Embed Size (px)
Citation preview
PEER-REVIEWED ARTICLE bioresources.com
Yue et al. (2013). “Cotton fiber transitional properties,” BioResources 8(4), 6460-6471. 6460
Transitional Properties of Cotton Fibers from Cellulose I to Cellulose II Structure
Yiying Yue,a,b
Guangping Han,a,* and Qinglin Wu
b,*
Mercerized fibers were prepared from native cotton fabrics via NaOH solution treatment at different concentrations. Mercerization led to transformation of the crystal structure of cotton fibers from cellulose I to II when the NaOH concentration was greater than 10 wt%. In addition, the cotton fibers were converted into a swollen and rough state after mercerization treatment. The results of Fourier transform infrared spectrometry and wide-angle X-ray diffraction indicated that the cellulose molecular structure changed (e.g. the degree of disorder of O-H stretching vibration increased, while the crystallinity index decreased) in the process of mercerization. Thermogravimetric analysis determined that the cellulose II fibers were more thermally stable than the cellulose I fibers. The mechanical properties of cellulose fiber-reinforced polyethylene oxide (PEO) composites showed that both original and mercerized cotton fibers enhanced the tensile strength of the PEO matrix. These properties directly contributed to the advantages of mercerized textile products (e.g. higher luster, holds more dye, more effectively absorbs perspiration, and tougher under different washing conditions).
Keywords: Cotton fiber; Cellulose I; Cellulose II; Mercerization; Properties
Contact information: a: Key Laboratory of Bio-based Material Science and Technology (Ministry of
Education), Northeast Forestry University, Harbin 150040, China; b: School of Renewable Natural
Resources, Louisiana State University Agricultural Center, Baton Rouge, LA 70803, USA;
* Corresponding authors: [email protected]; [email protected]
INTRODUCTION
Cellulose, which is one of the most promising renewable polymeric materials on
earth, exhibits fascinating structures and properties. It consists of β-1,-4- linked chains of
D-glucose, where the glucose units are in 6-membered rings (i.e., pyranoses) joined by
single oxygen atoms (acetal linkages) between the C-1 of one pyranose ring and the C-4
of the next ring (Nishimura et al. 1991). The crystal structure of native cellulose can be
converted to that of cellulose II by NaOH treatment, known as mercerization. It has been
reported that the cellulose I structure is made of parallel chains characterized by an
intermolecular hydrogen bond network extending from the O2-H hydroxyl to the O6 ring
oxygen of the next unit (Nishiyama et al. 2008). While the crystal structure of cellulose II
is described as anti-parallel, stabilized by an intermolecular hydrogen bond network of
O2-H---O6, O6-H---O6, and O2-H---O2 (Langan et al. 1999).
Mercerization treatment of natural cellulose fibers results in a structural
transformation from cellulose I to II. During the process, the form of the crystalline
lattice is changed because of the transformation of hydroxymethyl and the polarity of the
chains (Oh et al. 2005). However, its fibrous structure is largely kept intact. The
mercerization process also affects the twisting and swelling of cellulose fibers. This is
because Na+ ions play a crucial role in widening the accessible regions between the
PEER-REVIEWED ARTICLE bioresources.com
Yue et al. (2013). “Cotton fiber transitional properties,” BioResources 8(4), 6460-6471. 6461
lattice planes to allow the ions to diffuse into those planes (Gwon et al. 2010). During
mercerization, cellulose I proceeds through a crystal-to-crystal phase transformation. The
intermediate structure between the parallel chain structure of cellulose I and the anti-
parallel chain structure of cellulose II is Na-cellulose I (Gwon et al. 2010; Mansikkamaki
et al. 2005). Na-cellulose I is developed in the amorphous region of cellulose, and there is
a relatively large distance between cellulose molecules because OH groups in the
cellulose fiber are changed into O-Na groups. After a rinsing process, Na+ ions are
removed by water, and a new crystalline structure, cellulose II, is achieved. The
mechanism of mercerization has been widely studied; however, the transitional fiber
properties need to be further discussed.
Changsarn et al. (2011) studied cellulose nanowhiskers based on polyethylene
oxide (PEO) by electrospinning. A significant enhancement of PEO latex upon
incorporating small amounts of nanowhiskers was reported. The interaction of cellulose
nanocrystals and nanofibrils with PEO matrix and the resulted reinforcing effects on the
matrix polymer were also reported (Xu et al. 2013). The results showed that both PEO/
nanofibrils and PEO/nanocrystals composites achieved very high young’s modulus. The
bacteria cellulose nanofibers were acetylated to enhance the properties of optically
transparent composites of acrylic resin reinforced with the nanofibers (Ifuku et al. 2007).
Liu et al. (2010) reported the improved mechanical properties of polymethylmethacrylate
film through the reinforcement from cellulose nanocrystals.
The present work investigated the effect of mercerization on the properties of
cellulose fibers. The objective of this study was to characterize the morphology,
functional groups, crystal structure, and thermal properties of cotton cellulose fibers as a
function of mercerization treatment and to study their application as reinforcement in a
PEO matrix.
EXPERIMENTAL
Raw Materials and Processing Cotton fabrics were provided by the USDA ARS Southern Regional Research
Center in New Orleans, LA. The fabric sample was first cut into 5 × 25-mm pieces using
a fabric cutter, then further processed with a Wiley mill (Arthur H. Thomas Co.) to pass a
100-mesh screen. The obtained cotton particles were randomly divided into two parts and
then stored in two separate bags for further processing.
Mercerization Treatment Mercerization was conducted with one of the two bags of the pre-prepared cotton
fibers. About 30 g of cotton fiber was subjected to NaOH solution treatment for 4 h at
room temperature. Five NaOH concentrations were used, i.e., 0, 5, 10, 15, and 20 wt%.
The obtained slurry was filtered and thoroughly washed with distilled water until the
wash water reached a neutral pH. The prepared fiber samples were then dried at 40 °C in
a vacuum oven for 48 h prior to analysis of the effects of mercerization. The cotton
samples obtained were designated Cx, where x = 0, 5, 10, 15, and 20 according to the
concentration of alkaline solution. For instance, the sample with no alkali treatment was
marked C0, and the sample treated with 5% alkali solution was C5.
Fabrication of Cotton Fiber-reinforced Composite Films
PEER-REVIEWED ARTICLE bioresources.com
Yue et al. (2013). “Cotton fiber transitional properties,” BioResources 8(4), 6460-6471. 6462
1 mg of cellulose I (C0) and cellulose II (C20) cotton fibers were added to 50 mL
of 0.5 wt% PEO suspension (molecular mass 20,000 g/mol), respectively. The resulting
mixture was intensely stirred to achieve a uniform dispersion of cellulose cotton fiber in
the polymer matrix. Finally, 20 mL of the solution was cast in plastic dishes (inter
diameter 87 mm) and then dried in refrigerator at 10 °C for overnight to obtain PEO/
cellulose I cotton fiber (C0), and PEO/cellulose II cotton fiber (C20) composite films.
Characterization Morphological analysis
The morphology of cotton fibers was characterized using field emission scanning
electron microscopy (FESEM, NovaTM
Nano SEM 450, Hillsboro, Oregon, USA). Prior
to analysis, the raw and mercerized cotton fibers were coated with Au and then fixed on
metal stubs using double-sided adhesive tape. The samples were scanned at 5 kV, and the
images were recorded.
Fourier transform infrared (FTIR) spectrometry
The FTIR spectra of dry fiber samples were taken with a Bruker FTIR analyzer
(Tensor-27, Bruker Optics Inc., Billerica, MA) using the attenuated total reflectance
(ATR) mode. The data were recorded in the range of 4000 to 600 cm-1
. Each of the
samples from various treatment conditions was pressed into the sample chamber for FTIR
measurements. For each condition, three replicate measurements were made.
Wide-angle X-ray diffraction (WXRD)
The super-molecular structure of the native and mercerized cotton fibers was
analyzed using a Bruker/Siemens D5000 automated wide-angle powder X-ray diffracto-
meter. The X-ray diffraction pattern was recorded within an angle range of 0 to 40°. The
wavelength of the Cu/Ka radiation source was 0.154 nm, and the spectra were obtained at
30 mA with an accelerating voltage of 40 kV. X-ray diffraction data were analyzed using
the MDI Jade 5.0 software. Curve fitting was performed to find individual peak regions.
The main diffraction peaks were integrated and used to calculate the crystalline index
(CI, %) of the samples, as shown in Equation 1,
%100(%)
ac
c
II
ICI (1)
where Ic and Ia represent the integrated intensities of the crystalline and amorphous
regions, respectively.
The Scherrer equation was used to calculate the crystal size, t (nm), which was
determined perpendicular to the (200) planes for both cellulose I and cellulose II samples,
Cos
Kt (2)
where K is the correction factor and usually taken to be 0.9; λ is the radiation wavelength;
θ is the diffraction angle; and β is the corrected angular width at half maximum intensity
in radians.
PEER-REVIEWED ARTICLE bioresources.com
Yue et al. (2013). “Cotton fiber transitional properties,” BioResources 8(4), 6460-6471. 6463
The spacing between the (200) planes, d (nm), was calculated using Bragg’s
equation,
sin2 dn (3)
where n is an integer; λ is the wavelength of incident wave; and θ is the angle between
the incident ray and the scattering plane.
Thermal analysis
The dehydration and degradation behavior of cotton fiber samples was character-
ized using a thermogravimetric analyzer (Q50, TA Instruments, New Castle, DE) in a
nitrogen atmosphere. Specimens of 5 to 10 mg were tested in a temperature range of 30
to 500 °C. The heating rate was 5 °C/min, and the nitrogen flow rate was 65 mL/min. The
weight loss rate was obtained from derivative thermogravimetric (DTG) data. The onset
degradation temperature was defined as the intersection temperature of tangents drawn
from a thermogravimetric curve, one before inflection caused by the degradation and
another from the cellulose degradation step.
RESULTS AND DISCUSSION
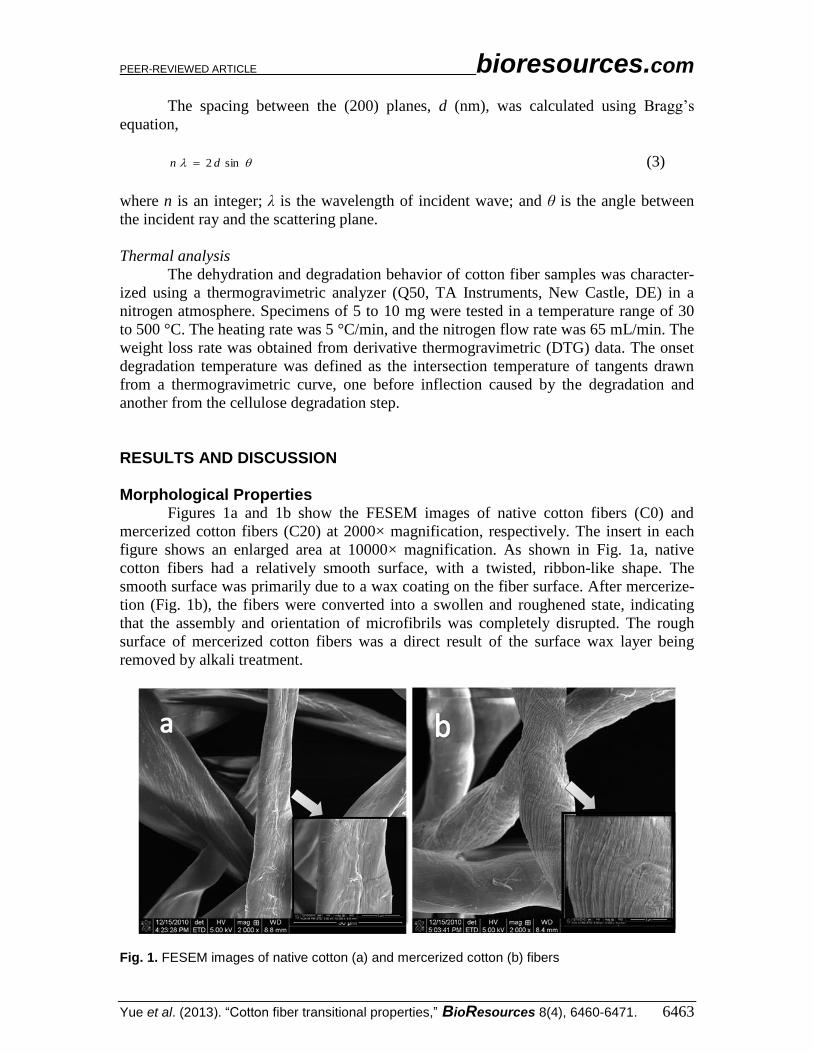
Morphological Properties Figures 1a and 1b show the FESEM images of native cotton fibers (C0) and
mercerized cotton fibers (C20) at 2000× magnification, respectively. The insert in each
figure shows an enlarged area at 10000× magnification. As shown in Fig. 1a, native
cotton fibers had a relatively smooth surface, with a twisted, ribbon-like shape. The
smooth surface was primarily due to a wax coating on the fiber surface. After mercerize-
tion (Fig. 1b), the fibers were converted into a swollen and roughened state, indicating
that the assembly and orientation of microfibrils was completely disrupted. The rough
surface of mercerized cotton fibers was a direct result of the surface wax layer being
removed by alkali treatment.
Fig. 1. FESEM images of native cotton (a) and mercerized cotton (b) fibers
PEER-REVIEWED ARTICLE bioresources.com
Yue et al. (2013). “Cotton fiber transitional properties,” BioResources 8(4), 6460-6471. 6464
A roughened fiber surface allows fibers to take dyes more easily and may also
provide better interfacial bonding for fiber-polymer composite systems. Also, the surface
of the of the nearly cylindrical cotton fiber after mercerization reflected light more evenly
to all sides than the ribbon shaped cotton fiber and the fiber surface became more
lustrous.
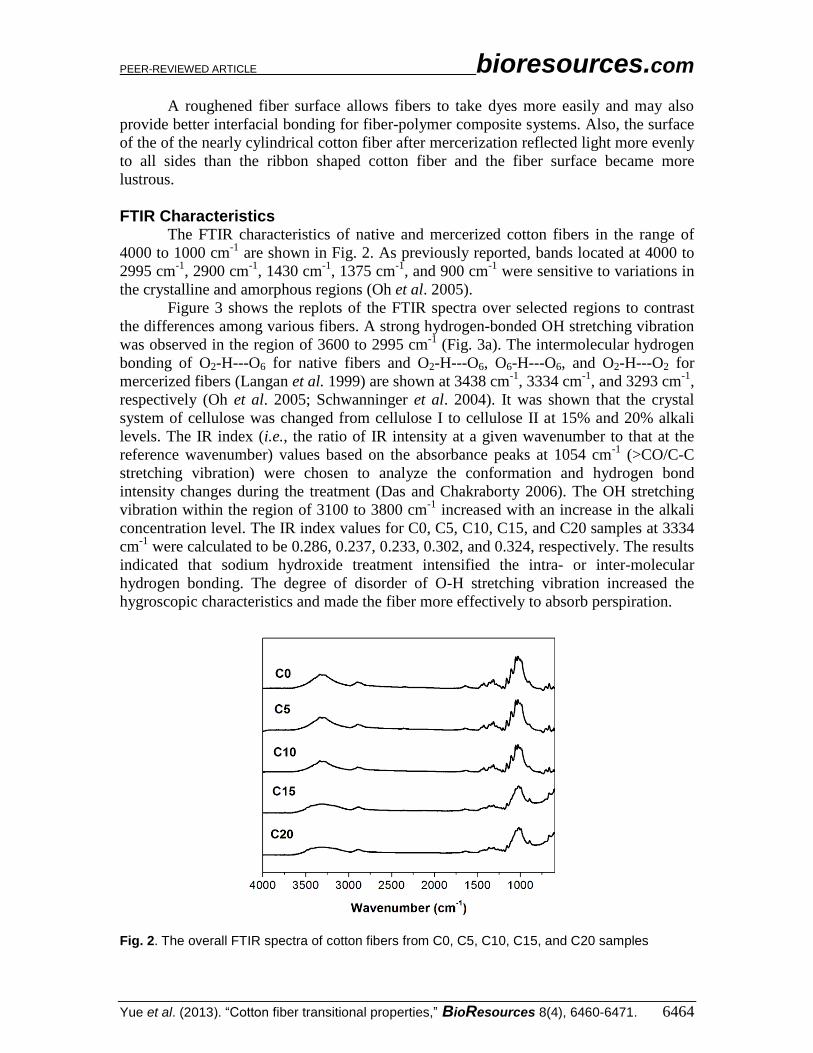
FTIR Characteristics The FTIR characteristics of native and mercerized cotton fibers in the range of
4000 to 1000 cm-1
are shown in Fig. 2. As previously reported, bands located at 4000 to
2995 cm-1
, 2900 cm-1
, 1430 cm-1
, 1375 cm-1
, and 900 cm-1
were sensitive to variations in
the crystalline and amorphous regions (Oh et al. 2005).
Figure 3 shows the replots of the FTIR spectra over selected regions to contrast
the differences among various fibers. A strong hydrogen-bonded OH stretching vibration
was observed in the region of 3600 to 2995 cm-1
(Fig. 3a). The intermolecular hydrogen
bonding of O2-H---O6 for native fibers and O2-H---O6, O6-H---O6, and O2-H---O2 for
mercerized fibers (Langan et al. 1999) are shown at 3438 cm-1
, 3334 cm-1
, and 3293 cm-1
,
respectively (Oh et al. 2005; Schwanninger et al. 2004). It was shown that the crystal
system of cellulose was changed from cellulose I to cellulose II at 15% and 20% alkali
levels. The IR index (i.e., the ratio of IR intensity at a given wavenumber to that at the
reference wavenumber) values based on the absorbance peaks at 1054 cm-1
(>CO/C-C
stretching vibration) were chosen to analyze the conformation and hydrogen bond
intensity changes during the treatment (Das and Chakraborty 2006). The OH stretching
vibration within the region of 3100 to 3800 cm-1
increased with an increase in the alkali
concentration level. The IR index values for C0, C5, C10, C15, and C20 samples at 3334
cm-1
were calculated to be 0.286, 0.237, 0.233, 0.302, and 0.324, respectively. The results
indicated that sodium hydroxide treatment intensified the intra- or inter-molecular
hydrogen bonding. The degree of disorder of O-H stretching vibration increased the
hygroscopic characteristics and made the fiber more effectively to absorb perspiration.
Fig. 2. The overall FTIR spectra of cotton fibers from C0, C5, C10, C15, and C20 samples
PEER-REVIEWED ARTICLE bioresources.com
Yue et al. (2013). “Cotton fiber transitional properties,” BioResources 8(4), 6460-6471. 6465
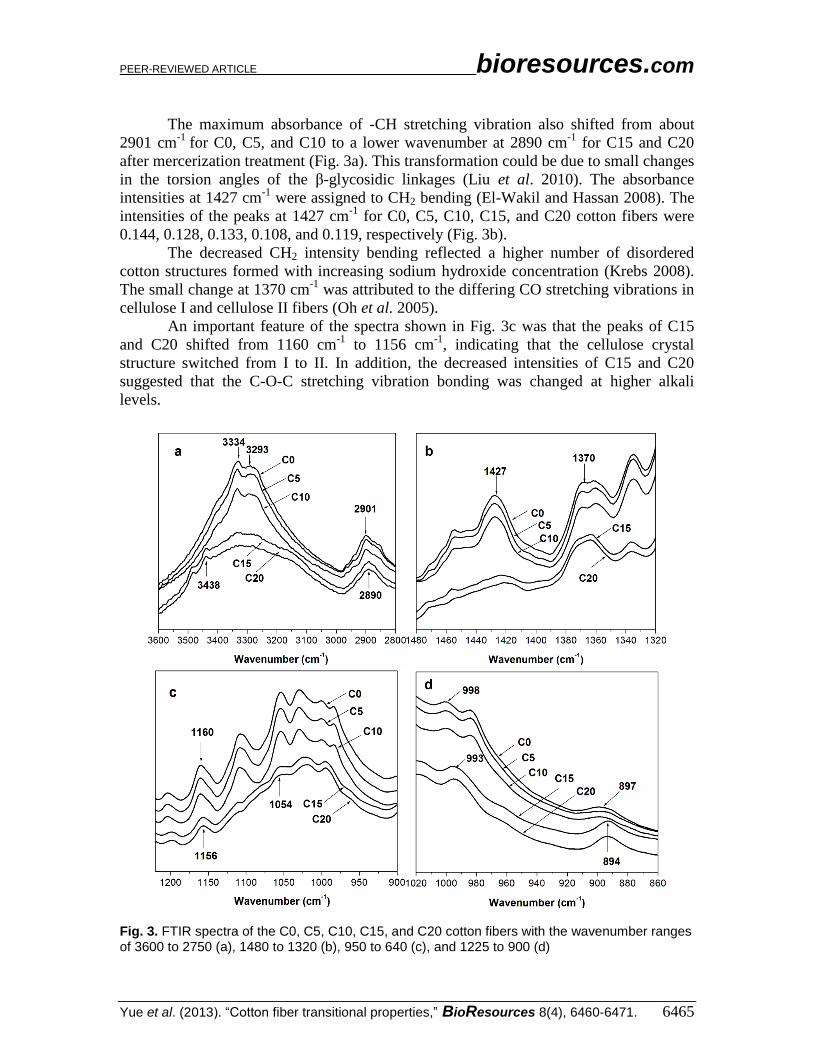
The maximum absorbance of -CH stretching vibration also shifted from about
2901 cm-1
for C0, C5, and C10 to a lower wavenumber at 2890 cm-1
for C15 and C20
after mercerization treatment (Fig. 3a). This transformation could be due to small changes
in the torsion angles of the β-glycosidic linkages (Liu et al. 2010). The absorbance
intensities at 1427 cm-1
were assigned to CH2 bending (El-Wakil and Hassan 2008). The
intensities of the peaks at 1427 cm-1
for C0, C5, C10, C15, and C20 cotton fibers were
0.144, 0.128, 0.133, 0.108, and 0.119, respectively (Fig. 3b).
The decreased CH2 intensity bending reflected a higher number of disordered
cotton structures formed with increasing sodium hydroxide concentration (Krebs 2008).
The small change at 1370 cm-1
was attributed to the differing CO stretching vibrations in
cellulose I and cellulose II fibers (Oh et al. 2005).
An important feature of the spectra shown in Fig. 3c was that the peaks of C15
and C20 shifted from 1160 cm-1
to 1156 cm-1
, indicating that the cellulose crystal
structure switched from I to II. In addition, the decreased intensities of C15 and C20
suggested that the C-O-C stretching vibration bonding was changed at higher alkali
levels.
Fig. 3. FTIR spectra of the C0, C5, C10, C15, and C20 cotton fibers with the wavenumber ranges of 3600 to 2750 (a), 1480 to 1320 (b), 950 to 640 (c), and 1225 to 900 (d)
PEER-REVIEWED ARTICLE bioresources.com
Yue et al. (2013). “Cotton fiber transitional properties,” BioResources 8(4), 6460-6471. 6466
Figure 3d shows that the bands at 897 cm-1
shifted to 894 cm-1
. It was reported
that the 897 cm-1
wavenumber can be assigned to the β-glucosidic linkage for the
cellulose I structure and the 894 cm-1
wavenumber to the cellulose II structure (Gwon et
al. 2010). This change was due to the rotation of glucose residue around the glucosidic
bond (Ray and Sarkar 2001). The bands at 998 cm-1
shifted to 993 cm-1
, indicating the
crystal structure transformation from cellulose I to II (Gwon et al. 2010).
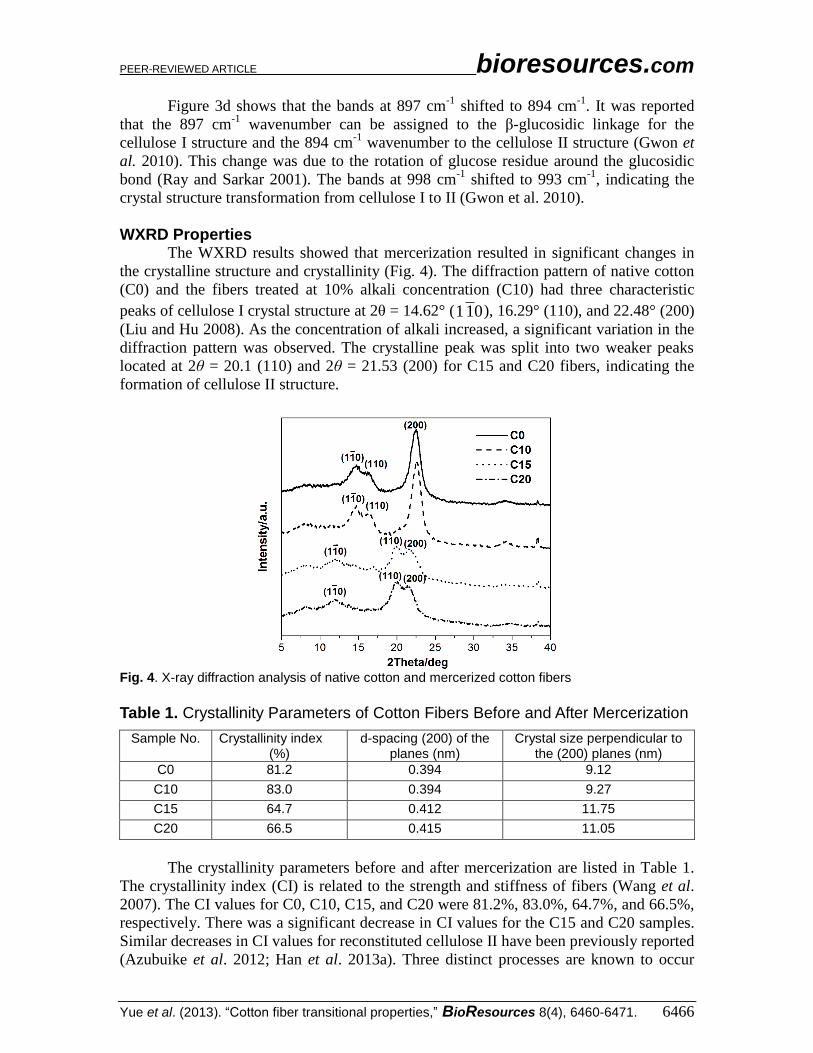
WXRD Properties The WXRD results showed that mercerization resulted in significant changes in
the crystalline structure and crystallinity (Fig. 4). The diffraction pattern of native cotton
(C0) and the fibers treated at 10% alkali concentration (C10) had three characteristic
peaks of cellulose I crystal structure at 2θ = 14.62° (110), 16.29° (110), and 22.48° (200)
(Liu and Hu 2008). As the concentration of alkali increased, a significant variation in the
diffraction pattern was observed. The crystalline peak was split into two weaker peaks
located at 2θ = 20.1 (110) and 2θ = 21.53 (200) for C15 and C20 fibers, indicating the
formation of cellulose II structure.
Fig. 4. X-ray diffraction analysis of native cotton and mercerized cotton fibers
Table 1. Crystallinity Parameters of Cotton Fibers Before and After Mercerization
Sample No. Crystallinity index (%)
d-spacing (200) of the planes (nm)
Crystal size perpendicular to the (200) planes (nm)
C0 81.2 0.394 9.12
C10 83.0 0.394 9.27
C15 64.7 0.412 11.75
C20 66.5 0.415 11.05
The crystallinity parameters before and after mercerization are listed in Table 1.
The crystallinity index (CI) is related to the strength and stiffness of fibers (Wang et al.
2007). The CI values for C0, C10, C15, and C20 were 81.2%, 83.0%, 64.7%, and 66.5%,
respectively. There was a significant decrease in CI values for the C15 and C20 samples.
Similar decreases in CI values for reconstituted cellulose II have been previously reported
(Azubuike et al. 2012; Han et al. 2013a). Three distinct processes are known to occur
PEER-REVIEWED ARTICLE bioresources.com
Yue et al. (2013). “Cotton fiber transitional properties,” BioResources 8(4), 6460-6471. 6467
during mercerization: microfibril swelling, crystalline area disruption, and new crystal-
line lattice formation. Mercerization occurs only when the NaOH hydrates penetrate into
the cellulose crystals to disrupt them and form new crystals, creating a new physical
network in the swollen state. The NaOH hydrates need to be small enough to penetrate
into the regions of higher lateral order (Lee et al. 2004). The size of the NaOH hydrates is
known to decrease with increased alkali concentration. At lower NaOH concentrations
(i.e., C10), NaOH hydrates were too big to penetrate into the cellulose crystals to disrupt
them. As a result, the CI value for the C10 sample showed little change. The crystalline
structure of the cotton fibers was converted into a swollen state as the NaOH concen-
tration was further increased. When the cellulose structure was in its most swollen state,
it became easier for the hydrated hydroxide ions to penetrate the internal crystals and
thoroughly react with the fiber, leading to a reduced CI value. However, the rate of
penetration of the hydroxide ions became slower due to the increased viscosity of the
NaOH solution at higher concentration levels (e.g., 20%) (Okano and Sarko 1984; Okano
and Sarko 1985). Thus, a NaOH concentration of approximately 15% was probably the
most suitable for crystal lattice transformation and degradation of cotton fibers at the
given temperature level. It should be noted that the conversion process of cellulose I to
cellulose II also depended on the temperature of NaOH and the fiber mixture.
The results in Table 1 show that the inter-planar spacing between adjacent lattices
for native cellulose fibers was 0.394 nm. However, the spacing became larger for
cellulose II fibers (C15 and C20). Changes of crystal size in the (200) planes showed a
similar tendency. The crystal sizes for cotton fibers varied from 9.12 nm to 11.75 nm.
The results indicated that mercerized cellulose increased in crystal size and d-spacing.
Mercerization resulted in the agglomeration of the β-1, 4-D-linked glucose chain or
arrangement of strong intermolecular hydrogen bonds through the conversion of cellulose
I to cellulose II.
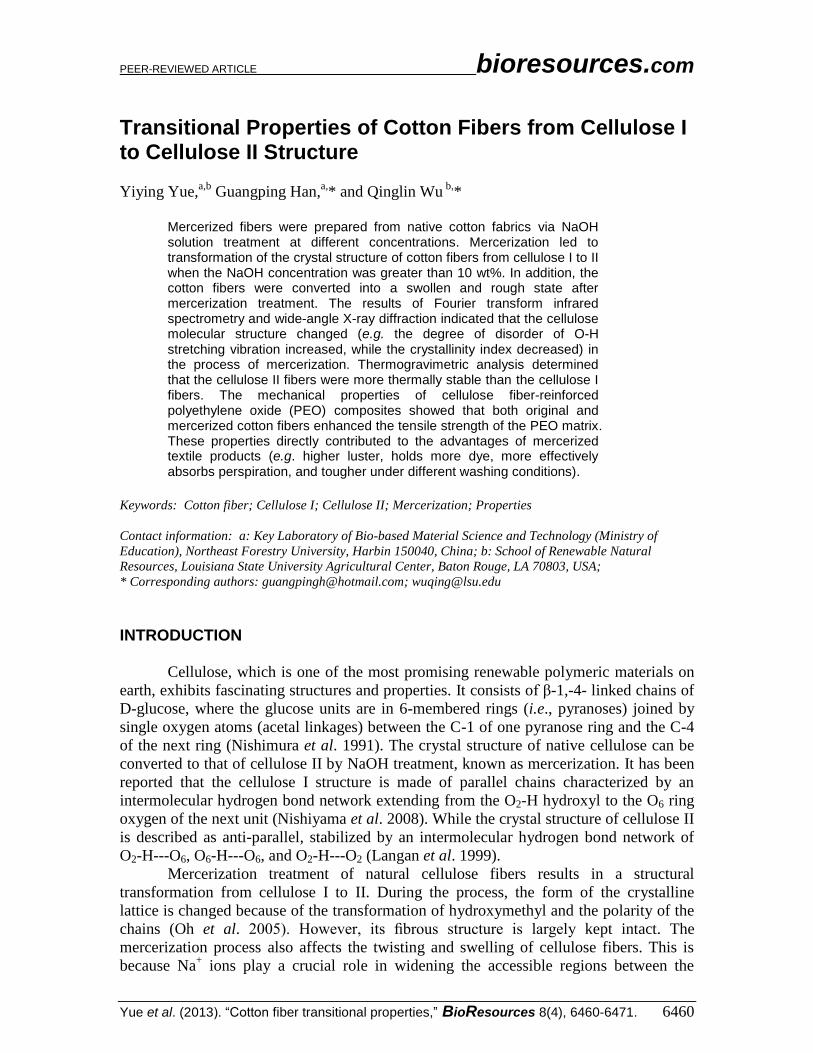
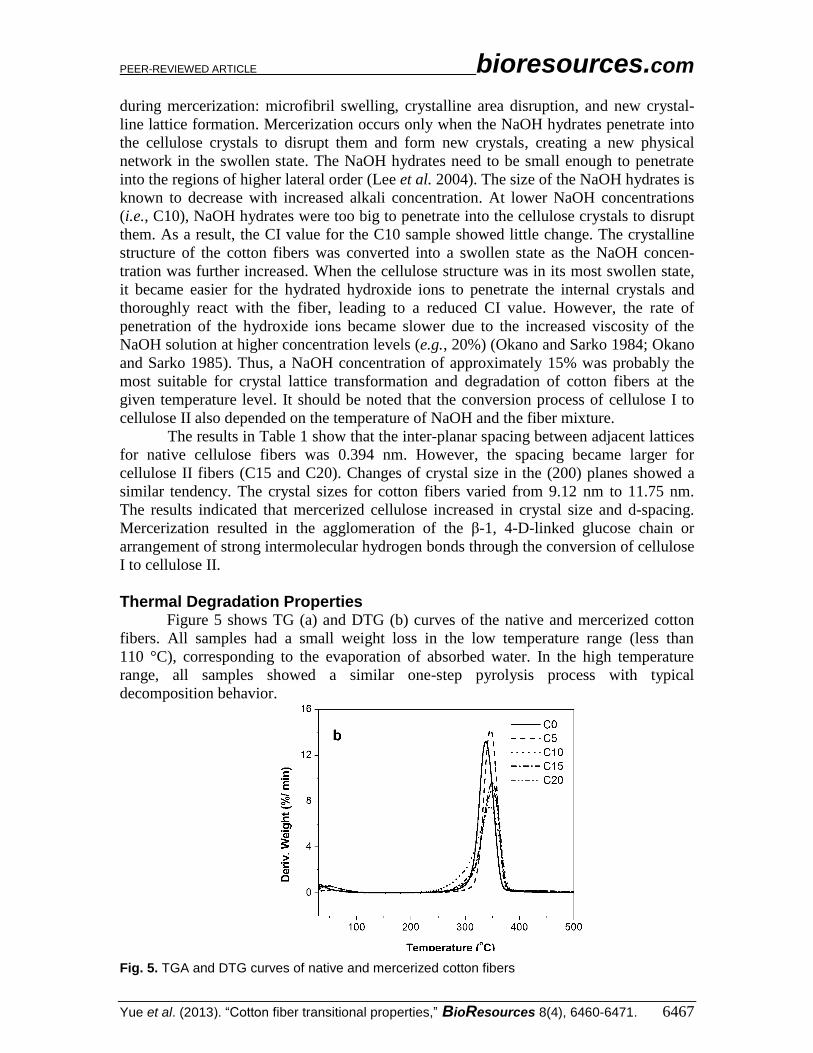
Thermal Degradation Properties Figure 5 shows TG (a) and DTG (b) curves of the native and mercerized cotton
fibers. All samples had a small weight loss in the low temperature range (less than
110 °C), corresponding to the evaporation of absorbed water. In the high temperature
range, all samples showed a similar one-step pyrolysis process with typical
decomposition behavior.
Fig. 5. TGA and DTG curves of native and mercerized cotton fibers
PEER-REVIEWED ARTICLE bioresources.com
Yue et al. (2013). “Cotton fiber transitional properties,” BioResources 8(4), 6460-6471. 6468
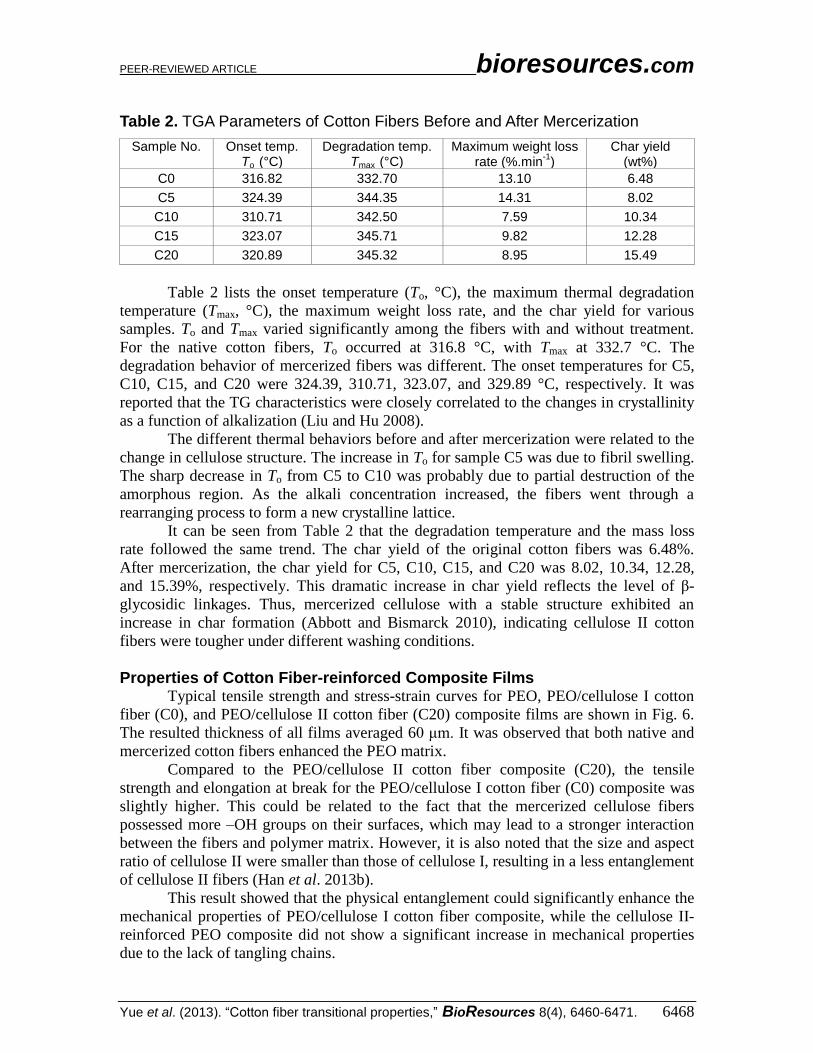
Table 2. TGA Parameters of Cotton Fibers Before and After Mercerization
Sample No. Onset temp. To (°C)
Degradation temp. Tmax (°C)
Maximum weight loss rate (%.min
-1)
Char yield (wt%)
C0 316.82 332.70 13.10 6.48
C5 324.39 344.35 14.31 8.02
C10 310.71 342.50 7.59 10.34
C15 323.07 345.71 9.82 12.28
C20 320.89 345.32 8.95 15.49
Table 2 lists the onset temperature (To, °C), the maximum thermal degradation
temperature (Tmax, °C), the maximum weight loss rate, and the char yield for various
samples. To and Tmax varied significantly among the fibers with and without treatment.
For the native cotton fibers, To occurred at 316.8 °C, with Tmax at 332.7 °C. The
degradation behavior of mercerized fibers was different. The onset temperatures for C5,
C10, C15, and C20 were 324.39, 310.71, 323.07, and 329.89 °C, respectively. It was
reported that the TG characteristics were closely correlated to the changes in crystallinity
as a function of alkalization (Liu and Hu 2008).
The different thermal behaviors before and after mercerization were related to the
change in cellulose structure. The increase in To for sample C5 was due to fibril swelling.
The sharp decrease in To from C5 to C10 was probably due to partial destruction of the
amorphous region. As the alkali concentration increased, the fibers went through a
rearranging process to form a new crystalline lattice.
It can be seen from Table 2 that the degradation temperature and the mass loss
rate followed the same trend. The char yield of the original cotton fibers was 6.48%.
After mercerization, the char yield for C5, C10, C15, and C20 was 8.02, 10.34, 12.28,
and 15.39%, respectively. This dramatic increase in char yield reflects the level of β-
glycosidic linkages. Thus, mercerized cellulose with a stable structure exhibited an
increase in char formation (Abbott and Bismarck 2010), indicating cellulose II cotton
fibers were tougher under different washing conditions.
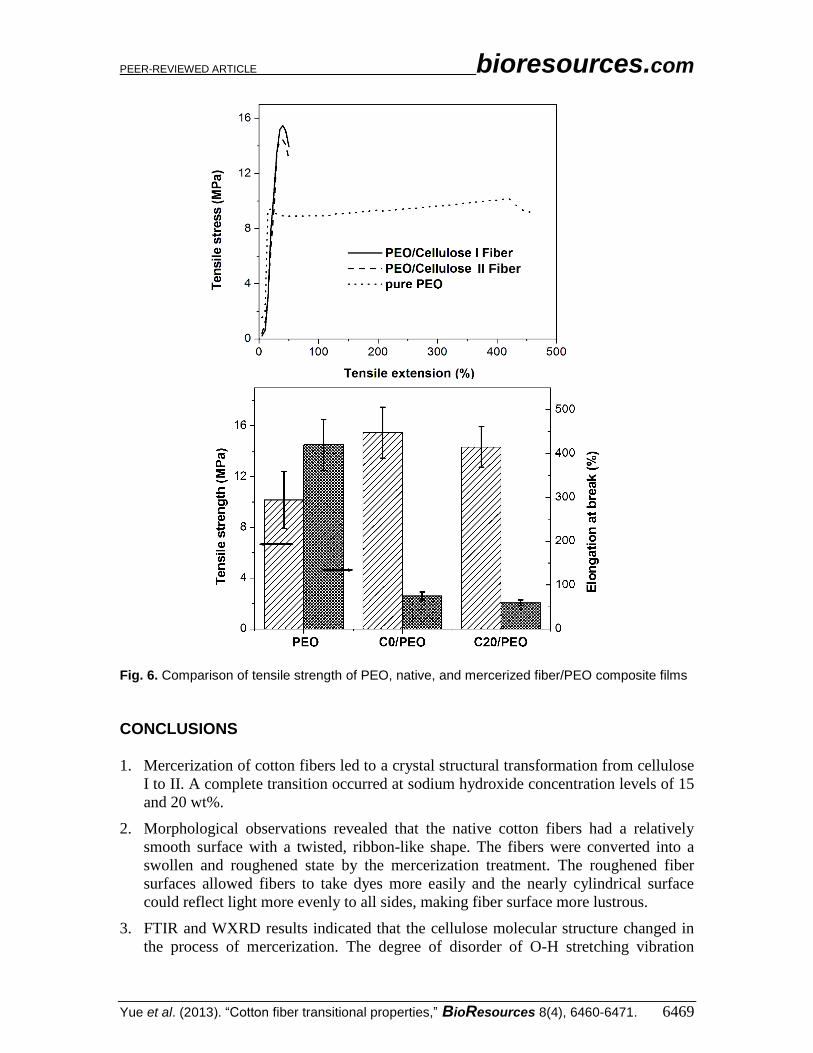
Properties of Cotton Fiber-reinforced Composite Films Typical tensile strength and stress-strain curves for PEO, PEO/cellulose I cotton
fiber (C0), and PEO/cellulose II cotton fiber (C20) composite films are shown in Fig. 6.
The resulted thickness of all films averaged 60 μm. It was observed that both native and
mercerized cotton fibers enhanced the PEO matrix.
Compared to the PEO/cellulose II cotton fiber composite (C20), the tensile
strength and elongation at break for the PEO/cellulose I cotton fiber (C0) composite was
slightly higher. This could be related to the fact that the mercerized cellulose fibers
possessed more –OH groups on their surfaces, which may lead to a stronger interaction
between the fibers and polymer matrix. However, it is also noted that the size and aspect
ratio of cellulose II were smaller than those of cellulose I, resulting in a less entanglement
of cellulose II fibers (Han et al. 2013b).
This result showed that the physical entanglement could significantly enhance the
mechanical properties of PEO/cellulose I cotton fiber composite, while the cellulose II-
reinforced PEO composite did not show a significant increase in mechanical properties
due to the lack of tangling chains.
PEER-REVIEWED ARTICLE bioresources.com
Yue et al. (2013). “Cotton fiber transitional properties,” BioResources 8(4), 6460-6471. 6469
Fig. 6. Comparison of tensile strength of PEO, native, and mercerized fiber/PEO composite films
CONCLUSIONS
1. Mercerization of cotton fibers led to a crystal structural transformation from cellulose
I to II. A complete transition occurred at sodium hydroxide concentration levels of 15
and 20 wt%.
2. Morphological observations revealed that the native cotton fibers had a relatively
smooth surface with a twisted, ribbon-like shape. The fibers were converted into a
swollen and roughened state by the mercerization treatment. The roughened fiber
surfaces allowed fibers to take dyes more easily and the nearly cylindrical surface
could reflect light more evenly to all sides, making fiber surface more lustrous.
3. FTIR and WXRD results indicated that the cellulose molecular structure changed in
the process of mercerization. The degree of disorder of O-H stretching vibration
II Fiber
PEER-REVIEWED ARTICLE bioresources.com
Yue et al. (2013). “Cotton fiber transitional properties,” BioResources 8(4), 6460-6471. 6470
increased the hygroscopic characteristics and made the fiber more effective for the
absorption of perspiration.
4. TGA analysis determined that the structure of cellulose II cotton fiber was more
thermally stable than that of cellulose I fiber, resulting in the tougher cellulose II
cotton fibers under different washing conditions.
5. The mechanical properties of fiber-reinforced PEO composites suggested that both
raw and mercerized cotton fibers enhanced the tensile strength of the PEO matrix.
The tensile strength and elongation at break for the PEO/cellulose I (C0) and
PEO/cellulose II cotton fiber (C20) composites were almost the same, indicating that
the effects of physical entanglement in C0 is as significant as chemical O-H group
interaction in C20. Future study is needed to prove the stronger chemical interactions
among mercerized cotton fibers than native cotton fibers.
ACKNOWLEDGMENTS
The financial support from the State Forestry Administration 948 project (Grant
No. 2013-4-11), the National Natural Science Foundation (Grant No. 31070505), and the
USDA CSREES (Grant Number: 2008-38814-04771) are highly appreciated.
REFERENCES CITED
Abbott, A., and Bismarck, A. (2010). “Self-reinforced cellulose nanocomposites,”
Cellulose 17(4), 779-791.
Azubuike, C. P., Rodriguez, H., Okhamafe, A. O., and Rogers, R. D. (2012).
“Physicochemical properties of maize cob cellulose powders reconstituted from ionic
liquid solution,” Cellulose 19(2), 425-433.
Changsarn, S., Mendez, J. D., Shanmuganathan, K., Foster, E. J., Weder, C., and
Supaphol, P. (2011). “Biologically inspired hierarchical design of nanocomposites
based on poly(ethylene oxide) and cellulose nanofibers,” Macromolecular Rapid
Communications 32, 1367-1372.
El-Wakil, N. A., and Hassan, M. L. (2008). “Structural changes of regenerated cellulose
dissolved in FeTNa, NaOH/thiourea, and NMMO systems,” J. Appl. Polym. Sci.
109(5), 2862-2871.
Gwon, J. G., Lee, S. Y., Doh, G. H., and Kim, J. H. (2010). “Characterization of
chemically modified wood fibers using FTIR spectroscopy for biocomposites,” J.
Appl. Polym. Sci. 116(6), 3212-3219.
Han, J, Zhou C, French AD, Han G, Wu Q. (2013a). “Characterization of cellulose II
nanoparticles regenerated from 1-butyl-3-methylimidazolium chloride,” Carbohydr.
Polym. 94(2), 773-781.
Han, J, Zhou C, Wu Y, Liu F, Wu Q. (2013b). “Self-assembling behavior of cellulose
nanoparticles during freeze-drying: Effect of suspension concentration, particle size,
crystal structure, and surface charge,” Biomacromolecules 14(5),1529-1540.
Ifuku, S., Nogi, M., Abe, K., Handa, K., Nakatsubo, F., and Yano, H. (2007). “Surface
modification of bacterial cellulose nanofibers for property enhancement of optically
transparent composites: Dependence on acetyl-group DS,” Biomacromolecules 8,
PEER-REVIEWED ARTICLE bioresources.com
Yue et al. (2013). “Cotton fiber transitional properties,” BioResources 8(4), 6460-6471. 6471
1973-1978.
Krebs, F. C. (2008). “Degradation and stability of polymer and organic solar cells,” Sol.
Energ. Mat. Sol. Cells 92(7), 685.
Langan, P., Nishiyama, Y., and Chanzy, H. (1999). “A revised structure and hydrogen-
bonding system in cellulose II from a neutron fiber diffraction analysis,” J. Am. Chem.
Soc. 121(43), 9940-9946.
Liu, H. Y., Liu, D. G., Yao, F., and Wu, Q. (2010). “Fabrication and properties of
transparent polymethylmethacrylate/cellulose nanocrystals composites,” Bioresource
Technology 101, 5685-5692.
Liu, X. X., Khor, S., Petinakis, E., Yu, L., Simon, G., Dean, K., and Bateman, S. (2010).
“Effects of hydrophilic fillers on the thermal degradation of poly(lactic acid),”
Thermochim. Acta 509(1-2), 147-151.
Liu, Y. P., and Hu, H. (2008). “X-ray diffraction study of bamboo fibers treated with
NaOH,” Fiber Polym. 9(6), 735-739.
Lee, M. H., Park, H. S., Yoon, K. J., and Hauser, P. J. (2004). “Enhancing the durability
of linen-like properties of low temperature mercerized cotton,” Text. Res. J. 74(2),
146-154.
Mansikkamaki, P., Lahtinen, M., and Rissanen, K. (2005). “Structural changes of
cellulose crystallites induced by mercerisation in different solvent systems
determined by powder X-ray diffraction method,” Cellulose 12(3), 233-242.
Nishimura, H., Okano, T., and Sarko, A. (1991). “Mercerization of cellulose .5. Crystal
and molecular-structure of Na-cellulose I,” Macromolecules 24(3), 759-770.
Nishiyama, Y., Johnson, G. P., French, A. D., Forsyth, V. T., and Langan, P. (2008).
“Neutron crystallography, molecular dynamics, and quantum mechanics studies of
the nature of hydrogen bonding in cellulose I-beta,” Biomacromolecules 9(11), 3133-
3140.
Oh, S. Y., Yoo, D. I., Shin, Y., and Seo, G. (2005). “FTIR analysis of cellulose treated
with sodium hydroxide and carbon dioxide,” Carbohyd. Res. 340(3), 417-428.
Okano, T., and Sarko, A. (1984). “Mercerization of cellulose .1. X-ray-diffraction
evidence for intermediate structures,” J. Appl. Polym. Sci. 29(12), 4175-4182.
Okano, T., and Sarko, A. (1985). “Mercerization of cellulose .2. Alkali cellulose
intermediates and a possible mercerization mechanism,” J. Appl. Polym. Sci. 30(1),
325-332.
Ray, D., and Sarkar, B. K. (2001). “Characterization of alkali-treated jute fibers for
physical and mechanical properties,” J. Appl. Polym. Sci. 80(7), 1013-1020.
Schwanninger, M., Rodrigues, J. C., Pereira, H., and Hinterstoisser, B. (2004). “Effects
of short-time vibratory ball milling on the shape of FTIR spectra of cellulose,” Vib.
Spectrosc. 36(1), 23-40.
Wang, L. L., Han, G. T., and Zhang, Y. M. (2007). “Comparative study of composition,
structure and properties of Apocynum venetum fibers under different pretreatments,”
Carbohydrate Polymers 69(2), 391-397.
Xu, X. Z., Liu, F., Jiang, L., Zhu, J. Y., Haagenson, D., and Wiesenborn, D. P. (2013).
“Cellulose nanocrystals vs. cellulose nanofibrils: A comparative study on their
microstructures and effects as polymer reinforcing agents,” ACS Applied Materials
& Interfaces 5, 2999-3009.
Article submitted: April 17, 2013; Peer review completed: May 27, 2013; Revision
received: October 16, 2013; Accepted: October 17, 2013; Published: October 25, 2013.