Embed Size (px)
Citation preview
Transition to 100% Renewable Electricity on the SWIS – can it be done and at what cost?
12 April 2019 (updated 30 May 2019) Ben Rose, Energy and Emissions Analyst (Powerbalance developer) Angus King, SEN Tech Team (SIREN Developer) • The Authors accept no liability whatsoever by reason of negligence or otherwise arising
from the use or release of the information in this presentation. • The Authors request that they be acknowledged by users of any of the information in this
presentation.
30/05/2019 Ben Rose 1
“We are looking at how to manage the system to be more resilient as well as … cost effective and carbon neutral, or zero carbon … (they) are not necessarily antithetical,” ……..Nor is having renewable resources and having a reliable and secure system antithetical. In fact, you can have it all” Australian Energy Market Operator CEO Audrey Zibelman
30/05/2019 Ben Rose 2
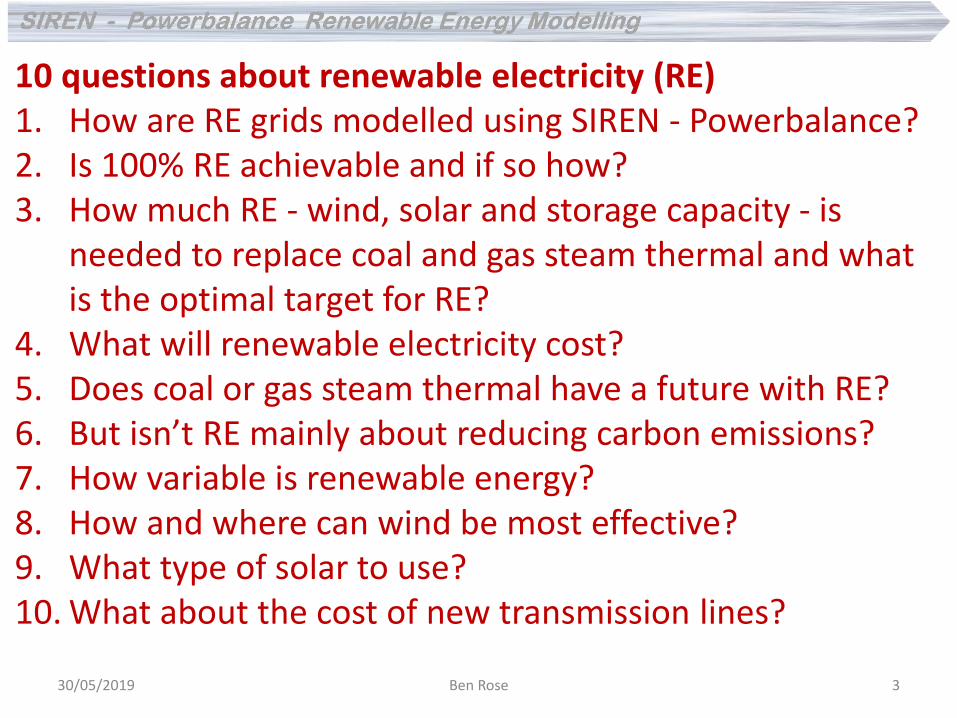
10 questions about renewable electricity (RE) 1. How are RE grids modelled using SIREN - Powerbalance? 2. Is 100% RE achievable and if so how? 3. How much RE - wind, solar and storage capacity - is
needed to replace coal and gas steam thermal and what is the optimal target for RE?
4. What will renewable electricity cost? 5. Does coal or gas steam thermal have a future with RE? 6. But isn’t RE mainly about reducing carbon emissions? 7. How variable is renewable energy? 8. How and where can wind be most effective? 9. What type of solar to use? 10. What about the cost of new transmission lines?
30/05/2019 Ben Rose 3
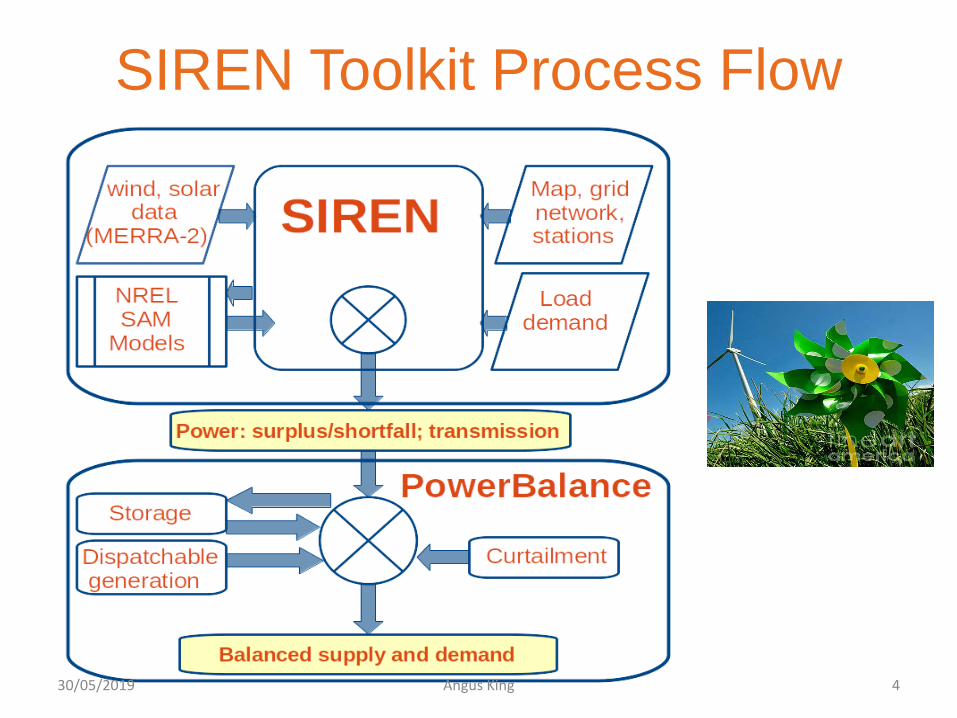
SIREN Toolkit Process Flow
30/05/2019 Angus King 4
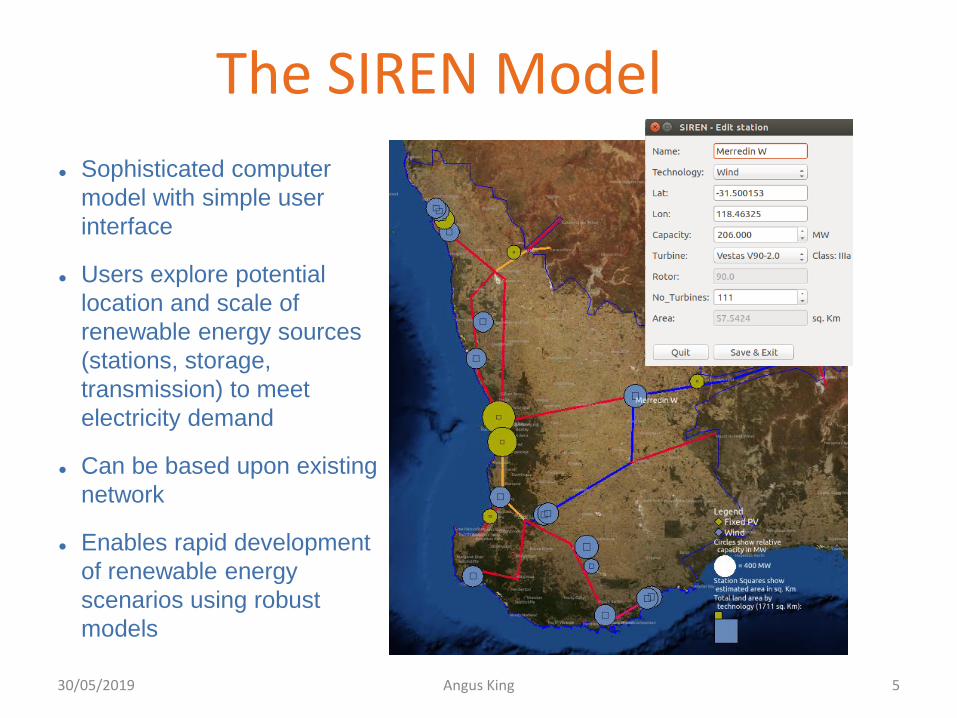
The SIREN Model
Sophisticated computer
model with simple user
interface
Users explore potential
location and scale of
renewable energy sources
(stations, storage,
transmission) to meet
electricity demand
Can be based upon existing
network
Enables rapid development
of renewable energy
scenarios using robust
models
30/05/2019 Angus King 5
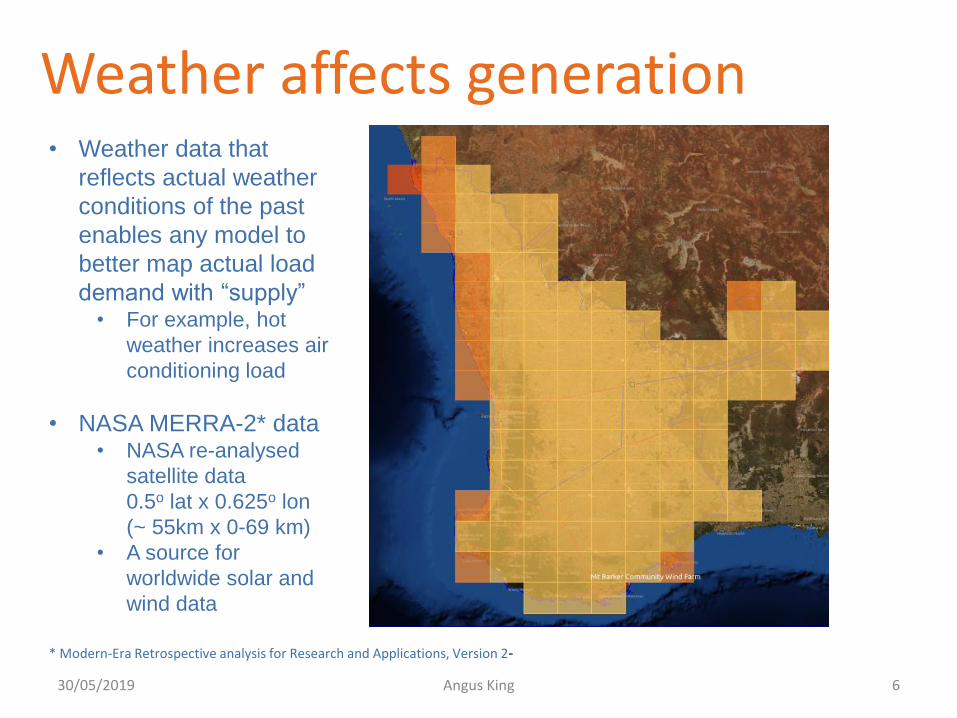
Weather affects generation • Weather data that
reflects actual weather
conditions of the past
enables any model to
better map actual load
demand with “supply” • For example, hot
weather increases air
conditioning load
• NASA MERRA-2* data • NASA re-analysed
satellite data
0.5o lat x 0.625o lon
(~ 55km x 0-69 km)
• A source for
worldwide solar and
wind data
* Modern-Era Retrospective analysis for Research and Applications, Version 2-
30/05/2019 Angus King 6
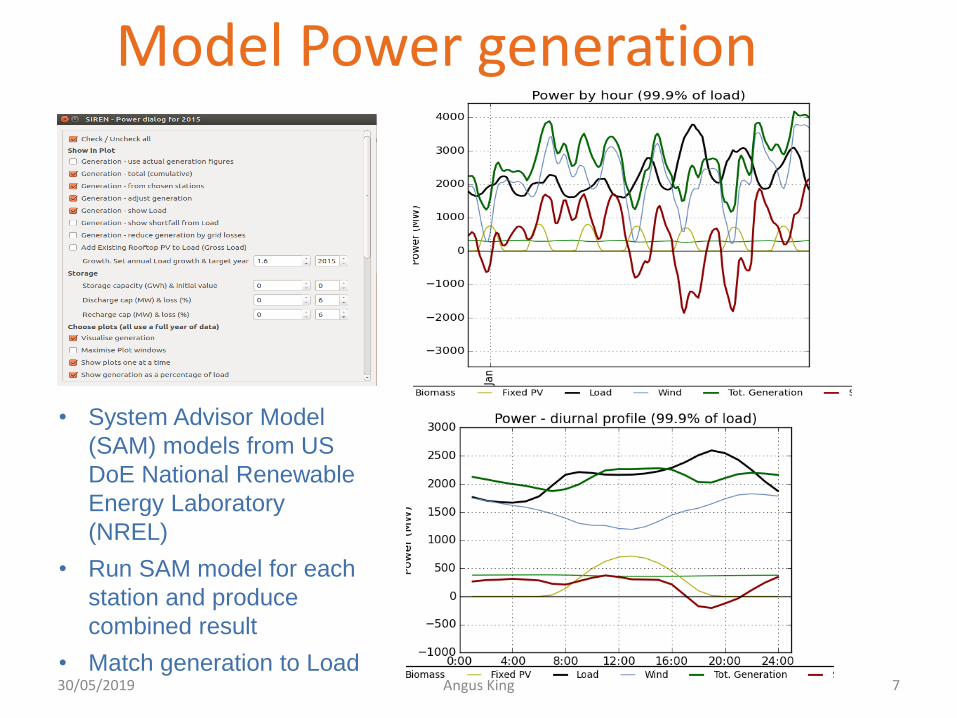
Model Power generation
• System Advisor Model
(SAM) models from US
DoE National Renewable
Energy Laboratory
(NREL)
• Run SAM model for each
station and produce
combined result
• Match generation to Load 30/05/2019 Angus King 7
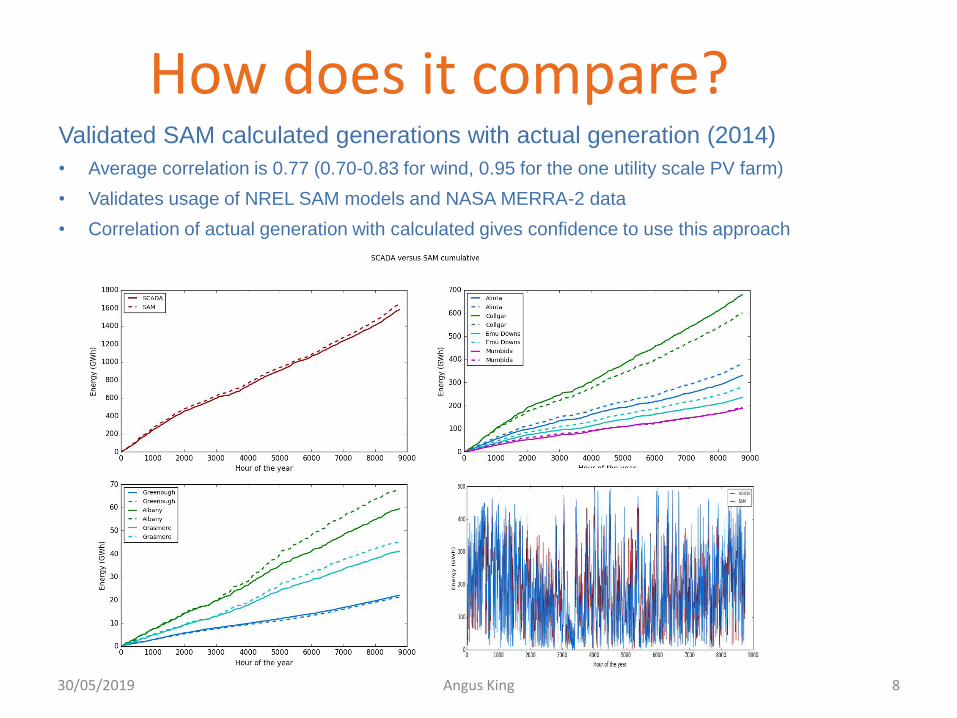
How does it compare? Validated SAM calculated generations with actual generation (2014)
• Average correlation is 0.77 (0.70-0.83 for wind, 0.95 for the one utility scale PV farm)
• Validates usage of NREL SAM models and NASA MERRA-2 data
• Correlation of actual generation with calculated gives confidence to use this approach
30/05/2019 Angus King 8
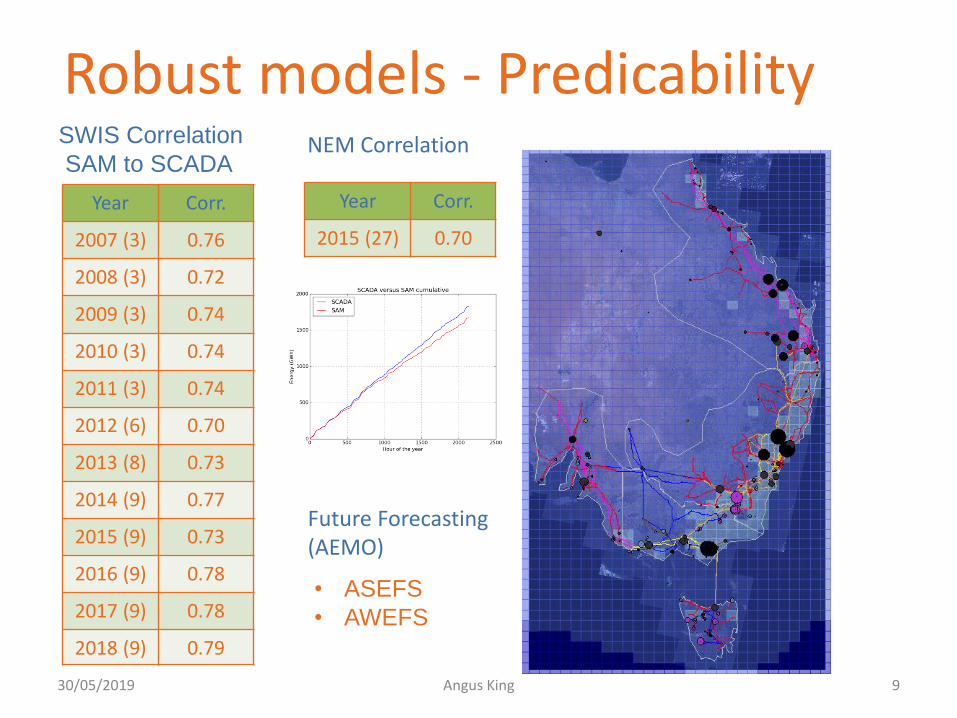
Robust models - Predicability SWIS Correlation
SAM to SCADA
Year Corr.
2007 (3) 0.76
2008 (3) 0.72
2009 (3) 0.74
2010 (3) 0.74
2011 (3) 0.74
2012 (6) 0.70
2013 (8) 0.73
2014 (9) 0.77
2015 (9) 0.73
2016 (9) 0.78
2017 (9) 0.78
2018 (9) 0.79
NEM Correlation
Year Corr.
2015 (27) 0.70
Future Forecasting (AEMO)
• ASEFS
• AWEFS
30/05/2019 Angus King 9
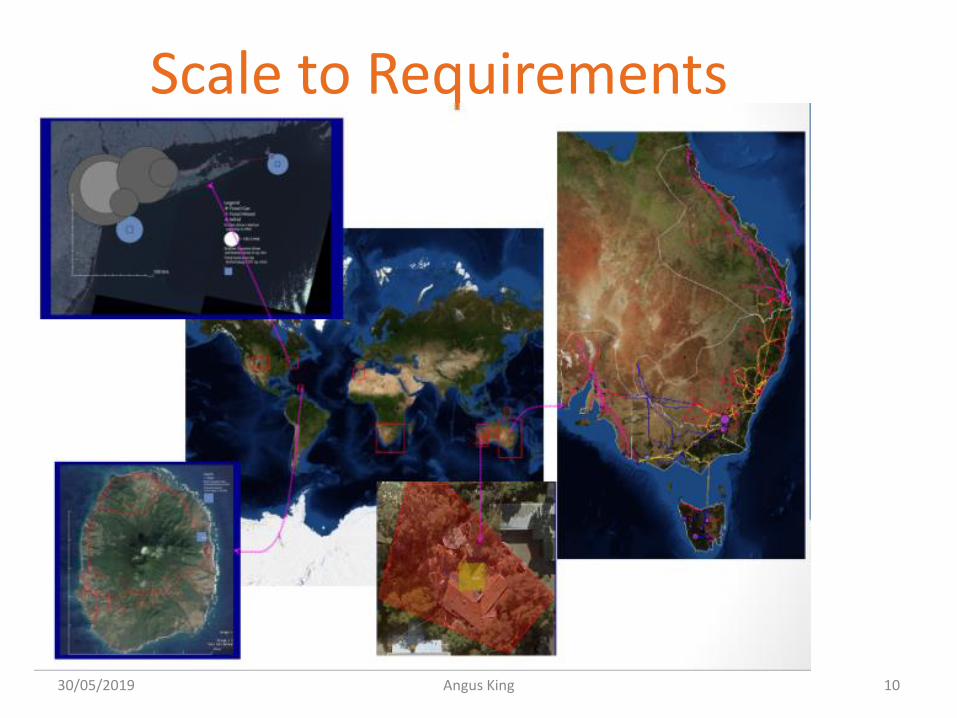
Scale to Requirements
30/05/2019 Angus King 10

● Data sources are publicly available
● Models – NREL SAM
● Maps – OpenStreet Map (MapQuest)
● Weather – NASA MERRA-2
● Network – Location/area dependent
● Developed to support any geographic area
● Developed with open source products
● Python with it's extensive range of libraries
● Packaged binaries sourceforge.net/projects/sensiren/
● (Includes package to create SAM weather files from MERRA-2)
● Licensed under the GNU
● GNU Affero General Public License
Wide & Open Application
30/05/2019 Angus King 11
SIREN - Powerbalance Toolbox was used to model and cost these scenarios for transition to Renewable Electricity
• Powerbalance is a set of programmed Excel spreadsheet templates for scenario types.
• A tool to quantify and cost dispatchable energy generation, storage and CO2 emissions.
• Balances power with load for 8760 hours of a year.
• Produces costed RE scenarios.
• Tool to develop whole of system plans for electricity grids
*Invented by Ben Rose and Len Bunn 30/05/2019 Ben Rose 12
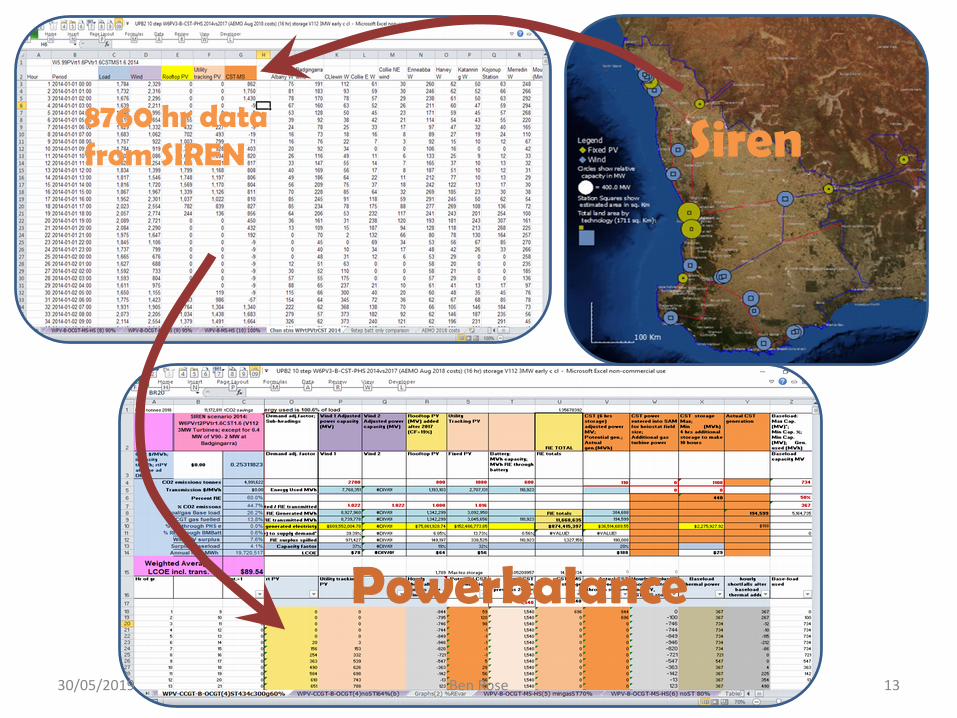
Siren
Powerbalance
8760 hr data from SIREN
30/05/2019 Ben Rose 13
Technical / economic transition plans for renewable electricity NEM : • Bin Lu, Blakers, Bin Lu et al, ANU, 2017 (using ‘NEMO’) • Elliston et al, 2016, UNSW, (‘NEMO’) WA: • SWIS - This plan and variants (SIREN-Powerbalance) • Kimberley – TWS RE roadmap (SIREN-Powerbalance)
Synergy is using Plexos for modelling SA modelling by Danny Price WA State Government does not yet have such a plan but have started – Whole of System Plan, Distributed Energy Roadmap.
30/05/2019 Ben Rose 14
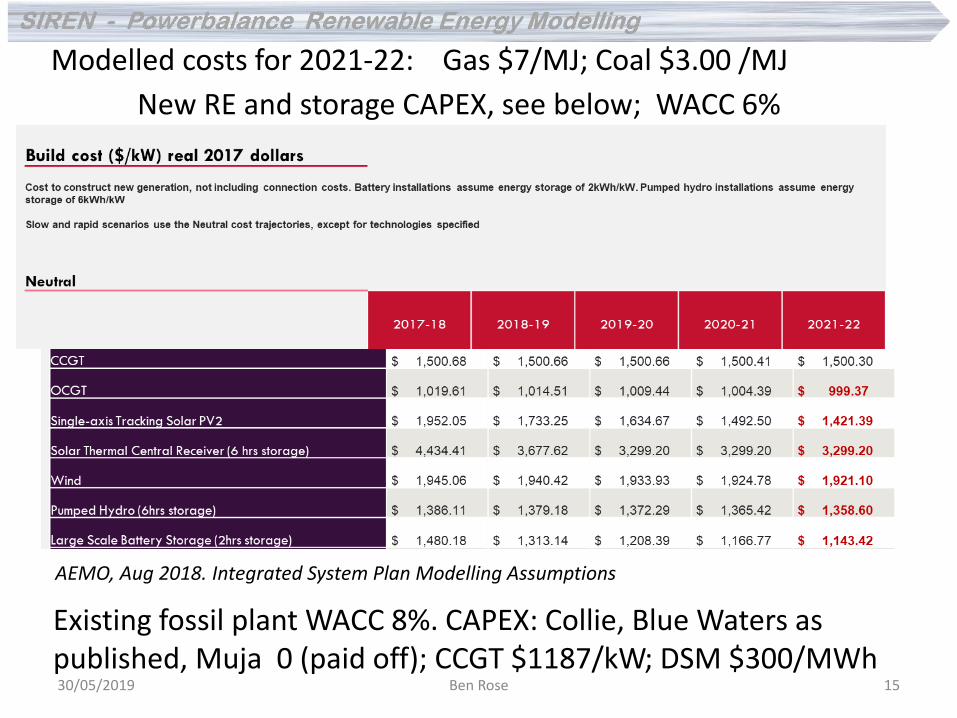
AEMO, Aug 2018. Integrated System Plan Modelling Assumptions
New RE and storage CAPEX, see below; WACC 6%
Modelled costs for 2021-22: Gas $7/MJ; Coal $3.00 /MJ
Existing fossil plant WACC 8%. CAPEX: Collie, Blue Waters as published, Muja 0 (paid off); CCGT $1187/kW; DSM $300/MWh 30/05/2019 Ben Rose 15
Is 100% renewable energy achievable on the SWIS and if so how?
30/05/2019 Ben Rose 16
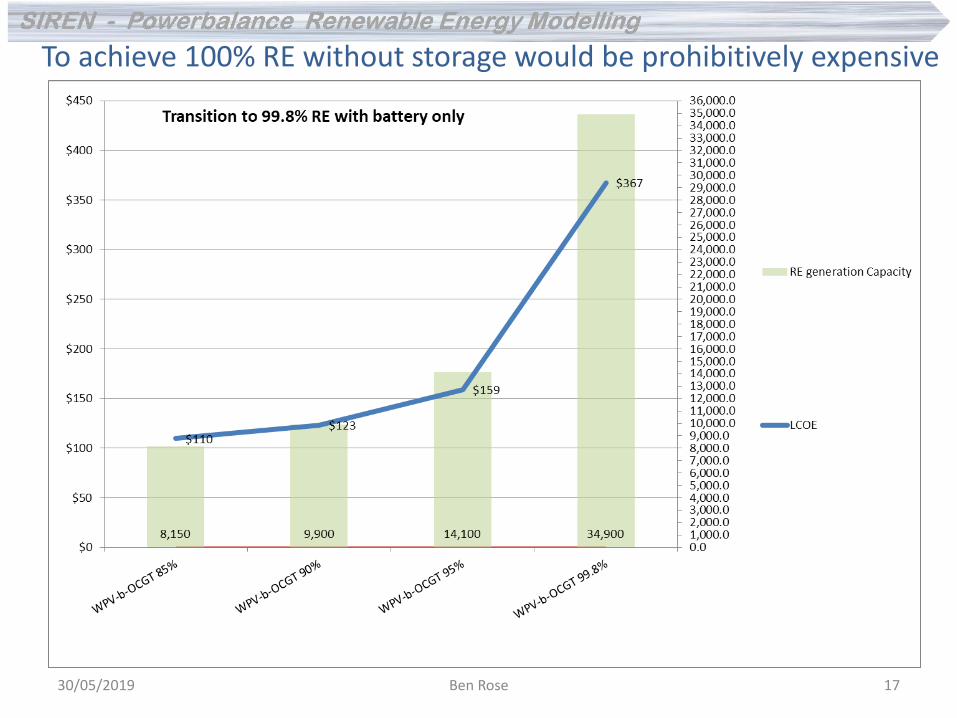
To achieve 100% RE without storage would be prohibitively expensive
30/05/2019 Ben Rose 17
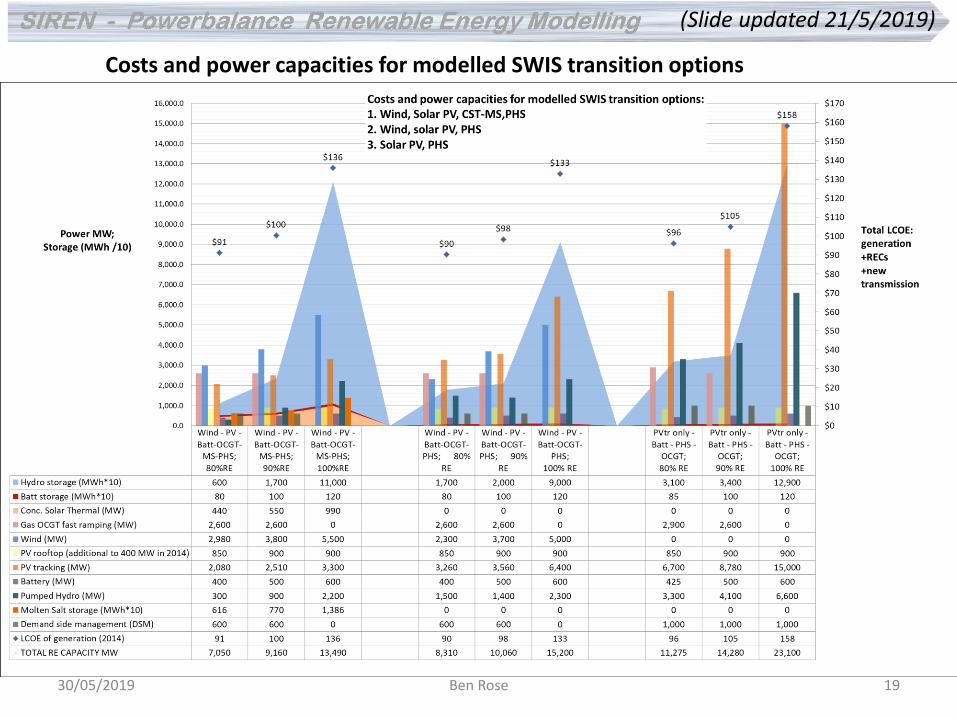
Modelling indicates there are options with storage that can achieve 100% RE at a reasonable cost. However the large pumped hydro storages required for 100% RE may not be physically practical. Three modelled scenarios for 80%, 90% and 100% RE are shown in the next graph: 1. Wind, Solar PV, solar concentrating thermal (CST) with molten salt
storage (MS), pumped hydro storage (PHS), battery storage (Batt) and fast ramping gas turbines (OCGT)
2. Wind, Solar PV with PHS, Batt, OCGT 3. Utility scale tracking solar PV only with PHS, Batt, OCGT
A transition to 100% RE using Option 1 is explained in further detail in this presentation.
30/05/2019 Ben Rose 18
(Slide updated 21/5/2019)
Costs and power capacities for modelled SWIS transition options
30/05/2019 Ben Rose 19
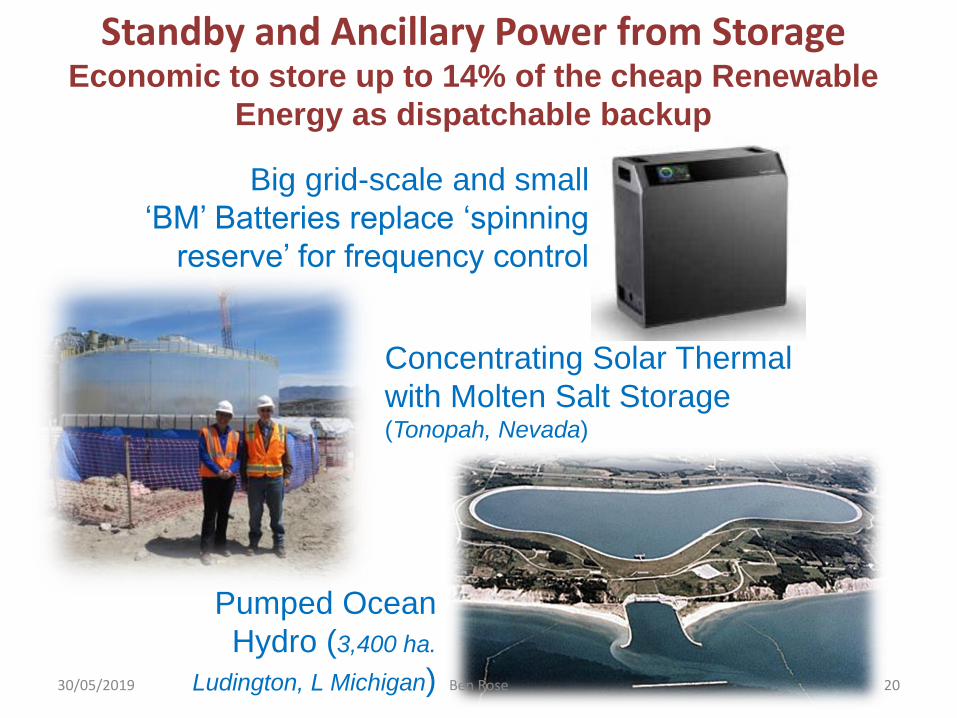
Standby and Ancillary Power from Storage Economic to store up to 14% of the cheap Renewable
Energy as dispatchable backup
Pumped Ocean
Hydro (3,400 ha.
Ludington, L Michigan)
Concentrating Solar Thermal
with Molten Salt Storage (Tonopah, Nevada)
Big grid-scale and small
‘BM’ Batteries replace ‘spinning
reserve’ for frequency control
30/05/2019 Ben Rose 20
Transition pathway to 100 % RE on the SWIS: • Best with 3 types of storage – Battery, PHS and CST-MS.
• For the 90% RE scenario modelled here - 14% of
generation is renewable energy through CST – molten salt and pumped hydro storage.
• Renewable biofuel or hydrogen can be used to fuel the fast gas turbines (OCGT’s) and or H2 fuel cells for the remaining 10% to reach 100% RE.
• Renewable fueled OCGT’s will cost less and be more
practical than expanding storage to reach 100% RE. 30/05/2019 Ben Rose 21
What is the optimal target for wind, solar and storage?
30/05/2019 Ben Rose 22
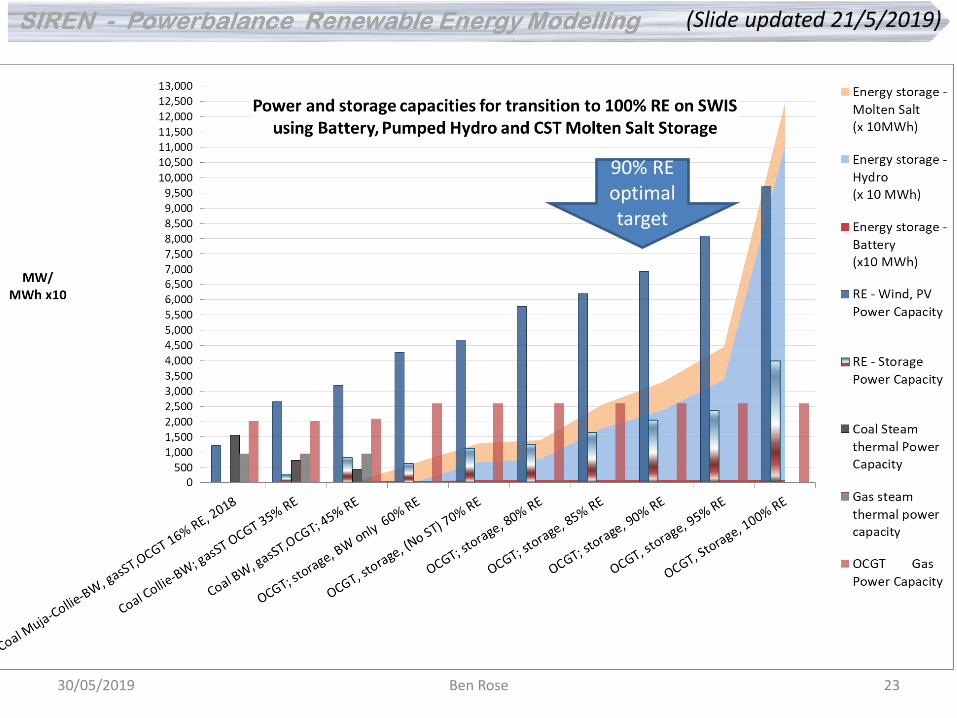
90% RE optimal target
(Slide updated 21/5/2019)
30/05/2019 Ben Rose 23
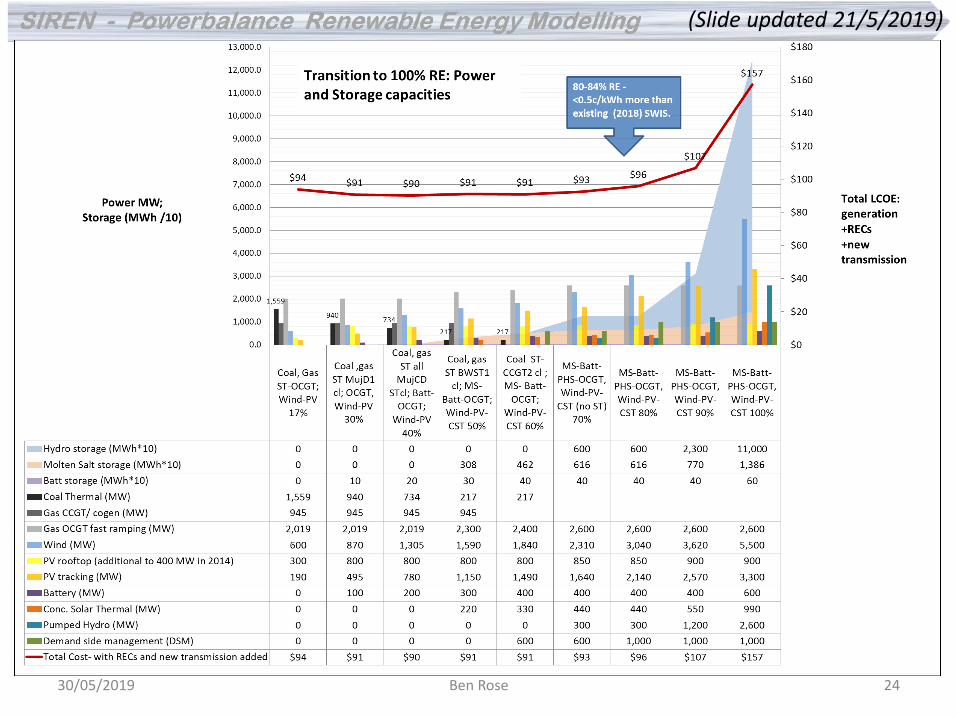
(Slide updated 21/5/2019)
30/05/2019 Ben Rose 24
• 90% RE is a sensible target in terms of cost and physical constraints.
• There are many combinations of wind, solar and storage that will do the job
• Remaining 10% from OCGT’s and or fuel cells fueled by H2 and or bio-fuels 100% RE.
30/05/2019 Ben Rose 25
What will the transition to renewable electricity cost?
30/05/2019 Ben Rose 26
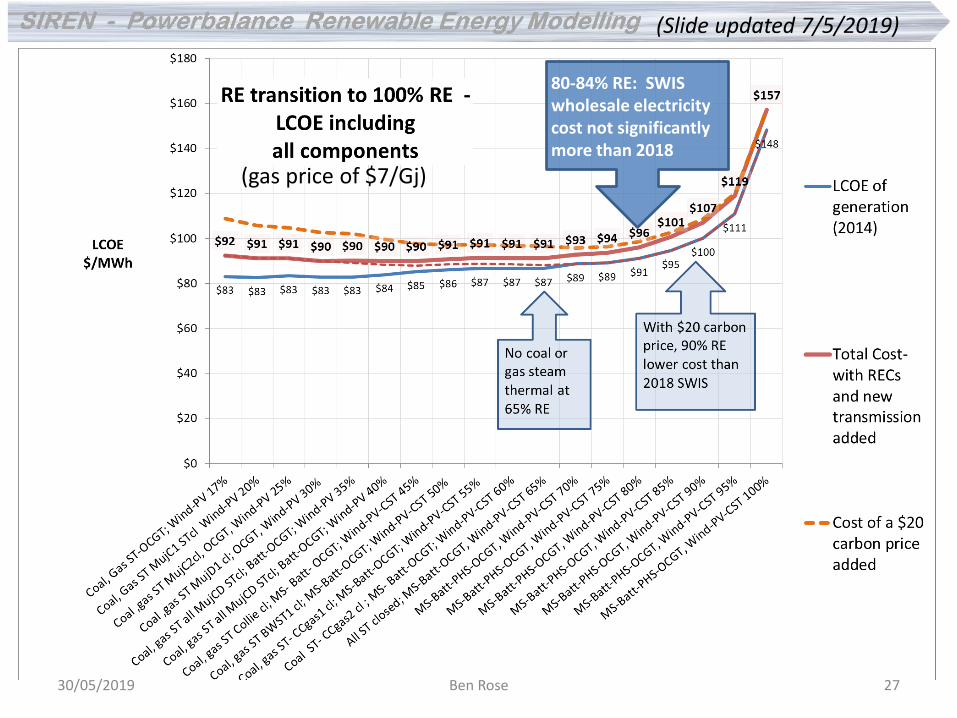
(gas price of $7/Gj)
80-84% RE: SWIS wholesale electricity cost not significantly more than 2018
(Slide updated 7/5/2019)
30/05/2019 Ben Rose 27
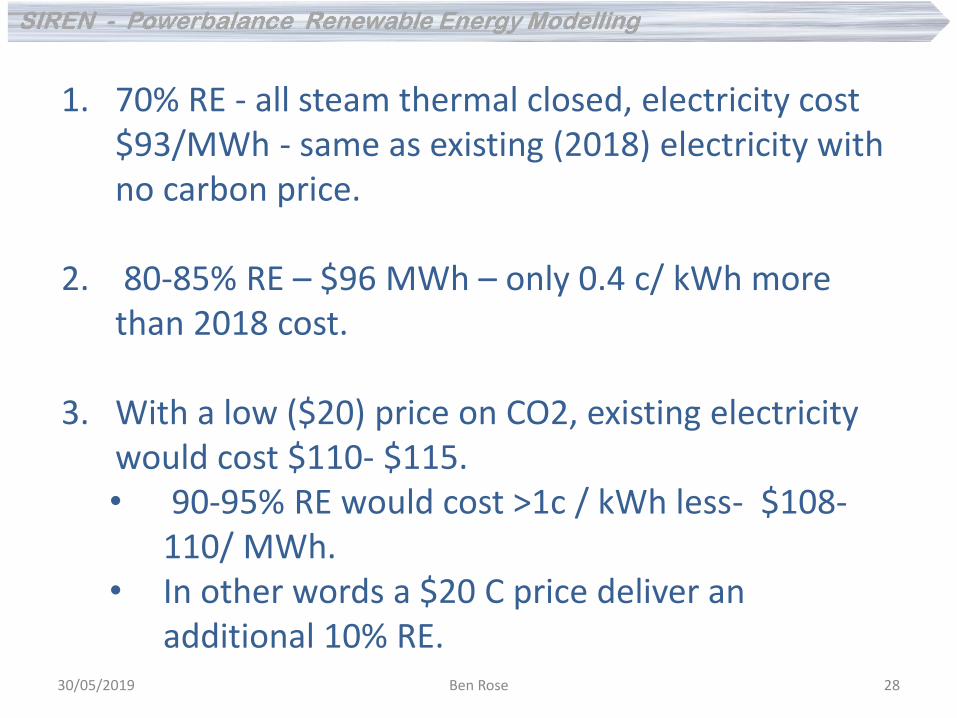
1. 70% RE - all steam thermal closed, electricity cost $93/MWh - same as existing (2018) electricity with no carbon price.
2. 80-85% RE – $96 MWh – only 0.4 c/ kWh more than 2018 cost.
3. With a low ($20) price on CO2, existing electricity would cost $110- $115. • 90-95% RE would cost >1c / kWh less- $108-
110/ MWh. • In other words a $20 C price deliver an
additional 10% RE. 30/05/2019 Ben Rose 28
What about gas cost?
30/05/2019 Ben Rose 29
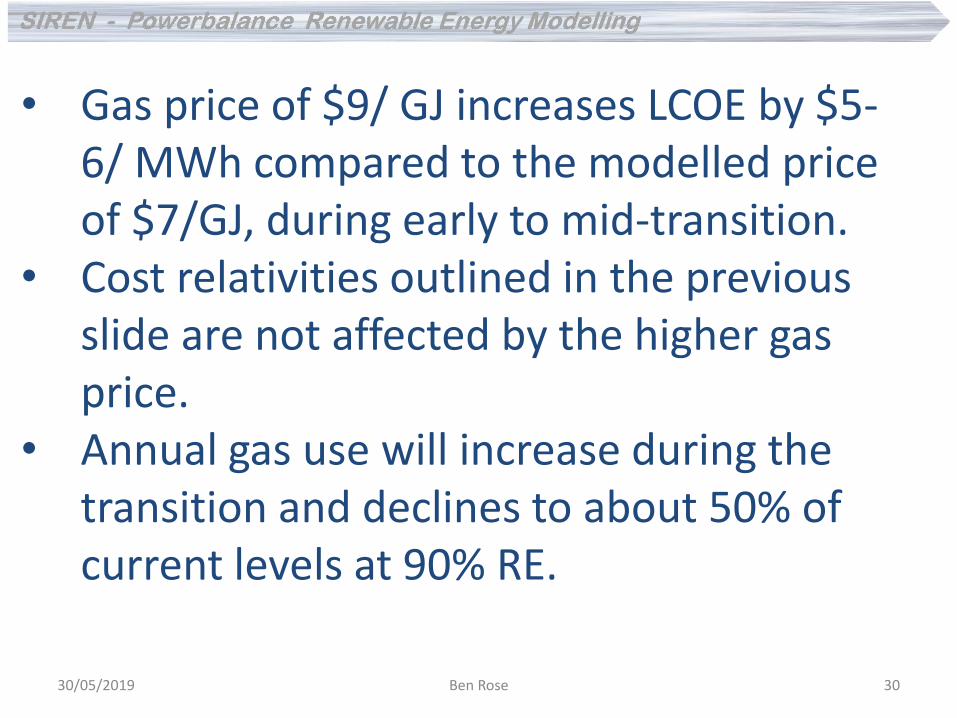
• Gas price of $9/ GJ increases LCOE by $5-6/ MWh compared to the modelled price of $7/GJ, during early to mid-transition.
• Cost relativities outlined in the previous slide are not affected by the higher gas price.
• Annual gas use will increase during the transition and declines to about 50% of current levels at 90% RE.
30/05/2019 Ben Rose 30
How much RE is needed to replace coal and gas steam thermal and how much will this cost?
30/05/2019 Ben Rose 31
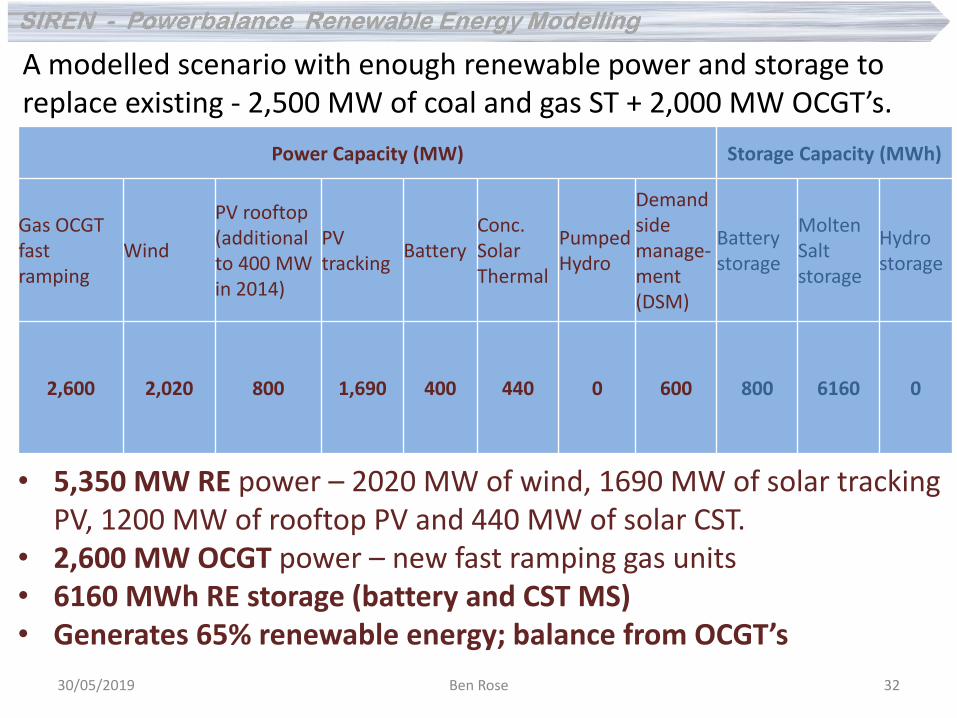
• 5,350 MW RE power – 2020 MW of wind, 1690 MW of solar tracking PV, 1200 MW of rooftop PV and 440 MW of solar CST.
• 2,600 MW OCGT power – new fast ramping gas units • 6160 MWh RE storage (battery and CST MS) • Generates 65% renewable energy; balance from OCGT’s
Power Capacity (MW) Storage Capacity (MWh)
Gas OCGT fast ramping
Wind
PV rooftop (additional to 400 MW in 2014)
PV tracking
Battery Conc. Solar Thermal
Pumped Hydro
Demand side manage-ment (DSM)
Battery storage
Molten Salt storage
Hydro storage
2,600 2,020 800 1,690 400 440 0 600 800 6160 0
A modelled scenario with enough renewable power and storage to replace existing - 2,500 MW of coal and gas ST + 2,000 MW OCGT’s.
30/05/2019 Ben Rose 32
Replacing all coal and gas steam thermal plant with RE power to generate 65% renewable electricity : • Likely to reduce wholesale electricity prices slightly
compared to existing (2018).
• $90 - $97/ MWh for gas prices of $7 - 9 per GJ
30/05/2019 Ben Rose 33
Does coal or gas steam thermal have a future with renewables?
30/05/2019 Ben Rose 34
30/05/2019 Ben Rose 35
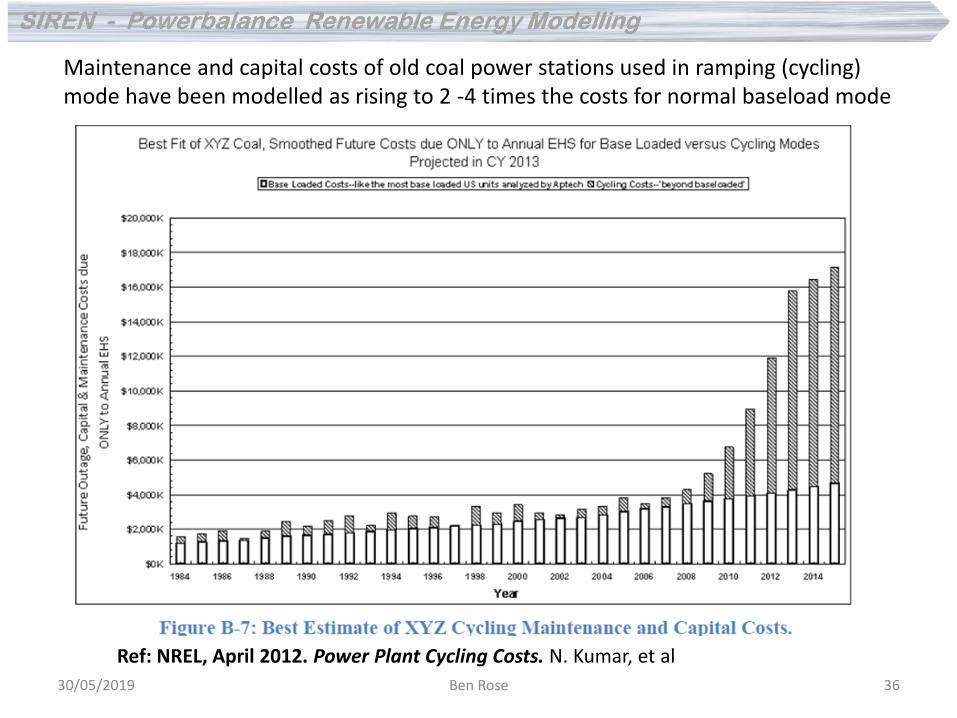
Ref: NREL, April 2012. Power Plant Cycling Costs. N. Kumar, et al
Maintenance and capital costs of old coal power stations used in ramping (cycling) mode have been modelled as rising to 2 -4 times the costs for normal baseload mode
30/05/2019 Ben Rose 36
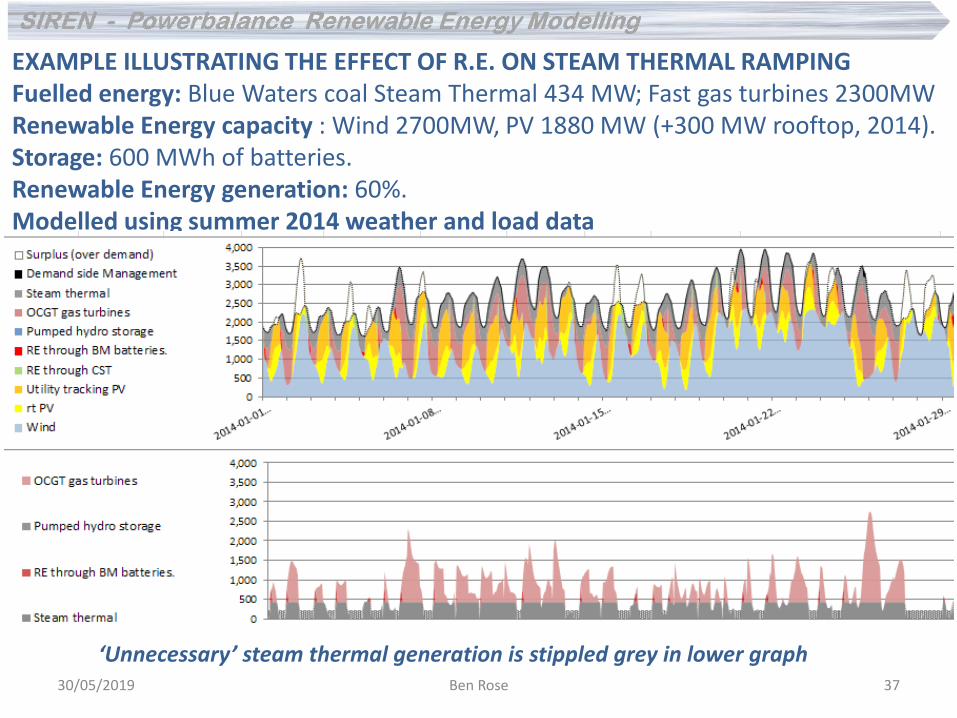
EXAMPLE ILLUSTRATING THE EFFECT OF R.E. ON STEAM THERMAL RAMPING Fuelled energy: Blue Waters coal Steam Thermal 434 MW; Fast gas turbines 2300MW Renewable Energy capacity : Wind 2700MW, PV 1880 MW (+300 MW rooftop, 2014). Storage: 600 MWh of batteries. Renewable Energy generation: 60%. Modelled using summer 2014 weather and load data
‘Unnecessary’ steam thermal generation is stippled grey in lower graph 30/05/2019 Ben Rose 37
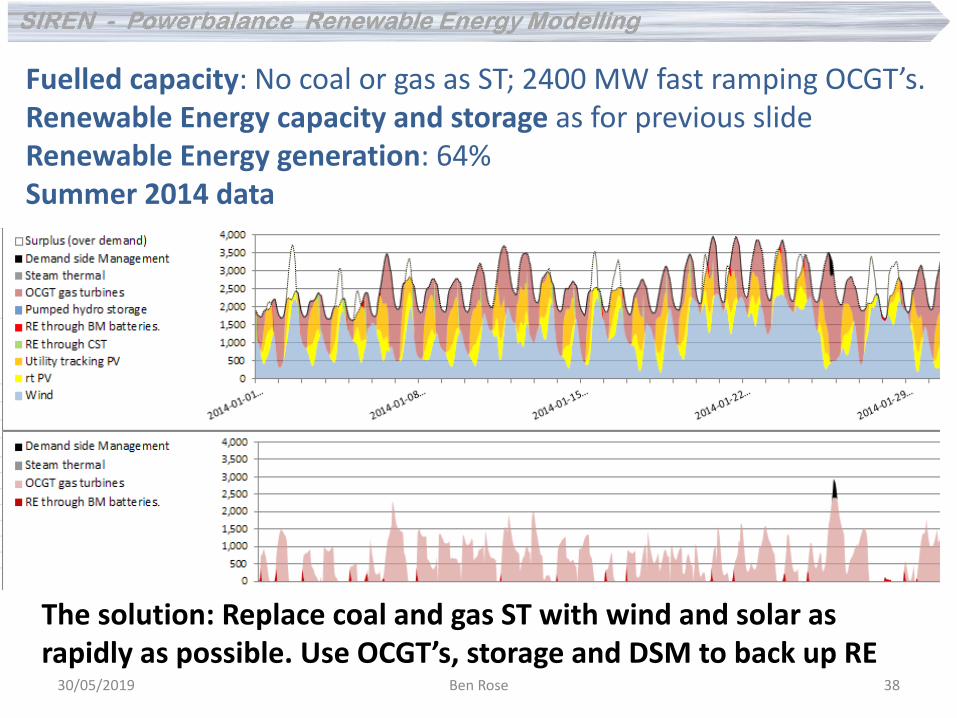
Fuelled capacity: No coal or gas as ST; 2400 MW fast ramping OCGT’s. Renewable Energy capacity and storage as for previous slide Renewable Energy generation: 64% Summer 2014 data
The solution: Replace coal and gas ST with wind and solar as rapidly as possible. Use OCGT’s, storage and DSM to back up RE
30/05/2019 Ben Rose 38
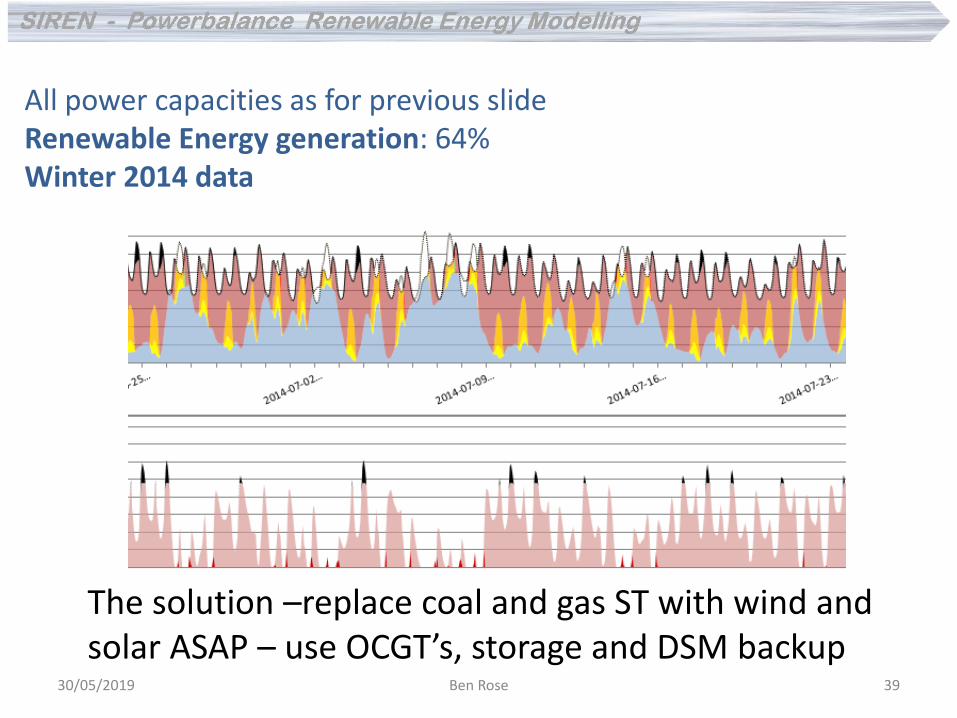
All power capacities as for previous slide Renewable Energy generation: 64% Winter 2014 data
The solution –replace coal and gas ST with wind and solar ASAP – use OCGT’s, storage and DSM backup
30/05/2019 Ben Rose 39
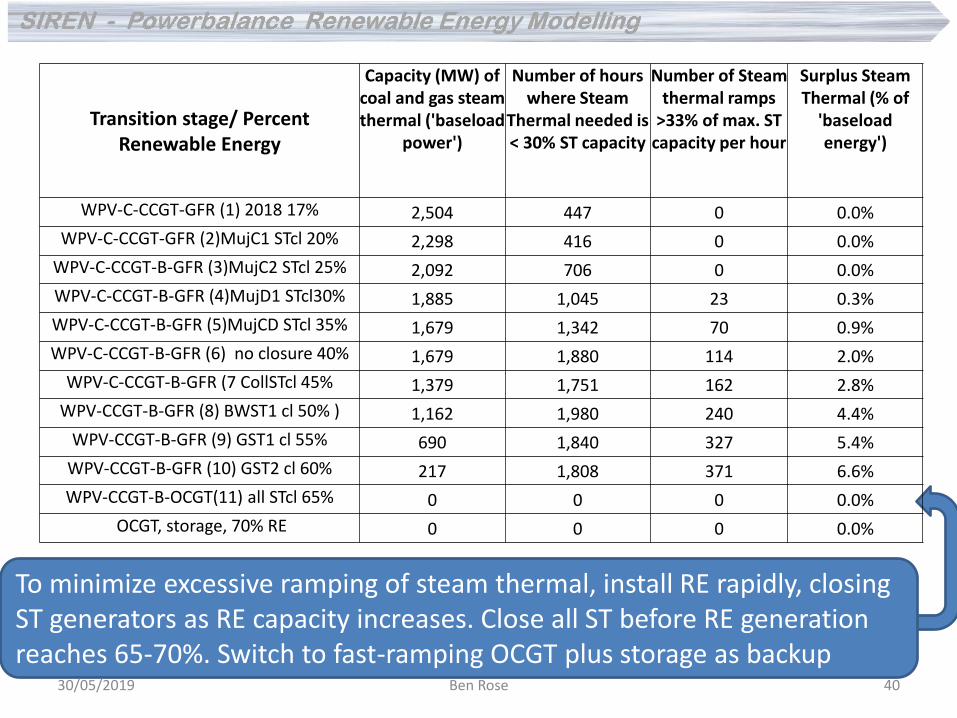
To minimize excessive ramping of steam thermal, install RE rapidly, closing ST generators as RE capacity increases. Close all ST before RE generation reaches 65-70%. Switch to fast-ramping OCGT plus storage as backup
Transition stage/ Percent Renewable Energy
Capacity (MW) of coal and gas steam thermal ('baseload
power')
Number of hours where Steam
Thermal needed is < 30% ST capacity
Number of Steam thermal ramps
>33% of max. ST capacity per hour
Surplus Steam Thermal (% of
'baseload energy')
WPV-C-CCGT-GFR (1) 2018 17% 2,504 447 0 0.0%
WPV-C-CCGT-GFR (2)MujC1 STcl 20% 2,298 416 0 0.0%
WPV-C-CCGT-B-GFR (3)MujC2 STcl 25% 2,092 706 0 0.0%
WPV-C-CCGT-B-GFR (4)MujD1 STcl30% 1,885 1,045 23 0.3%
WPV-C-CCGT-B-GFR (5)MujCD STcl 35% 1,679 1,342 70 0.9%
WPV-C-CCGT-B-GFR (6) no closure 40% 1,679 1,880 114 2.0%
WPV-C-CCGT-B-GFR (7 CollSTcl 45% 1,379 1,751 162 2.8%
WPV-CCGT-B-GFR (8) BWST1 cl 50% ) 1,162 1,980 240 4.4%
WPV-CCGT-B-GFR (9) GST1 cl 55% 690 1,840 327 5.4%
WPV-CCGT-B-GFR (10) GST2 cl 60% 217 1,808 371 6.6%
WPV-CCGT-B-OCGT(11) all STcl 65% 0 0 0 0.0%
OCGT, storage, 70% RE 0 0 0 0.0%
30/05/2019 Ben Rose 40
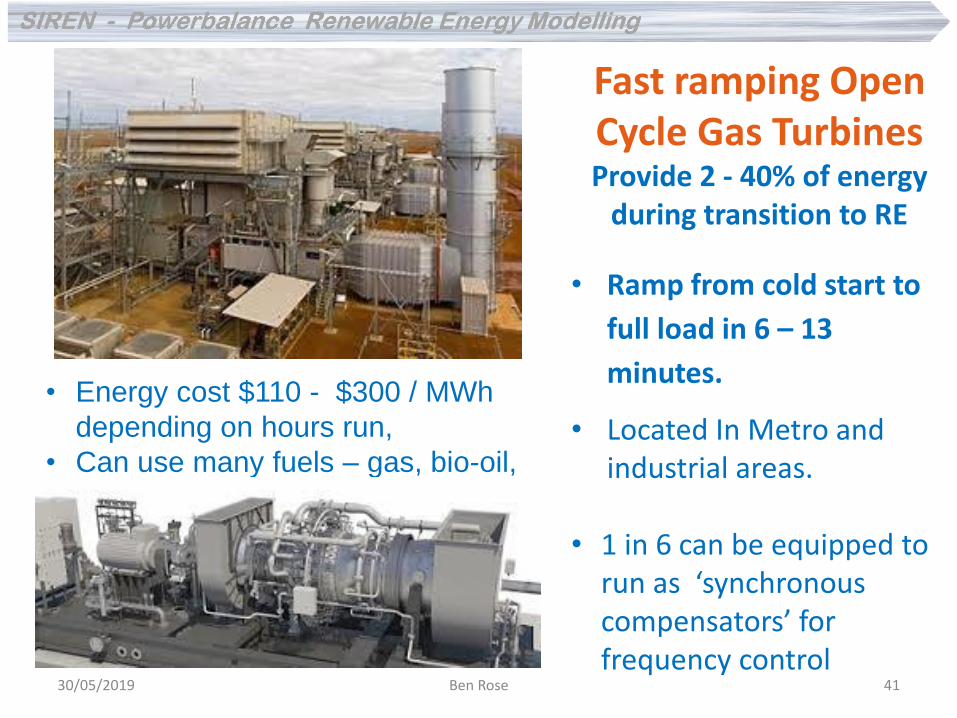
• Energy cost $110 - $300 / MWh
depending on hours run,
• Can use many fuels – gas, bio-oil,
bio-ethanol, bio-gas.
Fast ramping Open Cycle Gas Turbines Provide 2 - 40% of energy
during transition to RE
• Ramp from cold start to
full load in 6 – 13
minutes.
• Located In Metro and industrial areas.
• 1 in 6 can be equipped to run as ‘synchronous compensators’ for frequency control
30/05/2019 Ben Rose 41
Damage to ST generators can be reduced by: 1. Increasing maintenance and replacement of parts 2. Paying to curtail wind and solar, which has zero marginal
cost. CONCLUSIONS 1 & 2 above push up LCOE of coal and gas steam thermal (ST) and make it less reliable. As RE increases, need to phase out the ST early. Replace with fast ramping OCGT’s and storage by 65-70% RE.
Summary: • Coal and gas steam thermal (ST) do not function well as
backup for renewables because faster ramping and more shut-downs / start-ups will increase cost and decrease reliability of the ST generators.
30/05/2019 Ben Rose 42
But isn’t renewable energy mainly about reducing carbon emissions?
30/05/2019 Ben Rose 43
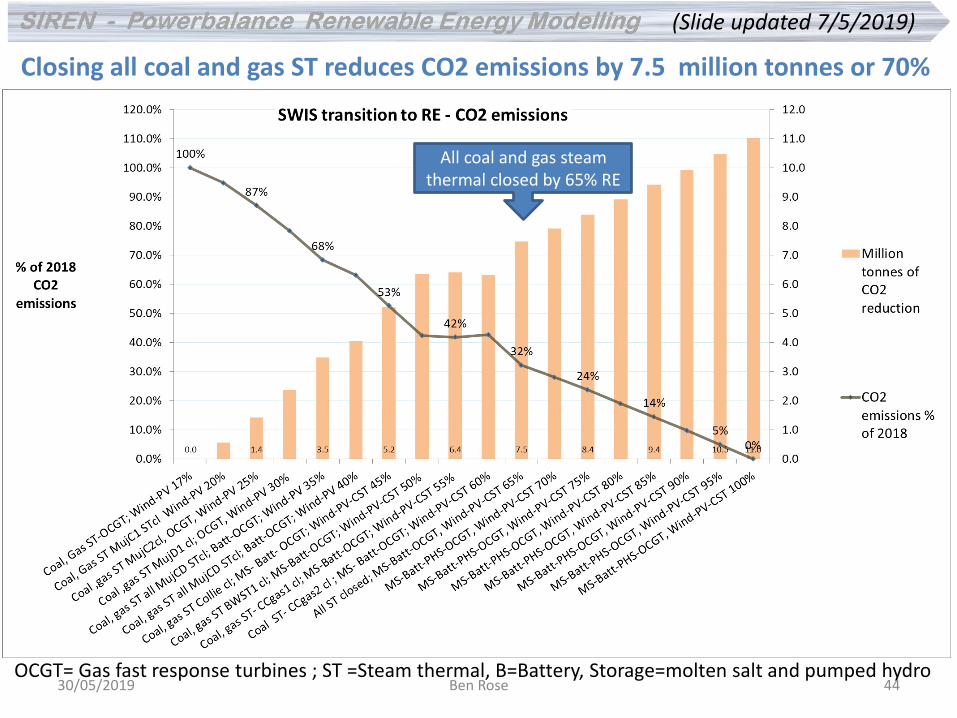
Closing all coal and gas ST reduces CO2 emissions by 7.5 million tonnes or 70%
OCGT= Gas fast response turbines ; ST =Steam thermal, B=Battery, Storage=molten salt and pumped hydro
All coal and gas steam thermal closed by 65% RE
(Slide updated 7/5/2019)
30/05/2019 Ben Rose 44
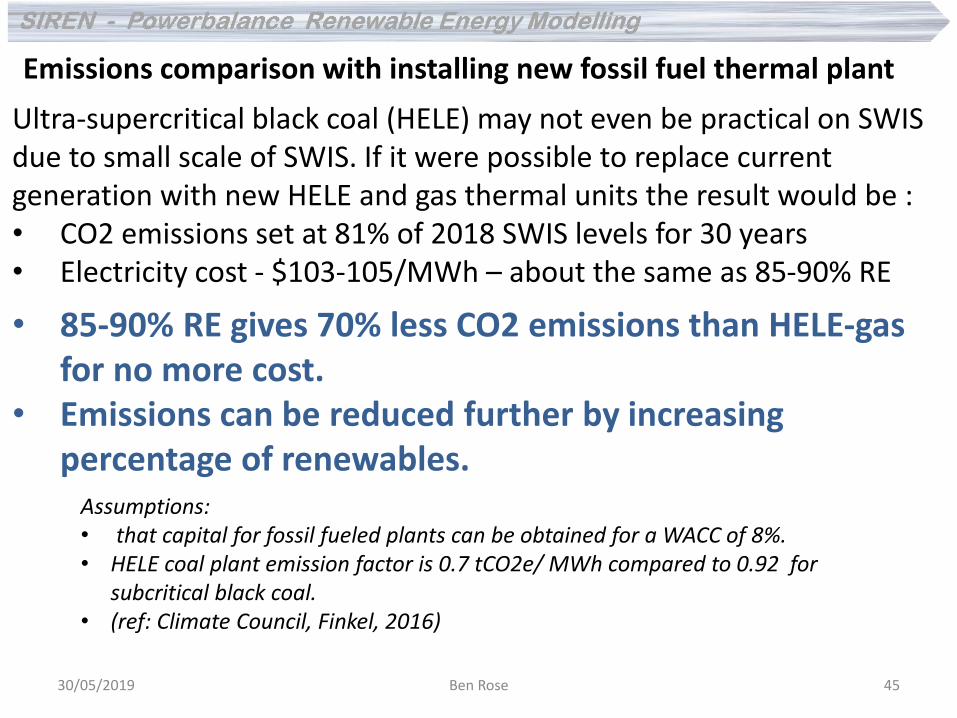
Ultra-supercritical black coal (HELE) may not even be practical on SWIS due to small scale of SWIS. If it were possible to replace current generation with new HELE and gas thermal units the result would be : • CO2 emissions set at 81% of 2018 SWIS levels for 30 years • Electricity cost - $103-105/MWh – about the same as 85-90% RE
Assumptions: • that capital for fossil fueled plants can be obtained for a WACC of 8%. • HELE coal plant emission factor is 0.7 tCO2e/ MWh compared to 0.92 for
subcritical black coal. • (ref: Climate Council, Finkel, 2016)
Emissions comparison with installing new fossil fuel thermal plant
• 85-90% RE gives 70% less CO2 emissions than HELE-gas for no more cost.
• Emissions can be reduced further by increasing percentage of renewables.
30/05/2019 Ben Rose 45
How variable is renewable energy?
30/05/2019 Ben Rose 46
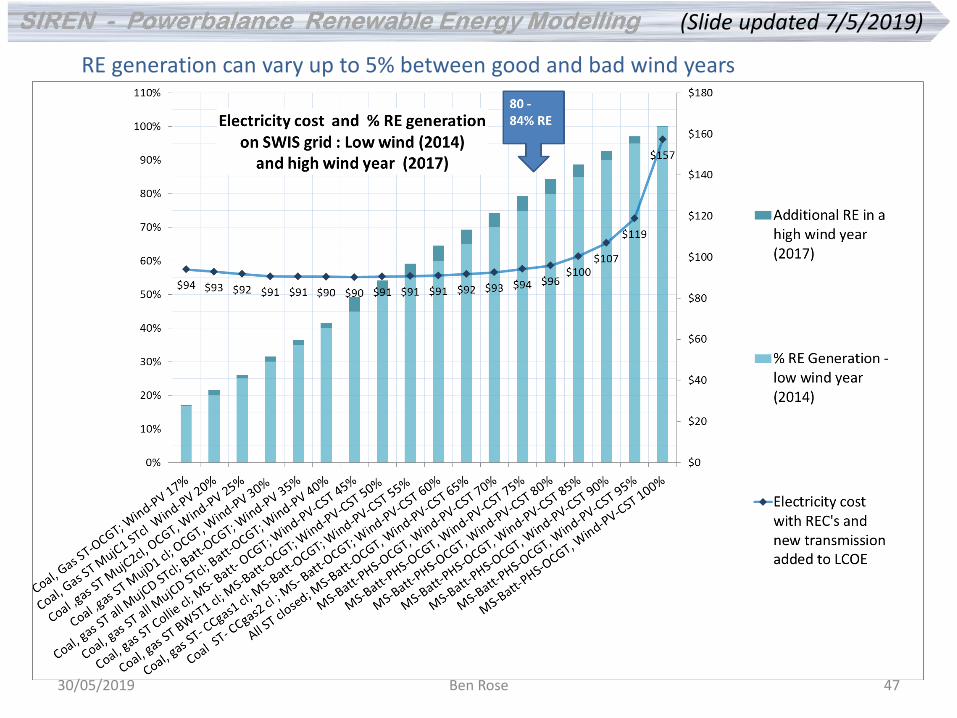
RE generation can vary up to 5% between good and bad wind years
(Slide updated 7/5/2019)
30/05/2019 Ben Rose 47
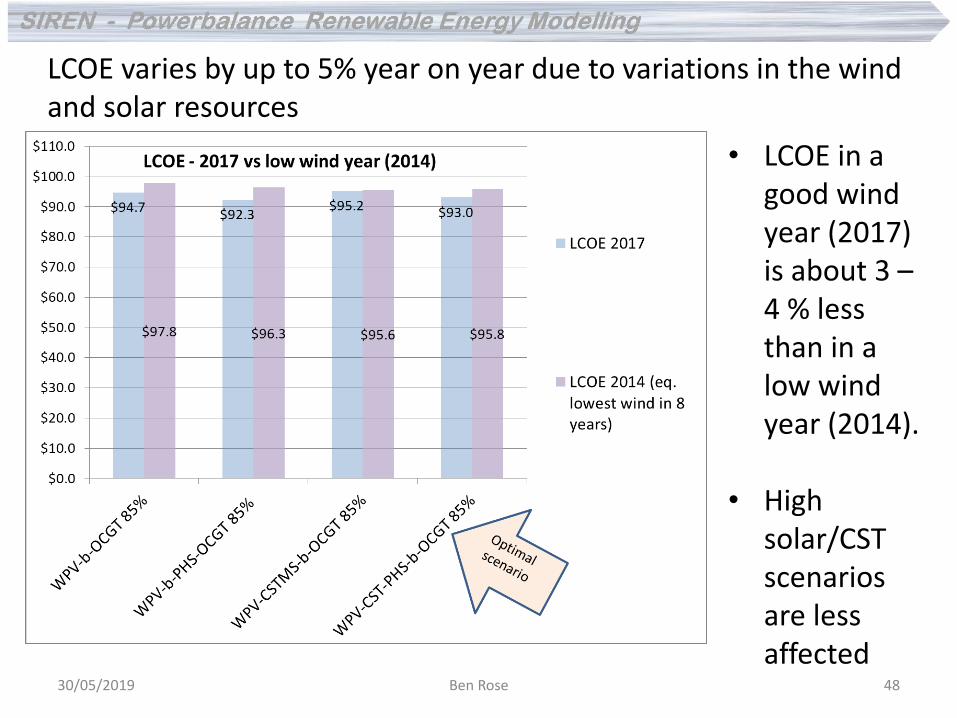
• LCOE in a good wind year (2017) is about 3 – 4 % less than in a low wind year (2014).
• High solar/CST scenarios are less affected
LCOE varies by up to 5% year on year due to variations in the wind and solar resources
30/05/2019 Ben Rose 48
How and where can wind be most effective?
30/05/2019 Ben Rose 49
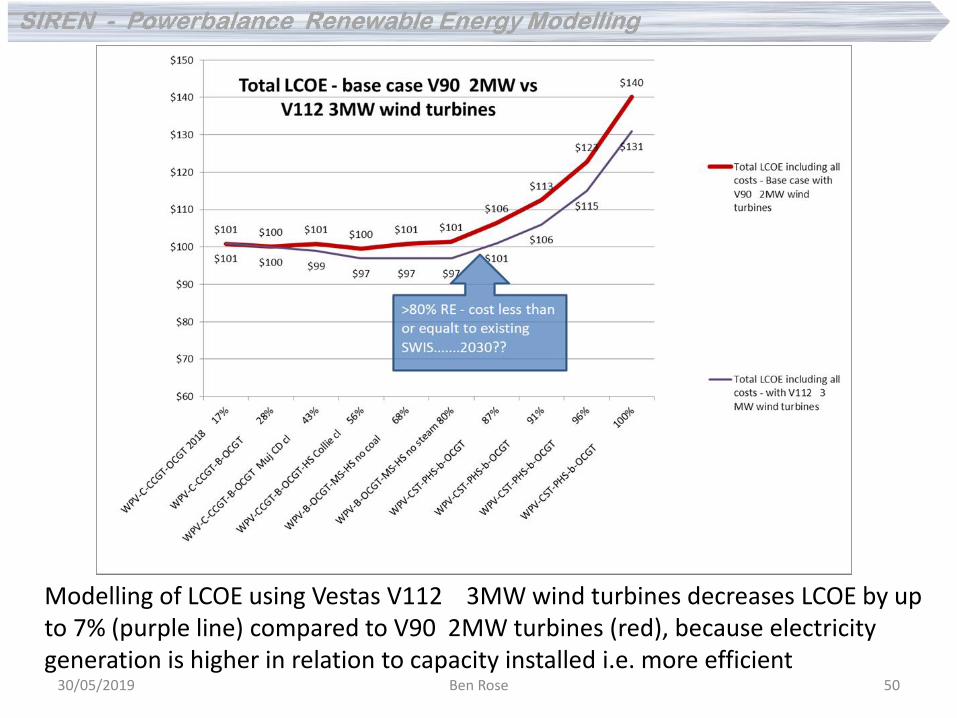
Modelling of LCOE using Vestas V112 3MW wind turbines decreases LCOE by up to 7% (purple line) compared to V90 2MW turbines (red), because electricity generation is higher in relation to capacity installed i.e. more efficient
30/05/2019 Ben Rose 50
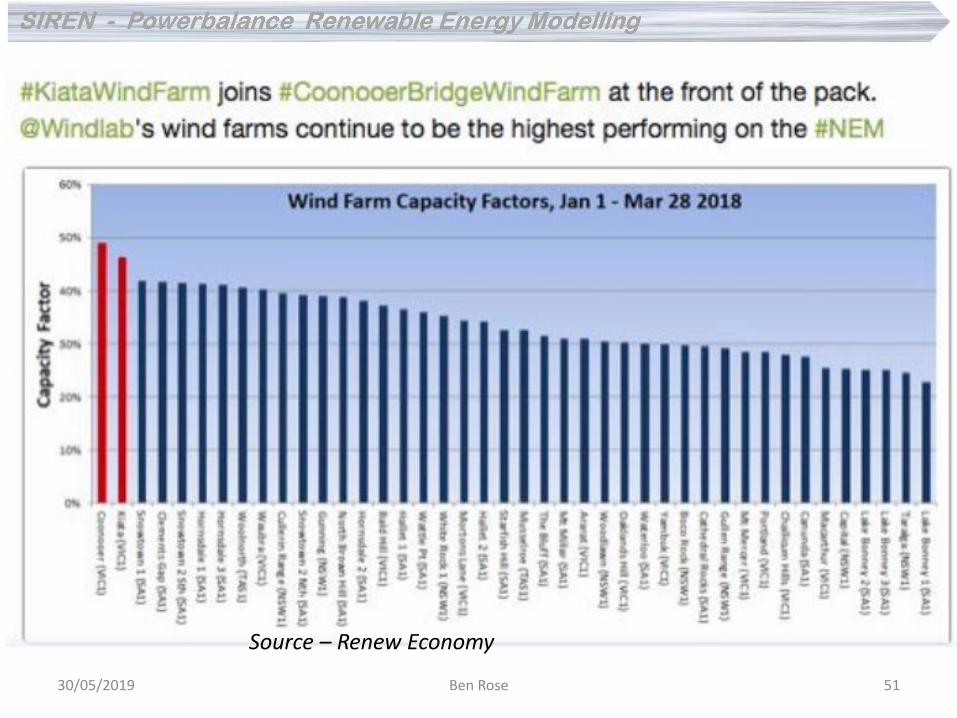
Source – Renew Economy
30/05/2019 Ben Rose 51
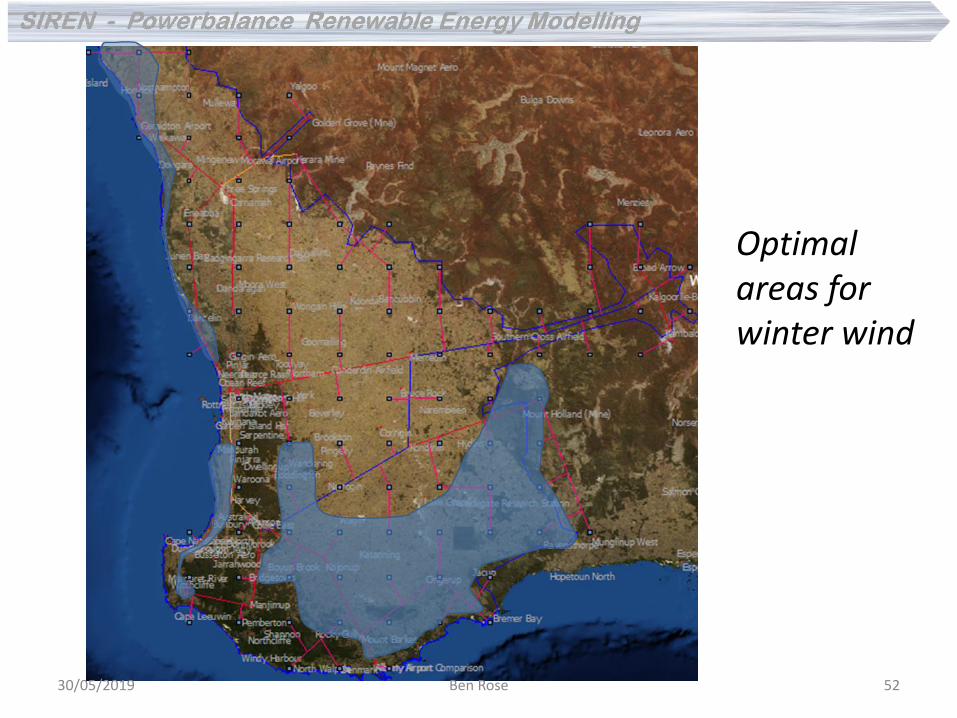
Optimal areas for winter wind
30/05/2019 Ben Rose 52
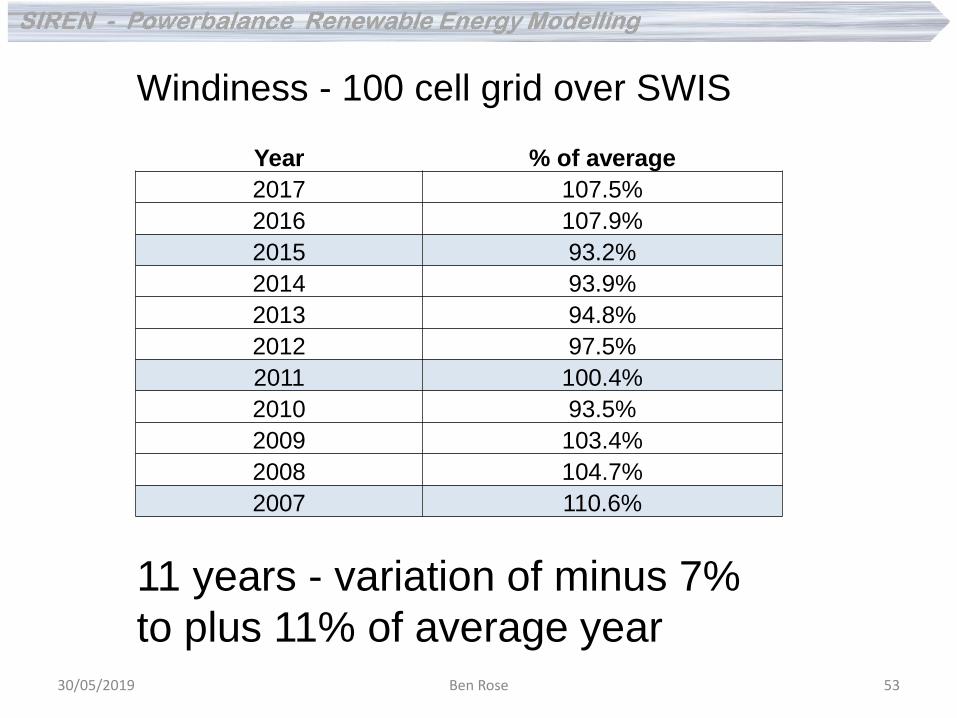
Windiness - 100 cell grid over SWIS
Year % of average
2017 107.5%
2016 107.9%
2015 93.2%
2014 93.9%
2013 94.8%
2012 97.5%
2011 100.4%
2010 93.5%
2009 103.4%
2008 104.7%
2007 110.6%
11 years - variation of minus 7%
to plus 11% of average year 30/05/2019 Ben Rose 53
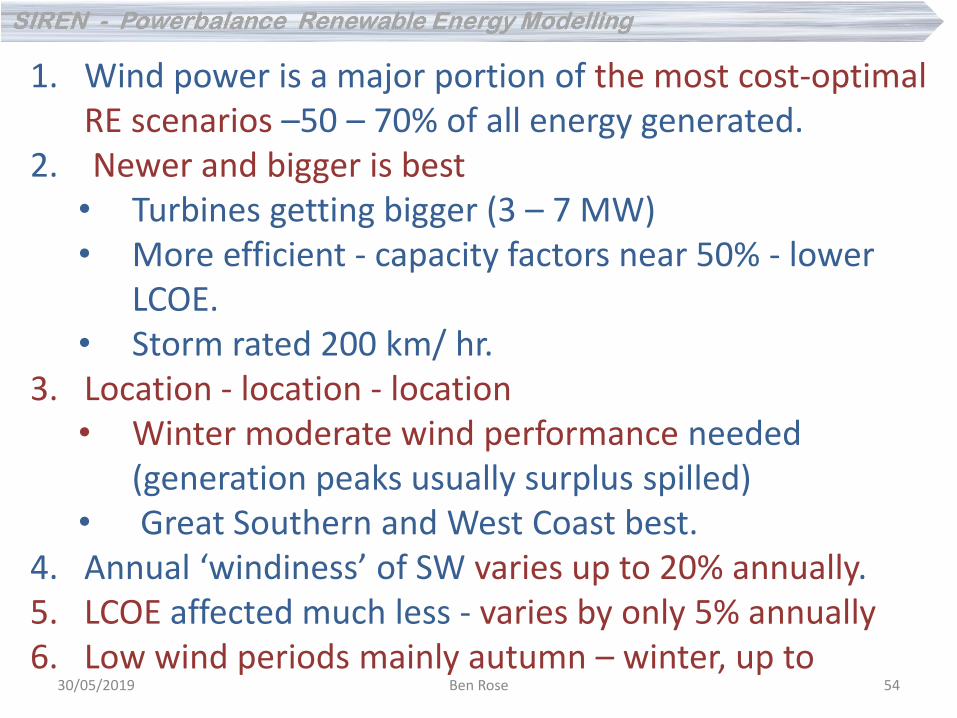
1. Wind power is a major portion of the most cost-optimal RE scenarios –50 – 70% of all energy generated.
2. Newer and bigger is best • Turbines getting bigger (3 – 7 MW) • More efficient - capacity factors near 50% - lower
LCOE. • Storm rated 200 km/ hr.
3. Location - location - location • Winter moderate wind performance needed
(generation peaks usually surplus spilled) • Great Southern and West Coast best.
4. Annual ‘windiness’ of SW varies up to 20% annually. 5. LCOE affected much less - varies by only 5% annually 6. Low wind periods mainly autumn – winter, up to
30/05/2019 Ben Rose 54
What type of solar to use?
30/05/2019 Ben Rose 55
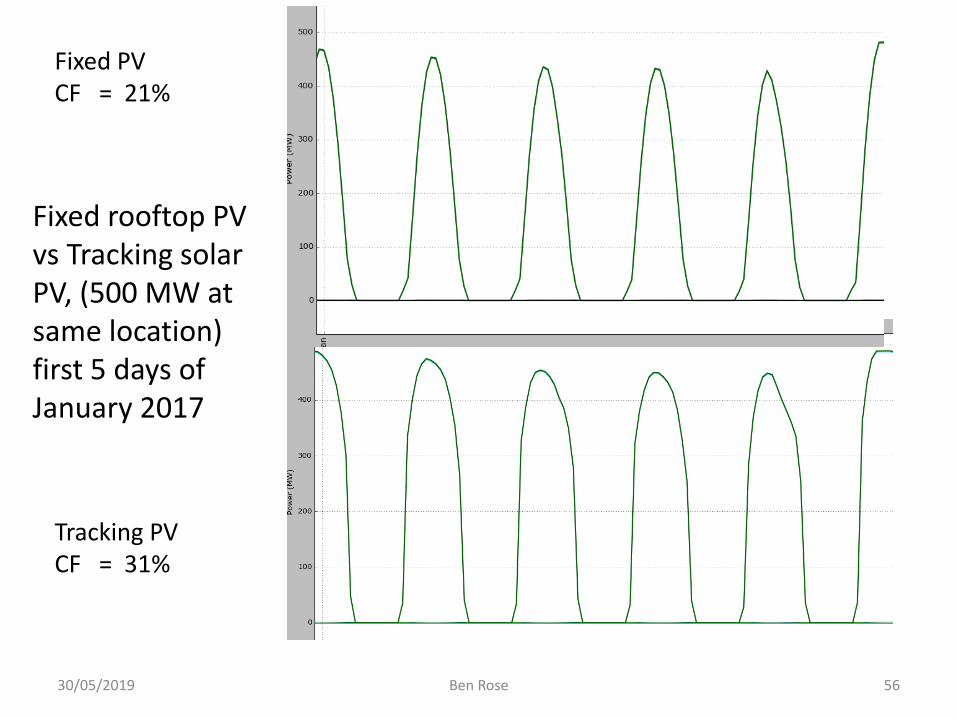
Fixed rooftop PV vs Tracking solar PV, (500 MW at same location) first 5 days of January 2017
Fixed PV CF = 21%
Tracking PV CF = 31%
30/05/2019 Ben Rose 56
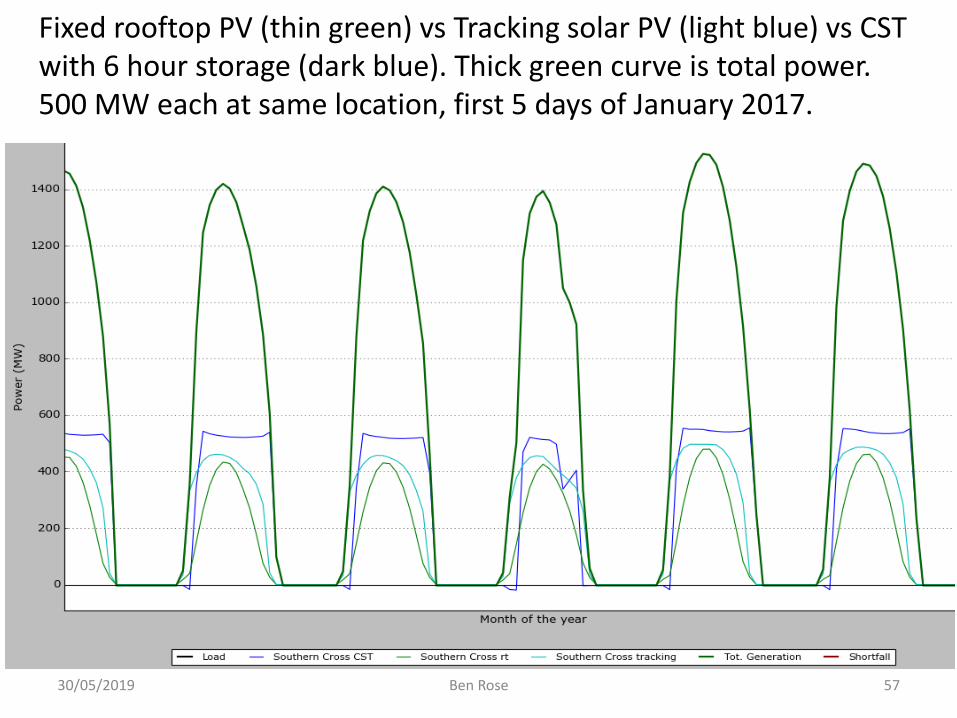
Fixed rooftop PV (thin green) vs Tracking solar PV (light blue) vs CST with 6 hour storage (dark blue). Thick green curve is total power. 500 MW each at same location, first 5 days of January 2017.
30/05/2019 Ben Rose 57
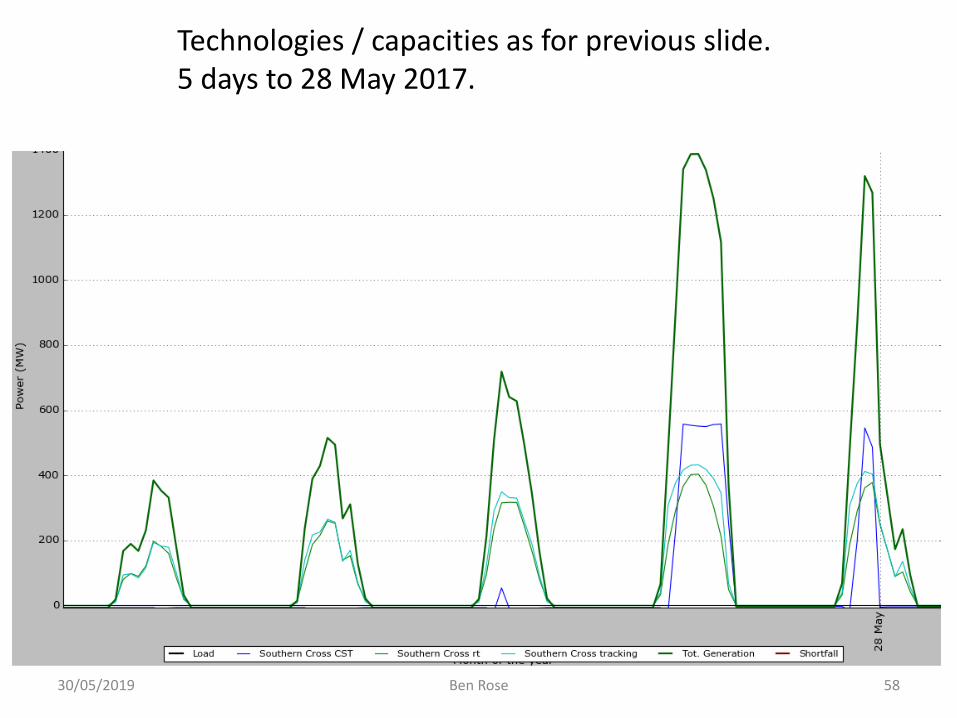
Technologies / capacities as for previous slide. 5 days to 28 May 2017.
30/05/2019 Ben Rose 58
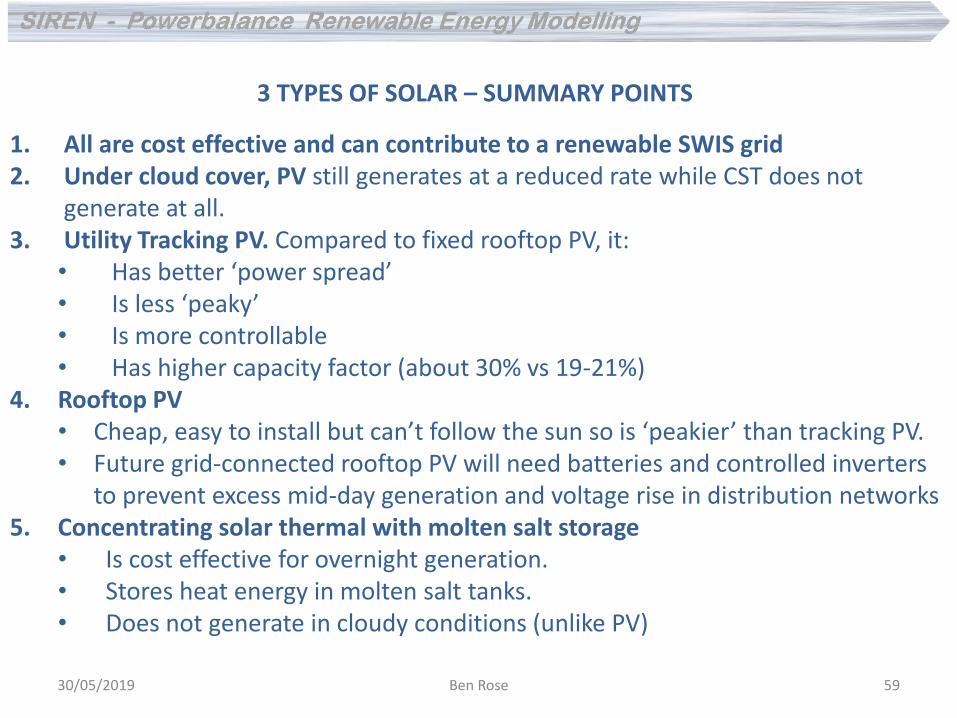
3 TYPES OF SOLAR – SUMMARY POINTS
1. All are cost effective and can contribute to a renewable SWIS grid 2. Under cloud cover, PV still generates at a reduced rate while CST does not
generate at all. 3. Utility Tracking PV. Compared to fixed rooftop PV, it:
• Has better ‘power spread’ • Is less ‘peaky’ • Is more controllable • Has higher capacity factor (about 30% vs 19-21%)
4. Rooftop PV • Cheap, easy to install but can’t follow the sun so is ‘peakier’ than tracking PV. • Future grid-connected rooftop PV will need batteries and controlled inverters
to prevent excess mid-day generation and voltage rise in distribution networks 5. Concentrating solar thermal with molten salt storage
• Is cost effective for overnight generation. • Stores heat energy in molten salt tanks. • Does not generate in cloudy conditions (unlike PV)
30/05/2019 Ben Rose 59
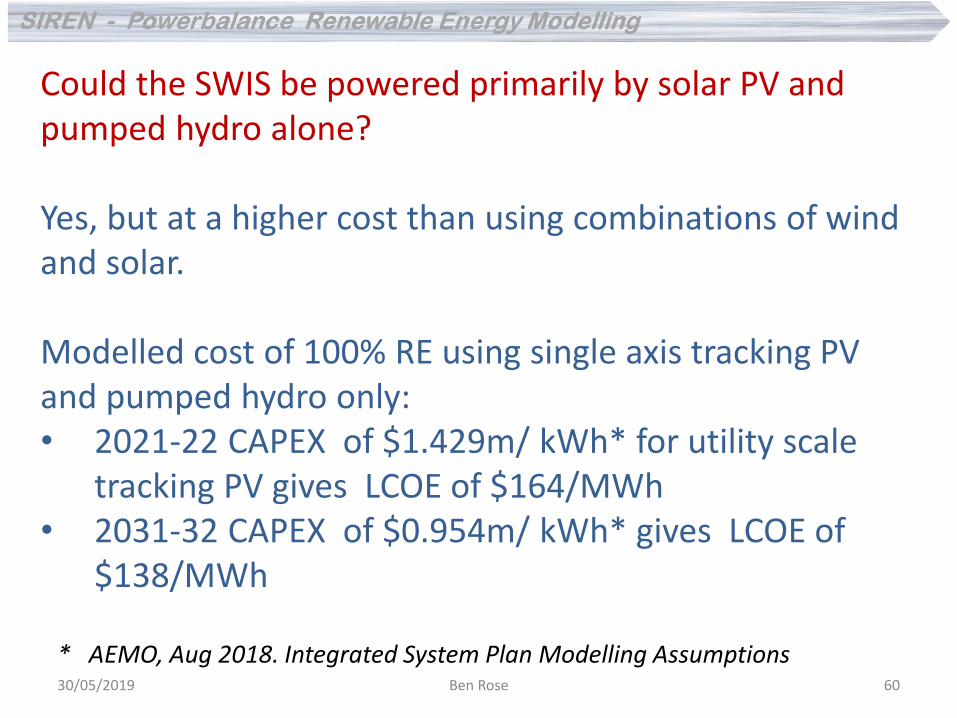
Could the SWIS be powered primarily by solar PV and pumped hydro alone?
Yes, but at a higher cost than using combinations of wind and solar.
Modelled cost of 100% RE using single axis tracking PV and pumped hydro only: • 2021-22 CAPEX of $1.429m/ kWh* for utility scale
tracking PV gives LCOE of $164/MWh • 2031-32 CAPEX of $0.954m/ kWh* gives LCOE of
$138/MWh
* AEMO, Aug 2018. Integrated System Plan Modelling Assumptions 30/05/2019 Ben Rose 60
What about the cost of new transmission lines?
30/05/2019 Ben Rose 61
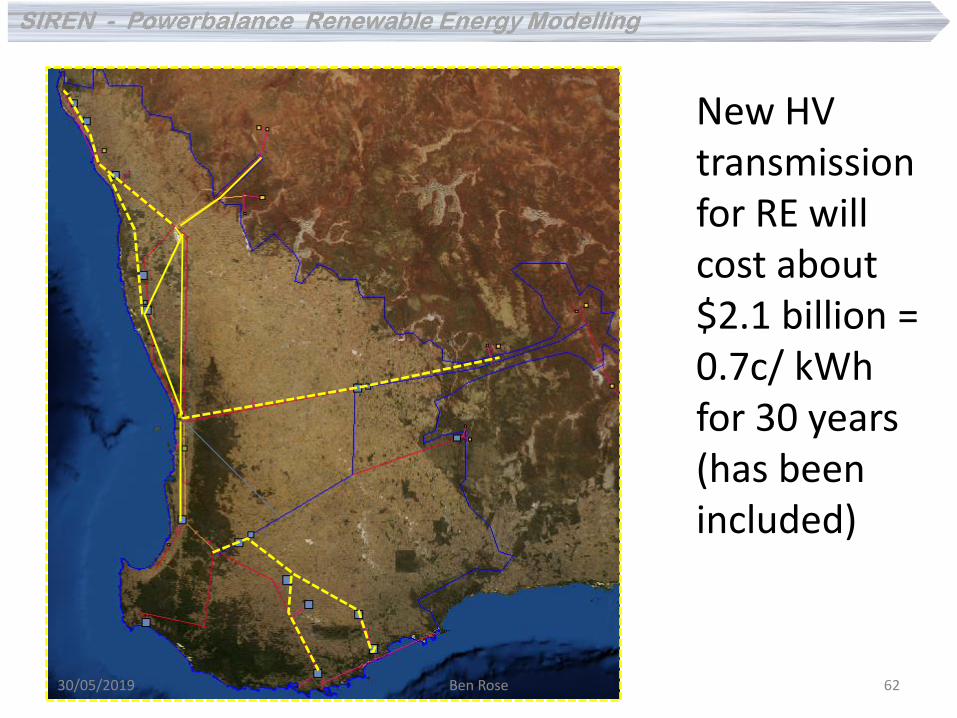
New HV transmission for RE will cost about $2.1 billion = 0.7c/ kWh for 30 years (has been included)
30/05/2019 Ben Rose 62
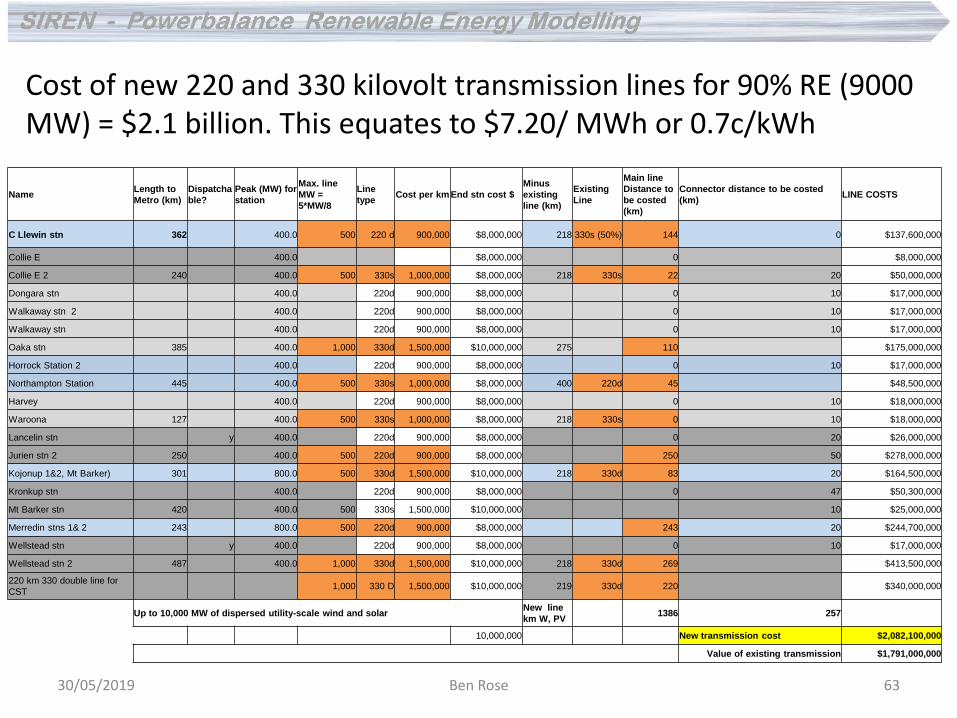
Cost of new 220 and 330 kilovolt transmission lines for 90% RE (9000 MW) = $2.1 billion. This equates to $7.20/ MWh or 0.7c/kWh
Name Length to
Metro (km)
Dispatcha
ble?
Peak (MW) for
station
Max. line
MW =
5*MW/8
Line
type Cost per km End stn cost $
Minus
existing
line (km)
Existing
Line
Main line
Distance to
be costed
(km)
Connector distance to be costed
(km) LINE COSTS
C Llewin stn 362 400.0 500 220 d 900,000 $8,000,000 218 330s (50%) 144 0 $137,600,000
Collie E 400.0 $8,000,000 0 $8,000,000
Collie E 2 240 400.0 500 330s 1,000,000 $8,000,000 218 330s 22 20 $50,000,000
Dongara stn 400.0 220d 900,000 $8,000,000 0 10 $17,000,000
Walkaway stn 2 400.0 220d 900,000 $8,000,000 0 10 $17,000,000
Walkaway stn 400.0 220d 900,000 $8,000,000 0 10 $17,000,000
Oaka stn 385 400.0 1,000 330d 1,500,000 $10,000,000 275 110 $175,000,000
Horrock Station 2 400.0 220d 900,000 $8,000,000 0 10 $17,000,000
Northampton Station 445 400.0 500 330s 1,000,000 $8,000,000 400 220d 45 $48,500,000
Harvey 400.0 220d 900,000 $8,000,000 0 10 $18,000,000
Waroona 127 400.0 500 330s 1,000,000 $8,000,000 218 330s 0 10 $18,000,000
Lancelin stn y 400.0 220d 900,000 $8,000,000 0 20 $26,000,000
Jurien stn 2 250 400.0 500 220d 900,000 $8,000,000 250 50 $278,000,000
Kojonup 1&2, Mt Barker) 301 800.0 500 330d 1,500,000 $10,000,000 218 330d 83 20 $164,500,000
Kronkup stn 400.0 220d 900,000 $8,000,000 0 47 $50,300,000
Mt Barker stn 420 400.0 500 330s 1,500,000 $10,000,000 10 $25,000,000
Merredin stns 1& 2 243 800.0 500 220d 900,000 $8,000,000 243 20 $244,700,000
Wellstead stn y 400.0 220d 900,000 $8,000,000 0 10 $17,000,000
Wellstead stn 2 487 400.0 1,000 330d 1,500,000 $10,000,000 218 330d 269 $413,500,000
220 km 330 double line for
CST 1,000 330 D 1,500,000 $10,000,000 219 330d 220 $340,000,000
Up to 10,000 MW of dispersed utility-scale wind and solar New line
km W, PV 1386 257
10,000,000 New transmission cost $2,082,100,000
Value of existing transmission $1,791,000,000
30/05/2019 Ben Rose 63
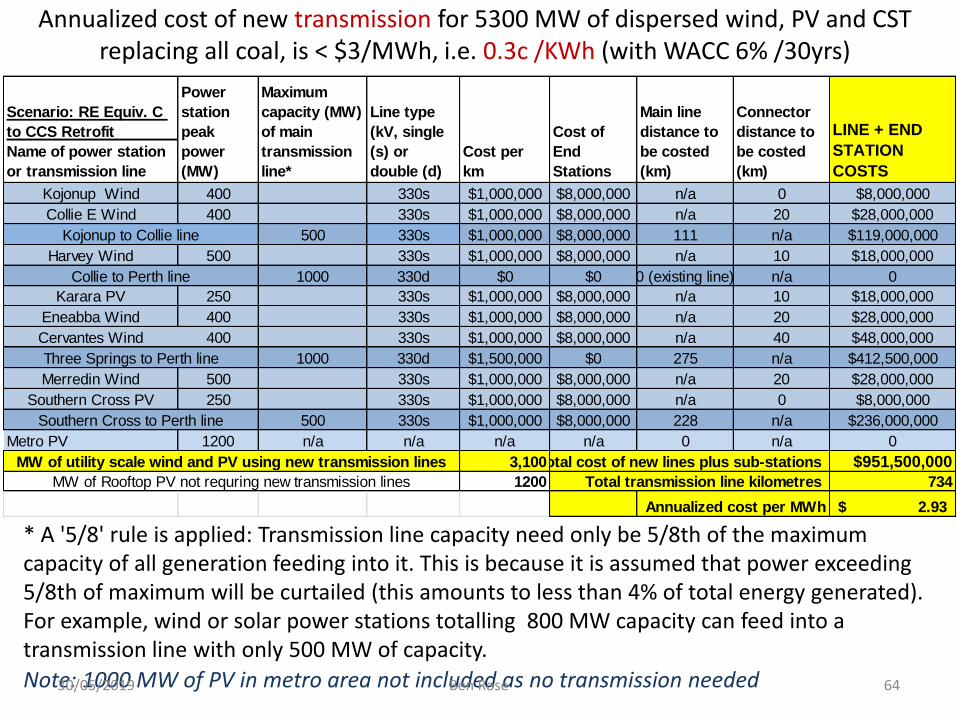
Annualized cost of new transmission for 5300 MW of dispersed wind, PV and CST replacing all coal, is < $3/MWh, i.e. 0.3c /KWh (with WACC 6% /30yrs)
Note: 1000 MW of PV in metro area not included as no transmission needed
* A '5/8' rule is applied: Transmission line capacity need only be 5/8th of the maximum capacity of all generation feeding into it. This is because it is assumed that power exceeding 5/8th of maximum will be curtailed (this amounts to less than 4% of total energy generated). For example, wind or solar power stations totalling 800 MW capacity can feed into a transmission line with only 500 MW of capacity.
Scenario: RE Equiv. C
to CCS Retrofit
Name of power station
or transmission line
Power
station
peak
power
(MW)
Maximum
capacity (MW)
of main
transmission
line*
Line type
(kV, single
(s) or
double (d)
Cost per
km
Cost of
End
Stations
Main line
distance to
be costed
(km)
Connector
distance to
be costed
(km)
LINE + END
STATION
COSTS
Kojonup Wind 400 330s $1,000,000 $8,000,000 n/a 0 $8,000,000
Collie E Wind 400 330s $1,000,000 $8,000,000 n/a 20 $28,000,000
500 330s $1,000,000 $8,000,000 111 n/a $119,000,000
Harvey Wind 500 330s $1,000,000 $8,000,000 n/a 10 $18,000,000
1000 330d $0 $0 0 (existing line) n/a 0
Karara PV 250 330s $1,000,000 $8,000,000 n/a 10 $18,000,000
Eneabba Wind 400 330s $1,000,000 $8,000,000 n/a 20 $28,000,000
Cervantes Wind 400 330s $1,000,000 $8,000,000 n/a 40 $48,000,000
1000 330d $1,500,000 $0 275 n/a $412,500,000
Merredin Wind 500 330s $1,000,000 $8,000,000 n/a 20 $28,000,000
Southern Cross PV 250 330s $1,000,000 $8,000,000 n/a 0 $8,000,000
500 330s $1,000,000 $8,000,000 228 n/a $236,000,000
Metro PV 1200 n/a n/a n/a n/a 0 n/a 0
3,100Total cost of new lines plus sub-stations $951,500,000
1200 Total transmission line kilometres 734
Annualized cost per MWh 2.93$
MW of Rooftop PV not requring new transmission lines
MW of utility scale wind and PV using new transmission lines
Kojonup to Collie line
Three Springs to Perth line
Collie to Perth line
Southern Cross to Perth line
30/05/2019 Ben Rose 64
10 take-away points
30/05/2019 Ben Rose 65
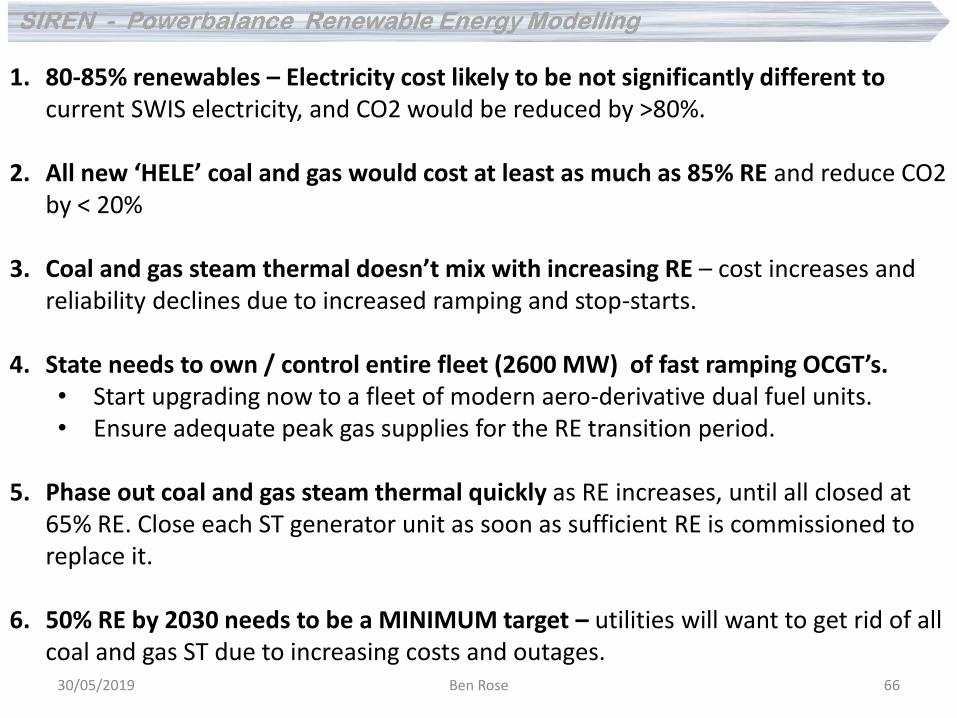
1. 80-85% renewables – Electricity cost likely to be not significantly different to current SWIS electricity, and CO2 would be reduced by >80%.
2. All new ‘HELE’ coal and gas would cost at least as much as 85% RE and reduce CO2 by < 20%
3. Coal and gas steam thermal doesn’t mix with increasing RE – cost increases and reliability declines due to increased ramping and stop-starts.
4. State needs to own / control entire fleet (2600 MW) of fast ramping OCGT’s. • Start upgrading now to a fleet of modern aero-derivative dual fuel units. • Ensure adequate peak gas supplies for the RE transition period.
5. Phase out coal and gas steam thermal quickly as RE increases, until all closed at
65% RE. Close each ST generator unit as soon as sufficient RE is commissioned to replace it.
6. 50% RE by 2030 needs to be a MINIMUM target – utilities will want to get rid of all coal and gas ST due to increasing costs and outages.
30/05/2019 Ben Rose 66
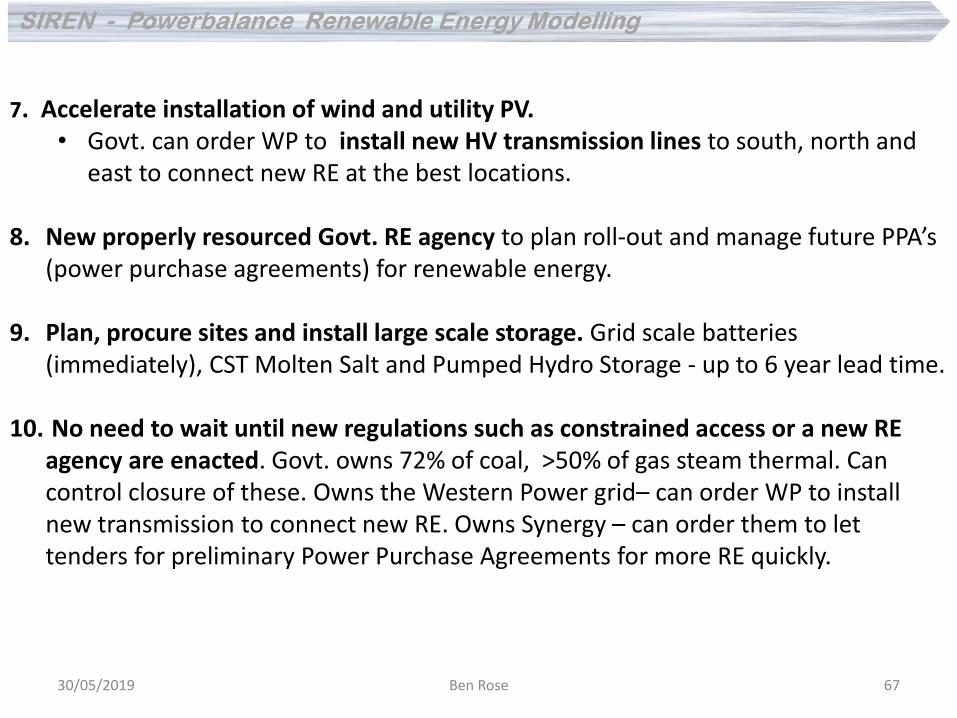
7. Accelerate installation of wind and utility PV. • Govt. can order WP to install new HV transmission lines to south, north and
east to connect new RE at the best locations.
8. New properly resourced Govt. RE agency to plan roll-out and manage future PPA’s (power purchase agreements) for renewable energy.
9. Plan, procure sites and install large scale storage. Grid scale batteries (immediately), CST Molten Salt and Pumped Hydro Storage - up to 6 year lead time.
10. No need to wait until new regulations such as constrained access or a new RE agency are enacted. Govt. owns 72% of coal, >50% of gas steam thermal. Can control closure of these. Owns the Western Power grid– can order WP to install new transmission to connect new RE. Owns Synergy – can order them to let tenders for preliminary Power Purchase Agreements for more RE quickly.
30/05/2019 Ben Rose 67
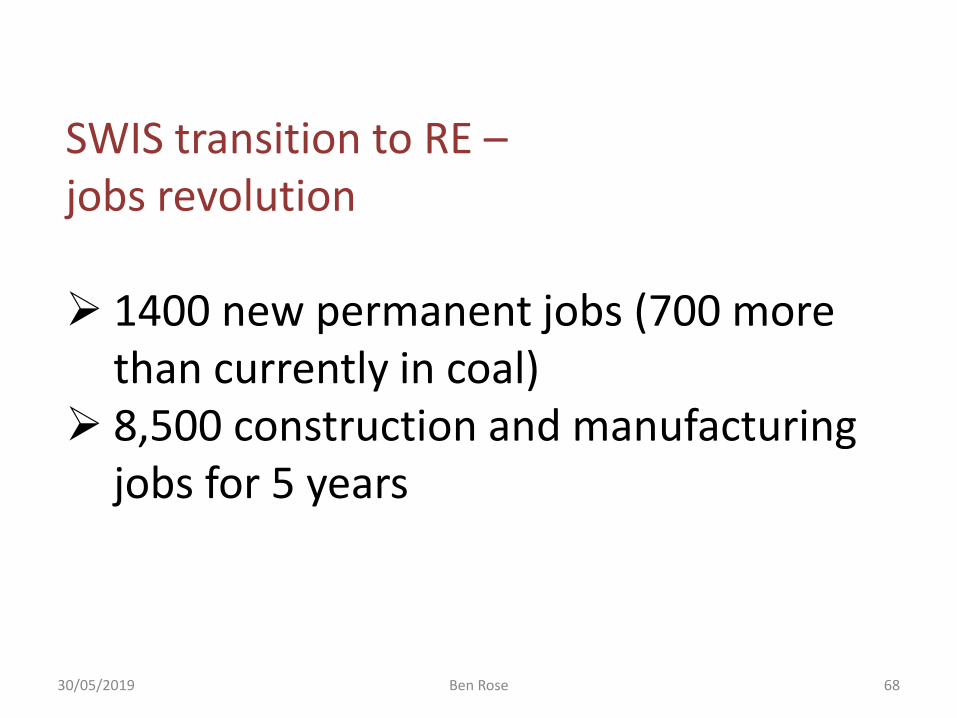
SWIS transition to RE – jobs revolution 1400 new permanent jobs (700 more
than currently in coal) 8,500 construction and manufacturing
jobs for 5 years
30/05/2019 Ben Rose 68
Supplementary slides
30/05/2019 Ben Rose 69
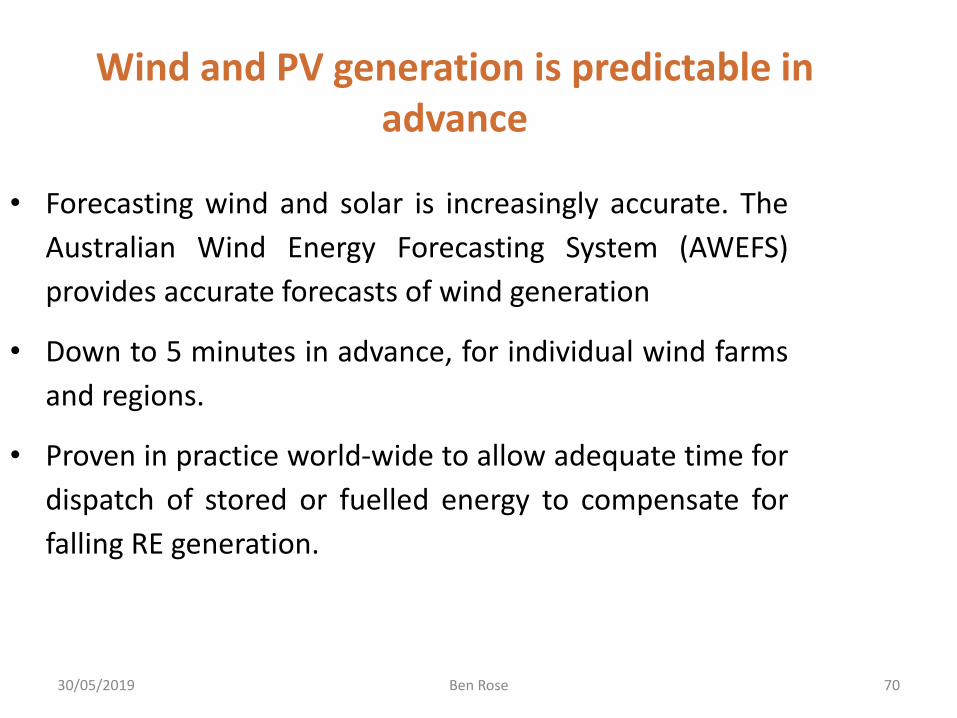
Wind and PV generation is predictable in advance
• Forecasting wind and solar is increasingly accurate. The
Australian Wind Energy Forecasting System (AWEFS)
provides accurate forecasts of wind generation
• Down to 5 minutes in advance, for individual wind farms
and regions.
• Proven in practice world-wide to allow adequate time for
dispatch of stored or fuelled energy to compensate for
falling RE generation.
30/05/2019 Ben Rose 70
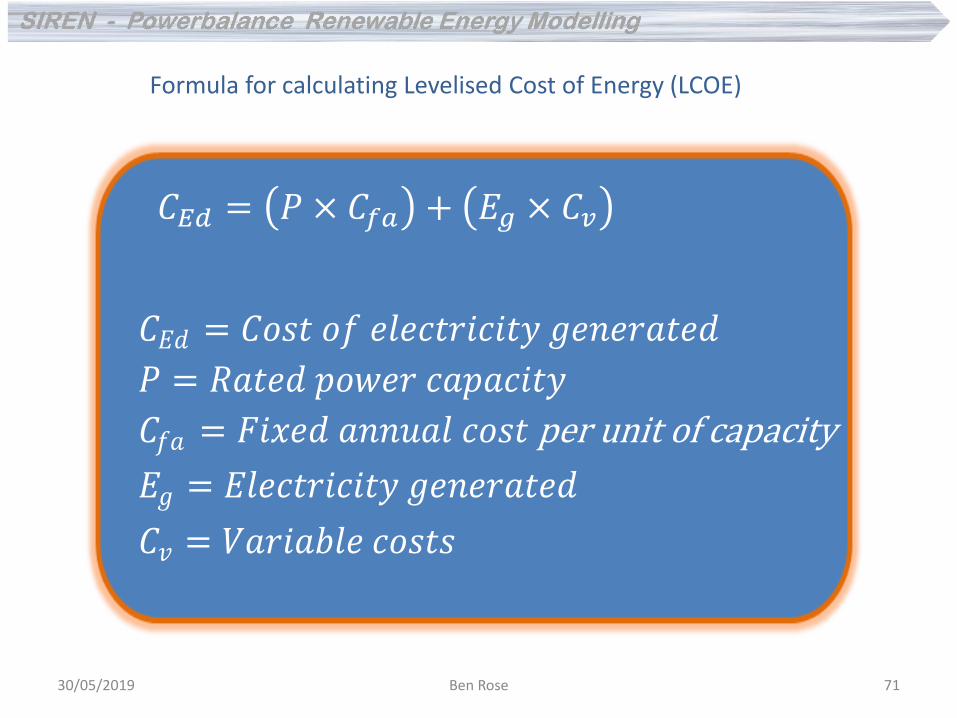
𝐶𝐸𝑑 = 𝑃 × 𝐶𝑓𝑎 + 𝐸𝑔 × 𝐶𝑣
Where:
𝐶𝐸𝑑 = 𝐶𝑜𝑠𝑡 𝑜𝑓 𝑒𝑙𝑒𝑐𝑡𝑟𝑖𝑐𝑖𝑡𝑦 𝑔𝑒𝑛𝑒𝑟𝑎𝑡𝑒𝑑
𝑃 = 𝑅𝑎𝑡𝑒𝑑 𝑝𝑜𝑤𝑒𝑟 𝑐𝑎𝑝𝑎𝑐𝑖𝑡𝑦
𝐶𝑓𝑎 = 𝐹𝑖𝑥𝑒𝑑 𝑎𝑛𝑛𝑢𝑎𝑙 𝑐𝑜𝑠𝑡 per unit of capacity
𝐸𝑔 = 𝐸𝑙𝑒𝑐𝑡𝑟𝑖𝑐𝑖𝑡𝑦 𝑔𝑒𝑛𝑒𝑟𝑎𝑡𝑒𝑑
𝐶𝑣 = 𝑉𝑎𝑟𝑖𝑎𝑏𝑙𝑒 𝑐𝑜𝑠𝑡𝑠
𝐶𝐸𝑑 = 𝑃 × 𝐶𝑓𝑎 + 𝐸𝑔 × 𝐶𝑣
Formula for calculating Levelised Cost of Energy (LCOE)
30/05/2019 Ben Rose 71
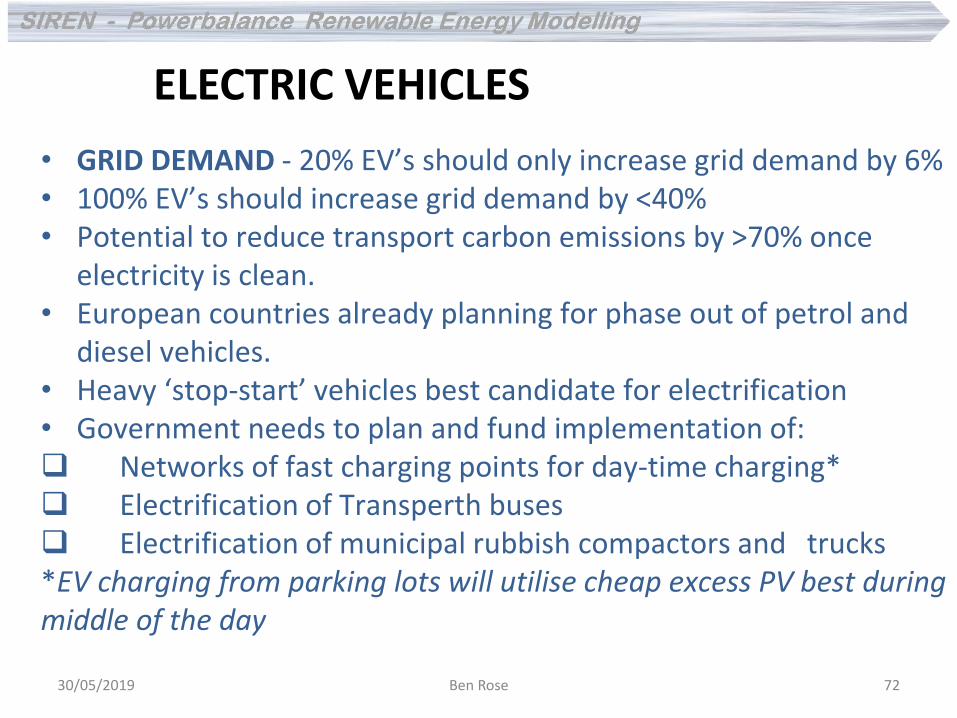
• GRID DEMAND - 20% EV’s should only increase grid demand by 6% • 100% EV’s should increase grid demand by <40% • Potential to reduce transport carbon emissions by >70% once
electricity is clean. • European countries already planning for phase out of petrol and
diesel vehicles. • Heavy ‘stop-start’ vehicles best candidate for electrification • Government needs to plan and fund implementation of: Networks of fast charging points for day-time charging* Electrification of Transperth buses Electrification of municipal rubbish compactors and trucks *EV charging from parking lots will utilise cheap excess PV best during middle of the day
ELECTRIC VEHICLES
30/05/2019 Ben Rose 72
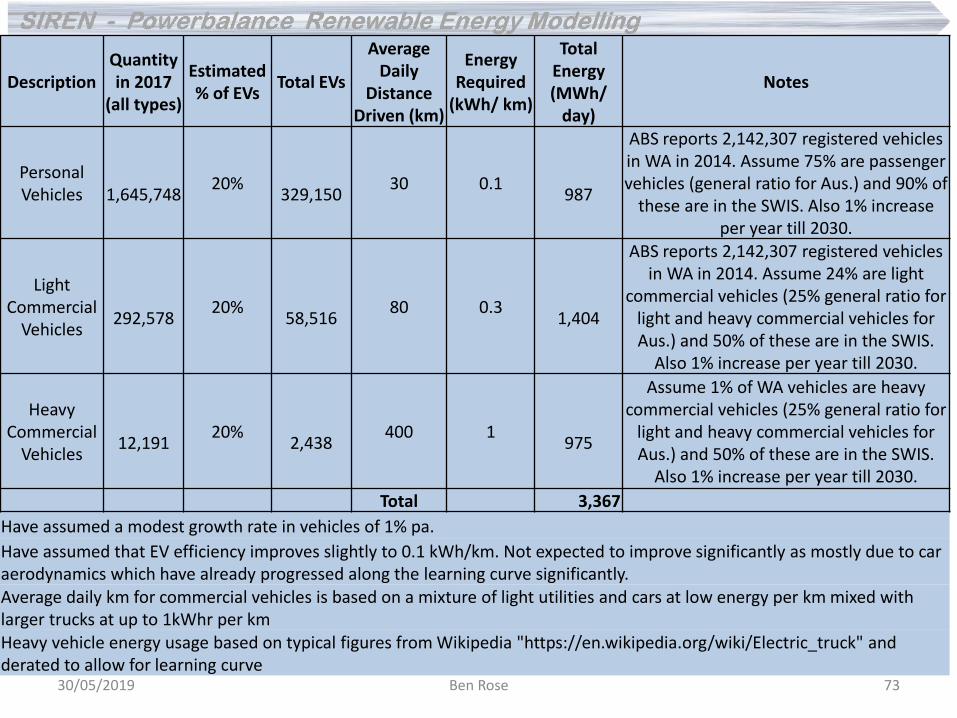
Description Quantity in 2017
(all types)
Estimated % of EVs
Total EVs
Average Daily
Distance Driven (km)
Energy Required
(kWh/ km)
Total Energy (MWh/
day)
Notes
Personal Vehicles
1,645,748
20%
329,150 30 0.1
987
ABS reports 2,142,307 registered vehicles in WA in 2014. Assume 75% are passenger vehicles (general ratio for Aus.) and 90% of
these are in the SWIS. Also 1% increase per year till 2030.
Light Commercial
Vehicles
292,578
20%
58,516 80 0.3
1,404
ABS reports 2,142,307 registered vehicles in WA in 2014. Assume 24% are light
commercial vehicles (25% general ratio for light and heavy commercial vehicles for Aus.) and 50% of these are in the SWIS.
Also 1% increase per year till 2030.
Heavy Commercial
Vehicles
12,191
20%
2,438 400 1
975
Assume 1% of WA vehicles are heavy commercial vehicles (25% general ratio for
light and heavy commercial vehicles for Aus.) and 50% of these are in the SWIS.
Also 1% increase per year till 2030.
Total 3,367
Have assumed a modest growth rate in vehicles of 1% pa.
Have assumed that EV efficiency improves slightly to 0.1 kWh/km. Not expected to improve significantly as mostly due to car aerodynamics which have already progressed along the learning curve significantly. Average daily km for commercial vehicles is based on a mixture of light utilities and cars at low energy per km mixed with larger trucks at up to 1kWhr per km Heavy vehicle energy usage based on typical figures from Wikipedia "https://en.wikipedia.org/wiki/Electric_truck" and derated to allow for learning curve
30/05/2019 Ben Rose 73
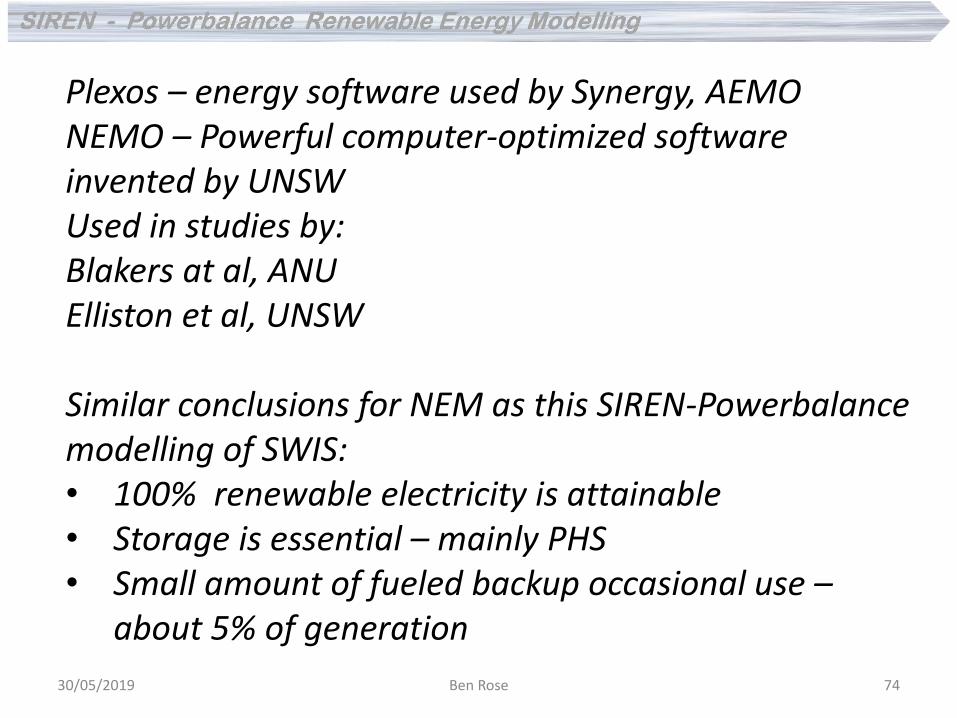
Plexos – energy software used by Synergy, AEMO NEMO – Powerful computer-optimized software invented by UNSW Used in studies by: Blakers at al, ANU Elliston et al, UNSW Similar conclusions for NEM as this SIREN-Powerbalance modelling of SWIS: • 100% renewable electricity is attainable • Storage is essential – mainly PHS • Small amount of fueled backup occasional use –
about 5% of generation
30/05/2019 Ben Rose 74
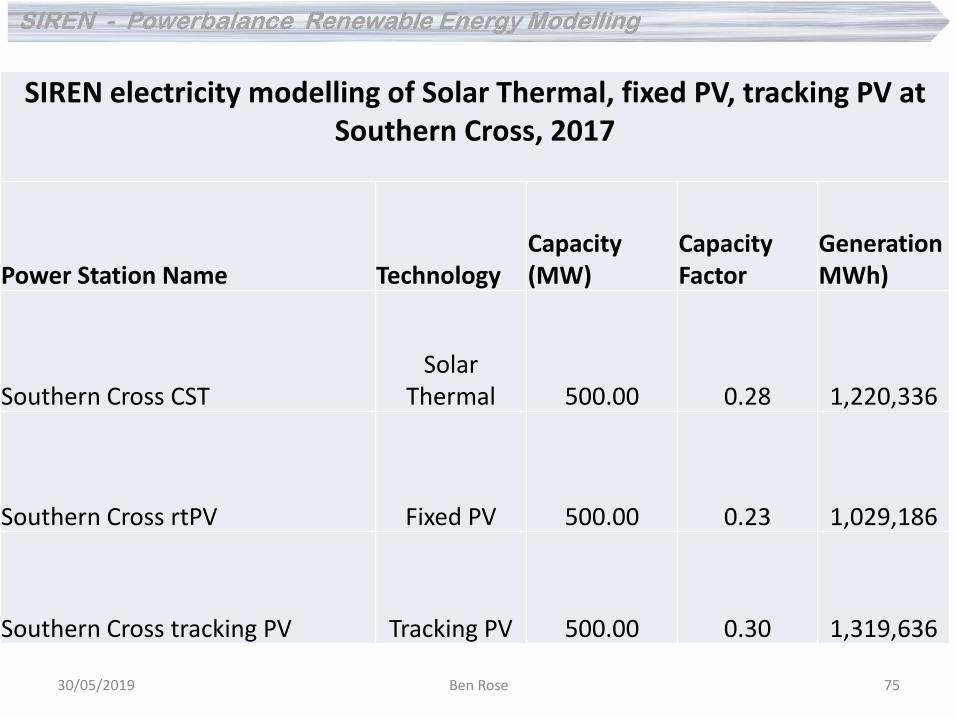
SIREN electricity modelling of Solar Thermal, fixed PV, tracking PV at Southern Cross, 2017
Power Station Name Technology
Capacity (MW)
Capacity Factor
Generation MWh)
Southern Cross CST
Solar Thermal 500.00 0.28 1,220,336
Southern Cross rtPV Fixed PV 500.00 0.23 1,029,186
Southern Cross tracking PV Tracking PV 500.00 0.30 1,319,636
30/05/2019 Ben Rose 75
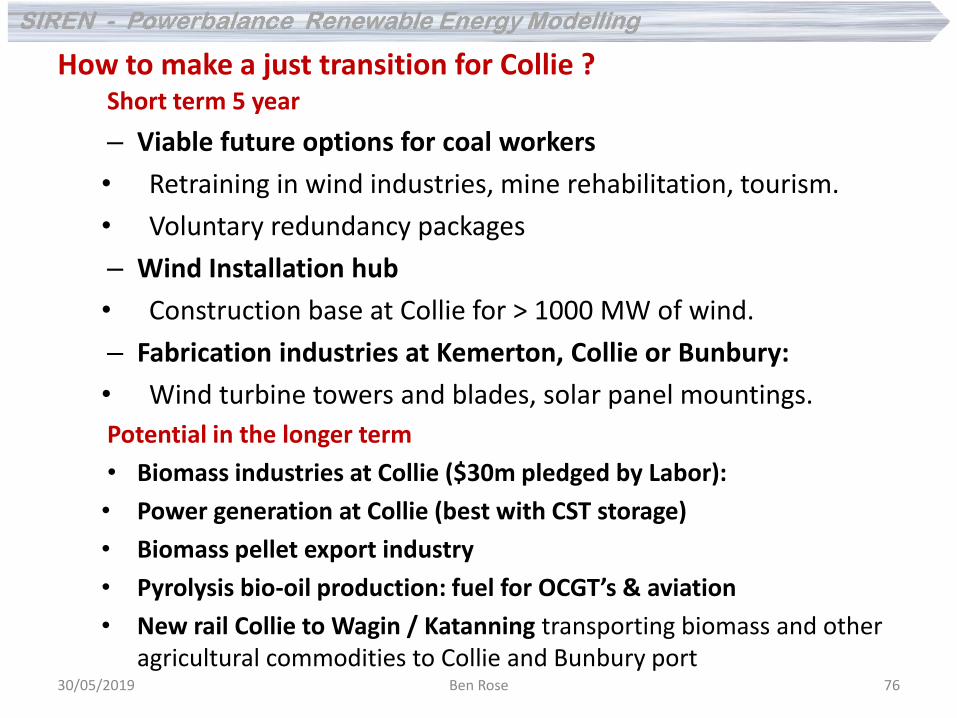
Short term 5 year
– Viable future options for coal workers
• Retraining in wind industries, mine rehabilitation, tourism.
• Voluntary redundancy packages
– Wind Installation hub
• Construction base at Collie for > 1000 MW of wind.
– Fabrication industries at Kemerton, Collie or Bunbury:
• Wind turbine towers and blades, solar panel mountings.
Potential in the longer term
• Biomass industries at Collie ($30m pledged by Labor):
• Power generation at Collie (best with CST storage)
• Biomass pellet export industry
• Pyrolysis bio-oil production: fuel for OCGT’s & aviation
• New rail Collie to Wagin / Katanning transporting biomass and other agricultural commodities to Collie and Bunbury port
How to make a just transition for Collie ?
30/05/2019 Ben Rose 76
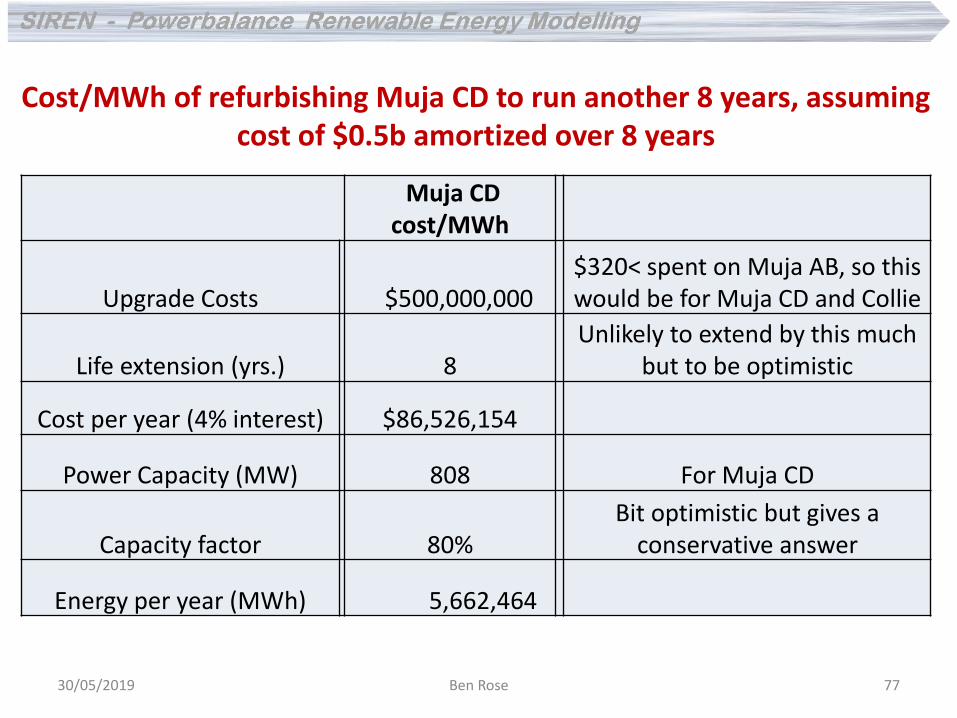
Muja CD cost/MWh
Upgrade Costs $500,000,000 $320< spent on Muja AB, so this would be for Muja CD and Collie
Life extension (yrs.) 8 Unlikely to extend by this much
but to be optimistic
Cost per year (4% interest) $86,526,154
Power Capacity (MW) 808 For Muja CD
Capacity factor 80% Bit optimistic but gives a
conservative answer
Energy per year (MWh) 5,662,464
Cost/MWh of refurbishing Muja CD to run another 8 years, assuming
cost of $0.5b amortized over 8 years
30/05/2019 Ben Rose 77
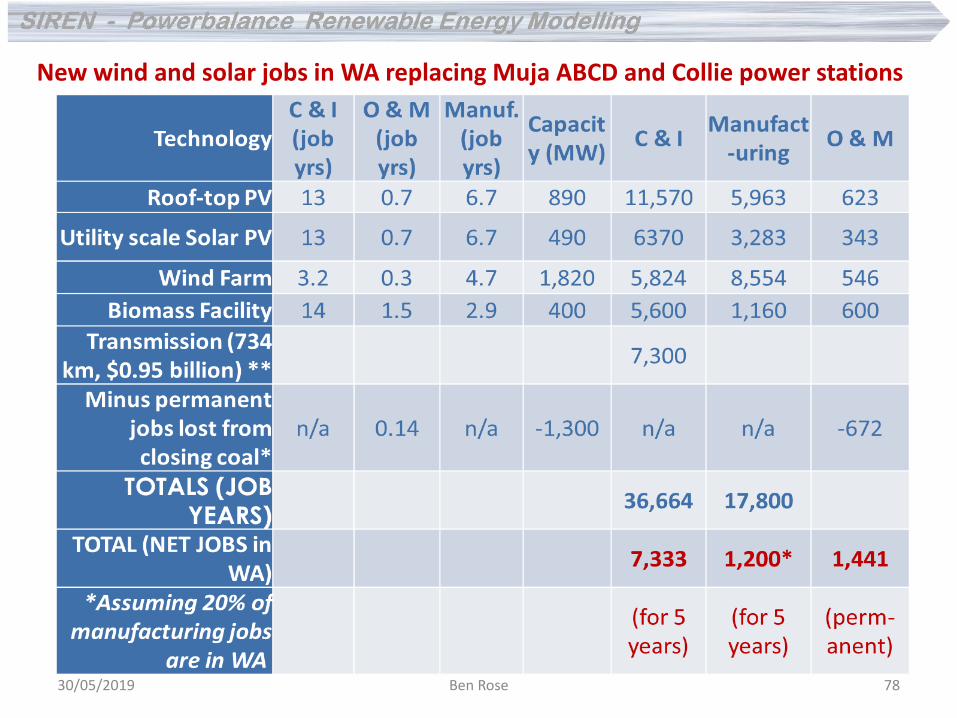
New wind and solar jobs in WA replacing Muja ABCD and Collie power stations
30/05/2019 Ben Rose 78
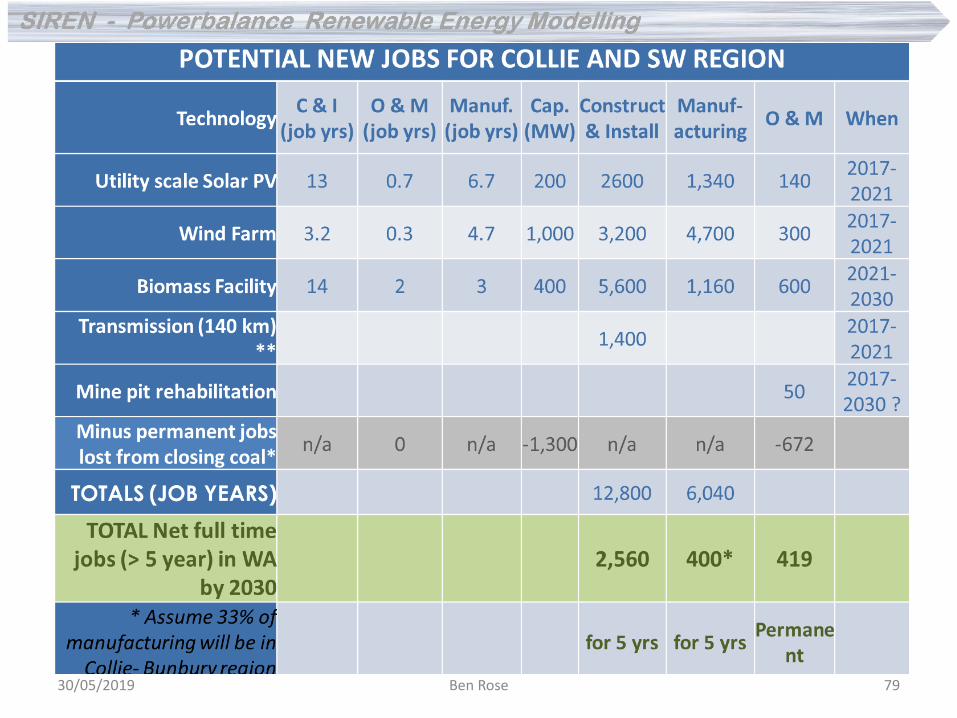
30/05/2019 Ben Rose 79

30/05/2019 Ben Rose 80
30/05/2019 Ben Rose 81