Embed Size (px)
Citation preview
Transition of the Schwabe/Hale Solar Cycles Associated with the Long-Term Variation of Solar Activity
+ their effects on climate change during the Maunder Minimum
2004.12.2
Hiroko Miyahara1, Yusuke Yokoyama1, Kimiaki Masuda2, Kentaro Nagaya2,Toshio Nakamura2, Yasushi Muraki3
1 Department of Earth & Planetary Sciences,The University of Tokyo, Japan
2 Nagoya University, Japan3 Konan University, Japan
(1645-1715 AD)
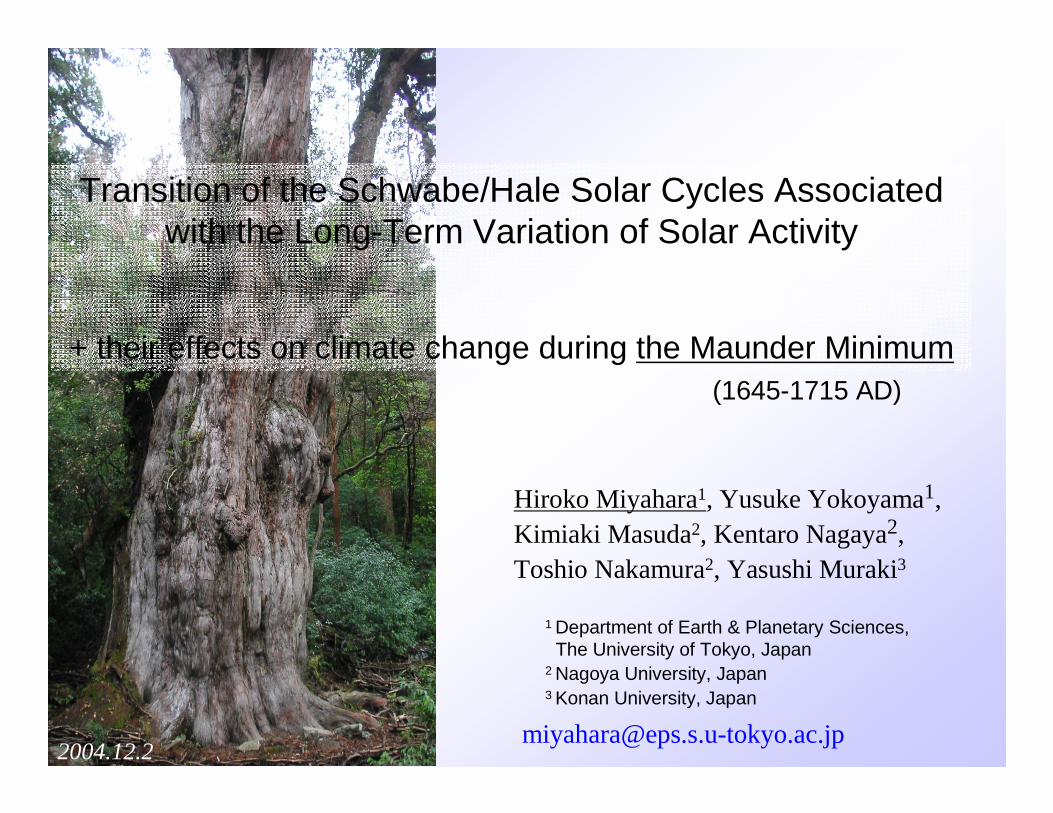
� the characteristics of solar variations during the long-term solar dynamo events; such as the Maunder Minimum, the Spoerer Minimumand the Medieval Maximum Period, as well as their precursors.
� if the “11-year” solar cycle really affects climate over time.Many climate parameters show ~11-year cycle (Hoyt & Schatten, 1997), but similar cycle could also come from climate system itself.
� what is the possible mechanisms of Sun-Climate connection at the decadal timescales, TSI, UV and/or GCRs?There is one way to differentiate their effects; which is the 22-year cycle
Motivation
Reconstruct the 11-year/22-year solar cycles by measuring 14C content in tree-rings with annual time resolution to clarify…..
-12
-9
-6
-3
0
3
6
1880 1900 1920 1940Year AD
∆14
C a
nom
aly
(per
mil
l)
0
100
200 Sunspot Num
ber
2000
2500
3000
3500
4000
4500
1950 1960 1970 1980 1990 2000Year AD
Neu
tron
Flu
x at
Clim
ax
0
100
200
300
400
Sunspot N
umber .
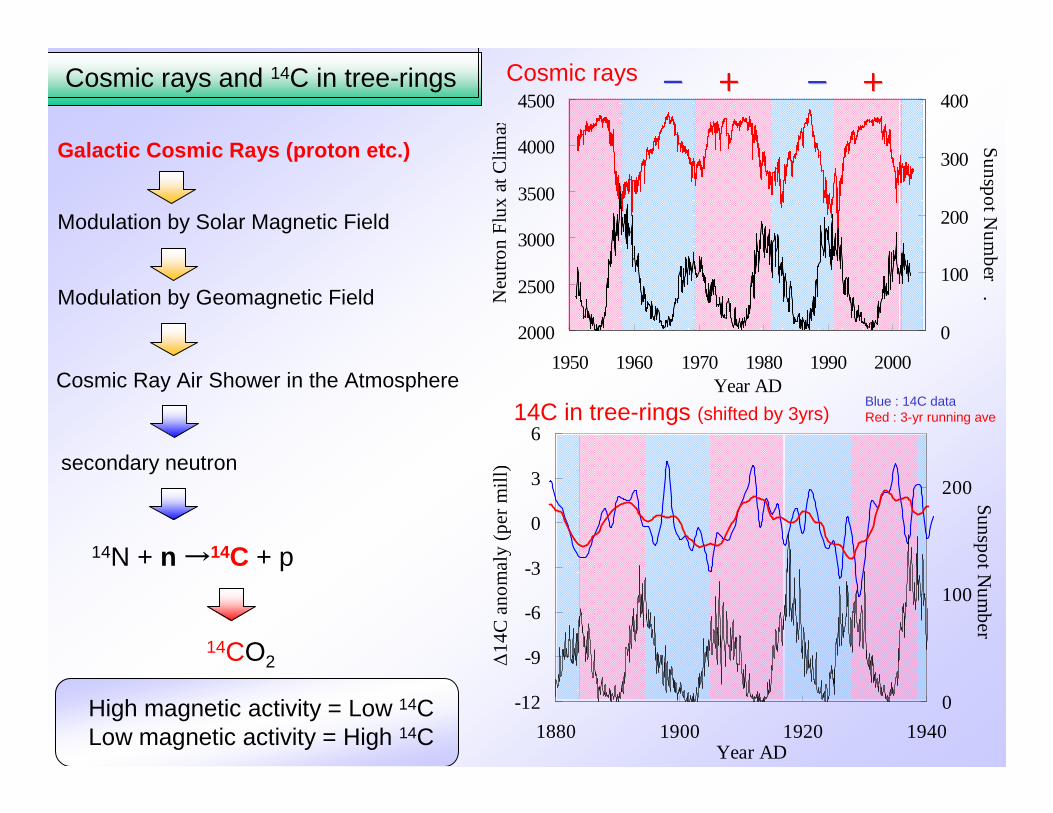
14C in tree-rings (shifted by 3yrs)
Cosmic rays and 14C in tree-rings
Blue : 14C dataRed : 3-yr running ave
Cosmic rays -------- ++++++++-------- ++++++++
14N + n→14C + p
14CO2
Cosmic Ray Air Shower in the Atmosphere
Modulation by Solar Magnetic Field
Galactic Cosmic Rays (proton etc.)
secondary neutron
High magnetic activity = Low 14CLow magnetic activity = High 14C
Modulation by Geomagnetic Field
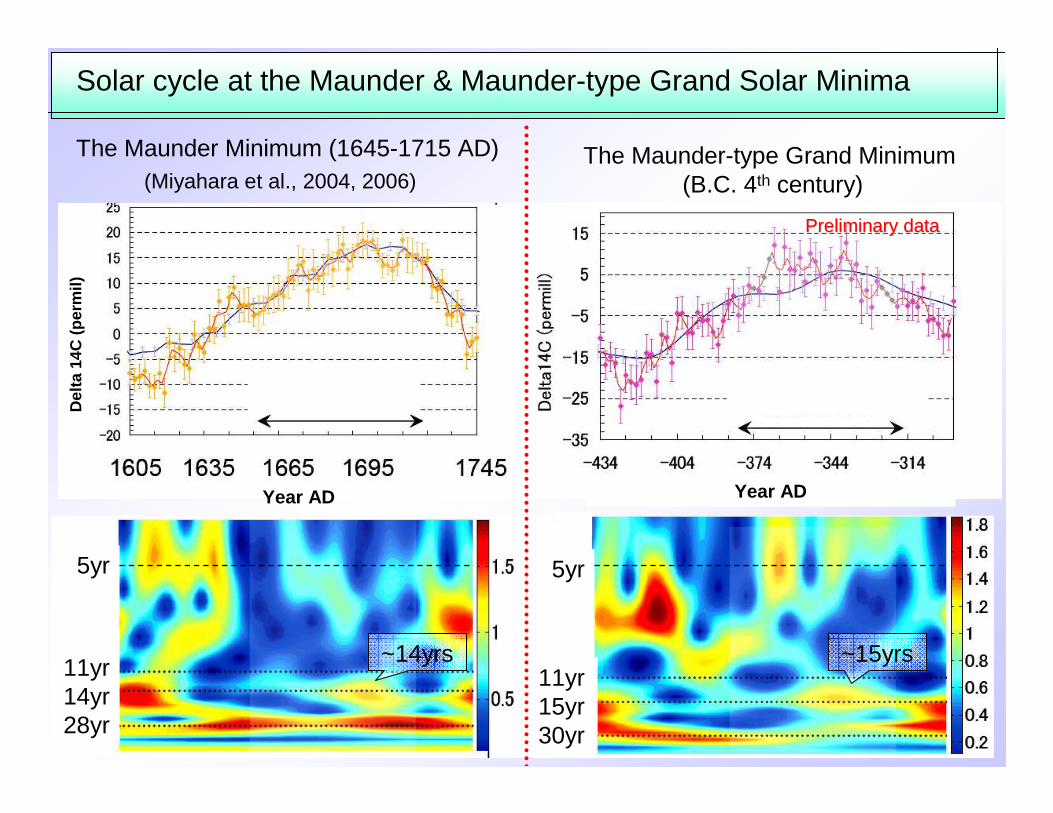
The Maunder Minimum (1645-1715 AD) The Maunder-type Grand Minimum(B.C. 4th century)
Year AD Year AD
Preliminary dataPreliminary data
Del
ta 1
4C (
per
mil)
~14yrs ~15yrs
Solar cycle at the Maunder & Maunder-type Grand Solar Minima
5yr
11yr14yr28yr
5yr
11yr15yr30yr
(Miyahara et al., 2004, 2006)
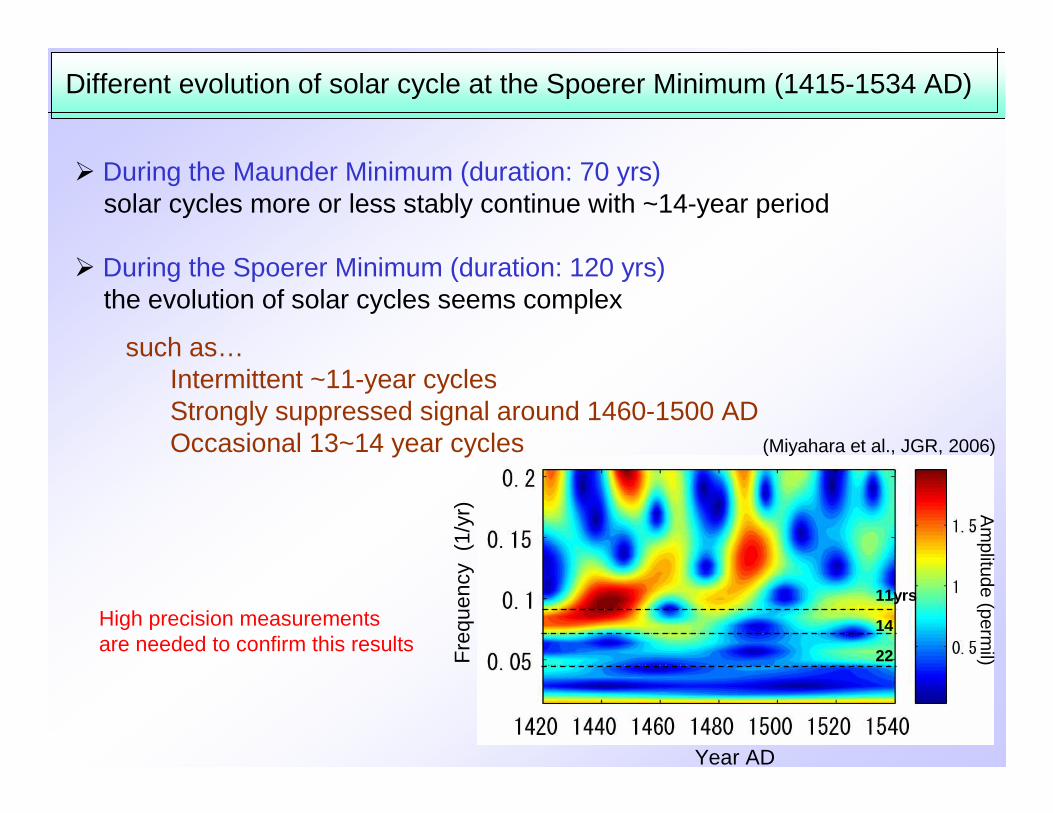
Different evolution of solar cycle at the Spoerer Minimum (1415-1534 AD)
Year AD
Fre
quen
cy (
1/yr
)
� During the Maunder Minimum (duration: 70 yrs)solar cycles more or less stably continue with ~14-year period
� During the Spoerer Minimum (duration: 120 yrs)the evolution of solar cycles seems complex
such as…Intermittent ~11-year cycles Strongly suppressed signal around 1460-1500 ADOccasional 13~14 year cycles
High precision measurements are needed to confirm this results
11yrs
14
22
(Miyahara et al., JGR, 2006)
Am
plitude (permil)
-8
-5
-2
1
4
1750 1770 1790 1810 1830
Year AD
ΔΔ ΔΔ1
41
41
41
4C
(p
er
mil
l)C
(p
er
mil
l)C
(p
er
mil
l)C
(p
er
mil
l)
0
100
200
300
Sunspot N
umber
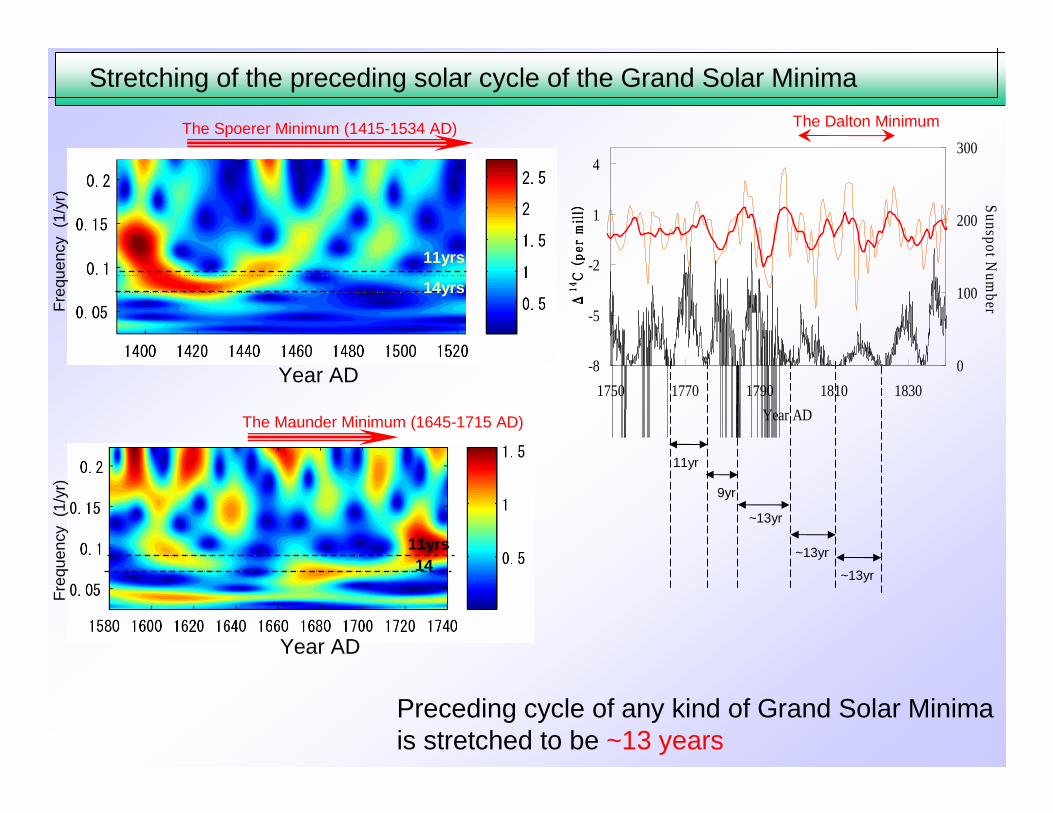
Preceding cycle of any kind of Grand Solar Minimais stretched to be ~13 years
Year AD
Year AD
The Spoerer Minimum (1415-1534 AD)
The Maunder Minimum (1645-1715 AD)
11yr
9yr
~13yr
~13yr
~13yr
The Dalton Minimum
Fre
quen
cy (
1/yr
)F
requ
ency
(1/
yr)
Stretching of the preceding solar cycle of the Grand Solar Minima
11yrs
14yrs
11yrs14
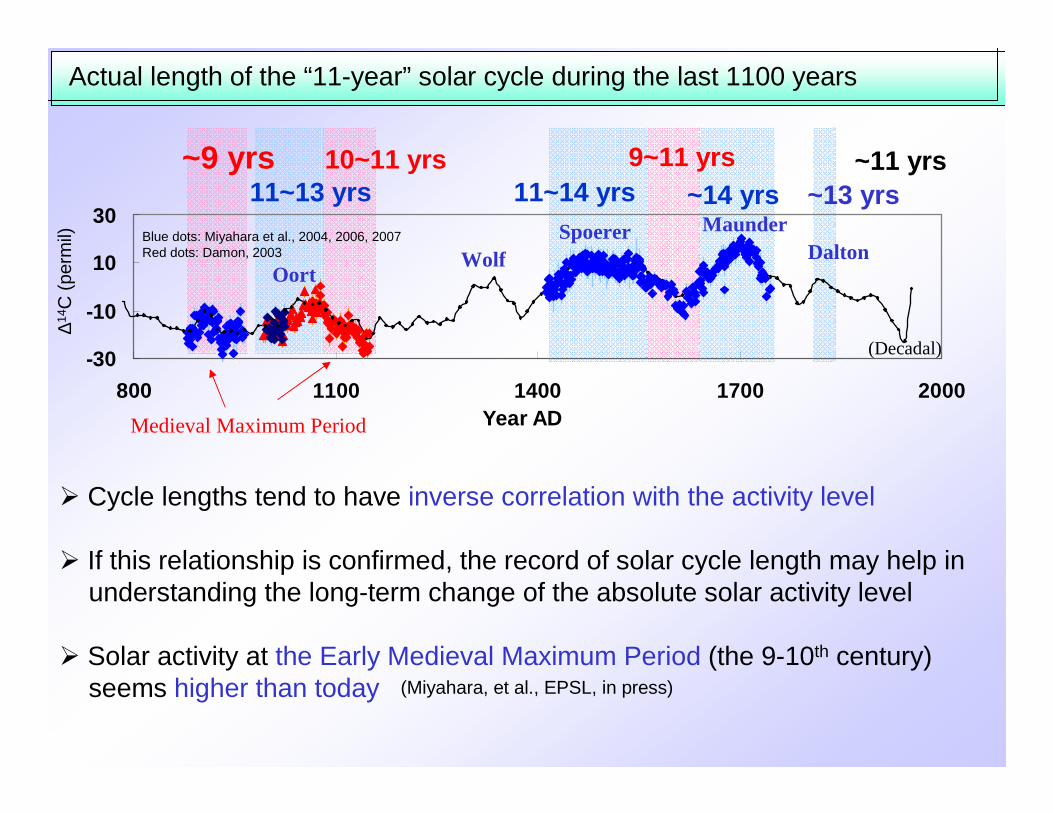
Actual length of the “11-year” solar cycle during the last 1100 years
(Decadal)
MaunderSpoererWolf Dalton
Oort
~9 yrs11~13 yrs
10~11 yrs 9~11 yrs11~14 yrs ~14 yrs ~13 yrs
∆14 C
(pe
rmil)
� Cycle lengths tend to have inverse correlation with the activity level
� If this relationship is confirmed, the record of solar cycle length may help inunderstanding the long-term change of the absolute solar activity level
� Solar activity at the Early Medieval Maximum Period (the 9-10th century)seems higher than today
~11 yrs
Blue dots: Miyahara et al., 2004, 2006, 2007Red dots: Damon, 2003
-30
-10
10
30
800 1100 1400 1700 2000Year AD
(Miyahara, et al., EPSL, in press)
Medieval Maximum Period
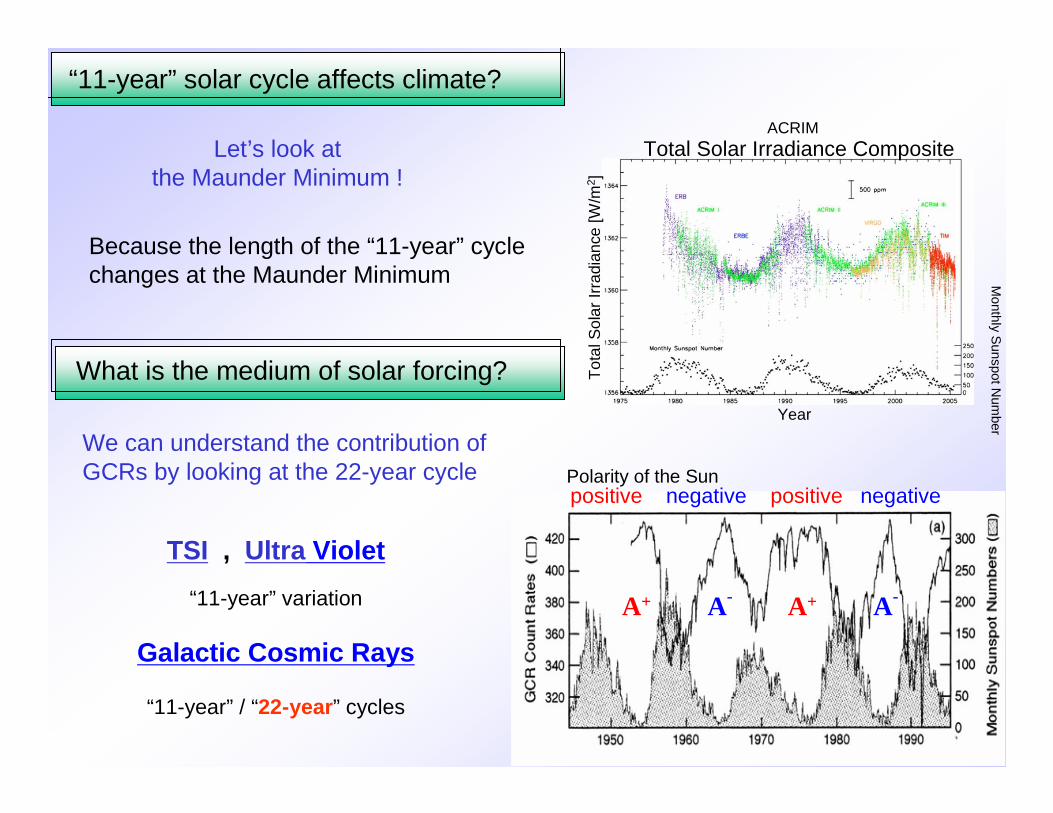
TSI , Ultra Violet
“11-year” variation
Galactic Cosmic Rays
“11-year” / “22-year” cycles
“11-year” solar cycle affects climate?
Total Solar Irradiance Composite
Tot
al S
olar
Irra
dian
ce [W
/m2 ]
Year
Monthly S
unspot Num
ber
A+A-A+ A-
Polarity of the Sunpositive negative positive negative
ACRIM
Let’s look atthe Maunder Minimum !
Because the length of the “11-year” cyclechanges at the Maunder Minimum
We can understand the contribution ofGCRs by looking at the 22-year cycle
What is the medium of solar forcing?
2000
2500
3000
3500
4000
4500
1950 1960 1970 1980 1990 2000Year AD
Neu
tron
Flu
x at
Clim
ax
0
100
200
300
400
Sunspot N
umber .
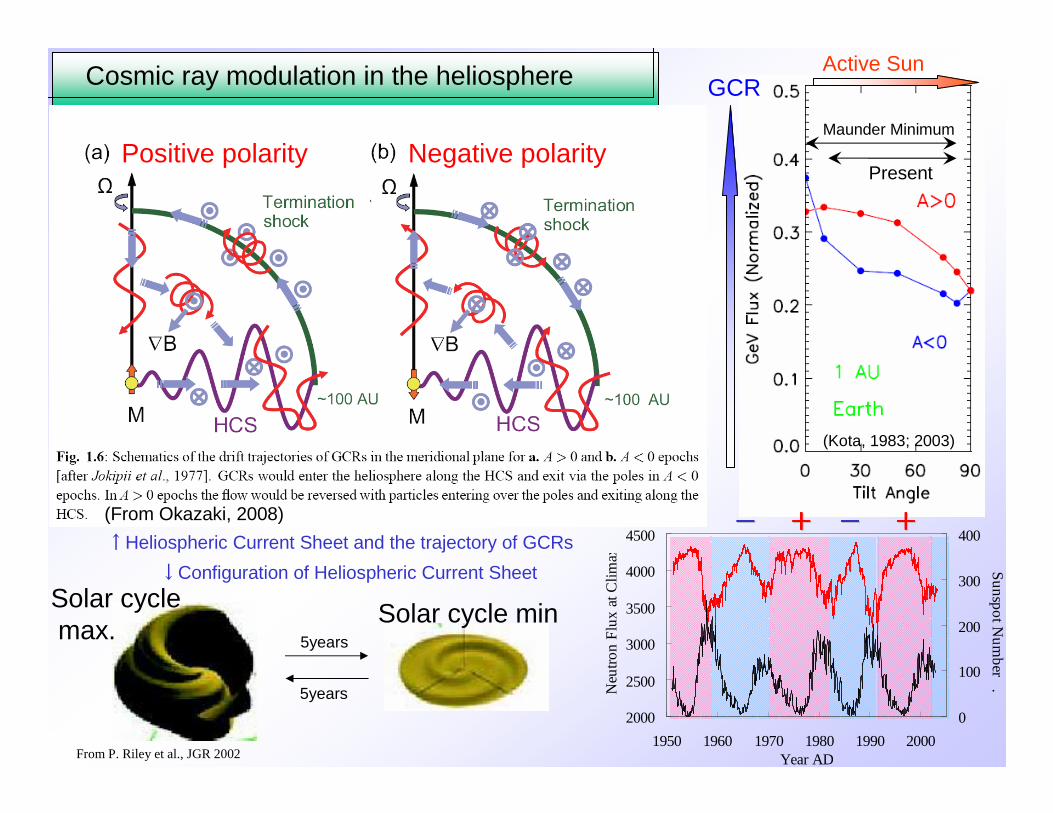
Cosmic ray modulation in the heliosphere
-------- ++++++++-------- ++++++++
Active SunGCR
(Kota, 1983; 2003)
↑Heliospheric Current Sheet and the trajectory of GCRs
(From Okazaki, 2008)
Maunder Minimum
Present
From P. Riley et al., JGR 2002
5years
5years
↓Configuration of Heliospheric Current Sheet
Positive polarity Negative polarity
Solar cyclemax.
Solar cycle min
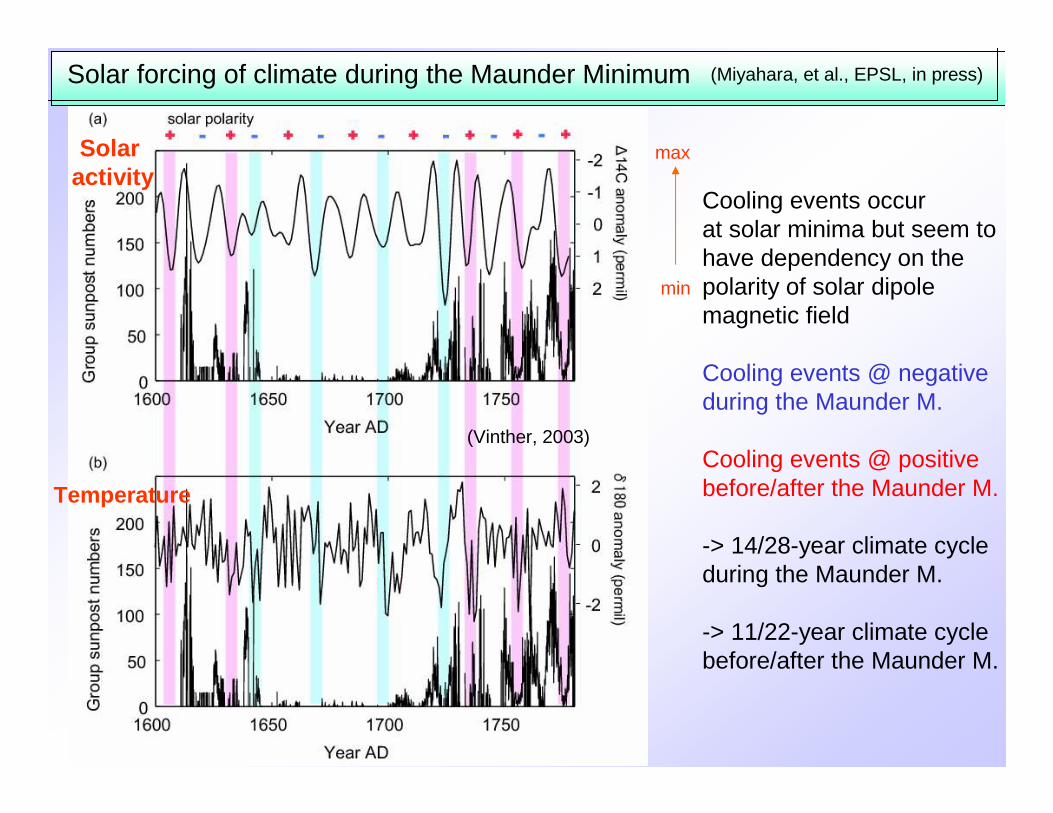
Solar activity
Temperature
(Vinther, 2003)
(Miyahara, et al., EPSL, in press)
max
min
Solar forcing of climate during the Maunder Minimum
Cooling events occur at solar minima but seem to have dependency on the polarity of solar dipole magnetic field
Cooling events @ negative during the Maunder M.
Cooling events @ positivebefore/after the Maunder M.
-> 14/28-year climate cycle during the Maunder M.
-> 11/22-year climate cyclebefore/after the Maunder M.
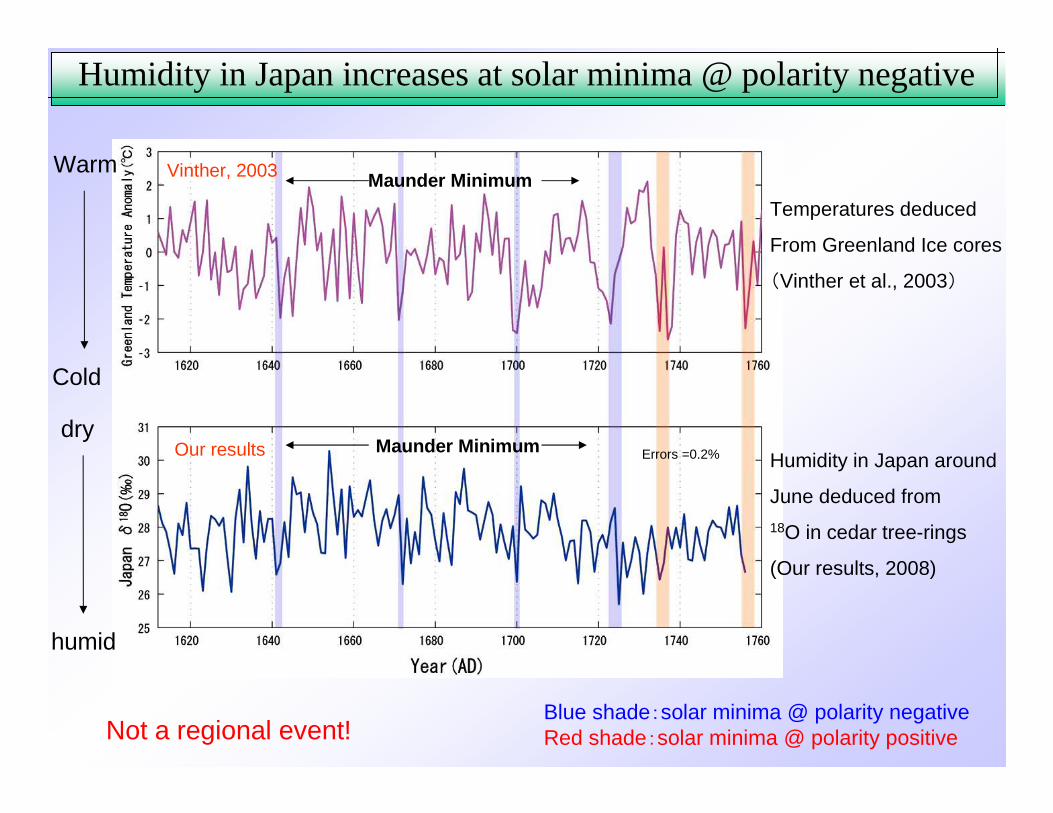
Humidity in Japan increases at solar minima @ polarity negative
Temperatures deduced
From Greenland Ice cores
(Vinther et al., 2003)
Humidity in Japan around
June deduced from
18O in cedar tree-rings
(Our results, 2008)
Blue shade:solar minima @ polarity negative Red shade:solar minima @ polarity positive
Maunder Minimum
Errors =0.2%Our results
Vinther, 2003
Maunder Minimum
humid
dry
Cold
Warm
Not a regional event!
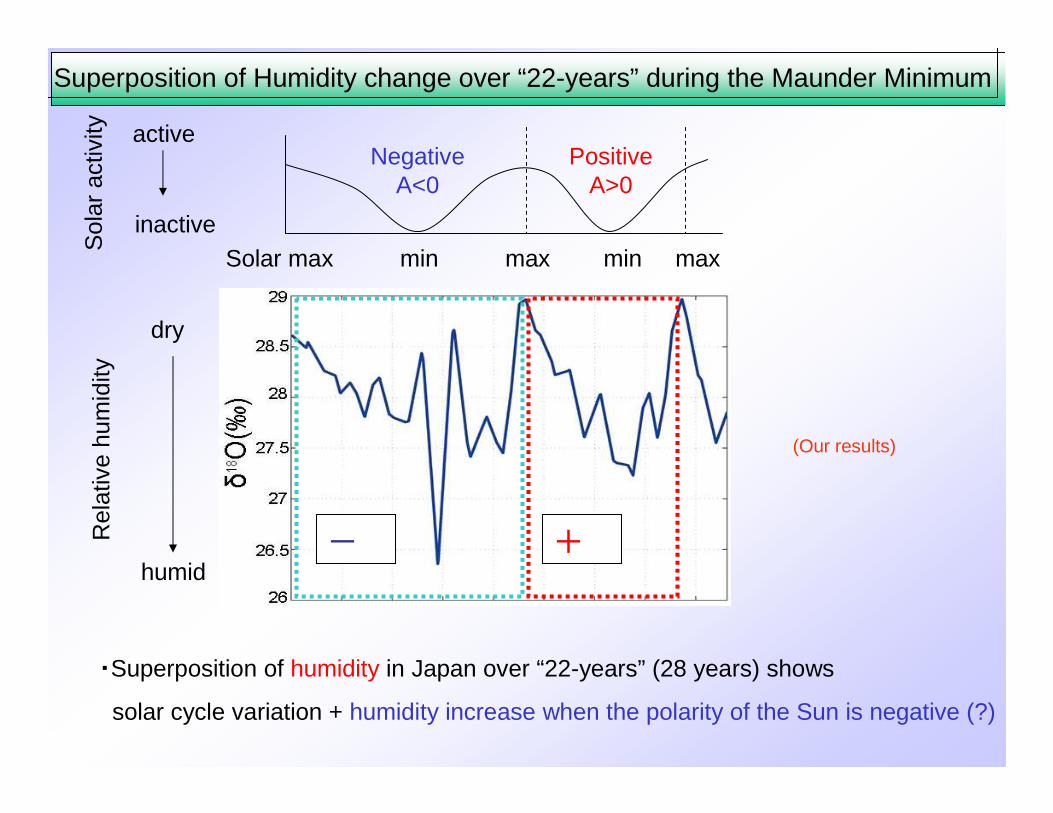
・Superposition of humidity in Japan over “22-years” (28 years) shows
solar cycle variation + humidity increase when the polarity of the Sun is negative (?)
- +
Solar max min max min max
humid
dry
Superposition of Humidity change over “22-years” during the Maunder Minimum
NegativeA<0
PositiveA>0
active
inactive
Sol
ar a
ctiv
ityR
elat
ive
hum
idity
(Our results)
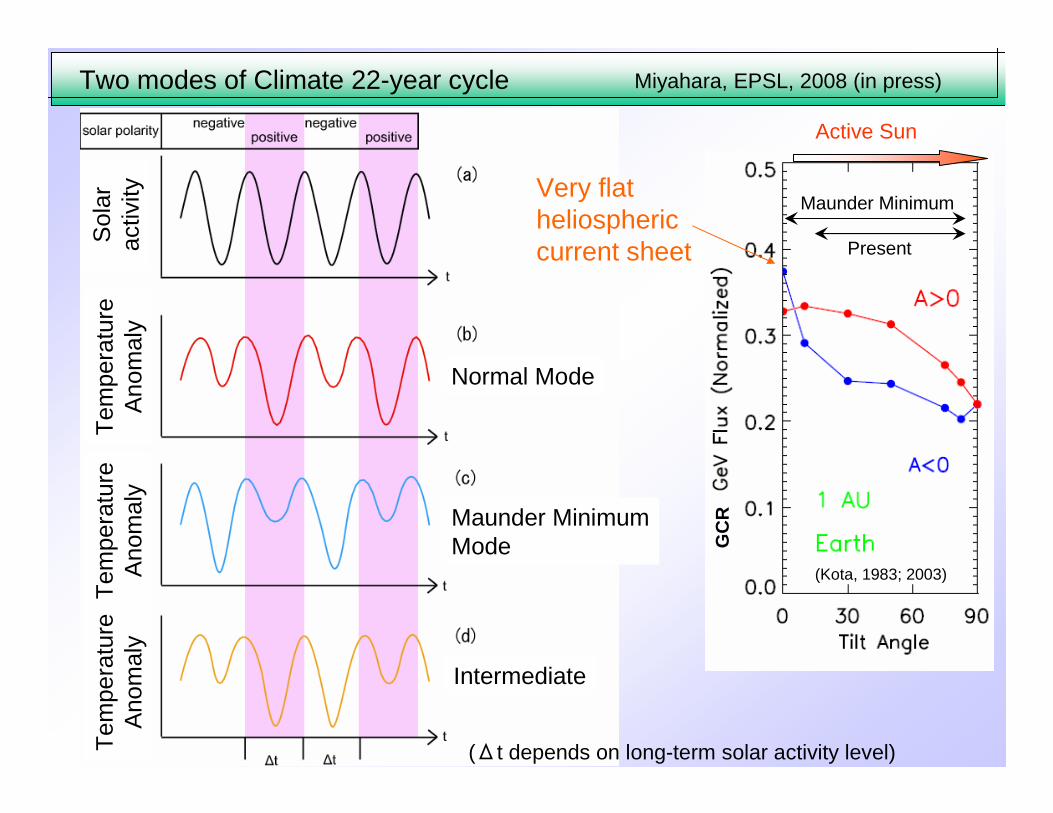
(Δt depends on long-term solar activity level)
Two modes of Climate 22-year cycle
Active Sun
Maunder Minimum
Present
GC
R
Miyahara, EPSL, 2008 (in press)
(Kota, 1983; 2003)
Normal Mode
Maunder MinimumMode
Intermediate
Sol
ar
activ
ityT
empe
ratu
reA
nom
aly
Tem
pera
ture
Ano
mal
yT
empe
ratu
reA
nom
aly
Very flat heliosphericcurrent sheet
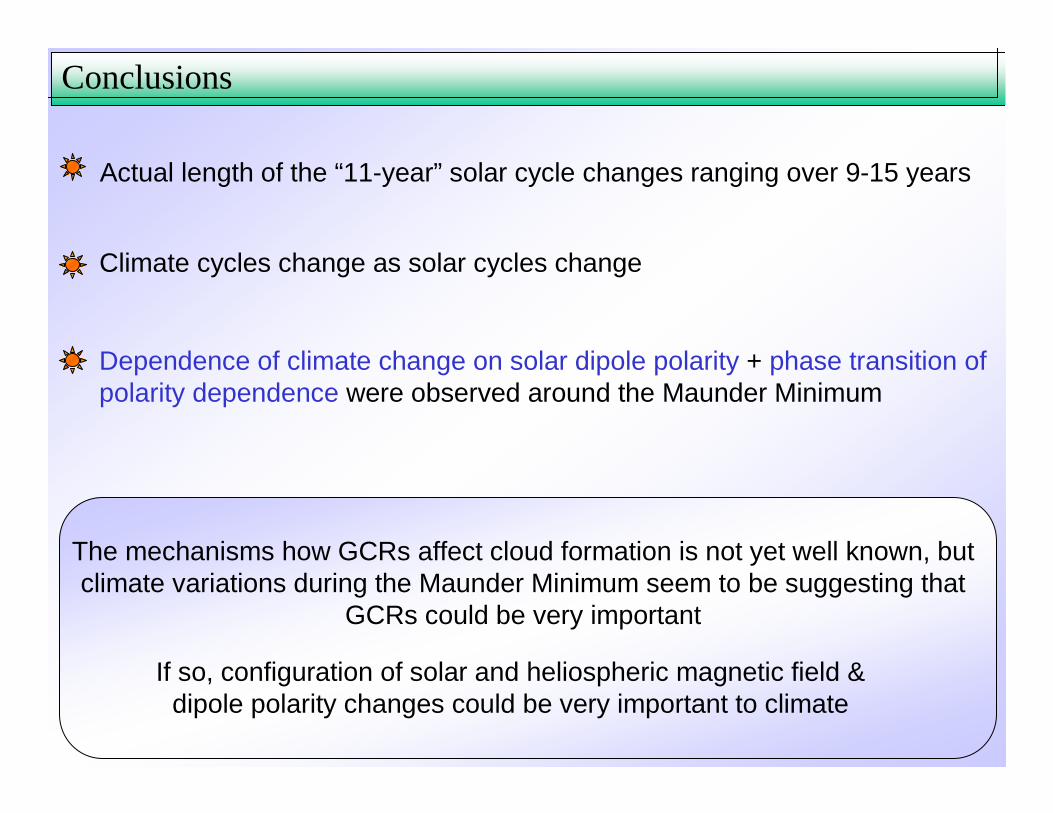
Actual length of the “11-year” solar cycle changes ranging over 9-15 years
Conclusions
Climate cycles change as solar cycles change
Dependence of climate change on solar dipole polarity + phase transition ofpolarity dependence were observed around the Maunder Minimum
If so, configuration of solar and heliospheric magnetic field & dipole polarity changes could be very important to climate
The mechanisms how GCRs affect cloud formation is not yet well known, but climate variations during the Maunder Minimum seem to be suggesting that
GCRs could be very important
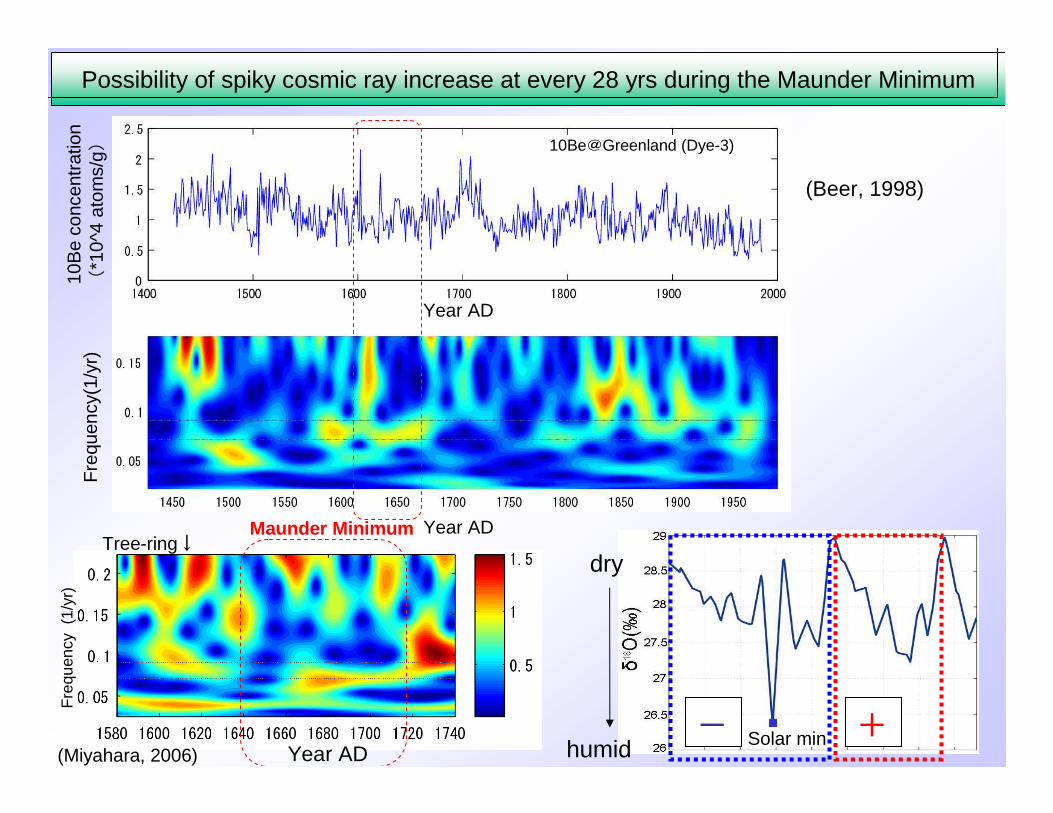
Fre
quen
cy(1
/yr)
10B
e co
ncen
trat
ion
(*10
^4 a
tom
s/g)
Year AD
10Be@Greenland (Dye-3)
- +Solar minhumid
dry
Possibility of spiky cosmic ray increase at every 28 yrs during the Maunder Minimum
Year ADMaunder Minimum
Year AD
Fre
quen
cy (
1/yr
)
Tree-ring↓
(Beer, 1998)
(Miyahara, 2006)・

End
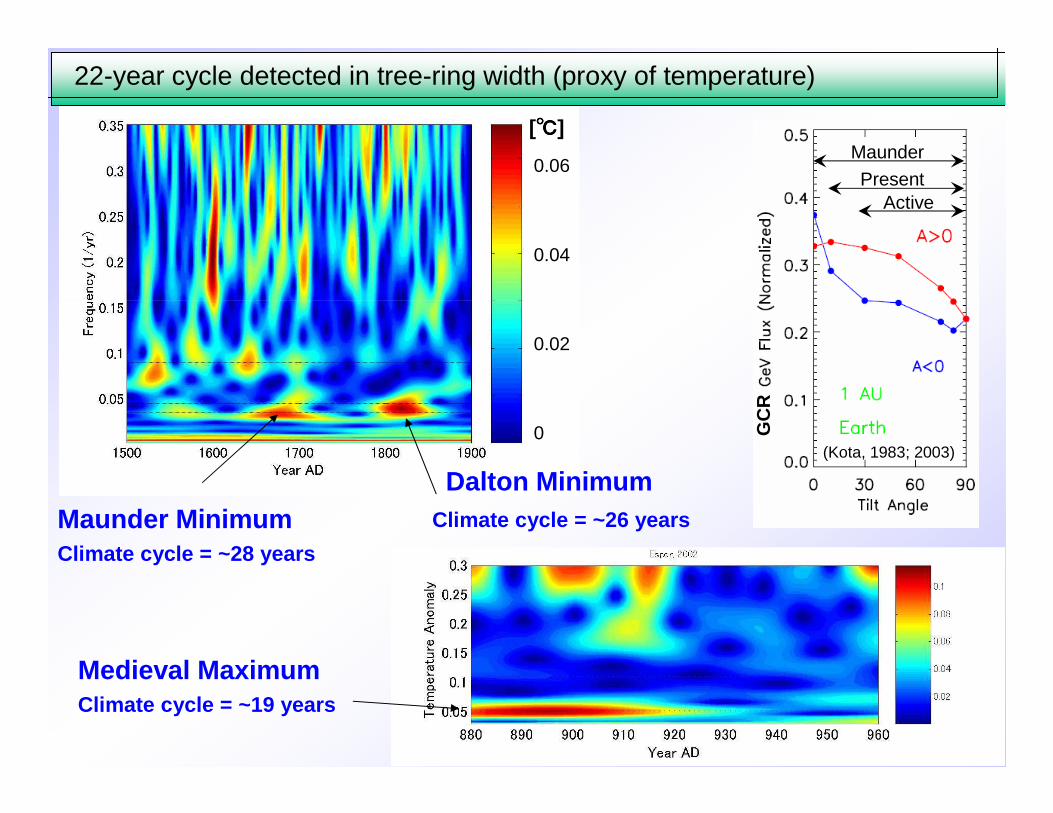
Dalton Minimum
Climate cycle = ~28 years
Climate cycle = ~26 years
0.06
0.04
0.02
0
[℃℃℃℃]
22-year cycle detected in tree-ring width (proxy of temperature)
Maunder Minimum
Climate cycle = ~19 years
Medieval Maximum
GC
R
(Kota, 1983; 2003)
Maunder
PresentActive
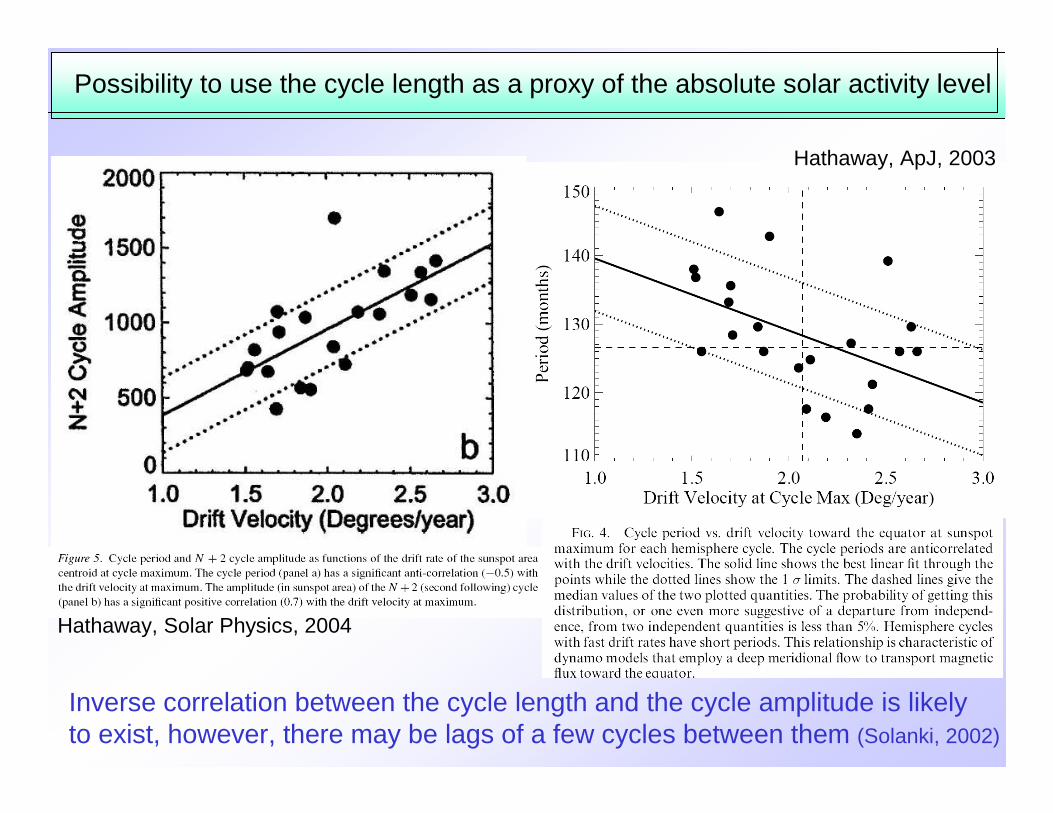
Hathaway, Solar Physics, 2004
Hathaway, ApJ, 2003
Possibility to use the cycle length as a proxy of the absolute solar activity level
Inverse correlation between the cycle length and the cycle amplitude is likelyto exist, however, there may be lags of a few cycles between them (Solanki, 2002)