Embed Size (px)
Citation preview
Transition from University to the Job Market. A Time Analysis of the University of Cagliari Graduates
Mariano Porcu, Nicola Tedesco1
Department of Social and Economics Research, University of Cagliari, Italy
Summary. To investigate the transition from University to work, and indi-rectly assess the effectiveness of university education, time analysis can play a key role. The period that elapses between graduation and finding work is usu-ally influenced by various factors. In this work, an analysis of such determi-nants is performed by means of non-parametric and parametric survival mod-els. Keywords. Transition to work; Time intervals; Graduates; Kaplan-Meier model; Weibull model.
1. Transition times between graduation and employment
The transition from university to the job market is a basic aspect to be consid-ered when assessing the efficacy of the higher education system in Italy (Giam-balvo, 1996; Ortu et al., 2000). Any analysis of the outcomes of the university system has to evaluate the success of graduates in finding a job in a short time.
The occupation of graduates must be evaluated both in relation to the em-ployment rate and job qualification, and to time needed to reach a given target. The length of a transition period may be influenced by several factors. By ana-lysing these factors, we can understand how the missions of state-run universi-ties to educate its citizens and to satisfy the demands of the labour society are accomplished.
1 This paper is the result of the joint research of the two authors. M. Porcu was responsi-
ble for the final editing of Sections 1, 2 and 4, whereas N. Tedesco was responsible for Section 3. The authors whish to thank the anonymous referees for their precious sugges-tions.

184 M. Porcu, N. Tedesco
Moreover, considering the “3+2” reform of the Italian university system, this aspect is an essential instrument to correct and improve the process of university education. Therefore, in this work, we will study transition times with semi-parametric and parametric techniques on a sample of graduates of University of Cagliari, in order to evaluate the importance of some covariates.
After the presentation of some general traits of the graduates of the Univer-sity of Cagliari (Section 2), we will analyse their transition times (Section 3) and draw some general conclusions from the obtained results (Section 4).
2. The University of Cagliari graduates
Our data comes from a survey on graduates of the University of Cagliari, un-dertaken in autumn 2003. Our research, realized with a CATI system, in-volved 4,363 graduates (aged 37 years or less at graduation) who had their de-gree in years 1999 and 2000.
We selected a sample size of 1,112 (one out of four population units). For each subject, the professional status at the interview was noted: i.e. whether employed, unemployed (before employed), seeking for first employment, en-rolled in a masters or PhD course, not interested in finding an occupation. Moreover, those in employment were asked whether they had started in their current job before or after completing their degree.
According to these variables, we selected a sub-sample of 906 graduates who were employed when interviewed and had begun their present job after the graduation. We concentrated our analysis on the employment status during a given period. Each of the 906 graduates was observed for a period ranging from 35 to 56 months (TIME) and their unemployment (transition) times were evaluated retrospectively. If a subject was not working at the end of survey period, his/her exposure time was truncated.
The criterion variable TIME is computed as difference between the student’s first employment time and that of graduation. If, during the observational pe-riod, the subject had obtained a master/PhD/specialization title, the time span (both truncated and complete) was recalculated subtracting the frequency pe-riod because we hypothesised that during post-graduate education subjects did not look for jobs.
For an explanatory analysis of transition times, we considered the covari-ates: sex (SEX), type of degree (TY_DEG), degree final mark (MARK), delay in finishing university studies (obtained by subtracting the statutory time for uni-versity studies from the time taken) (LAG), completion of master, or Ph.D., or other specialisation courses (POST).
Concerning the variable MARK (the interval is 66-110), we decided to create two levels (≤ 105 and ≥ 106) in line with its distribution (Fig. 1). The variable LAG was categorised in three levels: “≤ 1 year”, “2-3 years”, “≥ 4 years”.

Transition from University to the Job Market. 185 A Time Analysis of the University of Cagliari Graduates
Figure 1. Graphics for variables TIME (only not censured), MARK and LAG
As for variable TY_DEG, we consider four groups: Economics-Law-Social Sciences (EGS), Scientific-Technical subjects (SCT), Life and Health Sci-ences (SVS) and Humanities-Education-Behavioural Sciences (UEC)2 (the classification rationale is explained by Porcu & Puggioni, 2003).
Table 1, and Figures 1 and 2 show the distribution of the examined vari-ables. It is important to point out the negative asymmetry for variable MARK and high values for the average (105.0) and for the median (106.0). Contrari-wise, the variable TIME shows a positive asymmetry (the average being equal to 17.4 and the median being 15.0 months) according to previous studies (Ortu et al., 2000).
2 EGS group: degrees in Economics, Law and Political Science; SCT group: Engineering,
Physics, Mathematics, Chemistry and Geology; SVS group: Medicine, Biology, Natural Sciences and Pharmacology; UEC group: Literature, Languages and Educational Sci-ences (Pedagogy and Psychology).

186 M. Porcu, N. Tedesco
One noteworthy finding, considering its negative implication for an evalua-tion of the performance of our university system, is the average value for the variable LAG (4.47 years) and the median (4.00 years). We can conclude that in Sardinia the average time a student spends at university amounts to twice the statutory duration with a consequent and evident increase in costs for a university system that is clearly inefficient.
In Figure 2, we can observe distributions of some variables on a sub-sample of 906 subjects. The employment rate is 78% (707 events of interest and 199 censured), in which there is a prevalence of female (62%) graduates not in-volved in post-graduate education (53%), and the principal degree categories are EGS (36%) and UEC (30%).
Figure 2. Variables indicating the event (A) and TY_DEG (B), SEX (C) e POST (D)
Table 1. Synthetic statistics for variables TIME, MARK and LAG on sample of survey.
Covariates Min Q1 Me µ
Q3 Max σ
TIME* 0.00 6.00 15.00 17.36 27.00 55.00 12.94
MARK 78.00 102.00 106.00 105.02 110 110 5.73
LAG 0.00 3.00 4.00 4.47 6.00 14.00 2.47
* Relative to non truncated observations
Events 78%
Censures22%
A
EGS 36%
SCT23%
SVS10%
UEC 30%
B
F62%
M 38%
C Yes 47%
No53%
D
Transition from University to the Job Market. 187 A Time Analysis of the University of Cagliari Graduates
3. Analysis of transition times
In order to study the transition times and the importance of some covariates on times, we initially applied the Kaplan-Meier (KM) method, a non parametric technique (Section 3.1) and then a parametric one (Section 3.2). The total du-ration of the follow-up was 56 months (March 1999 – October 2003), and the longest time-event was 55 months.
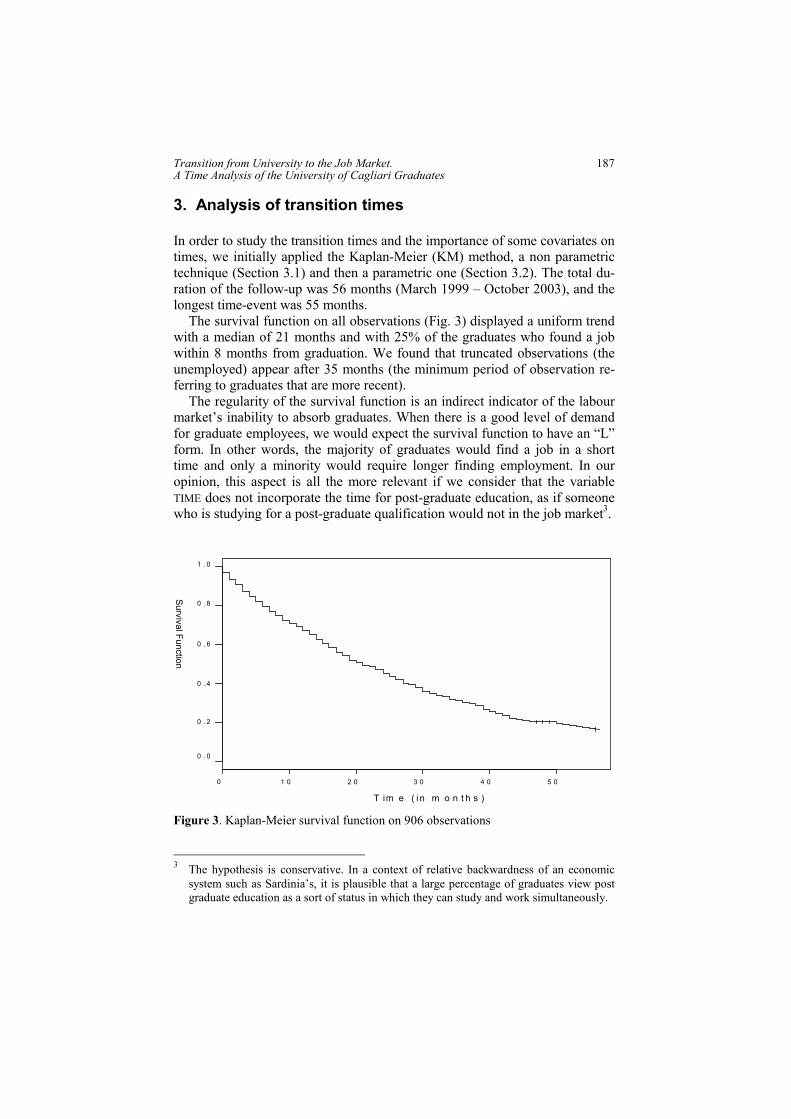
The survival function on all observations (Fig. 3) displayed a uniform trend with a median of 21 months and with 25% of the graduates who found a job within 8 months from graduation. We found that truncated observations (the unemployed) appear after 35 months (the minimum period of observation re-ferring to graduates that are more recent).
The regularity of the survival function is an indirect indicator of the labour market’s inability to absorb graduates. When there is a good level of demand for graduate employees, we would expect the survival function to have an “L” form. In other words, the majority of graduates would find a job in a short time and only a minority would require longer finding employment. In our opinion, this aspect is all the more relevant if we consider that the variable TIME does not incorporate the time for post-graduate education, as if someone who is studying for a post-graduate qualification would not in the job market3.
0 1 0 2 0 3 0 4 0 5 0
0 . 0
0 . 2
0 . 4
0 . 6
0 . 8
1 . 0
T im e ( i n m o n t h s )
Survival Function
Figure 3. Kaplan-Meier survival function on 906 observations
3 The hypothesis is conservative. In a context of relative backwardness of an economic
system such as Sardinia’s, it is plausible that a large percentage of graduates view post graduate education as a sort of status in which they can study and work simultaneously.

188 M. Porcu, N. Tedesco
3.1. Non parametric analysis: the effect of covariates
We carried out a non-parametric analysis of transition times in relation to some covariates SEX, MARK and POST (Fig. 4) considering the stratifica-tion of observations according to the levels of covariates. No covariates proved significant because the survival curves for each level of covariates were similar, in particular for the POST variable. This is an interesting result for three reasons: a) the local labour market’s inability to employ graduates with an post graduate qualification; b) the low quality of post-graduate educa-tion in Sardinia4; c) the possibility that post-graduate education is a way of overcoming the gaping divide between demand for and supply of graduates in Sardinia.
Figure 4. KM survival function for variables SEX, MARK and POST 4 In our sample, in most cases post-graduate education was not a PhD or a Master pro-
gramme but a shorter duration course.
0 10 20 30 40 50
0.0
0.4
0.8
Sex
Time (in months)
Survival Function
FM
0 10 20 30 40 50
0.0
0.4
0.8
Mark
Time (in months)
Survival Function
<106106+
0 10 20 30 40 50
0.0
0.4
0.8
Post graduation
Time (in months)
Survival Function
SìNo

Transition from University to the Job Market. 189 A Time Analysis of the University of Cagliari Graduates
0 10 20 30 40 50
0.00.2
0.40.6
0.81.0
p
EGSSVSSCTUEC
Figure 5. KM Survival Functions for variable TY_DEG
The stratified analysis of transition times by type of degree (TY_DEG) is rather interesting. As we can observe (Figure 5), survival functions for gradu-ates SCT and SVS show how their transition times are lower than they are for other graduates (in particular for SCT) and that the shape of their curves is more similar to “L” than in the other groups, which is the typical situation for short time events.
The comparison between medians and quartiles (Table 2) provides us with further points for reflection. On average, an SCT graduate finds a job in half the time it takes UEC or EGS graduates to find one. It is interesting to notice how the longest observation time of the event for SCT graduates (43 months) is lower by almost one year than for graduates of groups EGS (53 months) and UEC (55 months).
Such evidence is a well-known factor among those who analyse university education performance; our evidence stems from a context (Sardinia) of rela-tively low economic development. Therefore, this would indicate that even in a region where the services, and in particular the public ones, are particularly demanding for the new employment, graduates of groups EGS and UEC do not have a greater probability of finding a job5. 5 Nevertheless, it is reasonable to believe that this evidence is influenced by the persis-
tence of a blocking of employment opportunities in the public sector.
Survival Function
Time (in months)

190 M. Porcu, N. Tedesco
Log-rank, Wilcoxon and Likelihood Ratio tests were applied to test the hy-pothesis of homogeneity of survival curves for each category of covariate TY_DEG. They are significant in all cases (p<0.0001).
The analysis of transition times for the LAG variable (Figure 6) does not show any differences in distributions of times, even though those who com-plete a degree course with a lag of one year have shorter transition times (Ta-ble 2). Moreover, for the same category of graduates, Q1 and Me are quite similar to the corresponding values for other categories, while values of Q3 and Max appear lower.
Table 2. Some statistics on transition times for covariates TY_DEG and LAG
Variables Min Q1 Me Q3 Max TY_DEG:
EGS 0 12 23 46 53 SCT 0 4 12 28 43 SVS 0 7 16 40 46 UEC 0 14 26,5 42 55 LAG: ≤ 1 0 8 18 34 45 2-3 0 8 19 38 55 >3 0 9 23 43 54
0 10 20 30 40 50
0.00.2
0.40.6
0.81.0
p
0-12-33 +
Figure 6. KM Survival Functions for variable LAG
Survival Function
Time (in months)

Transition from University to the Job Market. 191 A Time Analysis of the University of Cagliari Graduates
This meant that only Log-Rank and LR tests were significant (at 5% level), but this was the case for the Wilcoxon Test (not significant because of the in-tersection of curves in the initial part of the follow-up).
3.2 Parametric analysis of covariate effects
Non-parametric analysis enabled us to distinguish between different durations of times in a status of unemployment. Nevertheless, it could not actually measure the strength of the effects of covariates. That is why we applied a pa-rametric Weibull survival model6.
The hazard function of the model is defined as
( ) ( ) ( )thx...xxexpth 0pipi22i11i β++β+β= ,
where h0(t) = λγtγ–1 distributes as the Weibull function, with λ being a scale parameter and γ a shape parameter.
The results of the application of the model (Table 3), show clearly how the principal covariates that influence the likelihood of finding employment are LAG (p=0.0136) and TY_DEG (p<0.0001).
Table 3. Significance of factors and parameters applying a Weibull model
Covariates Estimates Standard error Chi square p-value INTERCEPT 3.6241 0.1327 746.23 <0.0001 SEX 0,6940
F vs M 0.0389 0.0989 0.15 0.6940 MARK 0.9686
≥ 106 vs < 106 0.0037 0.0929 0.01 0.9686 CORSO 0.7660 Yes vs No 0.0262 0.0880 0.09 0.7660 LAG 0.0136
≤ 1 vs > 3 years -0.4269 0.1541 7.68 0.0056 2-3 vs > 3 years -0.1682 0.0999 2.84 0.0922
TY_DEG <0.0001 EGS vs UEC -0.0652 0.1163 0.31 0.5747 SCT vs UEC -0.6104 0.1305 21.87 <0.0001 SVS vs UEC. -0.2329 0.1587 2.15 0.1422
λ scale parameter 1.1359 0.0375 γ Weibull shape 0.8803 0.0290
6 We applied the parametric Weibull model to test the existence of a linear relation be-
tween log(times) and log[-log S(t)], where S(t) represents the survival function calcu-lated with the Kaplan-Meier method . We did not apply the semi-parametric Cox model because we did not verify for all covariates the hypothesis of the proportional odds of events for each different category of covariates.

192 M. Porcu, N. Tedesco
These results were by no means unexpected because they were disclosed in the non parametric KM analysis and in other studies (Tedesco, 2002; Porcu & Puggioni, 2003a), albeit with different research objectives.
The analysis of estimated parameters clarifies the role of the above-mentioned factors.
First of all, with regard to the time taken to obtain a degree, it is evident that a lag of 2 to 3 years, with respect to a baseline lag of 3 or more, does not cause any significant reduction of transition times (p>0.09).
On the contrary, what appears to be evident and statistically significant is the reduction of transition times for those who finish their university career either within the statutory time or with a minimum lag (one additional year) compared to the baseline ( 4269.0ˆ −=β ; p=0.0056).
As regards type of degree, the only significant parameter is for the category SCT ( 6104.0ˆ −=β ; p<0.0001); the estimate for this parameter is particularly high because exp(-0.6104) = 0.5431: in other words, the probability of a SCT graduate getting a job is almost twice as high as it is for a UEC graduate (baseline) .
Results for the SVS group were quite interesting: the parameter is not sig-nificantly different from that obtained with the non-parametric KM analysis. The high value for dispersion of the estimate (0.1587) is probably due to the substantial number of those not employed (more than 25%) in this group of graduates and this causes the parameter to be non significant.
4. Conclusions
Our research represents the first analysis of transition times undertaken on a sample of graduates at the University of Cagliari with the aim of defining a general context in which to carry out an in-depth study of the problem of tran-sition from university to job market.
We observed a linear survival function which shows that the labour market can absorb the supply of graduates, which shows the existence of endogenous and exogenous obstacles to employment. One such exogenous obstacle is the lack of new openings for jobs in the public sector, which, in a region such as Sardinia, represents the principal employer for graduates in several areas, and in particular in the education sector.
In contrast with the results of other research on the efficiency of employ-ment markets, no significant differences were recorded between genders (but lack of new job positions in the public sector can mask the effect of gender). Similar results have been obtained with the variables degree classification (MARK) and postgraduate education. This may indicate that these are not dis-criminating factors in obtaining a job. This is in contrast with general opinion, in particular in the opinion of students.

Transition from University to the Job Market. 193 A Time Analysis of the University of Cagliari Graduates
The flattening toward high level frustrates any possibility of selection based on the criteria of final degree mark, while for post-graduate education the re-sult is surprising because it seems that the choice to attend a postgraduate pro-gramme is dictated more by the lack of available employment than the idea of getting a higher qualification for the market.
Among the significant factors, we quoted the effect of the type of degree and, to a lesser extent, that of the duration of university studies.
As far as type of degree is concerned, only the SCT (Scientific-Technical) group shows significantly shorter transition time, as well as a lower percent-age of censures (unemployed) at the end of the observation period.
A similar trend was observed for graduates of group SVS (Life and Health Sciences), but the large number on censures (explained by the high percentage of graduates that attend specialisation programmes for medical doctors) and the low values for transition, or those finding work in a short time made the parameter in the Weibull model non significant.
As for the duration of studies, we have the confirmation that those who get their degree in a short time have a higher probability of obtaining a job in a short time in comparison with those who complete their degree with a lag of four years or more (this was the case for more than 50% of our sample).
In conclusion, the labour market in Sardinia, displays a striking inability to select graduates based on their curricula. Probably, the labour market is satu-rated in traditional economic sectors (public administration) and, because there is no innovative post-industrial development policy, we might see a rise in the phenomenon of graduate emigration, which recent research (Porcu & Puggioni, 2003b) puts at about 10%.
References
COLLETT D. (1994) Modelling Survival Data in Medical Research, Chapman & Hall, London.
GIAMBALVO O. (1996) Tempi di attesa per l'inserimento nel mercato del lavoro di una leva di laureati. In: Rivista Italiana di Economia Demografia e Statistica, L(1): 243-267
KLEIN J.P., MOESCHBERGER M.L. (2003) Survival Analysis. Techniques for Cen-sored and Truncated Data, 2nd ed., Springer, New York.
PORCU M., PUGGIONI G. (2003a) Laurea e abbandono universitario. Uno studio comparativo dei due eventi su un campione di immatricolati dell’Università di Cagliari. In: FABBRIS L. (ed) LAID-OUT: scoprire i rischi con l’analisi di seg-mentazione, vol.3, CLEUP, Padova: 25-40.
PORCU M., PUGGIONI G. (2003b) Transizione Università–Lavoro. Analisi prelimi-nare sui laureati della Sardegna nel periodo 1992 – 2001. In: CIVARDI M. (ed) Transizione Università–Lavoro: la definizione delle competenze, CLEUP, Padova: 81-96.
TEDESCO N. (2002) Analisi di segmentazione di una coorte di immatricolati

194 M. Porcu, N. Tedesco
dell’Università di Cagliari. In: G PUGGIONI (ed) Modelli e metodi per l’analisi dei rischi sociali e sanitari, CLEUP, Padova: 141-160.
TEDESCO N., PUGGIONI G., ORTU. A. (2000) Inserimento nel mercato del lavoro dei laureati in Scienze Politiche dell’Università di Cagliari dal 1987 al 1996. In: CIVARDI M., FABBRIS L. (ed) Valutazione della didattica con sistemi compu-ter-assisted, CLEUP, Padova: 135-154.