Embed Size (px)
Citation preview
TRANSIT SIGNAL PRIORITY WITH THREE-POINT ADVANCED PREDICTION: CASE STUDY OF BEACON STREET, BROOKLINE, MA
A Thesis Presented
By
Hangjue Li
to The Department of Civil and Environmental Engineering
in partial fulfillment of the requirements for the degree of
Master of Science in
Civil Engineering
in the field of
Transportation Engineering
Northeastern University Boston, Massachusetts
August,2012
2
Abstract
This thesis proposes a traffic signal control algorithm for transit priority based on
advanced detection. For each traffic signal, approaching transit vehicles are detected at
three points. The two closest points are just before and just after the transit stop preceding
the subject signal; the third and most distant point is just after the second preceding
transit stop. At each detection point, adjustments to the signal cycle are made in order to
increase the chance that the train arrives during a (future) green period. Adjustments at
the earlier detection points include shortening or lengthening signal phases, and assume
that further adjustments can be made a later detection points as uncertainty in predicting
the transit vehicle’s arrival time decreases. At the final detection point, adjustments also
include phase rotation, omitting left turn phases, and inserting transit-vehicle-only
phases, while respecting pedestrian phases. Signal control algorithms also include
features aimed at improving the efficiency of general traffic control including dynamic
recovery for restoring coordination (restoring relative offsets without caring about
absolute offsets) and allowing some signals to operate under full actuation. Algorithms
were also introduced to reduce pedestrian delay by minimizing cycle length, double
cycling, and providing pedestrian progression through two-stage crossings. The
algorithms were tested in simulation on Beacon Street in Brookline, MA, with a light rail
line operating in a median reservation. Simulation used the software VISSIM, with signal
control algorithms programmed using VAP, VISSIM’s programming language for traffic

3
signals. For the a.m. peak, transit delay was reduced 74 percent overall and up to 90
percent at a single intersection, with no change in delay to general traffic. Pedestrian
delay was also reduced by up to 50 percent at selected intersections.
4
Contents Abstract ........................................................................................................................... 2
List of Figures ................................................................................................................. 6
List of Tables .................................................................................................................. 7
1 Introduction .............................................................................................................. 8
1.1 Background ................................................................................................... 8
1.2 MBTA Green-Line (C) Light Rail along Beacon Street .................................. 9
1.3 Thesis Objective and Organization ............................................................... 13
2 Literature Synthesis ................................................................................................ 14
3 Transit Signal Priority Methodology ....................................................................... 17
3.1 Transit-Vehicle Prediction for TSP .............................................................. 17
3.1.1 Transit-Vehicle Detection ................................................................. 17
3.1.2 Arriving Time Prediction .................................................................. 20
3.2 Three-Point TSP Implementations ............................................................... 23
3.2.1 Three-Point Arrangement .................................................................. 23
3.2.2 Green Extension and Late Activation ................................................ 27
3.2.3 Early Green Activation ...................................................................... 29
3.2.4 Insert a Transit Signal Phase ............................................................. 30
3.2.5 Priority Level .................................................................................... 31
3.2.6 Dynamic Coordination Recovery after TSP ....................................... 31
3.3 General traffic Operation ............................................................................. 33
4 Simulation and Results Analysis ............................................................................. 35
4.1 Existing Condition of the Network ............................................................... 35
4.1.1 Existing Condition of General traffic ................................................. 35
4.1.2 Existing Public Transportation Conditions ........................................ 36
4.2 Improved General traffic .............................................................................. 39
5
4.2.1 General traffic Signal Operation ........................................................ 39
4.2.2 Pedestrian Signal Improvements ....................................................... 40
4.3 Advanced Transit Signal Priority Simulation ............................................... 49
4.3.1 Transit Signal Priority in the Traditional Way ................................... 49
4.3.2 Coordination Recovery Effects on TSP and General traffic ............... 51
4.3.3 Near-side and Far-side Stop Location ................................................ 52
4.3.4 Network Simulation Results .............................................................. 54
5 Conclusion ............................................................................................................. 57
References ..................................................................................................................... 59
Appendix....................................................................................................................... 60
6
List of Figures
FIGURE 1-1 MBTA RAPID TRANSIT-VEHICLE& BUS ROUTES MAP (3) ........................... 10 FIGURE 1-2 CORRIDOR OF BEACON ST. FROM MARION ST. TO ST. MARY ST., BROOKLINE,
MA. ....................................................................................................................... 11 FIGURE 2-1TRANSIT SIGNAL PRIORITY IN THE TRADITIONAL WAY (1) .......................... 15 FIGURE 3-1 ILLUSTRATION OF THREE POINTS TRANSIT SIGNAL PRIORITY ...................... 19 FIGURE3-2 TRAVEL TIME FROM FIRST DETECTED POINT TO THE SUBJECT INTERSECTION
............................................................................................................................... 21 FIGURE 3-3 SIGNAL CONTROL ALGORITHM .................................................................. 24 FIGURE 4-1 HEADWAY DISTRIBUTION AT COOLIDGE CORNER MORNING PEAK HOURS,
INBOUND ................................................................................................................ 37 FIGURE 4-2 HEADWAY DISTRIBUTION AT ST. PAUL ST, MORNING PEAK HOURS, INBOUND
............................................................................................................................... 38 FIGURE 4-3 SUMMIT AVE AT BEACON STREET, BROOKLINE, MA .................................. 42 FIGURE 4-4 SIGNAL OPERATION ILLUSTRATION AT SUMMIT AVE. ................................. 43 FIGURE 4-5 SIGNAL OPERATION AT ST. MARY’S ST, BROOKLINE, MA. ......................... 45 FIGURE 4-6 EXISTING CONDITION OF THE SIGNAL OPERATION ILLUSTRATION AT
PLEASANT ST, REPORT OF SYNCHRO 5 ................................................................. 47 FIGURE 4-7 EXISTING CONDITION OF THE SIGNAL OPERATION AT WINCHESTER, REPORT
OF SYNCHRO 5 ..................................................................................................... 47 FIGURE 4-8 WINCHETER ST. AT BEACON ST., BROOKLINE, MA ..................................... 48 FIGURE 4-9 CHECK-IN/CHECK-OUT DETECTOR LOCATION ILLUSTRATION ..................... 50 FIGURE 4-10 AVERAGE DELAYS OF INBOUND GENERAL TRAFFIC AT COORDINATION ZONE
............................................................................................................................... 51 FIGURE 4-11 MINIMUM DELAY STOP LOCATIONS AT HARVARD ST. AND ST. PAUL ST.,
INBOUND ................................................................................................................ 53 FIGURE 4-12 INBOUND TRANSIT DELAY IN MORNING PEAK HOURS .............................. 55 FIGURE 4-13 TRAFFIC DELAY OF THE ENTIRE NETWORK ............................................... 56
7
List of Tables
TABLE 4-1 EXISTING GENERAL TRAFFIC CONDITIONS ON BEACON STREET (MORNING PEAK HOURS, WEEKDAYS) .................................................................... 36
TABLE 4-2 IMPROVED GENERAL TRAFFIC SIGNAL PLAN ................................................ 40 TABLE 4-3 GENERAL TRAFFIC NETWORK PERFORMANCE .............................................. 40 TABLE 4-4 COMPARISON OF THE DUAL PEDESTRIAN CYCLE AND EXISTING CONDITION . 44 TABLE 4-5 IMPROVEMENTS OF THE PEDESTRIAN SIGNAL OPERATION AT ST. MARY’S .... 46 TABLE 4-6 RELATIONS OF TRANSIT DELAY AND STOP LOCATIONS ................................ 53
8
1 Introduction
1.1 Background
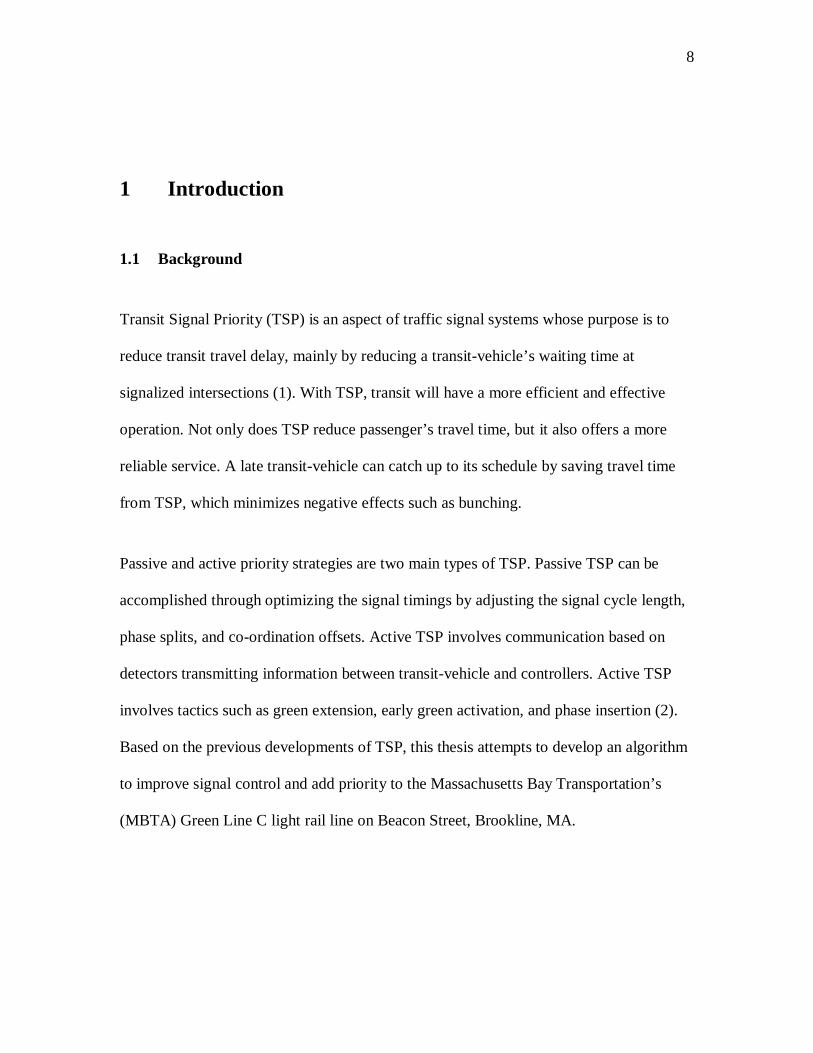
Transit Signal Priority (TSP) is an aspect of traffic signal systems whose purpose is to
reduce transit travel delay, mainly by reducing a transit-vehicle’s waiting time at
signalized intersections (1). With TSP, transit will have a more efficient and effective
operation. Not only does TSP reduce passenger’s travel time, but it also offers a more
reliable service. A late transit-vehicle can catch up to its schedule by saving travel time
from TSP, which minimizes negative effects such as bunching.
Passive and active priority strategies are two main types of TSP. Passive TSP can be
accomplished through optimizing the signal timings by adjusting the signal cycle length,
phase splits, and co-ordination offsets. Active TSP involves communication based on
detectors transmitting information between transit-vehicle and controllers. Active TSP
involves tactics such as green extension, early green activation, and phase insertion (2).
Based on the previous developments of TSP, this thesis attempts to develop an algorithm
to improve signal control and add priority to the Massachusetts Bay Transportation’s
(MBTA) Green Line C light rail line on Beacon Street, Brookline, MA.
9
1.2 MBTA Green-Line (C) Light Rail along Beacon Street
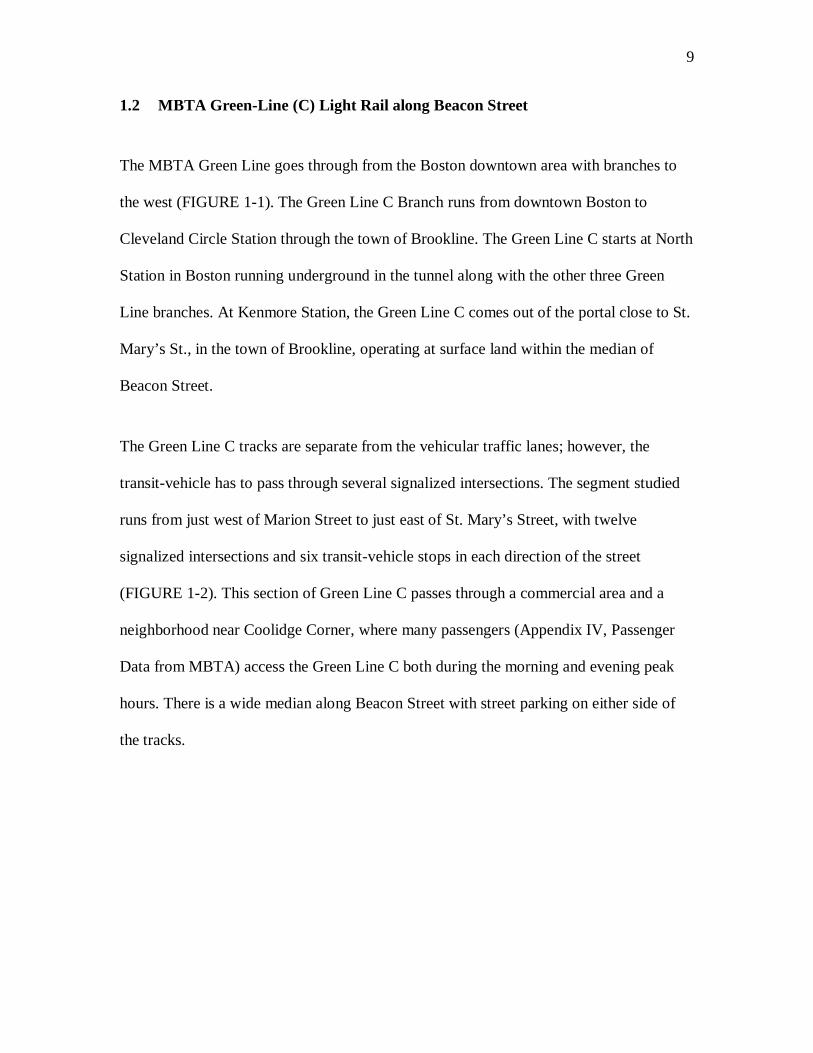
The MBTA Green Line goes through from the Boston downtown area with branches to
the west (FIGURE 1-1). The Green Line C Branch runs from downtown Boston to
Cleveland Circle Station through the town of Brookline. The Green Line C starts at North
Station in Boston running underground in the tunnel along with the other three Green
Line branches. At Kenmore Station, the Green Line C comes out of the portal close to St.
Mary’s St., in the town of Brookline, operating at surface land within the median of
Beacon Street.
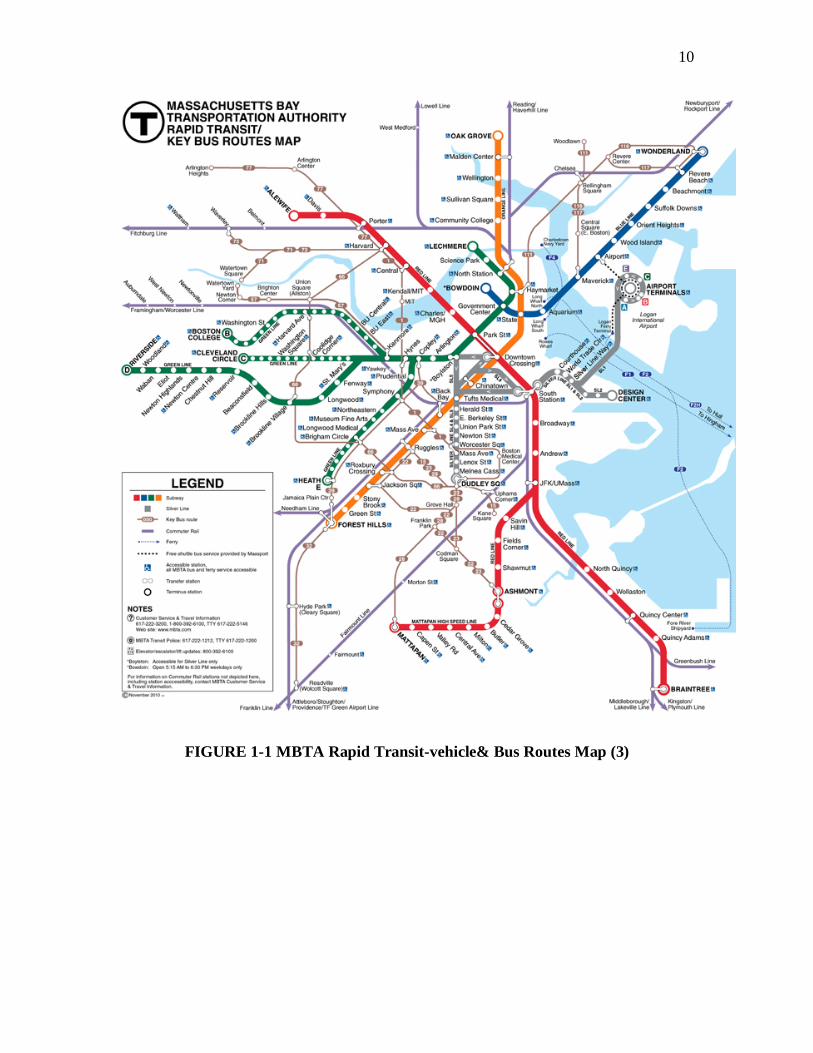
The Green Line C tracks are separate from the vehicular traffic lanes; however, the
transit-vehicle has to pass through several signalized intersections. The segment studied
runs from just west of Marion Street to just east of St. Mary’s Street, with twelve
signalized intersections and six transit-vehicle stops in each direction of the street
(FIGURE 1-2). This section of Green Line C passes through a commercial area and a
neighborhood near Coolidge Corner, where many passengers (Appendix IV, Passenger
Data from MBTA) access the Green Line C both during the morning and evening peak
hours. There is a wide median along Beacon Street with street parking on either side of
the tracks.
10
FIGURE 1-1 MBTA Rapid Transit-vehicle& Bus Routes Map (3)
11
FIGURE 1-2 Corridor of Beacon St. from Marion St. to St. Mary St., Brookline, MA.
(AutoCAD Sketch refers to Appendix IV)
12
Green Line C encounters delays due to stopping for the transit stations and the
intersections. The officially scheduled headway (4) is seven minutes, however, operation
are unreliable because of variable dwell time and intersection delays. If a train is late, the
passenger delay may be worsened due to more passengers who will be waiting for the
train which in turn increases the boarding time. The train delay may result in bunching,
with the headway between two transit-vehicles getting smaller and smaller. The trailing
vehicle could catch up to the leading one eventually, with the vehicle ahead being over
capacity, while the next vehicle may be almost empty. Meanwhile, long gaps develop
before the late transit-vehicle and behind the early vehicle which reduces the reliability of
the transit’s headway schedule.
13
1.3 Thesis Objective and Organization
This thesis aims to develop a traffic signal control algorithm for an arterial with light rail
in the median, located on Beacon Street, Brookline, MA. According to previous research
and implementation, TSP decreases transit’s travel time and reduces passengers’ delay,
but it hardly guarantees that every transit-vehicle gets a green light immediately. Signal
controllers are not permitted to apply an immediate green interval of TSP for various
reasons like respecting conflicting pedestrian service, meeting co-ordination needs, and
fulfilling the minimum green time and maximum green time limitations. The objective of
this algorithm is to provide minimal delay to public transit service through TSP, ideally
close to zero. The TSP algorithm development focuses on active signal priority by
detecting the arrival of a transit-vehicle and providing it priority. TSP is based on
predicting a train’s arrival at a traffic signal using detectors located at three points
(Chapter 3.2.1). The prediction of the train’s arrival time keeps improving at each point.
Tactics used include green extension, early green, phase rotation, omitting left turn
phases, and inserting transit-vehicle-only phases are used to implement TSP. Moreover,
general traffic (non-transit traffic) signal control is designed to minimize the influence of
transit-vehicle priority and decrease pedestrian’s delay. Signal control algorithms were
programmed and tested using the traffic simulation software VISSIM. The simulation
results were compared and analyzed among existing condition, TSP in traditional way
(Chapter 2), and the developed TSP.
14
2 Literature Synthesis
According to the Signal Timing Manual, “transit Signal Priority is an operational
Strategy that is applied to reduce the delay transit experience at traffic signals. TSP
involves communication between buses and traffic signal controllers so that a signal can
alter its timing to give priority to transit operations. Priority may be accomplished
through a number of methods, such as extending greens on identified phases, altering
phase sequences, and including special phases without interrupting the coordination of
green lights between adjacent intersections. Ultimately, TSP has the potential to improve
transit operation reliability, efficiency, and mobility. (1)”
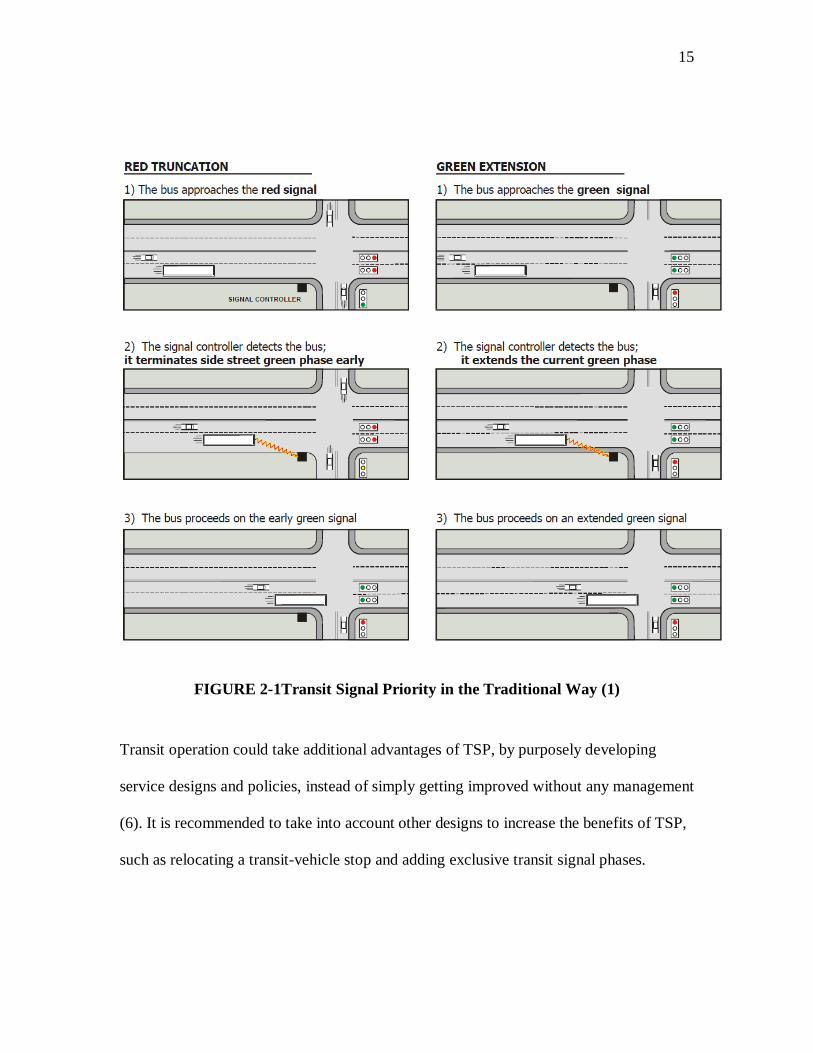
Basically, transit signal priority, in a traditional way, can proceed to an early green
activation and green extension to reduce the transit’s traveling delay. (FIGURE 2-1)
Due to the fluctuating traffic demand in each intersection, the minimum cycle should
have a limit to avoid cycle failure (5): the signal cycle length has significant effects on
the intersection capacity. An extremely short cycle length might increase traffic delay
owing to a lack of capacity. A very long cycle length, on the other hand, would lead to
huge delays in traffic because of the long waiting time. However, minimum and
maximum limits of cycle length constrain TSP operation.
15
FIGURE 2-1Transit Signal Priority in the Traditional Way (1)
Transit operation could take additional advantages of TSP, by purposely developing
service designs and policies, instead of simply getting improved without any management
(6). It is recommended to take into account other designs to increase the benefits of TSP,
such as relocating a transit-vehicle stop and adding exclusive transit signal phases.
16
A transit phase usually operates with one of the street’s general traffic stage that both
eastbound and westbound through traffic are green on Beacon Street, which indicates that
signal co-ordination can also assist in accomplishing the TSP objective in some cases.
TSP has already discovered that traffic signal co-ordination is an efficient way to
improve public transportation service competitiveness if applied appropriately (7).
17
3 Transit Signal Priority Methodology
The active TSP algorithm is introduced in this chapter. TSP strategy develops a three-
point advanced prediction and signal timing adjustment, including:
• transit-vehicle arrival time prediction ,
• tactics of TSP implementation, and
• General traffic improvement.
3.1 Transit-Vehicle Prediction for TSP
The active TSP’s implementation is based on predicting a transit-vehicle’s location and
arrival time to adjust the signal phases. This chapter introduces the selection of the
detectors’ location at three points, and the arrival time’s estimation. The predictions
decide the TSP implementation tactics at each point.
3.1.1 Transit-Vehicle Detection
Transit-vehicle prediction is the process of using detectors to provide a transit-vehicle’s
location and approach information to a controller. The detection information is
transmitted to the in order to provide priority to the transit-vehicles. It is necessary to
inform a controller in advance that a transit-vehicle is approaching so that TSP can be
applied.
Accurate and early predictions will provide a controller more flexibility to adjust the
priority timing plan, which will be more likely to improve the TSP service. For the
18
purpose of making the TSP operation more flexible, a transit-vehicle needs to be
predicted in advance so that with small, non-disruptive changes to green interval lengths,
the transit signal will be green when the vehicle arrives. However, the earlier a prediction
is made, the more uncertain factors there will be to predict transit arrival time due to
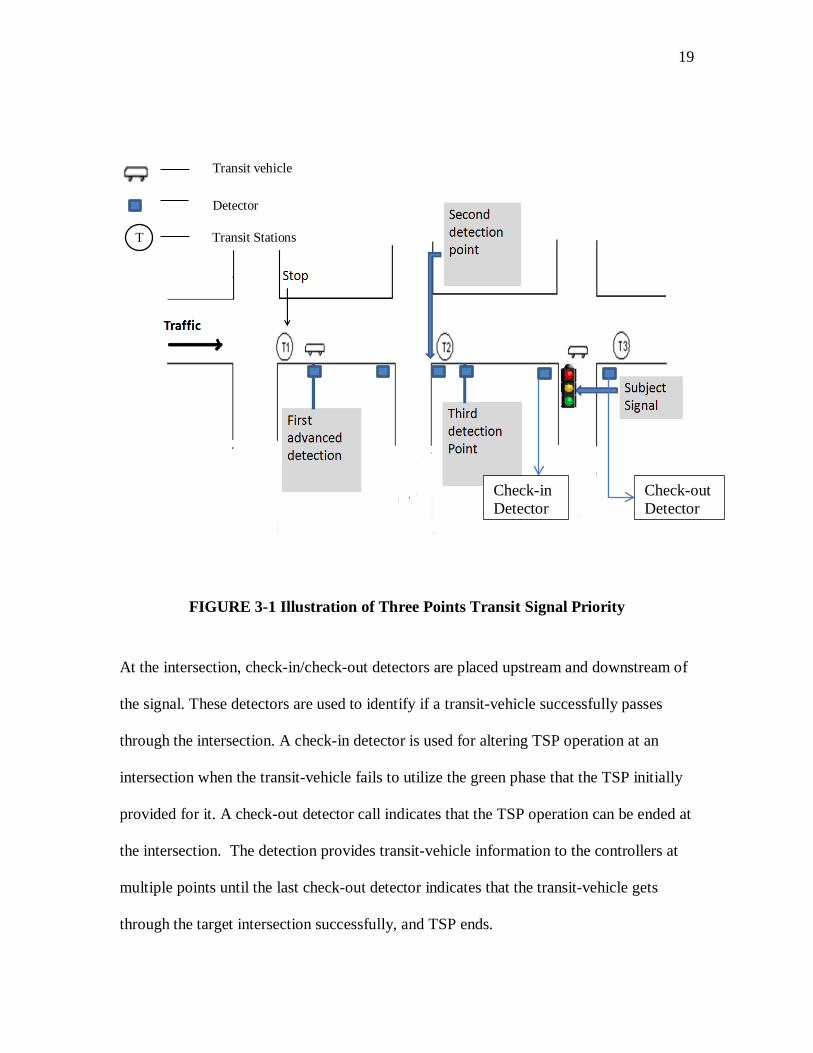
randomness in delay at intervening intersections and stops. Three locations will be used
to detect vehicles (FIGURE 3-1). The detectors are placed at two stations upstream of the
signalized intersection. In order to provide precise predictions as well as flexible TSP
operations, the first detection point is placed at a release point immediately after the first
transit station so that there will be only one station between the release point and the
subject intersection. A releasing point after a station allows a segment to have the longest
prediction time but one fewer uncertain dwell time (the dwell time of first transit station)
factor. The segment is defined as part of a travel route from the first detection point,
where a vehicle is detected, to the TSP target intersection. For checking the dwell time at
the middle station “T2”, the second detection point is located upstream of the closest
transit station (“T2”) to the target signal. The third detection point is located at
downstream of the release point of the closest station, and this is the earliest point that the
detector can provide the vehicle’s precise arrival time to the signal controller.
19
FIGURE 3-1 Illustration of Three Points Transit Signal Priority
At the intersection, check-in/check-out detectors are placed upstream and downstream of
the signal. These detectors are used to identify if a transit-vehicle successfully passes
through the intersection. A check-in detector is used for altering TSP operation at an
intersection when the transit-vehicle fails to utilize the green phase that the TSP initially
provided for it. A check-out detector call indicates that the TSP operation can be ended at
the intersection. The detection provides transit-vehicle information to the controllers at
multiple points until the last check-out detector indicates that the transit-vehicle gets
through the target intersection successfully, and TSP ends.
Check-in Detector
Check-out Detector
Transit vehicle
Detector
TT Transit Stations
20
At the transit station, an upstream detector and a downstream detector are placed at
upstream and downstream of the intersections, respectively. The pair of the detectors
monitors if the dwell time exceeds the pre-set length at the station (Chapter 3.2.1). The
downstream detector is also used to detect the transit-vehicle’s release time. The check-
out detector of the intersection and the upstream detector of the station could be the same
one at far-side transit stations; the downstream detector of the station and the check-in
detector of the intersection could be the same one at near-side stations.
3.1.2 Arriving Time Prediction
The advanced TSP attempts to make predictions earlier than the traditional ways of TSP
(Chapter 2), for the purpose of providing more flexibility to the controller implementing
TSP.
The subject signal TSP algorithm is based on two assumptions.
a. First, it assumes that the transit vehicle is able to successfully get TSP at
intervening signals without any delay. This means that the transit vehicle will
not be stopped by red signals until the target intersection in each segment, and
the signalized intersections will not impact the transit-vehicles’ travel time. This
is easier to accomplish when transit operates in its own right-of-way (ROW),
than for a bus in a shared ROW (e.g., mixed traffic).
b. Transit-vehicles have to stop at stations, and the dwell time is variable. The
second assumption is that the passenger arrival rate matches a normal distribution,
21
but the mean and variation may vary at each station, depending on the data. Since
the dwell time is variable, the arriving time of a segment would be a time range
instead of a specific point in time. The dwell time of each station is predicted
with an 85% confidence of interval.
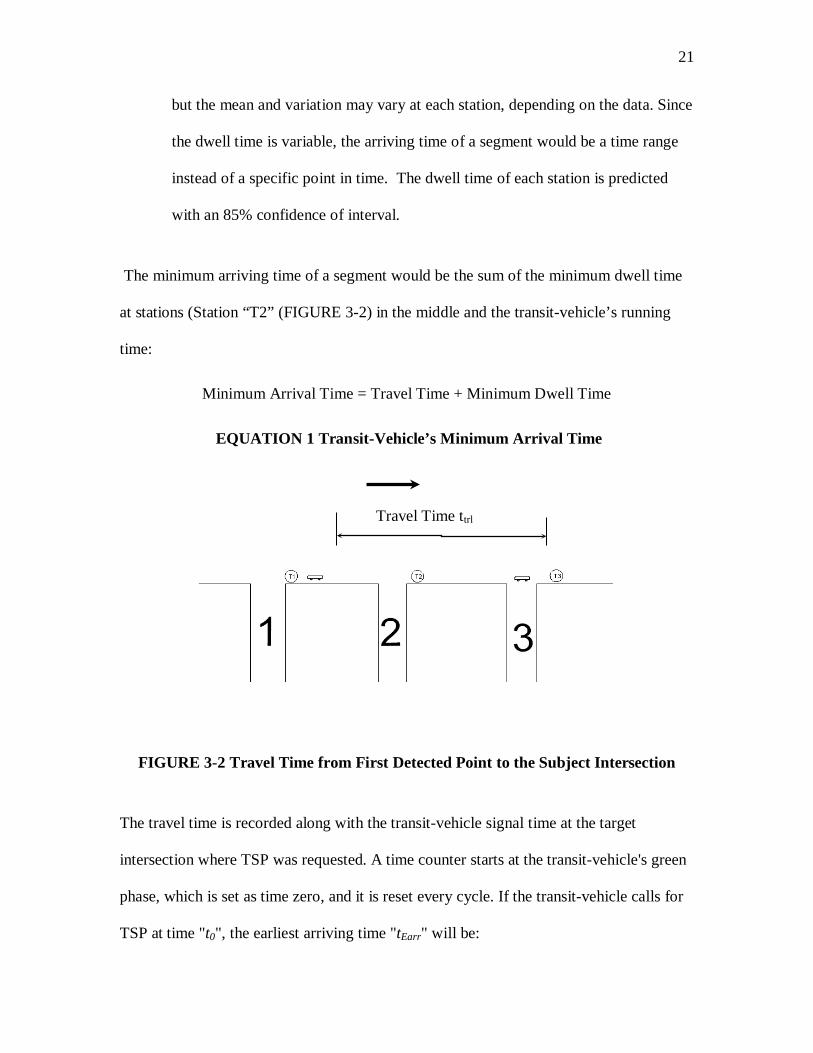
The minimum arriving time of a segment would be the sum of the minimum dwell time
at stations (Station “T2” (FIGURE 3-2) in the middle and the transit-vehicle’s running
time:
Minimum Arrival Time = Travel Time + Minimum Dwell Time
EQUATION 1 Transit-Vehicle’s Minimum Arrival Time
FIGURE 3-2 Travel Time from First Detected Point to the Subject Intersection
The travel time is recorded along with the transit-vehicle signal time at the target
intersection where TSP was requested. A time counter starts at the transit-vehicle's green
phase, which is set as time zero, and it is reset every cycle. If the transit-vehicle calls for
TSP at time "t0", the earliest arriving time "tEarr" will be:
Travel Time ttrl
22
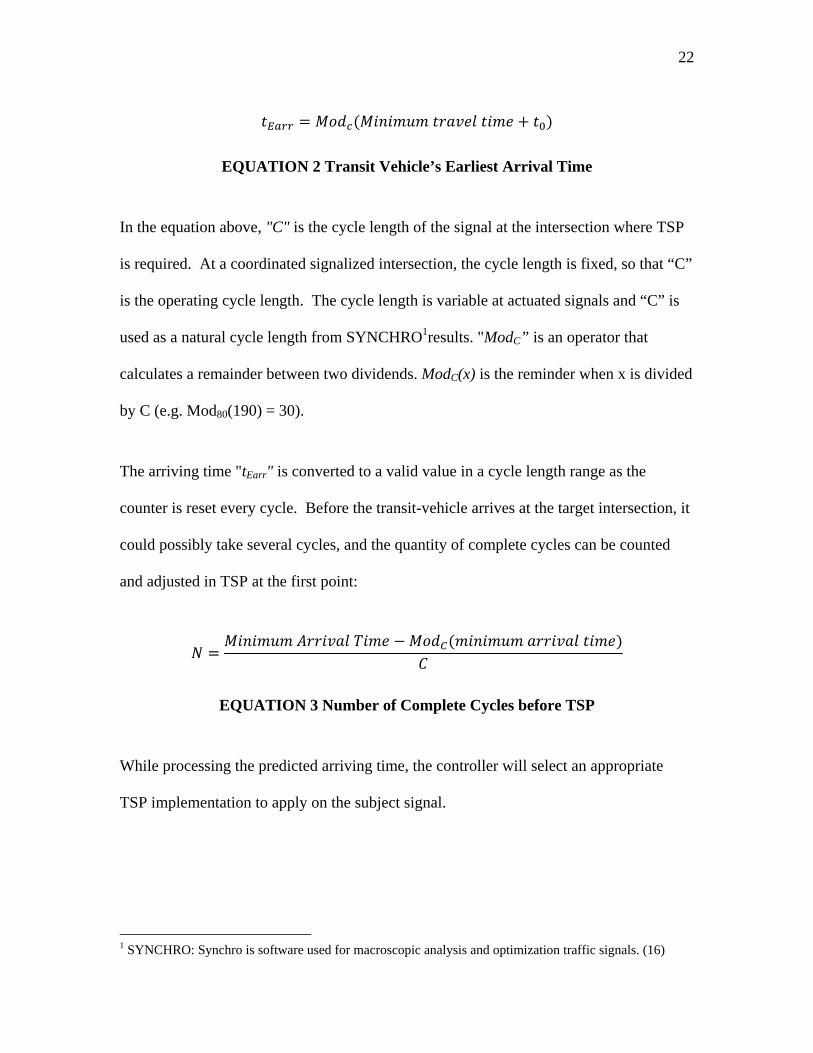
EQUATION 2 Transit Vehicle’s Earliest Arrival Time
In the equation above, "C" is the cycle length of the signal at the intersection where TSP
is required. At a coordinated signalized intersection, the cycle length is fixed, so that “C”
is the operating cycle length. The cycle length is variable at actuated signals and “C” is
used as a natural cycle length from SYNCHRO1results. "ModC” is an operator that
calculates a remainder between two dividends. ModC(x) is the reminder when x is divided
by C (e.g. Mod80(190) = 30).
The arriving time "tEarr" is converted to a valid value in a cycle length range as the
counter is reset every cycle. Before the transit-vehicle arrives at the target intersection, it
could possibly take several cycles, and the quantity of complete cycles can be counted
and adjusted in TSP at the first point:
EQUATION 3 Number of Complete Cycles before TSP
While processing the predicted arriving time, the controller will select an appropriate
TSP implementation to apply on the subject signal.
1 SYNCHRO: Synchro is software used for macroscopic analysis and optimization traffic signals. (16)
23
3.2 Three-Point TSP Implementations
The TSP implementation strategy is included in this section. The three-point arrangement
indicates that the controllers use the detection information to accomplish the TSP. The
tactic used includes:
• green extension,
• early green activation,
• phase rotation,
• omitting left turn phases, and
• inserting transit-vehicle-only.
After the TSP, the appropriate recovery would apply on the coordinated traffic.
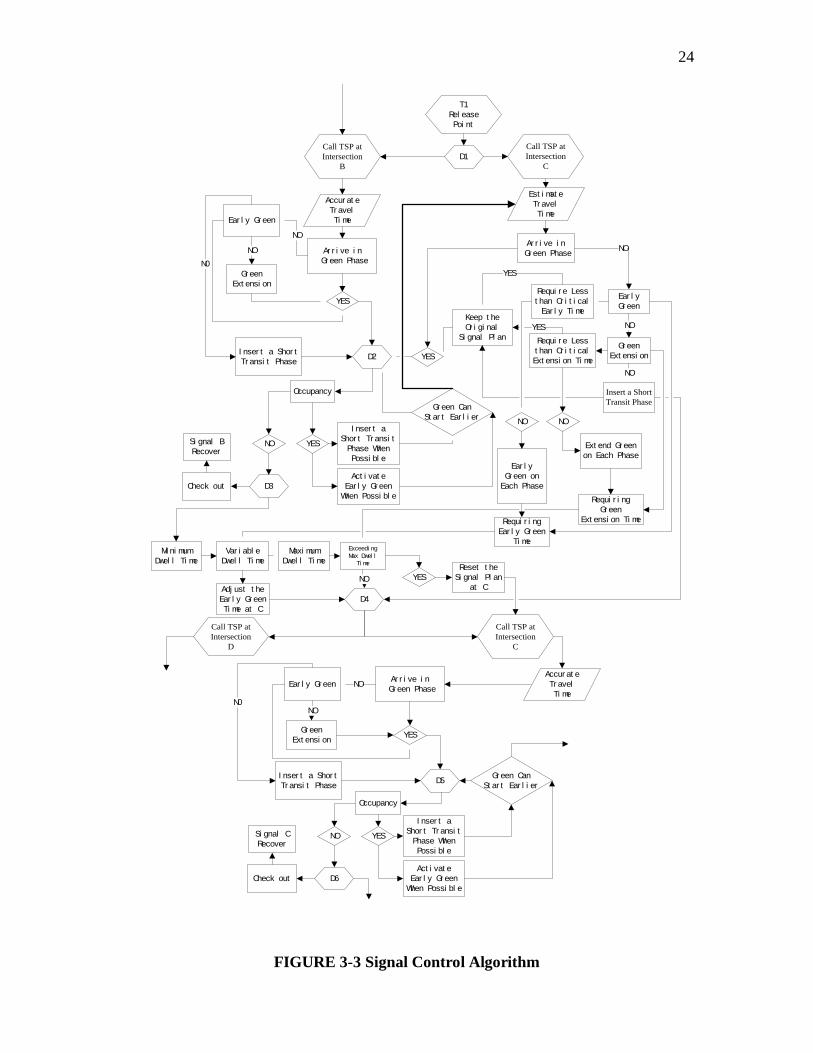
3.2.1 Three-Point Arrangement
The TSP operation algorithm (FIGURE3-3) is based on three main detection points in
space. TSP tactics used include green extension, early green, and phase rotation, omitting
left turn phases, and inserting transit-only phases, while respecting pedestrian phases and
general traffic capacity.
24
Call TSP atIntersection
B
Call TSP atIntersection
C
Est i mat e Tr avel Ti me
T1Rel ease Poi nt
Ar r i ve i n Gr een Phase
Accur at e Tr avel Ti me
YES
Gr een Ext ensi on
Ear l y Gr een
NO
NO
D1
I nser t a Shor t Tr ansi t Phase
N0
D2
NO YES
I nser t a Shor t Tr ansi t
Phase When Possi bl e
Act i vat e Ear l y Gr een
When Possi bl e
Gr een Can St ar t Ear l i er
D3
Ar r i ve i n Gr een Phase
YESGr een
Ext ensi on
Ear l y Gr een
Insert a Short Transit Phase
NO
NO
Requi r e Less t han Cr i t i cal
Ear l y Ti me
Requi r e Less t han Cr i t i cal Ext ensi on Ti me
Occupancy
Keep t he Or i gi nal
Si gnal Pl an
NO
NO
YES
Check out
Si gnal B Recover
NO
Ear l y Gr een on
Each Phase
Ext end Gr een on Each Phase
Mi ni mum Dwel l Ti me
Var i abl e Dwel l Ti me
Maxi mum Dwel l Ti me
Exceedi ng Max Dwel l
Ti me
Requi r i ng Ear l y Gr een
Ti me
Requi r i ng Gr een
Ext ensi on Ti me
YES
YESReset t he
Si gnal Pl an at CAdj ust t he
Ear l y Gr een Ti me at C
D4
NO
Call TSP atIntersection
C
Ar r i ve i n Gr een Phase
Accur at e Tr avel Ti me
YESGr een Ext ensi on
Ear l y Gr een
NO
NO
I nser t a Shor t Tr ansi t Phase
N0
D5
NO YES
I nser t a Shor t Tr ansi t
Phase When Possi bl e
Act i vat e Ear l y Gr een
When Possi bl e
Gr een Can St ar t Ear l i er
D6
Occupancy
Check out
Si gnal C Recover
Call TSP atIntersection
D
FIGURE 3-3 Signal Control Algorithm
25
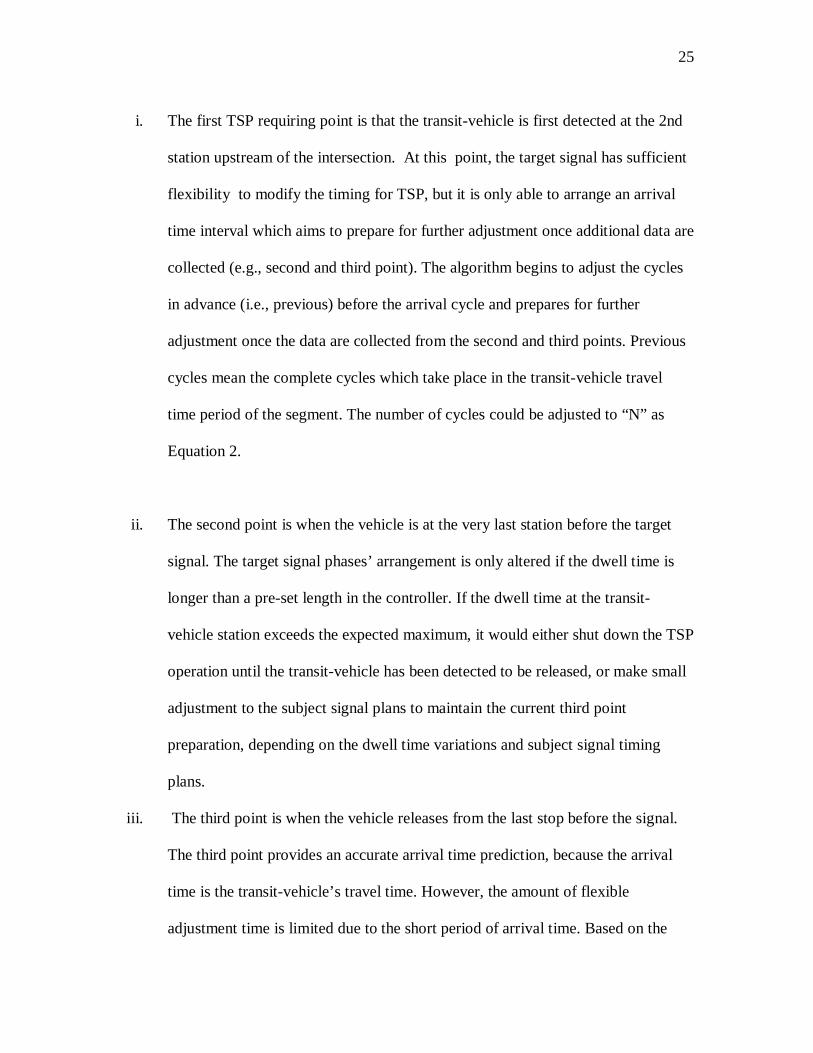
i. The first TSP requiring point is that the transit-vehicle is first detected at the 2nd
station upstream of the intersection. At this point, the target signal has sufficient
flexibility to modify the timing for TSP, but it is only able to arrange an arrival
time interval which aims to prepare for further adjustment once additional data are
collected (e.g., second and third point). The algorithm begins to adjust the cycles
in advance (i.e., previous) before the arrival cycle and prepares for further
adjustment once the data are collected from the second and third points. Previous
cycles mean the complete cycles which take place in the transit-vehicle travel
time period of the segment. The number of cycles could be adjusted to “N” as
Equation 2.
ii. The second point is when the vehicle is at the very last station before the target
signal. The target signal phases’ arrangement is only altered if the dwell time is
longer than a pre-set length in the controller. If the dwell time at the transit-
vehicle station exceeds the expected maximum, it would either shut down the TSP
operation until the transit-vehicle has been detected to be released, or make small
adjustment to the subject signal plans to maintain the current third point
preparation, depending on the dwell time variations and subject signal timing
plans.
iii. The third point is when the vehicle releases from the last stop before the signal.
The third point provides an accurate arrival time prediction, because the arrival
time is the transit-vehicle’s travel time. However, the amount of flexible
adjustment time is limited due to the short period of arrival time. Based on the
26
arrangement at the first and second point, the signal should be able to provide
TSP with minor adjustment at the third point. When the transit-vehicle is detected
by the check-out detector at the target intersection, the TSP ends.
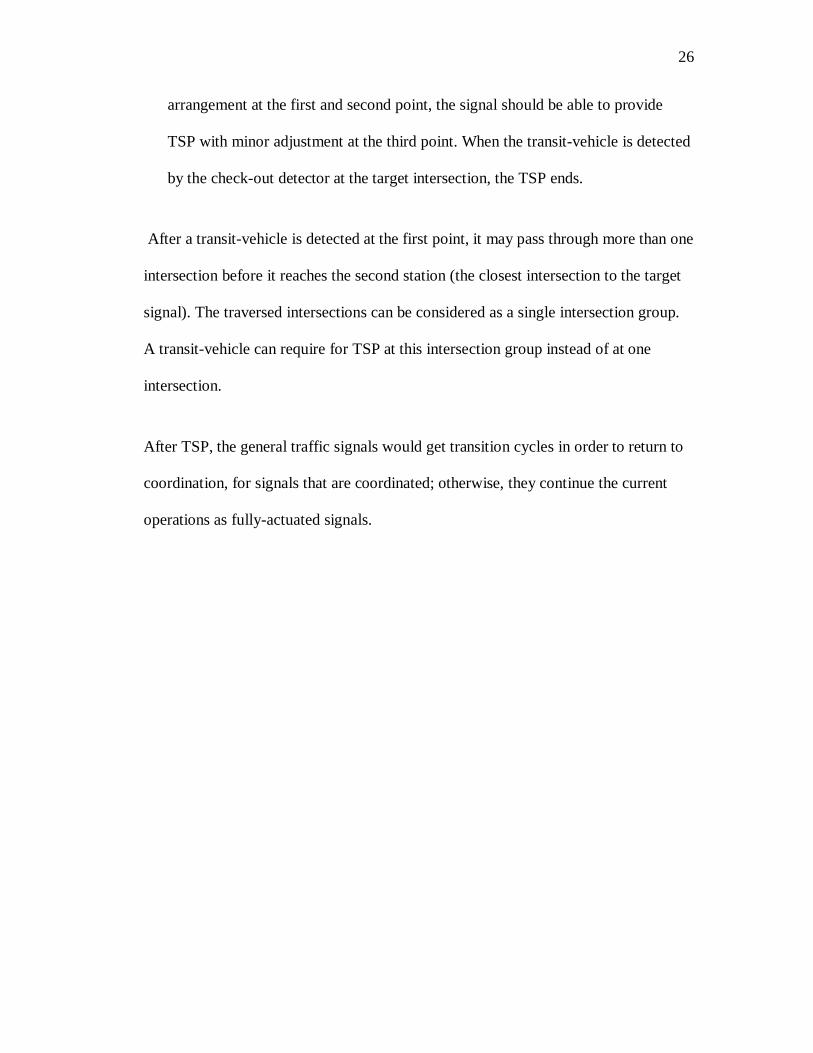
After a transit-vehicle is detected at the first point, it may pass through more than one
intersection before it reaches the second station (the closest intersection to the target
signal). The traversed intersections can be considered as a single intersection group.
A transit-vehicle can require for TSP at this intersection group instead of at one
intersection.
After TSP, the general traffic signals would get transition cycles in order to return to
coordination, for signals that are coordinated; otherwise, they continue the current
operations as fully-actuated signals.
27
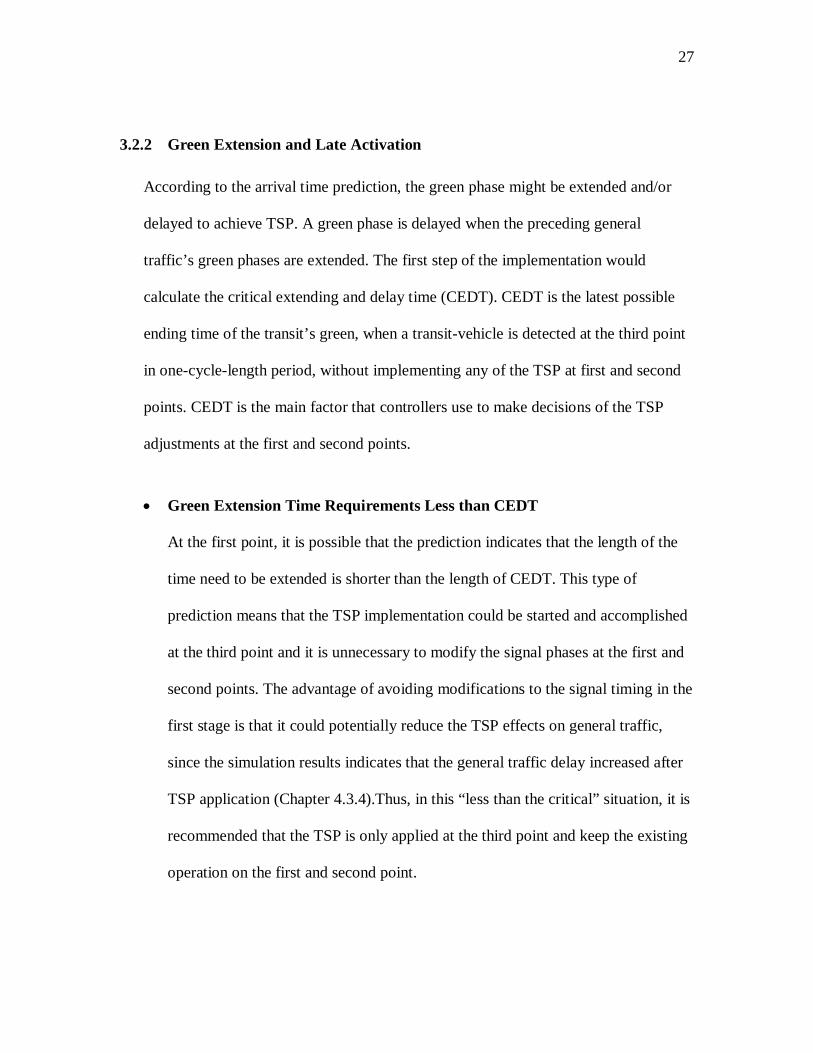
3.2.2 Green Extension and Late Activation
According to the arrival time prediction, the green phase might be extended and/or
delayed to achieve TSP. A green phase is delayed when the preceding general
traffic’s green phases are extended. The first step of the implementation would
calculate the critical extending and delay time (CEDT). CEDT is the latest possible
ending time of the transit’s green, when a transit-vehicle is detected at the third point
in one-cycle-length period, without implementing any of the TSP at first and second
points. CEDT is the main factor that controllers use to make decisions of the TSP
adjustments at the first and second points.
• Green Extension Time Requirements Less than CEDT
At the first point, it is possible that the prediction indicates that the length of the
time need to be extended is shorter than the length of CEDT. This type of
prediction means that the TSP implementation could be started and accomplished
at the third point and it is unnecessary to modify the signal phases at the first and
second points. The advantage of avoiding modifications to the signal timing in the
first stage is that it could potentially reduce the TSP effects on general traffic,
since the simulation results indicates that the general traffic delay increased after
TSP application (Chapter 4.3.4).Thus, in this “less than the critical” situation, it is
recommended that the TSP is only applied at the third point and keep the existing
operation on the first and second point.
28
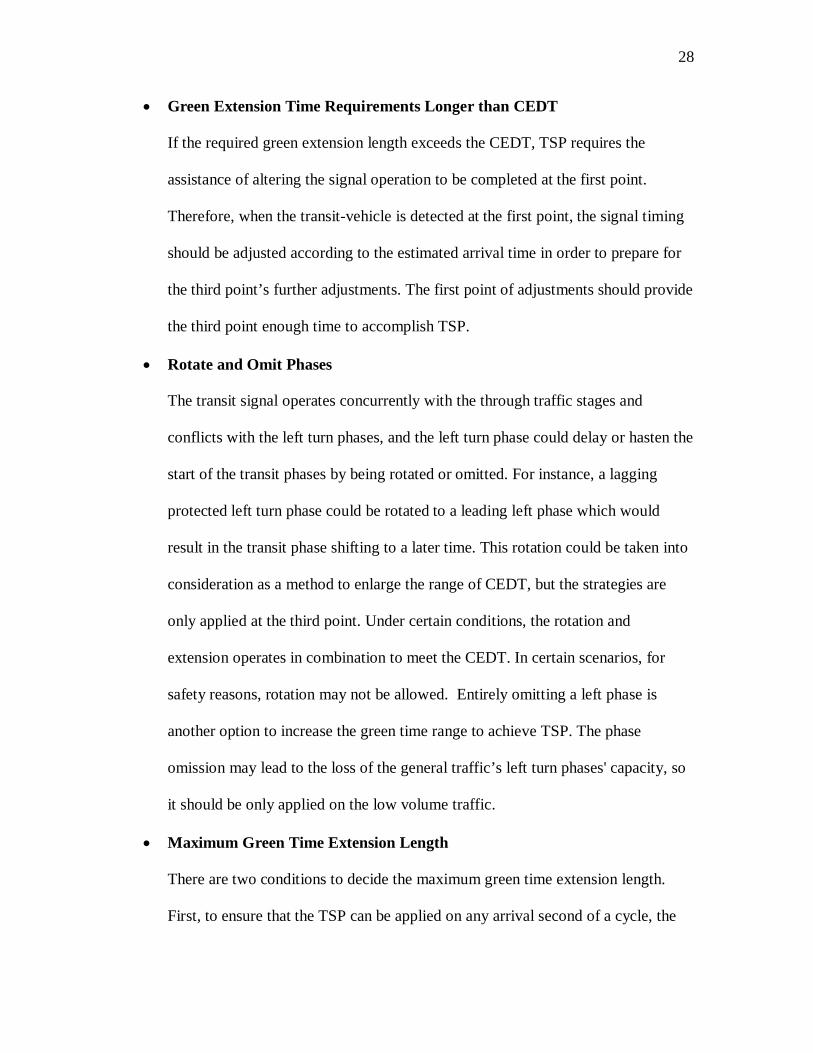
• Green Extension Time Requirements Longer than CEDT
If the required green extension length exceeds the CEDT, TSP requires the
assistance of altering the signal operation to be completed at the first point.
Therefore, when the transit-vehicle is detected at the first point, the signal timing
should be adjusted according to the estimated arrival time in order to prepare for
the third point’s further adjustments. The first point of adjustments should provide
the third point enough time to accomplish TSP.
• Rotate and Omit Phases
The transit signal operates concurrently with the through traffic stages and
conflicts with the left turn phases, and the left turn phase could delay or hasten the
start of the transit phases by being rotated or omitted. For instance, a lagging
protected left turn phase could be rotated to a leading left phase which would
result in the transit phase shifting to a later time. This rotation could be taken into
consideration as a method to enlarge the range of CEDT, but the strategies are
only applied at the third point. Under certain conditions, the rotation and
extension operates in combination to meet the CEDT. In certain scenarios, for
safety reasons, rotation may not be allowed. Entirely omitting a left phase is
another option to increase the green time range to achieve TSP. The phase
omission may lead to the loss of the general traffic’s left turn phases' capacity, so
it should be only applied on the low volume traffic.
• Maximum Green Time Extension Length
There are two conditions to decide the maximum green time extension length.
First, to ensure that the TSP can be applied on any arrival second of a cycle, the
29
green time extension length should at least reach the earliest starting time of early
green. For example, if the earliest start of the early green can be activated at the (i
+ 1)th second of a cycle, then the green time should be able to at least extend to
the ith second. If TSP needs a long green extension time, it could extend all the
phases of a few previous cycles in order to delay the TSP phase start time which
will provide more flexible time. Secondly, the maximum cycle length should not
exceed one hundred and twenty seconds to maintain a regular operation for
general traffic signals (Chapter 2).
3.2.3 Early Green Activation
With prediction that the transit-vehicle will arrive in a non-green phase, the phase might
be able to be activated earlier to accomplish the TSP. The early green implementation
also possesses a critical early green time, similar to the green extension, to decide the
TSP implementation at the first point. The critical early green time (CEGT) is the earliest
green time which can be activated when a transit-vehicle is detected at the third point,
under the situation of a non-TSP operation at the first and second points.
• Requiring Early Green Time Length Less than CEGT
At the first stage, if the detected transit-vehicle requires an early green TSP, and
the required early green time length is less than the CEGT, then the signal could
preserve the current signal’s operation at the first point. The TSP implementation
would affect at the second and third points.
30
• Requiring Early Green Time Length More than CEGT
If the required early green time length exceeds CEGT, TSP cannot be
accomplished solely on modifying signal phase at the third point. At the time the
transit-vehicle is detected at the first point, the TSP operation should be activated
to be ready for further adjustments at the future points. The first-point adjustment
would provide adequate flexible time to assist accomplishing TSP at later points.
Adjustments could shorten the cycle length by reducing each signal phase time
length at previous cycles, which would shift the transit-vehicle green phase earlier.
• Rotate and Omit Phases
Transit-vehicle signal phases are in conflict with general traffic turning phases.
Rotating and omitting these phases are possible methods to provide early green
TSP. A leading left turn can be rotated to be a lagging left turn in order to activate
the transit-vehicle phase earlier. If rotation is not allowed, omitting the leading
left phase is another option to enlarge the green time range in which to start an
early green. This rotation and omission strategy could be used to enlarge the
critical early green time applicable range also, but only at the third point. The
disadvantage of phase omission is losing traffic capacity, which might create a
need for extra time in the following cycles.
3.2.4 Insert a Transit Signal Phase
Because of the unpredictable dwell time, it may lead to some difficulty to achieving the
TSP by green extension or early green at the third point. Under this situation, it may be
necessary to insert a transit signal phase for the approaching vehicle. Considering that
31
transit signal phases are only in conflict with general traffic, but not with pedestrian
phases, general traffic could be stopped for a few seconds and a special short transit-
vehicle phase for TSP could be inserted. Safety concerns require that the controller shall
not omit or shorten any yellow time and red clearance time if terminating any general
traffic signal operation, and also, the terminated phases shall reach the minimum green
time requirement. The signal goes to the next stage operation after the phase insertion.
3.2.5 Priority Level
It is difficult to meet more than one TSP request at a time. When two transit-vehicles are
detected approaching the same intersection, it is likely that more than one TSP request
will be transmitted to the controller. Transit-vehicles travelling in the peak-hour direction
are likely to have more passengers, therefore TSP should be provided to the transit-
vehicle travelling in that direction if there are conflicting requests.
3.2.6 Dynamic Coordination Recovery after TSP
Intersections are dynamically coordinated in order to restore general traffic signal
systems after TSP is applied. The dynamic coordination is programmed into the main
general traffic signal system, and upstream intersections communicate to its downstream
intersection’s coordinated phase. The downstream signals offsets are adjusted by
following the upstream signals’ successively and the entire segment would restore back
to coordination.
The upstream signal sets an indicator to TRUE at its green starts plus the travel time, to
the downstream intersections. The indicator stays TRUE for the duration of the “green
bandwidth”, which for any pair of intersections is the smaller of the two’s scheduled
32
green. If the indicator is TRUE during a coordinated phase at downstream intersection,
then an attempt is made to shorten that non-coordinated signal phase, while fulfilling the
minimum green time length. The offsets may still have minor difference from the
previous after one recovery cycle, but the main coordinated phase will usually be at least
partly in the coordination bin to maintain the coordinated operation. It can take one to
three cycles to completely restore the coordinated operation. However, if there is a
transit-vehicle in between intersections, the signals are operated in TSP mode and the
coordination recovery would not be activated. The recovery coordination is mainly
applied in the direction in which TSP is applied.
33
3.3 General traffic Operation
Pedestrian phases operate concurrently with general traffic. Regardless of an actuated
signal or a group of coordinated signals, TSP would make an effort to reduce the cycle
length for reducing pedestrian delay. For the intersections that are far apart, a fully-
actuated signal1 would be applied. The fully actuated signals attempt to make the signal
more efficient and shorten the cycle length as much as possible. Actuated-coordinated
signals2 are implemented at the intersections with short spanning distances, but
shortening the overall cycle appropriately. TSP implementation may have some
influences on the general traffic signal operation. After TSP is applied, the controller
might need to be re-adjusted to resume the general traffic operation mode, depending on
different operation modes.
• Fully Actuated Signal Mode
The maximum cycle lengths of fully actuated signals are pre-set same as the fixed
coordinated cycle length, and the maximum signal phase splits are optimized
through simulation. Each fully actuated signal has an isolated operation and does
not apply recovery measures after TSP application, for there are not offsets
between the intersections at the segment installed fully actuated signals.
• Semi-Actuated Co-ordination Signal Mode
1Fully-actuated signal: Fully-actuated signal refers to detection and actuation for all traffic movements. (1) 2Actuated-coordination signal: The phases associated with the major-road through movements are coordinated, but the minor movements are actuated. (1)
34
In coordinated operation, the signal cycles have to recover to the preset length
after TSP is given. Offsets of the coordinated signals can be relative. As long as
the coordinated phases maintain the same time offset between the two
intersections, the coordination can continue to operate as planned. TSP
implementation might shift any offset forwards or backwards in time, but all the
related downstream offset should also be shifted to maintain coordination.
(Chapter 4.3.2)
• Omit Left-Turn Phases
All left-turn phases operate in an actuated type, whether it is a part of a single
actuated signal or a part of a coordinated signal operation, and the left-turn phases
would be skipped if there is no vehicle requiring a call. The omission is only
allowed to be applied on low traffic volume (volume lower than 80 vehicles per
hour) under TSP requirements. There is no additional recovery measures needed
on the left phase after TSP, the actuated left phase is able to get the vehicles
cleared.
35
4 Simulation and Results Analysis
Simulation results are illustrated in this chapter. The traffic is simulated and analyzed in
VISSIM 5.2. In all the VISSIM simulation Models, transit-vehicle’s speed is
approximately 25 miles per hour. The dwell time is modeled based on passenger’s
arriving rate with boarding and alighting time on each station except Coolidge Corner
station. Coolidge Corner station’s stopping time is simulated according to the
distribution of the data. The macro results of the general traffic are optimized and
measured by Sychro. The micro-results are simulated and collected along Beacon Street,
between Marion Street and St. Mary Street, on VISSIM.
4.1 Existing Condition of the Network
The traffic data of the existing condition are gathered from Brookline and MBTA, and a
few transit data was updated by counting in the year 2011. The existing condition of the
traffic network is established in the Synchro and VISSM. The macro results of the
general traffic are optimized and measured by Sychro. The micro-results are simulated
and collected along Beacon Street, between Marion Street and St. Mary Street, on
VISSIM.
4.1.1 Existing Condition of General traffic
The traffic signals are coordinated along Beacon Street with fixed ninety second cycle
length (Appendix IV, official data from Brookline). T8he existing condition of the
36
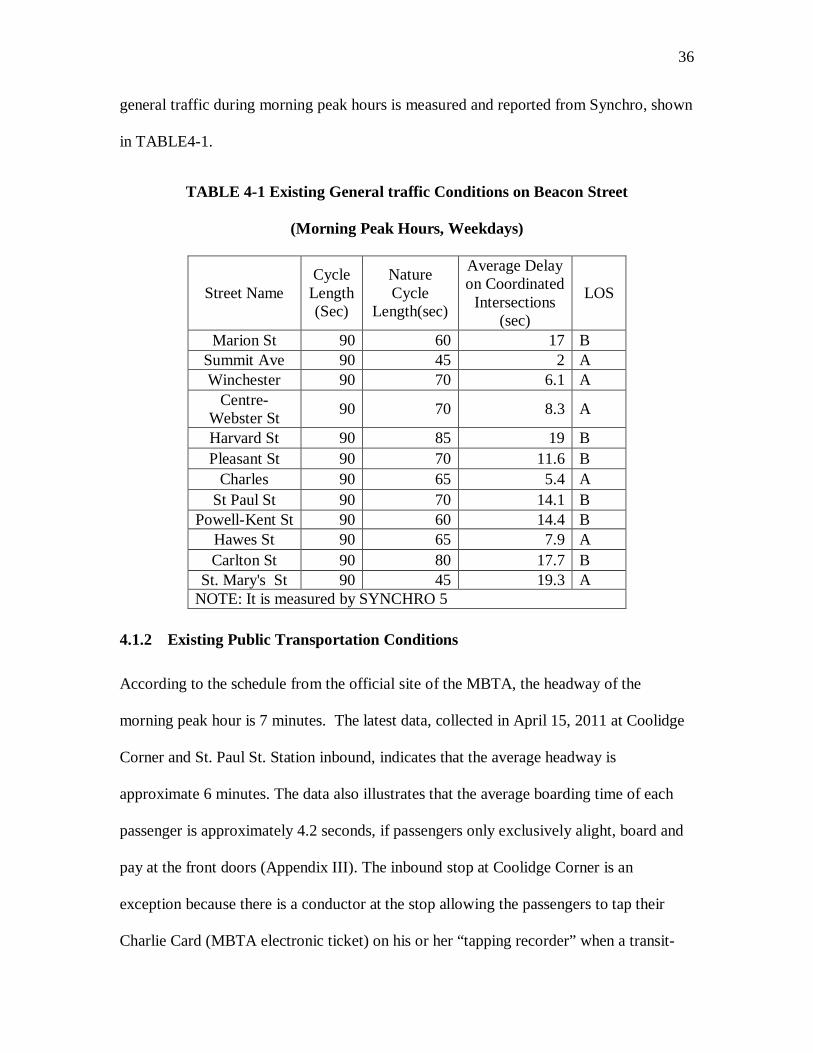
general traffic during morning peak hours is measured and reported from Synchro, shown
in TABLE4-1.
TABLE 4-1 Existing General traffic Conditions on Beacon Street
(Morning Peak Hours, Weekdays)
Street Name Cycle
Length(Sec)
Nature Cycle
Length(sec)
Average Delay on Coordinated
Intersections (sec)
LOS
Marion St 90 60 17 B Summit Ave 90 45 2 A Winchester 90 70 6.1 A
Centre-Webster St 90 70 8.3 A
Harvard St 90 85 19 B Pleasant St 90 70 11.6 B
Charles 90 65 5.4 A St Paul St 90 70 14.1 B
Powell-Kent St 90 60 14.4 B Hawes St 90 65 7.9 A Carlton St 90 80 17.7 B
St. Mary's St 90 45 19.3 A NOTE: It is measured by SYNCHRO 5
4.1.2 Existing Public Transportation Conditions
According to the schedule from the official site of the MBTA, the headway of the
morning peak hour is 7 minutes. The latest data, collected in April 15, 2011 at Coolidge
Corner and St. Paul St. Station inbound, indicates that the average headway is
approximate 6 minutes. The data also illustrates that the average boarding time of each
passenger is approximately 4.2 seconds, if passengers only exclusively alight, board and
pay at the front doors (Appendix III). The inbound stop at Coolidge Corner is an
exception because there is a conductor at the stop allowing the passengers to tap their
Charlie Card (MBTA electronic ticket) on his or her “tapping recorder” when a transit-
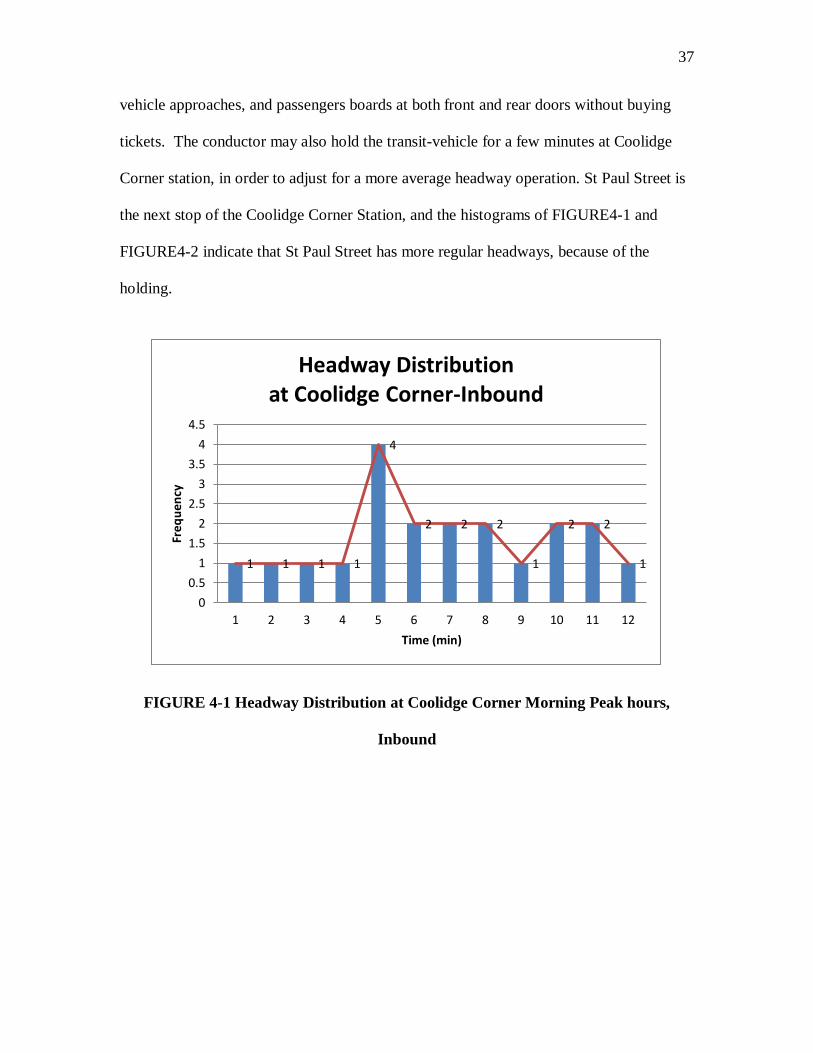
37
vehicle approaches, and passengers boards at both front and rear doors without buying
tickets. The conductor may also hold the transit-vehicle for a few minutes at Coolidge
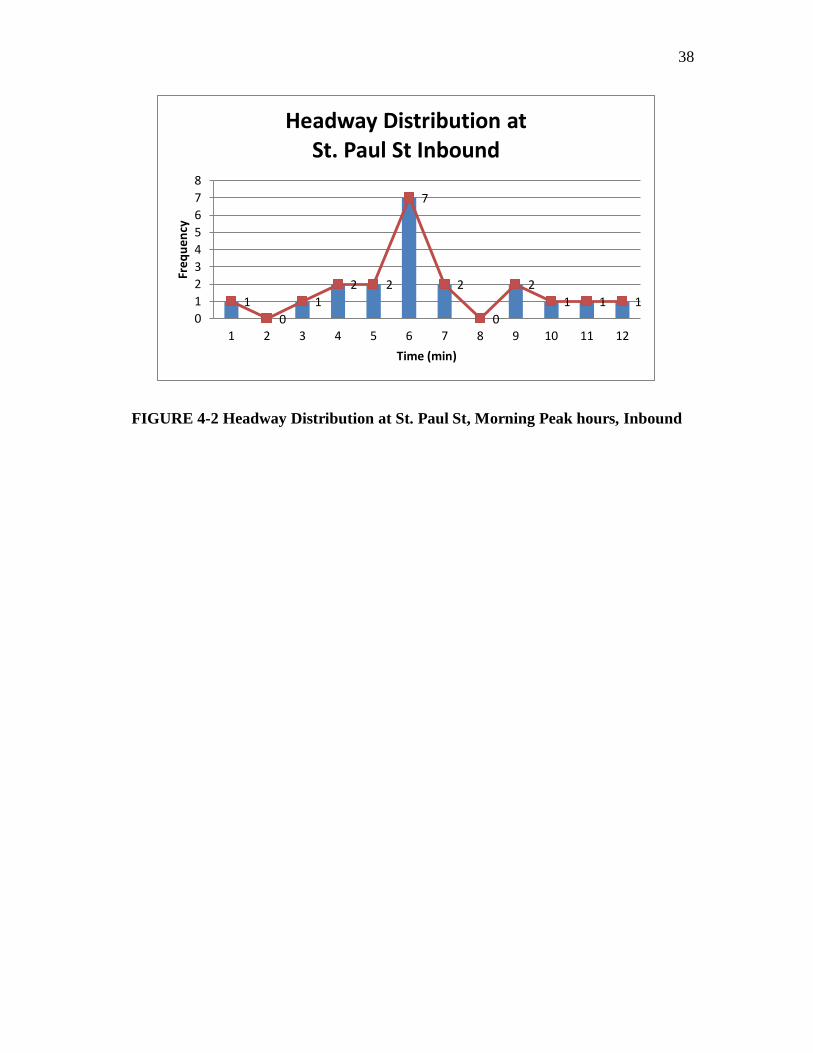
Corner station, in order to adjust for a more average headway operation. St Paul Street is
the next stop of the Coolidge Corner Station, and the histograms of FIGURE4-1 and
FIGURE4-2 indicate that St Paul Street has more regular headways, because of the
holding.
FIGURE 4-1 Headway Distribution at Coolidge Corner Morning Peak hours,
Inbound
1 1 1 1
4
2 2 2
1
2 2
1
00.5
11.5
22.5
33.5
44.5
1 2 3 4 5 6 7 8 9 10 11 12
Freq
uenc
y
Time (min)
Headway Distribution at Coolidge Corner-Inbound
38
FIGURE 4-2 Headway Distribution at St. Paul St, Morning Peak hours, Inbound
1 0
1 2 2
7
2
0
2 1 1 1
012345678
1 2 3 4 5 6 7 8 9 10 11 12
Freq
uenc
y
Time (min)
Headway Distribution at St. Paul St Inbound
39
4.2 Improved General traffic
For reducing the general traffic signal service and side-effects from TSP, the general
traffic are improved on several aspects. The network performance data of the general
traffic are collected before and after the improvements.
4.2.1 General traffic Signal Operation
From Marion Street to Charles Street, the spanning intersection distances are short and an
automobiles’ travel time is less than eight seconds which is same as the intersection
clearance time. The signal operational mode will be kept on the semi-actuated co-
ordination mode to reduce the traffic delay and avoid intersection spill back. In order to
reduce the two-stage pedestrian crossing delay on Beacon Street, the fixed co-ordination
cycle length is reduced to eighty seconds. Starting at St. Paul Street until St. Mary’s
Street, the signals of the intersections operate in fully- actuated mode which enhances
intersections’ efficiency and decreases pedestrian waiting time. A shorter Cycle length
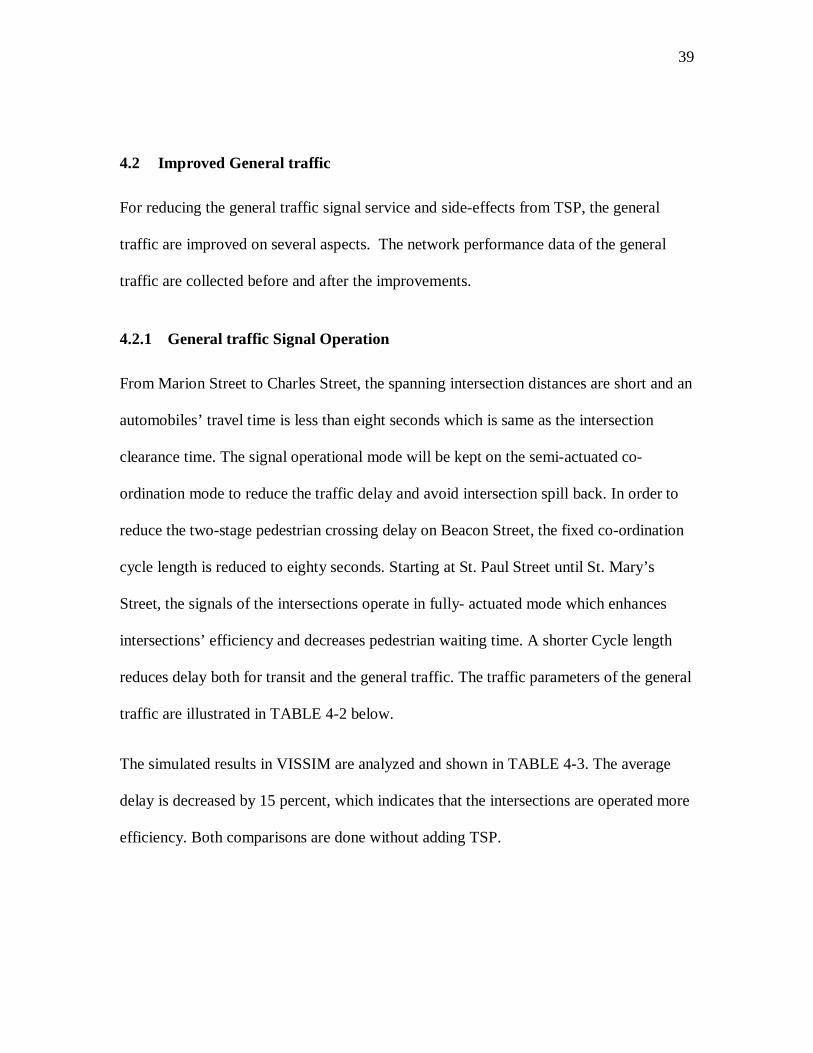
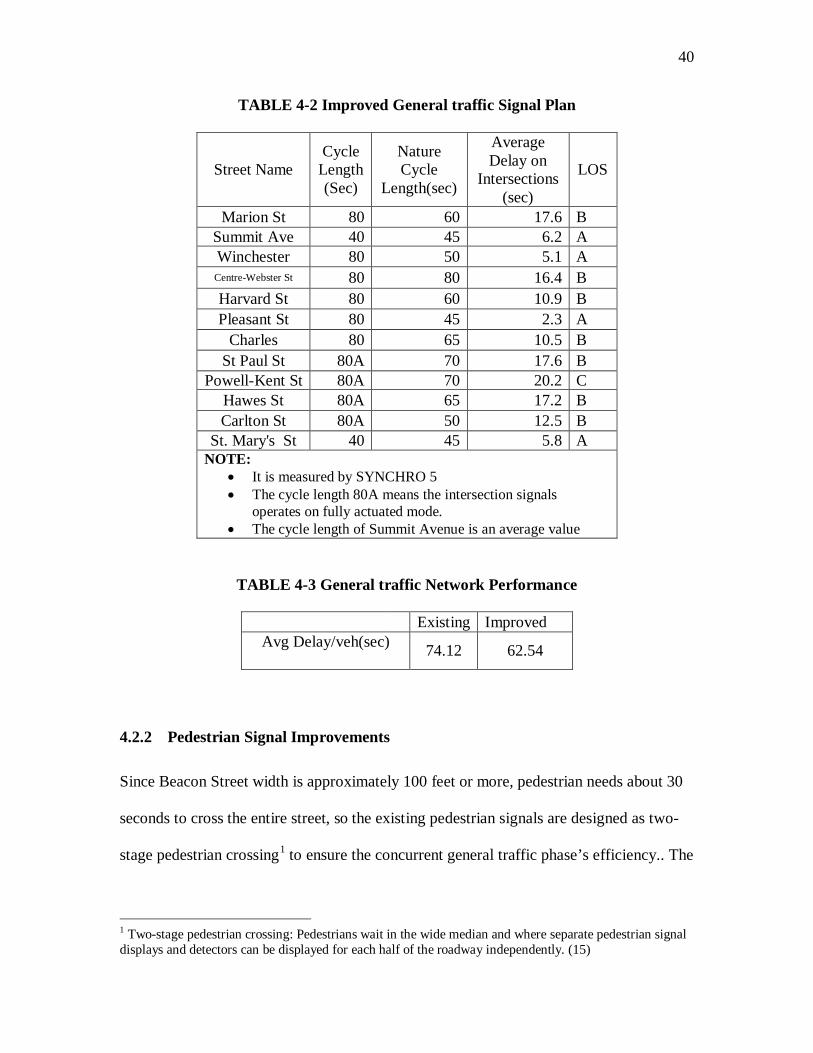
reduces delay both for transit and the general traffic. The traffic parameters of the general
traffic are illustrated in TABLE 4-2 below.
The simulated results in VISSIM are analyzed and shown in TABLE 4-3. The average
delay is decreased by 15 percent, which indicates that the intersections are operated more
efficiency. Both comparisons are done without adding TSP.
40
TABLE 4-2 Improved General traffic Signal Plan
Street Name Cycle
Length(Sec)
Nature Cycle
Length(sec)
Average Delay on
Intersections (sec)
LOS
Marion St 80 60 17.6 B Summit Ave 40 45 6.2 A Winchester 80 50 5.1 A
Centre-Webster St 80 80 16.4 B Harvard St 80 60 10.9 B Pleasant St 80 45 2.3 A
Charles 80 65 10.5 B St Paul St 80A 70 17.6 B
Powell-Kent St 80A 70 20.2 C Hawes St 80A 65 17.2 B Carlton St 80A 50 12.5 B
St. Mary's St 40 45 5.8 A NOTE:
• It is measured by SYNCHRO 5 • The cycle length 80A means the intersection signals
operates on fully actuated mode. • The cycle length of Summit Avenue is an average value
TABLE 4-3 General traffic Network Performance
Existing Improved Avg Delay/veh(sec)
74.12 62.54
4.2.2 Pedestrian Signal Improvements
Since Beacon Street width is approximately 100 feet or more, pedestrian needs about 30
seconds to cross the entire street, so the existing pedestrian signals are designed as two-
stage pedestrian crossing1 to ensure the concurrent general traffic phase’s efficiency.. The
1 Two-stage pedestrian crossing: Pedestrians wait in the wide median and where separate pedestrian signal displays and detectors can be displayed for each half of the roadway independently. (15)
41
improvements on the signal operations which decrease the pedestrian delay are as
follows.
4.2.2.1 Double Cycling the Pedestrian Signal, Dynamically Coordinated
with Traffic Signals at Applicable Intersections
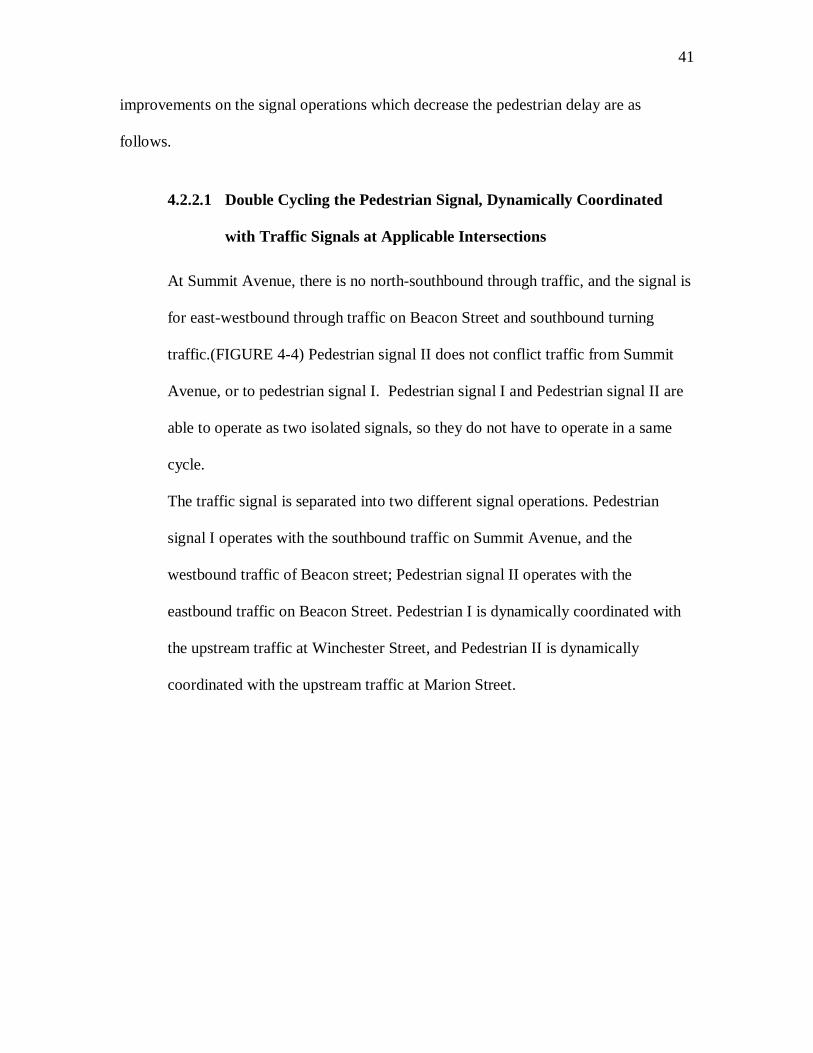
At Summit Avenue, there is no north-southbound through traffic, and the signal is
for east-westbound through traffic on Beacon Street and southbound turning
traffic.(FIGURE 4-4) Pedestrian signal II does not conflict traffic from Summit
Avenue, or to pedestrian signal I. Pedestrian signal I and Pedestrian signal II are
able to operate as two isolated signals, so they do not have to operate in a same
cycle.
The traffic signal is separated into two different signal operations. Pedestrian
signal I operates with the southbound traffic on Summit Avenue, and the
westbound traffic of Beacon street; Pedestrian signal II operates with the
eastbound traffic on Beacon Street. Pedestrian I is dynamically coordinated with
the upstream traffic at Winchester Street, and Pedestrian II is dynamically
coordinated with the upstream traffic at Marion Street.
42
FIGURE 4-3 Summit Ave at Beacon Street, Brookline, MA
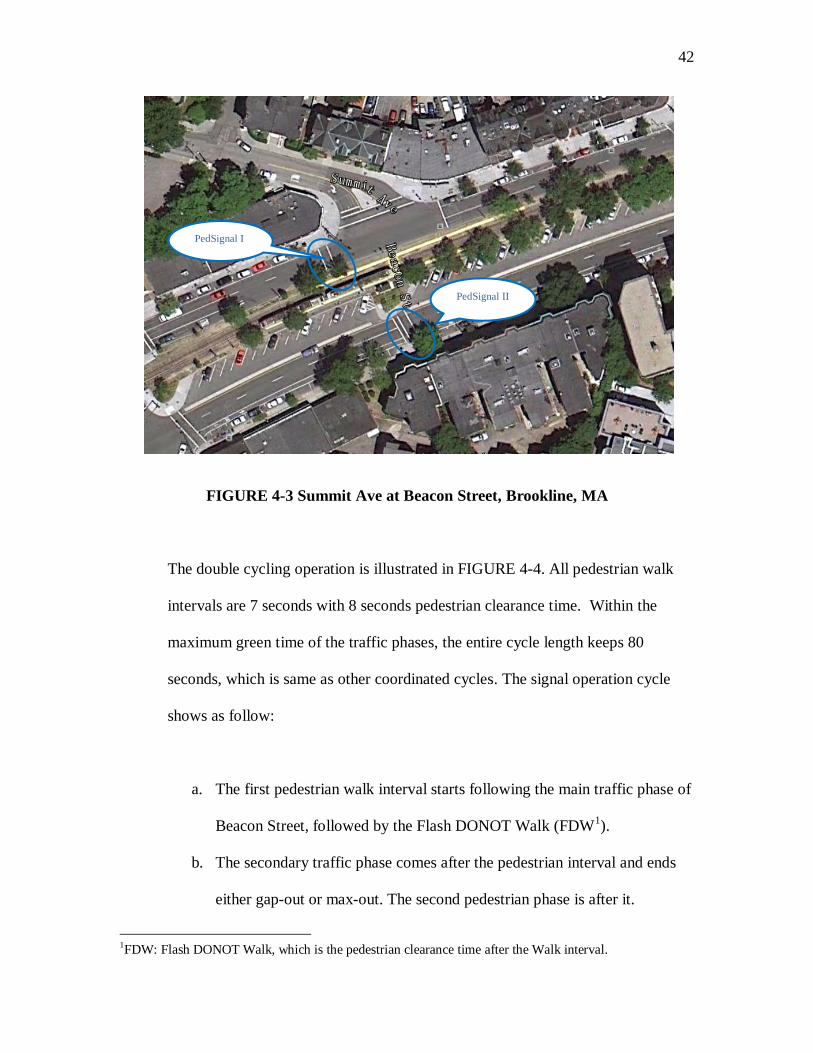
The double cycling operation is illustrated in FIGURE 4-4. All pedestrian walk
intervals are 7 seconds with 8 seconds pedestrian clearance time. Within the
maximum green time of the traffic phases, the entire cycle length keeps 80
seconds, which is same as other coordinated cycles. The signal operation cycle
shows as follow:
a. The first pedestrian walk interval starts following the main traffic phase of
Beacon Street, followed by the Flash DONOT Walk (FDW1).
b. The secondary traffic phase comes after the pedestrian interval and ends
either gap-out or max-out. The second pedestrian phase is after it.
1FDW: Flash DONOT Walk, which is the pedestrian clearance time after the Walk interval.
PedSignal I
PedSignal II
43
c. The main coordinated traffic phase activates after the second pedestrian
phase. If the secondary phase ends by gap-out, the balance from the
maximum green time goes to activating the main traffic phase early.
W FDWMain Traffic Phase on Beacon St.
Coordinate to the upstream intersection
Secondary Traffic Phase on Beacon
Street W FDWMain Traffic Phase on
Beacon StreetFDW
Offset Offset
Gap-out or Max-outCo-od
Ends
Cycle=80Sec
FIGURE 4-4 Signal Operation Illustration at Summit Ave.
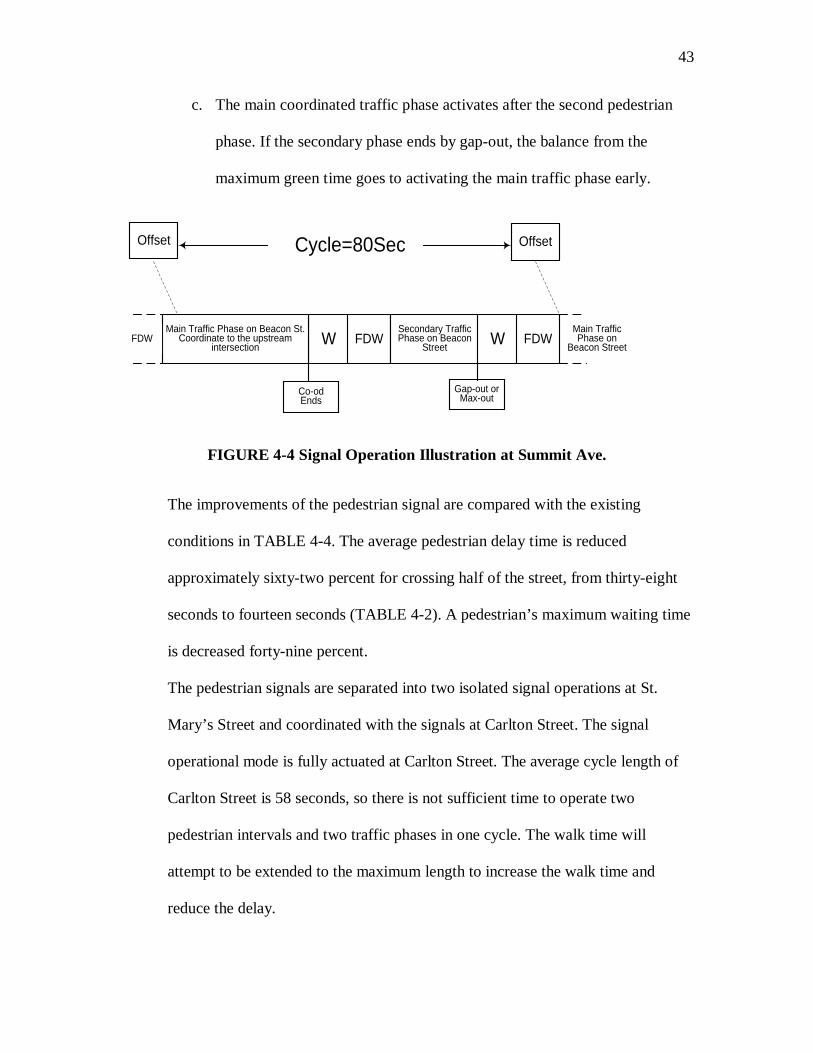
The improvements of the pedestrian signal are compared with the existing
conditions in TABLE 4-4. The average pedestrian delay time is reduced
approximately sixty-two percent for crossing half of the street, from thirty-eight
seconds to fourteen seconds (TABLE 4-2). A pedestrian’s maximum waiting time
is decreased forty-nine percent.
The pedestrian signals are separated into two isolated signal operations at St.
Mary’s Street and coordinated with the signals at Carlton Street. The signal
operational mode is fully actuated at Carlton Street. The average cycle length of
Carlton Street is 58 seconds, so there is not sufficient time to operate two
pedestrian intervals and two traffic phases in one cycle. The walk time will
attempt to be extended to the maximum length to increase the walk time and
reduce the delay.
44
TABLE 4-4 Comparison of the Dual Pedestrian Cycle and Existing Condition
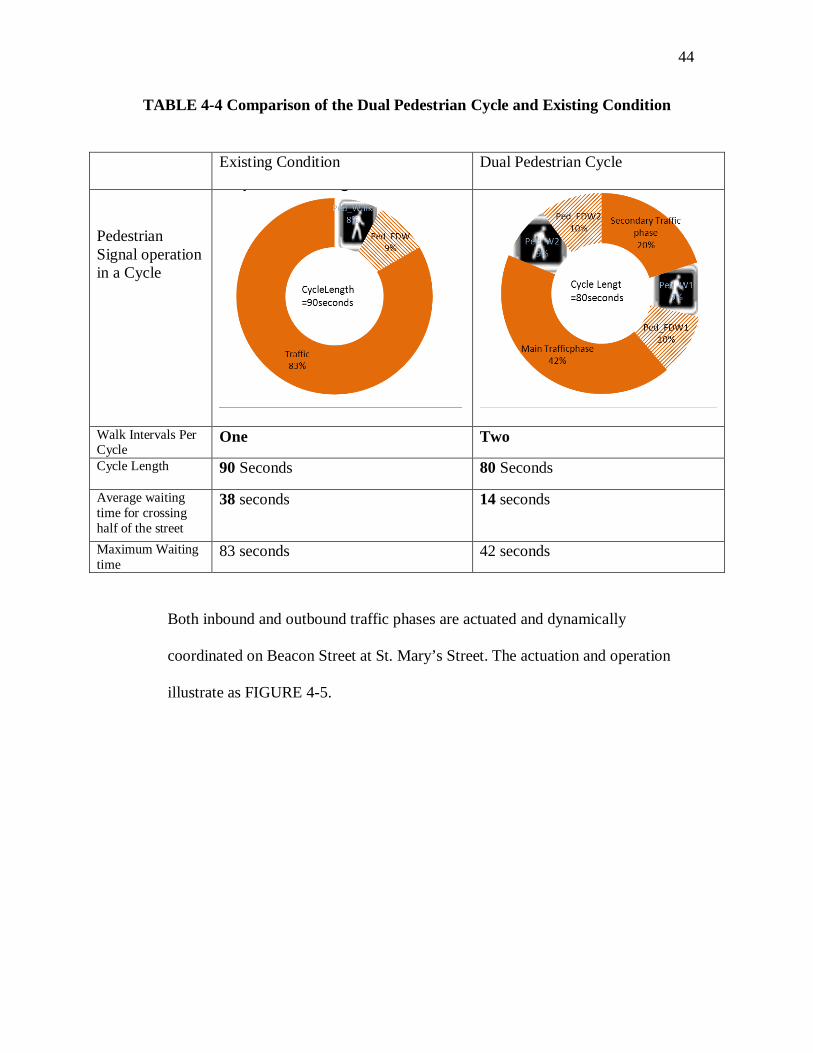
Both inbound and outbound traffic phases are actuated and dynamically
coordinated on Beacon Street at St. Mary’s Street. The actuation and operation
illustrate as FIGURE 4-5.
Existing Condition Dual Pedestrian Cycle
Pedestrian Signal operation in a Cycle
Walk Intervals Per Cycle
One Two
Cycle Length 90 Seconds 80 Seconds
Average waiting time for crossing half of the street
38 seconds 14 seconds
Maximum Waiting time
83 seconds 42 seconds
45
FDW BeaconW
BeaconCarlton
FDW BeaconW
St. Mary’ s St. Inbound
St. Mary’ s St. Outbound
Carlton St. at Beacon St.
Min Green
Gap/Max-out
Gap/Max-out
Gap/Max-out
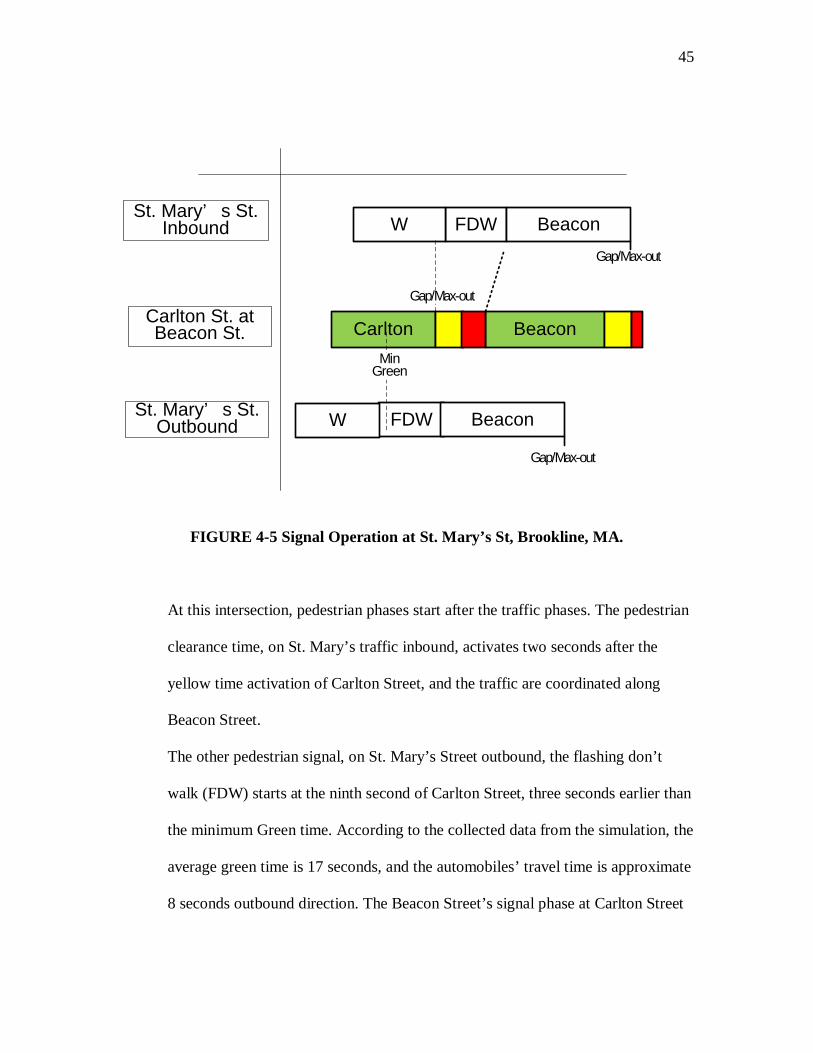
FIGURE 4-5 Signal Operation at St. Mary’s St, Brookline, MA.
At this intersection, pedestrian phases start after the traffic phases. The pedestrian
clearance time, on St. Mary’s traffic inbound, activates two seconds after the
yellow time activation of Carlton Street, and the traffic are coordinated along
Beacon Street.
The other pedestrian signal, on St. Mary’s Street outbound, the flashing don’t
walk (FDW) starts at the ninth second of Carlton Street, three seconds earlier than
the minimum Green time. According to the collected data from the simulation, the
average green time is 17 seconds, and the automobiles’ travel time is approximate
8 seconds outbound direction. The Beacon Street’s signal phase at Carlton Street
46
starts a few seconds later after the phase at St. Mary’s Street, offsets depending on
the actuation of the Carlton green phase.
TABLE 4-5 Improvements of the Pedestrian Signal Operation at St. Mary’s
Locations
Existing Improved Avg
Cycle (sec)
Walk Time (sec)
Avg Ped Delay (sec)
Avg Cycle (sec)
Walk Time (sec)
Avg Ped Delay (sec)
St. Mary's
St.
Inbound 90 7 38.27 56.3 18.5 12.69
Outbound 90 7 38.27 57.2 16.6 14.41
The simulated results are shown as TABLE4-5 above. Pedestrian Delay is
reduced more than 50 percent in this case.
4.2.2.2 Pedestrian Phase Concurrent with General traffic
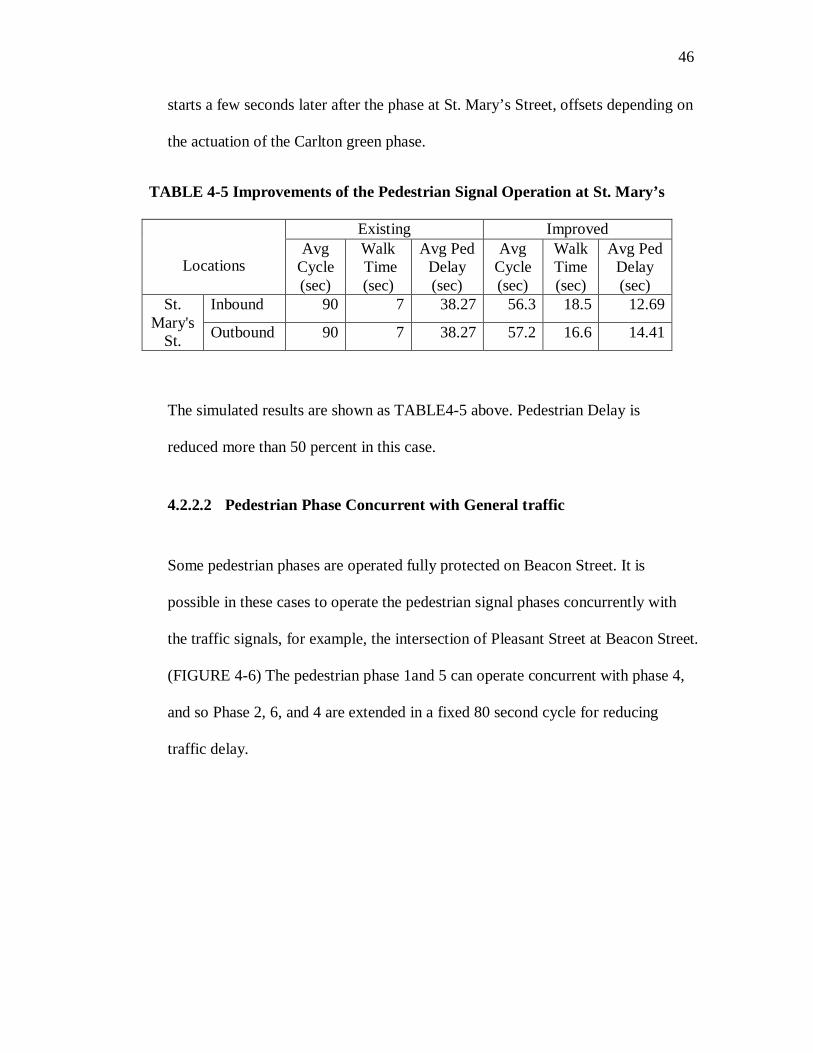
Some pedestrian phases are operated fully protected on Beacon Street. It is
possible in these cases to operate the pedestrian signal phases concurrently with
the traffic signals, for example, the intersection of Pleasant Street at Beacon Street.
(FIGURE 4-6) The pedestrian phase 1and 5 can operate concurrent with phase 4,
and so Phase 2, 6, and 4 are extended in a fixed 80 second cycle for reducing
traffic delay.
47
FIGURE 4-6 Existing Condition of the Signal Operation Illustration at Pleasant St,
Report of SYNCHRO 5
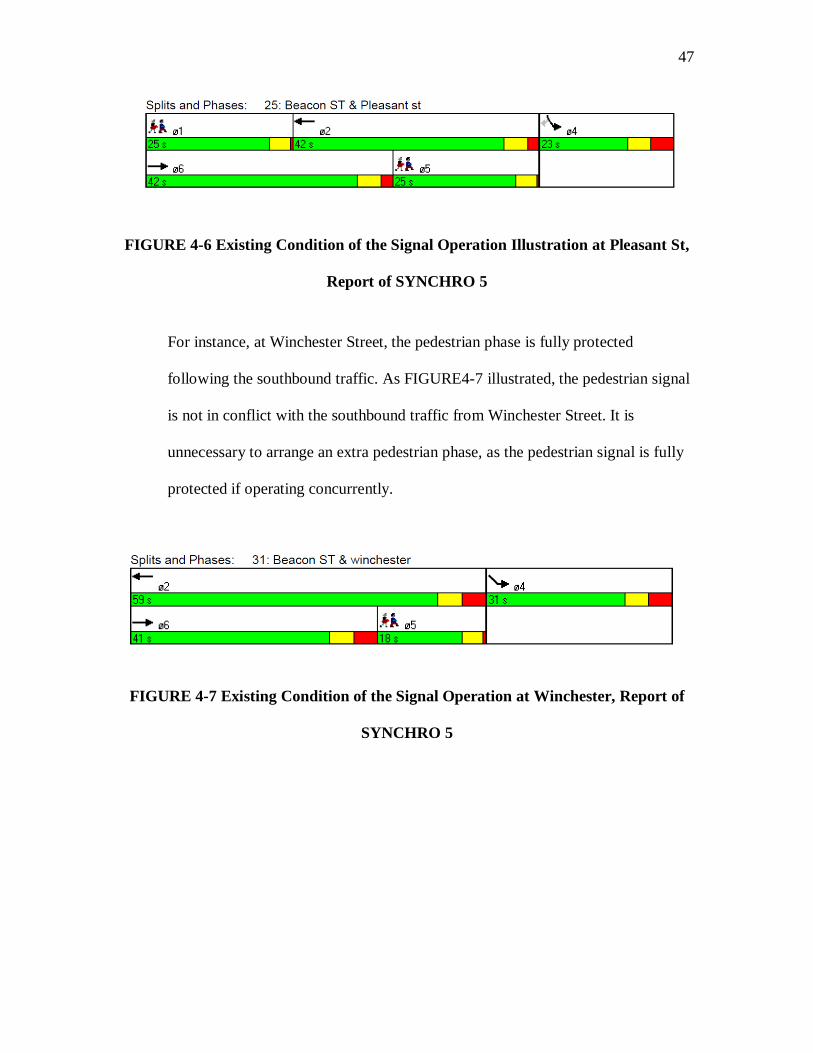
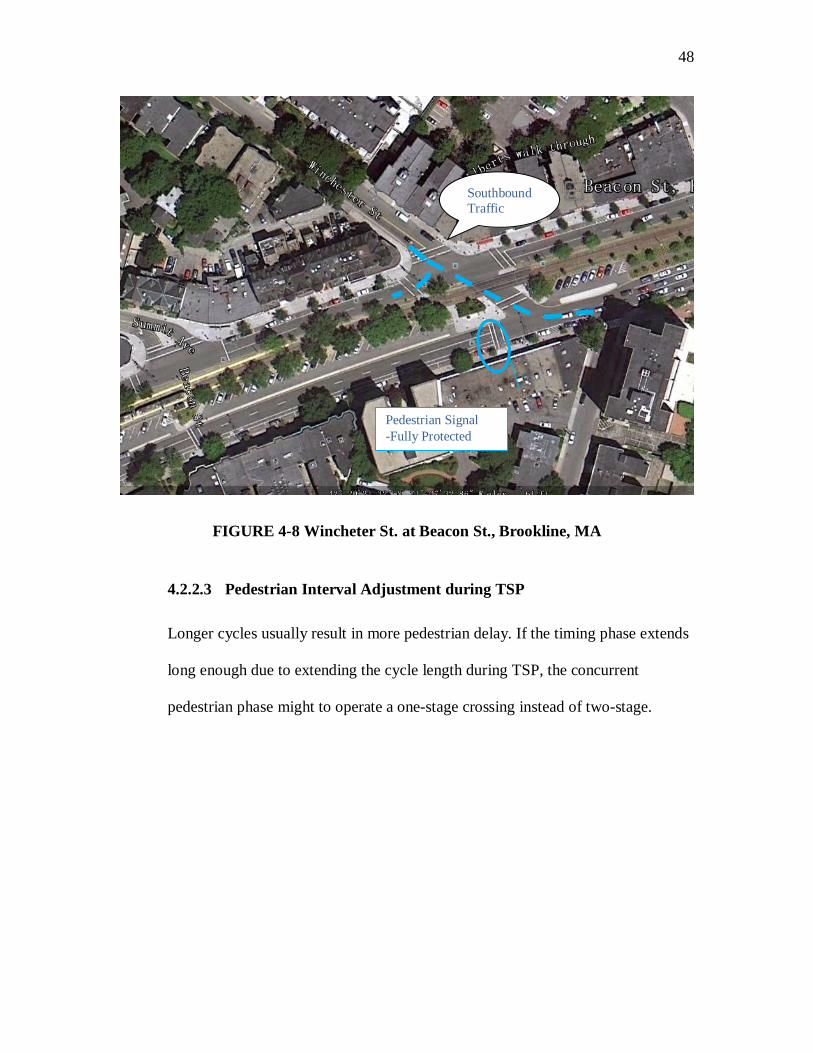
For instance, at Winchester Street, the pedestrian phase is fully protected
following the southbound traffic. As FIGURE4-7 illustrated, the pedestrian signal
is not in conflict with the southbound traffic from Winchester Street. It is
unnecessary to arrange an extra pedestrian phase, as the pedestrian signal is fully
protected if operating concurrently.
FIGURE 4-7 Existing Condition of the Signal Operation at Winchester, Report of
SYNCHRO 5
48
FIGURE 4-8 Wincheter St. at Beacon St., Brookline, MA
4.2.2.3 Pedestrian Interval Adjustment during TSP
Longer cycles usually result in more pedestrian delay. If the timing phase extends
long enough due to extending the cycle length during TSP, the concurrent
pedestrian phase might to operate a one-stage crossing instead of two-stage.
Pedestrian Signal -Fully Protected
Southbound Traffic
49
4.3 Advanced Transit Signal Priority Simulation
Improvements of the advanced TSP made using the existing general traffic conditions are
compared against improved general traffic conditions with and without utilizing
advanced transit signal priority, including pedestrian service. Transit signal priority
results are examined under four conditions:
• existing traffic conditions,
• traditional improvements to existing traffic conditions,
• advanced transit signal priority improvements to traffic conditions; and
• advanced transit signal priority utilizing.
4.3.1 Transit Signal Priority in the Traditional Way
Traditional TSP includes early green and green extension. (Chapter 2) The controller uses
Ring Barrier Controller (RBC) mode to simulate the signal operation in VISSIM, and the
transit signal is set to soft recall mode. Soft Recall Mode means the transit signal will
turn green concurrently with the general traffic signal when applicable, but the transit
signal will not call for signal priority unless the detector detects a transit-vehicle and
transmits the information to the controller. TSP is applied in both directions, and the first
detected vehicle gets the priority of TSP if two transit-vehicles request TSP at the same
intersection.
50
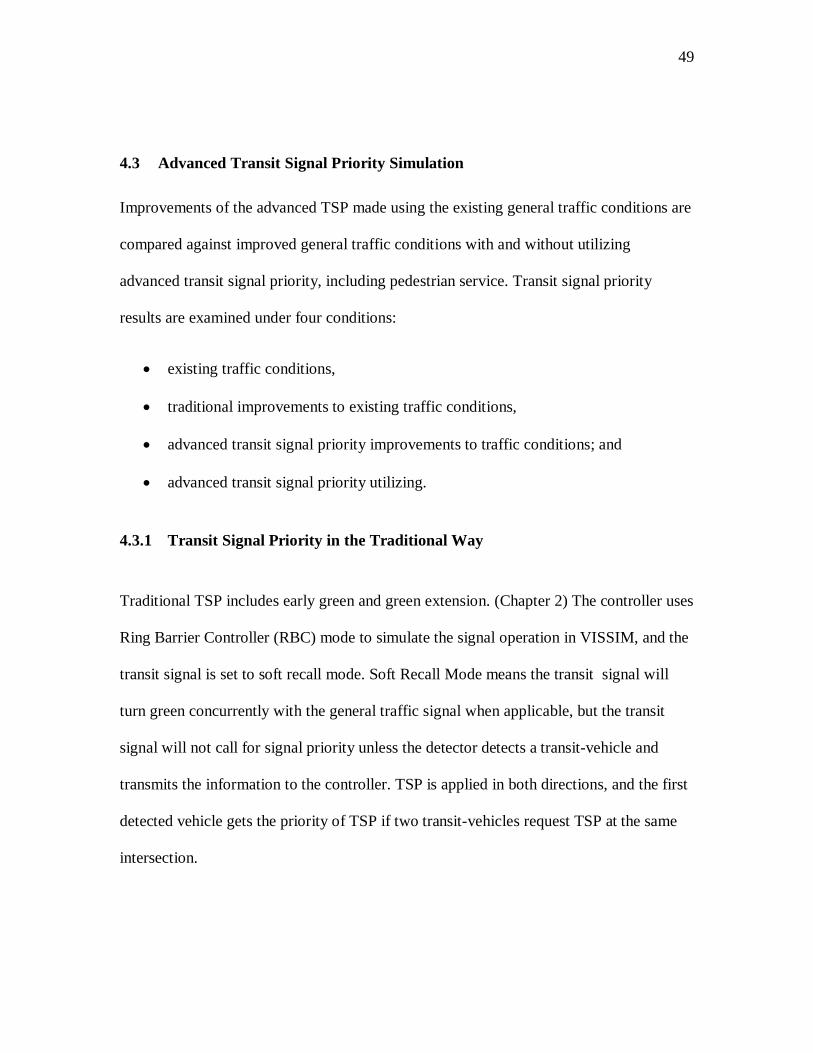
FIGURE 4-9 Check-in/Check-out Detector Location Illustration
In RBC mode, TSP application relies on a pair of check-in and check-out detectors.
When a transit-vehicle is detected at a check-in detector, the controller will receive the
transit-vehicle’s location information and start transit signal priority timing adjustment.
The controller will stop the priority application once the transit-vehicle is detected by the
check-out detector, and return to the private coordinated traffic signal operation. There is
only one pair of check-in and check-out detectors applied to transit signal priority
operation in the traditional way. (FIGURE 4-9) Check-in detectors will be set at locations
farthest distance away from the intersection, but the travel time should not exceed the
early green or extending green time limitations. Early green is difficult to implement in
the traditional way, as the limitation of the prediction. Check-out detectors are set
downstream of the intersections, used for transmitting the accomplishment information of
the transit priority to the controller. Max-out functionality will be setup on the Check-out
detector in case to assist in failure detection.
Check-out Detector
Check-in Detector
Transit-Track
51
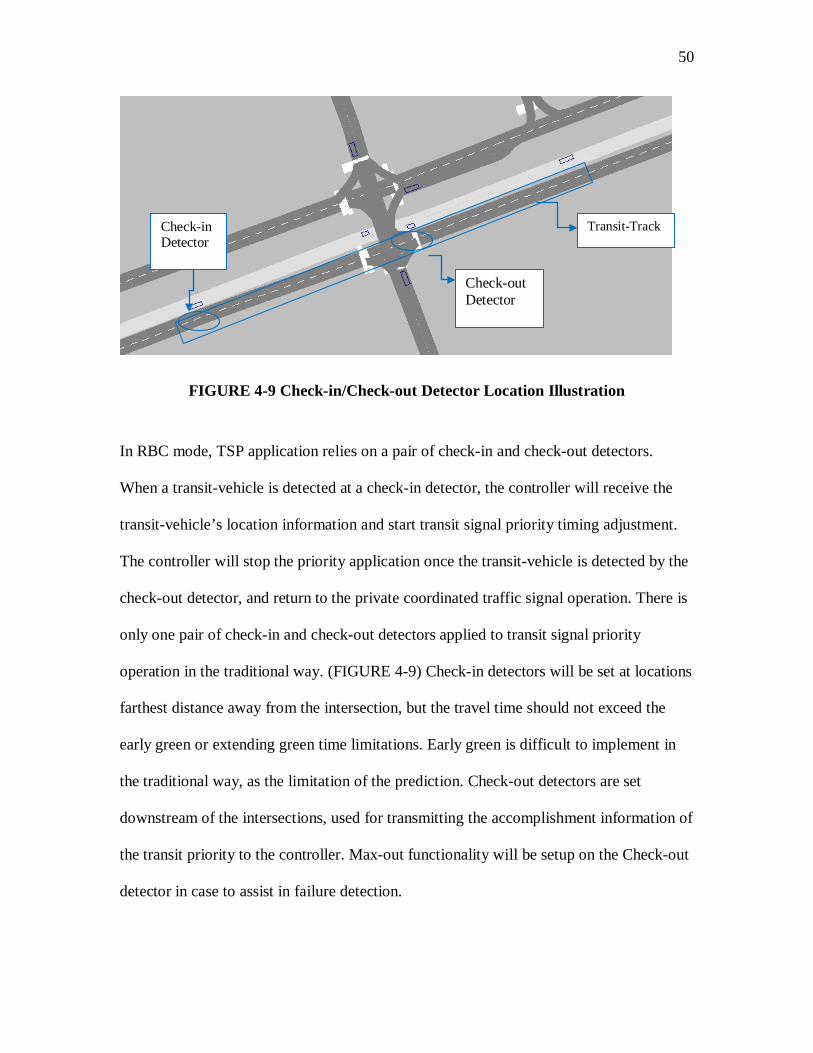
4.3.2 Coordination Recovery Effects on TSP and General traffic
For analyzing the results of the TSP recovery, the delay data is collected at the
coordinated segment on Beacon Street, from Marion Street to Charles Street. Simulated
results indicate that the delay effect on general traffic is reduced by approximately 19.5
percent after applying TSP with recovery compared to applying TSP without recovering.
(FIGURE 4-10)
FIGURE 4-10 Average Delays of Inbound General traffic at Coordination Zone1
The dynamic recovery has little influence on transit delay, according to the simulation
results. The average transit delays vary with the simulation seeds changing. The average
transit delays are similar with or without the recovery, but both are possibly larger or
smaller depending on the value of the random number seeds used. There is only 0.3
seconds difference under the generated seed of 42.
1Coordination Zone: the area of the coordinated intersections, from Marion Street to Charles Street.
0
20
40
60
80
100
120
140
With Recovery Without Recovery
52
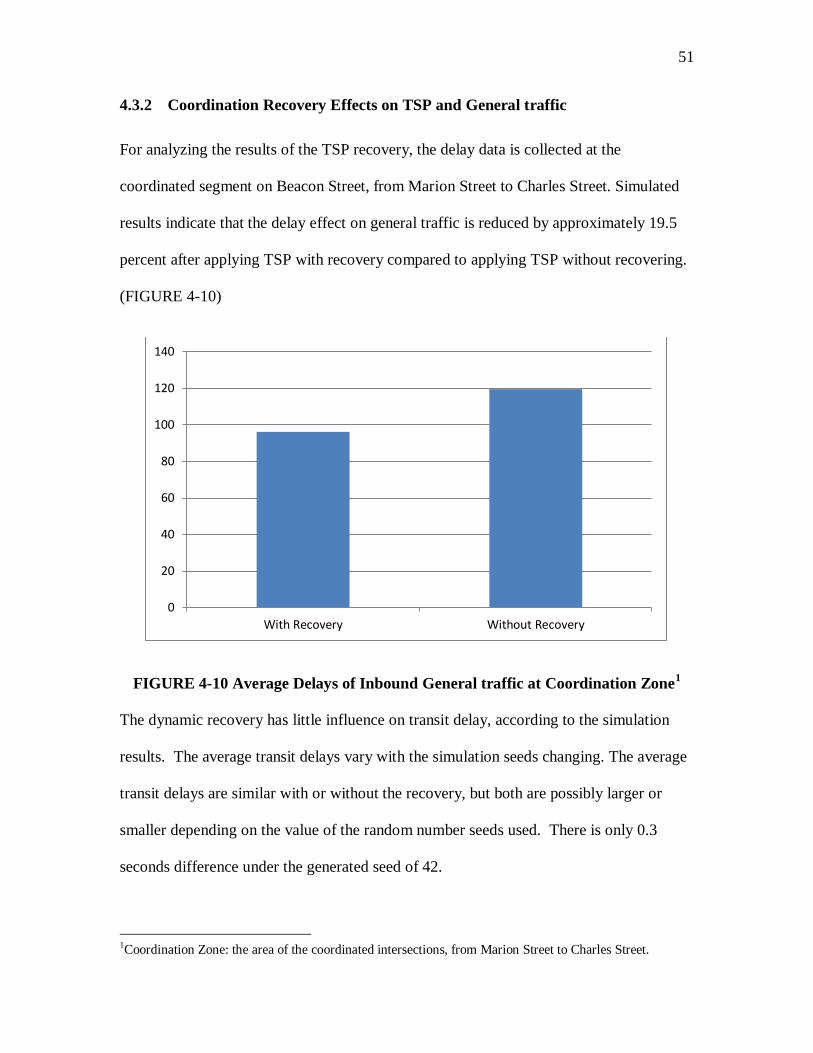
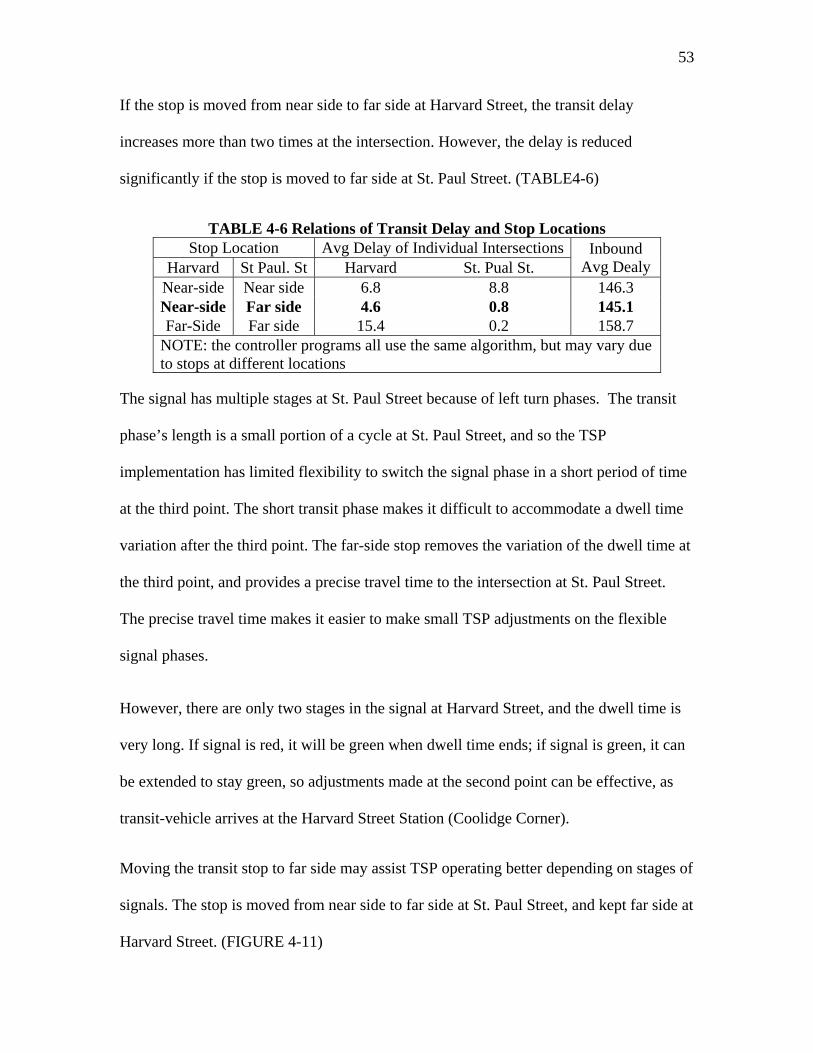
4.3.3 Near-side and Far-side Stop Location
There are two types of transit stop locations at intersections: near-side1 and far-side2. The
stops at Harvard Street and St. Paul Street are located at the near-side of the intersection
in the exiting condition. (FIGURE4-11) The experimental simulations are used to track
the stop locations’ effect on transit delay. Simulated results indicate that transit’s delay
time decreases at St. Paul Street and increases at Harvard Street, if these stops are moved
to far-side.
FIGURE 4-11 Minimum Delay Stop Locations at Harvard St. and St. Paul St., Inbound
1Near-side Stop: located upstream of the intersection, where the transit-vehicle serves passengers before getting through the intersection. 2Far-side Stop: located downstream of the intersection, where the transit-vehicle serves passengers after getting through the intersection.
Near-side Stop at Harvard St.
Far-side Stop at St. Paul St.
53
If the stop is moved from near side to far side at Harvard Street, the transit delay
increases more than two times at the intersection. However, the delay is reduced
significantly if the stop is moved to far side at St. Paul Street. (TABLE4-6)
TABLE 4-6 Relations of Transit Delay and Stop Locations Stop Location Avg Delay of Individual Intersections Inbound
Avg Dealy Harvard St Paul. St Harvard St. Pual St. Near-side Near side 6.8 8.8 146.3 Near-side Far side 4.6 0.8 145.1 Far-Side Far side 15.4 0.2 158.7
NOTE: the controller programs all use the same algorithm, but may vary due to stops at different locations
The signal has multiple stages at St. Paul Street because of left turn phases. The transit
phase’s length is a small portion of a cycle at St. Paul Street, and so the TSP
implementation has limited flexibility to switch the signal phase in a short period of time
at the third point. The short transit phase makes it difficult to accommodate a dwell time
variation after the third point. The far-side stop removes the variation of the dwell time at
the third point, and provides a precise travel time to the intersection at St. Paul Street.
The precise travel time makes it easier to make small TSP adjustments on the flexible
signal phases.
However, there are only two stages in the signal at Harvard Street, and the dwell time is
very long. If signal is red, it will be green when dwell time ends; if signal is green, it can
be extended to stay green, so adjustments made at the second point can be effective, as
transit-vehicle arrives at the Harvard Street Station (Coolidge Corner).
Moving the transit stop to far side may assist TSP operating better depending on stages of
signals. The stop is moved from near side to far side at St. Paul Street, and kept far side at
Harvard Street. (FIGURE 4-11)
54
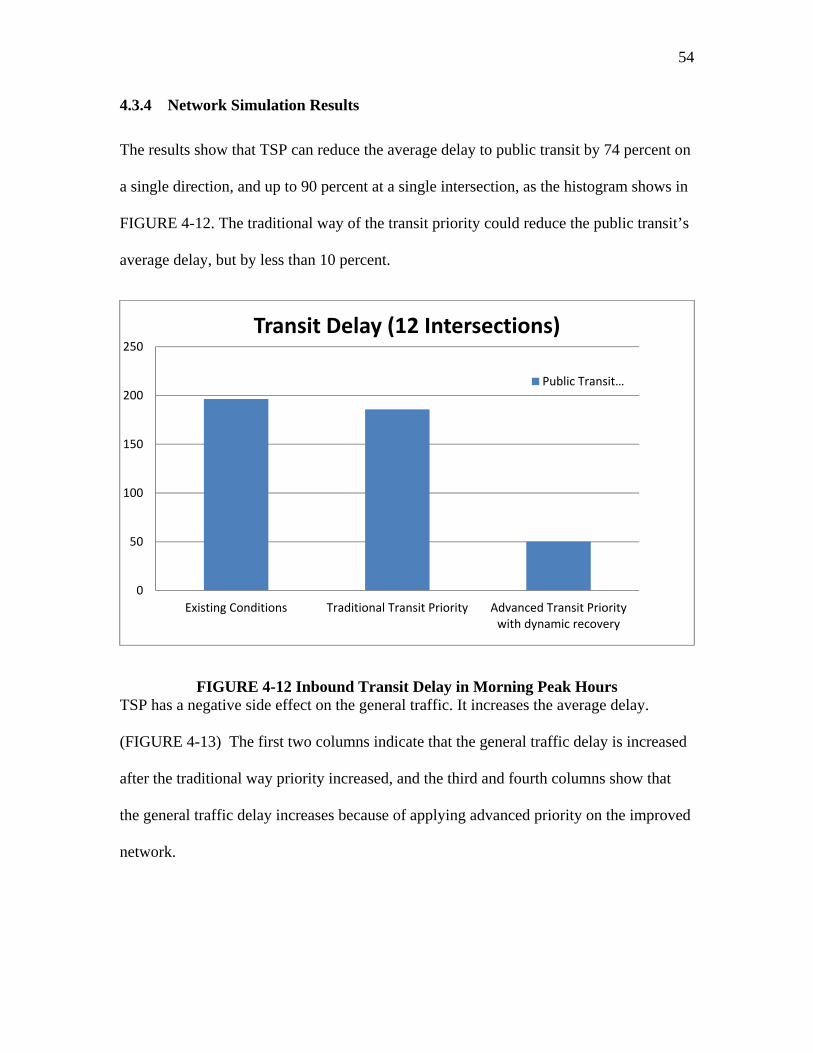
4.3.4 Network Simulation Results
The results show that TSP can reduce the average delay to public transit by 74 percent on
a single direction, and up to 90 percent at a single intersection, as the histogram shows in
FIGURE 4-12. The traditional way of the transit priority could reduce the public transit’s
average delay, but by less than 10 percent.
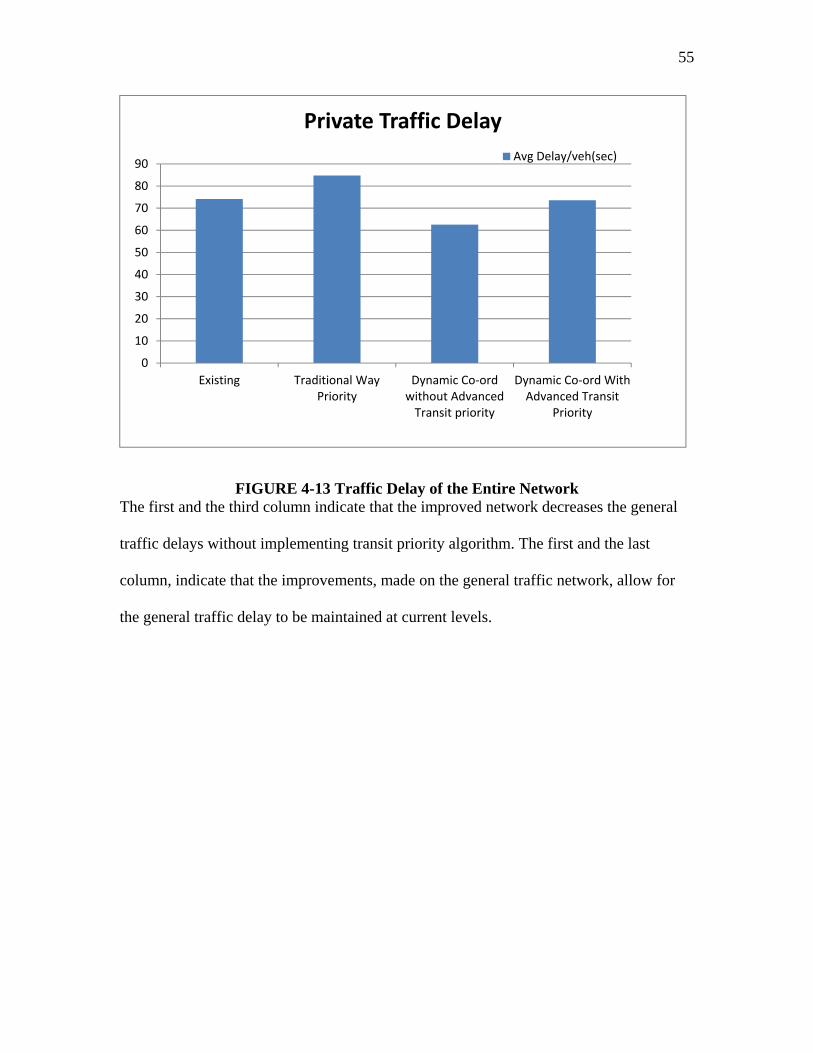
FIGURE 4-12 Inbound Transit Delay in Morning Peak Hours TSP has a negative side effect on the general traffic. It increases the average delay.
(FIGURE 4-13) The first two columns indicate that the general traffic delay is increased
after the traditional way priority increased, and the third and fourth columns show that
the general traffic delay increases because of applying advanced priority on the improved
network.
0
50
100
150
200
250
Existing Conditions Traditional Transit Priority Advanced Transit Prioritywith dynamic recovery
Transit Delay (12 Intersections)
Public Transit…
55
FIGURE 4-13 Traffic Delay of the Entire Network The first and the third column indicate that the improved network decreases the general
traffic delays without implementing transit priority algorithm. The first and the last
column, indicate that the improvements, made on the general traffic network, allow for
the general traffic delay to be maintained at current levels.
0
10
20
30
40
50
60
70
80
90
Existing Traditional WayPriority
Dynamic Co‐ordwithout AdvancedTransit priority
Dynamic Co‐ord WithAdvanced Transit
Priority
Private Traffic Delay
Avg Delay/veh(sec)
56
5 Conclusion
This project successfully developed an algorithm to improve TSP service that relies on
three-point detection. The case study is done on Beacon Street, Brookline, MA. The
traffic is simulated in VISSIM 5.2, and the results are collected and compared using
different conditions. The advanced TSP method proposed reduces public transit’s average
signal delay from approximately 140 seconds to 50 seconds in a single direction, which is
only 35 percent of the original delay. The general traffic delay can be kept at existing
levels after the improvements are implemented. The conclusions are summarized below:
• The TSP reduces the overall travel delay of public transit by 74 percent, and up to
90 percent at a single intersection;
• The improvements made to general traffic result in a 16 percent reduction of the
delay before transit priority is applied;
• The improvements made using the new control algorithms maintain the general
traffic delay at current levels after the transit priority is applied;
• Moving the transit stop from near side to far side may allow TSP to operate better
at multi-stage signals but less dwell time stations.
• Dynamic co-ordination of pedestrian signals with traffic reduces a pedestrians’
delay approximately 60 percent at affected signalized intersections.
• TSP implementation has the side effect of increasing general traffic delay, but
other improvements to traffic control are able to counter that effect.
57
In summary, advanced TSP has great potential to reduce transit delay, which is further
improved by early prediction. The side-effects of TSP on general traffic can be mitigated
by adjusting the signal splits. A pedestrian’s delay can be significantly reduced by double
cycling the pedestrian cycle. Although TSP using the three-point algorithm decreases the
transit delay in one direction significantly, it still has room for improvement. As
mentioned in the previous chapter, it is difficult to apply two-way signal priority. To
further develop this algorithm, a two-way application may benefit TSP further.
58
References
1. Federal Highway Administration. Traffic Signal Timing Manual. 2008. pp. 9-4.
2. Wadjas, Yann Racine. Adaptive Transit Signal Priority: Advanced Detection, Arrival Time Prediction, And Real-Time Phase-Length Adjustments Along an Arterial. 2002.
3. Massachusetts Bay Transportation Authority. [Online] http://www.mbta.com/schedules_and_maps/subway/.
4. Green Line Schedule from MBTA. [Online] http://www.mbta.com/templates/popup.asp?eid=9794.
5. Short or Long - Which Is Better? Probabilistic Approach to Cycle Length Optimization. Li, Lee D. Han and Jan-Mou. 2007, Transprotation Research Record, pp. 150-157.
6. Scheduling Buses to Take Advantage of Transit Signal Priority. Furth, Selman Z. Altun and Peter G. 2009, Transprotation Research Record, Vol. No.2111, pp. 50-59.
7. Improving Bus Travel Times with Passive Traffic Signal Co-ordinnation. M. Estrada, C. Trapote, M. Roca-Riu, and F. Robuste. Washington D.C : s.n., 2009, Transportation Research Record, Vol. No.2111, pp. 68-75.
8. Map, Google. Beacon St, Brookline, MA. [Online] http://maps.google.com/.
9. Beacon St, Brookline, MA, U.S. [Google Earth 6] 2011.
10. Transit Schedules of MBTA. [Online] http://www.mbta.com/uploadedFiles/Documents/Schedules_and_Maps/Subway/frequency-schedule.pdf.
11. Federal Highway Administration. Traffic Signal Timing Manual. 2008. pp. (9-4)-(9-5).
12. Ring Barrier Controller User Munal. s.l. : PTV, 2010.
13. Hangjue Li, Burak Cesme. Optimized Signal Time Plan Beacon St from St. Mary's St-Marion St, SYNCHRO 5 Report. Northeastern University, Boston : s.n., 2011.
14. Administration, Federal Highway. Traffic Signal Timming Manual. 2008. FHWA-HOP-08-024.
15. Signalized Intersections: Informational Guide. s.l. : Federal Highway Administration, p. 167.
16. Trafficware. [Online] http://www.trafficwareinc.com/transportation/product/synchro-8-0.

Appendix

Appendix I
Synchro Report of Existing Condition
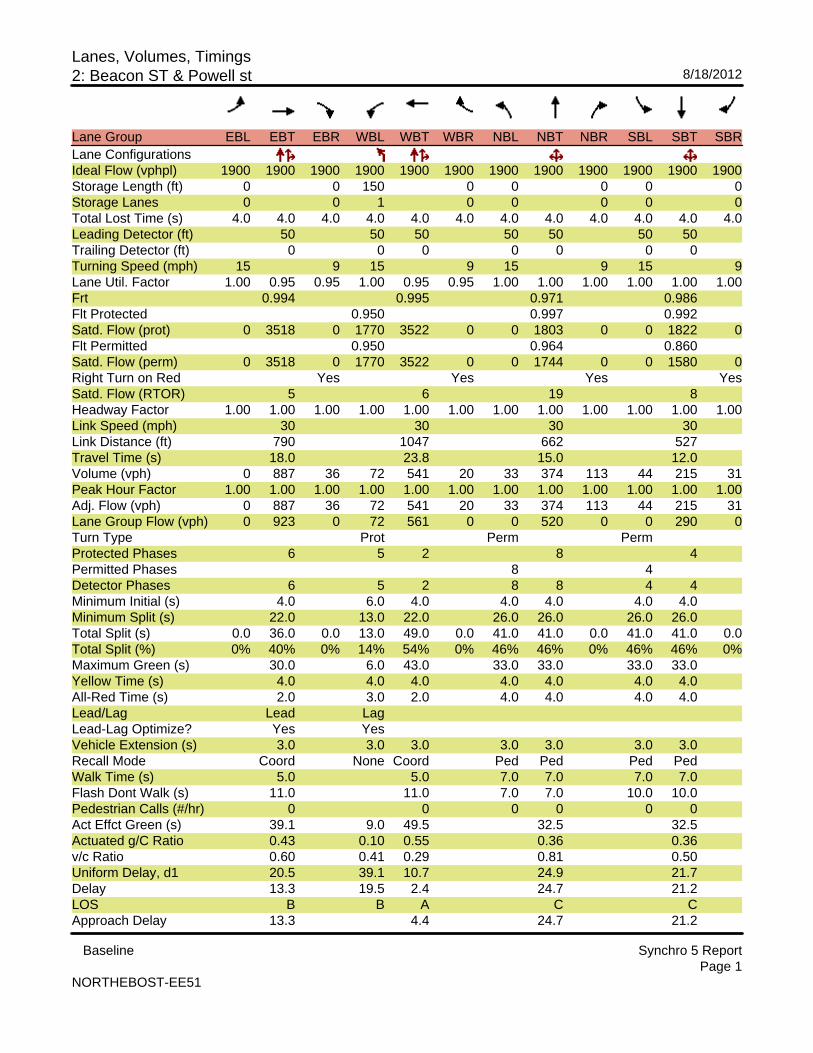
Lanes, Volumes, Timings2: Beacon ST & Powell st 8/18/2012
Baseline Synchro 5 ReportPage 1
NORTHEBOST-EE51
Lane Group EBL EBT EBR WBL WBT WBR NBL NBT NBR SBL SBT SBRLane ConfigurationsIdeal Flow (vphpl) 1900 1900 1900 1900 1900 1900 1900 1900 1900 1900 1900 1900Storage Length (ft) 0 0 150 0 0 0 0 0Storage Lanes 0 0 1 0 0 0 0 0Total Lost Time (s) 4.0 4.0 4.0 4.0 4.0 4.0 4.0 4.0 4.0 4.0 4.0 4.0Leading Detector (ft) 50 50 50 50 50 50 50Trailing Detector (ft) 0 0 0 0 0 0 0Turning Speed (mph) 15 9 15 9 15 9 15 9Lane Util. Factor 1.00 0.95 0.95 1.00 0.95 0.95 1.00 1.00 1.00 1.00 1.00 1.00Frt 0.994 0.995 0.971 0.986Flt Protected 0.950 0.997 0.992Satd. Flow (prot) 0 3518 0 1770 3522 0 0 1803 0 0 1822 0Flt Permitted 0.950 0.964 0.860Satd. Flow (perm) 0 3518 0 1770 3522 0 0 1744 0 0 1580 0Right Turn on Red Yes Yes Yes YesSatd. Flow (RTOR) 5 6 19 8Headway Factor 1.00 1.00 1.00 1.00 1.00 1.00 1.00 1.00 1.00 1.00 1.00 1.00Link Speed (mph) 30 30 30 30Link Distance (ft) 790 1047 662 527Travel Time (s) 18.0 23.8 15.0 12.0Volume (vph) 0 887 36 72 541 20 33 374 113 44 215 31Peak Hour Factor 1.00 1.00 1.00 1.00 1.00 1.00 1.00 1.00 1.00 1.00 1.00 1.00Adj. Flow (vph) 0 887 36 72 541 20 33 374 113 44 215 31Lane Group Flow (vph) 0 923 0 72 561 0 0 520 0 0 290 0Turn Type Prot Perm PermProtected Phases 6 5 2 8 4Permitted Phases 8 4Detector Phases 6 5 2 8 8 4 4Minimum Initial (s) 4.0 6.0 4.0 4.0 4.0 4.0 4.0Minimum Split (s) 22.0 13.0 22.0 26.0 26.0 26.0 26.0Total Split (s) 0.0 36.0 0.0 13.0 49.0 0.0 41.0 41.0 0.0 41.0 41.0 0.0Total Split (%) 0% 40% 0% 14% 54% 0% 46% 46% 0% 46% 46% 0%Maximum Green (s) 30.0 6.0 43.0 33.0 33.0 33.0 33.0Yellow Time (s) 4.0 4.0 4.0 4.0 4.0 4.0 4.0All-Red Time (s) 2.0 3.0 2.0 4.0 4.0 4.0 4.0Lead/Lag Lead LagLead-Lag Optimize? Yes YesVehicle Extension (s) 3.0 3.0 3.0 3.0 3.0 3.0 3.0Recall Mode Coord None Coord Ped Ped Ped PedWalk Time (s) 5.0 5.0 7.0 7.0 7.0 7.0Flash Dont Walk (s) 11.0 11.0 7.0 7.0 10.0 10.0Pedestrian Calls (#/hr) 0 0 0 0 0 0Act Effct Green (s) 39.1 9.0 49.5 32.5 32.5Actuated g/C Ratio 0.43 0.10 0.55 0.36 0.36v/c Ratio 0.60 0.41 0.29 0.81 0.50Uniform Delay, d1 20.5 39.1 10.7 24.9 21.7Delay 13.3 19.5 2.4 24.7 21.2LOS B B A C CApproach Delay 13.3 4.4 24.7 21.2
Lanes, Volumes, Timings2: Beacon ST & Powell st 8/18/2012
Baseline Synchro 5 ReportPage 2
NORTHEBOST-EE51
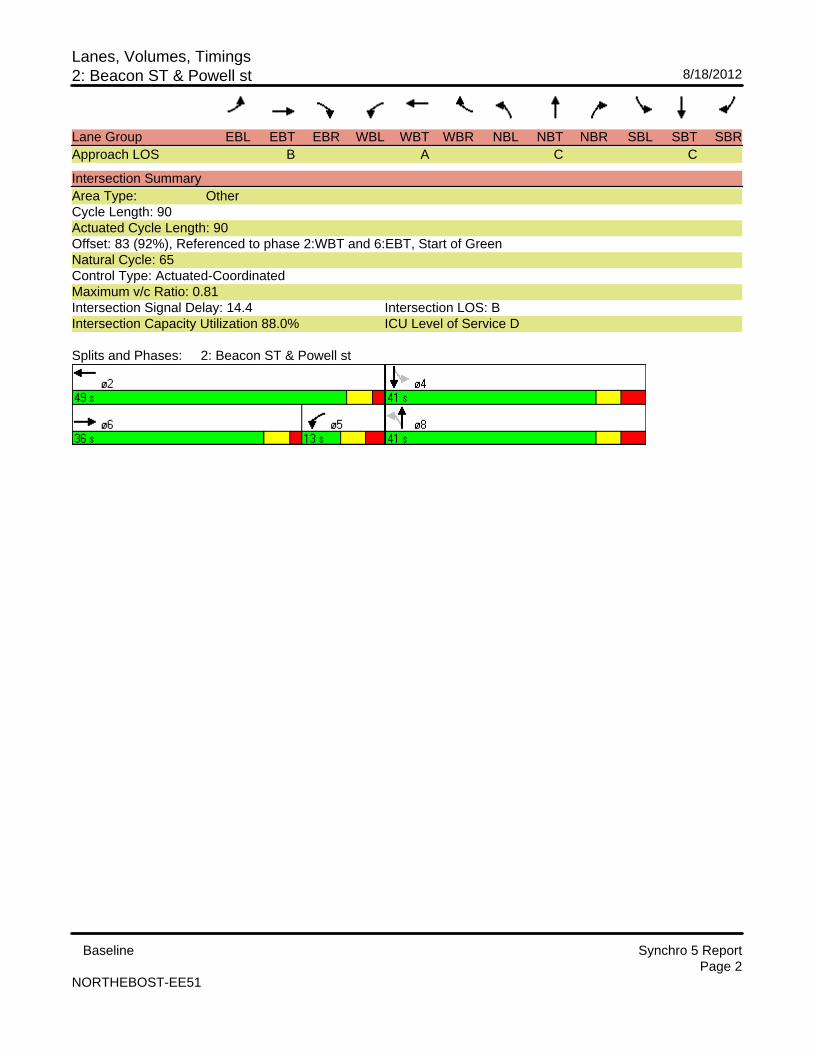
Lane Group EBL EBT EBR WBL WBT WBR NBL NBT NBR SBL SBT SBRApproach LOS B A C C
Intersection SummaryArea Type: OtherCycle Length: 90Actuated Cycle Length: 90Offset: 83 (92%), Referenced to phase 2:WBT and 6:EBT, Start of GreenNatural Cycle: 65Control Type: Actuated-CoordinatedMaximum v/c Ratio: 0.81Intersection Signal Delay: 14.4 Intersection LOS: BIntersection Capacity Utilization 88.0% ICU Level of Service D
Splits and Phases: 2: Beacon ST & Powell st
Lanes, Volumes, Timings6: Beacon ST & St. Mary 8/18/2012
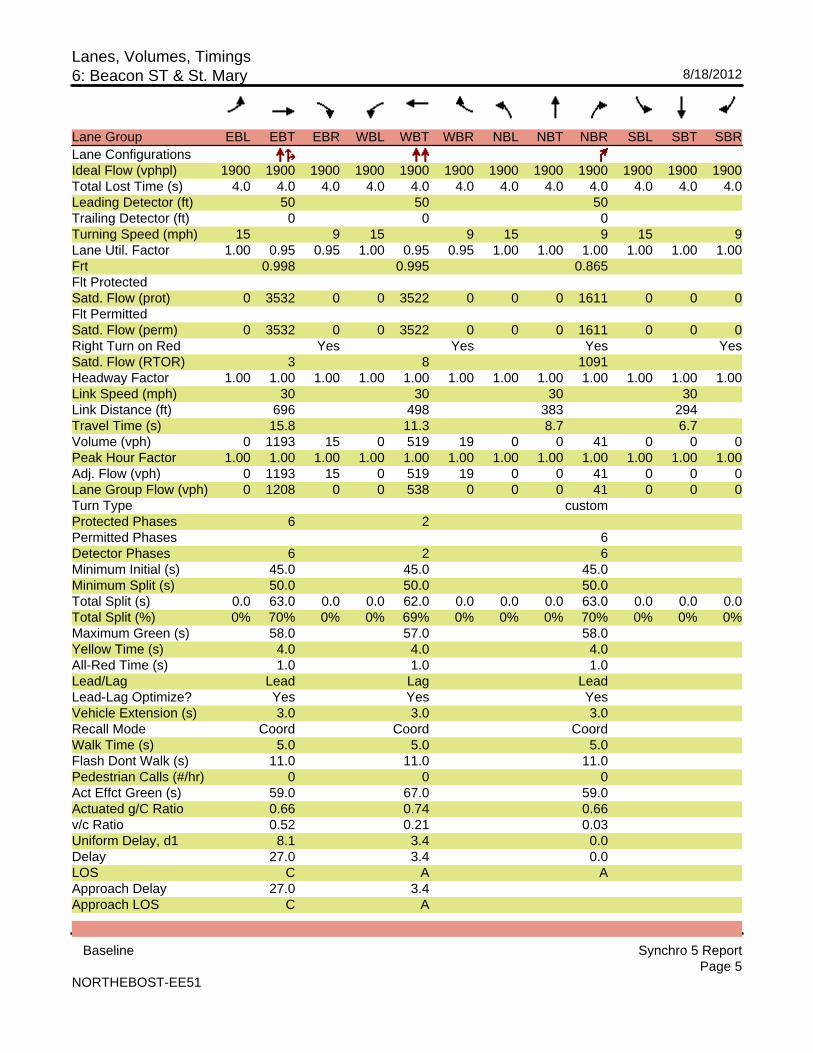
Baseline Synchro 5 ReportPage 5
NORTHEBOST-EE51
Lane Group EBL EBT EBR WBL WBT WBR NBL NBT NBR SBL SBT SBRLane ConfigurationsIdeal Flow (vphpl) 1900 1900 1900 1900 1900 1900 1900 1900 1900 1900 1900 1900Total Lost Time (s) 4.0 4.0 4.0 4.0 4.0 4.0 4.0 4.0 4.0 4.0 4.0 4.0Leading Detector (ft) 50 50 50Trailing Detector (ft) 0 0 0Turning Speed (mph) 15 9 15 9 15 9 15 9Lane Util. Factor 1.00 0.95 0.95 1.00 0.95 0.95 1.00 1.00 1.00 1.00 1.00 1.00Frt 0.998 0.995 0.865Flt ProtectedSatd. Flow (prot) 0 3532 0 0 3522 0 0 0 1611 0 0 0Flt PermittedSatd. Flow (perm) 0 3532 0 0 3522 0 0 0 1611 0 0 0Right Turn on Red Yes Yes Yes YesSatd. Flow (RTOR) 3 8 1091Headway Factor 1.00 1.00 1.00 1.00 1.00 1.00 1.00 1.00 1.00 1.00 1.00 1.00Link Speed (mph) 30 30 30 30Link Distance (ft) 696 498 383 294Travel Time (s) 15.8 11.3 8.7 6.7Volume (vph) 0 1193 15 0 519 19 0 0 41 0 0 0Peak Hour Factor 1.00 1.00 1.00 1.00 1.00 1.00 1.00 1.00 1.00 1.00 1.00 1.00Adj. Flow (vph) 0 1193 15 0 519 19 0 0 41 0 0 0Lane Group Flow (vph) 0 1208 0 0 538 0 0 0 41 0 0 0Turn Type customProtected Phases 6 2Permitted Phases 6Detector Phases 6 2 6Minimum Initial (s) 45.0 45.0 45.0Minimum Split (s) 50.0 50.0 50.0Total Split (s) 0.0 63.0 0.0 0.0 62.0 0.0 0.0 0.0 63.0 0.0 0.0 0.0Total Split (%) 0% 70% 0% 0% 69% 0% 0% 0% 70% 0% 0% 0%Maximum Green (s) 58.0 57.0 58.0Yellow Time (s) 4.0 4.0 4.0All-Red Time (s) 1.0 1.0 1.0Lead/Lag Lead Lag LeadLead-Lag Optimize? Yes Yes YesVehicle Extension (s) 3.0 3.0 3.0Recall Mode Coord Coord CoordWalk Time (s) 5.0 5.0 5.0Flash Dont Walk (s) 11.0 11.0 11.0Pedestrian Calls (#/hr) 0 0 0Act Effct Green (s) 59.0 67.0 59.0Actuated g/C Ratio 0.66 0.74 0.66v/c Ratio 0.52 0.21 0.03Uniform Delay, d1 8.1 3.4 0.0Delay 27.0 3.4 0.0LOS C A AApproach Delay 27.0 3.4Approach LOS C A
Lanes, Volumes, Timings6: Beacon ST & St. Mary 8/18/2012
Baseline Synchro 5 ReportPage 6
NORTHEBOST-EE51
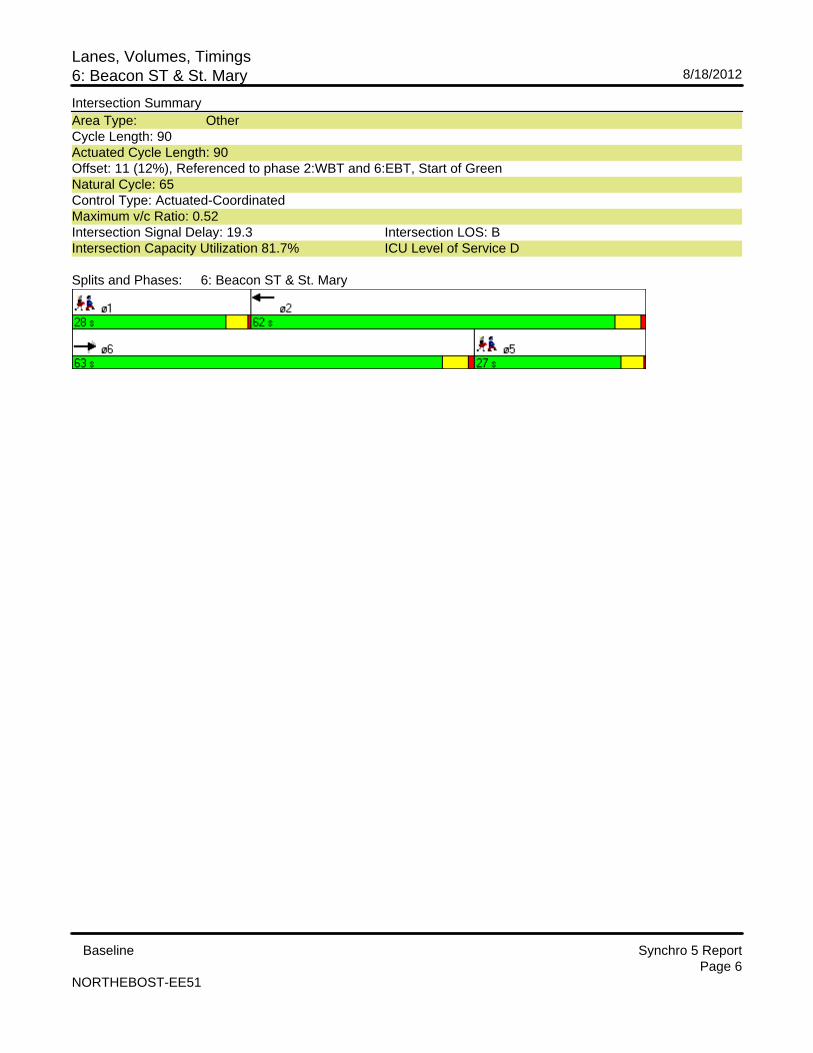
Intersection SummaryArea Type: OtherCycle Length: 90Actuated Cycle Length: 90Offset: 11 (12%), Referenced to phase 2:WBT and 6:EBT, Start of GreenNatural Cycle: 65Control Type: Actuated-CoordinatedMaximum v/c Ratio: 0.52Intersection Signal Delay: 19.3 Intersection LOS: BIntersection Capacity Utilization 81.7% ICU Level of Service D
Splits and Phases: 6: Beacon ST & St. Mary
Lanes, Volumes, Timings6: Beacon ST & St. Mary 8/18/2012
Baseline Synchro 5 ReportPage 7
NORTHEBOST-EE51
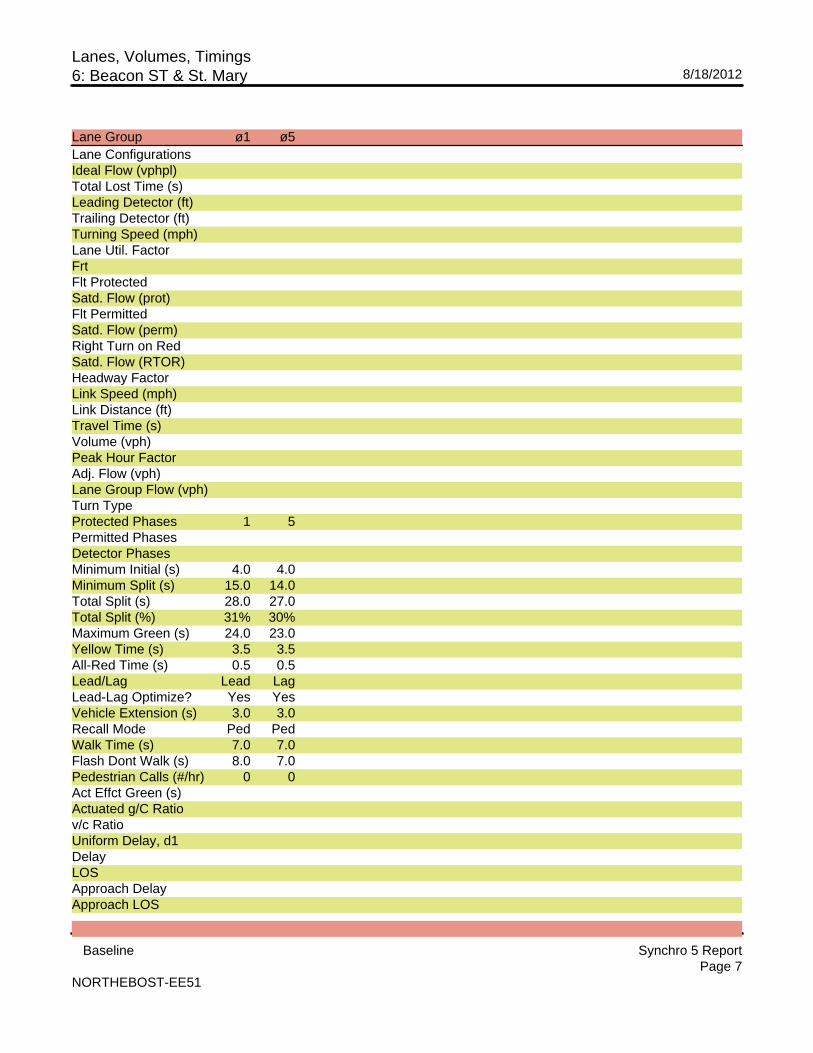
Lane Group ø1 ø5Lane ConfigurationsIdeal Flow (vphpl)Total Lost Time (s)Leading Detector (ft)Trailing Detector (ft)Turning Speed (mph)Lane Util. FactorFrtFlt ProtectedSatd. Flow (prot)Flt PermittedSatd. Flow (perm)Right Turn on RedSatd. Flow (RTOR)Headway FactorLink Speed (mph)Link Distance (ft)Travel Time (s)Volume (vph)Peak Hour FactorAdj. Flow (vph)Lane Group Flow (vph)Turn TypeProtected Phases 1 5Permitted PhasesDetector PhasesMinimum Initial (s) 4.0 4.0Minimum Split (s) 15.0 14.0Total Split (s) 28.0 27.0Total Split (%) 31% 30%Maximum Green (s) 24.0 23.0Yellow Time (s) 3.5 3.5All-Red Time (s) 0.5 0.5Lead/Lag Lead LagLead-Lag Optimize? Yes YesVehicle Extension (s) 3.0 3.0Recall Mode Ped PedWalk Time (s) 7.0 7.0Flash Dont Walk (s) 8.0 7.0Pedestrian Calls (#/hr) 0 0Act Effct Green (s)Actuated g/C Ratiov/c RatioUniform Delay, d1DelayLOSApproach DelayApproach LOS
Lanes, Volumes, Timings6: Beacon ST & St. Mary 8/18/2012
Baseline Synchro 5 ReportPage 8
NORTHEBOST-EE51
Intersection Summary
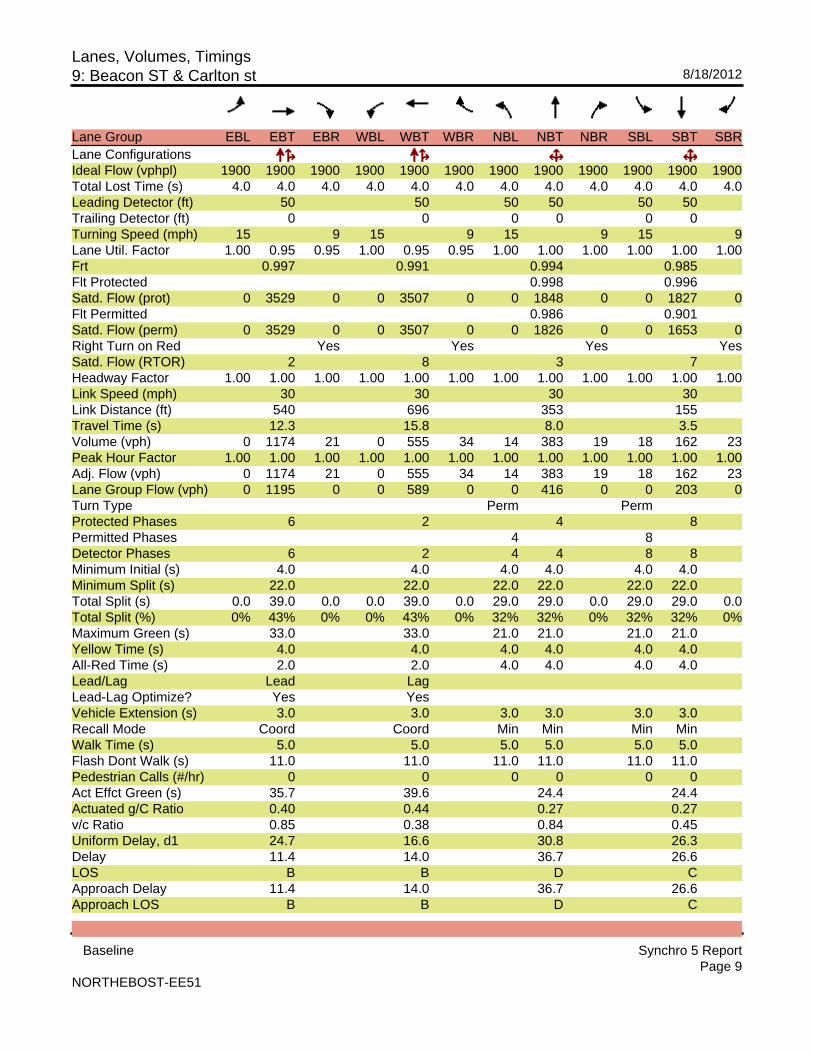
Lanes, Volumes, Timings9: Beacon ST & Carlton st 8/18/2012
Baseline Synchro 5 ReportPage 9
NORTHEBOST-EE51
Lane Group EBL EBT EBR WBL WBT WBR NBL NBT NBR SBL SBT SBRLane ConfigurationsIdeal Flow (vphpl) 1900 1900 1900 1900 1900 1900 1900 1900 1900 1900 1900 1900Total Lost Time (s) 4.0 4.0 4.0 4.0 4.0 4.0 4.0 4.0 4.0 4.0 4.0 4.0Leading Detector (ft) 50 50 50 50 50 50Trailing Detector (ft) 0 0 0 0 0 0Turning Speed (mph) 15 9 15 9 15 9 15 9Lane Util. Factor 1.00 0.95 0.95 1.00 0.95 0.95 1.00 1.00 1.00 1.00 1.00 1.00Frt 0.997 0.991 0.994 0.985Flt Protected 0.998 0.996Satd. Flow (prot) 0 3529 0 0 3507 0 0 1848 0 0 1827 0Flt Permitted 0.986 0.901Satd. Flow (perm) 0 3529 0 0 3507 0 0 1826 0 0 1653 0Right Turn on Red Yes Yes Yes YesSatd. Flow (RTOR) 2 8 3 7Headway Factor 1.00 1.00 1.00 1.00 1.00 1.00 1.00 1.00 1.00 1.00 1.00 1.00Link Speed (mph) 30 30 30 30Link Distance (ft) 540 696 353 155Travel Time (s) 12.3 15.8 8.0 3.5Volume (vph) 0 1174 21 0 555 34 14 383 19 18 162 23Peak Hour Factor 1.00 1.00 1.00 1.00 1.00 1.00 1.00 1.00 1.00 1.00 1.00 1.00Adj. Flow (vph) 0 1174 21 0 555 34 14 383 19 18 162 23Lane Group Flow (vph) 0 1195 0 0 589 0 0 416 0 0 203 0Turn Type Perm PermProtected Phases 6 2 4 8Permitted Phases 4 8Detector Phases 6 2 4 4 8 8Minimum Initial (s) 4.0 4.0 4.0 4.0 4.0 4.0Minimum Split (s) 22.0 22.0 22.0 22.0 22.0 22.0Total Split (s) 0.0 39.0 0.0 0.0 39.0 0.0 29.0 29.0 0.0 29.0 29.0 0.0Total Split (%) 0% 43% 0% 0% 43% 0% 32% 32% 0% 32% 32% 0%Maximum Green (s) 33.0 33.0 21.0 21.0 21.0 21.0Yellow Time (s) 4.0 4.0 4.0 4.0 4.0 4.0All-Red Time (s) 2.0 2.0 4.0 4.0 4.0 4.0Lead/Lag Lead LagLead-Lag Optimize? Yes YesVehicle Extension (s) 3.0 3.0 3.0 3.0 3.0 3.0Recall Mode Coord Coord Min Min Min MinWalk Time (s) 5.0 5.0 5.0 5.0 5.0 5.0Flash Dont Walk (s) 11.0 11.0 11.0 11.0 11.0 11.0Pedestrian Calls (#/hr) 0 0 0 0 0 0Act Effct Green (s) 35.7 39.6 24.4 24.4Actuated g/C Ratio 0.40 0.44 0.27 0.27v/c Ratio 0.85 0.38 0.84 0.45Uniform Delay, d1 24.7 16.6 30.8 26.3Delay 11.4 14.0 36.7 26.6LOS B B D CApproach Delay 11.4 14.0 36.7 26.6Approach LOS B B D C
Lanes, Volumes, Timings9: Beacon ST & Carlton st 8/18/2012
Baseline Synchro 5 ReportPage 10
NORTHEBOST-EE51
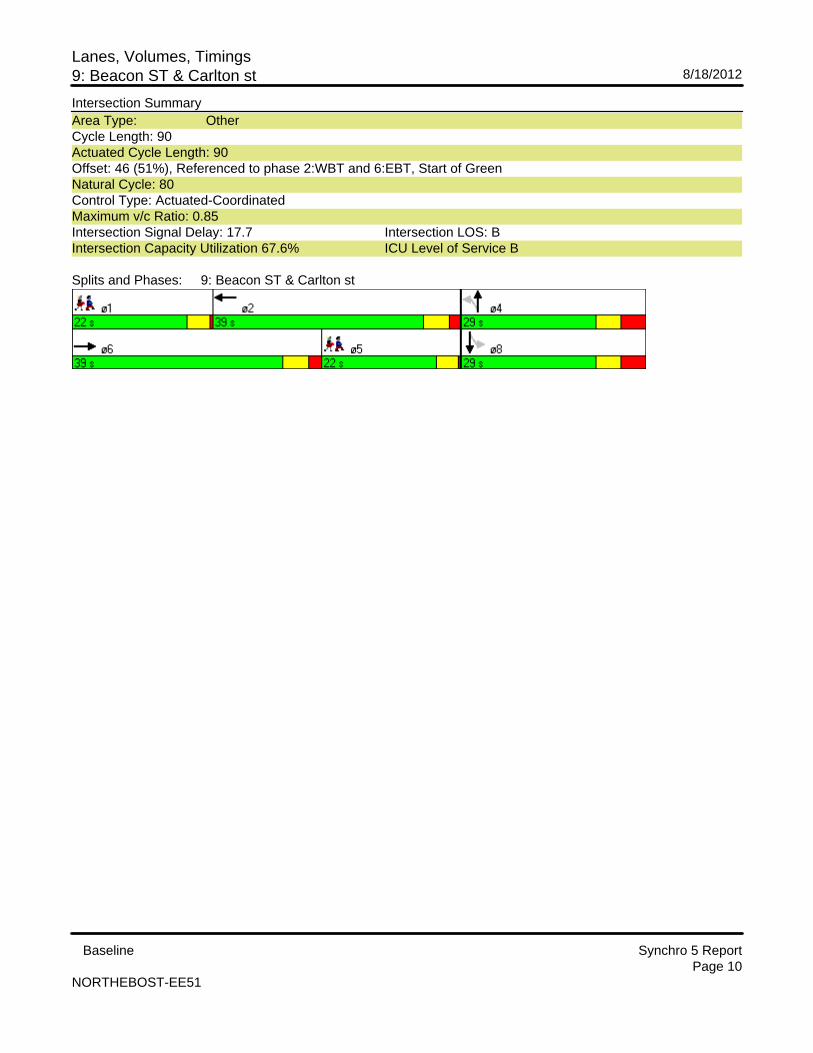
Intersection SummaryArea Type: OtherCycle Length: 90Actuated Cycle Length: 90Offset: 46 (51%), Referenced to phase 2:WBT and 6:EBT, Start of GreenNatural Cycle: 80Control Type: Actuated-CoordinatedMaximum v/c Ratio: 0.85Intersection Signal Delay: 17.7 Intersection LOS: BIntersection Capacity Utilization 67.6% ICU Level of Service B
Splits and Phases: 9: Beacon ST & Carlton st

Lanes, Volumes, Timings9: Beacon ST & Carlton st 8/18/2012
Baseline Synchro 5 ReportPage 11
NORTHEBOST-EE51
Lane Group ø1 ø5Lane ConfigurationsIdeal Flow (vphpl)Total Lost Time (s)Leading Detector (ft)Trailing Detector (ft)Turning Speed (mph)Lane Util. FactorFrtFlt ProtectedSatd. Flow (prot)Flt PermittedSatd. Flow (perm)Right Turn on RedSatd. Flow (RTOR)Headway FactorLink Speed (mph)Link Distance (ft)Travel Time (s)Volume (vph)Peak Hour FactorAdj. Flow (vph)Lane Group Flow (vph)Turn TypeProtected Phases 1 5Permitted PhasesDetector PhasesMinimum Initial (s) 4.0 4.0Minimum Split (s) 22.0 22.0Total Split (s) 22.0 22.0Total Split (%) 24% 24%Maximum Green (s) 18.0 18.0Yellow Time (s) 3.5 3.5All-Red Time (s) 0.5 0.5Lead/Lag Lead LagLead-Lag Optimize? Yes YesVehicle Extension (s) 3.0 3.0Recall Mode Ped PedWalk Time (s) 7.0 7.0Flash Dont Walk (s) 7.0 7.0Pedestrian Calls (#/hr) 0 0Act Effct Green (s)Actuated g/C Ratiov/c RatioUniform Delay, d1DelayLOSApproach DelayApproach LOS
Lanes, Volumes, Timings9: Beacon ST & Carlton st 8/18/2012
Baseline Synchro 5 ReportPage 12
NORTHEBOST-EE51
Intersection Summary
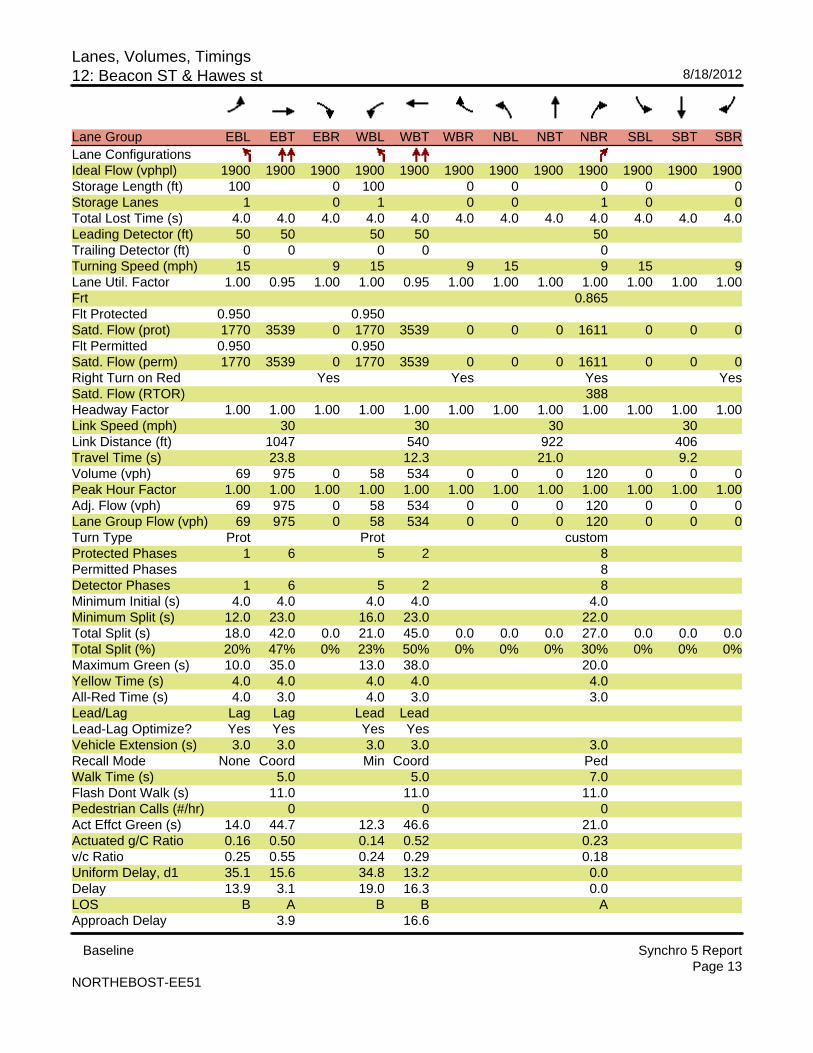
Lanes, Volumes, Timings12: Beacon ST & Hawes st 8/18/2012
Baseline Synchro 5 ReportPage 13
NORTHEBOST-EE51
Lane Group EBL EBT EBR WBL WBT WBR NBL NBT NBR SBL SBT SBRLane ConfigurationsIdeal Flow (vphpl) 1900 1900 1900 1900 1900 1900 1900 1900 1900 1900 1900 1900Storage Length (ft) 100 0 100 0 0 0 0 0Storage Lanes 1 0 1 0 0 1 0 0Total Lost Time (s) 4.0 4.0 4.0 4.0 4.0 4.0 4.0 4.0 4.0 4.0 4.0 4.0Leading Detector (ft) 50 50 50 50 50Trailing Detector (ft) 0 0 0 0 0Turning Speed (mph) 15 9 15 9 15 9 15 9Lane Util. Factor 1.00 0.95 1.00 1.00 0.95 1.00 1.00 1.00 1.00 1.00 1.00 1.00Frt 0.865Flt Protected 0.950 0.950Satd. Flow (prot) 1770 3539 0 1770 3539 0 0 0 1611 0 0 0Flt Permitted 0.950 0.950Satd. Flow (perm) 1770 3539 0 1770 3539 0 0 0 1611 0 0 0Right Turn on Red Yes Yes Yes YesSatd. Flow (RTOR) 388Headway Factor 1.00 1.00 1.00 1.00 1.00 1.00 1.00 1.00 1.00 1.00 1.00 1.00Link Speed (mph) 30 30 30 30Link Distance (ft) 1047 540 922 406Travel Time (s) 23.8 12.3 21.0 9.2Volume (vph) 69 975 0 58 534 0 0 0 120 0 0 0Peak Hour Factor 1.00 1.00 1.00 1.00 1.00 1.00 1.00 1.00 1.00 1.00 1.00 1.00Adj. Flow (vph) 69 975 0 58 534 0 0 0 120 0 0 0Lane Group Flow (vph) 69 975 0 58 534 0 0 0 120 0 0 0Turn Type Prot Prot customProtected Phases 1 6 5 2 8Permitted Phases 8Detector Phases 1 6 5 2 8Minimum Initial (s) 4.0 4.0 4.0 4.0 4.0Minimum Split (s) 12.0 23.0 16.0 23.0 22.0Total Split (s) 18.0 42.0 0.0 21.0 45.0 0.0 0.0 0.0 27.0 0.0 0.0 0.0Total Split (%) 20% 47% 0% 23% 50% 0% 0% 0% 30% 0% 0% 0%Maximum Green (s) 10.0 35.0 13.0 38.0 20.0Yellow Time (s) 4.0 4.0 4.0 4.0 4.0All-Red Time (s) 4.0 3.0 4.0 3.0 3.0Lead/Lag Lag Lag Lead LeadLead-Lag Optimize? Yes Yes Yes YesVehicle Extension (s) 3.0 3.0 3.0 3.0 3.0Recall Mode None Coord Min Coord PedWalk Time (s) 5.0 5.0 7.0Flash Dont Walk (s) 11.0 11.0 11.0Pedestrian Calls (#/hr) 0 0 0Act Effct Green (s) 14.0 44.7 12.3 46.6 21.0Actuated g/C Ratio 0.16 0.50 0.14 0.52 0.23v/c Ratio 0.25 0.55 0.24 0.29 0.18Uniform Delay, d1 35.1 15.6 34.8 13.2 0.0Delay 13.9 3.1 19.0 16.3 0.0LOS B A B B AApproach Delay 3.9 16.6
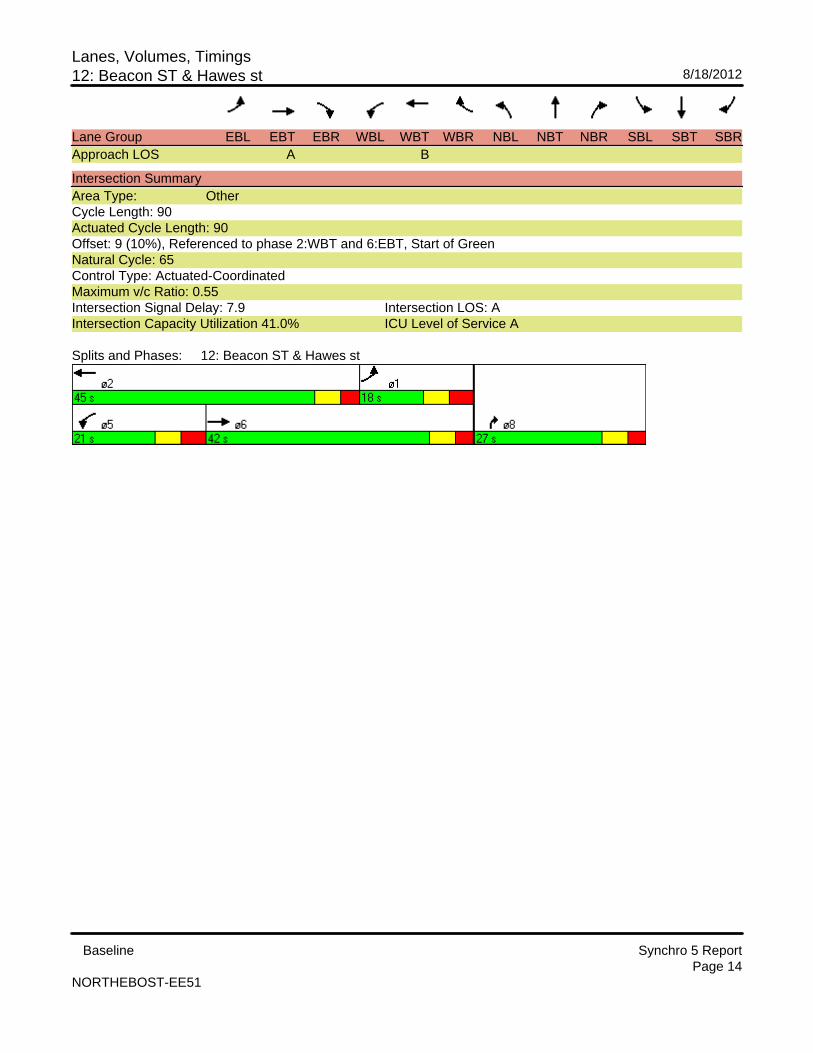
Lanes, Volumes, Timings12: Beacon ST & Hawes st 8/18/2012
Baseline Synchro 5 ReportPage 14
NORTHEBOST-EE51
Lane Group EBL EBT EBR WBL WBT WBR NBL NBT NBR SBL SBT SBRApproach LOS A B
Intersection SummaryArea Type: OtherCycle Length: 90Actuated Cycle Length: 90Offset: 9 (10%), Referenced to phase 2:WBT and 6:EBT, Start of GreenNatural Cycle: 65Control Type: Actuated-CoordinatedMaximum v/c Ratio: 0.55Intersection Signal Delay: 7.9 Intersection LOS: AIntersection Capacity Utilization 41.0% ICU Level of Service A
Splits and Phases: 12: Beacon ST & Hawes st
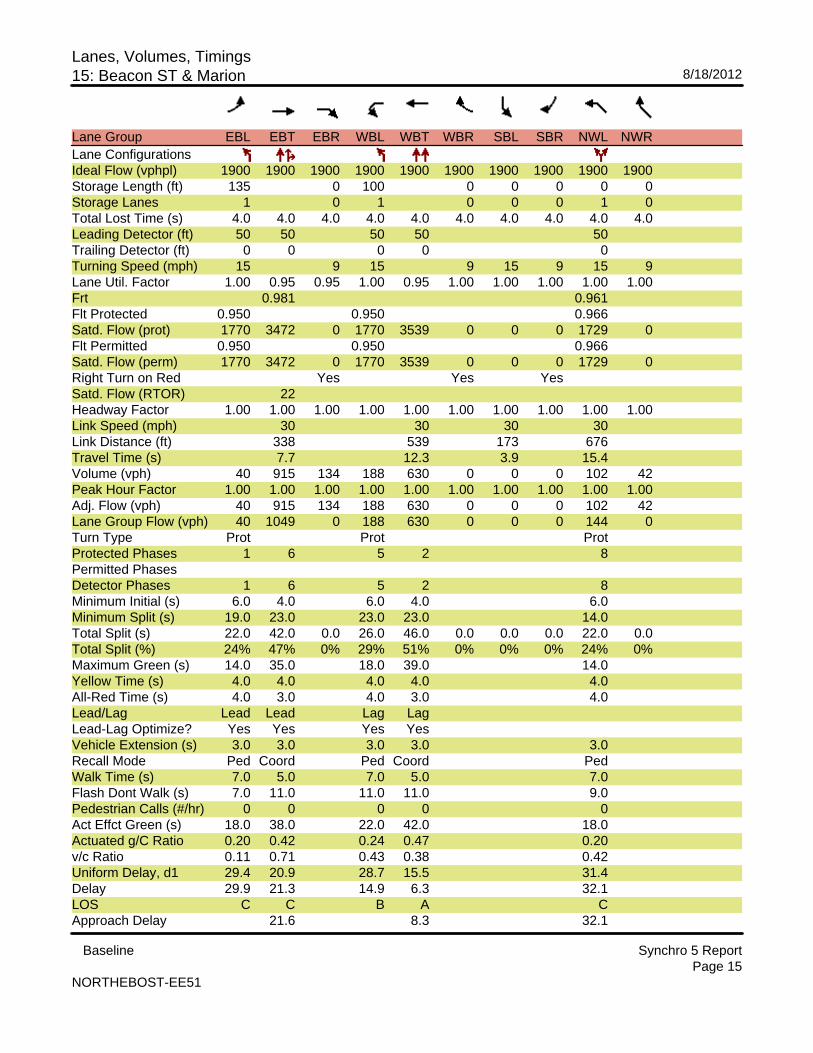
Lanes, Volumes, Timings15: Beacon ST & Marion 8/18/2012
Baseline Synchro 5 ReportPage 15
NORTHEBOST-EE51
Lane Group EBL EBT EBR WBL WBT WBR SBL SBR NWL NWRLane ConfigurationsIdeal Flow (vphpl) 1900 1900 1900 1900 1900 1900 1900 1900 1900 1900Storage Length (ft) 135 0 100 0 0 0 0 0Storage Lanes 1 0 1 0 0 0 1 0Total Lost Time (s) 4.0 4.0 4.0 4.0 4.0 4.0 4.0 4.0 4.0 4.0Leading Detector (ft) 50 50 50 50 50Trailing Detector (ft) 0 0 0 0 0Turning Speed (mph) 15 9 15 9 15 9 15 9Lane Util. Factor 1.00 0.95 0.95 1.00 0.95 1.00 1.00 1.00 1.00 1.00Frt 0.981 0.961Flt Protected 0.950 0.950 0.966Satd. Flow (prot) 1770 3472 0 1770 3539 0 0 0 1729 0Flt Permitted 0.950 0.950 0.966Satd. Flow (perm) 1770 3472 0 1770 3539 0 0 0 1729 0Right Turn on Red Yes Yes YesSatd. Flow (RTOR) 22Headway Factor 1.00 1.00 1.00 1.00 1.00 1.00 1.00 1.00 1.00 1.00Link Speed (mph) 30 30 30 30Link Distance (ft) 338 539 173 676Travel Time (s) 7.7 12.3 3.9 15.4Volume (vph) 40 915 134 188 630 0 0 0 102 42Peak Hour Factor 1.00 1.00 1.00 1.00 1.00 1.00 1.00 1.00 1.00 1.00Adj. Flow (vph) 40 915 134 188 630 0 0 0 102 42Lane Group Flow (vph) 40 1049 0 188 630 0 0 0 144 0Turn Type Prot Prot ProtProtected Phases 1 6 5 2 8Permitted PhasesDetector Phases 1 6 5 2 8Minimum Initial (s) 6.0 4.0 6.0 4.0 6.0Minimum Split (s) 19.0 23.0 23.0 23.0 14.0Total Split (s) 22.0 42.0 0.0 26.0 46.0 0.0 0.0 0.0 22.0 0.0Total Split (%) 24% 47% 0% 29% 51% 0% 0% 0% 24% 0%Maximum Green (s) 14.0 35.0 18.0 39.0 14.0Yellow Time (s) 4.0 4.0 4.0 4.0 4.0All-Red Time (s) 4.0 3.0 4.0 3.0 4.0Lead/Lag Lead Lead Lag LagLead-Lag Optimize? Yes Yes Yes YesVehicle Extension (s) 3.0 3.0 3.0 3.0 3.0Recall Mode Ped Coord Ped Coord PedWalk Time (s) 7.0 5.0 7.0 5.0 7.0Flash Dont Walk (s) 7.0 11.0 11.0 11.0 9.0Pedestrian Calls (#/hr) 0 0 0 0 0Act Effct Green (s) 18.0 38.0 22.0 42.0 18.0Actuated g/C Ratio 0.20 0.42 0.24 0.47 0.20v/c Ratio 0.11 0.71 0.43 0.38 0.42Uniform Delay, d1 29.4 20.9 28.7 15.5 31.4Delay 29.9 21.3 14.9 6.3 32.1LOS C C B A CApproach Delay 21.6 8.3 32.1
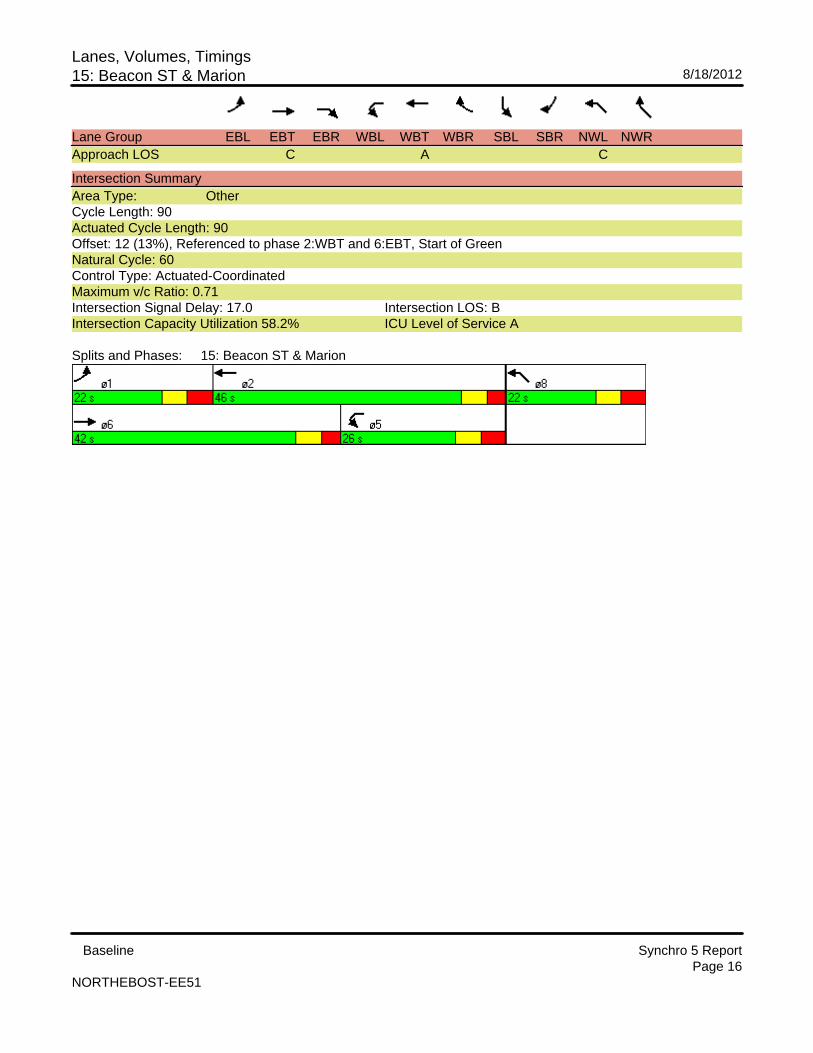
Lanes, Volumes, Timings15: Beacon ST & Marion 8/18/2012
Baseline Synchro 5 ReportPage 16
NORTHEBOST-EE51
Lane Group EBL EBT EBR WBL WBT WBR SBL SBR NWL NWRApproach LOS C A C
Intersection SummaryArea Type: OtherCycle Length: 90Actuated Cycle Length: 90Offset: 12 (13%), Referenced to phase 2:WBT and 6:EBT, Start of GreenNatural Cycle: 60Control Type: Actuated-CoordinatedMaximum v/c Ratio: 0.71Intersection Signal Delay: 17.0 Intersection LOS: BIntersection Capacity Utilization 58.2% ICU Level of Service A
Splits and Phases: 15: Beacon ST & Marion
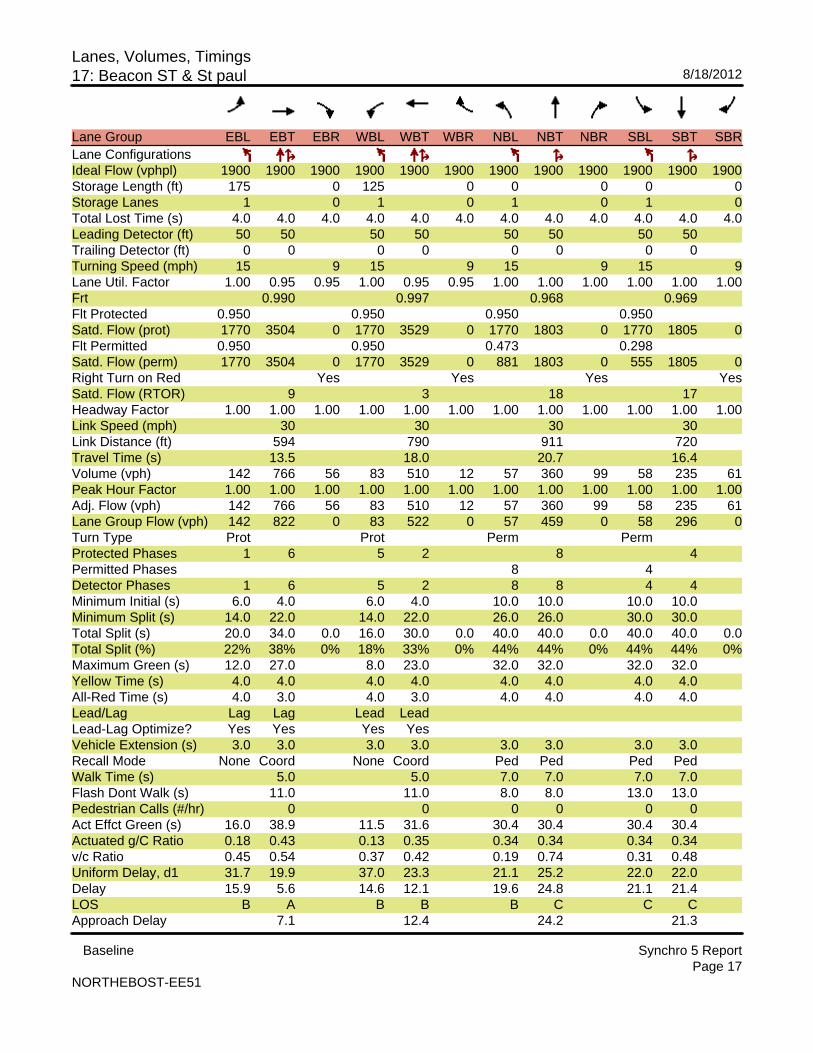
Lanes, Volumes, Timings17: Beacon ST & St paul 8/18/2012
Baseline Synchro 5 ReportPage 17
NORTHEBOST-EE51
Lane Group EBL EBT EBR WBL WBT WBR NBL NBT NBR SBL SBT SBRLane ConfigurationsIdeal Flow (vphpl) 1900 1900 1900 1900 1900 1900 1900 1900 1900 1900 1900 1900Storage Length (ft) 175 0 125 0 0 0 0 0Storage Lanes 1 0 1 0 1 0 1 0Total Lost Time (s) 4.0 4.0 4.0 4.0 4.0 4.0 4.0 4.0 4.0 4.0 4.0 4.0Leading Detector (ft) 50 50 50 50 50 50 50 50Trailing Detector (ft) 0 0 0 0 0 0 0 0Turning Speed (mph) 15 9 15 9 15 9 15 9Lane Util. Factor 1.00 0.95 0.95 1.00 0.95 0.95 1.00 1.00 1.00 1.00 1.00 1.00Frt 0.990 0.997 0.968 0.969Flt Protected 0.950 0.950 0.950 0.950Satd. Flow (prot) 1770 3504 0 1770 3529 0 1770 1803 0 1770 1805 0Flt Permitted 0.950 0.950 0.473 0.298Satd. Flow (perm) 1770 3504 0 1770 3529 0 881 1803 0 555 1805 0Right Turn on Red Yes Yes Yes YesSatd. Flow (RTOR) 9 3 18 17Headway Factor 1.00 1.00 1.00 1.00 1.00 1.00 1.00 1.00 1.00 1.00 1.00 1.00Link Speed (mph) 30 30 30 30Link Distance (ft) 594 790 911 720Travel Time (s) 13.5 18.0 20.7 16.4Volume (vph) 142 766 56 83 510 12 57 360 99 58 235 61Peak Hour Factor 1.00 1.00 1.00 1.00 1.00 1.00 1.00 1.00 1.00 1.00 1.00 1.00Adj. Flow (vph) 142 766 56 83 510 12 57 360 99 58 235 61Lane Group Flow (vph) 142 822 0 83 522 0 57 459 0 58 296 0Turn Type Prot Prot Perm PermProtected Phases 1 6 5 2 8 4Permitted Phases 8 4Detector Phases 1 6 5 2 8 8 4 4Minimum Initial (s) 6.0 4.0 6.0 4.0 10.0 10.0 10.0 10.0Minimum Split (s) 14.0 22.0 14.0 22.0 26.0 26.0 30.0 30.0Total Split (s) 20.0 34.0 0.0 16.0 30.0 0.0 40.0 40.0 0.0 40.0 40.0 0.0Total Split (%) 22% 38% 0% 18% 33% 0% 44% 44% 0% 44% 44% 0%Maximum Green (s) 12.0 27.0 8.0 23.0 32.0 32.0 32.0 32.0Yellow Time (s) 4.0 4.0 4.0 4.0 4.0 4.0 4.0 4.0All-Red Time (s) 4.0 3.0 4.0 3.0 4.0 4.0 4.0 4.0Lead/Lag Lag Lag Lead LeadLead-Lag Optimize? Yes Yes Yes YesVehicle Extension (s) 3.0 3.0 3.0 3.0 3.0 3.0 3.0 3.0Recall Mode None Coord None Coord Ped Ped Ped PedWalk Time (s) 5.0 5.0 7.0 7.0 7.0 7.0Flash Dont Walk (s) 11.0 11.0 8.0 8.0 13.0 13.0Pedestrian Calls (#/hr) 0 0 0 0 0 0Act Effct Green (s) 16.0 38.9 11.5 31.6 30.4 30.4 30.4 30.4Actuated g/C Ratio 0.18 0.43 0.13 0.35 0.34 0.34 0.34 0.34v/c Ratio 0.45 0.54 0.37 0.42 0.19 0.74 0.31 0.48Uniform Delay, d1 31.7 19.9 37.0 23.3 21.1 25.2 22.0 22.0Delay 15.9 5.6 14.6 12.1 19.6 24.8 21.1 21.4LOS B A B B B C C CApproach Delay 7.1 12.4 24.2 21.3
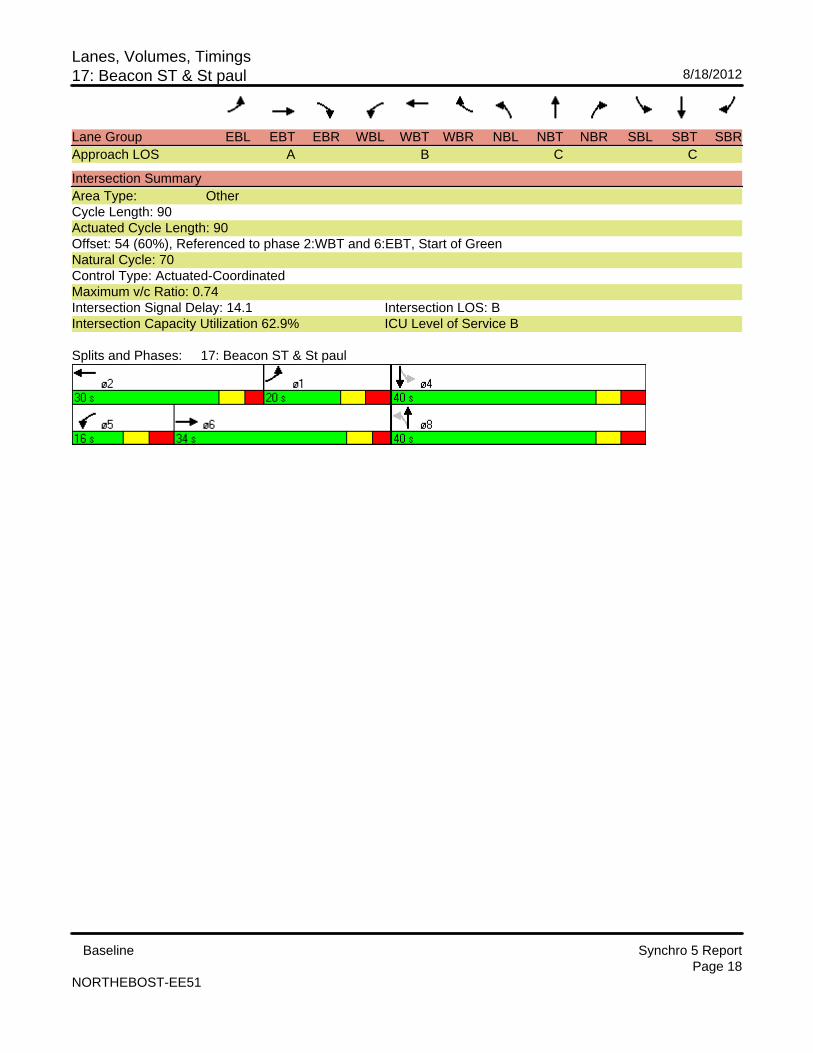
Lanes, Volumes, Timings17: Beacon ST & St paul 8/18/2012
Baseline Synchro 5 ReportPage 18
NORTHEBOST-EE51
Lane Group EBL EBT EBR WBL WBT WBR NBL NBT NBR SBL SBT SBRApproach LOS A B C C
Intersection SummaryArea Type: OtherCycle Length: 90Actuated Cycle Length: 90Offset: 54 (60%), Referenced to phase 2:WBT and 6:EBT, Start of GreenNatural Cycle: 70Control Type: Actuated-CoordinatedMaximum v/c Ratio: 0.74Intersection Signal Delay: 14.1 Intersection LOS: BIntersection Capacity Utilization 62.9% ICU Level of Service B
Splits and Phases: 17: Beacon ST & St paul
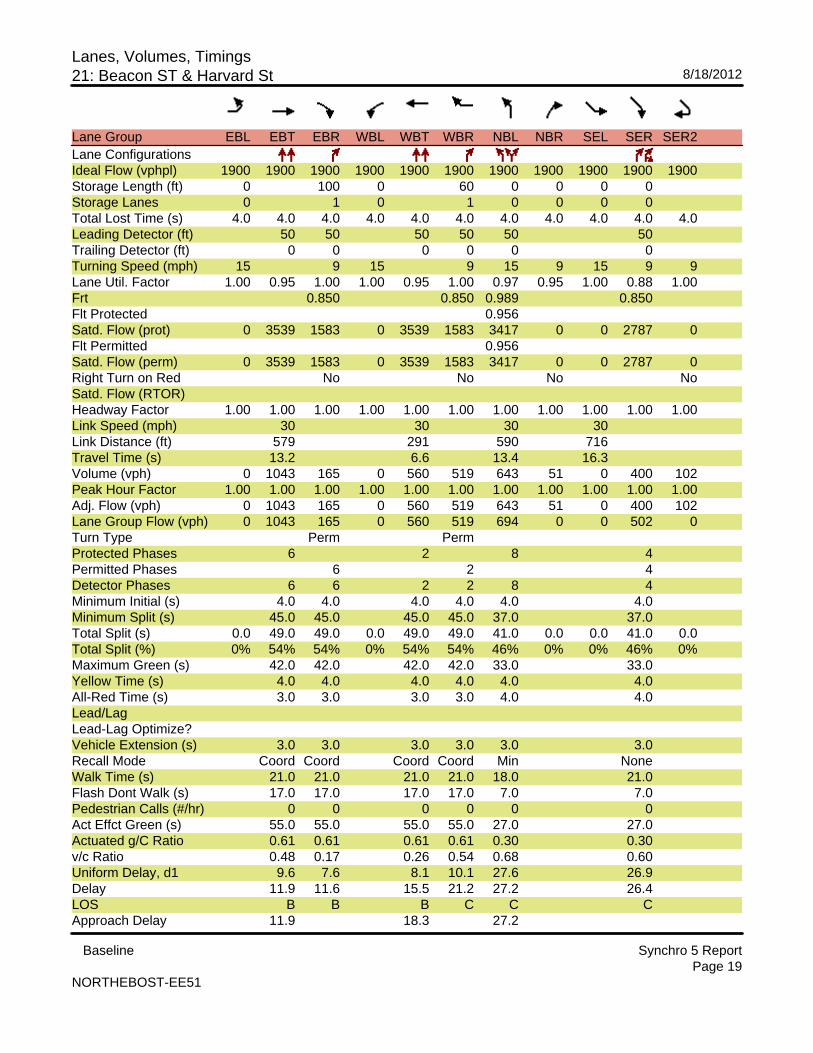
Lanes, Volumes, Timings21: Beacon ST & Harvard St 8/18/2012
Baseline Synchro 5 ReportPage 19
NORTHEBOST-EE51
Lane Group EBL EBT EBR WBL WBT WBR NBL NBR SEL SER SER2Lane ConfigurationsIdeal Flow (vphpl) 1900 1900 1900 1900 1900 1900 1900 1900 1900 1900 1900Storage Length (ft) 0 100 0 60 0 0 0 0Storage Lanes 0 1 0 1 0 0 0 0Total Lost Time (s) 4.0 4.0 4.0 4.0 4.0 4.0 4.0 4.0 4.0 4.0 4.0Leading Detector (ft) 50 50 50 50 50 50Trailing Detector (ft) 0 0 0 0 0 0Turning Speed (mph) 15 9 15 9 15 9 15 9 9Lane Util. Factor 1.00 0.95 1.00 1.00 0.95 1.00 0.97 0.95 1.00 0.88 1.00Frt 0.850 0.850 0.989 0.850Flt Protected 0.956Satd. Flow (prot) 0 3539 1583 0 3539 1583 3417 0 0 2787 0Flt Permitted 0.956Satd. Flow (perm) 0 3539 1583 0 3539 1583 3417 0 0 2787 0Right Turn on Red No No No NoSatd. Flow (RTOR)Headway Factor 1.00 1.00 1.00 1.00 1.00 1.00 1.00 1.00 1.00 1.00 1.00Link Speed (mph) 30 30 30 30Link Distance (ft) 579 291 590 716Travel Time (s) 13.2 6.6 13.4 16.3Volume (vph) 0 1043 165 0 560 519 643 51 0 400 102Peak Hour Factor 1.00 1.00 1.00 1.00 1.00 1.00 1.00 1.00 1.00 1.00 1.00Adj. Flow (vph) 0 1043 165 0 560 519 643 51 0 400 102Lane Group Flow (vph) 0 1043 165 0 560 519 694 0 0 502 0Turn Type Perm PermProtected Phases 6 2 8 4Permitted Phases 6 2 4Detector Phases 6 6 2 2 8 4Minimum Initial (s) 4.0 4.0 4.0 4.0 4.0 4.0Minimum Split (s) 45.0 45.0 45.0 45.0 37.0 37.0Total Split (s) 0.0 49.0 49.0 0.0 49.0 49.0 41.0 0.0 0.0 41.0 0.0Total Split (%) 0% 54% 54% 0% 54% 54% 46% 0% 0% 46% 0%Maximum Green (s) 42.0 42.0 42.0 42.0 33.0 33.0Yellow Time (s) 4.0 4.0 4.0 4.0 4.0 4.0All-Red Time (s) 3.0 3.0 3.0 3.0 4.0 4.0Lead/LagLead-Lag Optimize?Vehicle Extension (s) 3.0 3.0 3.0 3.0 3.0 3.0Recall Mode Coord Coord Coord Coord Min NoneWalk Time (s) 21.0 21.0 21.0 21.0 18.0 21.0Flash Dont Walk (s) 17.0 17.0 17.0 17.0 7.0 7.0Pedestrian Calls (#/hr) 0 0 0 0 0 0Act Effct Green (s) 55.0 55.0 55.0 55.0 27.0 27.0Actuated g/C Ratio 0.61 0.61 0.61 0.61 0.30 0.30v/c Ratio 0.48 0.17 0.26 0.54 0.68 0.60Uniform Delay, d1 9.6 7.6 8.1 10.1 27.6 26.9Delay 11.9 11.6 15.5 21.2 27.2 26.4LOS B B B C C CApproach Delay 11.9 18.3 27.2
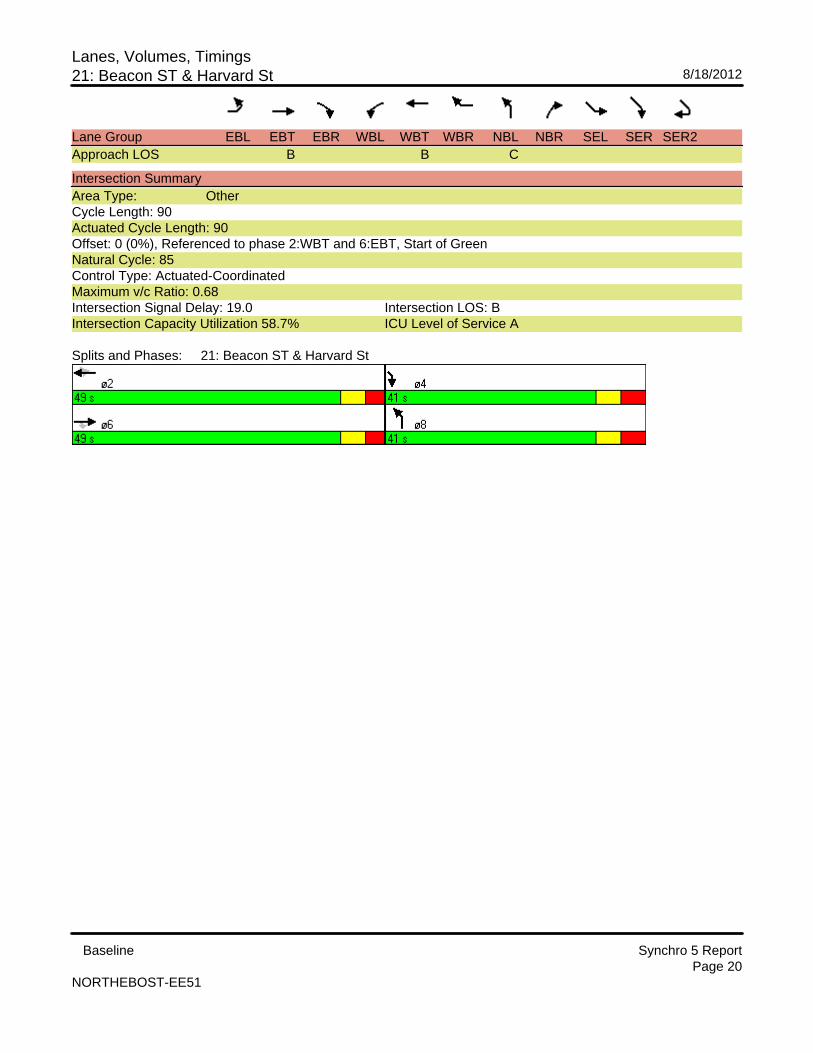
Lanes, Volumes, Timings21: Beacon ST & Harvard St 8/18/2012
Baseline Synchro 5 ReportPage 20
NORTHEBOST-EE51
Lane Group EBL EBT EBR WBL WBT WBR NBL NBR SEL SER SER2Approach LOS B B C
Intersection SummaryArea Type: OtherCycle Length: 90Actuated Cycle Length: 90Offset: 0 (0%), Referenced to phase 2:WBT and 6:EBT, Start of GreenNatural Cycle: 85Control Type: Actuated-CoordinatedMaximum v/c Ratio: 0.68Intersection Signal Delay: 19.0 Intersection LOS: BIntersection Capacity Utilization 58.7% ICU Level of Service A
Splits and Phases: 21: Beacon ST & Harvard St
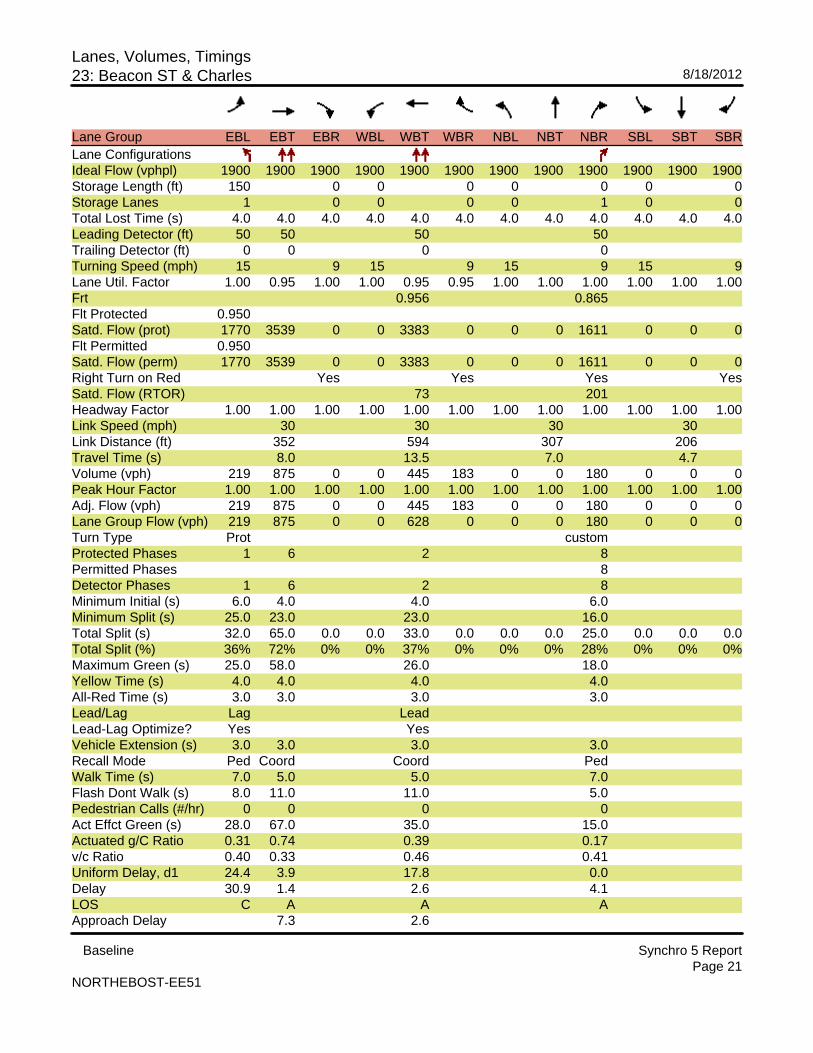
Lanes, Volumes, Timings23: Beacon ST & Charles 8/18/2012
Baseline Synchro 5 ReportPage 21
NORTHEBOST-EE51
Lane Group EBL EBT EBR WBL WBT WBR NBL NBT NBR SBL SBT SBRLane ConfigurationsIdeal Flow (vphpl) 1900 1900 1900 1900 1900 1900 1900 1900 1900 1900 1900 1900Storage Length (ft) 150 0 0 0 0 0 0 0Storage Lanes 1 0 0 0 0 1 0 0Total Lost Time (s) 4.0 4.0 4.0 4.0 4.0 4.0 4.0 4.0 4.0 4.0 4.0 4.0Leading Detector (ft) 50 50 50 50Trailing Detector (ft) 0 0 0 0Turning Speed (mph) 15 9 15 9 15 9 15 9Lane Util. Factor 1.00 0.95 1.00 1.00 0.95 0.95 1.00 1.00 1.00 1.00 1.00 1.00Frt 0.956 0.865Flt Protected 0.950Satd. Flow (prot) 1770 3539 0 0 3383 0 0 0 1611 0 0 0Flt Permitted 0.950Satd. Flow (perm) 1770 3539 0 0 3383 0 0 0 1611 0 0 0Right Turn on Red Yes Yes Yes YesSatd. Flow (RTOR) 73 201Headway Factor 1.00 1.00 1.00 1.00 1.00 1.00 1.00 1.00 1.00 1.00 1.00 1.00Link Speed (mph) 30 30 30 30Link Distance (ft) 352 594 307 206Travel Time (s) 8.0 13.5 7.0 4.7Volume (vph) 219 875 0 0 445 183 0 0 180 0 0 0Peak Hour Factor 1.00 1.00 1.00 1.00 1.00 1.00 1.00 1.00 1.00 1.00 1.00 1.00Adj. Flow (vph) 219 875 0 0 445 183 0 0 180 0 0 0Lane Group Flow (vph) 219 875 0 0 628 0 0 0 180 0 0 0Turn Type Prot customProtected Phases 1 6 2 8Permitted Phases 8Detector Phases 1 6 2 8Minimum Initial (s) 6.0 4.0 4.0 6.0Minimum Split (s) 25.0 23.0 23.0 16.0Total Split (s) 32.0 65.0 0.0 0.0 33.0 0.0 0.0 0.0 25.0 0.0 0.0 0.0Total Split (%) 36% 72% 0% 0% 37% 0% 0% 0% 28% 0% 0% 0%Maximum Green (s) 25.0 58.0 26.0 18.0Yellow Time (s) 4.0 4.0 4.0 4.0All-Red Time (s) 3.0 3.0 3.0 3.0Lead/Lag Lag LeadLead-Lag Optimize? Yes YesVehicle Extension (s) 3.0 3.0 3.0 3.0Recall Mode Ped Coord Coord PedWalk Time (s) 7.0 5.0 5.0 7.0Flash Dont Walk (s) 8.0 11.0 11.0 5.0Pedestrian Calls (#/hr) 0 0 0 0Act Effct Green (s) 28.0 67.0 35.0 15.0Actuated g/C Ratio 0.31 0.74 0.39 0.17v/c Ratio 0.40 0.33 0.46 0.41Uniform Delay, d1 24.4 3.9 17.8 0.0Delay 30.9 1.4 2.6 4.1LOS C A A AApproach Delay 7.3 2.6
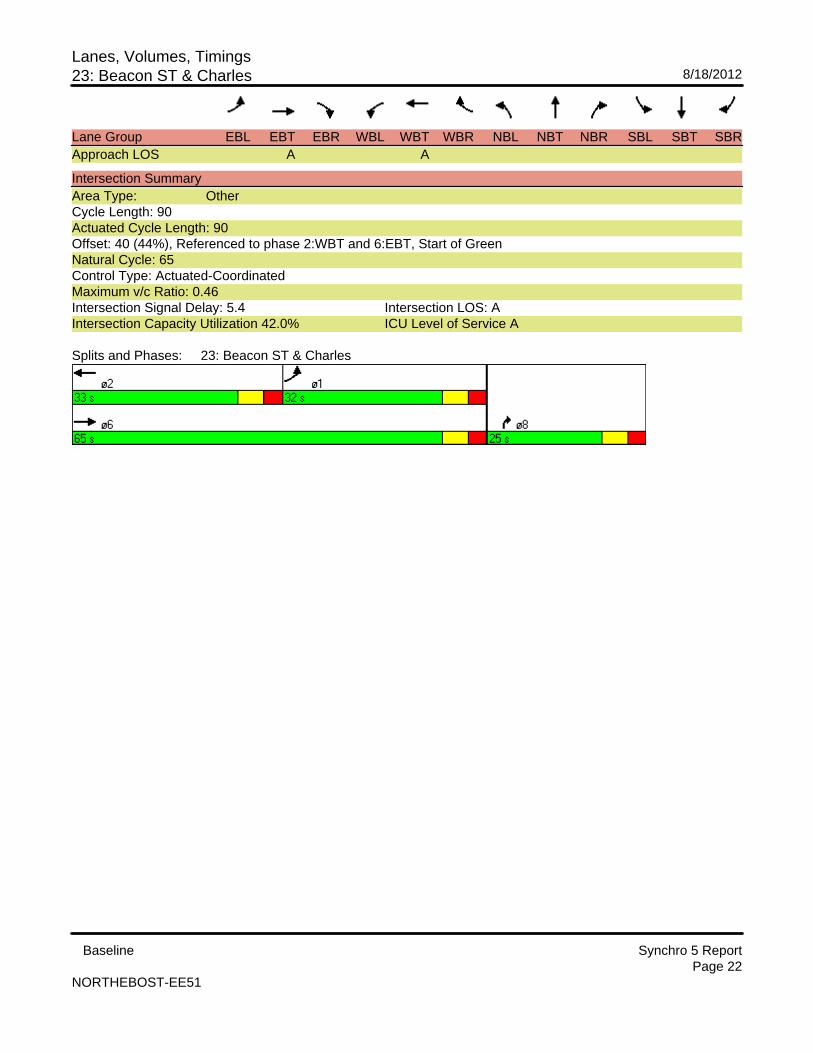
Lanes, Volumes, Timings23: Beacon ST & Charles 8/18/2012
Baseline Synchro 5 ReportPage 22
NORTHEBOST-EE51
Lane Group EBL EBT EBR WBL WBT WBR NBL NBT NBR SBL SBT SBRApproach LOS A A
Intersection SummaryArea Type: OtherCycle Length: 90Actuated Cycle Length: 90Offset: 40 (44%), Referenced to phase 2:WBT and 6:EBT, Start of GreenNatural Cycle: 65Control Type: Actuated-CoordinatedMaximum v/c Ratio: 0.46Intersection Signal Delay: 5.4 Intersection LOS: AIntersection Capacity Utilization 42.0% ICU Level of Service A
Splits and Phases: 23: Beacon ST & Charles
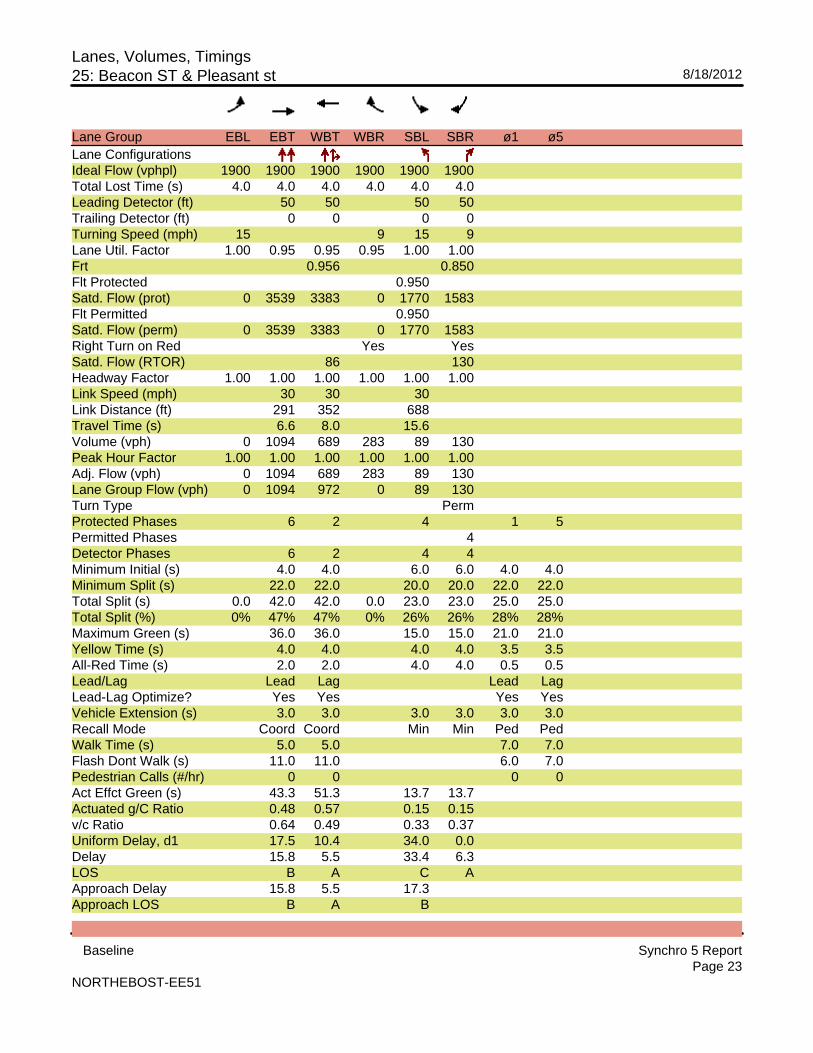
Lanes, Volumes, Timings25: Beacon ST & Pleasant st 8/18/2012
Baseline Synchro 5 ReportPage 23
NORTHEBOST-EE51
Lane Group EBL EBT WBT WBR SBL SBR ø1 ø5Lane ConfigurationsIdeal Flow (vphpl) 1900 1900 1900 1900 1900 1900Total Lost Time (s) 4.0 4.0 4.0 4.0 4.0 4.0Leading Detector (ft) 50 50 50 50Trailing Detector (ft) 0 0 0 0Turning Speed (mph) 15 9 15 9Lane Util. Factor 1.00 0.95 0.95 0.95 1.00 1.00Frt 0.956 0.850Flt Protected 0.950Satd. Flow (prot) 0 3539 3383 0 1770 1583Flt Permitted 0.950Satd. Flow (perm) 0 3539 3383 0 1770 1583Right Turn on Red Yes YesSatd. Flow (RTOR) 86 130Headway Factor 1.00 1.00 1.00 1.00 1.00 1.00Link Speed (mph) 30 30 30Link Distance (ft) 291 352 688Travel Time (s) 6.6 8.0 15.6Volume (vph) 0 1094 689 283 89 130Peak Hour Factor 1.00 1.00 1.00 1.00 1.00 1.00Adj. Flow (vph) 0 1094 689 283 89 130Lane Group Flow (vph) 0 1094 972 0 89 130Turn Type PermProtected Phases 6 2 4 1 5Permitted Phases 4Detector Phases 6 2 4 4Minimum Initial (s) 4.0 4.0 6.0 6.0 4.0 4.0Minimum Split (s) 22.0 22.0 20.0 20.0 22.0 22.0Total Split (s) 0.0 42.0 42.0 0.0 23.0 23.0 25.0 25.0Total Split (%) 0% 47% 47% 0% 26% 26% 28% 28%Maximum Green (s) 36.0 36.0 15.0 15.0 21.0 21.0Yellow Time (s) 4.0 4.0 4.0 4.0 3.5 3.5All-Red Time (s) 2.0 2.0 4.0 4.0 0.5 0.5Lead/Lag Lead Lag Lead LagLead-Lag Optimize? Yes Yes Yes YesVehicle Extension (s) 3.0 3.0 3.0 3.0 3.0 3.0Recall Mode Coord Coord Min Min Ped PedWalk Time (s) 5.0 5.0 7.0 7.0Flash Dont Walk (s) 11.0 11.0 6.0 7.0Pedestrian Calls (#/hr) 0 0 0 0Act Effct Green (s) 43.3 51.3 13.7 13.7Actuated g/C Ratio 0.48 0.57 0.15 0.15v/c Ratio 0.64 0.49 0.33 0.37Uniform Delay, d1 17.5 10.4 34.0 0.0Delay 15.8 5.5 33.4 6.3LOS B A C AApproach Delay 15.8 5.5 17.3Approach LOS B A B
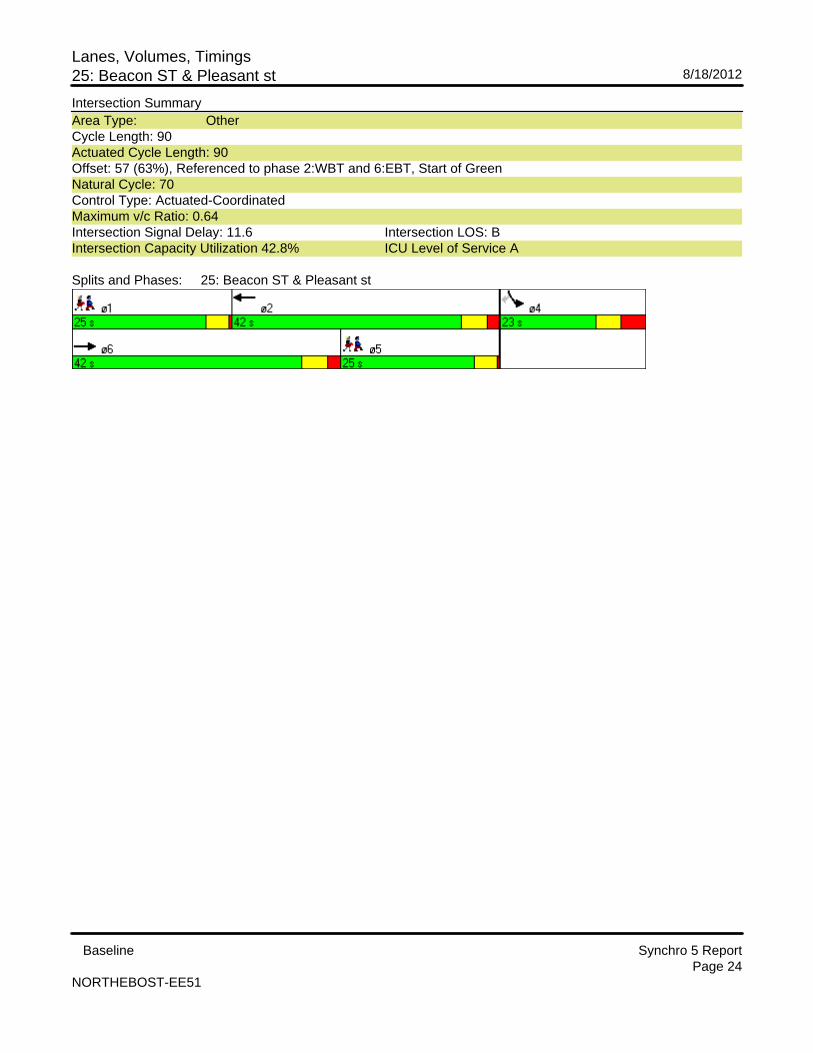
Lanes, Volumes, Timings25: Beacon ST & Pleasant st 8/18/2012
Baseline Synchro 5 ReportPage 24
NORTHEBOST-EE51
Intersection SummaryArea Type: OtherCycle Length: 90Actuated Cycle Length: 90Offset: 57 (63%), Referenced to phase 2:WBT and 6:EBT, Start of GreenNatural Cycle: 70Control Type: Actuated-CoordinatedMaximum v/c Ratio: 0.64Intersection Signal Delay: 11.6 Intersection LOS: BIntersection Capacity Utilization 42.8% ICU Level of Service A
Splits and Phases: 25: Beacon ST & Pleasant st
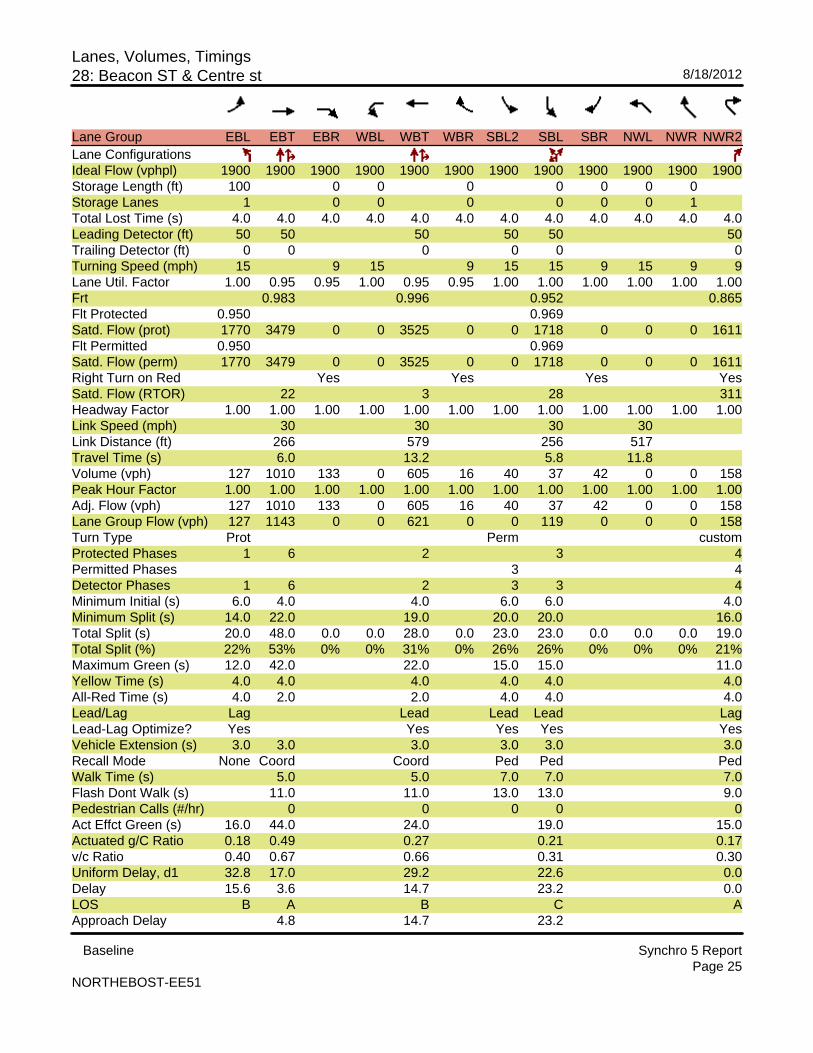
Lanes, Volumes, Timings28: Beacon ST & Centre st 8/18/2012
Baseline Synchro 5 ReportPage 25
NORTHEBOST-EE51
Lane Group EBL EBT EBR WBL WBT WBR SBL2 SBL SBR NWL NWR NWR2Lane ConfigurationsIdeal Flow (vphpl) 1900 1900 1900 1900 1900 1900 1900 1900 1900 1900 1900 1900Storage Length (ft) 100 0 0 0 0 0 0 0Storage Lanes 1 0 0 0 0 0 0 1Total Lost Time (s) 4.0 4.0 4.0 4.0 4.0 4.0 4.0 4.0 4.0 4.0 4.0 4.0Leading Detector (ft) 50 50 50 50 50 50Trailing Detector (ft) 0 0 0 0 0 0Turning Speed (mph) 15 9 15 9 15 15 9 15 9 9Lane Util. Factor 1.00 0.95 0.95 1.00 0.95 0.95 1.00 1.00 1.00 1.00 1.00 1.00Frt 0.983 0.996 0.952 0.865Flt Protected 0.950 0.969Satd. Flow (prot) 1770 3479 0 0 3525 0 0 1718 0 0 0 1611Flt Permitted 0.950 0.969Satd. Flow (perm) 1770 3479 0 0 3525 0 0 1718 0 0 0 1611Right Turn on Red Yes Yes Yes YesSatd. Flow (RTOR) 22 3 28 311Headway Factor 1.00 1.00 1.00 1.00 1.00 1.00 1.00 1.00 1.00 1.00 1.00 1.00Link Speed (mph) 30 30 30 30Link Distance (ft) 266 579 256 517Travel Time (s) 6.0 13.2 5.8 11.8Volume (vph) 127 1010 133 0 605 16 40 37 42 0 0 158Peak Hour Factor 1.00 1.00 1.00 1.00 1.00 1.00 1.00 1.00 1.00 1.00 1.00 1.00Adj. Flow (vph) 127 1010 133 0 605 16 40 37 42 0 0 158Lane Group Flow (vph) 127 1143 0 0 621 0 0 119 0 0 0 158Turn Type Prot Perm customProtected Phases 1 6 2 3 4Permitted Phases 3 4Detector Phases 1 6 2 3 3 4Minimum Initial (s) 6.0 4.0 4.0 6.0 6.0 4.0Minimum Split (s) 14.0 22.0 19.0 20.0 20.0 16.0Total Split (s) 20.0 48.0 0.0 0.0 28.0 0.0 23.0 23.0 0.0 0.0 0.0 19.0Total Split (%) 22% 53% 0% 0% 31% 0% 26% 26% 0% 0% 0% 21%Maximum Green (s) 12.0 42.0 22.0 15.0 15.0 11.0Yellow Time (s) 4.0 4.0 4.0 4.0 4.0 4.0All-Red Time (s) 4.0 2.0 2.0 4.0 4.0 4.0Lead/Lag Lag Lead Lead Lead LagLead-Lag Optimize? Yes Yes Yes Yes YesVehicle Extension (s) 3.0 3.0 3.0 3.0 3.0 3.0Recall Mode None Coord Coord Ped Ped PedWalk Time (s) 5.0 5.0 7.0 7.0 7.0Flash Dont Walk (s) 11.0 11.0 13.0 13.0 9.0Pedestrian Calls (#/hr) 0 0 0 0 0Act Effct Green (s) 16.0 44.0 24.0 19.0 15.0Actuated g/C Ratio 0.18 0.49 0.27 0.21 0.17v/c Ratio 0.40 0.67 0.66 0.31 0.30Uniform Delay, d1 32.8 17.0 29.2 22.6 0.0Delay 15.6 3.6 14.7 23.2 0.0LOS B A B C AApproach Delay 4.8 14.7 23.2
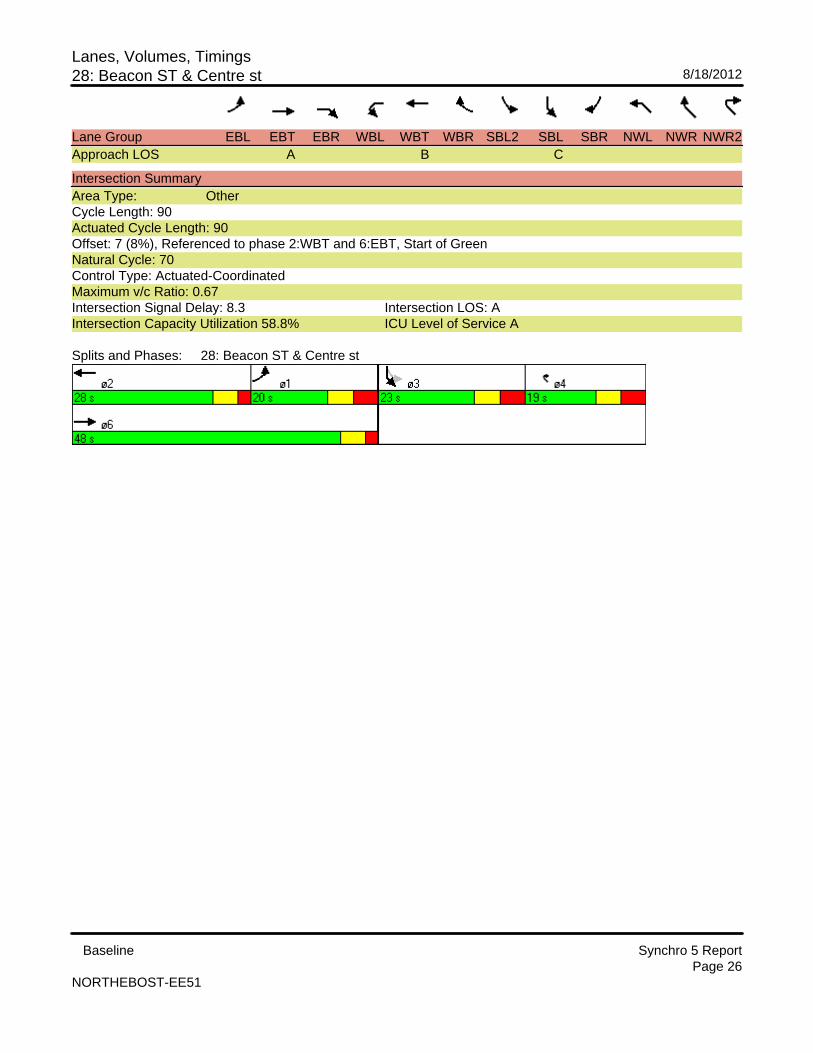
Lanes, Volumes, Timings28: Beacon ST & Centre st 8/18/2012
Baseline Synchro 5 ReportPage 26
NORTHEBOST-EE51
Lane Group EBL EBT EBR WBL WBT WBR SBL2 SBL SBR NWL NWR NWR2Approach LOS A B C
Intersection SummaryArea Type: OtherCycle Length: 90Actuated Cycle Length: 90Offset: 7 (8%), Referenced to phase 2:WBT and 6:EBT, Start of GreenNatural Cycle: 70Control Type: Actuated-CoordinatedMaximum v/c Ratio: 0.67Intersection Signal Delay: 8.3 Intersection LOS: AIntersection Capacity Utilization 58.8% ICU Level of Service A
Splits and Phases: 28: Beacon ST & Centre st
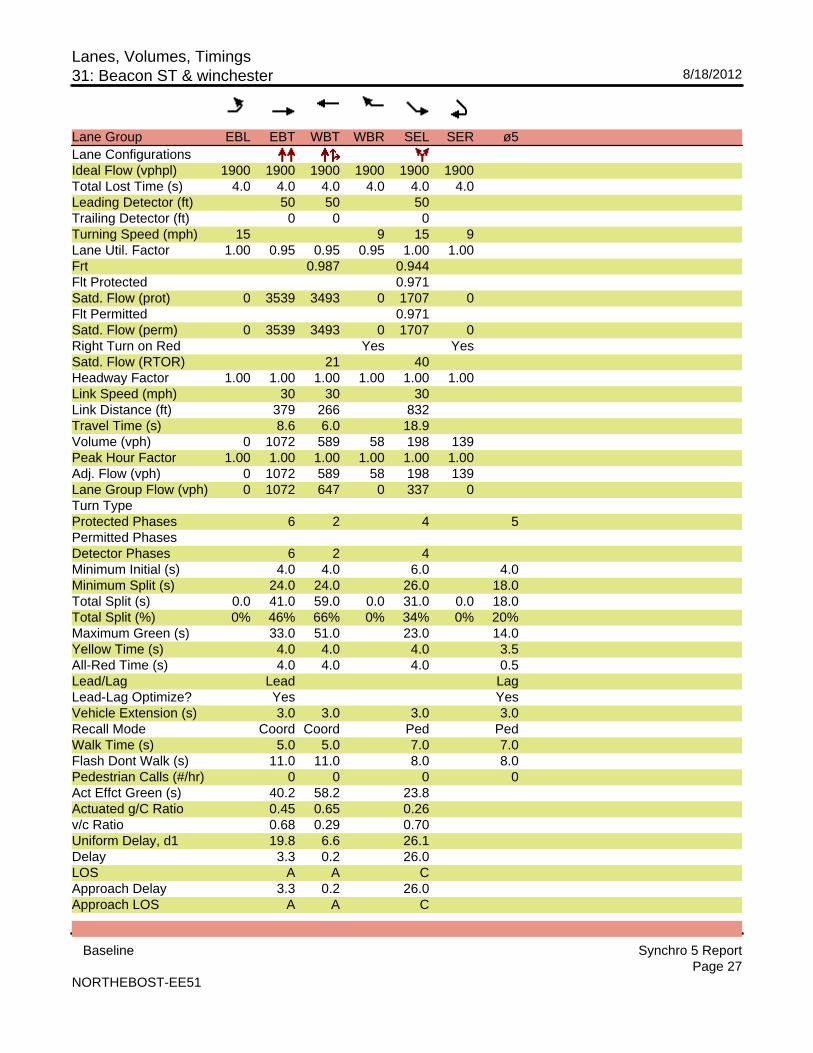
Lanes, Volumes, Timings31: Beacon ST & winchester 8/18/2012
Baseline Synchro 5 ReportPage 27
NORTHEBOST-EE51
Lane Group EBL EBT WBT WBR SEL SER ø5Lane ConfigurationsIdeal Flow (vphpl) 1900 1900 1900 1900 1900 1900Total Lost Time (s) 4.0 4.0 4.0 4.0 4.0 4.0Leading Detector (ft) 50 50 50Trailing Detector (ft) 0 0 0Turning Speed (mph) 15 9 15 9Lane Util. Factor 1.00 0.95 0.95 0.95 1.00 1.00Frt 0.987 0.944Flt Protected 0.971Satd. Flow (prot) 0 3539 3493 0 1707 0Flt Permitted 0.971Satd. Flow (perm) 0 3539 3493 0 1707 0Right Turn on Red Yes YesSatd. Flow (RTOR) 21 40Headway Factor 1.00 1.00 1.00 1.00 1.00 1.00Link Speed (mph) 30 30 30Link Distance (ft) 379 266 832Travel Time (s) 8.6 6.0 18.9Volume (vph) 0 1072 589 58 198 139Peak Hour Factor 1.00 1.00 1.00 1.00 1.00 1.00Adj. Flow (vph) 0 1072 589 58 198 139Lane Group Flow (vph) 0 1072 647 0 337 0Turn TypeProtected Phases 6 2 4 5Permitted PhasesDetector Phases 6 2 4Minimum Initial (s) 4.0 4.0 6.0 4.0Minimum Split (s) 24.0 24.0 26.0 18.0Total Split (s) 0.0 41.0 59.0 0.0 31.0 0.0 18.0Total Split (%) 0% 46% 66% 0% 34% 0% 20%Maximum Green (s) 33.0 51.0 23.0 14.0Yellow Time (s) 4.0 4.0 4.0 3.5All-Red Time (s) 4.0 4.0 4.0 0.5Lead/Lag Lead LagLead-Lag Optimize? Yes YesVehicle Extension (s) 3.0 3.0 3.0 3.0Recall Mode Coord Coord Ped PedWalk Time (s) 5.0 5.0 7.0 7.0Flash Dont Walk (s) 11.0 11.0 8.0 8.0Pedestrian Calls (#/hr) 0 0 0 0Act Effct Green (s) 40.2 58.2 23.8Actuated g/C Ratio 0.45 0.65 0.26v/c Ratio 0.68 0.29 0.70Uniform Delay, d1 19.8 6.6 26.1Delay 3.3 0.2 26.0LOS A A CApproach Delay 3.3 0.2 26.0Approach LOS A A C
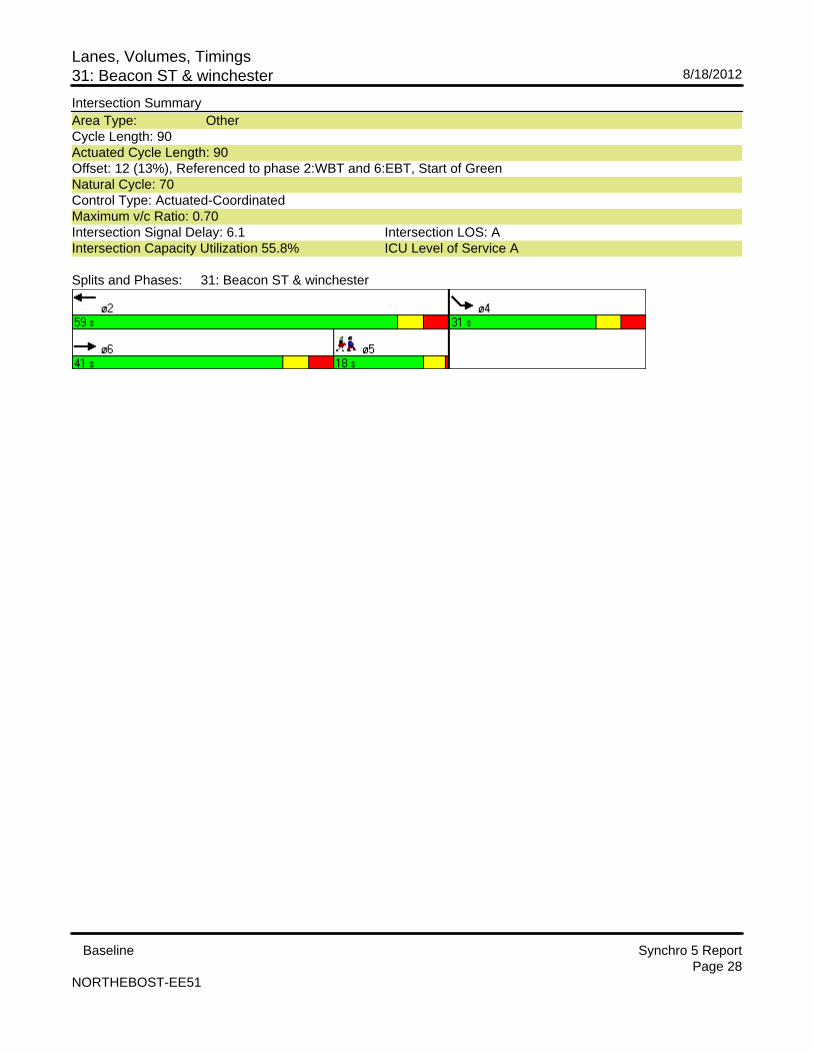
Lanes, Volumes, Timings31: Beacon ST & winchester 8/18/2012
Baseline Synchro 5 ReportPage 28
NORTHEBOST-EE51
Intersection SummaryArea Type: OtherCycle Length: 90Actuated Cycle Length: 90Offset: 12 (13%), Referenced to phase 2:WBT and 6:EBT, Start of GreenNatural Cycle: 70Control Type: Actuated-CoordinatedMaximum v/c Ratio: 0.70Intersection Signal Delay: 6.1 Intersection LOS: AIntersection Capacity Utilization 55.8% ICU Level of Service A
Splits and Phases: 31: Beacon ST & winchester
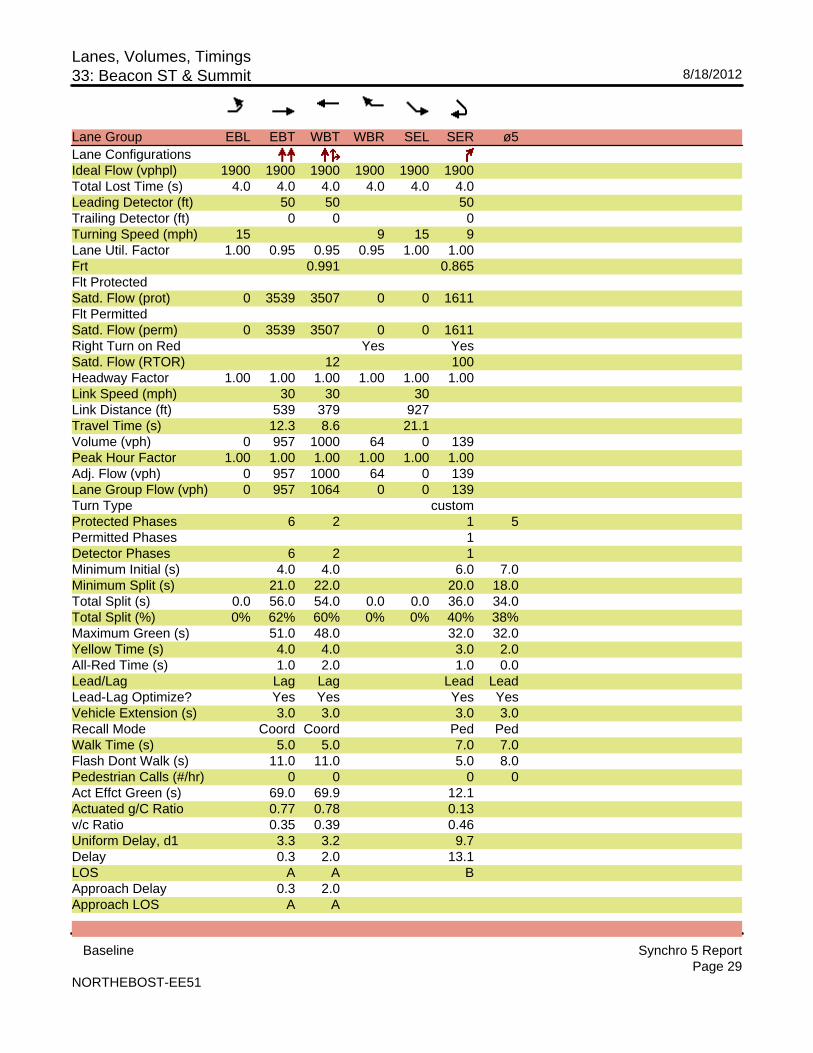
Lanes, Volumes, Timings33: Beacon ST & Summit 8/18/2012
Baseline Synchro 5 ReportPage 29
NORTHEBOST-EE51
Lane Group EBL EBT WBT WBR SEL SER ø5Lane ConfigurationsIdeal Flow (vphpl) 1900 1900 1900 1900 1900 1900Total Lost Time (s) 4.0 4.0 4.0 4.0 4.0 4.0Leading Detector (ft) 50 50 50Trailing Detector (ft) 0 0 0Turning Speed (mph) 15 9 15 9Lane Util. Factor 1.00 0.95 0.95 0.95 1.00 1.00Frt 0.991 0.865Flt ProtectedSatd. Flow (prot) 0 3539 3507 0 0 1611Flt PermittedSatd. Flow (perm) 0 3539 3507 0 0 1611Right Turn on Red Yes YesSatd. Flow (RTOR) 12 100Headway Factor 1.00 1.00 1.00 1.00 1.00 1.00Link Speed (mph) 30 30 30Link Distance (ft) 539 379 927Travel Time (s) 12.3 8.6 21.1Volume (vph) 0 957 1000 64 0 139Peak Hour Factor 1.00 1.00 1.00 1.00 1.00 1.00Adj. Flow (vph) 0 957 1000 64 0 139Lane Group Flow (vph) 0 957 1064 0 0 139Turn Type customProtected Phases 6 2 1 5Permitted Phases 1Detector Phases 6 2 1Minimum Initial (s) 4.0 4.0 6.0 7.0Minimum Split (s) 21.0 22.0 20.0 18.0Total Split (s) 0.0 56.0 54.0 0.0 0.0 36.0 34.0Total Split (%) 0% 62% 60% 0% 0% 40% 38%Maximum Green (s) 51.0 48.0 32.0 32.0Yellow Time (s) 4.0 4.0 3.0 2.0All-Red Time (s) 1.0 2.0 1.0 0.0Lead/Lag Lag Lag Lead LeadLead-Lag Optimize? Yes Yes Yes YesVehicle Extension (s) 3.0 3.0 3.0 3.0Recall Mode Coord Coord Ped PedWalk Time (s) 5.0 5.0 7.0 7.0Flash Dont Walk (s) 11.0 11.0 5.0 8.0Pedestrian Calls (#/hr) 0 0 0 0Act Effct Green (s) 69.0 69.9 12.1Actuated g/C Ratio 0.77 0.78 0.13v/c Ratio 0.35 0.39 0.46Uniform Delay, d1 3.3 3.2 9.7Delay 0.3 2.0 13.1LOS A A BApproach Delay 0.3 2.0Approach LOS A A
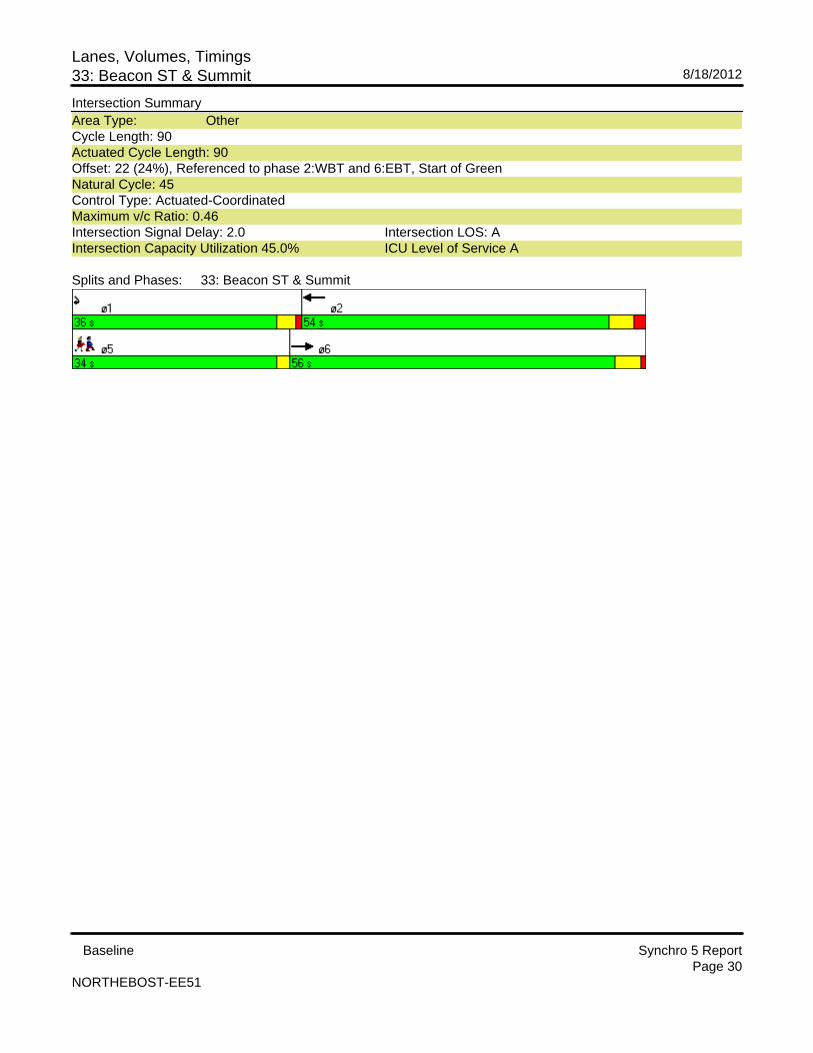
Lanes, Volumes, Timings33: Beacon ST & Summit 8/18/2012
Baseline Synchro 5 ReportPage 30
NORTHEBOST-EE51
Intersection SummaryArea Type: OtherCycle Length: 90Actuated Cycle Length: 90Offset: 22 (24%), Referenced to phase 2:WBT and 6:EBT, Start of GreenNatural Cycle: 45Control Type: Actuated-CoordinatedMaximum v/c Ratio: 0.46Intersection Signal Delay: 2.0 Intersection LOS: AIntersection Capacity Utilization 45.0% ICU Level of Service A
Splits and Phases: 33: Beacon ST & Summit

Appendix II
Synchro Report of Improved Traffic Signal
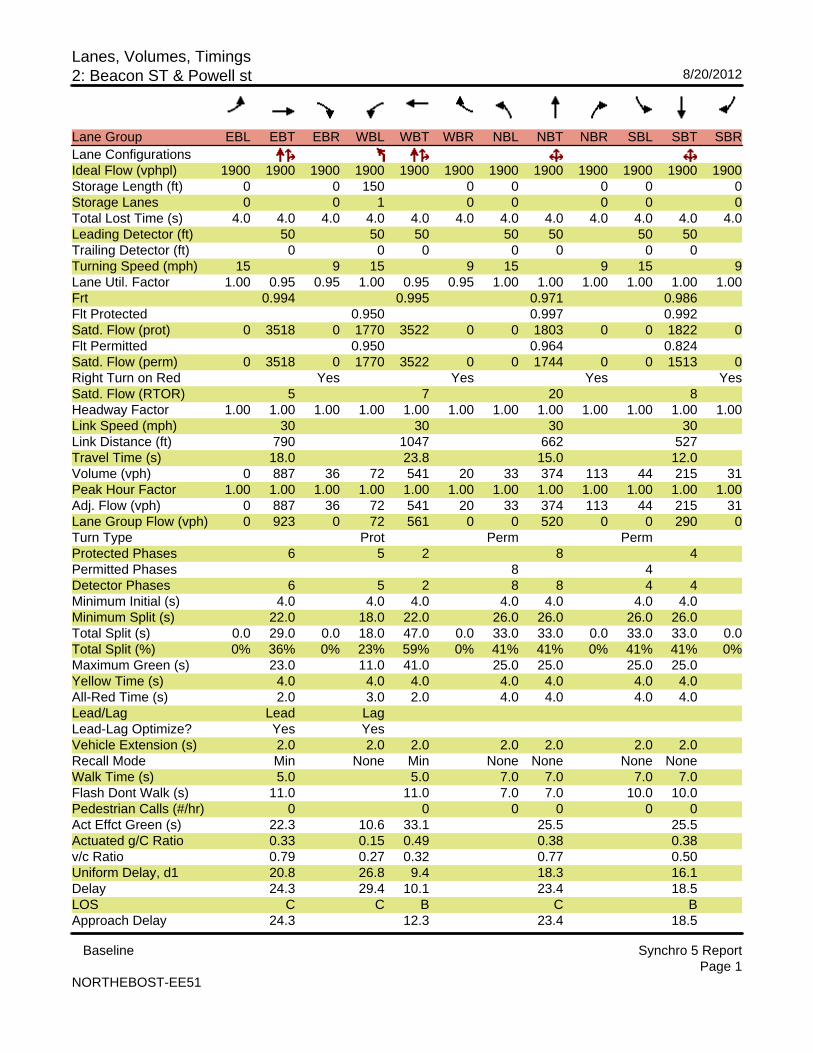
Lanes, Volumes, Timings2: Beacon ST & Powell st 8/20/2012
Baseline Synchro 5 ReportPage 1
NORTHEBOST-EE51
Lane Group EBL EBT EBR WBL WBT WBR NBL NBT NBR SBL SBT SBRLane ConfigurationsIdeal Flow (vphpl) 1900 1900 1900 1900 1900 1900 1900 1900 1900 1900 1900 1900Storage Length (ft) 0 0 150 0 0 0 0 0Storage Lanes 0 0 1 0 0 0 0 0Total Lost Time (s) 4.0 4.0 4.0 4.0 4.0 4.0 4.0 4.0 4.0 4.0 4.0 4.0Leading Detector (ft) 50 50 50 50 50 50 50Trailing Detector (ft) 0 0 0 0 0 0 0Turning Speed (mph) 15 9 15 9 15 9 15 9Lane Util. Factor 1.00 0.95 0.95 1.00 0.95 0.95 1.00 1.00 1.00 1.00 1.00 1.00Frt 0.994 0.995 0.971 0.986Flt Protected 0.950 0.997 0.992Satd. Flow (prot) 0 3518 0 1770 3522 0 0 1803 0 0 1822 0Flt Permitted 0.950 0.964 0.824Satd. Flow (perm) 0 3518 0 1770 3522 0 0 1744 0 0 1513 0Right Turn on Red Yes Yes Yes YesSatd. Flow (RTOR) 5 7 20 8Headway Factor 1.00 1.00 1.00 1.00 1.00 1.00 1.00 1.00 1.00 1.00 1.00 1.00Link Speed (mph) 30 30 30 30Link Distance (ft) 790 1047 662 527Travel Time (s) 18.0 23.8 15.0 12.0Volume (vph) 0 887 36 72 541 20 33 374 113 44 215 31Peak Hour Factor 1.00 1.00 1.00 1.00 1.00 1.00 1.00 1.00 1.00 1.00 1.00 1.00Adj. Flow (vph) 0 887 36 72 541 20 33 374 113 44 215 31Lane Group Flow (vph) 0 923 0 72 561 0 0 520 0 0 290 0Turn Type Prot Perm PermProtected Phases 6 5 2 8 4Permitted Phases 8 4Detector Phases 6 5 2 8 8 4 4Minimum Initial (s) 4.0 4.0 4.0 4.0 4.0 4.0 4.0Minimum Split (s) 22.0 18.0 22.0 26.0 26.0 26.0 26.0Total Split (s) 0.0 29.0 0.0 18.0 47.0 0.0 33.0 33.0 0.0 33.0 33.0 0.0Total Split (%) 0% 36% 0% 23% 59% 0% 41% 41% 0% 41% 41% 0%Maximum Green (s) 23.0 11.0 41.0 25.0 25.0 25.0 25.0Yellow Time (s) 4.0 4.0 4.0 4.0 4.0 4.0 4.0All-Red Time (s) 2.0 3.0 2.0 4.0 4.0 4.0 4.0Lead/Lag Lead LagLead-Lag Optimize? Yes YesVehicle Extension (s) 2.0 2.0 2.0 2.0 2.0 2.0 2.0Recall Mode Min None Min None None None NoneWalk Time (s) 5.0 5.0 7.0 7.0 7.0 7.0Flash Dont Walk (s) 11.0 11.0 7.0 7.0 10.0 10.0Pedestrian Calls (#/hr) 0 0 0 0 0 0Act Effct Green (s) 22.3 10.6 33.1 25.5 25.5Actuated g/C Ratio 0.33 0.15 0.49 0.38 0.38v/c Ratio 0.79 0.27 0.32 0.77 0.50Uniform Delay, d1 20.8 26.8 9.4 18.3 16.1Delay 24.3 29.4 10.1 23.4 18.5LOS C C B C BApproach Delay 24.3 12.3 23.4 18.5
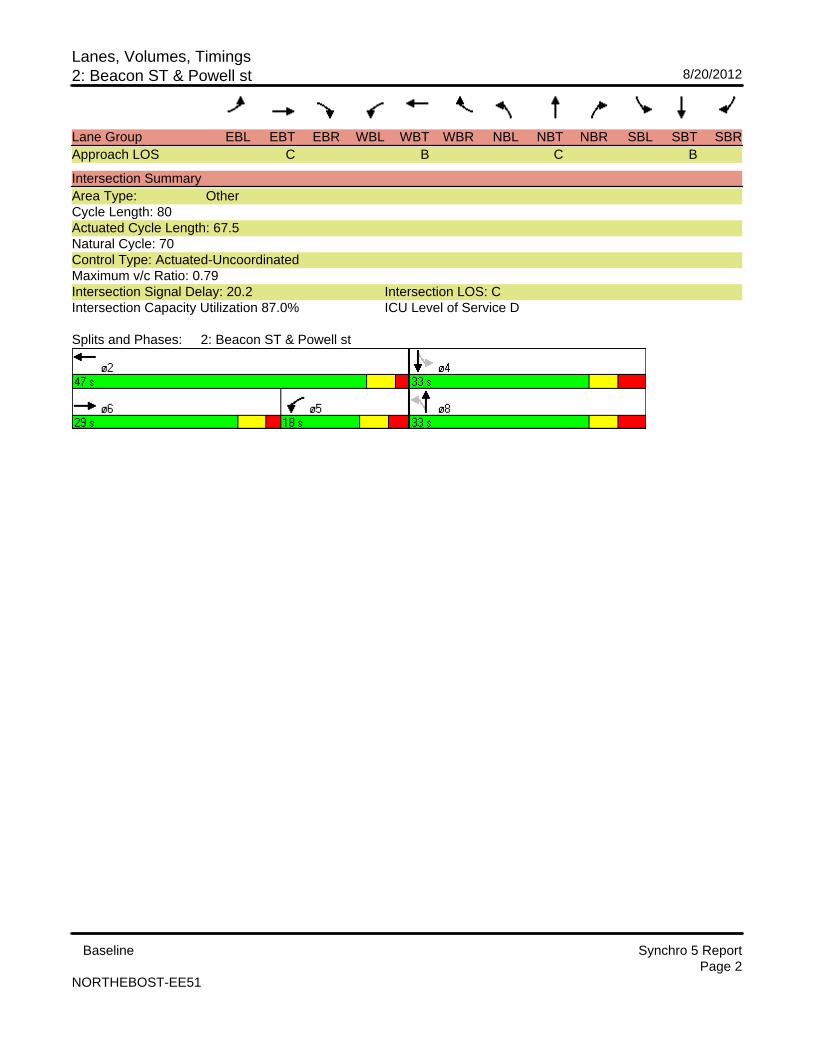
Lanes, Volumes, Timings2: Beacon ST & Powell st 8/20/2012
Baseline Synchro 5 ReportPage 2
NORTHEBOST-EE51
Lane Group EBL EBT EBR WBL WBT WBR NBL NBT NBR SBL SBT SBRApproach LOS C B C B
Intersection SummaryArea Type: OtherCycle Length: 80Actuated Cycle Length: 67.5Natural Cycle: 70Control Type: Actuated-UncoordinatedMaximum v/c Ratio: 0.79Intersection Signal Delay: 20.2 Intersection LOS: CIntersection Capacity Utilization 87.0% ICU Level of Service D
Splits and Phases: 2: Beacon ST & Powell st
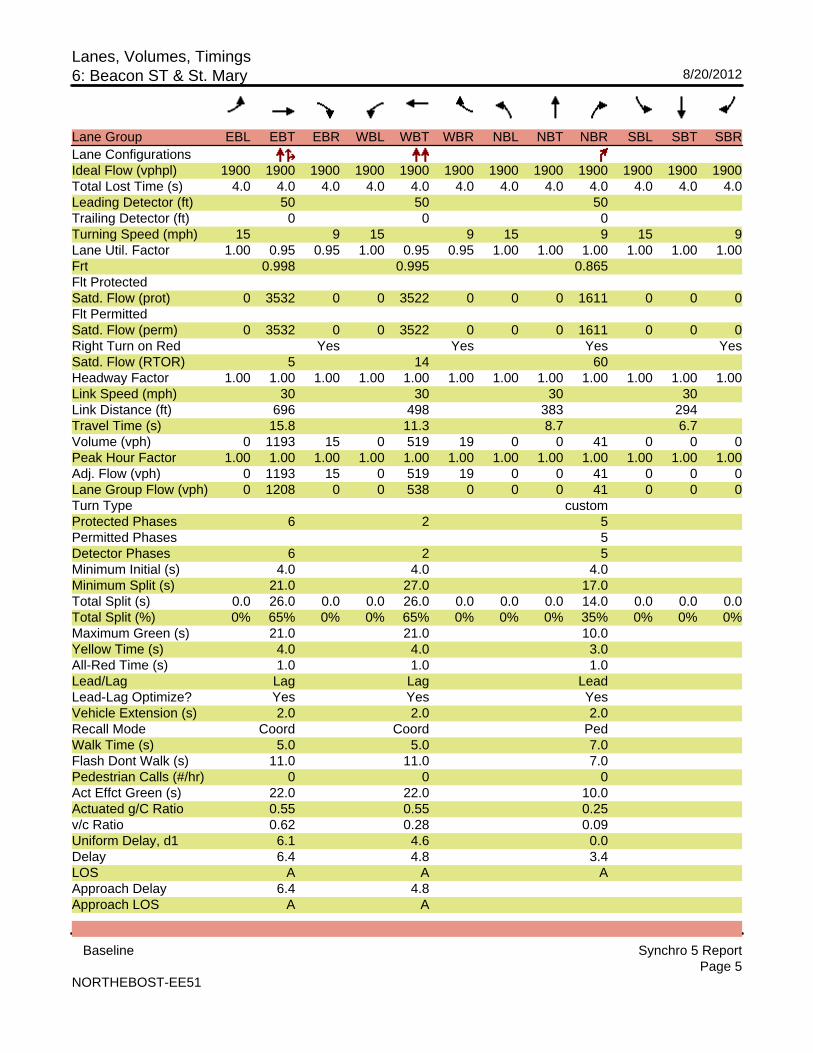
Lanes, Volumes, Timings6: Beacon ST & St. Mary 8/20/2012
Baseline Synchro 5 ReportPage 5
NORTHEBOST-EE51
Lane Group EBL EBT EBR WBL WBT WBR NBL NBT NBR SBL SBT SBRLane ConfigurationsIdeal Flow (vphpl) 1900 1900 1900 1900 1900 1900 1900 1900 1900 1900 1900 1900Total Lost Time (s) 4.0 4.0 4.0 4.0 4.0 4.0 4.0 4.0 4.0 4.0 4.0 4.0Leading Detector (ft) 50 50 50Trailing Detector (ft) 0 0 0Turning Speed (mph) 15 9 15 9 15 9 15 9Lane Util. Factor 1.00 0.95 0.95 1.00 0.95 0.95 1.00 1.00 1.00 1.00 1.00 1.00Frt 0.998 0.995 0.865Flt ProtectedSatd. Flow (prot) 0 3532 0 0 3522 0 0 0 1611 0 0 0Flt PermittedSatd. Flow (perm) 0 3532 0 0 3522 0 0 0 1611 0 0 0Right Turn on Red Yes Yes Yes YesSatd. Flow (RTOR) 5 14 60Headway Factor 1.00 1.00 1.00 1.00 1.00 1.00 1.00 1.00 1.00 1.00 1.00 1.00Link Speed (mph) 30 30 30 30Link Distance (ft) 696 498 383 294Travel Time (s) 15.8 11.3 8.7 6.7Volume (vph) 0 1193 15 0 519 19 0 0 41 0 0 0Peak Hour Factor 1.00 1.00 1.00 1.00 1.00 1.00 1.00 1.00 1.00 1.00 1.00 1.00Adj. Flow (vph) 0 1193 15 0 519 19 0 0 41 0 0 0Lane Group Flow (vph) 0 1208 0 0 538 0 0 0 41 0 0 0Turn Type customProtected Phases 6 2 5Permitted Phases 5Detector Phases 6 2 5Minimum Initial (s) 4.0 4.0 4.0Minimum Split (s) 21.0 27.0 17.0Total Split (s) 0.0 26.0 0.0 0.0 26.0 0.0 0.0 0.0 14.0 0.0 0.0 0.0Total Split (%) 0% 65% 0% 0% 65% 0% 0% 0% 35% 0% 0% 0%Maximum Green (s) 21.0 21.0 10.0Yellow Time (s) 4.0 4.0 3.0All-Red Time (s) 1.0 1.0 1.0Lead/Lag Lag Lag LeadLead-Lag Optimize? Yes Yes YesVehicle Extension (s) 2.0 2.0 2.0Recall Mode Coord Coord PedWalk Time (s) 5.0 5.0 7.0Flash Dont Walk (s) 11.0 11.0 7.0Pedestrian Calls (#/hr) 0 0 0Act Effct Green (s) 22.0 22.0 10.0Actuated g/C Ratio 0.55 0.55 0.25v/c Ratio 0.62 0.28 0.09Uniform Delay, d1 6.1 4.6 0.0Delay 6.4 4.8 3.4LOS A A AApproach Delay 6.4 4.8Approach LOS A A
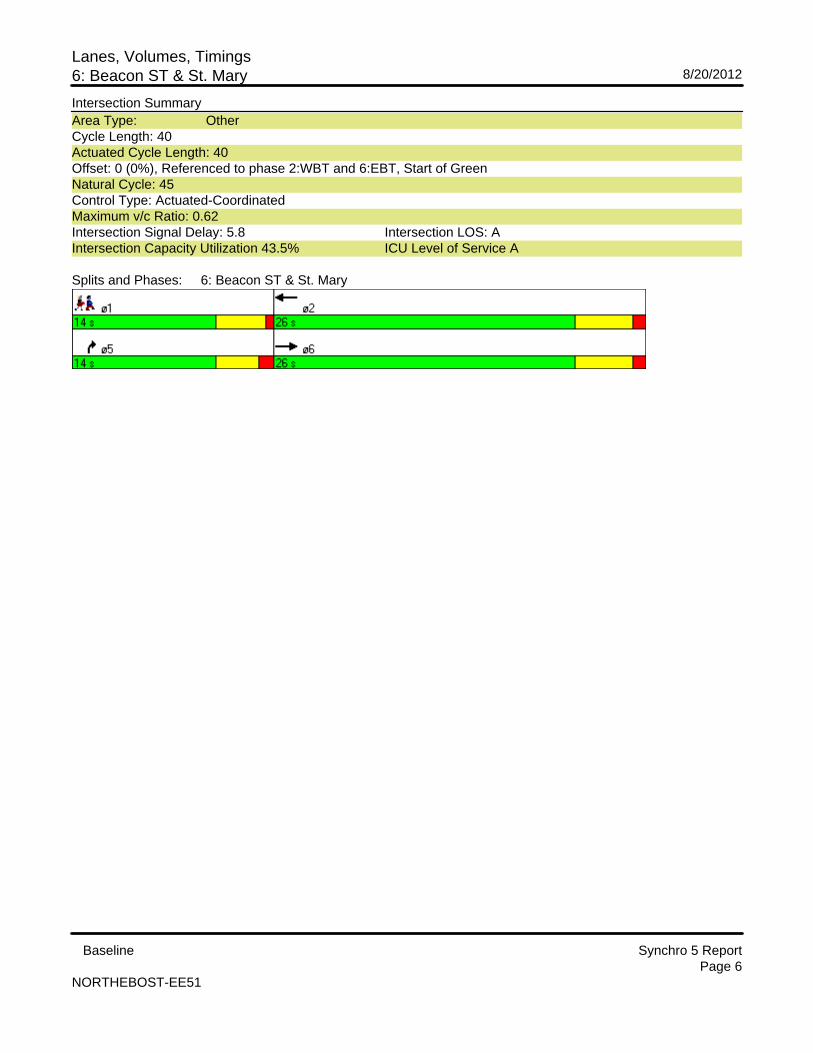
Lanes, Volumes, Timings6: Beacon ST & St. Mary 8/20/2012
Baseline Synchro 5 ReportPage 6
NORTHEBOST-EE51
Intersection SummaryArea Type: OtherCycle Length: 40Actuated Cycle Length: 40Offset: 0 (0%), Referenced to phase 2:WBT and 6:EBT, Start of GreenNatural Cycle: 45Control Type: Actuated-CoordinatedMaximum v/c Ratio: 0.62Intersection Signal Delay: 5.8 Intersection LOS: AIntersection Capacity Utilization 43.5% ICU Level of Service A
Splits and Phases: 6: Beacon ST & St. Mary
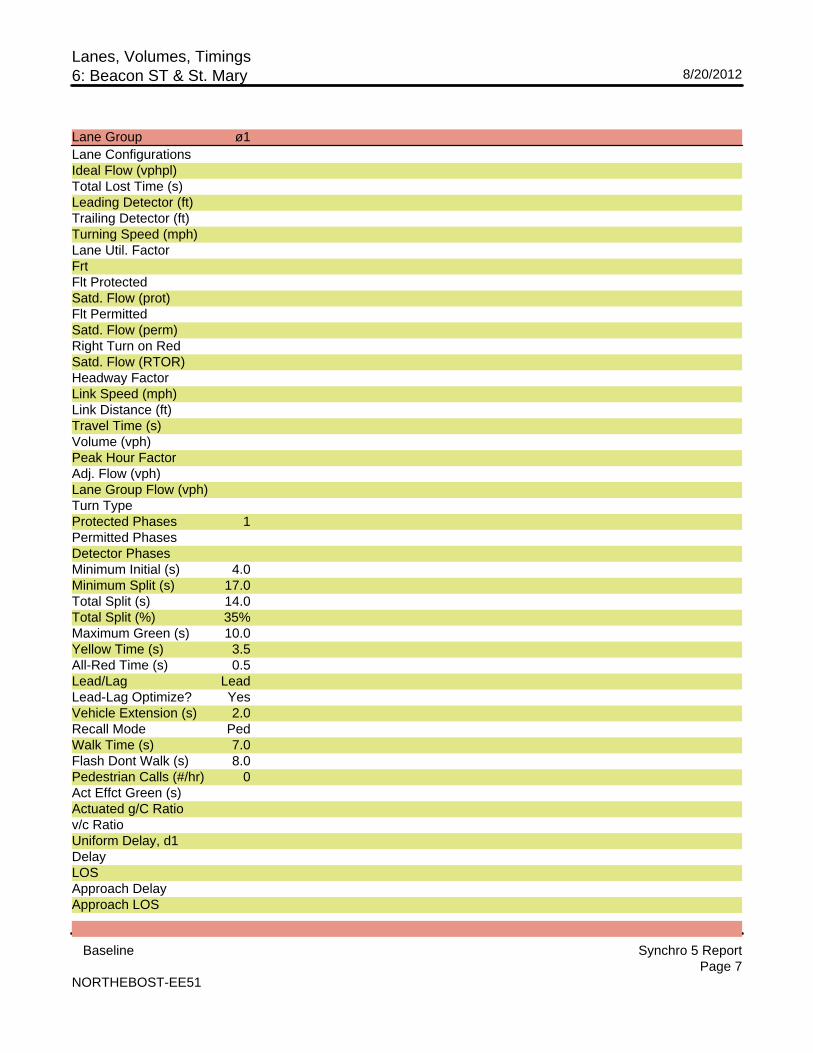
Lanes, Volumes, Timings6: Beacon ST & St. Mary 8/20/2012
Baseline Synchro 5 ReportPage 7
NORTHEBOST-EE51
Lane Group ø1Lane ConfigurationsIdeal Flow (vphpl)Total Lost Time (s)Leading Detector (ft)Trailing Detector (ft)Turning Speed (mph)Lane Util. FactorFrtFlt ProtectedSatd. Flow (prot)Flt PermittedSatd. Flow (perm)Right Turn on RedSatd. Flow (RTOR)Headway FactorLink Speed (mph)Link Distance (ft)Travel Time (s)Volume (vph)Peak Hour FactorAdj. Flow (vph)Lane Group Flow (vph)Turn TypeProtected Phases 1Permitted PhasesDetector PhasesMinimum Initial (s) 4.0Minimum Split (s) 17.0Total Split (s) 14.0Total Split (%) 35%Maximum Green (s) 10.0Yellow Time (s) 3.5All-Red Time (s) 0.5Lead/Lag LeadLead-Lag Optimize? YesVehicle Extension (s) 2.0Recall Mode PedWalk Time (s) 7.0Flash Dont Walk (s) 8.0Pedestrian Calls (#/hr) 0Act Effct Green (s)Actuated g/C Ratiov/c RatioUniform Delay, d1DelayLOSApproach DelayApproach LOS

Lanes, Volumes, Timings6: Beacon ST & St. Mary 8/20/2012
Baseline Synchro 5 ReportPage 8
NORTHEBOST-EE51
Intersection Summary

Lanes, Volumes, Timings9: Beacon ST & Carlton st 8/20/2012
Baseline Synchro 5 ReportPage 9
NORTHEBOST-EE51
Lane Group EBL EBT EBR WBL WBT WBR NBL NBT NBR SBL SBT SBRLane ConfigurationsIdeal Flow (vphpl) 1900 1900 1900 1900 1900 1900 1900 1900 1900 1900 1900 1900Total Lost Time (s) 4.0 4.0 4.0 4.0 4.0 4.0 4.0 4.0 4.0 4.0 4.0 4.0Leading Detector (ft) 50 50 50 50 50 50Trailing Detector (ft) 0 0 0 0 0 0Turning Speed (mph) 15 9 15 9 15 9 15 9Lane Util. Factor 1.00 0.95 0.95 1.00 0.95 0.95 1.00 1.00 1.00 1.00 1.00 1.00Frt 0.997 0.991 0.994 0.985Flt Protected 0.998 0.996Satd. Flow (prot) 0 3529 0 0 3507 0 0 1848 0 0 1827 0Flt Permitted 0.988 0.948Satd. Flow (perm) 0 3529 0 0 3507 0 0 1829 0 0 1739 0Right Turn on Red Yes Yes Yes YesSatd. Flow (RTOR) 3 11 4 10Headway Factor 1.00 1.00 1.00 1.00 1.00 1.00 1.00 1.00 1.00 1.00 1.00 1.00Link Speed (mph) 30 30 30 30Link Distance (ft) 540 696 353 155Travel Time (s) 12.3 15.8 8.0 3.5Volume (vph) 0 1174 21 0 555 34 14 383 19 18 162 23Peak Hour Factor 1.00 1.00 1.00 1.00 1.00 1.00 1.00 1.00 1.00 1.00 1.00 1.00Adj. Flow (vph) 0 1174 21 0 555 34 14 383 19 18 162 23Lane Group Flow (vph) 0 1195 0 0 589 0 0 416 0 0 203 0Turn Type Perm PermProtected Phases 6 2 4 8Permitted Phases 4 8Detector Phases 6 2 4 4 8 8Minimum Initial (s) 4.0 4.0 4.0 4.0 4.0 4.0Minimum Split (s) 22.0 22.0 22.0 22.0 22.0 22.0Total Split (s) 0.0 43.0 0.0 0.0 43.0 0.0 37.0 37.0 0.0 37.0 37.0 0.0Total Split (%) 0% 54% 0% 0% 54% 0% 46% 46% 0% 46% 46% 0%Maximum Green (s) 37.0 37.0 29.0 29.0 29.0 29.0Yellow Time (s) 4.0 4.0 4.0 4.0 4.0 4.0All-Red Time (s) 2.0 2.0 4.0 4.0 4.0 4.0Lead/LagLead-Lag Optimize?Vehicle Extension (s) 2.0 2.0 2.0 2.0 2.0 2.0Recall Mode None Min Min Min Min MinWalk Time (s) 5.0 5.0 5.0 5.0 5.0 5.0Flash Dont Walk (s) 11.0 11.0 11.0 11.0 11.0 11.0Pedestrian Calls (#/hr) 0 0 0 0 0 0Act Effct Green (s) 25.2 25.2 20.7 20.7Actuated g/C Ratio 0.46 0.46 0.38 0.38v/c Ratio 0.74 0.36 0.60 0.31Uniform Delay, d1 11.3 8.8 13.1 10.9Delay 12.7 10.0 15.1 13.0LOS B A B BApproach Delay 12.7 10.0 15.1 13.0Approach LOS B A B B
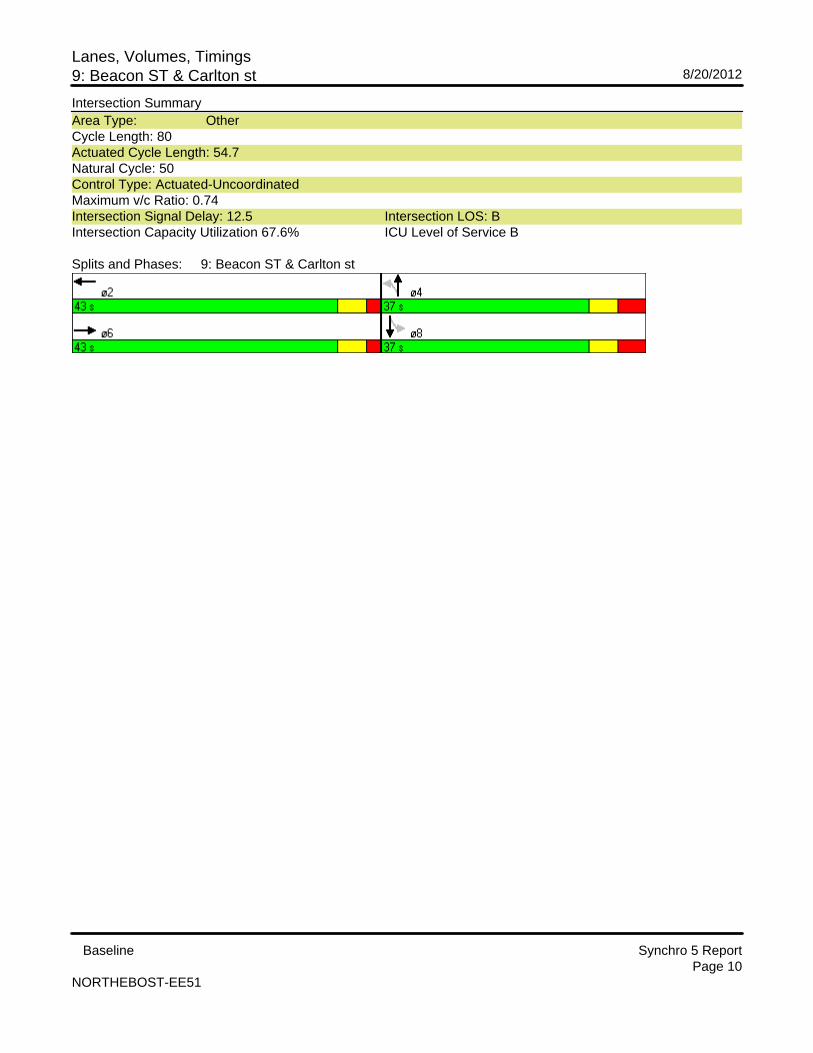
Lanes, Volumes, Timings9: Beacon ST & Carlton st 8/20/2012
Baseline Synchro 5 ReportPage 10
NORTHEBOST-EE51
Intersection SummaryArea Type: OtherCycle Length: 80Actuated Cycle Length: 54.7Natural Cycle: 50Control Type: Actuated-UncoordinatedMaximum v/c Ratio: 0.74Intersection Signal Delay: 12.5 Intersection LOS: BIntersection Capacity Utilization 67.6% ICU Level of Service B
Splits and Phases: 9: Beacon ST & Carlton st

Lanes, Volumes, Timings12: Beacon ST & 8/20/2012
Baseline Synchro 5 ReportPage 11
NORTHEBOST-EE51
Lane Group EBL EBT EBR WBL WBT WBR NBL NBT NBR SBL SBT SBRLane ConfigurationsIdeal Flow (vphpl) 1900 1900 1900 1900 1900 1900 1900 1900 1900 1900 1900 1900Storage Length (ft) 100 0 100 0 0 0 0 0Storage Lanes 1 0 1 0 0 1 0 0Total Lost Time (s) 4.0 4.0 4.0 4.0 4.0 4.0 4.0 4.0 4.0 4.0 4.0 4.0Leading Detector (ft) 50 50 50 50 50Trailing Detector (ft) 0 0 0 0 0Turning Speed (mph) 15 9 15 9 15 9 15 9Lane Util. Factor 1.00 0.95 1.00 1.00 0.95 1.00 1.00 1.00 1.00 1.00 1.00 1.00Frt 0.865Flt Protected 0.950 0.950Satd. Flow (prot) 1770 3539 0 1770 3539 0 0 0 1611 0 0 0Flt Permitted 0.950 0.950Satd. Flow (perm) 1770 3539 0 1770 3539 0 0 0 1611 0 0 0Right Turn on Red Yes Yes Yes YesSatd. Flow (RTOR) 391Headway Factor 1.00 1.00 1.00 1.00 1.00 1.00 1.00 1.00 1.00 1.00 1.00 1.00Link Speed (mph) 30 30 30 30Link Distance (ft) 1047 540 922 406Travel Time (s) 23.8 12.3 21.0 9.2Volume (vph) 69 975 0 58 534 0 0 0 120 0 0 0Peak Hour Factor 1.00 1.00 1.00 1.00 1.00 1.00 1.00 1.00 1.00 1.00 1.00 1.00Adj. Flow (vph) 69 975 0 58 534 0 0 0 120 0 0 0Lane Group Flow (vph) 69 975 0 58 534 0 0 0 120 0 0 0Turn Type Prot Prot customProtected Phases 1 6 5 2 8Permitted Phases 8Detector Phases 1 6 5 2 8Minimum Initial (s) 4.0 4.0 4.0 4.0 4.0Minimum Split (s) 16.0 23.0 16.0 23.0 22.0Total Split (s) 19.0 36.0 0.0 19.0 36.0 0.0 0.0 0.0 25.0 0.0 0.0 0.0Total Split (%) 24% 45% 0% 24% 45% 0% 0% 0% 31% 0% 0% 0%Maximum Green (s) 11.0 30.0 11.0 30.0 18.0Yellow Time (s) 4.0 4.0 4.0 4.0 4.0All-Red Time (s) 4.0 2.0 4.0 2.0 3.0Lead/Lag Lead Lead Lag LagLead-Lag Optimize? Yes Yes Yes YesVehicle Extension (s) 2.0 2.0 2.0 2.0 2.0Recall Mode None None Min None PedWalk Time (s) 5.0 5.0 7.0Flash Dont Walk (s) 11.0 11.0 11.0Pedestrian Calls (#/hr) 0 0 0Act Effct Green (s) 11.3 25.1 10.8 30.5 21.2Actuated g/C Ratio 0.15 0.36 0.16 0.44 0.31v/c Ratio 0.26 0.76 0.21 0.34 0.16Uniform Delay, d1 29.0 21.5 24.1 14.4 0.0Delay 27.8 19.5 27.4 14.5 0.0LOS C B C B AApproach Delay 20.1 15.8
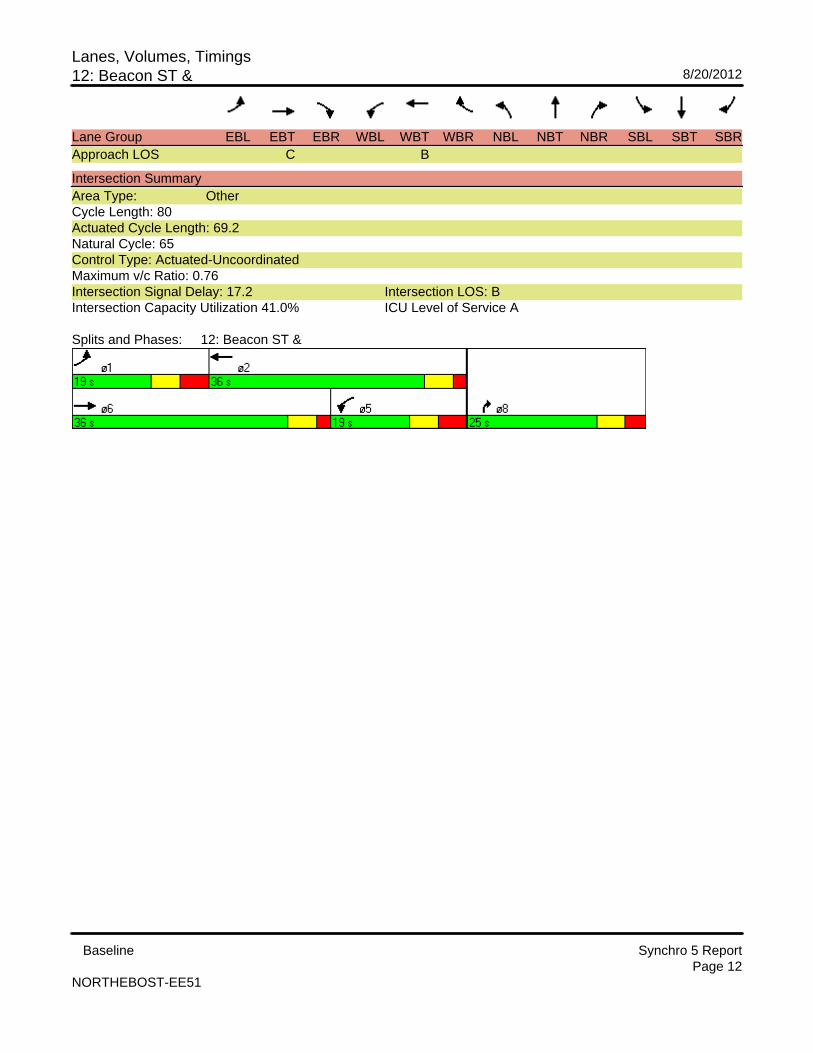
Lanes, Volumes, Timings12: Beacon ST & 8/20/2012
Baseline Synchro 5 ReportPage 12
NORTHEBOST-EE51
Lane Group EBL EBT EBR WBL WBT WBR NBL NBT NBR SBL SBT SBRApproach LOS C B
Intersection SummaryArea Type: OtherCycle Length: 80Actuated Cycle Length: 69.2Natural Cycle: 65Control Type: Actuated-UncoordinatedMaximum v/c Ratio: 0.76Intersection Signal Delay: 17.2 Intersection LOS: BIntersection Capacity Utilization 41.0% ICU Level of Service A
Splits and Phases: 12: Beacon ST &
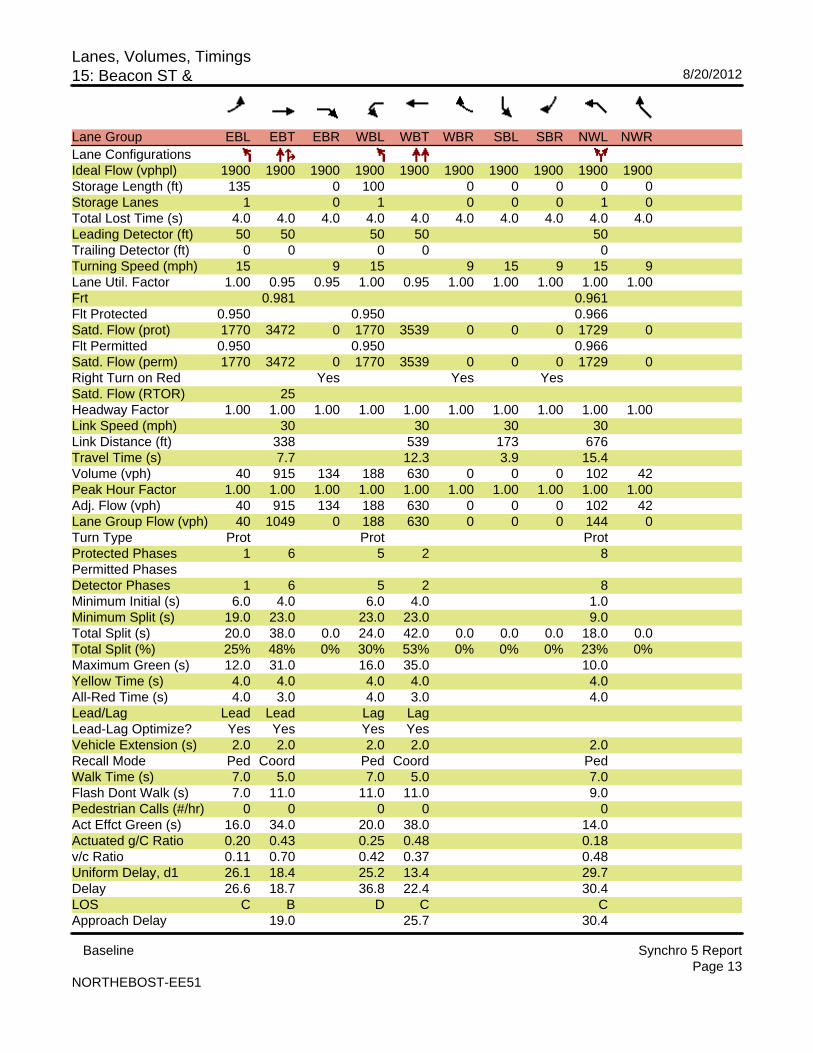
Lanes, Volumes, Timings15: Beacon ST & 8/20/2012
Baseline Synchro 5 ReportPage 13
NORTHEBOST-EE51
Lane Group EBL EBT EBR WBL WBT WBR SBL SBR NWL NWRLane ConfigurationsIdeal Flow (vphpl) 1900 1900 1900 1900 1900 1900 1900 1900 1900 1900Storage Length (ft) 135 0 100 0 0 0 0 0Storage Lanes 1 0 1 0 0 0 1 0Total Lost Time (s) 4.0 4.0 4.0 4.0 4.0 4.0 4.0 4.0 4.0 4.0Leading Detector (ft) 50 50 50 50 50Trailing Detector (ft) 0 0 0 0 0Turning Speed (mph) 15 9 15 9 15 9 15 9Lane Util. Factor 1.00 0.95 0.95 1.00 0.95 1.00 1.00 1.00 1.00 1.00Frt 0.981 0.961Flt Protected 0.950 0.950 0.966Satd. Flow (prot) 1770 3472 0 1770 3539 0 0 0 1729 0Flt Permitted 0.950 0.950 0.966Satd. Flow (perm) 1770 3472 0 1770 3539 0 0 0 1729 0Right Turn on Red Yes Yes YesSatd. Flow (RTOR) 25Headway Factor 1.00 1.00 1.00 1.00 1.00 1.00 1.00 1.00 1.00 1.00Link Speed (mph) 30 30 30 30Link Distance (ft) 338 539 173 676Travel Time (s) 7.7 12.3 3.9 15.4Volume (vph) 40 915 134 188 630 0 0 0 102 42Peak Hour Factor 1.00 1.00 1.00 1.00 1.00 1.00 1.00 1.00 1.00 1.00Adj. Flow (vph) 40 915 134 188 630 0 0 0 102 42Lane Group Flow (vph) 40 1049 0 188 630 0 0 0 144 0Turn Type Prot Prot ProtProtected Phases 1 6 5 2 8Permitted PhasesDetector Phases 1 6 5 2 8Minimum Initial (s) 6.0 4.0 6.0 4.0 1.0Minimum Split (s) 19.0 23.0 23.0 23.0 9.0Total Split (s) 20.0 38.0 0.0 24.0 42.0 0.0 0.0 0.0 18.0 0.0Total Split (%) 25% 48% 0% 30% 53% 0% 0% 0% 23% 0%Maximum Green (s) 12.0 31.0 16.0 35.0 10.0Yellow Time (s) 4.0 4.0 4.0 4.0 4.0All-Red Time (s) 4.0 3.0 4.0 3.0 4.0Lead/Lag Lead Lead Lag LagLead-Lag Optimize? Yes Yes Yes YesVehicle Extension (s) 2.0 2.0 2.0 2.0 2.0Recall Mode Ped Coord Ped Coord PedWalk Time (s) 7.0 5.0 7.0 5.0 7.0Flash Dont Walk (s) 7.0 11.0 11.0 11.0 9.0Pedestrian Calls (#/hr) 0 0 0 0 0Act Effct Green (s) 16.0 34.0 20.0 38.0 14.0Actuated g/C Ratio 0.20 0.43 0.25 0.48 0.18v/c Ratio 0.11 0.70 0.42 0.37 0.48Uniform Delay, d1 26.1 18.4 25.2 13.4 29.7Delay 26.6 18.7 36.8 22.4 30.4LOS C B D C CApproach Delay 19.0 25.7 30.4

Lanes, Volumes, Timings15: Beacon ST & 8/20/2012
Baseline Synchro 5 ReportPage 14
NORTHEBOST-EE51
Lane Group EBL EBT EBR WBL WBT WBR SBL SBR NWL NWRApproach LOS B C C
Intersection SummaryArea Type: OtherCycle Length: 80Actuated Cycle Length: 80Offset: 16 (20%), Referenced to phase 2:WBT and 6:EBT, Start of GreenNatural Cycle: 60Control Type: Actuated-CoordinatedMaximum v/c Ratio: 0.70Intersection Signal Delay: 22.5 Intersection LOS: CIntersection Capacity Utilization 58.2% ICU Level of Service A
Splits and Phases: 15: Beacon ST &
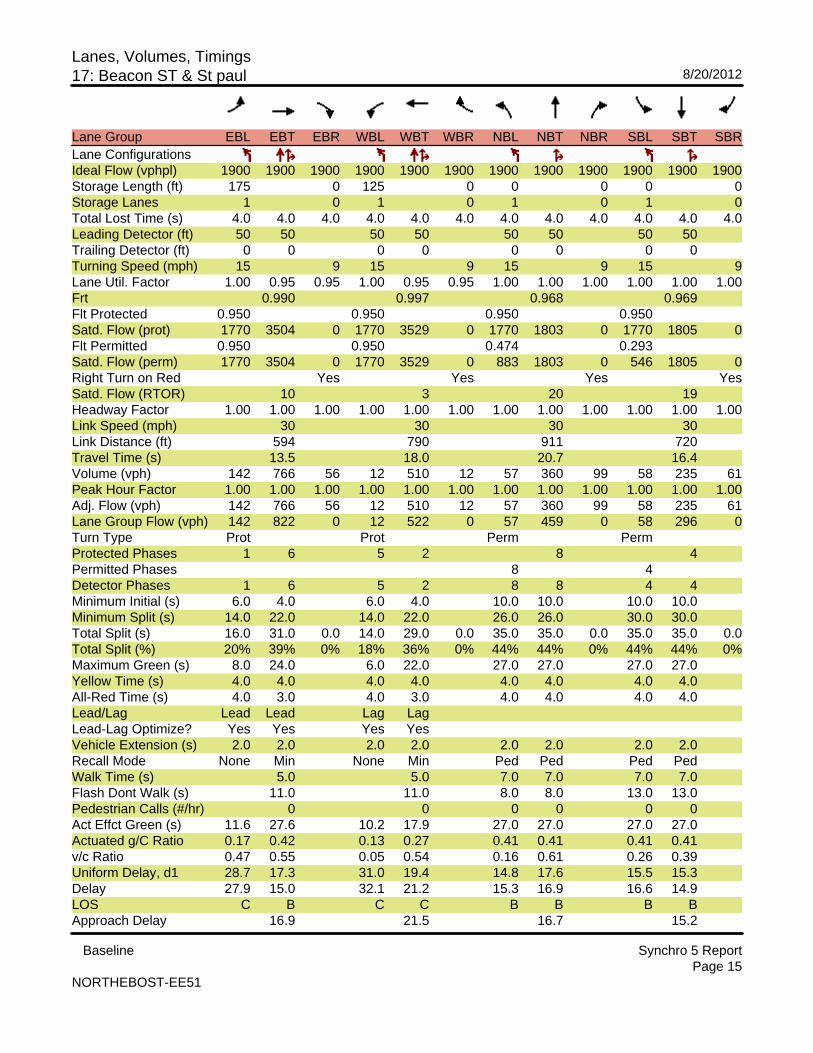
Lanes, Volumes, Timings17: Beacon ST & St paul 8/20/2012
Baseline Synchro 5 ReportPage 15
NORTHEBOST-EE51
Lane Group EBL EBT EBR WBL WBT WBR NBL NBT NBR SBL SBT SBRLane ConfigurationsIdeal Flow (vphpl) 1900 1900 1900 1900 1900 1900 1900 1900 1900 1900 1900 1900Storage Length (ft) 175 0 125 0 0 0 0 0Storage Lanes 1 0 1 0 1 0 1 0Total Lost Time (s) 4.0 4.0 4.0 4.0 4.0 4.0 4.0 4.0 4.0 4.0 4.0 4.0Leading Detector (ft) 50 50 50 50 50 50 50 50Trailing Detector (ft) 0 0 0 0 0 0 0 0Turning Speed (mph) 15 9 15 9 15 9 15 9Lane Util. Factor 1.00 0.95 0.95 1.00 0.95 0.95 1.00 1.00 1.00 1.00 1.00 1.00Frt 0.990 0.997 0.968 0.969Flt Protected 0.950 0.950 0.950 0.950Satd. Flow (prot) 1770 3504 0 1770 3529 0 1770 1803 0 1770 1805 0Flt Permitted 0.950 0.950 0.474 0.293Satd. Flow (perm) 1770 3504 0 1770 3529 0 883 1803 0 546 1805 0Right Turn on Red Yes Yes Yes YesSatd. Flow (RTOR) 10 3 20 19Headway Factor 1.00 1.00 1.00 1.00 1.00 1.00 1.00 1.00 1.00 1.00 1.00 1.00Link Speed (mph) 30 30 30 30Link Distance (ft) 594 790 911 720Travel Time (s) 13.5 18.0 20.7 16.4Volume (vph) 142 766 56 12 510 12 57 360 99 58 235 61Peak Hour Factor 1.00 1.00 1.00 1.00 1.00 1.00 1.00 1.00 1.00 1.00 1.00 1.00Adj. Flow (vph) 142 766 56 12 510 12 57 360 99 58 235 61Lane Group Flow (vph) 142 822 0 12 522 0 57 459 0 58 296 0Turn Type Prot Prot Perm PermProtected Phases 1 6 5 2 8 4Permitted Phases 8 4Detector Phases 1 6 5 2 8 8 4 4Minimum Initial (s) 6.0 4.0 6.0 4.0 10.0 10.0 10.0 10.0Minimum Split (s) 14.0 22.0 14.0 22.0 26.0 26.0 30.0 30.0Total Split (s) 16.0 31.0 0.0 14.0 29.0 0.0 35.0 35.0 0.0 35.0 35.0 0.0Total Split (%) 20% 39% 0% 18% 36% 0% 44% 44% 0% 44% 44% 0%Maximum Green (s) 8.0 24.0 6.0 22.0 27.0 27.0 27.0 27.0Yellow Time (s) 4.0 4.0 4.0 4.0 4.0 4.0 4.0 4.0All-Red Time (s) 4.0 3.0 4.0 3.0 4.0 4.0 4.0 4.0Lead/Lag Lead Lead Lag LagLead-Lag Optimize? Yes Yes Yes YesVehicle Extension (s) 2.0 2.0 2.0 2.0 2.0 2.0 2.0 2.0Recall Mode None Min None Min Ped Ped Ped PedWalk Time (s) 5.0 5.0 7.0 7.0 7.0 7.0Flash Dont Walk (s) 11.0 11.0 8.0 8.0 13.0 13.0Pedestrian Calls (#/hr) 0 0 0 0 0 0Act Effct Green (s) 11.6 27.6 10.2 17.9 27.0 27.0 27.0 27.0Actuated g/C Ratio 0.17 0.42 0.13 0.27 0.41 0.41 0.41 0.41v/c Ratio 0.47 0.55 0.05 0.54 0.16 0.61 0.26 0.39Uniform Delay, d1 28.7 17.3 31.0 19.4 14.8 17.6 15.5 15.3Delay 27.9 15.0 32.1 21.2 15.3 16.9 16.6 14.9LOS C B C C B B B BApproach Delay 16.9 21.5 16.7 15.2
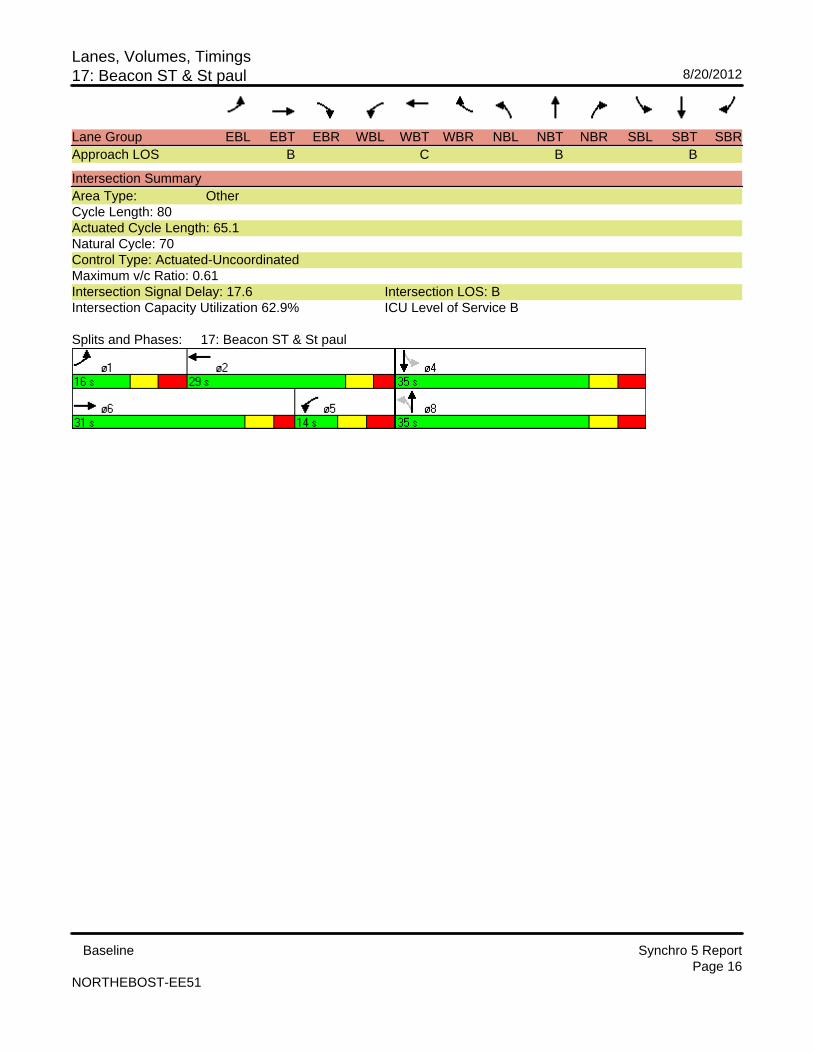
Lanes, Volumes, Timings17: Beacon ST & St paul 8/20/2012
Baseline Synchro 5 ReportPage 16
NORTHEBOST-EE51
Lane Group EBL EBT EBR WBL WBT WBR NBL NBT NBR SBL SBT SBRApproach LOS B C B B
Intersection SummaryArea Type: OtherCycle Length: 80Actuated Cycle Length: 65.1Natural Cycle: 70Control Type: Actuated-UncoordinatedMaximum v/c Ratio: 0.61Intersection Signal Delay: 17.6 Intersection LOS: BIntersection Capacity Utilization 62.9% ICU Level of Service B
Splits and Phases: 17: Beacon ST & St paul
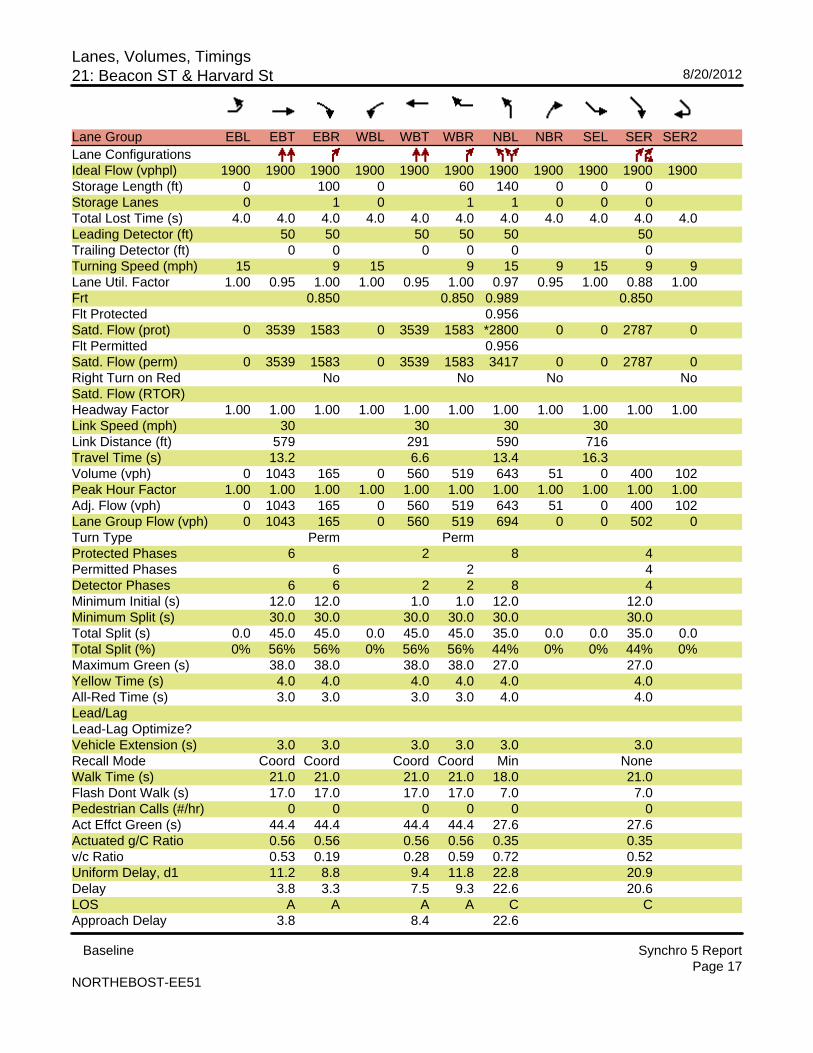
Lanes, Volumes, Timings21: Beacon ST & Harvard St 8/20/2012
Baseline Synchro 5 ReportPage 17
NORTHEBOST-EE51
Lane Group EBL EBT EBR WBL WBT WBR NBL NBR SEL SER SER2Lane ConfigurationsIdeal Flow (vphpl) 1900 1900 1900 1900 1900 1900 1900 1900 1900 1900 1900Storage Length (ft) 0 100 0 60 140 0 0 0Storage Lanes 0 1 0 1 1 0 0 0Total Lost Time (s) 4.0 4.0 4.0 4.0 4.0 4.0 4.0 4.0 4.0 4.0 4.0Leading Detector (ft) 50 50 50 50 50 50Trailing Detector (ft) 0 0 0 0 0 0Turning Speed (mph) 15 9 15 9 15 9 15 9 9Lane Util. Factor 1.00 0.95 1.00 1.00 0.95 1.00 0.97 0.95 1.00 0.88 1.00Frt 0.850 0.850 0.989 0.850Flt Protected 0.956Satd. Flow (prot) 0 3539 1583 0 3539 1583 *2800 0 0 2787 0Flt Permitted 0.956Satd. Flow (perm) 0 3539 1583 0 3539 1583 3417 0 0 2787 0Right Turn on Red No No No NoSatd. Flow (RTOR)Headway Factor 1.00 1.00 1.00 1.00 1.00 1.00 1.00 1.00 1.00 1.00 1.00Link Speed (mph) 30 30 30 30Link Distance (ft) 579 291 590 716Travel Time (s) 13.2 6.6 13.4 16.3Volume (vph) 0 1043 165 0 560 519 643 51 0 400 102Peak Hour Factor 1.00 1.00 1.00 1.00 1.00 1.00 1.00 1.00 1.00 1.00 1.00Adj. Flow (vph) 0 1043 165 0 560 519 643 51 0 400 102Lane Group Flow (vph) 0 1043 165 0 560 519 694 0 0 502 0Turn Type Perm PermProtected Phases 6 2 8 4Permitted Phases 6 2 4Detector Phases 6 6 2 2 8 4Minimum Initial (s) 12.0 12.0 1.0 1.0 12.0 12.0Minimum Split (s) 30.0 30.0 30.0 30.0 30.0 30.0Total Split (s) 0.0 45.0 45.0 0.0 45.0 45.0 35.0 0.0 0.0 35.0 0.0Total Split (%) 0% 56% 56% 0% 56% 56% 44% 0% 0% 44% 0%Maximum Green (s) 38.0 38.0 38.0 38.0 27.0 27.0Yellow Time (s) 4.0 4.0 4.0 4.0 4.0 4.0All-Red Time (s) 3.0 3.0 3.0 3.0 4.0 4.0Lead/LagLead-Lag Optimize?Vehicle Extension (s) 3.0 3.0 3.0 3.0 3.0 3.0Recall Mode Coord Coord Coord Coord Min NoneWalk Time (s) 21.0 21.0 21.0 21.0 18.0 21.0Flash Dont Walk (s) 17.0 17.0 17.0 17.0 7.0 7.0Pedestrian Calls (#/hr) 0 0 0 0 0 0Act Effct Green (s) 44.4 44.4 44.4 44.4 27.6 27.6Actuated g/C Ratio 0.56 0.56 0.56 0.56 0.35 0.35v/c Ratio 0.53 0.19 0.28 0.59 0.72 0.52Uniform Delay, d1 11.2 8.8 9.4 11.8 22.8 20.9Delay 3.8 3.3 7.5 9.3 22.6 20.6LOS A A A A C CApproach Delay 3.8 8.4 22.6
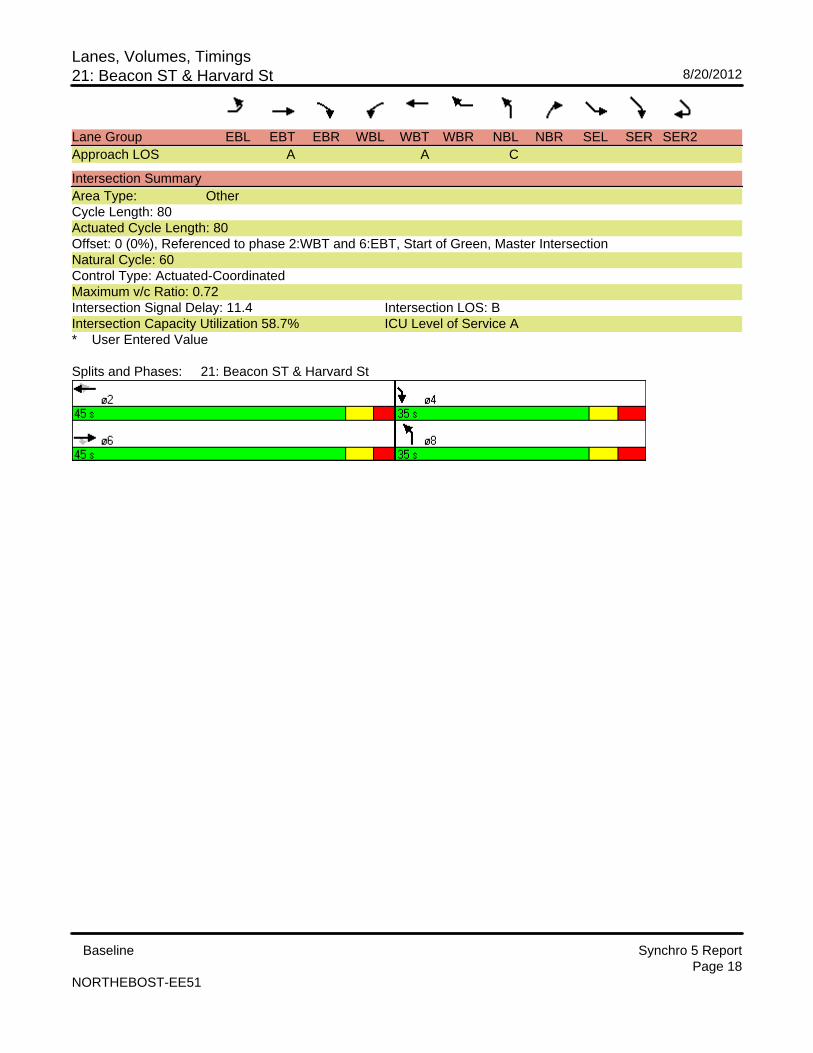
Lanes, Volumes, Timings21: Beacon ST & Harvard St 8/20/2012
Baseline Synchro 5 ReportPage 18
NORTHEBOST-EE51
Lane Group EBL EBT EBR WBL WBT WBR NBL NBR SEL SER SER2Approach LOS A A C
Intersection SummaryArea Type: OtherCycle Length: 80Actuated Cycle Length: 80Offset: 0 (0%), Referenced to phase 2:WBT and 6:EBT, Start of Green, Master IntersectionNatural Cycle: 60Control Type: Actuated-CoordinatedMaximum v/c Ratio: 0.72Intersection Signal Delay: 11.4 Intersection LOS: BIntersection Capacity Utilization 58.7% ICU Level of Service A* User Entered Value
Splits and Phases: 21: Beacon ST & Harvard St
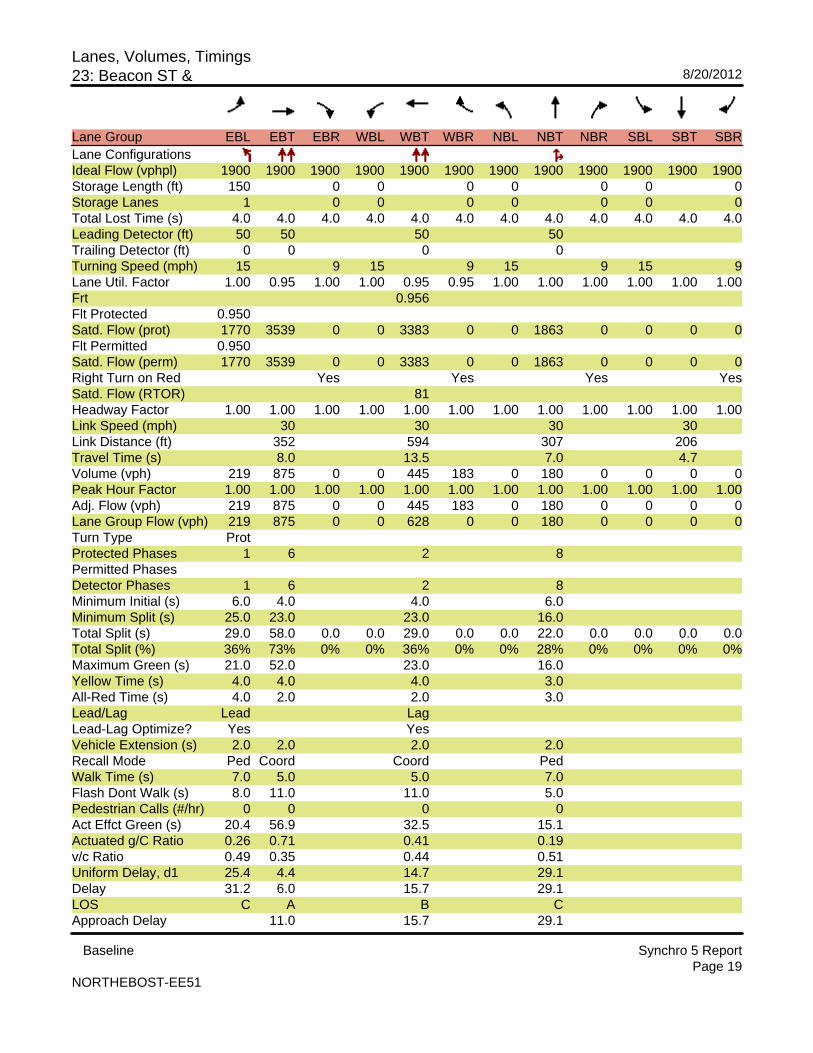
Lanes, Volumes, Timings23: Beacon ST & 8/20/2012
Baseline Synchro 5 ReportPage 19
NORTHEBOST-EE51
Lane Group EBL EBT EBR WBL WBT WBR NBL NBT NBR SBL SBT SBRLane ConfigurationsIdeal Flow (vphpl) 1900 1900 1900 1900 1900 1900 1900 1900 1900 1900 1900 1900Storage Length (ft) 150 0 0 0 0 0 0 0Storage Lanes 1 0 0 0 0 0 0 0Total Lost Time (s) 4.0 4.0 4.0 4.0 4.0 4.0 4.0 4.0 4.0 4.0 4.0 4.0Leading Detector (ft) 50 50 50 50Trailing Detector (ft) 0 0 0 0Turning Speed (mph) 15 9 15 9 15 9 15 9Lane Util. Factor 1.00 0.95 1.00 1.00 0.95 0.95 1.00 1.00 1.00 1.00 1.00 1.00Frt 0.956Flt Protected 0.950Satd. Flow (prot) 1770 3539 0 0 3383 0 0 1863 0 0 0 0Flt Permitted 0.950Satd. Flow (perm) 1770 3539 0 0 3383 0 0 1863 0 0 0 0Right Turn on Red Yes Yes Yes YesSatd. Flow (RTOR) 81Headway Factor 1.00 1.00 1.00 1.00 1.00 1.00 1.00 1.00 1.00 1.00 1.00 1.00Link Speed (mph) 30 30 30 30Link Distance (ft) 352 594 307 206Travel Time (s) 8.0 13.5 7.0 4.7Volume (vph) 219 875 0 0 445 183 0 180 0 0 0 0Peak Hour Factor 1.00 1.00 1.00 1.00 1.00 1.00 1.00 1.00 1.00 1.00 1.00 1.00Adj. Flow (vph) 219 875 0 0 445 183 0 180 0 0 0 0Lane Group Flow (vph) 219 875 0 0 628 0 0 180 0 0 0 0Turn Type ProtProtected Phases 1 6 2 8Permitted PhasesDetector Phases 1 6 2 8Minimum Initial (s) 6.0 4.0 4.0 6.0Minimum Split (s) 25.0 23.0 23.0 16.0Total Split (s) 29.0 58.0 0.0 0.0 29.0 0.0 0.0 22.0 0.0 0.0 0.0 0.0Total Split (%) 36% 73% 0% 0% 36% 0% 0% 28% 0% 0% 0% 0%Maximum Green (s) 21.0 52.0 23.0 16.0Yellow Time (s) 4.0 4.0 4.0 3.0All-Red Time (s) 4.0 2.0 2.0 3.0Lead/Lag Lead LagLead-Lag Optimize? Yes YesVehicle Extension (s) 2.0 2.0 2.0 2.0Recall Mode Ped Coord Coord PedWalk Time (s) 7.0 5.0 5.0 7.0Flash Dont Walk (s) 8.0 11.0 11.0 5.0Pedestrian Calls (#/hr) 0 0 0 0Act Effct Green (s) 20.4 56.9 32.5 15.1Actuated g/C Ratio 0.26 0.71 0.41 0.19v/c Ratio 0.49 0.35 0.44 0.51Uniform Delay, d1 25.4 4.4 14.7 29.1Delay 31.2 6.0 15.7 29.1LOS C A B CApproach Delay 11.0 15.7 29.1
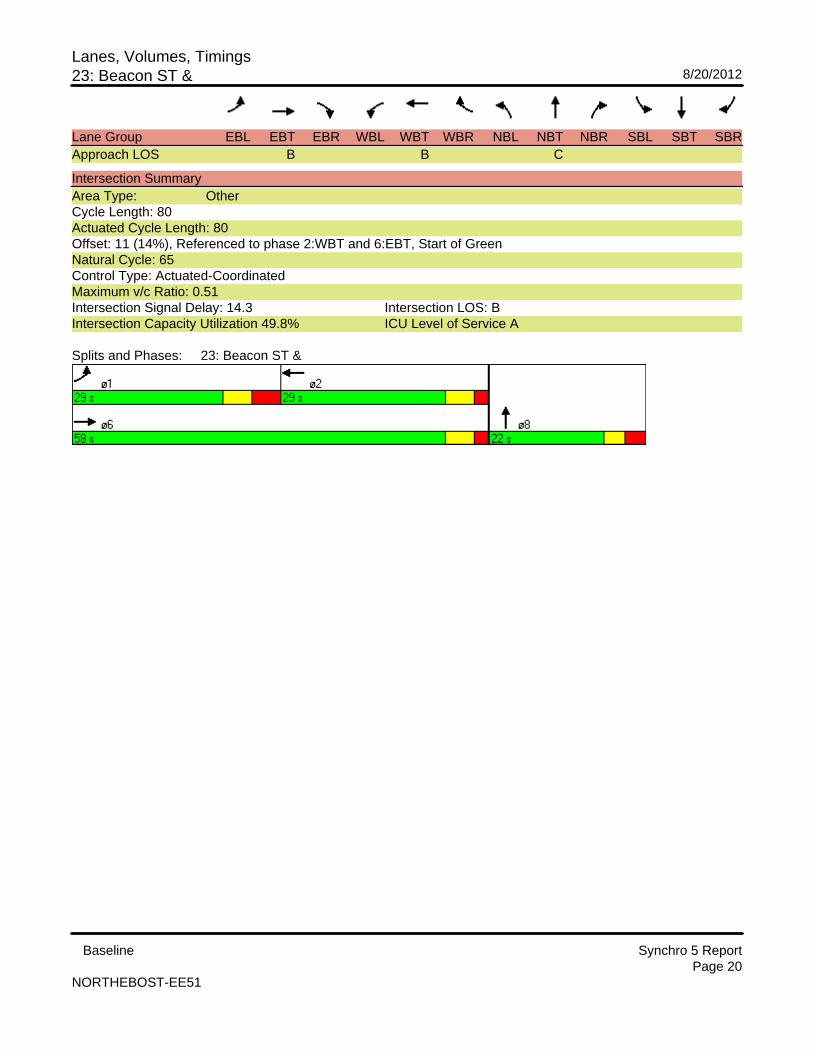
Lanes, Volumes, Timings23: Beacon ST & 8/20/2012
Baseline Synchro 5 ReportPage 20
NORTHEBOST-EE51
Lane Group EBL EBT EBR WBL WBT WBR NBL NBT NBR SBL SBT SBRApproach LOS B B C
Intersection SummaryArea Type: OtherCycle Length: 80Actuated Cycle Length: 80Offset: 11 (14%), Referenced to phase 2:WBT and 6:EBT, Start of GreenNatural Cycle: 65Control Type: Actuated-CoordinatedMaximum v/c Ratio: 0.51Intersection Signal Delay: 14.3 Intersection LOS: BIntersection Capacity Utilization 49.8% ICU Level of Service A
Splits and Phases: 23: Beacon ST &
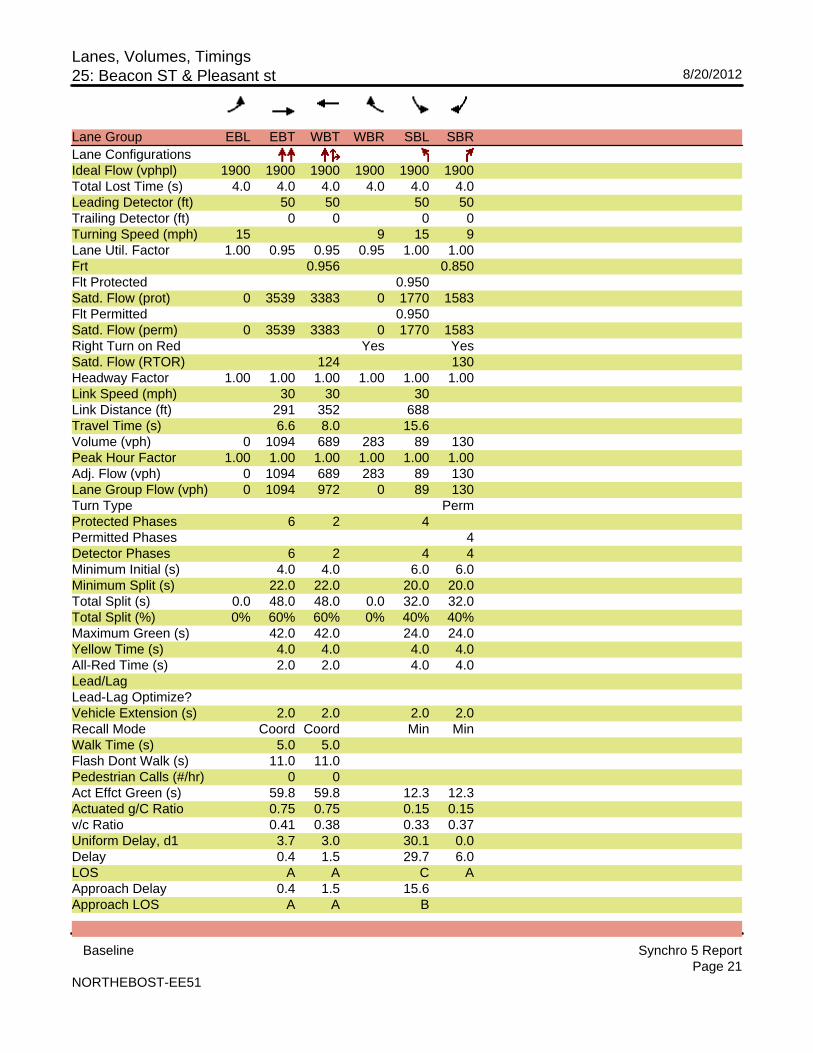
Lanes, Volumes, Timings25: Beacon ST & Pleasant st 8/20/2012
Baseline Synchro 5 ReportPage 21
NORTHEBOST-EE51
Lane Group EBL EBT WBT WBR SBL SBRLane ConfigurationsIdeal Flow (vphpl) 1900 1900 1900 1900 1900 1900Total Lost Time (s) 4.0 4.0 4.0 4.0 4.0 4.0Leading Detector (ft) 50 50 50 50Trailing Detector (ft) 0 0 0 0Turning Speed (mph) 15 9 15 9Lane Util. Factor 1.00 0.95 0.95 0.95 1.00 1.00Frt 0.956 0.850Flt Protected 0.950Satd. Flow (prot) 0 3539 3383 0 1770 1583Flt Permitted 0.950Satd. Flow (perm) 0 3539 3383 0 1770 1583Right Turn on Red Yes YesSatd. Flow (RTOR) 124 130Headway Factor 1.00 1.00 1.00 1.00 1.00 1.00Link Speed (mph) 30 30 30Link Distance (ft) 291 352 688Travel Time (s) 6.6 8.0 15.6Volume (vph) 0 1094 689 283 89 130Peak Hour Factor 1.00 1.00 1.00 1.00 1.00 1.00Adj. Flow (vph) 0 1094 689 283 89 130Lane Group Flow (vph) 0 1094 972 0 89 130Turn Type PermProtected Phases 6 2 4Permitted Phases 4Detector Phases 6 2 4 4Minimum Initial (s) 4.0 4.0 6.0 6.0Minimum Split (s) 22.0 22.0 20.0 20.0Total Split (s) 0.0 48.0 48.0 0.0 32.0 32.0Total Split (%) 0% 60% 60% 0% 40% 40%Maximum Green (s) 42.0 42.0 24.0 24.0Yellow Time (s) 4.0 4.0 4.0 4.0All-Red Time (s) 2.0 2.0 4.0 4.0Lead/LagLead-Lag Optimize?Vehicle Extension (s) 2.0 2.0 2.0 2.0Recall Mode Coord Coord Min MinWalk Time (s) 5.0 5.0Flash Dont Walk (s) 11.0 11.0Pedestrian Calls (#/hr) 0 0Act Effct Green (s) 59.8 59.8 12.3 12.3Actuated g/C Ratio 0.75 0.75 0.15 0.15v/c Ratio 0.41 0.38 0.33 0.37Uniform Delay, d1 3.7 3.0 30.1 0.0Delay 0.4 1.5 29.7 6.0LOS A A C AApproach Delay 0.4 1.5 15.6Approach LOS A A B

Lanes, Volumes, Timings25: Beacon ST & Pleasant st 8/20/2012
Baseline Synchro 5 ReportPage 22
NORTHEBOST-EE51
Intersection SummaryArea Type: OtherCycle Length: 80Actuated Cycle Length: 80Offset: 5 (6%), Referenced to phase 2:WBT and 6:EBT, Start of GreenNatural Cycle: 45Control Type: Actuated-CoordinatedMaximum v/c Ratio: 0.41Intersection Signal Delay: 2.3 Intersection LOS: AIntersection Capacity Utilization 42.8% ICU Level of Service A
Splits and Phases: 25: Beacon ST & Pleasant st
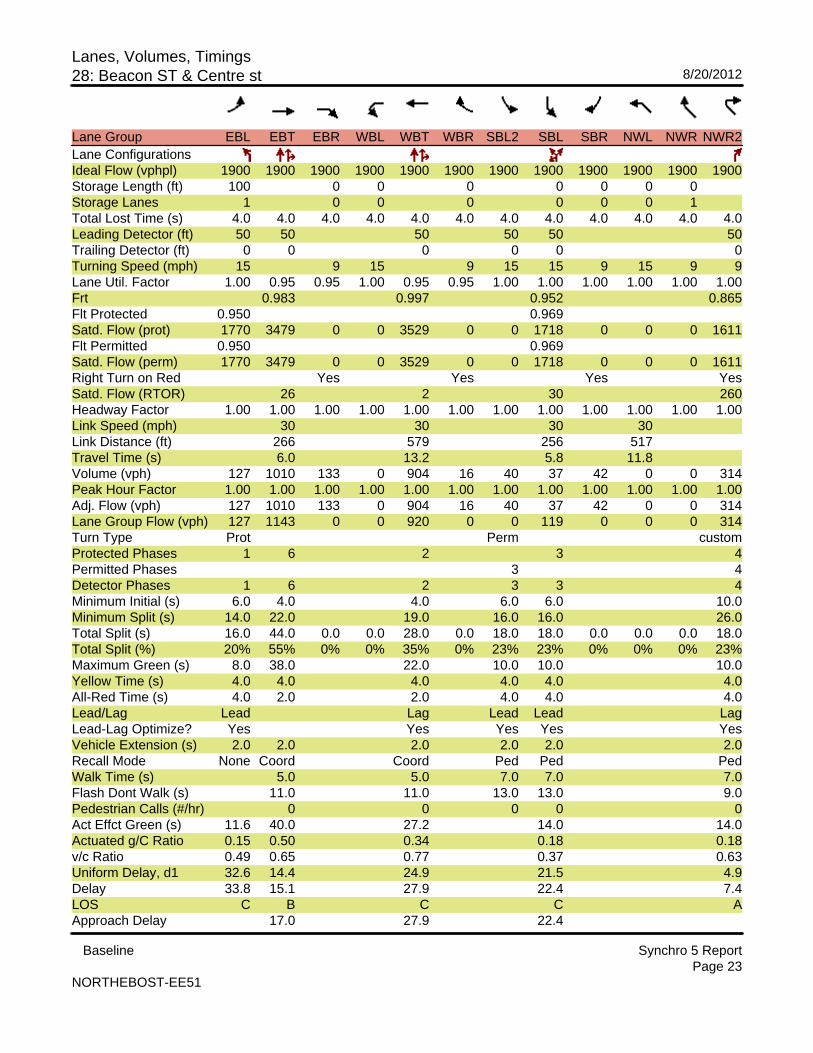
Lanes, Volumes, Timings28: Beacon ST & Centre st 8/20/2012
Baseline Synchro 5 ReportPage 23
NORTHEBOST-EE51
Lane Group EBL EBT EBR WBL WBT WBR SBL2 SBL SBR NWL NWR NWR2Lane ConfigurationsIdeal Flow (vphpl) 1900 1900 1900 1900 1900 1900 1900 1900 1900 1900 1900 1900Storage Length (ft) 100 0 0 0 0 0 0 0Storage Lanes 1 0 0 0 0 0 0 1Total Lost Time (s) 4.0 4.0 4.0 4.0 4.0 4.0 4.0 4.0 4.0 4.0 4.0 4.0Leading Detector (ft) 50 50 50 50 50 50Trailing Detector (ft) 0 0 0 0 0 0Turning Speed (mph) 15 9 15 9 15 15 9 15 9 9Lane Util. Factor 1.00 0.95 0.95 1.00 0.95 0.95 1.00 1.00 1.00 1.00 1.00 1.00Frt 0.983 0.997 0.952 0.865Flt Protected 0.950 0.969Satd. Flow (prot) 1770 3479 0 0 3529 0 0 1718 0 0 0 1611Flt Permitted 0.950 0.969Satd. Flow (perm) 1770 3479 0 0 3529 0 0 1718 0 0 0 1611Right Turn on Red Yes Yes Yes YesSatd. Flow (RTOR) 26 2 30 260Headway Factor 1.00 1.00 1.00 1.00 1.00 1.00 1.00 1.00 1.00 1.00 1.00 1.00Link Speed (mph) 30 30 30 30Link Distance (ft) 266 579 256 517Travel Time (s) 6.0 13.2 5.8 11.8Volume (vph) 127 1010 133 0 904 16 40 37 42 0 0 314Peak Hour Factor 1.00 1.00 1.00 1.00 1.00 1.00 1.00 1.00 1.00 1.00 1.00 1.00Adj. Flow (vph) 127 1010 133 0 904 16 40 37 42 0 0 314Lane Group Flow (vph) 127 1143 0 0 920 0 0 119 0 0 0 314Turn Type Prot Perm customProtected Phases 1 6 2 3 4Permitted Phases 3 4Detector Phases 1 6 2 3 3 4Minimum Initial (s) 6.0 4.0 4.0 6.0 6.0 10.0Minimum Split (s) 14.0 22.0 19.0 16.0 16.0 26.0Total Split (s) 16.0 44.0 0.0 0.0 28.0 0.0 18.0 18.0 0.0 0.0 0.0 18.0Total Split (%) 20% 55% 0% 0% 35% 0% 23% 23% 0% 0% 0% 23%Maximum Green (s) 8.0 38.0 22.0 10.0 10.0 10.0Yellow Time (s) 4.0 4.0 4.0 4.0 4.0 4.0All-Red Time (s) 4.0 2.0 2.0 4.0 4.0 4.0Lead/Lag Lead Lag Lead Lead LagLead-Lag Optimize? Yes Yes Yes Yes YesVehicle Extension (s) 2.0 2.0 2.0 2.0 2.0 2.0Recall Mode None Coord Coord Ped Ped PedWalk Time (s) 5.0 5.0 7.0 7.0 7.0Flash Dont Walk (s) 11.0 11.0 13.0 13.0 9.0Pedestrian Calls (#/hr) 0 0 0 0 0Act Effct Green (s) 11.6 40.0 27.2 14.0 14.0Actuated g/C Ratio 0.15 0.50 0.34 0.18 0.18v/c Ratio 0.49 0.65 0.77 0.37 0.63Uniform Delay, d1 32.6 14.4 24.9 21.5 4.9Delay 33.8 15.1 27.9 22.4 7.4LOS C B C C AApproach Delay 17.0 27.9 22.4
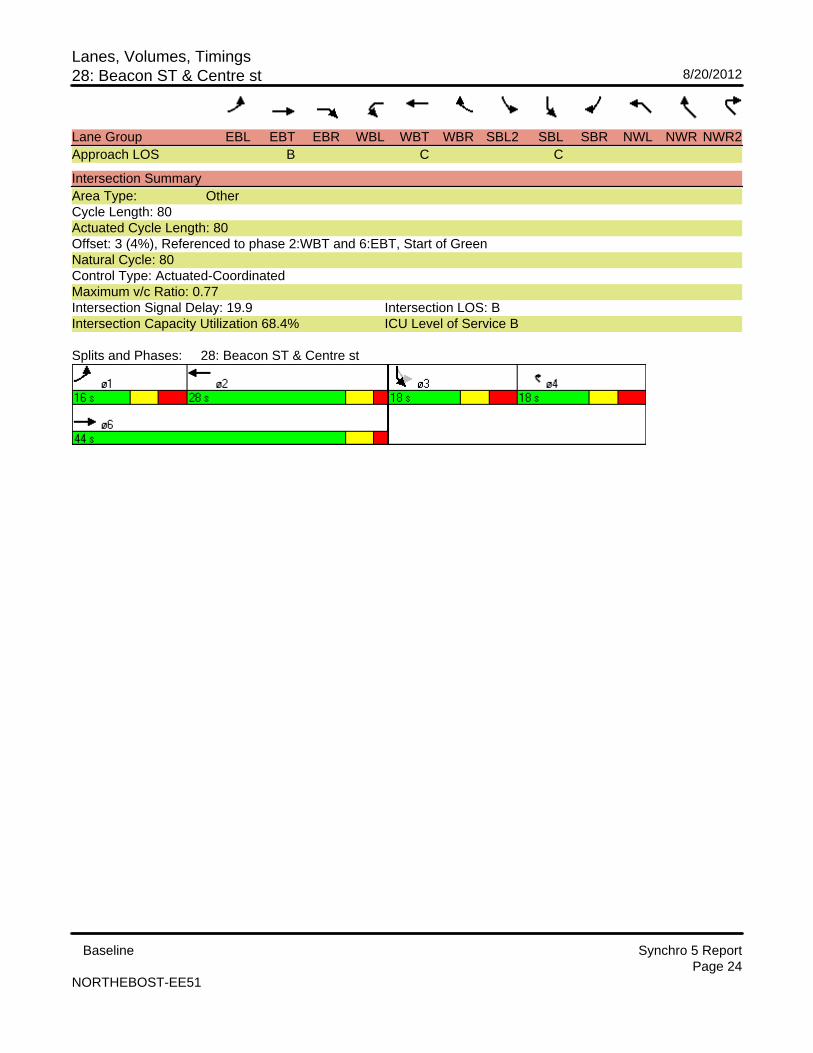
Lanes, Volumes, Timings28: Beacon ST & Centre st 8/20/2012
Baseline Synchro 5 ReportPage 24
NORTHEBOST-EE51
Lane Group EBL EBT EBR WBL WBT WBR SBL2 SBL SBR NWL NWR NWR2Approach LOS B C C
Intersection SummaryArea Type: OtherCycle Length: 80Actuated Cycle Length: 80Offset: 3 (4%), Referenced to phase 2:WBT and 6:EBT, Start of GreenNatural Cycle: 80Control Type: Actuated-CoordinatedMaximum v/c Ratio: 0.77Intersection Signal Delay: 19.9 Intersection LOS: BIntersection Capacity Utilization 68.4% ICU Level of Service B
Splits and Phases: 28: Beacon ST & Centre st
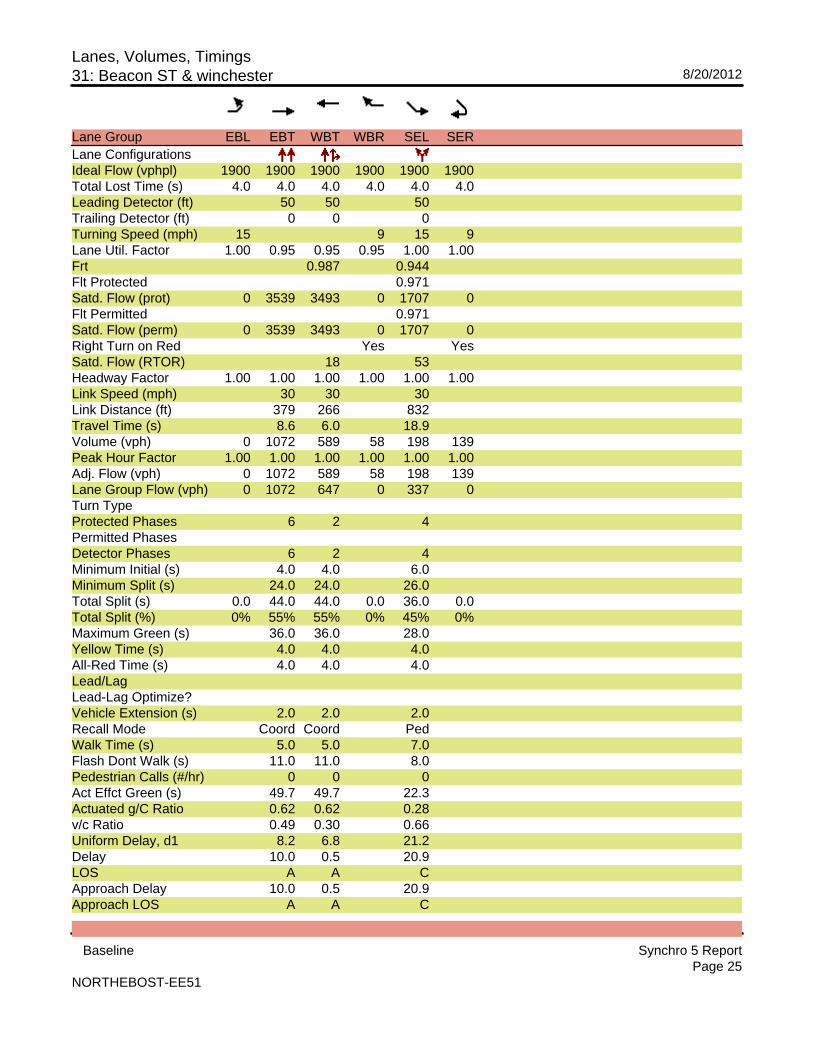
Lanes, Volumes, Timings31: Beacon ST & winchester 8/20/2012
Baseline Synchro 5 ReportPage 25
NORTHEBOST-EE51
Lane Group EBL EBT WBT WBR SEL SERLane ConfigurationsIdeal Flow (vphpl) 1900 1900 1900 1900 1900 1900Total Lost Time (s) 4.0 4.0 4.0 4.0 4.0 4.0Leading Detector (ft) 50 50 50Trailing Detector (ft) 0 0 0Turning Speed (mph) 15 9 15 9Lane Util. Factor 1.00 0.95 0.95 0.95 1.00 1.00Frt 0.987 0.944Flt Protected 0.971Satd. Flow (prot) 0 3539 3493 0 1707 0Flt Permitted 0.971Satd. Flow (perm) 0 3539 3493 0 1707 0Right Turn on Red Yes YesSatd. Flow (RTOR) 18 53Headway Factor 1.00 1.00 1.00 1.00 1.00 1.00Link Speed (mph) 30 30 30Link Distance (ft) 379 266 832Travel Time (s) 8.6 6.0 18.9Volume (vph) 0 1072 589 58 198 139Peak Hour Factor 1.00 1.00 1.00 1.00 1.00 1.00Adj. Flow (vph) 0 1072 589 58 198 139Lane Group Flow (vph) 0 1072 647 0 337 0Turn TypeProtected Phases 6 2 4Permitted PhasesDetector Phases 6 2 4Minimum Initial (s) 4.0 4.0 6.0Minimum Split (s) 24.0 24.0 26.0Total Split (s) 0.0 44.0 44.0 0.0 36.0 0.0Total Split (%) 0% 55% 55% 0% 45% 0%Maximum Green (s) 36.0 36.0 28.0Yellow Time (s) 4.0 4.0 4.0All-Red Time (s) 4.0 4.0 4.0Lead/LagLead-Lag Optimize?Vehicle Extension (s) 2.0 2.0 2.0Recall Mode Coord Coord PedWalk Time (s) 5.0 5.0 7.0Flash Dont Walk (s) 11.0 11.0 8.0Pedestrian Calls (#/hr) 0 0 0Act Effct Green (s) 49.7 49.7 22.3Actuated g/C Ratio 0.62 0.62 0.28v/c Ratio 0.49 0.30 0.66Uniform Delay, d1 8.2 6.8 21.2Delay 10.0 0.5 20.9LOS A A CApproach Delay 10.0 0.5 20.9Approach LOS A A C
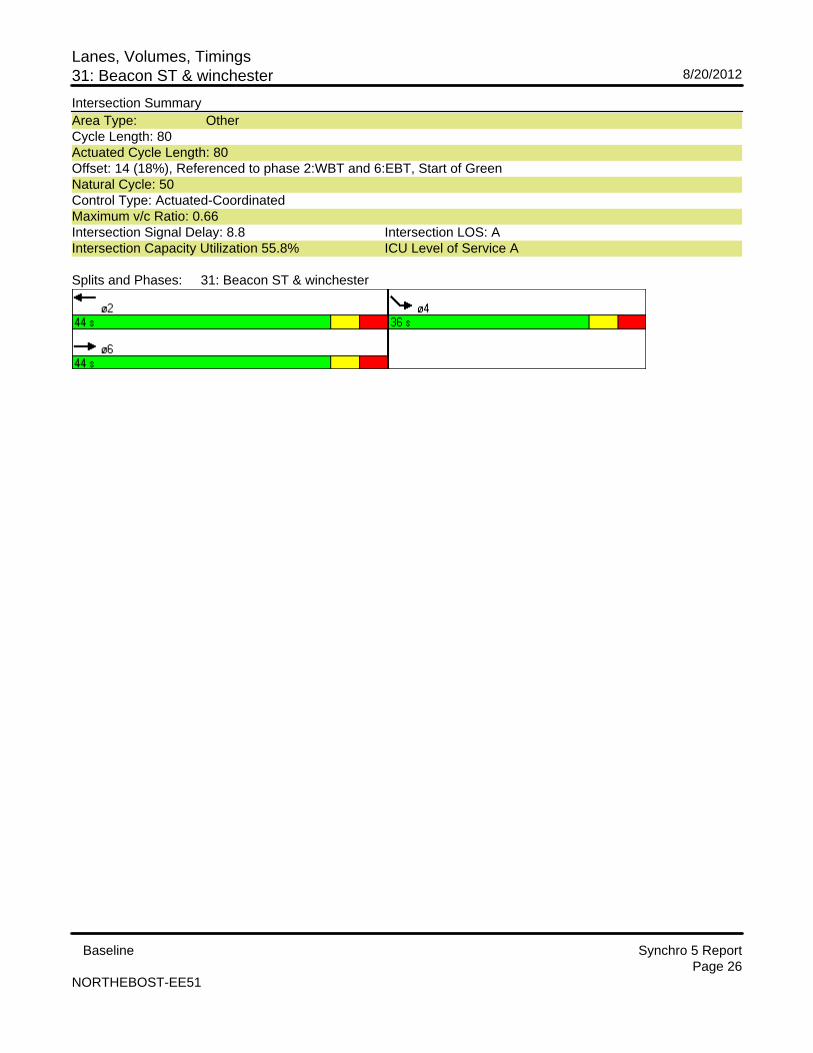
Lanes, Volumes, Timings31: Beacon ST & winchester 8/20/2012
Baseline Synchro 5 ReportPage 26
NORTHEBOST-EE51
Intersection SummaryArea Type: OtherCycle Length: 80Actuated Cycle Length: 80Offset: 14 (18%), Referenced to phase 2:WBT and 6:EBT, Start of GreenNatural Cycle: 50Control Type: Actuated-CoordinatedMaximum v/c Ratio: 0.66Intersection Signal Delay: 8.8 Intersection LOS: AIntersection Capacity Utilization 55.8% ICU Level of Service A
Splits and Phases: 31: Beacon ST & winchester
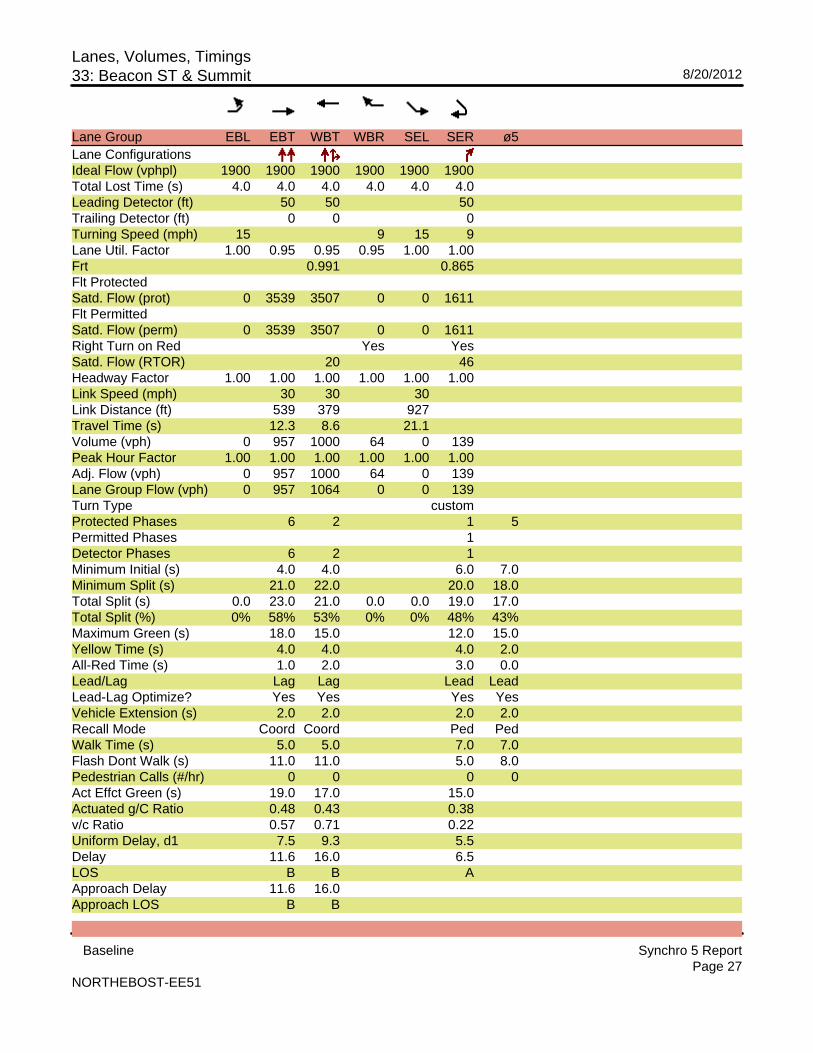
Lanes, Volumes, Timings33: Beacon ST & Summit 8/20/2012
Baseline Synchro 5 ReportPage 27
NORTHEBOST-EE51
Lane Group EBL EBT WBT WBR SEL SER ø5Lane ConfigurationsIdeal Flow (vphpl) 1900 1900 1900 1900 1900 1900Total Lost Time (s) 4.0 4.0 4.0 4.0 4.0 4.0Leading Detector (ft) 50 50 50Trailing Detector (ft) 0 0 0Turning Speed (mph) 15 9 15 9Lane Util. Factor 1.00 0.95 0.95 0.95 1.00 1.00Frt 0.991 0.865Flt ProtectedSatd. Flow (prot) 0 3539 3507 0 0 1611Flt PermittedSatd. Flow (perm) 0 3539 3507 0 0 1611Right Turn on Red Yes YesSatd. Flow (RTOR) 20 46Headway Factor 1.00 1.00 1.00 1.00 1.00 1.00Link Speed (mph) 30 30 30Link Distance (ft) 539 379 927Travel Time (s) 12.3 8.6 21.1Volume (vph) 0 957 1000 64 0 139Peak Hour Factor 1.00 1.00 1.00 1.00 1.00 1.00Adj. Flow (vph) 0 957 1000 64 0 139Lane Group Flow (vph) 0 957 1064 0 0 139Turn Type customProtected Phases 6 2 1 5Permitted Phases 1Detector Phases 6 2 1Minimum Initial (s) 4.0 4.0 6.0 7.0Minimum Split (s) 21.0 22.0 20.0 18.0Total Split (s) 0.0 23.0 21.0 0.0 0.0 19.0 17.0Total Split (%) 0% 58% 53% 0% 0% 48% 43%Maximum Green (s) 18.0 15.0 12.0 15.0Yellow Time (s) 4.0 4.0 4.0 2.0All-Red Time (s) 1.0 2.0 3.0 0.0Lead/Lag Lag Lag Lead LeadLead-Lag Optimize? Yes Yes Yes YesVehicle Extension (s) 2.0 2.0 2.0 2.0Recall Mode Coord Coord Ped PedWalk Time (s) 5.0 5.0 7.0 7.0Flash Dont Walk (s) 11.0 11.0 5.0 8.0Pedestrian Calls (#/hr) 0 0 0 0Act Effct Green (s) 19.0 17.0 15.0Actuated g/C Ratio 0.48 0.43 0.38v/c Ratio 0.57 0.71 0.22Uniform Delay, d1 7.5 9.3 5.5Delay 11.6 16.0 6.5LOS B B AApproach Delay 11.6 16.0Approach LOS B B

Lanes, Volumes, Timings33: Beacon ST & Summit 8/20/2012
Baseline Synchro 5 ReportPage 28
NORTHEBOST-EE51
Intersection SummaryArea Type: OtherCycle Length: 40Actuated Cycle Length: 40Offset: 0 (0%), Referenced to phase 2:WBT and 6:EBT, Start of GreenNatural Cycle: 45Control Type: Actuated-CoordinatedMaximum v/c Ratio: 0.71Intersection Signal Delay: 13.5 Intersection LOS: BIntersection Capacity Utilization 45.0% ICU Level of Service A
Splits and Phases: 33: Beacon ST & Summit

Appendix III
Passenger and Transit Data at Coolidge Corner and St. Paul Street
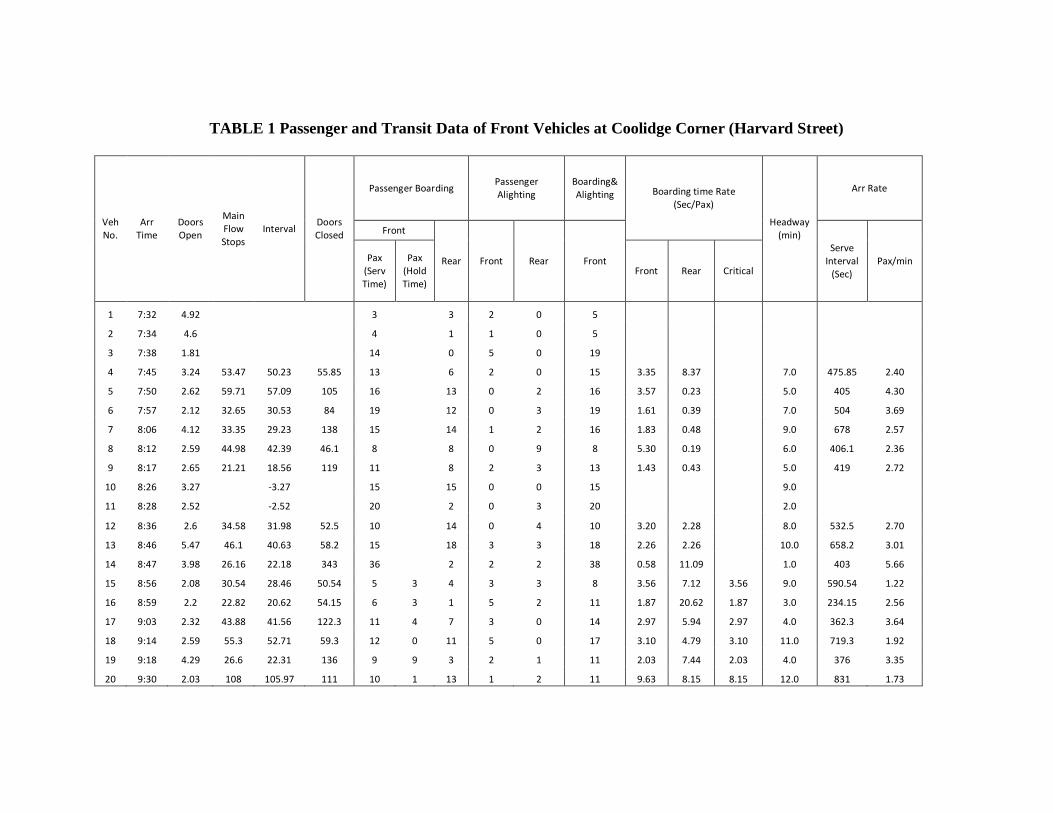
TABLE 1 Passenger and Transit Data of Front Vehicles at Coolidge Corner (Harvard Street)
Veh No.
Arr Time
Doors Open
Main Flow Stops
Interval Doors Closed
Passenger Boarding Passenger Alighting
Boarding& Alighting Boarding time Rate
(Sec/Pax)
Headway (min)
Arr Rate
Front
Rear Front Rear Front Serve
Interval (Sec)
Pax/min Pax (Serv Time)
Pax (Hold Time)
Front Rear Critical
1 7:32 4.92
3
3 2 0 5
2 7:34 4.6
4
1 1 0 5
3 7:38 1.81
14
0 5 0 19
4 7:45 3.24 53.47 50.23 55.85 13
6 2 0 15 3.35 8.37 7.0 475.85 2.40
5 7:50 2.62 59.71 57.09 105 16
13 0 2 16 3.57 0.23 5.0 405 4.30
6 7:57 2.12 32.65 30.53 84 19
12 0 3 19 1.61 0.39 7.0 504 3.69
7 8:06 4.12 33.35 29.23 138 15
14 1 2 16 1.83 0.48 9.0 678 2.57
8 8:12 2.59 44.98 42.39 46.1 8
8 0 9 8 5.30 0.19 6.0 406.1 2.36
9 8:17 2.65 21.21 18.56 119 11
8 2 3 13 1.43 0.43 5.0 419 2.72
10 8:26 3.27
-3.27
15
15 0 0 15 9.0
11 8:28 2.52
-2.52
20
2 0 3 20 2.0
12 8:36 2.6 34.58 31.98 52.5 10
14 0 4 10 3.20 2.28 8.0 532.5 2.70
13 8:46 5.47 46.1 40.63 58.2 15
18 3 3 18 2.26 2.26 10.0 658.2 3.01
14 8:47 3.98 26.16 22.18 343 36
2 2 2 38 0.58 11.09 1.0 403 5.66
15 8:56 2.08 30.54 28.46 50.54 5 3 4 3 3 8 3.56 7.12 3.56 9.0 590.54 1.22
16 8:59 2.2 22.82 20.62 54.15 6 3 1 5 2 11 1.87 20.62 1.87 3.0 234.15 2.56
17 9:03 2.32 43.88 41.56 122.3 11 4 7 3 0 14 2.97 5.94 2.97 4.0 362.3 3.64
18 9:14 2.59 55.3 52.71 59.3 12 0 11 5 0 17 3.10 4.79 3.10 11.0 719.3 1.92
19 9:18 4.29 26.6 22.31 136 9 9 3 2 1 11 2.03 7.44 2.03 4.0 376 3.35
20 9:30 2.03 108 105.97 111 10 1 13 1 2 11 9.63 8.15 8.15 12.0 831 1.73
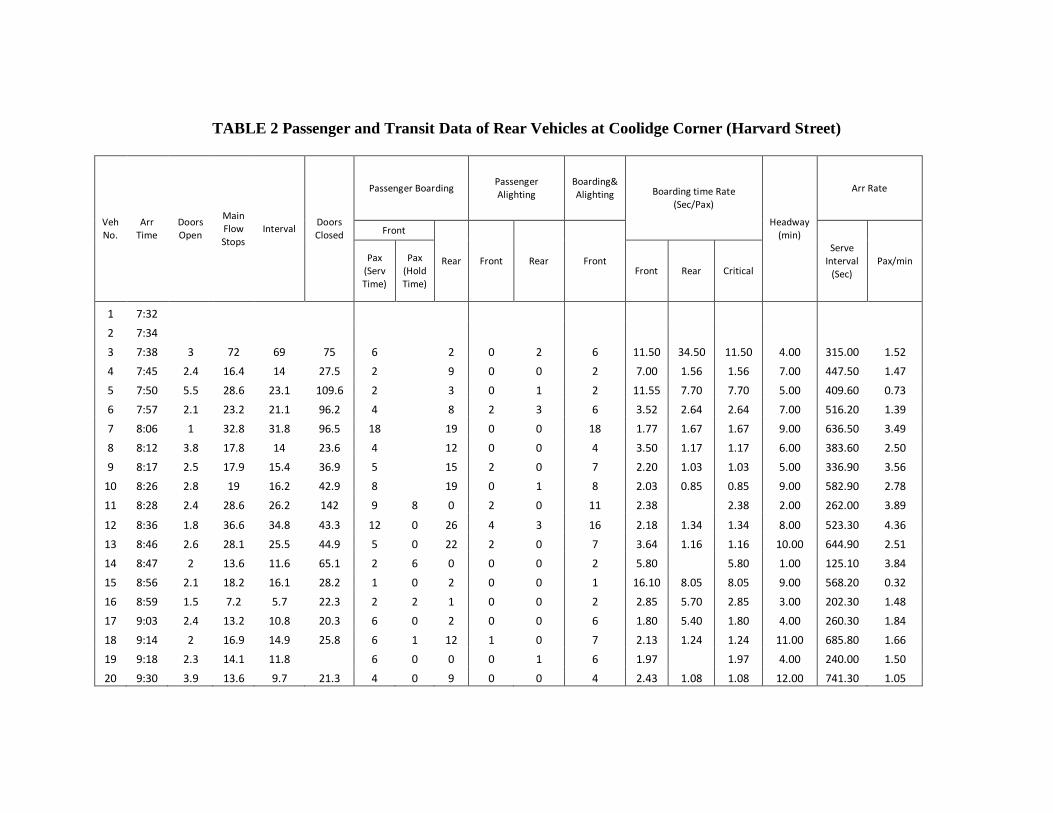
TABLE 2 Passenger and Transit Data of Rear Vehicles at Coolidge Corner (Harvard Street)
Veh No.
Arr Time
Doors Open
Main Flow Stops
Interval Doors Closed
Passenger Boarding Passenger Alighting
Boarding& Alighting Boarding time Rate
(Sec/Pax)
Headway (min)
Arr Rate
Front
Rear Front Rear Front Serve
Interval (Sec)
Pax/min Pax (Serv Time)
Pax (Hold Time)
Front Rear Critical
1 7:32 2 7:34 3 7:38 3 72 69 75 6
2 0 2 6 11.50 34.50 11.50 4.00 315.00 1.52
4 7:45 2.4 16.4 14 27.5 2
9 0 0 2 7.00 1.56 1.56 7.00 447.50 1.47 5 7:50 5.5 28.6 23.1 109.6 2
3 0 1 2 11.55 7.70 7.70 5.00 409.60 0.73
6 7:57 2.1 23.2 21.1 96.2 4
8 2 3 6 3.52 2.64 2.64 7.00 516.20 1.39 7 8:06 1 32.8 31.8 96.5 18
19 0 0 18 1.77 1.67 1.67 9.00 636.50 3.49
8 8:12 3.8 17.8 14 23.6 4
12 0 0 4 3.50 1.17 1.17 6.00 383.60 2.50 9 8:17 2.5 17.9 15.4 36.9 5
15 2 0 7 2.20 1.03 1.03 5.00 336.90 3.56
10 8:26 2.8 19 16.2 42.9 8
19 0 1 8 2.03 0.85 0.85 9.00 582.90 2.78 11 8:28 2.4 28.6 26.2 142 9 8 0 2 0 11 2.38 2.38 2.00 262.00 3.89
12 8:36 1.8 36.6 34.8 43.3 12 0 26 4 3 16 2.18 1.34 1.34 8.00 523.30 4.36 13 8:46 2.6 28.1 25.5 44.9 5 0 22 2 0 7 3.64 1.16 1.16 10.00 644.90 2.51 14 8:47 2 13.6 11.6 65.1 2 6 0 0 0 2 5.80 5.80 1.00 125.10 3.84 15 8:56 2.1 18.2 16.1 28.2 1 0 2 0 0 1 16.10 8.05 8.05 9.00 568.20 0.32 16 8:59 1.5 7.2 5.7 22.3 2 2 1 0 0 2 2.85 5.70 2.85 3.00 202.30 1.48 17 9:03 2.4 13.2 10.8 20.3 6 0 2 0 0 6 1.80 5.40 1.80 4.00 260.30 1.84 18 9:14 2 16.9 14.9 25.8 6 1 12 1 0 7 2.13 1.24 1.24 11.00 685.80 1.66 19 9:18 2.3 14.1 11.8
6 0 0 0 1 6 1.97 1.97 4.00 240.00 1.50
20 9:30 3.9 13.6 9.7 21.3 4 0 9 0 0 4 2.43 1.08 1.08 12.00 741.30 1.05
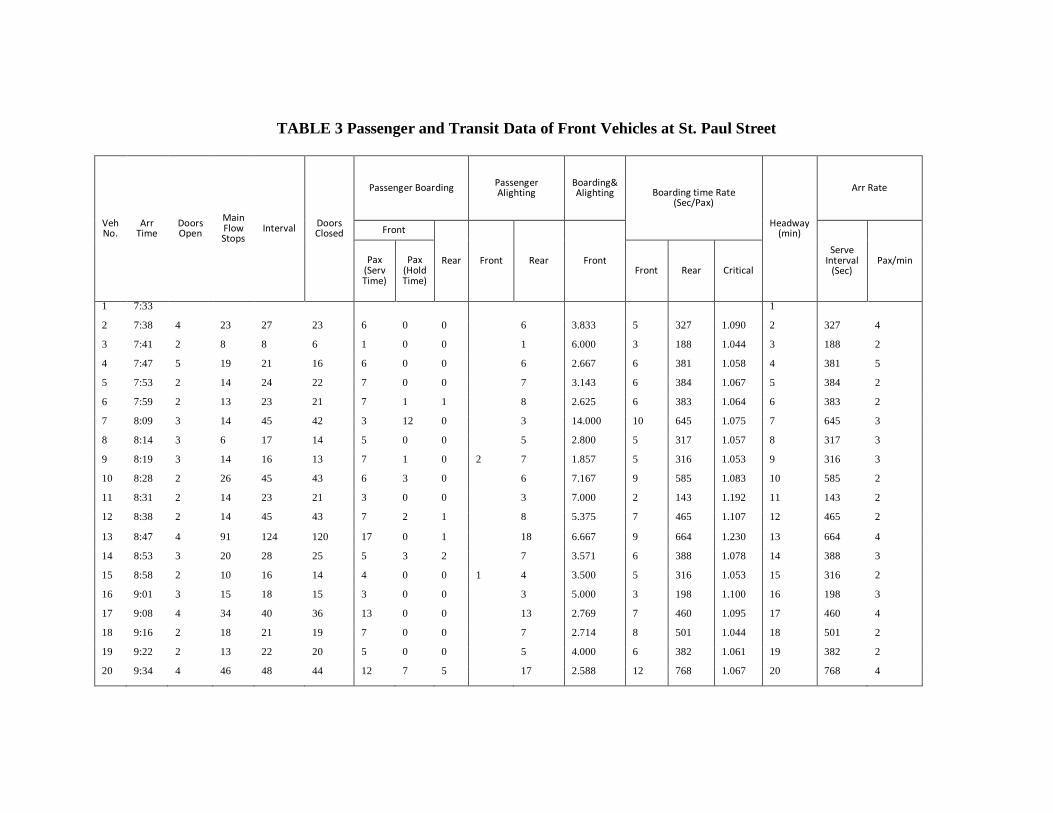
TABLE 3 Passenger and Transit Data of Front Vehicles at St. Paul Street
Veh No.
Arr Time
Doors Open
Main Flow Stops
Interval Doors Closed
Passenger Boarding Passenger Alighting
Boarding& Alighting Boarding time Rate
(Sec/Pax)
Headway (min)
Arr Rate
Front
Rear Front Rear Front Serve
Interval (Sec)
Pax/min Pax (Serv Time)
Pax (Hold Time)
Front Rear Critical
1 7:33 1
2 7:38 4 23 27 23 6 0 0 6 3.833 5 327 1.090 2 327 4
3 7:41 2 8 8 6 1 0 0 1 6.000 3 188 1.044 3 188 2
4 7:47 5 19 21 16 6 0 0 6 2.667 6 381 1.058 4 381 5
5 7:53 2 14 24 22 7 0 0 7 3.143 6 384 1.067 5 384 2
6 7:59 2 13 23 21 7 1 1 8 2.625 6 383 1.064 6 383 2
7 8:09 3 14 45 42 3 12 0 3 14.000 10 645 1.075 7 645 3
8 8:14 3 6 17 14 5 0 0 5 2.800 5 317 1.057 8 317 3
9 8:19 3 14 16 13 7 1 0 2 7 1.857 5 316 1.053 9 316 3
10 8:28 2 26 45 43 6 3 0 6 7.167 9 585 1.083 10 585 2
11 8:31 2 14 23 21 3 0 0 3 7.000 2 143 1.192 11 143 2
12 8:38 2 14 45 43 7 2 1 8 5.375 7 465 1.107 12 465 2
13 8:47 4 91 124 120 17 0 1 18 6.667 9 664 1.230 13 664 4
14 8:53 3 20 28 25 5 3 2 7 3.571 6 388 1.078 14 388 3
15 8:58 2 10 16 14 4 0 0 1 4 3.500 5 316 1.053 15 316 2
16 9:01 3 15 18 15 3 0 0 3 5.000 3 198 1.100 16 198 3
17 9:08 4 34 40 36 13 0 0 13 2.769 7 460 1.095 17 460 4
18 9:16 2 18 21 19 7 0 0 7 2.714 8 501 1.044 18 501 2
19 9:22 2 13 22 20 5 0 0 5 4.000 6 382 1.061 19 382 2
20 9:34 4 46 48 44 12 7 5 17 2.588 12 768 1.067 20 768 4
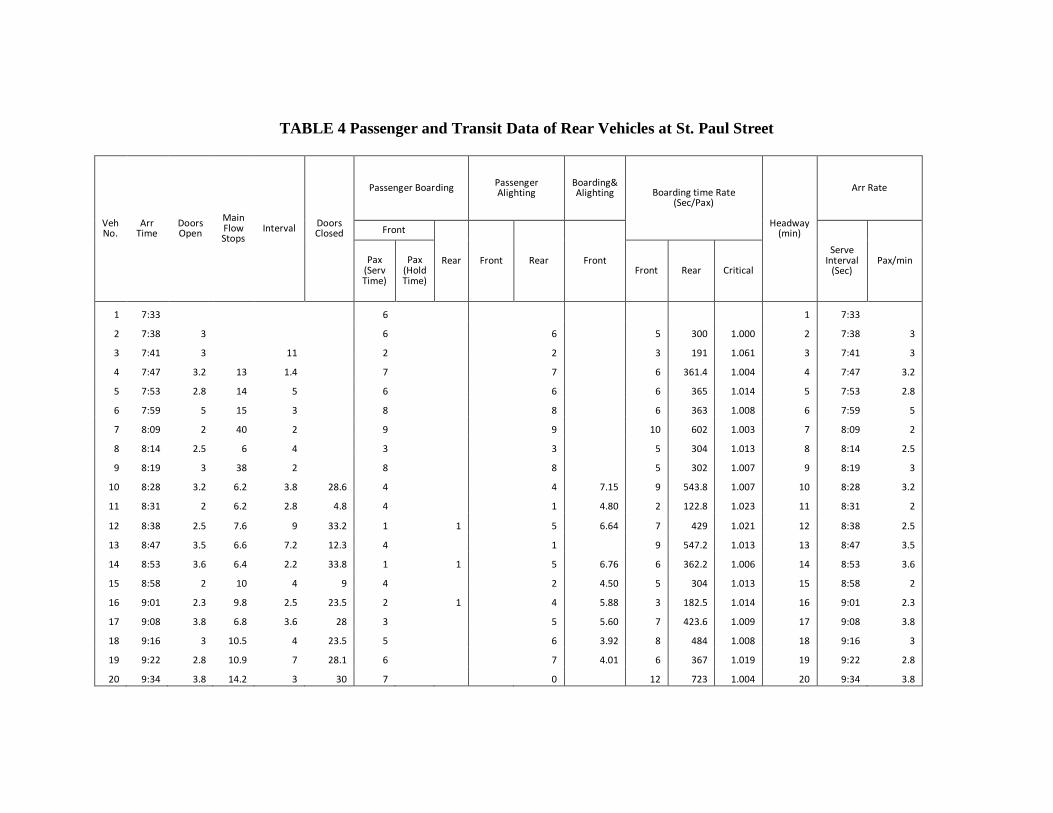
TABLE 4 Passenger and Transit Data of Rear Vehicles at St. Paul Street
Veh No.
Arr Time
Doors Open
Main Flow Stops
Interval Doors Closed
Passenger Boarding Passenger Alighting
Boarding& Alighting Boarding time Rate
(Sec/Pax)
Headway (min)
Arr Rate
Front
Rear Front Rear Front Serve
Interval (Sec)
Pax/min Pax (Serv Time)
Pax (Hold Time)
Front Rear Critical
1 7:33 6 1 7:33
2 7:38 3
6 6 5 300 1.000 2 7:38 3
3 7:41 3
11
2 2 3 191 1.061 3 7:41 3
4 7:47 3.2 13 1.4
7 7 6 361.4 1.004 4 7:47 3.2
5 7:53 2.8 14 5
6 6 6 365 1.014 5 7:53 2.8
6 7:59 5 15 3
8 8 6 363 1.008 6 7:59 5
7 8:09 2 40 2
9 9 10 602 1.003 7 8:09 2
8 8:14 2.5 6 4
3 3 5 304 1.013 8 8:14 2.5
9 8:19 3 38 2
8 8 5 302 1.007 9 8:19 3
10 8:28 3.2 6.2 3.8 28.6 4 4 7.15 9 543.8 1.007 10 8:28 3.2
11 8:31 2 6.2 2.8 4.8 4 1 4.80 2 122.8 1.023 11 8:31 2
12 8:38 2.5 7.6 9 33.2 1 1 5 6.64 7 429 1.021 12 8:38 2.5
13 8:47 3.5 6.6 7.2 12.3 4 1 9 547.2 1.013 13 8:47 3.5
14 8:53 3.6 6.4 2.2 33.8 1 1 5 6.76 6 362.2 1.006 14 8:53 3.6
15 8:58 2 10 4 9 4 2 4.50 5 304 1.013 15 8:58 2
16 9:01 2.3 9.8 2.5 23.5 2 1 4 5.88 3 182.5 1.014 16 9:01 2.3
17 9:08 3.8 6.8 3.6 28 3 5 5.60 7 423.6 1.009 17 9:08 3.8
18 9:16 3 10.5 4 23.5 5 6 3.92 8 484 1.008 18 9:16 3
19 9:22 2.8 10.9 7 28.1 6 7 4.01 6 367 1.019 19 9:22 2.8
20 9:34 3.8 14.2 3 30 7 0 12 723 1.004 20 9:34 3.8

Appendix IV
Data Disc Attached
For the following items, please refer to the Attached Disc:
• Intersection Plans and Signal Information of Existing Condition • Synchro Network Files • VISSIM Simulation Network Files • Simulation results Analysis Spreadsheets • Passenger and Transit Data from MBTA • AutoCaD Sketch- Corridor of Beacon St. from Marion St. to St. Mary St., Brookline, MA.