Embed Size (px)
Citation preview

inside cover
February 2013
Transit-Oriented Development Typology Strategy for Allegheny County
An Initiative of the Pittsburgh Community Reinvestment Group
AcknowledgementsTh is report was made possible with the generous support of the Heinz Endowments.
Heinz’s work is grounded in the legacy established by the two endowments from which it was formed – the Howard Heinz Endowment and the Vira L. Heinz Endowment – and uses our region as a laboratory for the development of solutions to challenges that are na-tional in scope. Heinz’s fi elds of emphasis include general philanthropy and the disciplines represented by our fi ve grant-making programs: Arts & Culture; Children, Youth & Fami-lies; Education; Environment; and Innovation Economy.
Th e Center for Transit-Oriented Development (CTOD) authored the report in part-nership with the Pittsburgh Community Reinvestment Group (PCRG), on behalf of GoBurgh. GoBurgh is the leading non-partisan voice on transit for the Pittsburgh region. With a rich knowledge base, extensive research-backed data and a wealth of information on transit-oriented issues, GoBurgh acts as a convener of organizations and communities in the Pittsburgh region, working toward sustainable and vibrant transit infrastructure.
GoBurgh exists as part of the Regional Policy program of the Pittsburgh Community Re-investment Group (PCRG) and as such brings a community-oriented voice to transporta-tion planning, integrates transportation and land use policies, and leverages transporta-tion assets as community revitalization and economic development tools. GoBurgh also monitors and works with local, regional and state government agencies to ensure smart and equitable legislative policy development.
Th e Center for Transit-Oriented Development (CTOD) is the only national non-profi t eff ort dedicated to providing best practices, research and tools to support equitable market-based transit-oriented development. CTOD partners with both the public and private market sectors to strategize about ways to encourage the development of high per-forming communities around transit stations and to build transit systems that maximize development potential. CTOD works to integrate local and regional planning, generate new tools for economic development, real estate and investment issues, improve aff ord-ability and livability for all members of the community, and respond to imperatives for climate change and sustainability. Th e Center for TOD is a partnership of Reconnecting America, the Center for Neighborhood Technology, and Strategic Economics. For more information go to CTOD’s website at http://www.ctod.org.
Steering Committee:Patrick Roberts: Principal Transportation Planner, City of Pittsburgh Department of City PlanningAllegheny Conference on Community Development:
Ken Zapinski: Sr. Vice President, Energy and InfrastructureWill Bernstein: Policy Analyst
Eric Stoller: Program Offi cer, Community Revitalization, Th e Heinz Endowments
Jay Rickabaugh: Project Manager, Congress of Neighboring CommunitiesMatt Smith: President, National Association of Industrial and Offi ce Properties and Red Swing GroupDon Carter: Director, Remaking Cities Institute, Carnegie Mellon UniversityLynn Colosi: Sr. Vice President, Clearview StrategiesLocal Government Academy:
Susan Hockenberry: Executive DirectorSara Welch: Outreach and Communications Manager
Vinh Ly: Planner III, Allegheny County Economic DevelopmentRebecca Davidson-Wagner: Manager, Pittsburgh Urban Initiatives, Urban Redevelop-ment Authority of PittsburghStefani Danes: Principal, Perkins Eastman ArchitectsPort Authority of Allegheny County:
Wendy Stern: Assistant General Manager, Planning and DevelopmentDavid Wohlwill: Program Manager, Long-Range Planning
Eric Milliron: Commercial Districts Manager, Municipality of Mt. LebanonJim Richter: Executive Director, Hazelwood Initiative
Th e following people and organizations were invaluable to our understanding of TOD challenges throughout Allegheny County and understanding the opportunities and priorities. Th eir input was vital to this report.
Jerry Duke: Planning Director, Municipality of Bethel ParkSouthwestern Pennsylvania Commission:
Jim Hassinger: President and CEOChuck DiPietro: Transportation Planning DirectorTom Klevan: Coordinator, Regional Transit ProjectsDavid Totten: Transit PlannerChuck Imbrogno: Models/Data Analysis Manager
Urban Redevelopment Authority of Pittsburgh:Susheela Nemani-Stranger: Manager, Economic DevelopmentRebecca Schenck: Project Development Specialist
Jerome Jackson: Executive Director, Operation Better Block, Inc.Tracey Evans: Executive Director, Wilkinsburg CDC and Wilkinsburg Borough Coun-cil memberWanda Wilson: Executive Director, Oakland Planning and Development Corp.Jeanne McNutt: Executive Director, Uptown Partners of PittsburghDarryl Phillips: Lead Traffi c Engineer, Parsons Brinkerhoff
Transit-Oriented Development Typology Strategy for Allegheny County II

Transit-Oriented Development Typology Strategy for Allegheny CountyIII
Pittsburgh Community Reinvestment Group:Ernie Hogan: Executive DirectorBreen Masciotra: Regional Outreach ManagerEd Nusser: Land Use Policy CoordinatorSteve Novotny: Community Coordinator - Sheraden
East Liberty Development, Inc.:Nathan Cunningham: Director of Real Estate DevelopmentSkip Schwab: Director of Operations
Mark Minnerly: Director of Real EstateJason Kambitsis: Executive Director, Mt. Washington CDCGreg Jones: Executive Director, Economic Development SouthLucinda Beattie: Vice President of Transportation, Pittsburgh Downtown PartnershipScott Bricker: Bike Pittsburgh
Report Contributors:Project Manager: Chris Sandvig, Regional Policy Director and Typology Project Manager, Pittsburgh Community Reinvestment GroupLead Authors: Abigail Th orne-Lyman, Reconnecting America Christopher Yake, Reconnecting America Alison Nemirow, Strategic Economics Nadine Fogarty, Strategic EconomicsContributing Authors: Breen Masciotra, PCRG Bill Sadler, Reconnecting America Toral Patel, Reconnecting America Irving Pham, Reconnecting America Jeff Wood, Reconnecting AmericaDesigner: John Hughes, Reconnecting America
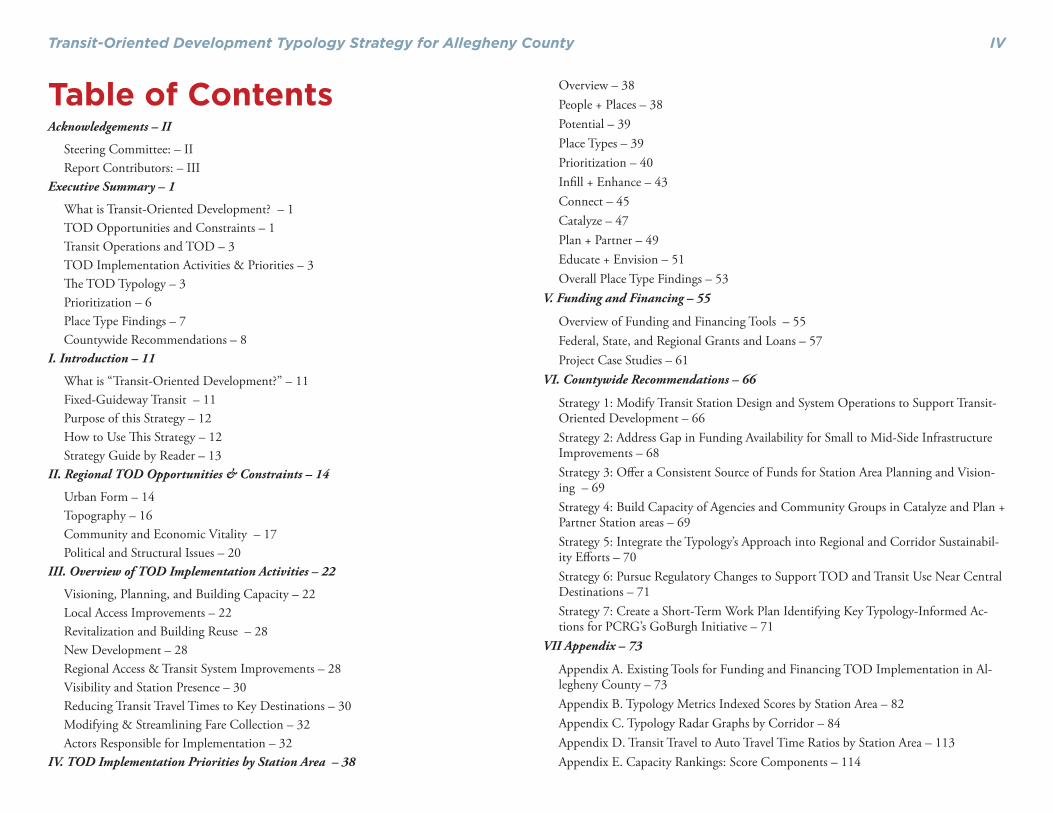
Table of ContentsAcknowledgements – II
Steering Committee: – IIReport Contributors: – III
Executive Summary – 1
What is Transit-Oriented Development? – 1TOD Opportunities and Constraints – 1Transit Operations and TOD – 3TOD Implementation Activities & Priorities – 3Th e TOD Typology – 3Prioritization – 6Place Type Findings – 7Countywide Recommendations – 8
I. Introduction – 11
What is “Transit-Oriented Development?” – 11Fixed-Guideway Transit – 11Purpose of this Strategy – 12How to Use Th is Strategy – 12Strategy Guide by Reader – 13
II. Regional TOD Opportunities & Constraints – 14
Urban Form – 14Topography – 16Community and Economic Vitality – 17Political and Structural Issues – 20
III. Overview of TOD Implementation Activities – 22
Visioning, Planning, and Building Capacity – 22Local Access Improvements – 22Revitalization and Building Reuse – 28New Development – 28Regional Access & Transit System Improvements – 28Visibility and Station Presence – 30Reducing Transit Travel Times to Key Destinations – 30Modifying & Streamlining Fare Collection – 32Actors Responsible for Implementation – 32
IV. TOD Implementation Priorities by Station Area – 38
Overview – 38People + Places – 38Potential – 39Place Types – 39Prioritization – 40Infi ll + Enhance – 43Connect – 45Catalyze – 47Plan + Partner – 49Educate + Envision – 51Overall Place Type Findings – 53
V. Funding and Financing – 55
Overview of Funding and Financing Tools – 55Federal, State, and Regional Grants and Loans – 57Project Case Studies – 61
VI. Countywide Recommendations – 66
Strategy 1: Modify Transit Station Design and System Operations to Support Transit-Oriented Development – 66Strategy 2: Address Gap in Funding Availability for Small to Mid-Side Infrastructure Improvements – 68Strategy 3: Off er a Consistent Source of Funds for Station Area Planning and Vision-ing – 69Strategy 4: Build Capacity of Agencies and Community Groups in Catalyze and Plan + Partner Station areas – 69Strategy 5: Integrate the Typology’s Approach into Regional and Corridor Sustainabil-ity Eff orts – 70Strategy 6: Pursue Regulatory Changes to Support TOD and Transit Use Near Central Destinations – 71Strategy 7: Create a Short-Term Work Plan Identifying Key Typology-Informed Ac-tions for PCRG’s GoBurgh Initiative – 71
VII Appendix – 73
Appendix A. Existing Tools for Funding and Financing TOD Implementation in Al-legheny County – 73Appendix B. Typology Metrics Indexed Scores by Station Area – 82Appendix C. Typology Radar Graphs by Corridor – 84Appendix D. Transit Travel to Auto Travel Time Ratios by Station Area – 113Appendix E. Capacity Rankings: Score Components – 114
Transit-Oriented Development Typology Strategy for Allegheny County IV
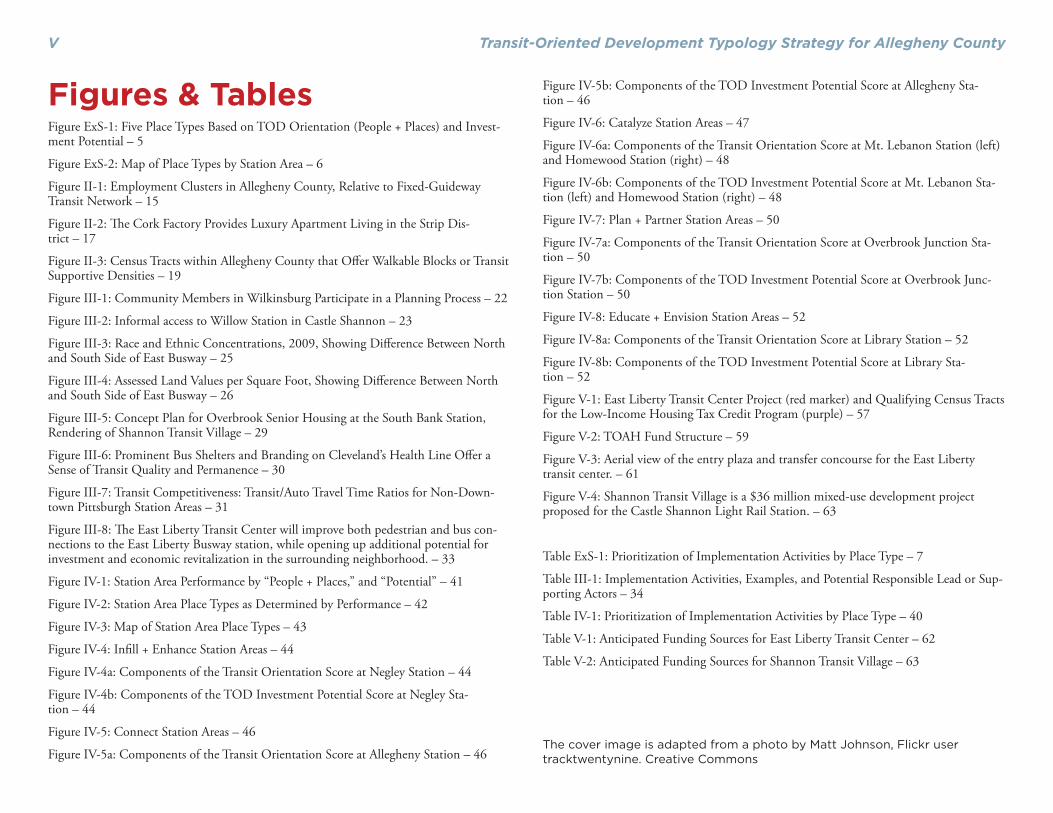
The cover image is adapted from a photo by Matt Johnson, Flickr user tracktwentynine. Creative Commons
Transit-Oriented Development Typology Strategy for Allegheny CountyV
Figures & TablesFigure ExS-1: Five Place Types Based on TOD Orientation (People + Places) and Invest-ment Potential – 5
Figure ExS-2: Map of Place Types by Station Area – 6
Figure II-1: Employment Clusters in Allegheny County, Relative to Fixed-Guideway Transit Network – 15
Figure II-2: Th e Cork Factory Provides Luxury Apartment Living in the Strip Dis-trict – 17
Figure II-3: Census Tracts within Allegheny County that Off er Walkable Blocks or Transit Supportive Densities – 19
Figure III-1: Community Members in Wilkinsburg Participate in a Planning Process – 22
Figure III-2: Informal access to Willow Station in Castle Shannon – 23
Figure III-3: Race and Ethnic Concentrations, 2009, Showing Diff erence Between North and South Side of East Busway – 25
Figure III-4: Assessed Land Values per Square Foot, Showing Diff erence Between North and South Side of East Busway – 26
Figure III-5: Concept Plan for Overbrook Senior Housing at the South Bank Station, Rendering of Shannon Transit Village – 29
Figure III-6: Prominent Bus Shelters and Branding on Cleveland’s Health Line Off er a Sense of Transit Quality and Permanence – 30
Figure III-7: Transit Competitiveness: Transit/Auto Travel Time Ratios for Non-Down-town Pittsburgh Station Areas – 31
Figure III-8: Th e East Liberty Transit Center will improve both pedestrian and bus con-nections to the East Liberty Busway station, while opening up additional potential for investment and economic revitalization in the surrounding neighborhood. – 33
Figure IV-1: Station Area Performance by “People + Places,” and “Potential” – 41
Figure IV-2: Station Area Place Types as Determined by Performance – 42
Figure IV-3: Map of Station Area Place Types – 43
Figure IV-4: Infi ll + Enhance Station Areas – 44
Figure IV-4a: Components of the Transit Orientation Score at Negley Station – 44
Figure IV-4b: Components of the TOD Investment Potential Score at Negley Sta-tion – 44
Figure IV-5: Connect Station Areas – 46
Figure IV-5a: Components of the Transit Orientation Score at Allegheny Station – 46
Figure IV-5b: Components of the TOD Investment Potential Score at Allegheny Sta-tion – 46
Figure IV-6: Catalyze Station Areas – 47
Figure IV-6a: Components of the Transit Orientation Score at Mt. Lebanon Station (left) and Homewood Station (right) – 48
Figure IV-6b: Components of the TOD Investment Potential Score at Mt. Lebanon Sta-tion (left) and Homewood Station (right) – 48
Figure IV-7: Plan + Partner Station Areas – 50
Figure IV-7a: Components of the Transit Orientation Score at Overbrook Junction Sta-tion – 50
Figure IV-7b: Components of the TOD Investment Potential Score at Overbrook Junc-tion Station – 50
Figure IV-8: Educate + Envision Station Areas – 52
Figure IV-8a: Components of the Transit Orientation Score at Library Station – 52
Figure IV-8b: Components of the TOD Investment Potential Score at Library Sta-tion – 52
Figure V-1: East Liberty Transit Center Project (red marker) and Qualifying Census Tracts for the Low-Income Housing Tax Credit Program (purple) – 57
Figure V-2: TOAH Fund Structure – 59
Figure V-3: Aerial view of the entry plaza and transfer concourse for the East Liberty transit center. – 61
Figure V-4: Shannon Transit Village is a $36 million mixed-use development project proposed for the Castle Shannon Light Rail Station. – 63
Table ExS-1: Prioritization of Implementation Activities by Place Type – 7
Table III-1: Implementation Activities, Examples, and Potential Responsible Lead or Sup-porting Actors – 34
Table IV-1: Prioritization of Implementation Activities by Place Type – 40
Table V-1: Anticipated Funding Sources for East Liberty Transit Center – 62
Table V-2: Anticipated Funding Sources for Shannon Transit Village – 63

Executive Summary1
Executive SummaryCities and regions from coast to coast are pursuing transit-oriented development
(TOD) strategies as a way to achieve many goals, including increased economic
competitiveness through improved quality of life, reduced congestion, lower
transportation costs for households, improved air quality, reduced costs for pro-
viding city services, and growth management. Th e concept of TOD is becoming
more popular as the number of regions planning light rail, bus rapid transit, and
other fi xed-guideway transit investments expands.
While other regions must spend hundreds of millions – or billions – to create
transit-oriented communities, Allegheny County, fortunately, is well-poised to
capture the creative labor force and new employers interested in the improved
quality of life off ered through transit-oriented living that its current fi xed-
guideway investments could catalyze. Many of the county’s neighborhoods – and
surrounding communities – were built around historic transit lines. A large share
of neighborhoods near the T, Busways, and Incline stations are already walkable
and include their own nearby community retail and service amenities. However,
a more systematic approach to transit-oriented investments is needed to unlock
the potential of these neighborhoods and draw regional economic growth. Th is
Transit-Oriented Development Typology Strategy is designed to provide a frame-
work for understanding what these transit-oriented investments are, where they
can leverage the greatest economic potential, and how they can be funded and
implemented.
Th is Strategy focuses on the region’s fi xed-guideway transit network, which
includes the East, West and South Busways, the Blue Line and Red Line T, the
Monongahela Incline, and the planned Downtown to Oakland Bus Rapid Transit
corridor.
What is Transit-Oriented Development?
Transit-Oriented Development, or TOD, by defi nition is the integration of trans-
portation with surrounding land uses. Th is integration is accomplished through
urban design, zoning, community development, and supportive infrastructure
investments and results in neighborhoods where residents and workers can get
around without a car. Rather than being defi ned by a particular mix of uses at a
particular density, successful TOD is defi ned by shared traits like neighborhoods
that foster transportation choices of all kinds and healthy communities with
vibrant commercial districts serving the daily needs of the residents.
TOD Opportunities and Constraints
Many Allegheny County neighborhoods have characteristics of TOD, but
topography and other barriers often limit full access to the transit stations or
between neighborhoods.
An advantage of most Allegheny County communities served by fi xed-guideway
transit is their physical form. Unlike many other regions, which would have to
tear down or retrofi t entire neighborhoods to support walkability, most neighbor-
hoods around existing fi xed-guideway stations could become signifi cantly more
transit-oriented with small- or moderate-scale, strategic access improvements.
However, many historic transit lines have been dismantled, leaving walkable
communities that have become isolated from the region’s major job centers. And
for many of the areas that have retained fi xed-guideway transit (e.g. the Red Line
corridor), topography presents an access challenge to getting to stations, espe-
cially in communities with aging populations. In the case of the East Busway, the
transit infrastructure itself, which operates alongside a major freight rail corridor,
Executive Summary 2
presents a physical and psychological barrier.
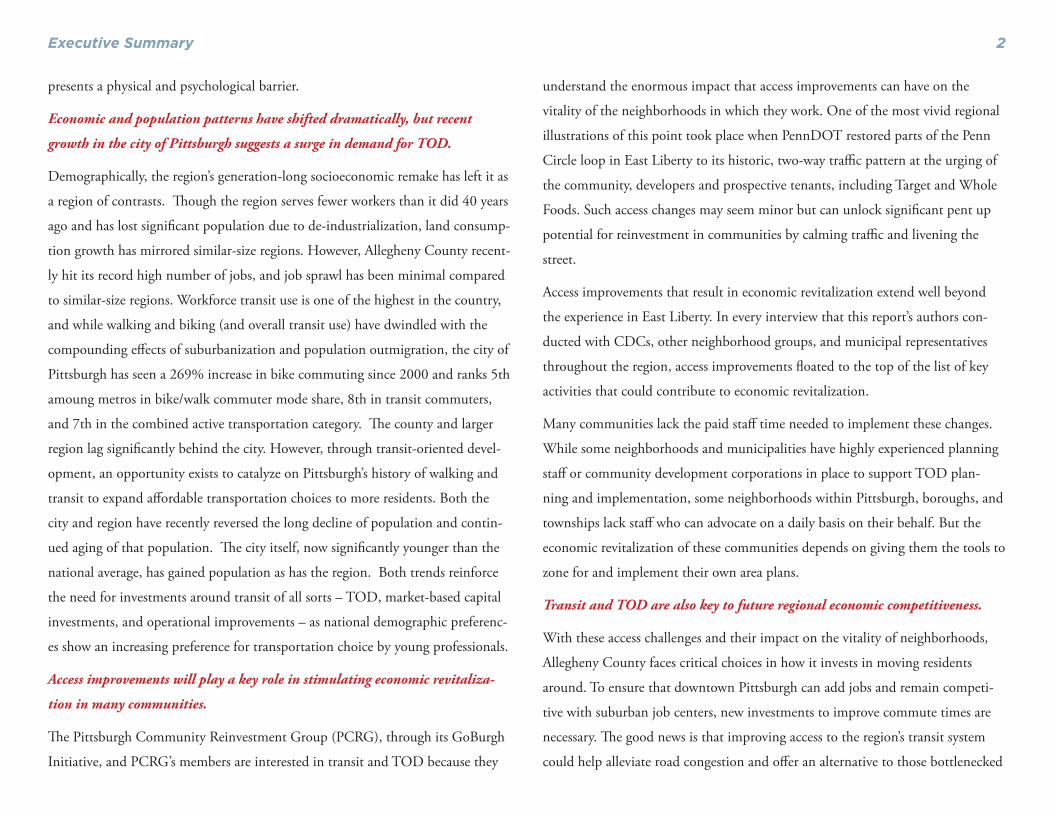
Economic and population patterns have shifted dramatically, but recent
growth in the city of Pittsburgh suggests a surge in demand for TOD.
Demographically, the region’s generation-long socioeconomic remake has left it as
a region of contrasts. Th ough the region serves fewer workers than it did 40 years
ago and has lost signifi cant population due to de-industrialization, land consump-
tion growth has mirrored similar-size regions. However, Allegheny County recent-
ly hit its record high number of jobs, and job sprawl has been minimal compared
to similar-size regions. Workforce transit use is one of the highest in the country,
and while walking and biking (and overall transit use) have dwindled with the
compounding eff ects of suburbanization and population outmigration, the city of
Pittsburgh has seen a 269% increase in bike commuting since 2000 and ranks 5th
amoung metros in bike/walk commuter mode share, 8th in transit commuters,
and 7th in the combined active transportation category. Th e county and larger
region lag signifi cantly behind the city. However, through transit-oriented devel-
opment, an opportunity exists to catalyze on Pittsburgh’s history of walking and
transit to expand aff ordable transportation choices to more residents. Both the
city and region have recently reversed the long decline of population and contin-
ued aging of that population. Th e city itself, now signifi cantly younger than the
national average, has gained population as has the region. Both trends reinforce
the need for investments around transit of all sorts – TOD, market-based capital
investments, and operational improvements – as national demographic preferenc-
es show an increasing preference for transportation choice by young professionals.
Access improvements will play a key role in stimulating economic revitaliza-
tion in many communities.
Th e Pittsburgh Community Reinvestment Group (PCRG), through its GoBurgh
Initiative, and PCRG’s members are interested in transit and TOD because they
understand the enormous impact that access improvements can have on the
vitality of the neighborhoods in which they work. One of the most vivid regional
illustrations of this point took place when PennDOT restored parts of the Penn
Circle loop in East Liberty to its historic, two-way traffi c pattern at the urging of
the community, developers and prospective tenants, including Target and Whole
Foods. Such access changes may seem minor but can unlock signifi cant pent up
potential for reinvestment in communities by calming traffi c and livening the
street.
Access improvements that result in economic revitalization extend well beyond
the experience in East Liberty. In every interview that this report’s authors con-
ducted with CDCs, other neighborhood groups, and municipal representatives
throughout the region, access improvements fl oated to the top of the list of key
activities that could contribute to economic revitalization.
Many communities lack the paid staff time needed to implement these changes.
While some neighborhoods and municipalities have highly experienced planning
staff or community development corporations in place to support TOD plan-
ning and implementation, some neighborhoods within Pittsburgh, boroughs, and
townships lack staff who can advocate on a daily basis on their behalf. But the
economic revitalization of these communities depends on giving them the tools to
zone for and implement their own area plans.
Transit and TOD are also key to future regional economic competitiveness.
With these access challenges and their impact on the vitality of neighborhoods,
Allegheny County faces critical choices in how it invests in moving residents
around. To ensure that downtown Pittsburgh can add jobs and remain competi-
tive with suburban job centers, new investments to improve commute times are
necessary. Th e good news is that improving access to the region’s transit system
could help alleviate road congestion and off er an alternative to those bottlenecked

Executive Summary3
drivers. If traffi c continues to worsen, transit becomes all the more attractive, of-
fering commuters less time spent traveling. Th e even better news is that improv-
ing transit access is a cheaper option: fundamentally, widening roads into hillsides
will be vastly more expensive and intrusive into nearby communities than im-
proving access to station areas and increasing transit frequency.
By tapping into the region’s transit assets, uplifting surrounding neighborhoods,
and highlighting their access to major centers of economic activity like Down-
town and Oakland, the region can continue to capture the young professionals
interested in living in neighborhoods where they don’t need a car and can walk,
bike, or take transit to work, to see friends and run errands. Neighborhoods near
fi xed-guideway stations will draw both investors and new potential residents seek-
ing a certain quality of life.
Transit Operations and TOD
With the Port Authority facing perhaps the largest fi scal crisis in its history, it
may seem like transit-oriented development is a low priority where transportation
issues are concerned. However, the converse is true – the time has never been bet-
ter. By reinvesting in the land uses and street infrastructure surrounding the Port
Authority’s fi xed-guideway system, TOD will ultimately make accessing and using
the system a signifi cantly easier and more pleasant experience. Th is in turn could
signifi cantly boost ridership and farebox recovery for the Port Authority. TOD
cannot fi ll the operating defi cit, but can play a signifi cant role in ensuring that the
revenue generated through ridership is bolstered and stable.
Of course, TOD requires stable, reliable transit service in order to work. To
ensure that investors and new residents and businesses are willing to plant roots in
the communities with fi xed-guideway stations, they must be sure that the stations
are going to be a permanent asset. Solving the Port Authority’s fi scal crisis will be
a key step to ensure TOD – and its related benefi ts – move forward. Conversely,
any fi nancially-driven service alterations should place higher priority on preserv-
ing or even increasing fi xed-guideway service to preserve the core system and keep
transit- and place-based investment viable and attractive.
TOD Implementation Activities & Priorities
While new development can play a key role in TOD, it is not necessarily the fi rst,
or best place, for many neighborhoods to start achieving the goals of TOD. Th is
is particularly true in neighborhoods that are already fairly walkable but which
lack the market strength to catalyze new development. Th is strategy divides TOD
implementation activities into fi ve distinct categories:
• Capacity Building, Visioning, and Planning• Local Access Improvements• Revitalization and Building Re-use • New Development• Regional Access and Transit System Improvements
Each of these categories encompasses a broad range of activities that may be more
appropriate in some station areas than others. Th ese are described in Chapter III.
The TOD Typology
Given the sheer size and reach of Pittsburgh’s fi xed-guideway transit system, TOD
implementation at the countywide scale can seem daunting. With over 100 light
rail and busway stations and limited resources to address their diverse needs, the
time is right to strategically organize and guide eff orts to optimize the system
through planning and community development.
Th e typology, or method of sorting the region’s busway and rail station areas into
diff erent types, is designed to help PCRG and its local partners better leverage
TOD potential across the region. Th e typology classifi es station areas into fi ve
place types that have similar implementation needs. Th e typology does not supplant

Executive Summary 4
local planning eff orts, but rather helps guide and focus community development
activities in smaller communities and lower-capacity neighborhoods as the real
estate market steadily rebounds.
By factoring in existing elements of the built (places), social (people) and develop-
ment and political (potential) environments, the typology is a holistic measure of
a community’s current overall transit orientation and relative market strength. On
one axis it includes a composite transit orientation index that captures a blend of
existing physical and social characteristics proven to generate transit ridership and
walking and biking trips. Th is index includes the following specifi c measures of
transit orientation:
• People: Th e number of residents and workers in an area has a direct correla-
tion with reduced auto trips;
• Places: Areas with commercial urban amenities such as restaurants, grocers,
and specialty retail not only allow residents to complete daily activities with-
out getting in a car, but they also improve the likelihood of higher density
development by increasing residential land values;
• Physical Form: Small block sizes promote more compact development and
walkability;
• Population: Th e percentage of households with access to one or fewer
vehicles refl ects the transit dependence of a station area;
• Proximity: Transit travel times to a region’s major employment and activity
center is a proxy for regional accessibility. An extensive recent meta-analysis
of land use and travel behavior studies found that vehicle miles traveled are
inversely related with distance to a region’s core downtown.
Th e other axis of the typology measures the near-term potential for new invest-
ment and development within station areas. To capture the existing market condi-
tions and future market potential of individual transit communities, this axis also
uses a composite measure comprised of the following factors. Again, these factors
are kept somewhat basic and can be updated over time as station area conditions
change:
• Sales: Average real estate sales per square foot from 2000 to 2011. By con-
trolling for size and capturing sales over multiple market cycles, this measure
provides a relative order of magnitude comparison over time;
• Rents: Average residential rents based on 2010 Census data. Higher achiev-
able rents are more likely to attract new TOD market interest;
• Land Availability: Acres of underutilized land within each station area.
Some land – but not an excess of land – should be available for new develop-
ment to off er potential for change;
• Capacity: Qualitative rating of a station area’s public and private capacity to
attract and foster development. Factors going into this rating included, but
were not limited to, planning initiatives (station area planning, zoning); the
presence of a redevelopment authority; recent development activity; and the
relative experience of community development organizations in community
organizing, planning, implementation, and securing funding and fi nancing
for projects.
Th e juxtaposition of the People + Places (transit orientation) and Potential (for
new investment) axes provides the framework whereby the county’s busway, T,
Monongahela Incline, and planned Downtown-Oakland BRT stations can be
clustered in a series of implementation place types. Figure ExS-1 illustrates how
each station area scores in terms of the two axes. Generally speaking, the East
Busway and proposed Downtown-Oakland BRT stations perform at the higher
ends of both spectrums. While inner Red Line and West Busway stations score
moderately well on both measures, the more suburban Blue Line stations tend to
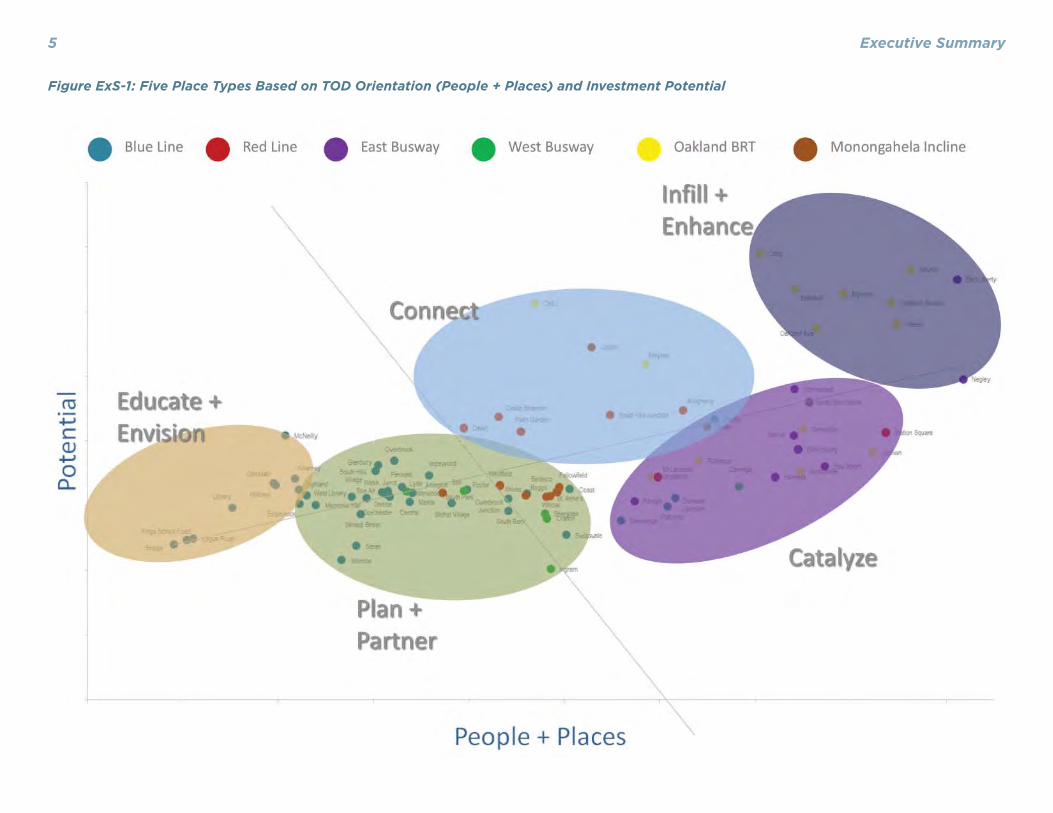
Executive Summary5
Figure ExS-1: Five Place Types Based on TOD Orientation (People + Places) and Investment Potential
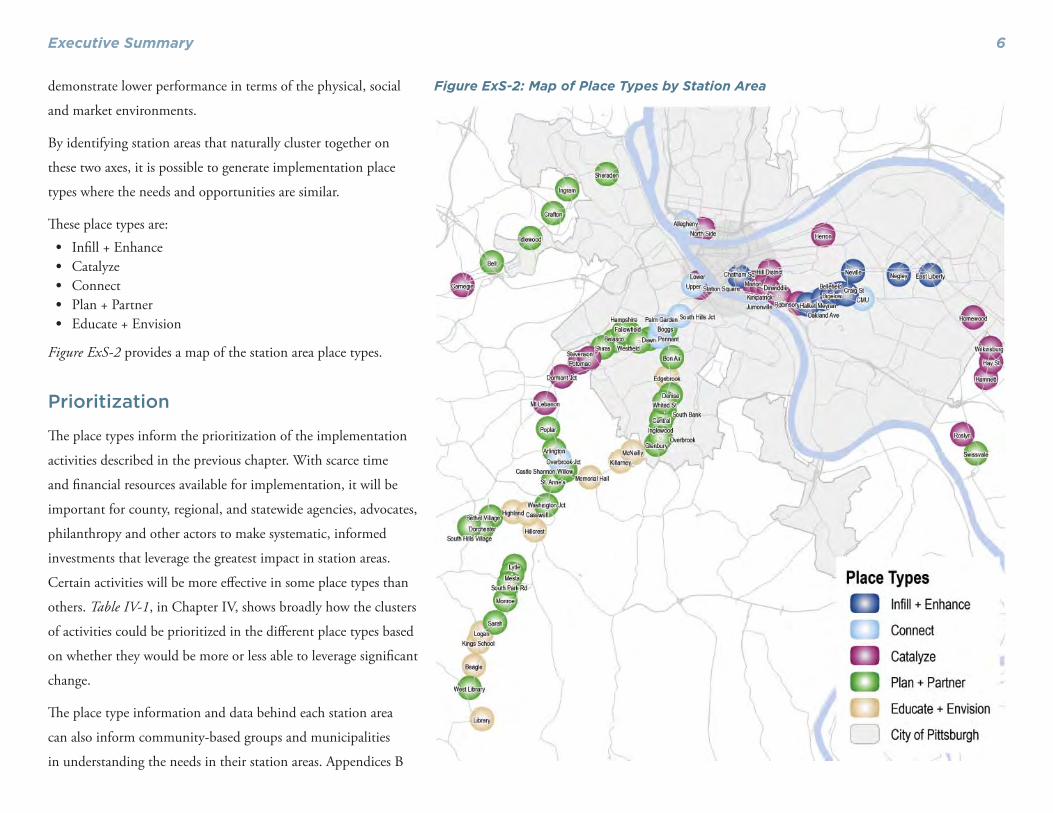
Executive Summary 6
demonstrate lower performance in terms of the physical, social
and market environments.
By identifying station areas that naturally cluster together on
these two axes, it is possible to generate implementation place
types where the needs and opportunities are similar.
Th ese place types are:• Infi ll + Enhance• Catalyze• Connect• Plan + Partner• Educate + Envision
Figure ExS-2 provides a map of the station area place types.
Prioritization
Th e place types inform the prioritization of the implementation
activities described in the previous chapter. With scarce time
and fi nancial resources available for implementation, it will be
important for county, regional, and statewide agencies, advocates,
philanthropy and other actors to make systematic, informed
investments that leverage the greatest impact in station areas.
Certain activities will be more eff ective in some place types than
others. Table IV-1, in Chapter IV, shows broadly how the clusters
of activities could be prioritized in the diff erent place types based
on whether they would be more or less able to leverage signifi cant
change.
Th e place type information and data behind each station area
can also inform community-based groups and municipalities
in understanding the needs in their station areas. Appendices B
Figure ExS-2: Map of Place Types by Station Area

Executive Summary7
and C off er more detailed data and charts showing the relative performance of
each station area on the eight indicators that are used to create the place types.
By identifying indicators where station areas score lower than their peers, local
groups and agencies can consider the range of TOD implementation strategies
that might help address these shortcomings and increase the potential for TOD.
Place Type Findings
Below are some of the overall fi ndings about the various needs for transit-oriented
development, based on the classifi cation of the region’s 100 station areas into the
above fi ve place types.
Infi ll + Enhance
• Much of the proposed Oakland-Downtown corridor already outper-
forms the existing fi xed-guideway transit network in its transit orienta-
tion and market potential. Th e majority (7 of 9) of the Infi ll + Enhance
station areas are along the proposed BRT corridor. Higher-quality transit,
placemaking, and access improvements to stations along this corridor could
help capture the pent-up demand for TOD from these areas and within the
Catalyze station areas in the Hill District and Uptown.
• Interventions to catalyze TOD should be modest to minimal in these
station areas. Following the matrix in Table ExS-1, prioritization of fi nancial
public investment or organizational capacity in these areas is at a lower prior-
ity than for other place types. All Infi ll+Enhance place types already enjoy
strong market and physical form, and have a high degree of capacity on the
ground for TOD. Scarce resources should be focused in other areas.
Catalyze + Connect
• 28 station areas fall into either the Catalyze or Connect place types.
Th e concept behind both the “Catalyze” and “Connect” place types is that
transit-oriented development is achievable with minor investments. Small to
moderate investments in these station areas could signifi cantly boost regional
economic competitiveness by off ering ample opportunities for a high quality,
transit-rich lifestyle.
• Many of these station areas need some kind of pedestrian access en-
hancement in order to catalyze TOD. Clearly, the station areas falling into
Table ExS-1: Prioritization of Implementation Activities by Place Type
Building Capacity of Local TOD Champions Planning/ Visioning Access
ImprovementsCommunity and Economic Revitalization Catalytic Development
Infi ll & Enhance Low Low Medium Medium Medium
Catalyze High Medium Medium High High
Connect Medium High High Medium High
Plan & Partner High High Medium Low Low
Educate & Envision Medium Medium Low Low Low

Executive Summary 8
the Connect place type are in need of pedestrian and bicycle improvements.
Yet, even among the many Catalyze station areas on the East Busway, increas-
ing pedestrian access – particularly over or under the East Busway alignment
– has already been identifi ed as a key revitalization strategy. Th is reinforces
the need for new funding sources to help pay for improvements such as pe-
destrian bridges and tunnels, sidewalk enhancements and bicycle lanes.
• Th ere is a need to increase the capacity and coordination of both public
agency staff and community groups in some of these station areas. One
recommendation is to develop a regional program to increase capacity by le-
veraging the experience of high capacity neighborhoods, and off ering techni-
cal assistance and best practices, potentially along transit corridors.
• Th ese station areas represent the best “bang for your buck” in terms of
both capital and capacity investments to catalyze TOD. Targeted invest-
ments in these station areas could yield the largest return for TOD due to
their place type. More information on suggested station area activities, for
both Catalyze + Connect, are provided within this report.
Plan + Partner
• Th e majority of station areas fall within the Plan + Partner place type.
Th erefore, further evaluation and monitoring of these station areas is needed
to identify locations with an interest in transit-oriented development.
• Plan + Partner place types, in their current state, are not strong can-
didates for infrastructure investments. A lack of the necessary capacity,
market forces, and/or physical form mean that signifi cant infrastructure in-
vestments in these place types, at this time, would yield little return in regards
to TOD.
• Off ering regional incentives to plan for TOD, such as readily available
planning or infrastructure grants, could help identify the interested sta-
tions in need of support. While not all of the Plan + Partner station areas
may be interested in TOD today, those that are should receive technical sup-
port if needed, in order to generate community support, create a vision, and
develop a plan for implementation.
• Continued monitoring of these station areas is important. Since condi-
tions and politics change over time, some Plan + Partner stations may shift
into a diff erent category and need further intervention.
Educate + Envision
Most Educate + Envision station areas are not strong candidates for TOD. Unless
there is evidence that a community with an Educate + Envision station area is
interested in TOD, these stations do not off er the urban form or support required
to readily achieve TOD benefi ts.
Countywide Recommendations
Seven Key Strategies for TOD
Each station area in Allegheny County’s system has its own set of implementation
needs to support transit-oriented development. Th e typology off ers a framework
for prioritizing and understanding these needs at a glance. Th ere are additionally
seven strategies that agencies and advocates can deploy to support and catalyze
momentum for transit-oriented development across the entire transit system,
regardless of place type:
1. Modify transit station design and system operations to support
TOD. Th ere are a number of modifi cations that the Port Authority could
make to the system that could provide a signifi cant boost to the TOD
potential of current station areas without necessarily increasing operating
costs on the system. Th ese include rebranding the busway lines and 28x,
enhancing fare collection to be speedy and consistent, and off ering timed
Executive Summary9
transfers to other buses at fi xed-guideway stations with visible signage
and maps to facilitate those transfers. Improvements to existing stations
– including additional shelters, at-grade boarding, and bicycle storage –
could also support transit-oriented development by increasing the sense of
permanence on the corridors. Further, additional planned fi xed-guideway
lines could enhance ridership, open connections to key destinations like
Oakland, and allow for development near downtown Pittsburgh in the
Strip District and Uptown neighborhoods.
2. Address gaps in funding availability for small- to midsize
infrastructure improvements. Th e majority of stations in the system
could benefi t from small-scale infrastructure improvements in the form
of pedestrian paths, bridges, and tunnels, improved sidewalks, bicycle
lanes and other bicycle infrastructure, and station area signage. Th e 28
stations falling in the Catalyze + Connect place types are high priority
locations, because these investments could have a transformative eff ect
on the surrounding neighborhoods by boosting the ability of transit to
be an economic and revitalizing asset for the communities. Many of the
Plan + Partner and Infi ll + Enhance station areas, could also benefi t from
these improvements. However, the availability of funds for projects in the
$1 to $5 million range is limited, and these can be signifi cant projects for
resource-constrained municipalities to take on without assistance. Re-
gional, state or local funds can be used to fi ll this funding gap as can value
capture mechanisms like TIF or TRID.
3. Off er a consistent source of funds for station area visioning and
planning. Many agencies outside the city of Pittsburgh do not have the
resources to fund TOD plans themselves. Further, without the enticement
of funding, some municipalities may not see any need to garner support
for TOD principles in their station areas. State and regional agencies
should off er more consistent tools to fund district and area wide planning.
4. Build capacity of agencies and community groups in Catalyze
and Plan + Partner station areas. Public agencies and commu-
nity groups in some Catalyze and Plan + Partner station areas may not
have the capacity to advocate for TOD-related strategies. Th ey may lack
experienced paid planning staff , may need additional expertise in secur-
ing funding for activities and projects, or may need technical support on
specifi c planning eff orts. Th is could be addressed through the development
of a regional capacity building system that leverages technical expertise of
more experienced CDCs and agency staff , public incentives such as grant
programs for TOD planning, or corridor working groups that are used to
share information and advocate on behalf of larger, corridor-wide issues.
5. Integrate the typology approach into regional and corridor sus-
tainability eff orts. Th e typology approach developed for this Strategy
has been designed to be quantitative and replicable over time. Further, the
data behind the typology is available at the countywide or even regional
scale, meaning the typology could be replicated for other corridors,
neighborhoods, or communities. Th e largely quantitative nature of the
typology also provides a relatively neutral tool for making decisions about
the allocation of funding for agencies such as Allegheny County or the
Southwestern Pennsylvania Commission, which are responsible to every
municipality regardless of transit proximity. As a result, this typology will
make an excellent tool to inform future investment decisions, or to simply

Executive Summary 10
evaluate the needs of diff erent communities in order to support greater
transportation choices and alleviate congestion.
6. Pursue regulatory changes to support TOD and transit use near
central destinations. Regional destinations into which the transit
system feeds are unique locations whereregulatory changes can change the
behavior of transit riders, drivers, and commuters from across the region.
Th ese areas are therefore regional priorities for dynamic, thoughtful park-
ing pricing, zoning and other land use regulation, and ongoing monitoring
and response of regulations as conditions change.
7. Create a short-term work plan identifying key typology-in-
formed actions for PCRG’s GoBurgh Initiative. GoBurgh already
plays a key role in advocating for modifi cations to transit policy. GoBurgh
is a key leader in advocating for many of the strategies above, and develop-
ing future capacity building and TOD implementation systems.

I. Introduction11
I. IntroductionCities and regions from coast to coast are pursuing transit-oriented development
(TOD) strategies as a way to achieve many goals, including increased economic
competitiveness through improved quality of life, reduced congestion, lower
transportation costs for households, improved air quality, reduced costs for pro-
viding city services, and growth management. Th e concept of TOD is becoming
more popular as the number of regions planning light rail, bus rapid transit, and
other fi xed-guideway transit investments expands. Today more than 40 regions
have a light rail or BRT line (compared to 28 in 2000) and there are 721 planned
new transit corridors in 109 regions across the United States. At current federal
funding levels, it would take 78 years to meet the full demand for new transit
systems today.1
Fortunately, Allegheny County is well poised to capture the creative labor force
and new employers interested in the improved quality of life off ered through
transit-oriented living that its current fi xed-guideway investments could catalyze.
Many of the County’s neighborhoods – and surrounding communities – were
built around historic transit lines. A large share of neighborhoods near the T,
Busways, and Incline stations are already walkable and include their own nearby
community retail and service amenities. However, a more systematic approach
to transit-oriented investments is needed to unlock the potential of these neigh-
borhoods and draw regional economic growth. Th is TOD Typology Strategy is
designed to provide a framework for understanding what these transit-oriented
investments are, where they can leverage the greatest economic potential, and how
they can be funded and implemented.
1 Reconnecting America, Jumpstarting the Transit Space Race, 2013. http://bit.ly/U5Ja3j
What is “Transit-Oriented Development?”
TOD, by defi nition, is the integration of transportation with surrounding land
uses. Th is is accomplished through urban design, zoning, community develop-
ment, and supportive infrastructure investments, which results in neighborhoods
where residents and workers can get around without a car. Th ere is no one-size-
fi ts-all TOD in terms of the mix of land uses, density, or building types; TOD
can include compact, single-family residential neighborhoods or major downtown
areas with multi-story offi ce buildings. Further, TOD does not necessarily entail
substantial new development; TOD can also include investments such as sidewalk
and bike improvements, parks, aff ordable housing preservation, and commercial
revitalization. Successful TOD is defi ned by shared traits like neighborhoods that
foster transportation choices of all kinds and healthy communities with vibrant
commercial districts serving the daily needs of the residents.
Fixed-Guideway Transit
Th e entire non-automotive transportation network, including rail, busways, fi xed
route buses, special services for the elderly and disability communities, sidewalks
and bike lanes, is critical to providing transportation choices and achieving the
vitality found in TOD. But TOD planning commonly focuses on the walkable
area surrounding light rail or busway stations operating in their own dedicated
right-of-way, referred to as a fi xed guideway. Traditional TOD defi nitions focus
on fi xed-guideway stations because these major transit infrastructure investments
are visible and permanent; they provide a greater level of certainty to investors,
developers, and prospective families and businesses that the transit will always
stay in one place, will always operate, and will always move people to destinations
along the line. Th is sense of certainty reduces the level of risk for investors and

I. Introduction 12
attracts residents who want to live near transit but who otherwise may not have
considered living in the surrounding neighborhood. Developers and businesses
can also build fewer parking spaces, knowing the transit provides permanent qual-
ity access to and from key destinations.
Th is typology focuses on the region’s fi xed-guideway transit network, which
includes the East, West and South Busways, the Blue Line and Red Line T, the
Monongahela Incline, and the planned Downtown to Oakland Bus Rapid Transit
corridor (the Duquesne Incline was omitted due to current utilization rates and
patterns). As the entirety of this network falls within Allegheny County, the coun-
ty is the largest geography used in this strategy, unless specifi c reference is made to
the Southwestern Pennsylvania Commission (the regional agency that serves the
ten-county greater Pittsburgh region as determined by the federal government).
Purpose of this Strategy
Th is strategy off ers a countywide framework for understanding the key transit-
oriented investments that can unlock TOD potential in Allegheny County to
leverage the economic, environmental and fi scal benefi ts of TOD. Resources for
investment in TOD infrastructure and planning will always be scarce; thus, this
strategy will help coordinate and prioritize those resources in the places where
they will have the greatest impact. Th e strategy further evaluates the current
system for TOD implementation, including the activities needed, actors involved,
and funding source available (or not available), to identify key policy changes or
other activities that can help expand resources.
Th e strategy is not a plan that supplants any local planning eff orts. It does not
make recommendations about the land uses that are appropriate in a station area;
it is purely an implementation document. While subsequent chapters provide
signifi cant data-driven information about the broad needs of diff erent station
areas in the system, further analysis is needed at the local level to identify specifi c
projects that could make the greatest diff erence in each station area.
How to Use This Strategy
Th is TOD strategy has four key sections that regional, countywide, and local
practitioners can use to inform their activities around TOD:
Implementation (Chapter III): Th e implementation matrix identifi es a
detailed set of activities that might be included in each of the implementation
categories prioritized in the typology. Local public agencies and CDCs may want
to use the implementation matrix to help explore the specifi c implementation
or investment needs in a station area. Further, the “actors” column of the matrix
identifi es the public agency, philanthropic partner, nonprofi t organization, etc.
who might take the lead or a supporting role in implementation of each activity,
and can act as a guide for coordination of roles and responsibilities in a given sta-
tion area.
Prioritization (Chapter IV): Th e Typology classifi es station areas based on
their big-picture implementation needs using the implementation categories from
Chapter III. At the regional scale, this tool can be used to identify key priority
locations for allocating diff erent funding resources. Nonprofi t organizations like
the Pittsburgh Community Reinvestment Group (PCRG) and its members can
use the typology to identify station areas where an investment in capacity build-
ing could leverage signifi cant change. Community members may want to use the
typology to identify station areas with similar characteristics to theirs, to share
best practice examples of TOD implementation. Th e typology can also help com-
munities without signifi cant technical capacity to get a sense of where and how to
get started.
Funding (Chapter V): Th e funding and fi nancing matrix can act as a guide to
the current funding programs that are available for community groups or devel-
I. Introduction13
opers seeking to implement a catalytic project2. Th e funding and fi nancing matrix
also provides regional and state advocates recommendations for policy changes
that could address key gaps in currently available funding sources. Th is informa-
tion can be used to set a future shared policy agenda or make the case to elected
offi cials that new funding sources are needed.
Station Area Data (Appendices): Th e radar graphs and indicators are the
background data used to create the typology. Th ey include fi ve variables related to
the urban and social environments, and three variables related to market poten-
tial. Th ese pieces are included in Appendices A and B. Individual community
development corporations (CDCs) or public agencies can use the radar graphs
and indicators to identify specifi c areas within their communities that are in need
of intervention; for example, a radar graph may show a community that enjoys
walkable blocks, but lacks the density needed to support existing or enhanced
transit service. Th is will enable communities to understand their relative position
in the typology as well. Developers may also be interested in evaluating the indi-
vidual radar graphs and indicators to fi nd station areas with key desirable charac-
teristics, like transit-oriented urban form and a mix of uses, moderate land values,
and some developable land. Th is could help developers and investors identify new
station areas in which to invest.
Strategy Guide by Reader
State, regional, and county agencies can use this strategy to understand the need
for new tools and programs and develop eff ective and effi cient allocation criteria
across the transit system, county, and region.
Municipal Agencies and Community-Based Organizations can identify
next steps in local transit-oriented development at individual station areas, and
2 The fi nancing matrix is current only as of the end of 2012 and state and local funding sources may ebb and fl ow over time.
view current performance across a range of indicators.
Advocacy Groups can use this strategy to defi ne and make the case for shared
agendas for change to policies, programs and funding streams at the local, re-
gional, state and federal scale.
Developers and Private Investors can identify those station areas that are
prime for new development or investment, and station areas in which to forge
partnerships with high capacity agencies or community based organizations to
leverage untapped market potential.
Philanthropy can identify regional and local activities to be supported through
programmatic funding, and evaluate the potential larger catalytic impact of proj-
ect scale investments.
II. Regional TOD Opportunities & Constraints 14
II. Regional TOD Opportunities & ConstraintsTh is chapter summarizes transit-oriented development opportunities that are
shared throughout the fi xed-guideway transit system, or that could be leveraged
systemwide to achieve TOD benefi ts. It also summarizes constraints and chal-
lenges to transit-oriented development that are shared across many station areas
in the system. For a more in-depth evaluation of existing TOD opportunities
and constraints, please refer to the Pittsburgh Regional TOD Strategic Plan and
Typology: TOD Opportunities and Constraints report published in preparation
for this strategy (May 2012).
Urban Form
Much of Allegheny County is inherently transit-oriented
Allegheny County has a competitive advantage when it comes to achieving suc-
cessful TOD in that most of its neighborhoods were built around walking and
transit and are inherently transit-oriented today. Many communities in Allegheny
County – both on and apart from the existing rail and busway systems – were
built around early 20th century streetcar and rail lines that took workers to their
jobs. During that time, the hilly terrain of the region also helped funnel growth
into compact, mixed-use neighborhoods and towns.
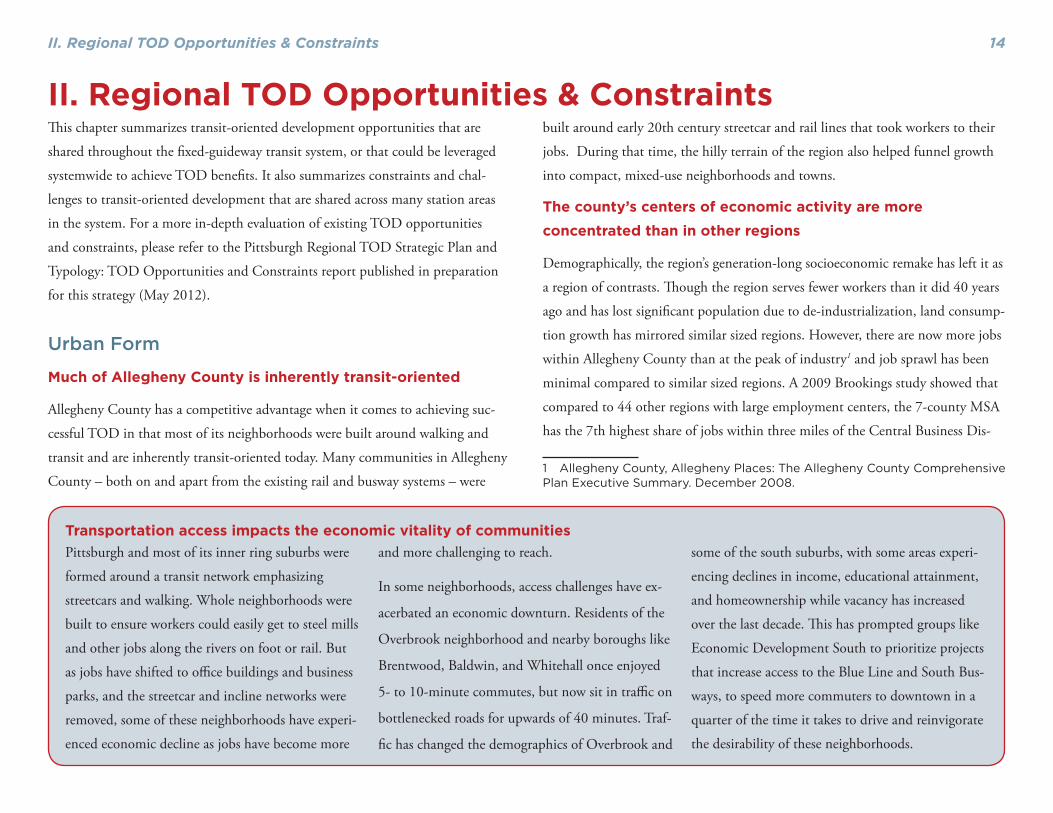
The county’s centers of economic activity are more concentrated than in other regions
Demographically, the region’s generation-long socioeconomic remake has left it as
a region of contrasts. Th ough the region serves fewer workers than it did 40 years
ago and has lost signifi cant population due to de-industrialization, land consump-
tion growth has mirrored similar sized regions. However, there are now more jobs
within Allegheny County than at the peak of industry1 and job sprawl has been
minimal compared to similar sized regions. A 2009 Brookings study showed that
compared to 44 other regions with large employment centers, the 7-county MSA
has the 7th highest share of jobs within three miles of the Central Business Dis-
1 Allegheny County, Allegheny Places: The Allegheny County Comprehensive Plan Executive Summary. December 2008.
Pittsburgh and most of its inner ring suburbs were
formed around a transit network emphasizing
streetcars and walking. Whole neighborhoods were
built to ensure workers could easily get to steel mills
and other jobs along the rivers on foot or rail. But
as jobs have shifted to offi ce buildings and business
parks, and the streetcar and incline networks were
removed, some of these neighborhoods have experi-
enced economic decline as jobs have become more
and more challenging to reach.
In some neighborhoods, access challenges have ex-
acerbated an economic downturn. Residents of the
Overbrook neighborhood and nearby boroughs like
Brentwood, Baldwin, and Whitehall once enjoyed
5- to 10-minute commutes, but now sit in traffi c on
bottlenecked roads for upwards of 40 minutes. Traf-
fi c has changed the demographics of Overbrook and
some of the south suburbs, with some areas experi-
encing declines in income, educational attainment,
and homeownership while vacancy has increased
over the last decade. Th is has prompted groups like
Economic Development South to prioritize projects
that increase access to the Blue Line and South Bus-
ways, to speed more commuters to downtown in a
quarter of the time it takes to drive and reinvigorate
the desirability of these neighborhoods.
Transportation access impacts the economic vitality of communities

II. Regional TOD Opportunities & Constraints15
Figure II-1: Employment Clusters in Allegheny County, Relative to Fixed-Guideway Transit Network

II. Regional TOD Opportunities & Constraints 16
trict.2 Figure II-1 shows the location of clustered job centers in the region.
CTOD’s own research on the impact of transit on development shows that sta-
tion areas just outside of major job centers have the greatest potential to attract
private real estate investment.3 Th is underscores the importance of continuing
to invest in new quality transit systems linking Downtown and Oakland to areas
with signifi cant developable land, like the Strip District and Uptown, and the
North Shore. Th eir proximity to downtown suggests these areas have the stron-
gest potential to benefi t from new fi xed-guideway improvements. It also under-
scores the signifi cant development potential opened up with the completion of
the North Shore Connector – particularly with the currently undeveloped land
around both North Shore stations.
Topography
Overcoming access challenges is a key priority
One challenge for Allegheny County is that many of the historic transit lines
have been dismantled, leaving walkable communities that have become isolated
from the region’s major job centers. And for many of the areas that have retained
fi xed-guideway transit (e.g. the Red Line corridor), topography presents an access
challenge to getting to stations, especially in communities with aging populations.
In the case of the East Busway, the transit infrastructure itself, which operates
along an existing freight rail right-of-way either in an underpass or on an elevated
trestle, presents a physical and psychological barrier.
An advantage of most of Allegheny County’s communities that are served by tran-
2 Kneebone, Elizabeth, “Job Sprawl Revisited: The Changing Geography of Metropolitan Employment,” Metro Economy Series for the Metropolitan Policy Program at Brookings. Washington, DC: Brookings Institution, April 2009. http://bit.ly/11sy9pW 3 Center for Transit-Oriented Development, “Rails to Real Estate: Development Patterns Along Three New Transit Lines.” Sponsored by the Federal Transit Administration, March 2011. http://ctod.org/portal/node/2302
sit, however, is their physical form. Unlike many other regions, which would have
to tear down or retrofi t entire neighborhoods to support walkability, most neigh-
borhoods around existing fi xed-guideway stations could become signifi cantly
more transit-oriented with small or moderate scale, strategic access improvements.
For example, as suggested by the Bridging the Busway eff ort in Homewood and
North Point Breeze, improving pedestrian connections and conditions across the
East Busway could unlock signifi cant pent-up market strength and help knit to-
gether neighborhoods to the north and south. Th e same principle applies in the
southern suburbs and city neighborhoods: ensuring that local residents near Blue
Line stations can fi nd the stations and access them on safe, comfortable paths
could vastly boost ridership on the T and South Busway.
Even with these challenges, the county’s topography lends
itself to transit use
Pittsburgh’s unique topography has played a signifi cant role in shaping the
development and transportation patterns of the region. Some transit stations –
particularly along the T corridors – face signifi cant challenges in improving access
because they are nestled at the base of valleys or the peak of hills. But the road
system is also constrained, and topographically-defi ned bottlenecks take their toll
on workers sitting in traffi c to reach the region’s major job centers. Th ough the
region serves fewer residents than it did 40 years ago and employment sprawl has
been relatively minimal, historic residential suburbanization trends have resulted
in more congestion within topographically constrained corridors.
With these access challenges and their impact on the vitality of neighborhoods,
Allegheny County faces critical choices in how it invests in moving residents
around. To ensure that downtown Pittsburgh and Oakland can add jobs and
remain competitive with suburban job centers, new investments to improve com-
mute times are necessary. Th e good news is that improving access to the region’s
transit systems could help alleviate road congestion and off er an alternative to

II. Regional TOD Opportunities & Constraints17
those bottlenecked drivers. If traffi c continues to worsen, transit becomes all the
more attractive, off ering commuters less time spent traveling.
Th e even better news is that improving transit access is a cheaper option: funda-
mentally, widening roads into hillsides will be vastly more expensive and intrusive
into nearby communities than improving access to station areas and increasing
transit frequency.
Community and Economic Vitality
TOD investments will boost the vitality of nearby communities
Th e Pittsburgh Community Reinvestment Group (PCRG), through its GoBurgh
Initiative, and PCRG’s members are interested in transit and TOD because they
understand the enormous impact access improvements can have on the vitality of
the neighborhoods in which they work. One of the most vivid regional illustra-
tions of this point took place when PennDOT restored parts of the Penn Circle
loop in East Liberty to its historic, two-way traffi c pattern at the urging of the
community, developers and prospective tenants, including Target and Whole
Foods. Such access changes may seem minor but they can unlock pent up poten-
tial for reinvestment in communities by calming traffi c and livening the street.
Access improvements that result in economic revitalization extend well beyond
the experience in East Liberty. In every interview that this report’s authors con-
ducted with CDCs and other neighborhood groups and municipalities through-
out the county, access improvements fl oated to the top of the list of key activities
that could contribute to economic revitalization. A number of these are described
in the sidebar on the following page.
TOD will boost regional economic competitiveness.
A 2012 study by Th e Economist magazine’s Economist Intelligence Unit ranked
regions across the globe based on their ability to be competitive by attracting capi-
tal, businesses, talent, and visitors.
Th e study found that while the
business and regulatory environ-
ment is important, the “quality of
human capital” and quality of life
were factors integral to the success
of the highest ranking regions.
As the report notes, “Many fi rms
fi ght to attract highly educated and
skilled workers, and as such many
choose new [regions] for growth
on the basis of the potential talent pool located there….a more knowledge-
oriented economy is exacerbating this process.” Th e report goes on to identify key
factors supporting or impeding competitiveness, including off ering a lifestyle that
attracts this talent pool, and alleviating congestion.4
Its excellent quality of life coupled with a growing knowledge-based sector has led
Allegheny County to expe rience a surge in the in-migration of young profession-
als over the last several years which has been well documented by the media. In
March 2012, Forbes Magazine identifi ed Pittsburgh as a “Comeback City,” citing
Allegheny County’s population growth in 2009. Th e Post-Gazette reported an
increase in population from 2009 to 2010 across the entire 10 county region. Th e
article added that the city of Pittsburgh is getting younger: whereas the median
age was 35.5 in 2000, it was 33.2 in 2010.5
Th ese young workers are also more likely to have a college degree than young
professionals in many other regions. Of the 366 metros with populations above
4 Economist Intelligence Unit and Citigroup: citiforcities.com 5 Bruner, Jon, “Ten American Comeback Cities,” Forbes Magazine. March 5, 2012. Accessed at http://onforb.es/zwAOQA Carpenter, Mackenzie, “Pittsburgh may be a perfect fi t for One Young World Summit,” Pittsburgh Post-Gazette. March 30, 2012. Accessed at http://bit.ly/WYoNkO
Figure II-2: The Cork Factory Provides Luxury Apartment Living in the Strip District

II. Regional TOD Opportunities & Constraints 18
50,000, Pittsburgh has the 23rd highest share of young professionals. More than
28 percent of the region’s 18- to 34-year-olds have a college degree, exceeding the
shares found in economic powerhouses including Charlotte, Chicago, and Atlanta
and falling shy of Seattle by a fraction of a point.6
6 Reconnecting America, Are We There Yet? Creating Complete Communities in 21st Century America. October 2012. http://reconnectingamerica.org/arewethereyet
Municipalities and community development corpo-
rations across Allegheny County are identifying ac-
cess improvements as critical steps to enhancing the
economic vitality of transit-oriented neighborhoods.
While some improvements are large scale, many of
the identifi ed improvements involve small to mid-
scale pedestrian connections immediately surround-
ing fi xed-guideway station areas. As more communi-
ties see the success that East Liberty has experienced
in tapping into pent-up Shadyside market demand
with new pedestrian bridges and roadway improve-
ments, access improvements seem more critical than
ever as ways to catalyze local economic revitaliza-
tion. For example:
• Th e Wilkinsburg Business District Revitaliza-
tion Plan shifts the emphasis of the business
district closer to the East Busway station than
its historic core, with Penn Avenue and Wood
Street as a key focal point. Th e plan calls
specifi cally for improved connections under
the busway right-of-way, including reopening
a pedestrian tunnel and expanding the Penn
Avenue underpass to create a more prominent
connection with the Wilkinsburg neighbor-
hoods to the west of the alignment. Interviews
with the Wilkinsburg CDC highlighted other
transportation-related issues that need to be
addressed to enhance the business district’s
economic competitiveness, including working
with PennDOT to make Penn Avenue less of
a thruway by retiming the lights; and working
with the Port Authority to off er more visible
and accessible bus stops.
• Th e Homewood “Bridging the Busway” Plan
identifi ed a range of improvements to better
link neighborhoods in south Homewood to the
Point Breeze North neighborhoods by off ering
safer, more accessible and visible connections
across the busway alignment. Operation Better
Block is working with local developers and
investors on components of the plan including
off ering better pedestrian paths parallel to the
busway, and catalyzing new development and
investment immediately northeast of the Home-
wood station.
• Th e intersection of Routes 51 and 88 in the
Overbrook neighborhood of Pittsburgh may be
better known for its car traffi c than its quality
transit access. But the Blue Line T and South
Busway sit just on the northwest side of this
busy intersection. Th is is also the point at which
the South Busway enters its dedicated right-of-
way, speeding people to downtown Pittsburgh.
Economic Development South envisions cap-
turing some of this traffi c in a new Multi-Modal
transit hub that would reduce commute times
for nearby residents who drive today and off er
a new transfer point between the South Bus-
way and the T, doubling the transit choices for
commuters. Th is new access could also prompt
a resurgence in the economic vitality of nearby
shops and neighborhoods in both Pittsburgh
and surrounding boroughs.
Access Improvements Are Economic Development Strategies
II. Regional TOD Opportunities & Constraints19
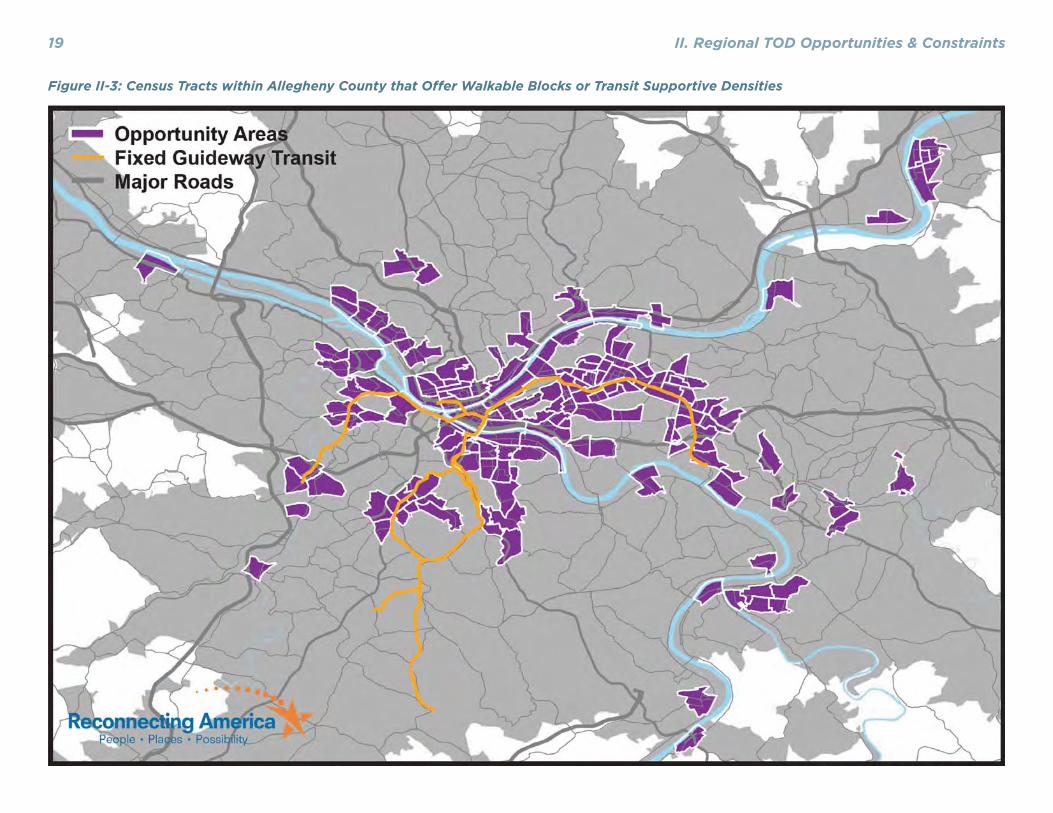
Figure II-3: Census Tracts within Allegheny County that Off er Walkable Blocks or Transit Supportive Densities

II. Regional TOD Opportunities & Constraints 20
Th is surge, in turn, has underscored the growing demand for quality rental hous-
ing in walkable, transit rich communities. But such housing continues to be in
short supply, as refl ected in the fully occupied Cork Factory luxury apartments in
the Strip District of Pittsburgh.
Unlike other regions pushing to attract these young professionals, Pittsburgh
does not have to retrofi t decades of suburban growth and build a whole new tran-
sit network. Th e region has a key competitive advantage in the form of its plenti-
ful walkable urban neighborhoods and high transit ridership. In a recent national
study by Reconnecting America which ranked all 366 metropolitan areas on their
ability to provide complete communities,7 the Pittsburgh region fl oated towards
the top because a much higher than average share of its residents live in walkable
neighborhoods (Figure II-3). Further, the fi xed-guideway system operates through
many of these neighborhoods.
By tapping into this asset, uplifting these neighborhoods, and highlighting their
connectivity to major centers of economic activity like Downtown and Oakland,
the region can continue to attract young professionals, who are increasingly in-
terested in living in neighborhoods where a car is unnecessary and they can walk,
bike, or take transit to work, to see friends and run errands. Neighborhoods near
fi xed-guideway stations will draw both investors and new potential residents seek-
ing a certain quality of life. Deploying the implementation strategies described in
Chapters III and IV could double or triple the number of neighborhoods with the
characteristics desirable to young professionals, reinforcing a regional culture of
car-free living, and further drawing the nation’s young, mobile software engineers,
artists, and writers to Pittsburgh, to create entrepreneurial businesses and lure new
employers.
Th ese kinds of investments can also result in improved access and reduced trans-
portation costs for lower income families. More mixed-income neighborhoods
7 Ibid.
can attract the kind of private investment and services (like grocery stores, doctors
offi ces, etc.) that residents of all incomes need. And improved access to regional
job centers provides better access to job opportunities for workers of all incomes.
Political and Structural Issues
Achieving these critical investments requires new coordination of the many actors responsible for TOD
TOD implementation in Pittsburgh requires signifi cant coordination of fund-
ing sources for development and infrastructure, local leadership, and partnership
across the public and private sectors. Th is is true nationally, but is particularly
true in Allegheny County, where CDCs have taken a leadership role in many
communities in securing funding and fi nancing for development, creating plans,
and forging partnerships with the public and private sectors. Th is coordination of
partners and funding has led to many successes in the region’s transit rich neigh-
borhoods, but requires decades of exceptional leadership, vast hours of paid and
volunteer time, and resources cobbled together from many sources – a level of
coordination that is a signifi cant barrier to entry for many communities.
Th is TOD Strategy seeks to improve the coordination of actors, activities, and
funding sources to broaden the reach of TOD principles throughout the entire
fi xed-guideway transit system. By making TOD a standard practice that all transit
rich communities can participate in through effi cient, coordinated investments,
Allegheny County can continue to bolster the economic vitality of both individu-
al communities and the larger economy.
The transit system will benefi t from TOD
With the Port Authority facing the largest fi scal crisis in its history, it may seem
like transit-oriented development is a low priority where transportation issues are
concerned. But the time has never been better. By reinvesting in the land uses
II. Regional TOD Opportunities & Constraints21
and street infrastructure surrounding the Port Authority’s fi xed-guideway system,
TOD will ultimately make accessing and using the system a signifi cantly easier
and more pleasant experience. Th is in turn could signifi cantly boost ridership and
farebox recovery for the Port Authority. TOD cannot fi ll the operating defi cit, but
can play a signifi cant role in ensuring that the revenue generated through rider-
ship is bolstered and stable.
Of course, TOD requires stable, reliable transit service in order to work. To
ensure that investors and new residents and businesses are willing to plant roots in
the communities with fi xed-guideway stations, they must be sure that the stations
are going to be a permanent asset. Solving the Port Authority’s fi scal crisis will be
a key step to ensure TOD - and its related benefi ts - move forward. Conversely,
any fi nancially-driven service alterations should place higher priority on preserv-
ing or even increasing fi xed-guideway service to preserve the core system and keep
transit- and place-based investment viable and attractive. Th is is vital to continue
Pittsburgh’s rebirth and keep attracting new and young talent to the region.

III. Overview of TOD Implementation Activities 22
III. Overview of TOD Implementation ActivitiesTh is chapter describes a range of activities used to achieve transit-oriented de-
velopment in Allegheny County and elsewhere in the country. Th is information
feeds into recommendations for coordinating and prioritizing implementation of
transit-oriented development that are found in subsequent chapters.
TOD implementation activities extend well beyond just new, thoughtfully-
designed private residential and commercial development near transit. While
new development can play a key role in TOD, it is not necessarily the fi rst, or
best place, for many neighborhoods to start achieving the goals of TOD. Th is is
particularly true in neighborhoods that are already fairly walkable but lack the
market strength to catalyze new development. Th is strategy divides TOD imple-
mentation activities into fi ve distinct categories:
• Visioning, Planning, and Building Capacity
• Local Access Improvements
• Revitalization and Building Reuse
• New Development
• Regional Access and Transit System Improvements
Th e following sections describe the activities that fall under each category, the
benefi t of investing in those activities, and issues to consider during implementa-
tion. Many activities fall under each of these categories, and the exact mix and
type of activity needed in each station area will vary based on local conditions.
Th e typology in Chapter IV off ers a starting point for understanding how dif-
ferent activities could fi ll the unique needs of specifi c station areas. By utilizing
demographic, urban form, social, and market-based data, the typology also creates
a framework for how to allocate the scarce resources available for these implemen-
tation activities across the fi xed-guideway system.
Visioning, Planning, and Building Capacity
Activities such as station
area planning, commu-
nity visioning and scenario
planning, and community
engagement and education
can play key roles in build-
ing momentum and support
for transit-oriented uses and
investments among residents
and policymakers. Visioning
by community-based orga-
nizations can help to build
political will and support from elected offi cials by demonstrating the interest from
the neighborhood in TOD principles. Station area planning off ers predictability
to developers who may be looking for new locations for their investments. Using
station area planning as an opportunity to evaluate a number of distinct land use
scenarios can accomplish many outcomes. Th e scenarios can educate the commu-
nity on the feasibility of diff erent densities and uses and be used to assess whether
value capture mechanisms (such as TRID) can be used to pay for infrastructure
improvements. Th is exercise can empower residents to weigh the pros and cons of
diff erent visions for their community.
Local Access Improvements
Pedestrian Access and Station Visibility
Shared topographical constraints and infrastructure barriers make local access
Figure III-1: Community Members in Wilkinsburg Participate in a Planning Process
Wilkinsburg CDC photo

III. Overview of TOD Implementation Activities23
improvements a key strategy in most - if not all - station areas across the fi xed-
guideway system. Much of the Red Line operates along the crest of a hill, while
part of the Blue Line is cut into the side of a diff erent hill, making pedestrian
access to the station areas challenging. Further, a ravine with a major arterial
highway – Saw Mill Run Blvd - divides much of the Blue Line T stops from the
South Busway, making transfers nearly impossible at all but one point. Improved
stairways and ramps could assist transit riders in accessing stations on foot but
topography will always be a distinct feature of Pittsburgh’s system.
Th ere are access challenges that
can be overcome with relative
ease and low cost, if the resources
to invest in local improvements
can be identifi ed. Wayfi nding
improvements would greatly
increase the prominence of transit
in communities. Several station
areas could benefi t from improve-
ments in station design, including
providing access (through pedestrian paths or bridges) to the platform from both
sides of the tracks, rather than one, and installing sidewalks on adjacent roads and
formalized access paths into adjacent communities, greatly improving the situa-
tion shown in Figure III-2.
Because they were built along existing or former freight alignments, the East and
West Busway stations face access challenges created by repurposed rights-of-way
themselves. Some stations cannot be accessed from both the north and south
sides of the station, and where such access points do exist, they are not always pe-
destrian friendly or safe. While it inherited a historic divide originally created by
the Pennsylvania Railroad Main Line over a century ago, demographic and mar-
Figure III-2: Informal access to Willow Station in Castle Shannon
Building Community Capacity to Implement TOD
A number of communities across Allegheny County have grown increas-
ingly sophisticated community based organizations or CDCs in the last
decade. Th eir stories off er ideas for ways to expand capacity building eff orts
to other municipalities that lack a paid planning department, or to commu-
nities in need of an advocate. For example:
• Acknowledging that the lack of a paid planning staff was limiting the
ability to apply for grants and other community revitalization pro-
grams, political leadership in the borough helped create the Wilkins-
burg CDC in 2006. Th is nonprofi t organization now works to revitalize
the community in close partnership with businesses, property owners,
residents and the municipality.
• Economic Development South is a unique CDC in that it serves a
number of municipalities that comprise part of the south suburban area
of Allegheny County. Brought together by shared congestion and eco-
nomic challenges created by traffi c on Routes 51 and 88, these munici-
palities are now able to work towards economic revitalization through
this nonprofi t entity.
• Among other communities with which it partners, PCRG is initiat-
ing eff orts to organize residents and build capacity for advocacy and
economic revitalization in the Sheraden neighborhood of Pittsburgh.
Th rough its Reimagining Neighborhoods program, full-time PCRG
staff are engaging residents through community events and one-on-one
outreach. As a result, a number of community leaders are emerging, as
is organizational structure and capacity, both of which may be able to
carry forward other economic revitalization work in the future.
III. Overview of TOD Implementation Activities 24
ket diff erences along the East Busway in particular (Figure III-3 and Figure III-4)
illustrate the role this corridor has played in separating otherwise adjacent com-
munities. It should also be noted that this historic divide has, since its creation,
added pedestrian barriers through elimination of overpasses and walling off of
pedestrian tunnels, and little has been done by many actors to reconnect commu-
nities on either side of the corridor. While new or re-opened pedestrian bridges
or tunnels can be costly, creating connections across this barrier can carry market
strength from the south side of the stations to the north side – a key priority for
most community groups and municipalities along the Busway.
Bicycle Access and Infrastructure
Transit-oriented development supports transportation choices, which include
transit use, walking, and bicycling. Pittsburgh is seeing a signifi cant increase in
bicycling, with bike utilization increasing 269% since 20001. Today the city of
Pittsburgh has the fi fth highest share of commuters who walk or bike to work,
the eighth highest in transit commuters, and seventh in the combine transit/
walk/bike category. Investments in bicycle infrastructure could further bolster the
growing popularity of alternative transportation choices.
For residents in communities that are less than 5 miles from a major job or
activity center, bicycling off ers an alternative that can sometimes be faster than
driving or taking transit. Bicycling expands the distance that transit dependent
households can reach comfortably, expanding the area where households can live
without a car but still comfortably access key goods, services, and jobs not in their
immediate neighborhoods. For example, retailers on long commercial corridors
such as Washington Rd. in Mt. Lebanon could reach a greater number of custom-
ers if the T station were better connected to bicycle infrastructure such as dedi-
cated lanes, path access, and long-term secure and sheltered bike storage. Districts
like Downtown, Uptown, the Strip, and Oakland could foster greater internal
1 US Census data
circulation with bicycle street networks. Bicycle infrastructure includes off -street
trails, on-street routes with dedicated lanes, “sharrows” that denote to drivers that
bicycles may be sharing lanes (typically used when roads do not have enough
width to accommodate a separate bike lane), sheltered and unsheltered bicycle
parking, bicycle sharing programs, and programs that foster bicycling such as bike
to work days, maps and other resources such as those off ered by Bike Pittsburgh.
Bicycling also expands the reach of the current transit network into nearby, but
not adjacent communities. Improved weather resistant bicycle facilities such as
bike lockers have been installed at many transit stations across the county as a low
cost way to increase ridership by catching residents who live farther away from the
stations.
As with other modes of access, topography is a key challenge in providing safe
bicycle routes throughout Allegheny County. Car traffi c is fi ltered onto the major
thruways in many communities, and in some neighborhoods the secondary, qui-
eter routes off ering a safe environment for bicycling to and from major destina-
tions are not obvious, or not continuous.
Better, Clearer Transfer Between Fixed-Guideways and the
On-Street Network
Improving connectivity to nearby bus routes is a key priority for many station
areas. Bus shelters and clear signs to direct transit riders making transfers can
boost ridership and support transit-oriented development by fostering increased
transportation choices. Providing clear, highly visible transfer information both
at stations and on-street stops near stations, as well as improved infrastructure
between these stops and stations, will connect the station with more destinations,
thereby off ering households with multiple workers more choices for where they
can live. Th is could include signage; higher-quality, more visible on-street shelters
at transfer points; walkways and bicycle infrastructure; and verbal cues on buses

III. Overview of TOD Implementation Activities25
approaching these respective stations and stops.
In addition to shelters and other infrastructure, one key to successful intermodal bus-to-rail or bus-to-busway transfers is ensuring that networks are clearly delineated
and that transfers are timed, so riders making a transfer can expect to wait only a short amount of time during morning and evening commutes.
Figure III-3: Race and Ethnic Concentrations, 2009, Showing Diff erence Between North and South Side of East Busway
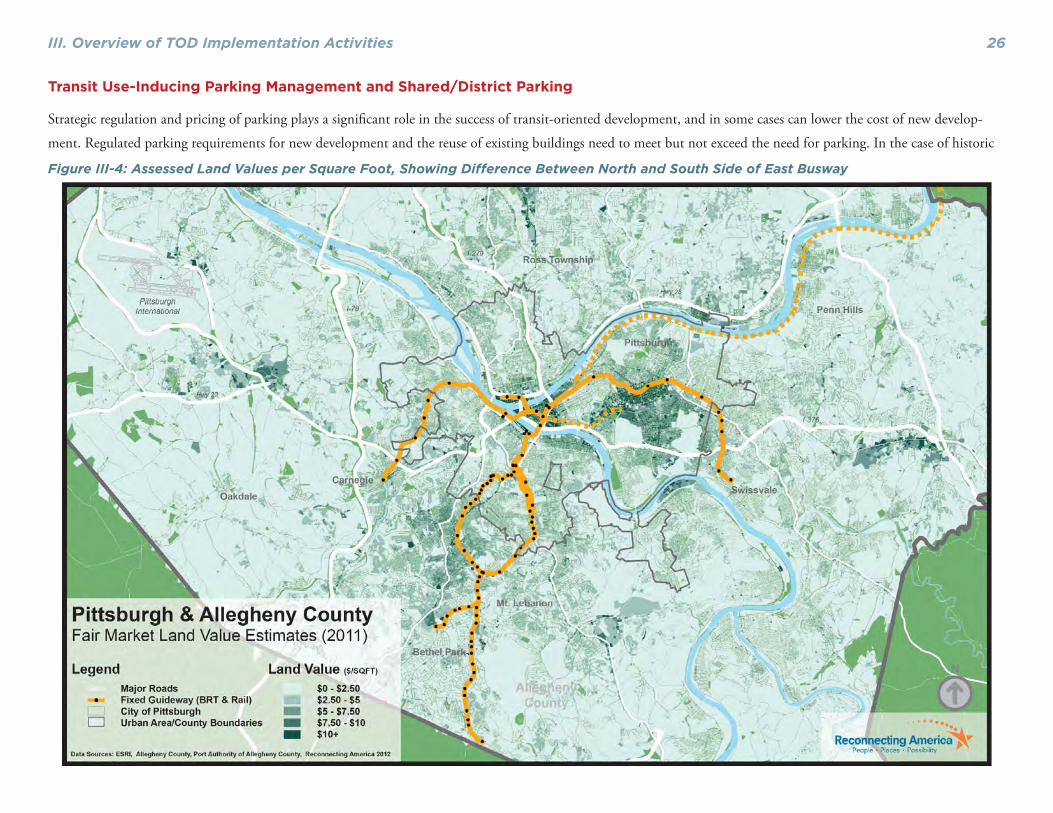
III. Overview of TOD Implementation Activities 26
Transit Use-Inducing Parking Management and Shared/District Parking
Strategic regulation and pricing of parking plays a signifi cant role in the success of transit-oriented development, and in some cases can lower the cost of new develop-
ment. Regulated parking requirements for new development and the reuse of existing buildings need to meet but not exceed the need for parking. In the case of historic
Figure III-4: Assessed Land Values per Square Foot, Showing Diff erence Between North and South Side of East Busway

III. Overview of TOD Implementation Activities27
preservation and building reuse, if there is no on-site location to accommodate
the required parking, parking regulations can limit the types of tenants who
might consider renting or purchasing space in a building. Some cities have elimi-
nated parking requirements altogether for historic reuse of buildings, or charge an
in-lieu fee instead, that can be used to build a shared structure elsewhere nearby.
Th is action removes barriers to attracting desirable tenants like restaurants and of-
fi ce users. Other cities have decided not to regulate parking minimums or maxi-
mums, encouraging developers and lenders to move away from suburban parking
standards. Shared parking is a newer kind of regulation that is popular in transit
rich locations. Shared parking allows spaces to count toward the parking require-
ments of multiple uses. For example, in a mixed-use development, the parking
required for offi ce uses will be busier during the day but empty at night and could
accommodate weekend and evening traffi c to restaurants in the same or nearby
space. Shared parking also allows for fl exibility over time as developers become
more comfortable with the idea of lower parking ratios. While the fi rst devel-
oper in a neighborhood may not be willing to reduce the amount of parking they
provide, requiring that fi rst developer to unbundle parking spaces from their units
will allow for others to rent those spaces if they do not need them later on.
Parking pricing is just as critical as regulation. Parking pricing can control the
demand for parking in parking-scarce areas, and encourage commuters and other
visitors to crowded destinations to use transit instead. Pricing can be dynamic and
be adjusted for demand. Pricing can also generate a revenue stream that can fund
other supportive infrastructure or programs; for example, revenue from city park-
ing garages funded over half of the $54 million infrastructure cost for the streetcar
in the Pearl District of Portland, OR.2 In some regions, such as Houston, parking
pricing has played a major role in increasing transit ridership.
Stormwater and Utility Upgrades
One critical issue facing the revitalization of the county’s transit rich communities
is the stormwater and sewage infrastructure that supports them. Like Allegheny
County, many historic communities across the nation have needed signifi cant
utility, stormwater, and wastewater management upgrades in order to accommo-
date additional growth. Th is can be a costly infrastructure expense that no single
developer or municipality can bear. Integrating green infrastructure into TOD
and access improvements, however, can help reduce the enormous capital burden
2 Ohland, Gloria and Shelley Poticha, Eds. Street Smart: Streetcars and Cities in the 21st Century. Oakland, CA: Reconnecting America, 2009.
East Liberty Innovative Parking Management
Transitioning developers and retailers who are used to suburban parking
layouts is a challenge faced by transit-rich urban locations across the coun-
try. But by allowing the fi rst few new investors in a neighborhood to build
at surburban parking ratios, with a transition plan in place, East Liberty has
been able to catalyze development while keeping the vision of fewer surface
lots alive as the neighborhood changes.
One example of this fl exible parking policy is in the works today. In the late
1990s, Home Depot was recruited to the neighborhood and built a store
closely resembling its more suburban counterparts, complete with a large
surface parking lot. As the market has demonstrated a demand for less park-
ing than was thought needed when the Home Depot was built, its parking
annex is now becoming a key new site for development.
By encouraging East Liberty developers to keep their parking separate from
their units or suites and working with existing developers with large lots so
that the parking can be repurposed if not used, the City and East Liberty
Development are able to continue following this model of enticing new in-
vestment, and changing parking standards and expectations along the way.

III. Overview of TOD Implementation Activities 28
facing the county while also improving the quality of life in and around stations.
Addressing this issue may require community and economic development actors
to forge new partnerships with utility-related groups typically not part of discus-
sions about revitalization and infi ll development.
Revitalization and Building Reuse
Th e reuse of historic buildings has long played a key role in the revitalization of
existing neighborhoods throughout the region and state. For transit rich neigh-
borhoods that were built with the pedestrian in mind, rehabilitation and reuse
of buildings can be the priority strategy for transit-oriented development as well.
Reuse of historic buildings also provides communities a way to embrace and rein-
force their own local identity and culture.
As a city of neighborhoods, Pittsburgh has more small walkable commercial
districts than most cities of similar size. Many surrounding jurisdictions share
this pattern of small, walkable retail districts. Some of these are vibrant and fully
occupied, while others are in need of signifi cant reinvestment. Reinforcing the
vitality of these districts by attracting new tenants and reusing buildings also
fosters transit-oriented development by off ering a variety of shopping and services
that are within a walkable or bikeable distance to residents of the surrounding
neighborhood.
A wide variety of programs exist to support historic preservation, building reuse,
and reclamation of blighted properties. Th ese are discussed in Chapter V: Fund-
ing and Financing.
New Development
As noted above, new development is the most commonly known kind of TOD
activity, but is not always necessarily the fi rst or best step that a community can
take to support TOD principles. Before transit-oriented development can occur,
land use regulations can ensure that the design of new development is supportive
of pedestrian access and that appropriate parking requirements are in place.
Th ere is no one size fi ts all standard for density, land use mix, or design for new
transit-oriented development. Successful, new transit-oriented development can
include compact single-family homes, rowhouses, multi-story apartment build-
ings or towers. Th e important thing is that the design fosters walkability, off ers se-
cure and attractive bicycle parking, and encourages transportation choices. Some
new transit-oriented development projects can even help to leverage much needed
pedestrian infrastructure and station access, as is proposed at Castle Shannon and
Overbrook Middle School (see sidebar next page).
In some cases, transit-oriented development may not be the most profi table use
for a developable property, and policymakers will need to determine whether
the investment of new development is more important than project design and
use. Th ere have been many instances where a proposed suburban retail big box
development has been selected over an envisioned but not yet proposed potential
high-density mixed-use development. Each community will need to weigh these
trade-off s; if community-supported TOD plans and visions are in place ahead of
time, these articulated visions can guide elected offi cials in their decisions.
Regional Access & Transit System Improvements
Often overlooked in TOD implementation is the “T” itself: transit. For TOD to
attract strong market demand both for developers and potential tenants, transit
service must be highly visible and accessible, convenient, frequent, and reliable.
In connecting regional destinations, transit must also off er travel times that are
competitive with the private automobile in serving job centers and other major
destinations.

III. Overview of TOD Implementation Activities29
As Chapter V discusses, funding for small- to mid-scale pedestrian, bicycle and
parking access improvements to station areas is hard to come by. But many
stations in the Allegheny County system are in dire need of these types of
improvements. Two developers are leveraging their transit-oriented projects in
order to off er these very types of improvements:
Drivers and nearby residents face many hurdles when parking or walking to
the South Bank station on the Blue Line T and South Busway. Drivers to the
station today park in surrounding neighborhoods, cross busy
Saw Mill Run Blvd., and walk down an unmaintained path to
the poorly marked station. Neighbors face the same challenge.
But a proposed senior housing and assisted living facility at the
former Overbrook Middle School facility would add 120 new
residential units, as well as a new transit drop off area, walkway,
and a pedestrian bridge over the Saw Mill Run creek to replace
a bridge that was washed out years ago. Developers NRP Group
and Valcott Enterprises are able to include these access ameni-
ties because the scale of the new infrastructur e is small relative
to the scale of the project. But station areas elsewhere in the
system may not always have the capacity to support new devel-
opment at the scale needed to leverage such infrastructure.
Th e proposed Shannon Transit Village project will enhance
pedestrian and bicycle access, increase park-and-ride spaces, and
elevate the profi le of the Castle Shannon station on the Red
Line. Th e eight-story mixed-use residential apartment and retail
development will be built on a parking deck on Port Authority
land to accommodate commuters using the park-and-ride facility.
Th e project involves strong partnerships from both the public and private sec-
tors, with the public sector contributing more than $11 million to the project
(for more on the funding sources for this project, see Chapter V). Th e new
development will not only increase the accessibility of the station, it will also
introduce a new housing product type – high-density market rate apartments
– to the surrounding neighborhood, paving the way for future transit-oriented
development. Figure III-5: Concept Plan for Overbrook Senior Housing at the South Bank Station, Rendering of Shannon Transit Village
RDL Architects, the NRP Group, LLC, Economic Develop ment South, PFDA Architects, Inc., Clearview Strategies
Leveraging new development to improve transit access

III. Overview of TOD Implementation Activities 30
Th e Port Authority’s service addresses many of these factors by conveying a sense
of permanence through its fi xed-guideway system. Although service cuts over the
years have diminished this sense of certainty to some degree, the physical infra-
structure and separated rights-of-way still signal to the development community
that higher quality service will generally remain intact along the T lines and bus-
ways for years to come. Instilled with this confi dence, they are able to “sell” the
transit lifestyle to potential residential and commercial tenants, leading to higher
rents and lower vacancy rates.
Visibility and Station Presence
Th is image and quality of the system can be further enhanced. For riders who are
not familiar with the system, the visibility of transit stations is limited. Th at is,
commuters are not made well aware of the availability of rail and busway stations
through signage and marketing. Visitors to the Washington, DC region, on the
other hand, are given clear direction, both from the highway and once they have
entered the system, to access the widely popular Metro system. Th e Pittsburgh
region has this same opportunity to promote its transit assets and funnel daily and
less frequent drivers to the system.
Secondly, enhancing the station platforms and shelters themselves could improve
the sense of transit permanence. In some cases, T stations are similar to local bus
stops in that they off er on-demand service only (i.e. the train stops only when
someone is waiting or upon passenger request) and limited passenger ameni-
ties. Station investments including weather protection, attractive lighting, sitting
areas, transit and area maps, civic art, possible vendor spaces, and overall station
branding give stations a greater sense of place for riders and developers alike.
Where right of way limitations present a constraint for station expansion, the case
may be made for additional station consolidation, which would also speed transit
travel times.
Reducing Transit Travel Times to Key Destinations
Permanence and visibility, however, are not the only factors in attracting TOD. As
mentioned above, the transit service must be competitive with the private auto-
mobile in terms of travel times. A ratio of transit travel time to driving time of 1.5
or better is considered competitive. Between a ratio of 1.5 and 2.0, transit is still
competitive, but is less so given that it is almost doubling the amount of time get-
ting to work and home to families. Over 2.0, transit becomes far less competitive
from a time calculation perspective.3
As illustrated in Figure III-7, East and West Busway stations tend to off er the fast-
est relative service, many of them averaging ratios of less than approximately 1.75.
Only three stations (all along the East Busway) in the system fall into the highly
3 Litman, Todd, “Valuing Transit Service Quality Improvements: Considering Comfort and Convenience in Transport Project Evaluation.” Vancouver, BC: Victoria Transport Policy Institute, November 24, 2011. http://bit.ly/WFQDBu
Figure III-6: Prominent Bus Shelters and Branding on Cleveland’s Health Line Off er a Sense of Transit Quality and Permanence
Credit: EMBARQ Brasil, Flickr

III. Overview of TOD Implementation Activities31
Figure III-7: Transit Competitiveness: Transit/Auto Travel Time Ratios for Non-Downtown Pittsburgh Station Areas

III. Overview of TOD Implementation Activities 32
competitive category of below 1.5. Blue Line stations are less time competitive
with most of them clustered just below and above 2.0. Th e majority of Red Line
and South Busway stations are above 2.0, thereby making it challenging to attract
busy commuters from their cars. Due to this lack of competitiveness, developers
and tenants are less likely to view the transit service as an amenity that warrants
rental and/or sales premiums. Addressing this issue by increasing spacing between
stations, changing fare collection mechanisms, and otherwise reducing travel time
will increase the competitiveness of low performing station areas for TOD. While
this measure focuses on travel times to Downtown, travel times to Oakland from
all West Busway, Red, and Blue Line stations will be less competitive while all
East Busway stations (except Heron Ave.) will be more competitive. Th e compe-
tiveness of reaching Oakland along the BRT corridor will be similar to its Down-
town competitiveness.
Modifying & Streamlining Fare Collection
Reducing the time for fare collection is one of the primary ways to reduce the
boarding and alighting time. Outside of Downtown, fares are collected on-board
buses either as passengers board or depart depending on the direction of service,
then switches to boarding-only collection after 7PM. On the Red and Blue lines,
on-board fare collection depends upon whether or not an attendant is on duty at
a station – or if it even is a station stop. While this method helps speed outbound
boardings at rush hour, the travel times savings can be nullifi ed once passengers
pay at their destination. Th is slows deboarding since passengers are all funneled
by the farebox and cannot exit rear doors. Inbound causes similar bottlenecks as
passengers must pay at the farebox rather than board through all doors. It is also
confusing to the casual or new user, creating a consumer-unfriendly experience.
Th e Port Authority is moving towards a more effi cient system with the implemen-
tation of the ConnectCard system. By ultimately migrating to an entirely off -
board fare collection system along the fi xed guideways and Oakland-Downtown
BRT corridor, it has the potential to signifi cantly reduce travel times, thereby
increasing the amenity value and development potential around transit. Other
methods of speeding boarding/alighting (ConnectCard scanners at the rear door,
for example) also increase the comfort of taking transit, as does a fare collection
method that does not depend on the time of day.
Actors Responsible for Implementation
Traditionally, the public sector has been held responsible for implementation
of TOD. Local governments have taken the lead in planning and visioning and
provide project subsidies through redevelopment and project entitlements; transit
agencies have fostered TOD with catalytic joint development projects and station
area access improvements; and, Metropolitan Planning Organizations (MPOs)
have granted regional transportation dollars to localities to make local access
improvements and catalyze supportive development (see the funding chapter for
more on the roles of MPOs)
In Pittsburgh and throughout Pennsylvania, community based organizations and
other nonprofi t advocates have often taken a leadership role in implementing
neighborhood change and revitalization. In other parts of the country nongov-
ernmental organizations tend to play more of a role in advocating for supportive
policy change but not implementation of community revitalization strategies. In
Pittsburgh, nongovernmental organizations both advocate and implement.
Across the country, a wider variety of actors are taking on the implementation
of the activities described in this chapter. Further, the interdisciplinary nature of
transit-oriented development requires collaboration across sectors, and amongst
public, private, and nonprofi t stakeholders. Table III-1 off ers examples of the
implementation strategies, and the actors who could take a lead or supporting
role in implementing these activities.

III. Overview of TOD Implementation Activities33
Th e successful revit alization of the East Liberty
neighborhood has required decades of coordination
of public agencies at all scales, community based
organizations, and the private sector. A snapshot of
some roles played by diff erent actors include:
East Liberty Development, Inc. has taken a lead role
in coordinating and developing vision and commu-
nity plans; securing fi nancing for key catalytic devel-
opment projects; attracting investors and developers;
coordinating overall strategies.
Th e Urban Redevelopment Authority has worked
with developers to secure fi nancing for projects,
including negotiating TIF agreements.
Th e City of Pittsburgh led the TRID planning
study, which identifi ed key development opportuni-
ties and infrastructure improvements to foster mo-
bility of pedestrians and bicyclists as well as transit
riders and drivers throughout the neighborhood and
into connecting neighborhoods. Th e City is cur-
rently identifying citywide priority mobility projects
through its MovePGH and PlanPGH initiatives.
Private Developers such as the Mosites Company
have led catalytic projects such as Eastside I.
Penn Avenue falls within the purview of PennDOT.
Th e state transportation
authority has been re-
sponsible for implement-
ing improvements such as
the Eastside Pedestrian/
Bike Bridge, converting
portions of Penn Circle
back to two-way and
improving ped/bike ame-
nities, making decisions
about signal timing, etc.
Political leadership
including the Mayor’s
Offi ce, Pittsburgh City
Council, County leaders, Congressmen and Sena-
tors have played a key role in advocating for funding
for improvements at the state and federal scales.
Th e Pittsburgh Parking Authority is responsible for
managing parking pricing at public parking spaces.
Community Leaders play a key role in securing in-
put from residents and businesses, garnering support
for appropriate projects, and off ering community
based programs that ensure opportunities created
by the revitalization of East Liberty are benefi cial to
today’s residents.
Th e Port Authority operates both surface bus and
busway service through the neighborhood, and will
be a lead partner in the construction of the new East
Liberty Transit Center which includes both a new
bus transfer interface as well as street and pedestrian
improvements to the East Busway station.
Philanthropy has supported the visioning, planning
and community organization eff orts over the last
several decades.
Local businesses foster an entrepreneurial spirit in
a changing neighborhood, and ensure the ongoing
vitality of street life throughout the business district.
It Takes a Village: The Unique Partnerships that Create Success
Figure III-8: The East Liberty Transit Center will improve both pedestrian and bus connections to the East Liberty Busway station, while opening up additional potential for investment and economic revitalization in the surrounding neighborhood.
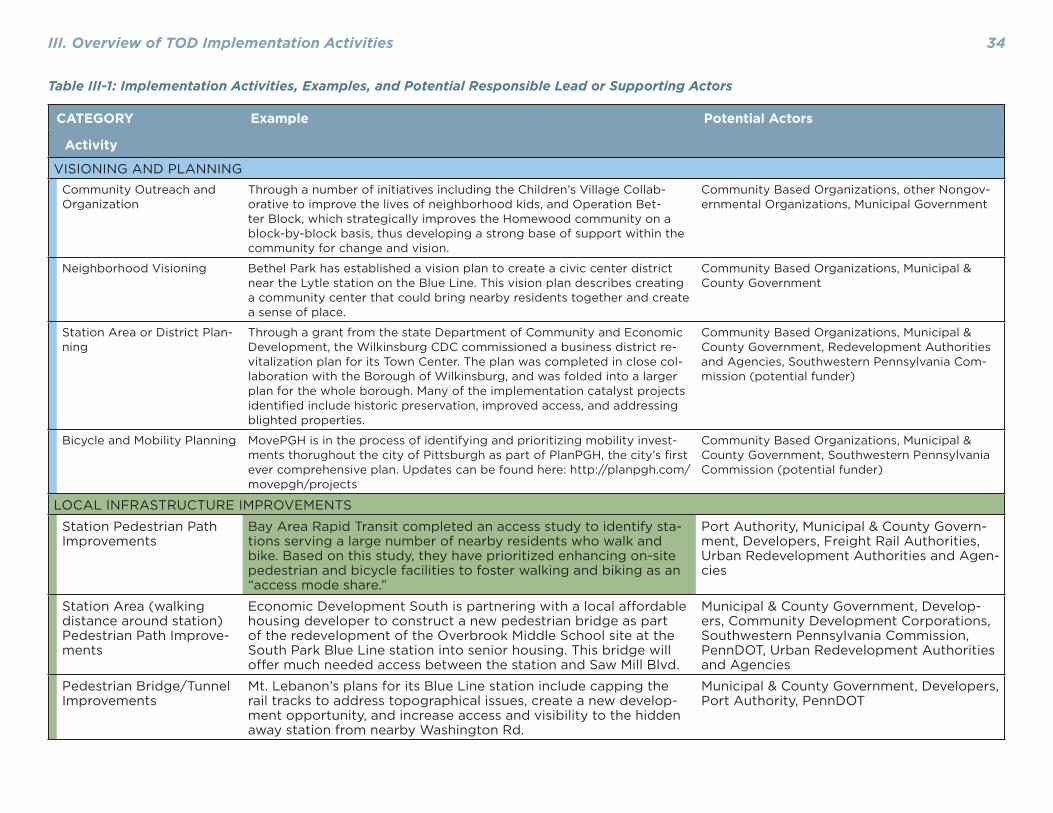
III. Overview of TOD Implementation Activities 34
Table III-1: Implementation Activities, Examples, and Potential Responsible Lead or Supporting Actors
CATEGORY Example Potential Actors
Activity
VISIONING AND PLANNINGCommunity Outreach and Organization
Through a number of initiatives including the Children’s Village Collab-orative to improve the lives of neighborhood kids, and Operation Bet-ter Block, which strategically improves the Homewood community on a block-by-block basis, thus developing a strong base of support within the community for change and vision.
Community Based Organizations, other Nongov-ernmental Organizations, Municipal Government
Neighborhood Visioning Bethel Park has established a vision plan to create a civic center district near the Lytle station on the Blue Line. This vision plan describes creating a community center that could bring nearby residents together and create a sense of place.
Community Based Organizations, Municipal & County Government
Station Area or District Plan-ning
Through a grant from the state Department of Community and Economic Development, the Wilkinsburg CDC commissioned a business district re-vitalization plan for its Town Center. The plan was completed in close col-laboration with the Borough of Wilkinsburg, and was folded into a larger plan for the whole borough. Many of the implementation catalyst projects identifi ed include historic preservation, improved access, and addressing blighted properties.
Community Based Organizations, Municipal & County Government, Redevelopment Authorities and Agencies, Southwestern Pennsylvania Com-mission (potential funder)
Bicycle and Mobility Planning MovePGH is in the process of identifying and prioritizing mobility invest-ments thorughout the city of Pittsburgh as part of PlanPGH, the city’s fi rst ever comprehensive plan. Updates can be found here: http://planpgh.com/movepgh/projects
Community Based Organizations, Municipal & County Government, Southwestern Pennsylvania Commission (potential funder)
LOCAL INFRASTRUCTURE IMPROVEMENTS
Station Pedestrian Path Improvements
Bay Area Rapid Transit completed an access study to identify sta-tions serving a large number of nearby residents who walk and bike. Based on this study, they have prioritized enhancing on-site pedestrian and bicycle facilities to foster walking and biking as an “access mode share.”
Port Authority, Municipal & County Govern-ment, Developers, Freight Rail Authorities, Urban Redevelopment Authorities and Agen-cies
Station Area (walking distance around station) Pedestrian Path Improve-ments
Economic Development South is partnering with a local aff ordable housing developer to construct a new pedestrian bridge as part of the redevelopment of the Overbrook Middle School site at the South Park Blue Line station into senior housing. This bridge will off er much needed access between the station and Saw Mill Blvd.
Municipal & County Government, Develop-ers, Community Development Corporations, Southwestern Pennsylvania Commission, PennDOT, Urban Redevelopment Authorities and Agencies
Pedestrian Bridge/Tunnel Improvements
Mt. Lebanon’s plans for its Blue Line station include capping the rail tracks to address topographical issues, create a new develop-ment opportunity, and increase access and visibility to the hidden away station from nearby Washington Rd.
Municipal & County Government, Developers, Port Authority, PennDOT

III. Overview of TOD Implementation Activities35
CATEGORY Example Potential Actors
Activity
Sidewalk Enhancements Cities including Dallas, Baton Rouge, Miami and Cleveland are installing temporary “complete streets” to off er neighbors and drivers a sense of what a street with wider sidewalks and bike lanes could feel like without the wholesale infrastructure expense. These pop-up streets fi ll a lane of traffi c or parking with temporary barriers, new landscaping, painted bike lanes, seating and other features for a week or several days a month. This approach has successfully resulted in the permanent transformation of streets in the long run.
Municipal & County Government, Develop-ers, Southwestern Pennsylvania Commission, PennDOT, Urban Redevelopment Authorities and Agencies
Station Wayfi nding and In-creased Visibility
The Bay Area Metropolitan Transportation Commission (the MPO) started a “Safe Routes to Transit” program off ering funding to improve lighting, signage to stations, and area road crossings. This funding has been used in many station areas to increase signage from major thoroughfares to the BART system.
Main Street Programs, Municipal & County Gov-ernment, Urban Redevelopment Authorities and Agencies, CDCs, Port Authority, PennDOT
Bicycle Lane Enhancements Led by Pittsburgh’s Urban Redevelopment Authority in collaboration with community groups including the Lawrenceville Corporation, the Allegheny River Green Boulevard plan envisions a bicycle path along an existing right of way between Lawrenceville and downtown Pittsburgh, via the Strip District.
Municipal & County Government, Develop-ers, Southwestern Pennsylvania Commission, PennDOT, Urban Redevelopment Authorities and Agencies
Bicycle Programming In addition to publishing an easy to use bicycle map of the region, BikeP-GH organizes a range of events each year to foster bicycling for recreation and work. These events include Car Free Fridays and Pedal Pittsburgh, an annual celebration of cycling that creates a festival like atmosphere along several bike routes in the region.
Nonprofi ts, Philanthropy, Local Governments, Southwestern Pennsylvania Commission, Port Authority
Bicycle Parking at Station A partnership of the Utah Transit Authority, Salt Lake City, and the Utah DOT created the Bicycle Transit Center at UTA’s main hub just outside of downtown Salt Lake City. This facility off ers bike repairs, showers, climate controlled bike storage, and bike rentals year round.
Port Authority, Municipal & County Govern-ment, Southwestern Pennsylvania Commission, PennDOT
Parking Management In 2011, the City of Chicago established a “congestion premium” on down-town parking rates in order to encourage transit, biking, and walking. The $28 million in revenue from the tax is reinvested in expanding transit lines and operations into and around downtown.
Pittsburgh Parking Authority Municipal Govern-ment, CDCs
Stormwater and Utility Upgrades
In 2010, the Bay Area Metropolitan Transportation Commission added util-ity and wastewater infrastructure to its list of approved “transportation for livable communities” grant uses as a way to incentivize additional growth in walkable historic communities near transit stops.
Developers, Urban Redevelopment Authorities and Agencies, Water and Sewer Authorities, Mu-nicipal & County Government

III. Overview of TOD Implementation Activities 36
CATEGORY Example Potential Actors
Activity
REVITALIZATION AND REUSEHistoric Preservation of Residential or Commercial Structures
The Pittsburgh History & Landmarks Foundation, together with a group of community members has been revitalizing the Victorian homes of Hamnett Place on a house-by-house basis. The eff orts have begun to turn around the neighborhood, making the streets and sidewalks feel safer, more pleasant, and ultimately more walkable.
Pittsburgh History and Landmarks Foundation, Urban Redevelopment Authorities and Agencies, CDCs, Developers
Façade Improvements The Streetface façade renovation program, administered by the Urban Re-development Authority of Pittsburgh, provides matching funds to eligible commercial building owners and tenants to improve their building fa-cades. Improved façades not only have a great impact on the appearance of the neighborhood, but also can positively aff ect a business’s bottom line by creating an atmosphere that’s inviting to customers. Citywide, over 200 façades have been improved and $2.4 million of public investment has leveraged over $4.2 million of private investment.
Main Street Programs, Urban Redevelopment Au-thorities and Agencies, CDCs, Developers
Main Street Improvements Utilizing Mainstreets and Historic District programs, among others, the former Southside Local Development Company invested in street trees, trash removal, and lighting and pedestrian crosswalk pilots along E. Car-son St. and ensured that Southside Works’ façade improvements crossed the street. Along with other programs, this signifi cantly increased private commercial and residential investment within the corridor.
Main Street Programs, Urban Redevelopment Au-thority, CDCs, Municipal & County Governments
Main Street Programming The Lawrenceville Mainstreets program provides organizational support and funding to support the growth of Lawrenceville’s two designated “Main Street” districts: Butler Street (from 34th to 55th Streets) and Penn Avenue (from 40th St. to Friendship Ave.). Since 1990, Lawrenceville has been provided Mainstreet support through the URA’s Streetface façade renovation program, assisting in the renovation of over 100 facades. It’s also provided promotional funding to support community events and ac-tivities like the Joy of Cookies Cookie Tour.
Main Street programs, community based organi-zations
Retail Tenant Attraction Through SSLDC’s Mainstreet programming, E. Carson retail vacancy fell from 45% in 1982 to 15% in 2011 – a level below that of suburban shop-ping malls. Today, little public investment is needed to maintain and grow commercial activity within the corridor. Median home values have also increased 500% within the district, again now driven almost entirely by private investment.
Developers, Urban Redevelopment Authorities and Agencies, Main Street Programs, CDCs
NEW DEVELOPMENTBrownfi elds Cleanup The Urban Redevelopment Authority worked with developers and state
environmental agencies to clean up the former LTV Steel site to support development of the South Side Works, among others.
Urban Redevelopment Authorities and Agencies, Developers, CDCs, Local Governments, EPA
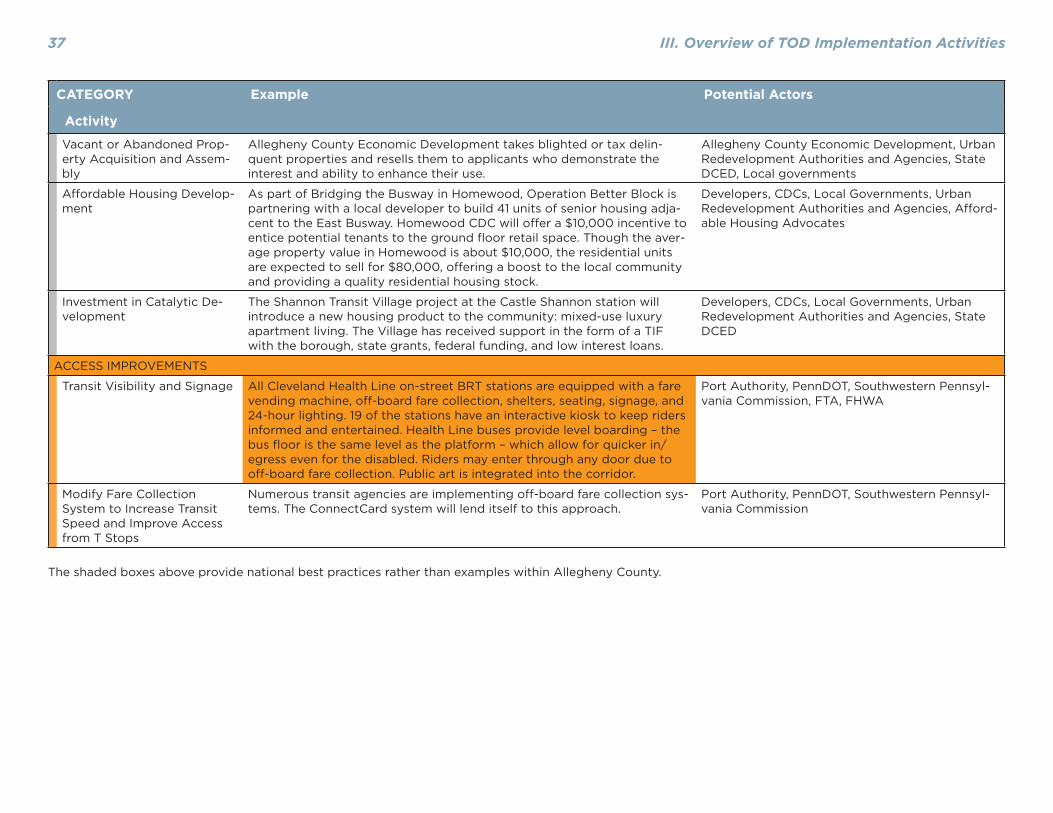
III. Overview of TOD Implementation Activities37
CATEGORY Example Potential Actors
Activity
Vacant or Abandoned Prop-erty Acquisition and Assem-bly
Allegheny County Economic Development takes blighted or tax delin-quent properties and resells them to applicants who demonstrate the interest and ability to enhance their use.
Allegheny County Economic Development, Urban Redevelopment Authorities and Agencies, State DCED, Local governments
Aff ordable Housing Develop-ment
As part of Bridging the Busway in Homewood, Operation Better Block is partnering with a local developer to build 41 units of senior housing adja-cent to the East Busway. Homewood CDC will off er a $10,000 incentive to entice potential tenants to the ground fl oor retail space. Though the aver-age property value in Homewood is about $10,000, the residential units are expected to sell for $80,000, off ering a boost to the local community and providing a quality residential housing stock.
Developers, CDCs, Local Governments, Urban Redevelopment Authorities and Agencies, Aff ord-able Housing Advocates
Investment in Catalytic De-velopment
The Shannon Transit Village project at the Castle Shannon station will introduce a new housing product to the community: mixed-use luxury apartment living. The Village has received support in the form of a TIF with the borough, state grants, federal funding, and low interest loans.
Developers, CDCs, Local Governments, Urban Redevelopment Authorities and Agencies, State DCED
ACCESS IMPROVEMENTS
Transit Visibility and Signage All Cleveland Health Line on-street BRT stations are equipped with a fare vending machine, off -board fare collection, shelters, seating, signage, and 24-hour lighting. 19 of the stations have an interactive kiosk to keep riders informed and entertained. Health Line buses provide level boarding – the bus fl oor is the same level as the platform – which allow for quicker in/egress even for the disabled. Riders may enter through any door due to off -board fare collection. Public art is integrated into the corridor.
Port Authority, PennDOT, Southwestern Pennsyl-vania Commission, FTA, FHWA
Modify Fare Collection System to Increase Transit Speed and Improve Access from T Stops
Numerous transit agencies are implementing off -board fare collection sys-tems. The ConnectCard system will lend itself to this approach.
Port Authority, PennDOT, Southwestern Pennsyl-vania Commission
The shaded boxes above provide national best practices rather than examples within Allegheny County.

IV. TOD Implementation Priorities by Station Area 38
IV. TOD Implementation Priorities by Station Area Given the sheer size and reach of Pittsburgh’s fi xed-guideway system, TOD imple-
mentation at the countywide scale can seem daunting. With over 100 light rail
and busway stations and limited resources to address their diverse needs, the time
is right to strategically organize and guide eff orts to optimize the system through
planning and community development. Th e TOD typology framework described
in this chapter is designed specifi cally to identify and prioritize station areas with
common implementation needs and TOD potential.
Th is typology does not supplant local planning eff orts, but rather helps guide and
focus community development activities and resources in smaller communities
and lower capacity neighborhoods as the real estate market steadily rebounds. Th e
typology classifi es station areas into fi ve place types that have common implemen-
tation needs. Each place type prioritizes a diff erent set of implementation activi-
ties from those described in the previous chapter.
Overview
Th e typology, or method of sorting the region’s fi xed-guideway station areas into
diff erent types, is designed to help PCRG and its local partners better leverage
TOD potential across the region. Th e typology is a holistic measure of a commu-
nity’s overall transit orientation and relative market strength, based on an assess-
ment of the built, social, development and political environments. While existing
transit orientation capitalizes on existing urban assets to build transit ridership
and transportation choice for current households, market strength and capacity
captures future potential for growth in the form of new development. A detailed
description of the proposed methodology is described below.
People + Places
A community’s transit orientation cannot be distilled to a single factor. It is the
function of a number of interworking land use and transportation characteristics.
Th is typology includes a composite transit orientation index that captures a blend
of existing physical and social characteristics proven to generate transit ridership
and walking and biking trips; namely: residential and employment densities,
mix of uses, and average block sizes. It also incorporates key predictors of transit
lifestyles, transit dependency (auto ownership) and transit vs. driving travel times.
For purposes of transparency and consistency, the chosen elements are simple,
and available for ongoing analysis into the future as conditions change.
Th e typology includes the following specifi c measures of transit orientation:
• People: Th e number of residents and workers in an area has a direct correla-
tion with reduced auto trips1;
• Places: Areas with commercial urban amenities such as restaurants, grocers,
and specialty retail not only allow residents to complete daily activities with-
out getting in a car, but they also improve the likelihood of higher density
development by increasing residential land values2;
• Physical Form: Small block sizes promote more compact development and
walkability;3
1 Newman, Peter and Jeff Kenworthy, “Urban Design to Reduce Automobile Dependence.” Opolis, v. 2 no 1 (2006).2 An Assessment of the Marginal Impact of Urban Amenities on Residential Pricing. Johnson-Gardner (2007). 3 Holtzclaw, John, Robert Clear, Hank Dittmar, David Goldstein, and Peter Haas, “Location Effi ciency: Neighborhood and Socio-Economic Characteristics Determine Auto Ownership and Use?” Transportation Planning and Technology, Vol. 25, March 2002, pgs. 1-27.
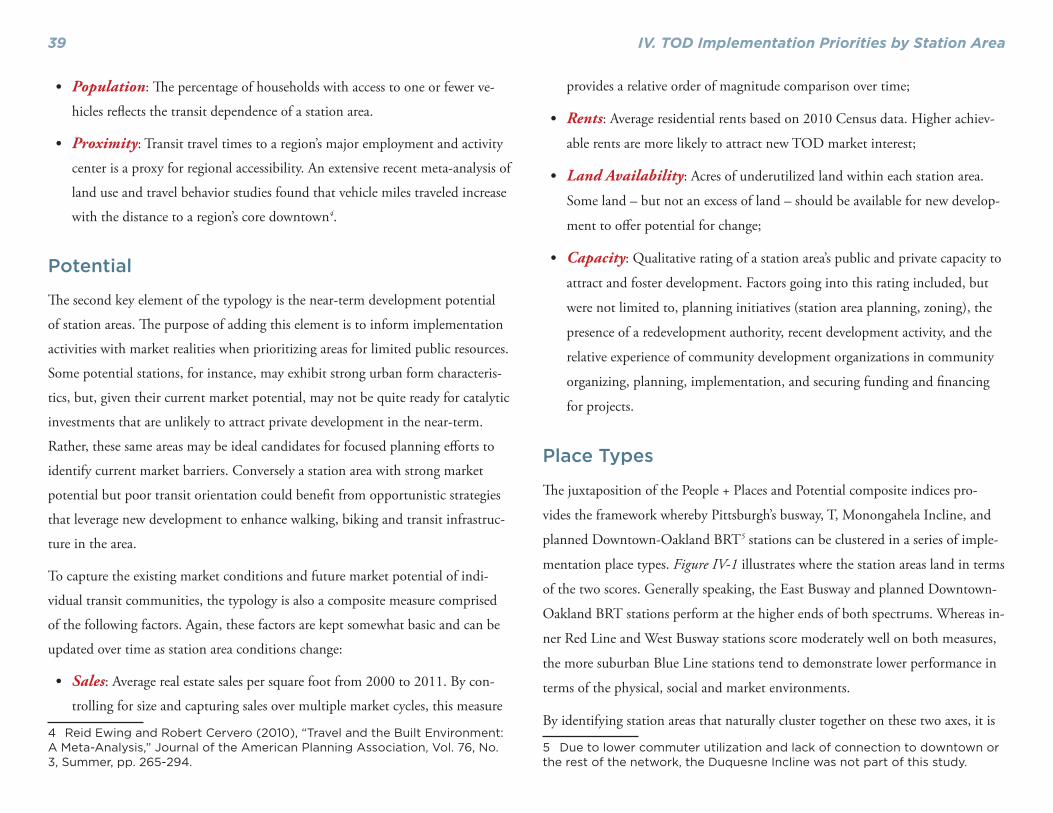
IV. TOD Implementation Priorities by Station Area39
• Population: Th e percentage of households with access to one or fewer ve-
hicles refl ects the transit dependence of a station area.
• Proximity: Transit travel times to a region’s major employment and activity
center is a proxy for regional accessibility. An extensive recent meta-analysis of
land use and travel behavior studies found that vehicle miles traveled increase
with the distance to a region’s core downtown4.
Potential
Th e second key element of the typology is the near-term development potential
of station areas. Th e purpose of adding this element is to inform implementation
activities with market realities when prioritizing areas for limited public resources.
Some potential stations, for instance, may exhibit strong urban form characteris-
tics, but, given their current market potential, may not be quite ready for catalytic
investments that are unlikely to attract private development in the near-term.
Rather, these same areas may be ideal candidates for focused planning eff orts to
identify current market barriers. Conversely a station area with strong market
potential but poor transit orientation could benefi t from opportunistic strategies
that leverage new development to enhance walking, biking and transit infrastruc-
ture in the area.
To capture the existing market conditions and future market potential of indi-
vidual transit communities, the typology is also a composite measure comprised
of the following factors. Again, these factors are kept somewhat basic and can be
updated over time as station area conditions change:
• Sales: Average real estate sales per square foot from 2000 to 2011. By con-
trolling for size and capturing sales over multiple market cycles, this measure
4 Reid Ewing and Robert Cervero (2010), “Travel and the Built Environment: A Meta-Analysis,” Journal of the American Planning Association, Vol. 76, No. 3, Summer, pp. 265-294.
provides a relative order of magnitude comparison over time;
• Rents: Average residential rents based on 2010 Census data. Higher achiev-
able rents are more likely to attract new TOD market interest;
• Land Availability: Acres of underutilized land within each station area.
Some land – but not an excess of land – should be available for new develop-
ment to off er potential for change;
• Capacity: Qualitative rating of a station area’s public and private capacity to
attract and foster development. Factors going into this rating included, but
were not limited to, planning initiatives (station area planning, zoning), the
presence of a redevelopment authority, recent development activity, and the
relative experience of community development organizations in community
organizing, planning, implementation, and securing funding and fi nancing
for projects.
Place Types
Th e juxtaposition of the People + Places and Potential composite indices pro-
vides the framework whereby Pittsburgh’s busway, T, Monongahela Incline, and
planned Downtown-Oakland BRT5 stations can be clustered in a series of imple-
mentation place types. Figure IV-1 illustrates where the station areas land in terms
of the two scores. Generally speaking, the East Busway and planned Downtown-
Oakland BRT stations perform at the higher ends of both spectrums. Whereas in-
ner Red Line and West Busway stations score moderately well on both measures,
the more suburban Blue Line stations tend to demonstrate lower performance in
terms of the physical, social and market environments.
By identifying station areas that naturally cluster together on these two axes, it is
5 Due to lower commuter utilization and lack of connection to downtown or the rest of the network, the Duquesne Incline was not part of this study.

IV. TOD Implementation Priorities by Station Area 40
possible to generate implementation place types where the needs and opportuni-
ties are similar.
Th ese place types, defi ned in the next several pages, are:• Infi ll & Enhance• Catalyze• Connect• Plan & Partner• Educate & Envision
Prioritization
Th e place types are designed to inform the prioritization of the implementa-
tion activities described in the previous chapter. With scarce time and fi nancial
resources available for implementation, it will be important for county, regional,
and statewide agencies, advocates, collaboratives and other organizations to make
systematic, informed investments that leverage the greatest impact in station
areas. Certain activities will be more eff ective in some place types than others.
Figure IV-1, on the next page, shows broadly how the clusters of activities could
be prioritized in the diff erent place types based on whether they would be more or
less able to leverage signifi cant change. Th e following pages off er a brief descrip-
tion of each place type with an explanation of why diff erent investment needs are
appropriate.
Th e place type information can also inform community-based groups and munic-
ipalities in understanding the needs in their station areas. Each of the below place
type descriptions include a brief profi le of a station area falling in that place type,
with their relative performance on all eight indicators described above. Similar
charts can be found in the appendix, for use at the local and station area level.
Table IV-1: Prioritization of Implementation Activities by Place Type
Building Capacity of Local TOD Champions
Planning/ Visioning Access Improvements
Community and Economic Revitalization
Catalytic Development
Infi ll & Enhance Low Low Medium Medium Medium
Catalyze High Medium Medium High High
Connect Medium High High Medium High
Plan & Partner High High Medium Low Low
Educate & Envision Medium Medium Low Low Low
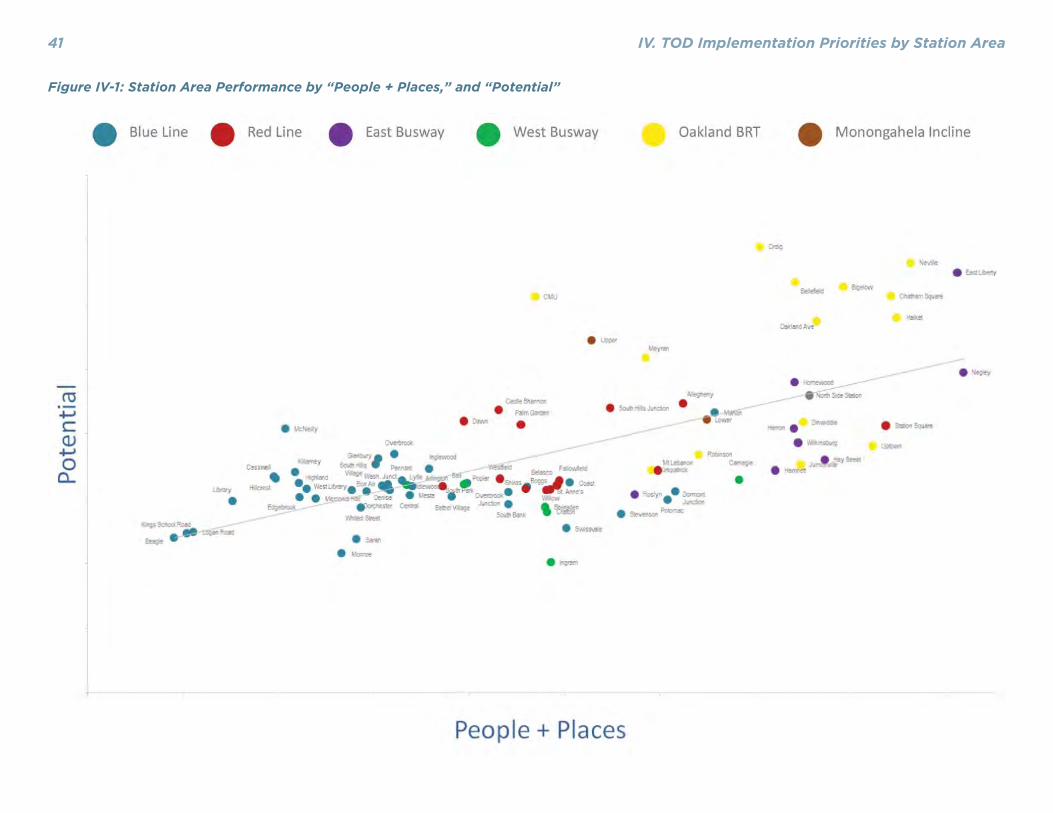
IV. TOD Implementation Priorities by Station Area41
Figure IV-1: Station Area Performance by “People + Places,” and “Potential”

IV. TOD Implementation Priorities by Station Area 42
Figure IV-2: Station Area Place Types as Determined by Performance
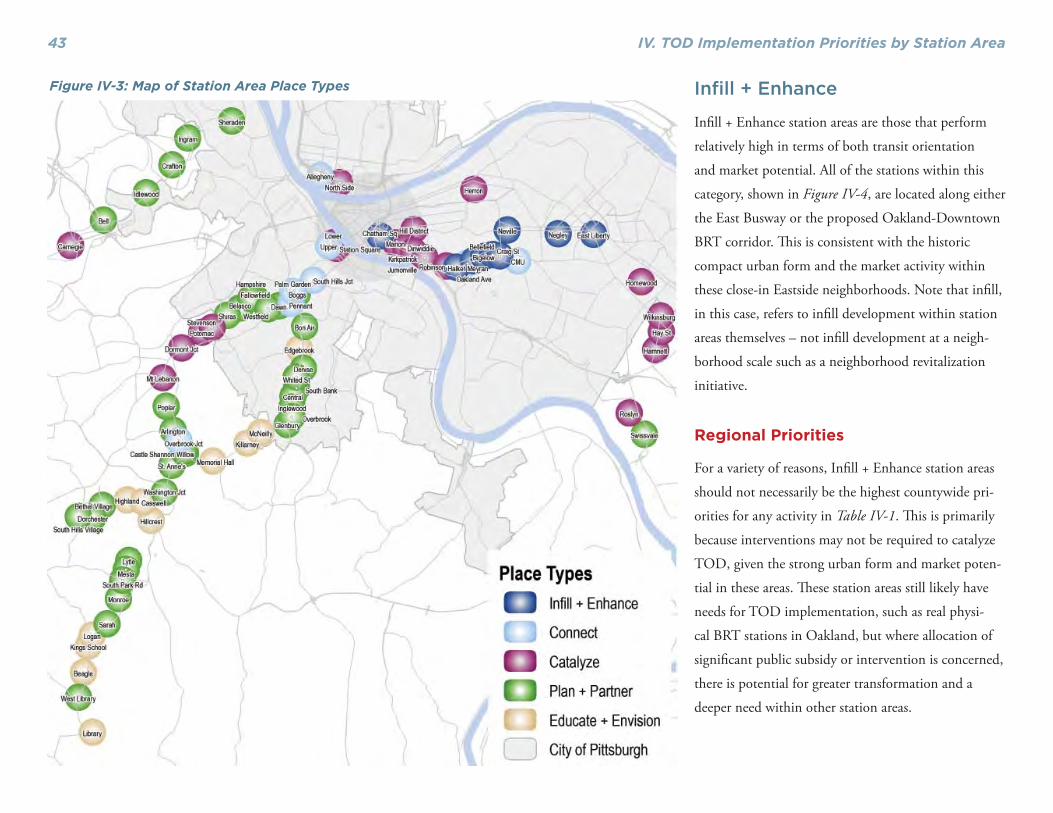
IV. TOD Implementation Priorities by Station Area43
Infi ll + Enhance
Infi ll + Enhance station areas are those that perform
relatively high in terms of both transit orientation
and market potential. All of the stations within this
category, shown in Figure IV-4, are located along either
the East Busway or the proposed Oakland-Downtown
BRT corridor. Th is is consistent with the historic
compact urban form and the market activity within
these close-in Eastside neighborhoods. Note that infi ll,
in this case, refers to infi ll development within station
areas themselves – not infi ll development at a neigh-
borhood scale such as a neighborhood revitalization
initiative.
Regional Priorities
For a variety of reasons, Infi ll + Enhance station areas
should not necessarily be the highest countywide pri-
orities for any activity in Table IV-1. Th is is primarily
because interventions may not be required to catalyze
TOD, given the strong urban form and market poten-
tial in these areas. Th ese station areas still likely have
needs for TOD implementation, such as real physi-
cal BRT stations in Oakland, but where allocation of
signifi cant public subsidy or intervention is concerned,
there is potential for greater transformation and a
deeper need within other station areas.
Figure IV-3: Map of Station Area Place Types

IV. TOD Implementation Priorities by Station Area 44
Investment Approach
Given their existing assets, Infi ll + Enhance station areas should be targeted for
modest, “surgical” type activities to help advance their momentum and expand
Figure IV-4: Infi ll + Enhance Station Areas
Figure IV-4a: Components of the Transit Orientation Score at Negley Station
Figure IV-4b: Components of the TOD Investment Potential Score at Negley Station

IV. TOD Implementation Priorities by Station Area45
their access to a broader population. Implementation priorities should include
more intensive infi ll development and enhancement of local services and ameni-
ties – again such as BRT stations, off -board fare collection, and system visibility
enhancements. Given their existing pedestrian-oriented environments, signifi cant
changes to the street network are not always needed in these areas, but enhance-
ment of local goods and services, and placemaking via neighborhood retail
development could help maximize local TOD potential and catalyze further
private market investment. In order to expand and maintain access to these areas
for lower-income households, workforce and mixed-income housing should be
targeted for those neighborhoods with rising rental rates.
Infi ll + Enhance Example: Negley
Th e Negley station on the East Busway enjoys a fairly walkable urban form and
a moderate to strong real estate market, relative to other areas of Pittsburgh. In-
terventions in this area in the form of signifi cant subsidies are unlikely to catalyze
signifi cant transformation, but could support nuanced projects that off er more
amenities to nearby residents.
Connect
Station areas within the Connect place types, shown in Figure IV-5, are those that
demonstrate higher market potential with more modest urban form and density.
Th is place type includes a mix of areas including districts with large institutional/
entertainment uses, close-in South Hills stations, and one with signifi cant redevel-
opment potential.
Regional Priorities
From an implementation perspective, these areas are ripe for strategic infra-
structure and access improvements to help unlock their development potential.
Connect station areas may have less walkable blocks in general or a handful of
signifi cant barriers to pedestrian access immediately surrounding the station areas.
If market potential is strong enough, these station areas may be good candidates
for leveraging new development in support of access improvements.
Investment Approach
In the case of the Red Line stations, the T line runs along a ridgeline making for
steep pedestrian climbs to the stations. Access improvements should be aimed
at enhancing these pedestrian routes (e.g. stairs, lighting) to help overcome the
physical and psychological barriers this topography creates.
Connect Example: Allegheny Station
Allegheny Station at the end of the recently completed North Shore Connector
is surrounded by surface parking lots and cut off from the North Side neighbor-
hoods by elevated Route 65. A planned PennDOT project to install a pedestrian
bridge and ramp connecting across Route 65 could address some of these issues
and is an example of the types of infrastructure projects that stations falling into

IV. TOD Implementation Priorities by Station Area 46
the “Connect” place type require. As redevelopment occurs, physical and visual
pedestrian connections to the area’s many entertainment destinations should be
enhanced.
Figure IV-5a: Components of the Transit Orientation Score at Allegheny Station
Figure IV-5b: Components of the TOD Investment Potential Score at Allegheny Station
Figure IV-5: Connect Station Areas
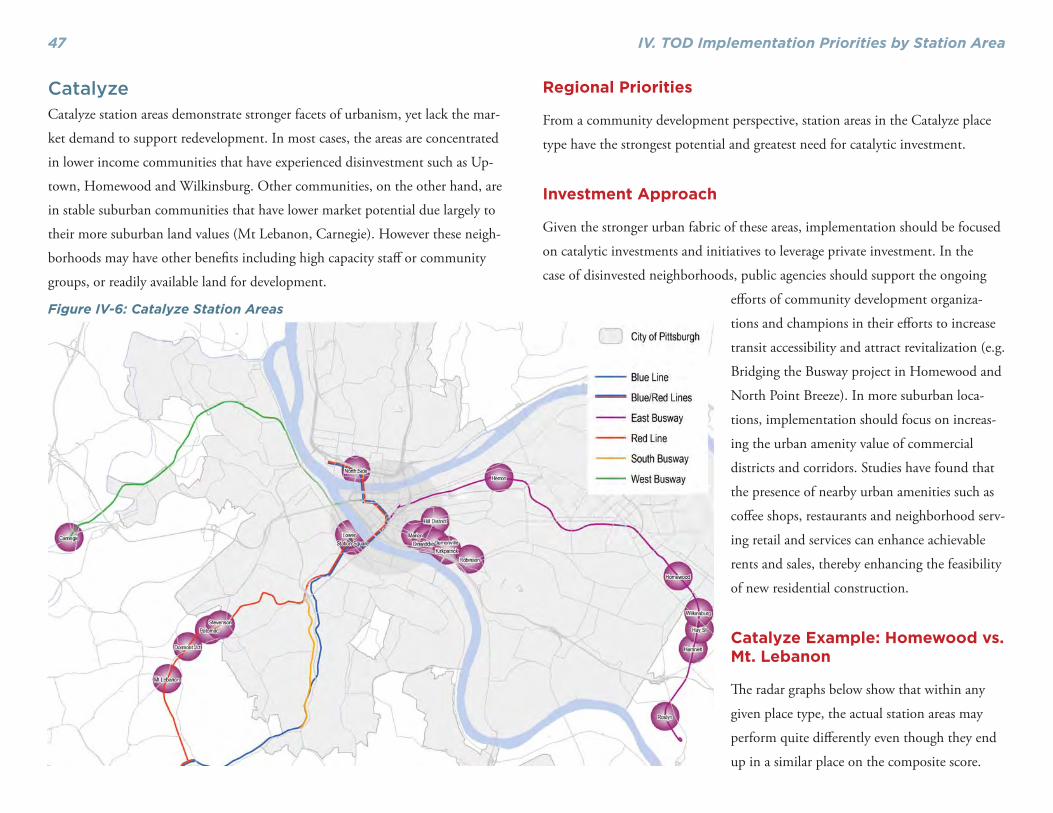
IV. TOD Implementation Priorities by Station Area47
CatalyzeCatalyze station areas demonstrate stronger facets of urbanism, yet lack the mar-
ket demand to support redevelopment. In most cases, the areas are concentrated
in lower income communities that have experienced disinvestment such as Up-
town, Homewood and Wilkinsburg. Other communities, on the other hand, are
in stable suburban communities that have lower market potential due largely to
their more suburban land values (Mt Lebanon, Carnegie). However these neigh-
borhoods may have other benefi ts including high capacity staff or community
groups, or readily available land for development.
Regional Priorities
From a community development perspective, station areas in the Catalyze place
type have the strongest potential and greatest need for catalytic investment.
Investment Approach
Given the stronger urban fabric of these areas, implementation should be focused
on catalytic investments and initiatives to leverage private investment. In the
case of disinvested neighborhoods, public agencies should support the ongoing
eff orts of community development organiza-
tions and champions in their eff orts to increase
transit accessibility and attract revitalization (e.g.
Bridging the Busway project in Homewood and
North Point Breeze). In more suburban loca-
tions, implementation should focus on increas-
ing the urban amenity value of commercial
districts and corridors. Studies have found that
the presence of nearby urban amenities such as
coff ee shops, restaurants and neighborhood serv-
ing retail and services can enhance achievable
rents and sales, thereby enhancing the feasibility
of new residential construction.
Catalyze Example: Homewood vs. Mt. Lebanon
Th e radar graphs below show that within any
given place type, the actual station areas may
perform quite diff erently even though they end
up in a similar place on the composite score.
Figure IV-6: Catalyze Station Areas
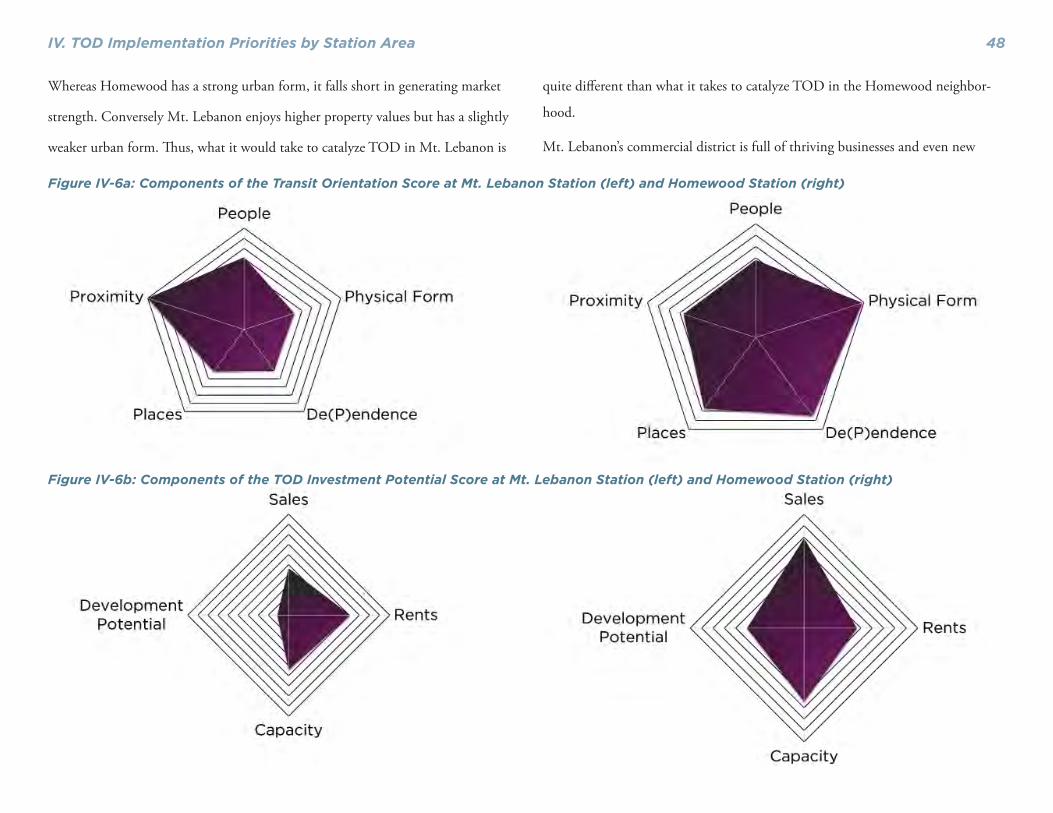
IV. TOD Implementation Priorities by Station Area 48
Whereas Homewood has a strong urban form, it falls short in generating market
strength. Conversely Mt. Lebanon enjoys higher property values but has a slightly
weaker urban form. Th us, what it would take to catalyze TOD in Mt. Lebanon is
quite diff erent than what it takes to catalyze TOD in the Homewood neighbor-
hood.
Mt. Lebanon’s commercial district is full of thriving businesses and even new
Figure IV-6a: Components of the Transit Orientation Score at Mt. Lebanon Station (left) and Homewood Station (right)
Figure IV-6b: Components of the TOD Investment Potential Score at Mt. Lebanon Station (left) and Homewood Station (right)
IV. TOD Implementation Priorities by Station Area49
commercial and hotel development, but surrounding neighborhoods include
moderate density single family residential homes which are not necessarily sup-
porting high transit ridership. What Mt. Lebanon enjoys in market strength it
lacks in available land, reinforcing the need for the planned, but potentially costly,
TRID study recommendation of using the air rights over the tracks.
Homewood’s Bridging the Busway study has off ered many recommendations for
ways to catalyze TOD in the neighborhood, by playing upon market strengths
found in the Point Breeze north neighborhood on the other side of the busway
itself. Its planned catalytic projects - including the aff ordable mixed-use complex
proposed less than half a block from the station – could generate new investment
and momentum in Homewood south.
Plan + Partner
Th e greatest number of station areas fall within the Plan + Partner place type.
Nearly all of the station areas on the West Busway, and a large number of sta-
tion areas on the Red and Blue line fall in this category, as shown in Figure IV-7.
While some station areas have characteristics of former streetcar suburbs, their
primary land use pattern is more suburban, and market potential is low to moder-
ate.
Regional Priorities
Implementation in Plan + Partner areas should be focused on station area plan-
ning and visioning. Given their modest market strength and/or limited urban
form, these areas present longer-term implementation opportunities. However,
these are areas where the region has made important transit investments and
long range planning is needed to ensure that the full value of these investments is
captured in the future.
Investment ApproachPlanning assistance and technical assistance should be focused on those station
areas within this long list that have demonstrated higher aspirations for TOD. To
help carry out these planning eff orts, PCRG and other actors should work with
these local partners to build community development capacity. In some cases,
such as the South Bank station, individual development projects may occur that
can both increase station connectivity and visibility, and create early “wins” that
build greater support for district wide planning in the long term.
Plan + Partner Example: Overbrook Junction
Located in the Borough of Castle Shannon at the end of the Red Line, Overbrook
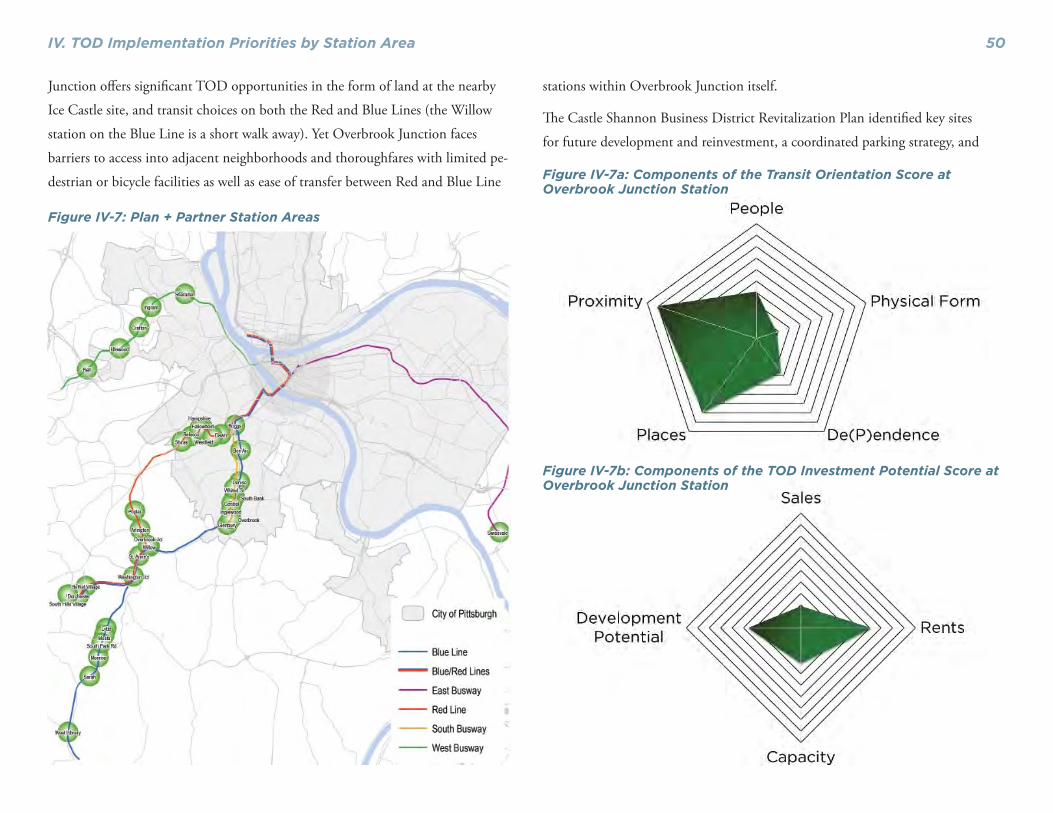
IV. TOD Implementation Priorities by Station Area 50
Junction off ers signifi cant TOD opportunities in the form of land at the nearby
Ice Castle site, and transit choices on both the Red and Blue Lines (the Willow
station on the Blue Line is a short walk away). Yet Overbrook Junction faces
barriers to access into adjacent neighborhoods and thoroughfares with limited pe-
destrian or bicycle facilities as well as ease of transfer between Red and Blue Line
stations within Overbrook Junction itself.
Th e Castle Shannon Business District Revitalization Plan identifi ed key sites
for future development and reinvestment, a coordinated parking strategy, and
Figure IV-7: Plan + Partner Station Areas
Figure IV-7a: Components of the Transit Orientation Score at Overbrook Junction Station
Figure IV-7b: Components of the TOD Investment Potential Score at Overbrook Junction Station
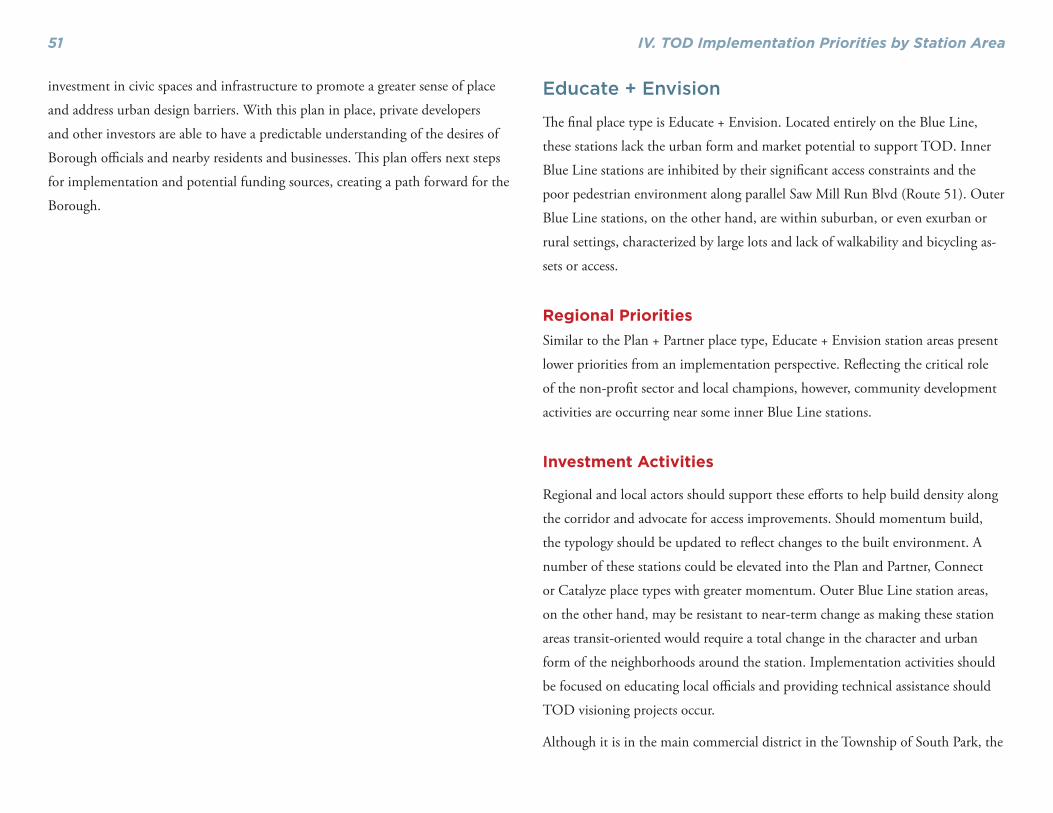
IV. TOD Implementation Priorities by Station Area51
investment in civic spaces and infrastructure to promote a greater sense of place
and address urban design barriers. With this plan in place, private developers
and other investors are able to have a predictable understanding of the desires of
Borough offi cials and nearby residents and businesses. Th is plan off ers next steps
for implementation and potential funding sources, creating a path forward for the
Borough.
Educate + Envision
Th e fi nal place type is Educate + Envision. Located entirely on the Blue Line,
these stations lack the urban form and market potential to support TOD. Inner
Blue Line stations are inhibited by their signifi cant access constraints and the
poor pedestrian environment along parallel Saw Mill Run Blvd (Route 51). Outer
Blue Line stations, on the other hand, are within suburban, or even exurban or
rural settings, characterized by large lots and lack of walkability and bicycling as-
sets or access.
Regional PrioritiesSimilar to the Plan + Partner place type, Educate + Envision station areas present
lower priorities from an implementation perspective. Refl ecting the critical role
of the non-profi t sector and local champions, however, community development
activities are occurring near some inner Blue Line stations.
Investment Activities
Regional and local actors should support these eff orts to help build density along
the corridor and advocate for access improvements. Should momentum build,
the typology should be updated to refl ect changes to the built environment. A
number of these stations could be elevated into the Plan and Partner, Connect
or Catalyze place types with greater momentum. Outer Blue Line station areas,
on the other hand, may be resistant to near-term change as making these station
areas transit-oriented would require a total change in the character and urban
form of the neighborhoods around the station. Implementation activities should
be focused on educating local offi cials and providing technical assistance should
TOD visioning projects occur.
Although it is in the main commercial district in the Township of South Park, the

IV. TOD Implementation Priorities by Station Area 52
Library station on the Blue Line has a more suburban to exurban land use pattern
and a large park-and-ride lot. Land uses are low density and there is limited sup-
port for signifi cantly increasing development in the area.
Should interest increase in TOD within the South Park Township, further eff orts
to communicate the benefi ts of TOD could be focused on the Library station.
However, given the lack of interest and the great potential of station areas falling
in other place types with more supportive urban form or capacity, encouraging
TOD in stations like Library is a low priority.
Figure IV-8: Educate + Envision Station Areas
Figure IV-8a: Components of the Transit Orientation Score at Library Station
Figure IV-8b: Components of the TOD Investment Potential Score at Library Station

IV. TOD Implementation Priorities by Station Area53
Overall Place Type Findings
Infi ll + Enhance
• Much of the planned Oakland corridor already outperforms the exist-
ing fi xed-guideway transit network in its transit orientation and mar-
ket potential. Th e majority (7 of 9) of the Infi ll + Enhance station areas
are along the proposed BRT corridor. Th is reinforces the importance of
higher-quality transit and placemaking access improvements (stations) along
this corridor to capture the pent-up demand for TOD from these areas and
Downtown within the “Catalyze” station areas located in the Hill District
and Uptown.
• Interventions to catalyze TOD should be modest to minimal in these
station areas. Following the matrix in Table IV-1, prioritization of fi nancial
public investment or organizational capacity in these areas is at a lower prior-
ity than for other place types. All Infi ll+Enhance place types already enjoy
strong market and physical form, and have a high degree of capacity on the
ground for TOD. Scarce resources should be focused in other areas.
Catalyze + Connect
• 28 station areas fall into either the Catalyze or Connect place types.
Th e concept behind both the “Catalyze” and “Connect” place types is that
transit-oriented development is achievable with minor investments. Small to
moderate investments in these station areas could signifi cantly boost regional
economic competitiveness by off ering ample opportunities for a high quality,
transit rich lifestyle.
• Many of these station areas face access need some kind of pedestrian en-
hancement in order to catalyze TOD. Clearly the station areas falling into
the “Connect” place type are in need of pedestrian and bicycle improvements.
Yet, even amongst the many “Catalyze” station areas on the East Busway,
increasing pedestrian access particularly over or under the East Busway align-
ment has already been identifi ed as a key revitalization strategy. Th is rein-
forces the need for new funding sources to help pay for improvements such as
pedestrian bridges and tunnels, sidewalk enhancements and bicycle lanes.
• Th ere is a need to increase the capacity and coordination of both public
agency staff and community groups in some of these station areas. One
recommendation is to develop a regional program to increase capacity by le-
veraging the experience of high capacity neighborhoods, and off ering techni-
cal assistance and best practices.
• Th ese station areas represent the best “bang for the buck” in terms of
both capital and capacity investments to catalyze TOD. Targeted invest-
ments in these station areas could yield the largest return for TOD due to
their place type. More information on suggested station area activities, for
both “Catalyze” and “Connect,” are provided within this report.
Plan + Partner
• Th e majority of station areas fall within the Plan + Partner place type.
Th erefore further evaluation and monitoring of these station areas is needed
to identify locations with an interest in TOD.
• Plan + Partner place types, in their current state, are not strong can-
didates for infrastructure investments. A lack of the necessary capacity,
market forces, and/or physical form mean that signifi cant infrastructure in-
vestments in these place types, at this time, would yield little return in regards
to TOD.
IV. TOD Implementation Priorities by Station Area 54
• Off ering regional incentives to plan for TOD, such as readily available
planning or infrastructure grants, could help cull out the interested sta-
tions in need of support. While not all of the Plan + Partner station areas
may be interested in TOD today, those that are should receive technical sup-
port if needed, in order to generate community support, create a vision, and
develop a plan for implementation.
• Continued monitoring of these station areas is important. Since condi-
tions and politics change over time, some Plan + Partner stations may shift
into a diff erent category and need further intervention.
Educate + Envision
• Most Educate + Envision station areas are not strong candidates for
TOD. Unless there is evidence that a community with an Educate + Envi-
sion station area is interested in TOD, these stations do not off er the urban
form or support required to readily achieve TOD benefi ts.

V. Funding and Financing55
V. Funding and FinancingTh is chapter provides an overview of the range of funding and fi nancing sources
that are currently available to local governments, community development
organizations, and other actors in Allegheny County to pay for the types of
TOD implementation activities identifi ed in previous chapters. Th e chapter also
provides examples of programs used in other states and regions to enable and
encourage TOD, and case studies of how two projects in Allegheny County – the
East Liberty Transit Center and Shannon Transit Village – are assembling funds
for implementation.
Overview of Funding and Financing Tools
Chapter III identifi es a number of implementation activities needed to achieve
transit-oriented development, including visioning and planning, local access
improvements, revitalization and building reuse, new development, and regional
access and transit system improvements. Traditionally, local governments have
dedicated a portion of their property tax, sales tax, and other General Fund reve-
nues to pay for these types of activities. However, the ability of local governments
in Pennsylvania to raise revenues by increasing or adjusting tax rates is restricted –
as it is in most states – by Pennsylvania’s constitution and statutes and establishing
new taxes requires state enabling legislation. Th ese constraints make it particularly
challenging for municipalities to pay for local infrastructure and community
development projects, especially in the wake of the national recession that began
in 2008. Given these challenges, local governments and community organizations
are looking for ways to leverage traditional sources of local government revenue
and generate new sources to pay for TOD implementation. (See the sidebar for a
discussion of funding and fi nancing for infrastructure and community facilities.)
Beyond general property and sales taxes, the tools available to fund and fi nance
TOD implementation fall into three broad categories: user fees; value capture;
and grants or loans from federal, state, regional, or other entities. Th ese categories
are discussed below. Existing tools available to municipalities and community
organizations are listed by category in Appendix A. Note that Appendix A is not
comprehensive, but rather includes the tools identifi ed as most relevant for TOD.
Paying for Infrastructure and Community Facilities: ‘Funding,’ ‘Financing,’ and ‘Pay-As-You-Go’
Th e fi rst step to paying for an infrastructure or community development
project is to identify the funding source(s). Some types of infrastructure
generate revenues directly by charging fees for use. For example, utilities,
toll roads, transit systems, and (in some instances) parking facilities charge
user fees, which can be used to pay for all or part of the costs associated
with capital improvements and/or operations and maintenance. Other types
of infrastructure and community facilities, such as local streets, sidewalks,
streetscape improvements, and parks and open space are intended for free
public use and rarely generate user fees. Th ese types of non-revenue-gener-
ating infrastructure require other sources of funding, such as tax revenues or
grants.
Once a revenue source is identifi ed, there are two basic ways to approach
paying for infrastructure: “pay-as-you-go” or “fi nancing.” In a pay-as-you-
go approach, an improvement is only made once a suffi cient amount of
revenue is collected to cover the cost of the improvement. In a fi nancing
approach, the improvement is paid for immediately, typically by borrowing
against future revenues – in other words, issuing debt (usually in the form
of bonds) that is paid back over time.
V. Funding and Financing 56
User Fees
User fees are charged for the use of public infrastructure or goods (e.g., toll road,
bridge, water and wastewater systems). Such fees are typically set to cover a sys-
tem’s operating and capital expenses, which can include debt service for improve-
ments to the system. In some cases, user fees can be used to help fi nance the costs
of new infrastructure, though doing so may require raising rates.
Value Capture Tools
Value capture refers to a number of tools that involve a public agency “capturing”
some portion of the increased property values resulting from the provision of new
infrastructure or a strong or strengthening real estate market. Th e value capture
tools available to local governments vary depending on the enabling legislation in
place in each state. In Pennsylvania, the following value capture tools are avail-
able:
• Tax Increment Financing (TIF): TIF works by freezing the tax revenues
that local taxing entities receive from a property or district at its base level in
the current year, and diverting additional tax revenue in future years (the “in-
crement”) into a separate pool of money.1 Th e incremental revenues can then
be used to fi nance infrastructure or other improvements required to make
new development possible. In Pennsylvania, TIF is typically used to capture
incremental revenues and make improvements associated with a particular
development project, rather than a district including multiple development
sites. In order to be eligible for TIF, a property must be designated as blight-
ed. All aff ected taxing entities, including municipalities, counties, and school
districts, must approve the diversion of their portion of the increment. State
1 TIF is typically limited to real estate property taxes, but under Pennsylvania law the tax increment can also include any tax increase resulting from the development including hotel, amusement, business, and parking taxes.
law limits TIF districts to account for no more than one-tenth of a munici-
pality’s total land value.
• Transit Revitalization Investment District (TRID): TRIDs were
created in 2004 by the Pennsylvania Legislature and have attracted consid-
erable attention as a national model for fi nancing TOD. Under the TRID
Act, municipalities or counties can work in cooperation with transit agencies
to implement a district-based tax increment fi nancing mechanism within
a half-mile of a transit station. In comparison with traditional TIF, TRIDs
are intended to be district-based (i.e. include multiple properties) and are
not limited to blighted areas. As with TIF, all aff ected taxing entities must
approve creation of the district. As of late 2012, no TRID districts have yet
been created; within Allegheny County, the proposed East Liberty TRID is
closest to being implemented.
• Neighborhood Improvement Districts (NIDs): Under Pennsylva-
nia’s Neighborhood Improvement District Act of 2000, municipalities may
designate a residential, industrial, commercial, institutional, or mixed-use
district within which all taxable properties are charged a special assessment.
NID revenues are administered by non-profi t organizations called Neighbor-
hood Improvement District Management Associations (NIDMAs), which
can use the revenues for improvements such as street lighting, cleaning, and
maintenance; sidewalk improvements and maintenance; street trees and other
amenities; and security services. Municipalities are not required to vote to
approve a NID, but individuals owning more than 40 percent of the property
within a proposed NID have the power to veto the proposal. NIDs that assess
residential properties are fairly rare; the most common form of is a Business
Improvement District, described below.
• Business Improvement Districts (BIDs): BIDs are a type of Neighbor-
hood Improvement District that assesses commercial property only.

V. Funding and Financing57
• Impact fees: Impact fees are charged to new development in order to
mitigate the impacts resulting from that activity. In Pennsylvania, legislation
to enable municipalities to charge these fees is limited to only a few types of
impacts, such as the transportation impact fee which can be used to mitigate
the impacts of new development on streets and roads.
Value capture tools are a critical part of many TOD projects in Pittsburgh and
around the country, and can serve a particularly important role in providing the
local match required by many state or federal grant programs. However, these
tools are subject to signifi cant limitations. First, they rely to varying extents on
new, private development in order to generate revenues. Even NIDs and BIDs,
while not explicitly tied to new development, have the potential to generate the
most revenue in relatively strong real estate markets where new development
drives signifi cant increases in the assessed value of properties within the district.
Because value capture revenues are typically generated by new development, these
tools can be challenging to use to pay for up-front investments that are required
in order to enable development, unless bond fi nancing is available.2 In addition,
value capture tools rarely generate suffi cient revenues to pay for all the needed
improvements on their own. Instead, they are typically used as part of a pack-
age of multiple funding sources. For example, the East Liberty Transit Center
and Shannon Transit Village, discussed below, are both combining value capture
mechanisms with multiple other sources to move forward with implementation.
Federal, State, and Regional Grants and Loans
Th is section describes the major federal, state, and regional sources of funding for
TOD-related projects. Appendix A provides more information on the individual
programs off ered by each agency that are most relevant for the types of imple-
2 Obtaining bond fi nancing is one of the barriers that cities are working to overcome in order to successfully implement TRID.
Eligibility Requirements for Federal Funds
Some federally funded community development programs, such as New
Markets Tax Credits and Community Development Block Grants, are
limited to projects located in qualifying Census Tracts that meet certain
requirements for median family income or percent of low-income house-
holds. Similarly, under the Low-Income Housing Tax Credits (LIHTC)
program, projects located in eligible low-income areas receive a basis boost
that qualifi es the projects to receive more credits. In some cases the defi ni-
tions exclude areas that fall just short of the threshold (e.g., tracts where
50% instead of 51% of residents are low-income) or that are transitioning
as a result of community development eff orts, cutting off access to funds
in areas where the community could signifi cantly benefi t from continued
investments.
In East Liberty, the pro-
posed transit center proj-
ect is located just to the
south of Qualifi ed Census
Tracts for the LIHTC
program – so the project
will not qualify for tax
credits, although it will
serve the adjacent low-in-
come neighborhoods and
would qualify if located
just a few hundred feet to
the north.
Figure V-1: East Liberty Transit Center Project (red marker) and Qualifying Census Tracts for the Low-Income Housing Tax Credit Program (purple)
Source: HUD USER, 2013.
V. Funding and Financing 58
mentation activities identifi ed in the typology.
Federal Sources
Appendix A lists a number of federal programs for which local governments,
transit authorities, and other organizations can apply directly to federal agencies.
Th ese include programs for brownfi eld remediation, transit extensions and capac-
ity improvements, economic development, and aff ordable housing development.
However, most federal funding for TOD-related projects is allocated through
state and regional agencies; these programs are discussed below and listed in
Appendix A under their respective administering agencies (e.g., federal CMAQ,
Transportation Alternatives, and Urbanized Area Formula dollars are administered
in the Pittsburgh region by the Southwestern Pennsylvania Commission; Com-
munity Development Block Grants are also administered at the state and local
level).
State Sources
Th e Commonwealth of Pennsylvania has a variety of agencies and programs
involved in funding and fi nancing local infrastructure and community and
economic development programs, including the Department of Community &
Economic Development (DCED), the Pennsylvania Department of Transporta-
tion (PennDOT), and the Pennsylvania Housing Financing Authority (PHFA).
Many of the state’s funding programs – particularly those off ered by DCED – are
tied to business attraction or particular development projects. For example, the
Redevelopment Assistance Capital Program (RACP), Pennsylvania Industrial
Development Authority (PIDA), and Infrastructure and Facilities Improvement
Program (IFIP) make money available to pay for infrastructure and related costs
for job attraction or other economic development projects (these programs are
described in Appendix A).
Th e state has a tradition of being directly involved in TOD implementation,
although – as in other states – Pennsylvania’s funding programs and priorities
change over time according to political priorities and the Commonwealth’s fi scal
situation. For example, the state legislation enabling TRIDs, passed in 2004, has
been cited as a national model for providing fi nancing for TOD. PennDOT’s
Pennsylvania Community Transportation Initiative (PCTI) provided competitive
funding in 2009 and 2011 for “Smart Transportation” projects that link transpor-
tation investments to land use planning, including bicycle, pedestrian, and traffi c
calming improvements. And the state’s Low Income Housing Tax Credit (LI-
HTC) competitive allocation process prioritizes aff ordable housing development
near transit by providing points for development projects that form “an important
part of a broader or comprehensive program of neighborhood improvement….
[which can include] contributing to a transit-oriented design initiative.” However,
these eff orts to prioritize TOD at the state level have been somewhat isolated.
Regional Southwestern Pennsylvania Commission
Th e Southwestern Pennsylvania Commission (SPC) is the 10-county region’s met-
ropolitan planning organization (MPO), the agency charged with directing the
use of state and federal transportation and economic development funds within
Southwestern Pennsylvania. As required by state and federal law, the agency as-
sembles a Long-Range Transportation Plan (LRTP) every three years that outlines
how SPC intends to distribute the funding it receives from the state and federal
governments over a 30-year period, including federal funding for bicycle, pedes-
trian, and other potentially TOD-related improvements (discussed in the side-
bar). Th e Long-Range Transportation Plan includes a shorter term Transportation
Improvement Program (TIP) that lists the region’s highest priority highway and
transit projects that are programmed for advancement over a four-year period.
Typically, major transportation projects must be included in the TIP to receive

V. Funding and Financing59
Th e Bay Area Transit-Oriented Aff ordable Housing Acquisition Fund, or
TOAH, is a $50 million structured fund that provides fi nancing for the
development of aff ordable housing and other community services (e.g., health
clinics, fresh food markets, and other neighborhood retail projects) near tran-
sit. A structured fund is a kind of loan fund that pools money from diff erent
investors for a specifi c, dedicated purpose. TOAH provides loans to non-profi t,
for-profi t, or public developers for predevelopment activities, property acquisi-
tion, and construction of aff ordable housing or community facilities, as well as
leveraged loans intended to be used with New Markets Tax Credits. In order
to be eligible, a project must be located within a Priority Development Area
(PDA), one of the locally identifi ed areas designated to accommodate much of
the region’s growth, and within a half-mile of high quality transit service.
TOAH was established after a multi-year case-making and planning process
led by the Great Communities Collaborative (GCC), a coalition of national
and regional advocacy, research, and funding organizations dedicated to
promoting aff ordable housing and TOD. Th e GCC recognized in 2008 that
the depressed housing market represented an opportunity to preserve land for
aff ordable housing near transit. Following the recommendations of a feasibility
study by the Center for Transit-Oriented Development, the GCC decided to
pursue the creation of a fund that would address specifi c barriers to equitable
TOD in the Bay Area, including a scarcity of development sites near transit,
high land costs, and the challenges of acquiring land in advance of securing
project fi nancing.
In 2010, the Metro politan Transportation Commission (MTC), the San Fran-
cisco region’s metropolitan planning organization, agreed to invest $10 million
in the fund. MTC raised the money by exchanging federal CMAQ and STP
transportation dollars with unrestricted, discretionary funding from one of the
region’s county congestion management agencies. Th e $10 million commit-
ment enabled the GCC to raise an additional $40 million in private capital for
the fund. Th e diagram below shows how the TOAH fund is structured. MTC’s
$10 million investment occupied the “top loss” risk position, meaning that if
any of the loans default, MTC takes the fi rst hit. Investments from founda-
tions and community development fi nancial institutions (CDFIs) occupy the
second tier. Finally, two banks occupy the senior risk position.
Sources: Bay Area TOAH, “Bay Area’s Transit-Oriented Aff ordable Housing Fund,” presented at Aff ordable. Housing Week, sponsored by the East Bay Housing Organizations, May 2011; Strategic Economics, “Incentivizing TOD: Case Studies of Regional Programs Throughout the United States.”
National Best Practices: San Francisco Bay Area Transit-Oriented Aff ordable Housing Acquisition Fund
Top Loss (Public Section): $10 million
from MTC
Second Loss (Foundations and CDFIs):
$15 million from six CDFIs and Ford, San
Francisco Foundation and Living Cities
Third Loss (Banks): $25 million from
Morgan Stanley and Citi Community
Capital
Figure V-2: TOAH Fund Structure
V. Funding and Financing 60
state and federal transportation dollars. Project sponsors (typically local govern-
ments) may apply to have their projects included in the TIP when the document
is updated every two years; SPC also conducts a public outreach process during
which groups interested in transportation projects can provide comment. Smaller
projects that are not included in the TIP can sometimes be funded with dollars
set aside for certain types of projects; for example, SPC has set aside funding for
bridge maintenance investments not identifi ed individually in the TIP.
Beginning with the 2035 LRTP, SPC has adopted a regional vision that “places
an emphasis on infi ll development with reinvestment in existing business districts
and brownfi eld rehabilitation throughout the region” and targets infrastructure
improvements to “centers and clusters of development and the corridors that con-
nect them.”3
3 Southwestern Pennsylvania Commission, “2040 Transportation and
In keeping with this vision, the agency has proposed creating a competitive Smart
Transportation Fund program that would direct federal urbanized area Surface
Transportation Program (STP Urban) funds for bicycle, pedestrian, and other
alternative transportation projects that meet regional goals.
SPC currently allocates Congestion Mitigation and Air Quality Improvement
(CMAQ) Program funding on a competitive basis, through a process that priori-
tizes diesel retrofi ts, traffi c fl ow improvements, transportation demand manage-
ment, and commuter bicycle/pedestrian improvements. Th e new federal transpor-
tation bill requires that Transportation Alternatives (TA) dollars also be allocated
to local governments through a competitive process, the details of which will be
up to individual MPOs.
Development Plan for Southwestern Pennyslvania,” Adopted June 27, 2011, http://www.spcregion.org/trans_lrp.shtml.
In early 2012, Congress adopted a new federal
transportation bill known as Moving Ahead for
Progress in the 21st Century (MAP-21), replacing
the previous transportation bill, SAFETEA-LU.
Depending on state and MPO policy, many diff er-
ent programs included in MAP-21 can be used to
fund projects that improve pedestrian and bicycle
conditions. However, there are a few key programs
that are particularly important for funding TOD-
related projects:
Transportation Alternatives (TA): Replaces the
Transportation Enhancements, Safe Routes to
School, and Recreational Trails programs – the main
sources for bicycle, pedestrian, traffi c calming, and
many other projects under SAFETEA-LU – and
cuts overall funding for these projects by a third.
DOTs and MPOs will be required to allocate TA
funding to local governments on a competitive basis.
Congestion Mitigation and Air Quality Improve-
ment (CMAQ): Funding for projects that improve
air quality in qualifying areas that do not meet
national air quality standards.
Surface Transportation Program (STP): Provides
fl exible funding that can be used for highways,
bridges, tunnels, bicycle and pedestrian infrastruc-
ture, and transit capital projects.
Local governments typically serve as the primary
project sponsors for transportation improvement
projects funded by these programs. However, com-
munity organizations have the opportunity to get
involved at the state and MPO level in deciding how
TA, CMAQ, and STP funding is allocated within
their regions.
Source: Transportation for America, “Making the Most of MAP-21,” December 2012, http://bit.ly/Vbwof5.
Federal Tra nsportation Funding for Pedestrian and Bicycle Improvements

V. Funding and Financing61
Ensuring that SPC’s processes for allocating TA, CMAQ, and other funds priori-
tizing TOD and other smart growth-related projects will be critical for supporting
TOD within Allegheny County. Th e previous page describes how the MPO in
the San Francisco Bay Area region used federal transportation dollars to support
these goals.
Project Case Studies
Th is section profi les East Liberty Transit Center and Shannon Transit Village,
two proposed projects that are well on their way to raising the funding necessary
to move forward with implementation. Th ese case studies provide insight on the
process needed to successfully fund and implement transit-oriented projects in
Allegheny County. Th e lessons learned are summarized below.
East Liberty Transit Center: Assembling Funding to Address
Local Access Needs
East Liberty was historically one of the most important commercial centers in
Pennsylvania, but experienced rapid decline in the second half of the 20th cen-
tury. In recent years, concerted eff orts by community groups and public entities
have succeeded in attracting signifi cant private reinvestment to the area. How-
ever, the neighborhood’s outdated infrastructure creates circulation and access
challenges for pedestrians, bicyclists, and drivers trying to reach the East Liberty
Busway Station and surrounding neighborhoods. Th e City of Pittsburgh and its
public and private partners have already begun to address these challenges, com-
pleting the fi rst phases of converting Penn Circle, the district’s one-way ring road,
to two-way traffi c in 2002 and 2011.4 In order to further improve connections to
East Liberty Station and open up new sites for redevelopment, the City and its
partners are in the process of assembling funds for an ambitious $34 million East
4 The proposed East Liberty TRID would, in combination with other funds, enable the City to complete the two-way conversion of Penn Circle.
Liberty Transit Center project that includes:
• Relocating and replacing the existing East Busway Station and local, on-street
bus stations and providing new station walkways to enable more effi cient pas-
senger transfers.
• Building new pedestrian and bicycle infrastructure, including pedestrian sig-
nals, bridges, streetscaping and amenities, and bicycle parking facilities.
• Redesigning local streets to improve the effi ciency of bus routing and trans-
fers.
• Upgrading existing transit- and district-serving parking and constructing new
parking facilities.
• Assembling and grading privately- and publicly-owned land to enable devel-
opment of Eastside III, a proposed commercial development project.
Figure V-3: Aerial view of the entry plaza and transfer concourse for the East Liberty transit center.
Source: Pittsburgh Urban Redevelopment Authority

V. Funding and Financing 62
Table V-1 shows the funding sources committed to the project as of late 2012.
Th e largest source of funds is a $15 million grant from the Transportation
Investment Generating Economic Recovery (TIGER) Discretionary Grant
Program, a temporary federal program that provided competitive grants for
projects of national or regional importance.5 However, the project team has
also secured grants from a wide range of other federal, state, and local sources,
as well as contributions from foundations, Carnegie Mellon University, and
East Liberty Development Corporation. In addition to grant funds, the project
will incorporate $1.4 million in tax increment generated from the develop-
ment of Bakery Square, an offi ce, retail, and hotel development completed in
2010. Debt and equity contributions from the developer of Eastside III will be
used for upfront design and engineering and to prepare the site for TOD.
Shannon Transit Village: Public and Private Investment to Enable TOD
Th e Shannon Transit Village is a $36 million mixed-use development project
proposed for the Castle Shannon Light Rail Station. Th e project is planned
to include 128 high-end apartments, 14,000 square feet of retail, and 283
parking spaces in addition to the 500 existing commuter park-and-ride spaces.
Because the transit village will be built on the air rights of the transit sta-
tion parking lot owned by the Port Authority, it requires constructing a deck
over the existing lot. In order to build the deck and associated infrastructure
projects, the developer has secured approximately $13 million in public funds,
including $4 million from a TIF district (Table V-2). Assembling these funds
and coordinating among the many agencies involved in the project has taken
more than a decade; the project is expected to break ground in 2013. Among
5 TIGER began as part of the American Recovery and Reinvestment Act of 2009 and has since been reauthorized to permit four rounds of funding. MAP-21 did not authorize any additional funding for TIGER, although Congress may decide to dedicate additional funding in the future on an annual basis.
Table V-1: Anticipated Funding Sources for East Liberty Transit Center
Source (Agency and Program) Amount
Federal
TIGER IV Grant $15,000,000
US EPA - Three Rivers Wet Weather Program * $100,000
Port Authority of Allegheny County (PAAC) $55,000
State and Local
PA Commonwealth Financing Authority – Business in our Sites $2,600,000
PA DCED – Infrastructure and Facilities Improvement Program** $2,080,000
PennDOT – Bridge Bill Funding*** $1,660,700
Urban Redevelopment Authority – Tax Increment Financing $1,400,000
PA DCED – Revitalization Assistance Capital Program $1,105,000
PA DCED – Neighborhood Assistance Program**** $125,065
Institutional
Foundations $380,000
Carnegie Mellon University $90,000
Sponsor Contributions
East Liberty Development, Inc. $180,000
City of Pittsburgh - City Bond Funding $457,100
Eastside Limited Partnership III – (Developer - Bank) $1,331,000
Eastside Limited Partnership III – (Developer - Capital) $5,456,191
Other Sources $2,000,000
Total project cost $34,020,055
*EPA funding provided through the Three Rivers Wet Weather Program, a non-profi t organization funded by federal, state, regional, and local agencies and local foundations that supports eff orts to address the region’s wet weather overfl ow problems.
**Provides multi-year grants to assist with payment of debt service for infrastruc-ture and other costs related to convention centers, hospitals, hotels, industrial/manufacturing facilities, retail facilities, or research and development facilities.
***Funding for state and local bridge projects.
****Application submitted.
Source: “East Liberty Transit Center/TOD TIGER IV Grant Application,” http://bit.ly/W9QI3E
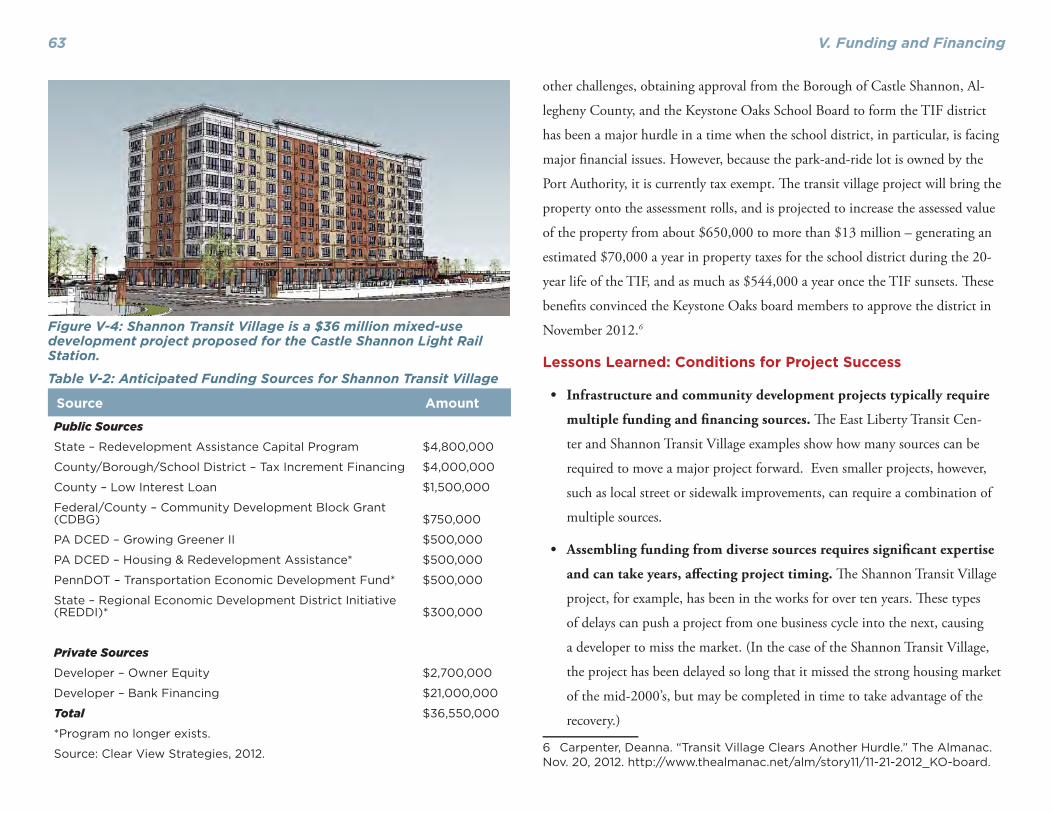
V. Funding and Financing63
other challenges, obtaining approval from the Borough of Castle Shannon, Al-
legheny County, and the Keystone Oaks School Board to form the TIF district
has been a major hurdle in a time when the school district, in particular, is facing
major fi nancial issues. However, because the park-and-ride lot is owned by the
Port Authority, it is currently tax exempt. Th e transit village project will bring the
property onto the assessment rolls, and is projected to increase the assessed value
of the property from about $650,000 to more than $13 million – generating an
estimated $70,000 a year in property taxes for the school district during the 20-
year life of the TIF, and as much as $544,000 a year once the TIF sunsets. Th ese
benefi ts convinced the Keystone Oaks board members to approve the district in
November 2012.6
Lessons Learned: Conditions for Project Success
• Infrastructure and community development projects typically require
multiple funding and fi nancing sources. Th e East Liberty Transit Cen-
ter and Shannon Transit Village examples show how many sources can be
required to move a major project forward. Even smaller projects, however,
such as local street or sidewalk improvements, can require a combination of
multiple sources.
• Assembling funding from diverse sources requires signifi cant expertise
and can take years, aff ecting project timing. Th e Shannon Transit Village
project, for example, has been in the works for over ten years. Th ese types
of delays can push a project from one business cycle into the next, causing
a developer to miss the market. (In the case of the Shannon Transit Village,
the project has been delayed so long that it missed the strong housing market
of the mid-2000’s, but may be completed in time to take advantage of the
recovery.)
6 Carpenter, Deanna. “Transit Village Clears Another Hurdle.” The Almanac. Nov. 20, 2012. http://www.thealmanac.net/alm/story11/11-21-2012_KO-board.
Table V-2: Anticipated Funding Sources for Shannon Transit Village
Source Amount
Public Sources
State – Redevelopment Assistance Capital Program $4,800,000
County/Borough/School District – Tax Increment Financing $4,000,000
County – Low Interest Loan $1,500,000
Federal/County – Community Development Block Grant (CDBG) $750,000
PA DCED – Growing Greener II $500,000
PA DCED – Housing & Redevelopment Assistance* $500,000
PennDOT – Transportation Economic Development Fund* $500,000
State – Regional Economic Development District Initiative (REDDI)* $300,000
Private Sources
Developer – Owner Equity $2,700,000
Developer – Bank Financing $21,000,000
Total $36,550,000
*Program no longer exists.
Source: Clear View Strategies, 2012.
Figure V-4: Shannon Transit Village is a $36 million mixed-use development project proposed for the Castle Shannon Light Rail Station.

V. Funding and Financing 64
• Money attracts money; the “fi rst dollar in” can be the most challenging
to fi nd. For example, many of the funding sources committed to the
East Liberty Transit Center were contingent upon receiving the TI-
GER grant. Because funders are often attracted to projects that have already
secured some funding, and thus are likely to be successful, new projects can
face a signifi cant hurdle in raising early investments. In the case of Shannon
Transit Village, for example, State Senator Wayne Fontana provided criti-
cal early funding for predevelopment planning, in the form of discretionary
REDDI dollars.
• Public and private partnerships are critical to project implementation.
In addition to directly providing funds to a project, partners can also help
raise awareness and create the momentum necessary to make a project work.
For example, the East Liberty project team submitted TIGER applications
in two previous funding rounds; the project’s success in the 2012 round
may in part have been due to endorsements from a range of local politicians,
community development and advocacy organizations, foundations, and the
members of the business community.
Funding and Financing Opportunities and Constraints
Based on the project case studies discussed above and the survey of funding and
fi nancing tools summarized in Appendix A, CTOD has identifi ed both opportu-
nities and constraints related to the funding and fi nancing of TOD implementa-
tion activities in Allegheny County:
• Th e state has a tradition of being directly involved in TOD implementa-
tion, but its involvement has been inconsistent. By creating programs like
TRID and the Pennsylvania Community Transportation Initiative (PCTI),
the state has shown leadership in providing funding and fi nancing for TOD
and smart growth. However, the availability of funding for PCTI and other
infrastructure and community development programs changes over time
depending on the political and economic climate. CTOD has found that
programs that are created by legislative action (such as TRID) tend to have
longer life spans than programs that are created by executive order or at the
discretion of a particular department.
• At the regional level, SPC has begun to emphasize smart growth prin-
ciples in its long-range planning. Community organizations and local
governments can help ensure that these principles are implemented by getting
involved in the discussion about how federal transportation funding is al-
located. In particular, MAP-21’s requirement that Transportation Alternatives
funding be distributed through a competitive process creates an opportunity
for community organizations, local offi cials, and citizens to advocate for
targeting these funds to transit-oriented areas.
• State statutory constraints and a challenging economic climate make it
diffi cult for local municipalities to pay for the ongoing maintenance of
existing infrastructure, let alone new capital improvement projects. In
addition to making it more diffi cult to pay directly for needed infrastructure
and facilities, local budgetary constraints can aff ect access to federal funding
programs, many of which require a local matching contribution. Funds raised
from TIF or another value capture tool and state or other public grants can
sometimes serve as the local match, but these sources are subject to con-
straints of their own (discussed below).
• Value capture strategies rely to varying extents on new development to
generate revenues. TIF and TRID in particular require signifi cant devel-
opment in order to generate tax increment; special assessment districts like
NIDs and BIDs also generate the most revenue in places where new devel-
opment or a strong real estate market drives property values. Th ese tools are
more challenging to use in places that require investments, but where market

V. Funding and Financing65
potential is more limited.
• Many public funding sources are tied to development projects, or to
business attraction. Local offi cials and community development profession-
als report that receiving state or regional funding for infrastructure projects
is easiest if the project is necessary to support planned new development. In
addition, many state programs that support infrastructure explicitly require
that the funding be used to support business retention or attraction. Th ese
requirements and limitations make it diffi cult to pay for improvements that
are primarily intended to connect the existing community to transit, enhance
quality of life, or set the stage for future new development in transit-oriented
locations.
• Th ere are limited dedicated funding sources for the small- to mid-scale
public infrastructure projects that are needed in many station areas.
When value capture mechanisms are not an option in communities that have
no large-scale development potential, the choices to fund local connectivity
and infrastructure improvements are very limited. Larger infrastructure proj-
ects may be eligible for signifi cant federal or state formula transportation dol-
lars or grants but smaller projects do not have the same visibility and regional
signifi cance. As discussed in previous chapters, creating a source to address
this need could have a signifi cant positive impact on the TOD potential of
many station areas across the system.
• Improving the organization and availability of information about state,
regional, and local funding programs could help facilitate TOD imple-
mentation. According to members of the private and non-profi t develop-
ment communities, the absence of a centralized source of information about
state, regional, and county funding sources makes the process of assembling
funding more challenging, and reliant on the expertise and relationships of
indivi duals and organizations.

VI. Countywide Recommendations 66
VI. Countywide RecommendationsAs described in Chapter III, each individual station area has its own set of imple-
mentation activities to support transit-oriented development. Th e typology in
Chapter IV off ers a framework for prioritizing these needs at the system wide and
countywide scales. Additionally, this chapter recommends seven strategies to sup-
port and catalyze momentum for transit-oriented development across the entire
transit system, regardless of place type. Th ese strategies have been informed by
both the quantitative typology assessment, and by interviews conducted over the
last year with agencies, community based organizations, and other stakeholders.
Th e seven strategies are:
1. Modify transit station design and system operations to support TOD
2. Address gap in funding availability for small to mid size infrastructure
improvements
3. Off er a consistent source of funds for station area visioning and planning
4. Build capacity of agencies and community groups in Catalyze and Plan +
Partner station areas
5. Integrate typology approach into regional and corridor sustainability ef-
forts
6. Pursue regulatory changes to support TOD and transit use near central
destinations
7. Create a short term work plan identifying key actions for PCRG’s Go-
Burgh Initiative.
Strategy 1: Modify Transit Station Design and System Operations to Support Transit-Oriented Development
Lead Responsibility: Port Authority; Potential Supporting Actors: Southwestern Penn-
sylvania Commission, PennDOT, City of Pittsburgh, Allegheny County
Th ere are a number of modifi cations that the Port Authority could make to the
system that could provide a signifi cant boost to the TOD potential of current
station areas without necessarily increasing operating costs on the system. Further,
additional planned fi xed-guideway lines could enhance ridership, open connec-
tions to key destinations like Oakland, and allow for development near down-
town Pittsburgh in the Strip District and Uptown neighborhoods.
1A. Modifi cations to System Operations
• Maintain current levels of service to fi xed-guideway stations and carefully
monitor ridership to identify and respond to increased demand.
• Brand buses on the busways to indicate their unique fi xed-guideway nature
with simpler names that align them more with the T than mixed-traffi c buses.
Branding of the 28X in this fashion should be considered as well, to make the
system accessible to visitors.
• Modify fare collection to speed up service by instituting off -board fare col-
lection, and making fare collection processes more predictable and quick for
both fi xed-guideway and fi xed-route customers.
• Off er easy timed transfers to other buses at station areas.
• Stop at all stations without requiring passengers to cue the driver. If this slows
down service, consider eliminating additional stations on the Red and Blue
VI. Countywide Recommendations67
Line that are in close proximity to one another, allowing for other stations to
be more formal.
1B. Small Capital Improvements to the Current System
• Off er clear wayfi nding maps and signs to connect stations to nearby destina-
tions and bus transfers.
• Enhance stations to support level boarding with elevated platforms or at-
grade buses.
• Enhance stations with shelters and more formal infrastructure, particularly on
the Blue and Red Lines. Identify key stations where these improvements will
be a priority.
• Enhance kiss and ride, park and ride, and pedestrian and bicycle access facili-
ties.
• Enhance bicycle storage, including adding weather resistant lockers to some
platforms.
• Create system maps that show the T and Busway lines, and 28X.
• Ensure that the proposed pedestrian ramp assets designed for Allegheny
Station are constructed, connecting Manchester and the North Side to the
North Shore Connector and further opening up development opportunity on
the North Shore.
1C. Additional Fixed-Guideway Alignments
Potential new capital investments in new and existing fi xed-guideway lines could
signifi cantly boost TOD potential:
• Prioritize new transit investments in the Strip district and Downtown-
Oakland corridor to leverage TOD. Ensure the planned transit technology is
appropriate for the type of service (i.e. the Strip district will function like a
streetcar, with many stops supporting a districtwide commercial and mixed-
use district. Mixed traffi c or dedicated lane streetcar service could be appro-
priate here).
• Ensure that the Downtown to Oakland connector include transit service and
infrastructure amenities that prompt developers to consider “TOD type”
projects such as level-boarding stations, off -board fare collection, dedicated
lanes, and other features that create a rail-like experience.
• Consider one East End alignment of the Oakland-Downtown BRT corridor
to utilize the East Busway rather than on-street alignments in the same cap-
ture area. Th is provides increased fi xed-guideway service on an underutilized
asset, reinforces station permanence and TOD potential, and possibly allevi-
ates ridership pressures - such as overcrowding - within the Centre Avenue
corridor.
• Consider an additional East Busway station in the Baum-Centre corridor to
support ongoing development, improve busway access and, hence ridership,
and also potentially alleviate ridership pressures discussed previously.
• Projects in the Saw Mill Run (SR 51) corridor that provide more transit
choices and catalyze development (such as the 51/88 project and Overbrook
Middle school) should be considered and evaluated for prioritization utilizing
the methodology of this TOD Strategy.
Status and Other Considerations
Modifi cations to the operating system - such as rebranding the busway lines to
distinguish them from the rest of the bus system, enhancing fare collection, and
removing stations on the Red Line – are activities that the Port Authority has
been studying for the last several years. Some of these have begun to be imple-
mented, such as removal of stations to speed service and launching the Connect-
VI. Countywide Recommendations 68
Card. However, other improvements such as full modifi cation of the fare collec-
tion system to be more consistent and speed service, are not in eff ect.
Th e Port Authority is not actively pursuing Capital Improvements to the
existing system –such as station enhancements, shelters, wayfi nding signage and
pedestrian access – at this time. Funding for these types of improvements will be
through sources such as federal grants. Other agencies or organizations may be
able to support the Port Authority in applying for these grants or may be able
to include these improvements in other TOD plans. For example, the SMART
TRID study in the city of Pittsburgh includes improvements to pedestrian safety,
walkability, bike lanes, green infrastructure, stations, and connectivity to Beech-
view’s business district.
Additional fi xed-guideway alignments are at varying degrees of planning.
While the Oakland-Downtown connector alternatives analysis is being com-
pleted, steps should be taken to assert the economic revitalization benefi ts of a
fi xed-guideway system vs. an enhanced mixed-traffi c bus. Th is is not a necessary
criterion for the Federal Transit Administration (FTA) New Starts Process, but is
key to the local success of the project. Modifying land use regulations along this
and other planned alignments, however, is a competitive factor in the FTA New
Starts process, so steps should be taken to ensure TOD supportive land use regu-
lations are in place. Th e Strip District plan is more conceptual though studies are
underway to consider multimodal transportation, and the Allegheny Riverfront
Green Boulevard project is also studying the feasibility of implementing a multi-
modal corridor.
Strategy 2: Address Gap in Funding Availability for Small to Mid-Side Infrastructure Improvements
Lead Responsibility: Commonwealth of PA, Southwestern Pennsylvania Commission,
Federal Government; Supporting Actors: PCRG’s GoBurgh Initiative and other state,
regional advocates
Th e majority of stations in the system could benefi t from small scale infrastruc-
ture improvements in the form of pedestrian paths, bridges, and tunnels, im-
proved sidewalks, bicycle lanes and other bicycle infrastructure, and station area
signage. Th e 28 stations falling in the Catalyze + Connect place types are high
priority locations, because these investments could have a transformative eff ect
on the surrounding neighborhoods by boosting the ability of transit to be an
economic and revitalizing asset for the communities. Many of the Plan + Partner,
and Infi ll + Enhance station areas, could also benefi t from these improvements.
Regional, State or local funds can be used to fi ll this funding gap as can value cap-
ture mechanisms like TIF or TRID. However value capture mechanisms require
new development, which should not always be a requirement for new infrastruc-
ture investments.
2A. Regional Modifi cations.
Many metropolitan planning organizations have devoted transportation dollars to
creating grant programs that address the need for small- to mid-size infrastructure
improvements. Chapter V off ers case studies of two of these programs. Recom-
mendations for SPC and other county or regional agencies include:
• Set aside a dedicated funding source for small- and mid-scale public infra-
structure projects that have the potential to improve connectivity to transit
and/or unlock future development potential.
• Target federal and state housing and transportation dollars to prioritize TOD-

VI. Countywide Recommendations69
related projects.
• Focus funding on high-priority station areas.
2B. State Modifi cations.
• Target state infrastructure and community and economic development fund-
ing programs to transit station areas.
• Detach funding for infrastructure from individual development projects,
allowing for district-based improvements in station areas without signifi cant
land available for new development.
2C. Modifi cations to Transit Revitalization Investment Districts
(TRID).
Th e following recommendations emerged from the 2011 TRID study that
CTOD completed with PCRG. As conditions may have changed, these recom-
mendations may need to be updated with new information.
• Implement a TRID pilot project in a place with signifi cant development
potential (e.g., the proposed East Liberty TRID). A demonstration project
would create a model for other eff orts to emulate, test the market for TRID-
backed bonds, and evaluate the need to make changes to the enabling legisla-
tion.
• Target existing regional and state resources to facilitate TRID implementa-
tion.
• Clarify the TRID legislation –clarify whether a TRID area can be amended
over time to include an extended value capture time period (beyond the
initial 20 years) if the TRID is amended to extend the district boundaries or
add new development activities; clarify the role of transit agencies in TRID
planning and implementation.
Strategy 3: Off er a Consistent Source of Funds for Station Area Planning and Visioning
Lead Responsibility: Commonwealth of PA, Southwestern Pennsylvania Commis-
sion, Allegheny County, City of Pittsburgh, Philanthropy; Supporting Actors: PCRG’s
GoBurgh Initiative and other state and regional nonprofi t advocates
Many agencies outside the city of Pittsburgh do not have the resources to fund
TOD plans themselves, but appropriate zoning and other land use regulations
are critical steps in supporting and catalyzing TOD. Further without the entice-
ment of funding, some municipalities may not see any need to garner support
for TOD principles in their station areas. State and regional agencies should off er
more consistent tools to fund district and area wide planning, particularly eff orts
that result in adoption of new TOD supportive zoning codes and other land use
regulations.
Strategy 4: Build Capacity of Agencies and Community Groups in Catalyze and Plan + Partner Station areas
Lead Responsibility: PCRG’s GoBurgh Initiative and other community-based organi-
zations, Philanthropy; Supporting Actors: Municipalities
Public agencies and community groups in some Catalyze, Connect, and Plan
+ Partner station areas may not have the capacity to advocate for TOD related
strategies. Th ey may lack experienced paid planning staff , may need additional
expertise in securing funding for activities and projects, or may need technical
support on specifi c planning eff orts. Th is is further discussed in Chapter III. A
number of new activities could help support these communities.
VI. Countywide Recommendations 70
4A. Develop a Regional Capacity Building System.
Establish a regional brain trust of experienced CDCs and agency staff to increase
leadership and planning capacity in targeted “Catalyze” station areas. Opportunis-
tically select 2-3 station areas a year to support with technical support, advice, and
on-the-ground capacity building eff orts.
4B. Off er public incentives to encourage communities to build
compactly, and support transit-oriented development.
Develop mechanisms where communities and station areas can express an inter-
est in receiving support on visioning, planning, implementation or other eff orts.
Since many station areas in the “Plan + Partner” place type may not have an inter-
est in TOD today, some program or mechanism should be in place to monitor
and identify those that do. A TOD planning program with funding at the state
or regional scale could off er an enticement for communities to step forward, and
these communities could be eligible for technical support from the “brain trust”
identifi ed above. A partnership of County or Regional Agencies with the nonprof-
it community could be highly eff ective in off ering coordinated technical support
to municipalities with an interest and need.
4C. Consider the feasibility of a corridor-level collaborative
to share information and technical expertise, and leverage
capacity for infrastructure investment.
A corridor level collaborative of local communities and CDCs, particularly along
the East Busway, would off er adjacent communities a more formalized network
for sharing best practices, technical expertise, and information on current related
activities. Additionally, such a corridor collaborative could advocate for corridor
wide improvements including addressing the need for more pedestrian tunnels
and bridges across the right-of-way. One possible activity of this collaborative
could be submitting a joint application for corridor wide infrastructure improve-
ments that might eligible for larger scale infrastructure grant programs at the state
or federal scale. Th is approach would overcome the gap in funding availability for
smaller scale projects, while creating a single multijurisdictional “ask” with greater
political support and visibility.
Strategy 5: Integrate the Typology’s Approach into Regional and Corridor Sustainability Eff orts
Lead Responsibility: Commonwealth of PA, Southwestern Pennsylvania Commission,
City of Pittsburgh, Transit Corridor Planning Authorities; Supporting Actors: PCRG’s
GoBurgh Initiative
Th e typology approach developed for this Strategy has been designed to be
quantitative and replicable over time. Further, the data behind the typology is
available at the countywide or even regional scale, meaning the typology could be
replicated for other corridors, neighborhoods, or communities. Th e largely quan-
titative nature of the typology also provides a relatively neutral tool for making
decisions about the allocation of funding for agencies such as Allegheny County
or the Southwestern Pennsylvania Commission, which are responsible to every
municipality regardless of transit proximity. As a result, this typology will make
an excellent tool to inform future investment decisions, or to simply evaluate the
needs of diff erent communities in order to support greater transportation choices
and alleviate congestion. Some possible applications of the typology include:
• An allocation criterion for infrastructure or planning grant programs. Th is
typology was based on a similar approach used by the Portland, OR MPO, in
order to identify areas of greatest impact for their TOD program investments.
• An evaluation tool for future potential transit corridors. Th e typology could
help identify potential station locations or corridor alignments based on the
transit orientation of diff erent neighborhoods.

VI. Countywide Recommendations71
• A tool to inform philanthropic investments or advocacy priorities. Th e typol-
ogy can inform locations where advocacy or funding activities of diff erent
types might be most eff ective.
Strategy 6: Pursue Regulatory Changes to Support TOD and Transit Use Near Central Destinations
Lead Responsibility: City of Pittsburgh Parking Authority; Municipalities, South-
western Pennsylvania Commission; Supporting Actors: Community advocates, City
advocates, Philanthropy
Regional destinations into which the transit system feeds are unique locations
where regulatory changes can change the behavior of transit riders, drivers, and
commuters from across the region. Th ese areas are therefore regional priorities for
dynamic, thoughtful parking pricing, zoning and other land use regulation, and
ongoing monitoring and response of regulations as conditions change.
6A. The Pittsburgh Parking Authority should implement
dynamic parking pricing and management – coordinated
with parking demand, congestion, and transit pricing - in key
destinations such as Downtown, Uptown, Oakland, and East
Liberty.
Understand parking demand and how this demand is fi lled. Some areas where
drivers “hide and ride” to downtown may require new parking regulations as well
limiting the period of time that cars may be parked. District/shared parking poli-
cies and projects should also be explored to maximize structured parking invest-
ments, encourage transit usage, free up land for development, and temper “hide
and ride” transit user parking behavior in residential neighborhoods.
6B. Ensure land use regulations near major regional job
centers and other destinations are zoned to support
appropriate TOD, with particular consideration to areas
adjacent to job centers that have signifi cant land opportunity.
Areas such as the North Shore, Strip District, and Uptown have signifi cant pent
up opportunity to accommodate signifi cant new development resulting from
demand to locate near downtown Pittsburgh. With appropriate incentives, transit
access, and zoning controls in place, these areas are key to introducing new de-
velopment types to the regional housing and commercial real estate markets, and
bolstering transit destinations with new vibrant urban centers.
Strategy 7: Create a Short-Term Work Plan Identifying Key Typology-Informed Actions for PCRG’s GoBurgh Initiative
Lead Responsibility: PCRG’s GoBurgh Initiative; Supporting Actors: PCRG, Philan-
thropy
PCRG’s GoBurgh Initiative already plays a key role in advocating for modifi ca-
tions to transit policy. GoBurgh is a key leader in advocating for many of the
strategies above, and developing future capacity building and TOD implementa-
tion systems.
7A. Develop a 2-year TOD plan establishing next steps based
on feasibility, interest, capacity and eff ectiveness.
Consider the feasibility of creating corridor working groups to advocate support
system changes, while also sharing information about best practices and activity.
Th is working group could also help consolidate information on the specifi c need
for small to mid-scale infrastructure improvements in order to help make the case
for a new funding source at the state or regional scales.

VI. Countywide Recommendations 72
7B. Support regional and county agencies to become leaders in TOD and compact development overall.
• Become involved in SPC’s decision making over how MAP-21 funds are al-
located within the region, particularly Transportation Alternatives funding.
• Create a centralized website or other resource for information about regional
(SPC) and Allegheny County funding programs.
• Build a broader base of support for SPC sustainability eff orts by forging part-
nerships with municipalities and groups in other counties (and targeting SPC
board members) to craft policies and funding programs that support sustain-
able infi ll development that includes TOD but also infrastructure in smaller
downtowns.
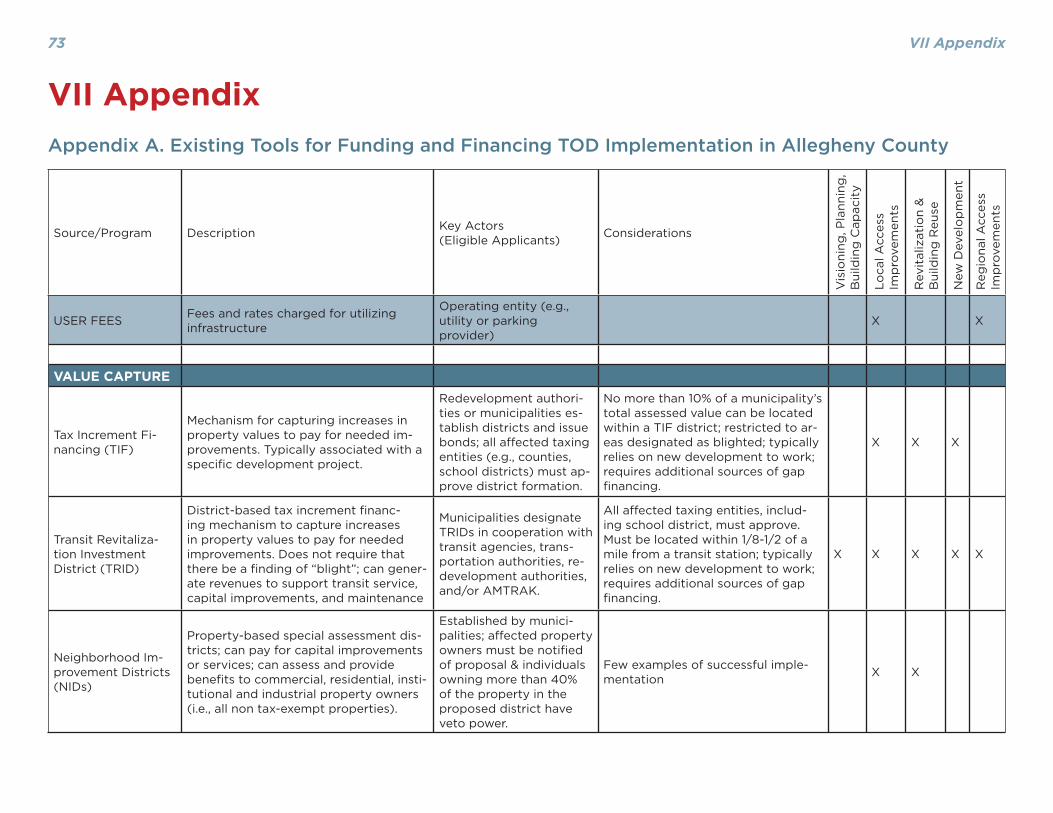
VII Appendix73
VII AppendixAppendix A. Existing Tools for Funding and Financing TOD Implementation in Allegheny County
Source/Program Description Key Actors (Eligible Applicants) Considerations
Vis
ioni
ng, P
lann
ing
, B
uild
ing
Cap
acit
y
Loca
l Acc
ess
Imp
rove
men
ts
Rev
ital
izat
ion
&
Bui
ldin
g R
euse
New
Dev
elo
pm
ent
Reg
iona
l Acc
ess
Imp
rove
men
ts
USER FEES Fees and rates charged for utilizing infrastructure
Operating entity (e.g., utility or parking provider)
X X
VALUE CAPTURE
Tax Increment Fi-nancing (TIF)
Mechanism for capturing increases in property values to pay for needed im-provements. Typically associated with a specifi c development project.
Redevelopment authori-ties or municipalities es-tablish districts and issue bonds; all aff ected taxing entities (e.g., counties, school districts) must ap-prove district formation.
No more than 10% of a municipality’s total assessed value can be located within a TIF district; restricted to ar-eas designated as blighted; typically relies on new development to work; requires additional sources of gap fi nancing.
X X X
Transit Revitaliza-tion Investment District (TRID)
District-based tax increment fi nanc-ing mechanism to capture increases in property values to pay for needed improvements. Does not require that there be a fi nding of “blight”; can gener-ate revenues to support transit service, capital improvements, and maintenance
Municipalities designate TRIDs in cooperation with transit agencies, trans-portation authorities, re-development authorities, and/or AMTRAK.
All aff ected taxing entities, includ-ing school district, must approve. Must be located within 1/8-1/2 of a mile from a transit station; typically relies on new development to work; requires additional sources of gap fi nancing.
X X X X X
Neighborhood Im-provement Districts (NIDs)
Property-based special assessment dis-tricts; can pay for capital improvements or services; can assess and provide benefi ts to commercial, residential, insti-tutional and industrial property owners (i.e., all non tax-exempt properties).
Established by munici-palities; aff ected property owners must be notifi ed of proposal & individuals owning more than 40% of the property in the proposed district have veto power.
Few examples of successful imple-mentation X X
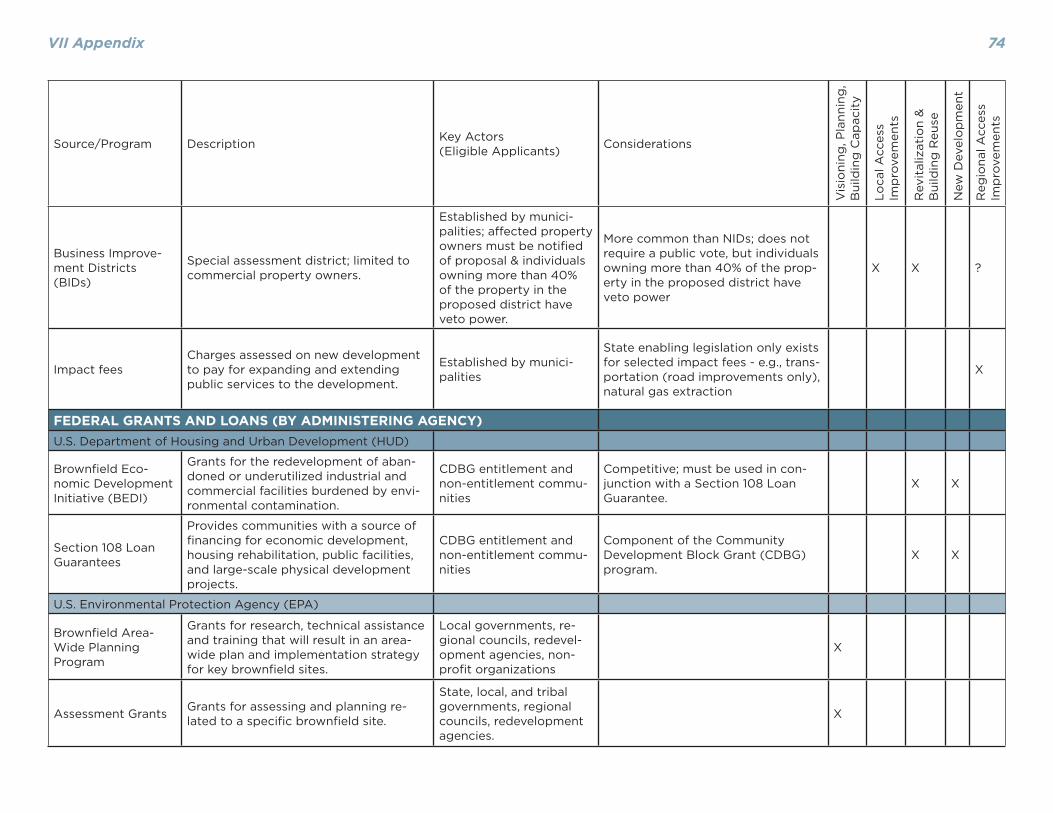
VII Appendix 74
Source/Program Description Key Actors (Eligible Applicants) Considerations
Vis
ioni
ng, P
lann
ing
, B
uild
ing
Cap
acit
y
Loca
l Acc
ess
Imp
rove
men
ts
Rev
ital
izat
ion
&
Bui
ldin
g R
euse
New
Dev
elo
pm
ent
Reg
iona
l Acc
ess
Imp
rove
men
ts
Business Improve-ment Districts (BIDs)
Special assessment district; limited to commercial property owners.
Established by munici-palities; aff ected property owners must be notifi ed of proposal & individuals owning more than 40% of the property in the proposed district have veto power.
More common than NIDs; does not require a public vote, but individuals owning more than 40% of the prop-erty in the proposed district have veto power
X X ?
Impact feesCharges assessed on new development to pay for expanding and extending public services to the development.
Established by munici-palities
State enabling legislation only exists for selected impact fees - e.g., trans-portation (road improvements only), natural gas extraction
X
FEDERAL GRANTS AND LOANS (BY ADMINISTERING AGENCY)
U.S. Department of Housing and Urban Development (HUD)
Brownfi eld Eco-nomic Development Initiative (BEDI)
Grants for the redevelopment of aban-doned or underutilized industrial and commercial facilities burdened by envi-ronmental contamination.
CDBG entitlement and non-entitlement commu-nities
Competitive; must be used in con-junction with a Section 108 Loan Guarantee.
X X
Section 108 Loan Guarantees
Provides communities with a source of fi nancing for economic development, housing rehabilitation, public facilities, and large-scale physical development projects.
CDBG entitlement and non-entitlement commu-nities
Component of the Community Development Block Grant (CDBG) program.
X X
U.S. Environmental Protection Agency (EPA)
Brownfi eld Area-Wide Planning Program
Grants for research, technical assistance and training that will result in an area-wide plan and implementation strategy for key brownfi eld sites.
Local governments, re-gional councils, redevel-opment agencies, non-profi t organizations
X
Assessment Grants Grants for assessing and planning re-lated to a specifi c brownfi eld site.
State, local, and tribal governments, regional councils, redevelopment agencies.
X

VII Appendix75
Source/Program Description Key Actors (Eligible Applicants) Considerations
Vis
ioni
ng, P
lann
ing
, B
uild
ing
Cap
acit
y
Loca
l Acc
ess
Imp
rove
men
ts
Rev
ital
izat
ion
&
Bui
ldin
g R
euse
New
Dev
elo
pm
ent
Reg
iona
l Acc
ess
Imp
rove
men
ts
Brownfi eld Cleanup Grants
Grants for cleanup activities at brown-fi eld sites.
State, local, and tribal governments, regional councils, redevelopment agencies, non-profi t or-ganizations.
X
Revolving Loan Fund Grants
Funding for a grant recipient to capital-ize a revolving loan fund for cleanup activities at brownfi eld sites.
State, local, and tribal governments, regional councils, redevelopment agencies.
X
Smart Growth Implementation Assistance Program and Building Blocks for Sustainable Communities
Technical assistance for governments that want to incorporate smart growth techniques into their future develop-ment.
State, local, regional, and tribal governments; non-profi ts in partnership with a governmental entity
X
U.S. Department of Transportation (DOT)
New Starts Program
Competitive funding for major new light rail, bus-rapid transit, and heavy rail projects, including extensions and capacity improvements to existing cor-ridors.
Transit agencies, other public entities X
Transportation In-frastructure Finance and Innovation Act (TIFIA)
Loans, loan guarantees, or lines of credit for major projects (highways, bridges, railroads, etc.)
State and local govern-ments, transit agencies, special authorities
TIFIA projects must have a dedi-cated revenue source (e.g., user fees, local tax revenues, special assess-ment revenues)
X
U.S. Economic Development Administration (EDA)
Public Works and Economic Adjust-ment Assistance programs
Grants for investments that support the implementation of regional economic development strategies designed to create jobs, leverage private capital, encourage economic development, and strengthen America’s ability to compete in the global marketplace.
Local governments and other public entities; non-profi t organizations.
X X
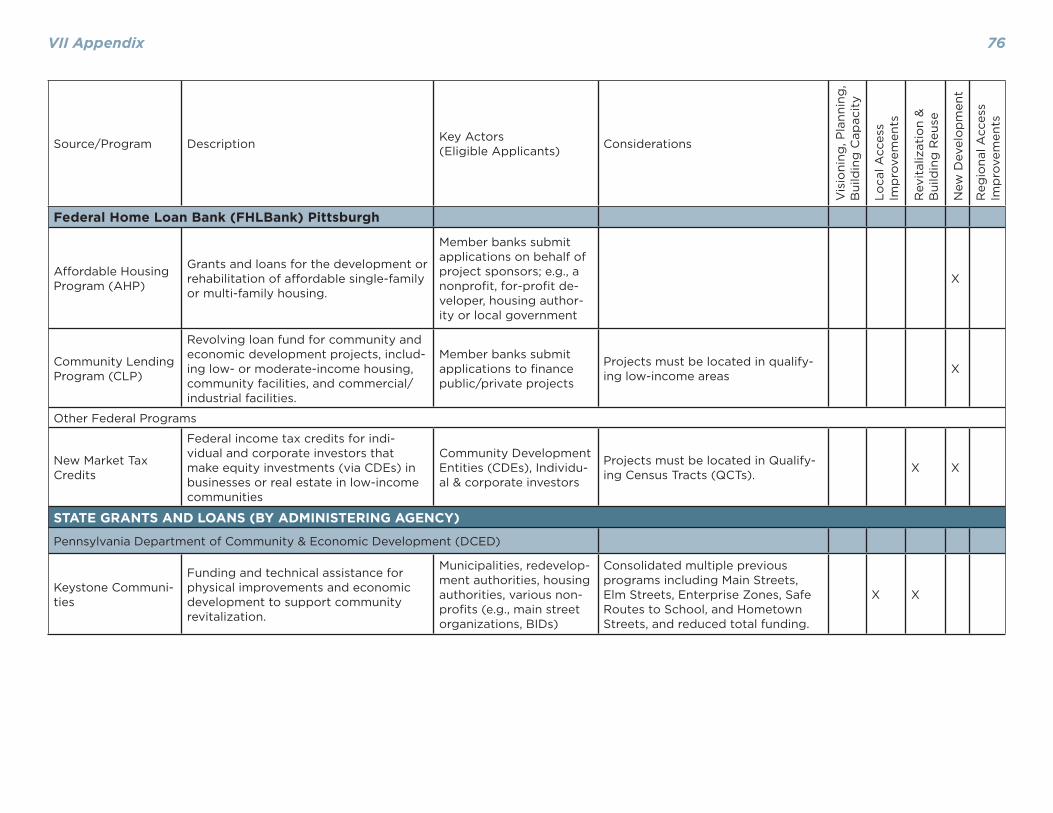
VII Appendix 76
Source/Program Description Key Actors (Eligible Applicants) Considerations
Vis
ioni
ng, P
lann
ing
, B
uild
ing
Cap
acit
y
Loca
l Acc
ess
Imp
rove
men
ts
Rev
ital
izat
ion
&
Bui
ldin
g R
euse
New
Dev
elo
pm
ent
Reg
iona
l Acc
ess
Imp
rove
men
ts
Federal Home Loan Bank (FHLBank) Pittsburgh
Aff ordable Housing Program (AHP)
Grants and loans for the development or rehabilitation of aff ordable single-family or multi-family housing.
Member banks submit applications on behalf of project sponsors; e.g., a nonprofi t, for-profi t de-veloper, housing author-ity or local government
X
Community Lending Program (CLP)
Revolving loan fund for community and economic development projects, includ-ing low- or moderate-income housing, community facilities, and commercial/industrial facilities.
Member banks submit applications to fi nance public/private projects
Projects must be located in qualify-ing low-income areas X
Other Federal Programs
New Market Tax Credits
Federal income tax credits for indi-vidual and corporate investors that make equity investments (via CDEs) in businesses or real estate in low-income communities
Community Development Entities (CDEs), Individu-al & corporate investors
Projects must be located in Qualify-ing Census Tracts (QCTs). X X
STATE GRANTS AND LOANS (BY ADMINISTERING AGENCY)
Pennsylvania Department of Community & Economic Development (DCED)
Keystone Communi-ties
Funding and technical assistance for physical improvements and economic development to support community revitalization.
Municipalities, redevelop-ment authorities, housing authorities, various non-profi ts (e.g., main street organizations, BIDs)
Consolidated multiple previous programs including Main Streets, Elm Streets, Enterprise Zones, Safe Routes to School, and Hometown Streets, and reduced total funding.
X X
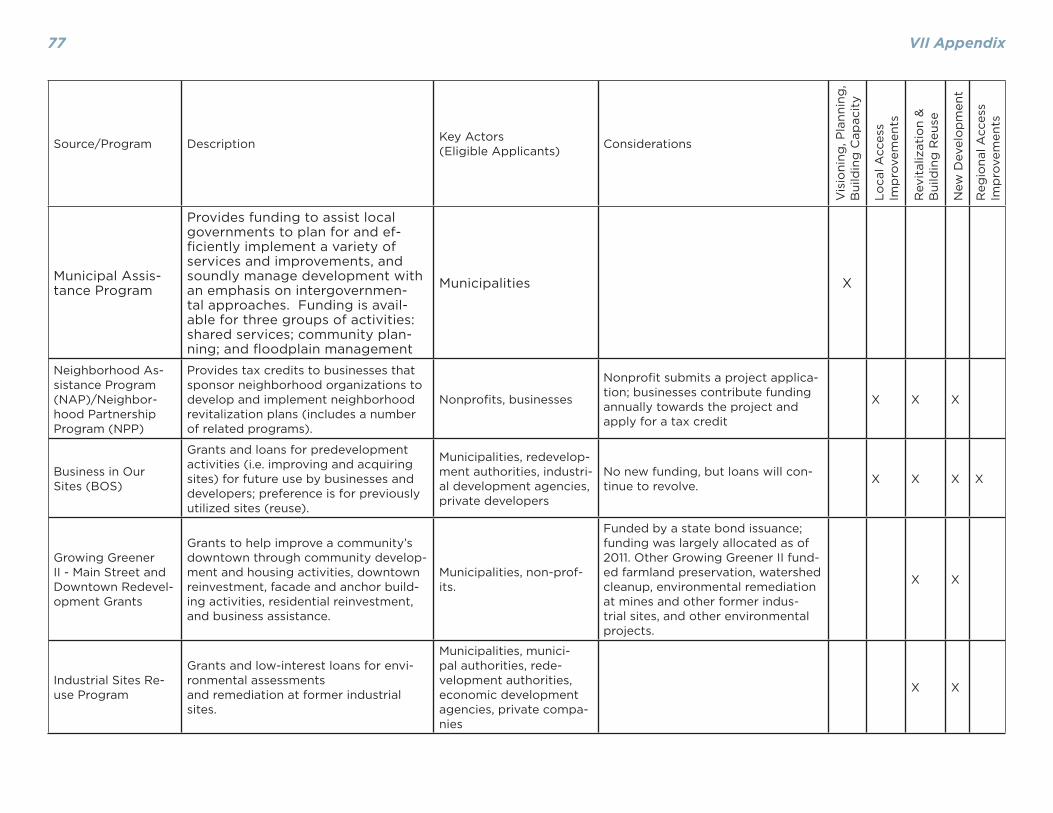
VII Appendix77
Source/Program Description Key Actors (Eligible Applicants) Considerations
Vis
ioni
ng, P
lann
ing
, B
uild
ing
Cap
acit
y
Loca
l Acc
ess
Imp
rove
men
ts
Rev
ital
izat
ion
&
Bui
ldin
g R
euse
New
Dev
elo
pm
ent
Reg
iona
l Acc
ess
Imp
rove
men
ts
Municipal Assis-tance Program
Provides funding to assist local governments to plan for and ef-fi ciently implement a variety of services and improvements, and soundly manage development with an emphasis on intergovernmen-tal approaches. Funding is avail-able for three groups of activities: shared services; community plan-ning; and fl oodplain management
Municipalities X
Neighborhood As-sistance Program (NAP)/Neighbor-hood Partnership Program (NPP)
Provides tax credits to businesses that sponsor neighborhood organizations to develop and implement neighborhood revitalization plans (includes a number of related programs).
Nonprofi ts, businesses
Nonprofi t submits a project applica-tion; businesses contribute funding annually towards the project and apply for a tax credit
X X X
Business in Our Sites (BOS)
Grants and loans for predevelopment activities (i.e. improving and acquiring sites) for future use by businesses and developers; preference is for previously utilized sites (reuse).
Municipalities, redevelop-ment authorities, industri-al development agencies, private developers
No new funding, but loans will con-tinue to revolve. X X X X
Growing Greener II - Main Street and Downtown Redevel-opment Grants
Grants to help improve a community’s downtown through community develop-ment and housing activities, downtown reinvestment, facade and anchor build-ing activities, residential reinvestment, and business assistance.
Municipalities, non-prof-its.
Funded by a state bond issuance; funding was largely allocated as of 2011. Other Growing Greener II fund-ed farmland preservation, watershed cleanup, environmental remediation at mines and other former indus-trial sites, and other environmental projects.
X X
Industrial Sites Re-use Program
Grants and low-interest loans for envi-ronmental assessmentsand remediation at former industrial sites.
Municipalities, munici-pal authorities, rede-velopment authorities, economic development agencies, private compa-nies
X X

VII Appendix 78
Source/Program Description Key Actors (Eligible Applicants) Considerations
Vis
ioni
ng, P
lann
ing
, B
uild
ing
Cap
acit
y
Loca
l Acc
ess
Imp
rove
men
ts
Rev
ital
izat
ion
&
Bui
ldin
g R
euse
New
Dev
elo
pm
ent
Reg
iona
l Acc
ess
Imp
rove
men
ts
Tax Increment Financing (TIF) Guarantee
Provides credit enhancements (guarantees up to $5 million) for TIF projects.
Issuers of TIF debt obligations located within a municipality other than a city of the fi rst- or second-class
X X X
Pennsylvania Indus-trial Development Authority (PIDA)
Low-interest loans through Industrial Development Corporations for land and building acquisition, construction and renovation, resulting in the creation or retention of jobs.
Certifi ed economic devel-opment organizations, on behalf of businesses
X
Infrastructure and Facilities Improve-ment Program (IFIP)
Multi-year grants to assist with debt ser-vice payment. Eligible projects include infrastructure, environmental reme-diation, other soft costs, and (in some cases) acquisition/development related to convention centers, hospitals, hotels, industrial facilities, retail facilities or re-search and development facilities
Authorities that issue debt for TIF; Redevelop-ment Authorities; Con-vention center authori-ties; The Pennsylvania Economic Development Financing Authority
X
Pennsylvania Department of Transportation (PennDOT)
Pennsylvania Com-munity Transporta-tion Initiative (PCTI)
Provided funding from the state TIP for smart transportation projects (includ-ing planning and capital improvements), with an emphasis on high yield and high value projects; investing in existing communities and infrastructure, mixed use and more compact development; and linking development to a variety of transportation options
Municipalities, MPOs, transit agencies, educa-tional institutions, trans-portation management associations
Unfunded as of the publishing of this report X X

VII Appendix79
Source/Program Description Key Actors (Eligible Applicants) Considerations
Vis
ioni
ng, P
lann
ing
, B
uild
ing
Cap
acit
y
Loca
l Acc
ess
Imp
rove
men
ts
Rev
ital
izat
ion
&
Bui
ldin
g R
euse
New
Dev
elo
pm
ent
Reg
iona
l Acc
ess
Imp
rove
men
ts
Pennsylvania Infra-structure Bank
Provides low-interest loans to help fund transportation projects within the Commonwealth. Generally funds avia-tion, highway/bridge, rail freight, and transit capital projects; may also include traffi c calming, pedestrian crossing, and Hometown Streets/Safe Routes to School improvements.
Municipalities, transporta-tion authorities, econom-ic development agencies, non-profi ts, and private corporations.
X X
Pennsylvania Housing Finance Agency (PHFA)
Low-Income Hous-ing Tax Credits (LIHTC)
Federal tax credits for aff ordable and mixed-income housing. Developers
Selection criteria include points for the development “forming an impor-tant part of a broader or compre-hensive program of neighborhood improvement….[which can include] contributing to a transit oriented design initiative”; projects located in a Qualifying Census Tract (QCT) or Diffi cult Development Area (DDA) may qualify for a higher construction basis.
X
PHFA Loan Pro-grams
Uses the proceeds from taxable and tax-exempt bond sales to make loans to developers.
Developers X
Other State Programs
Rehabilitation In-vestment Tax Credit (RITC)
Tax credits for rehabilitation of income-producing historic structures. Adminis-tered by the Pennsylvania Historical & Museum Commission
Property owners
In order to be eligible, structures must have been built before 1936 or be listed on the National Register of Historic Places.
X
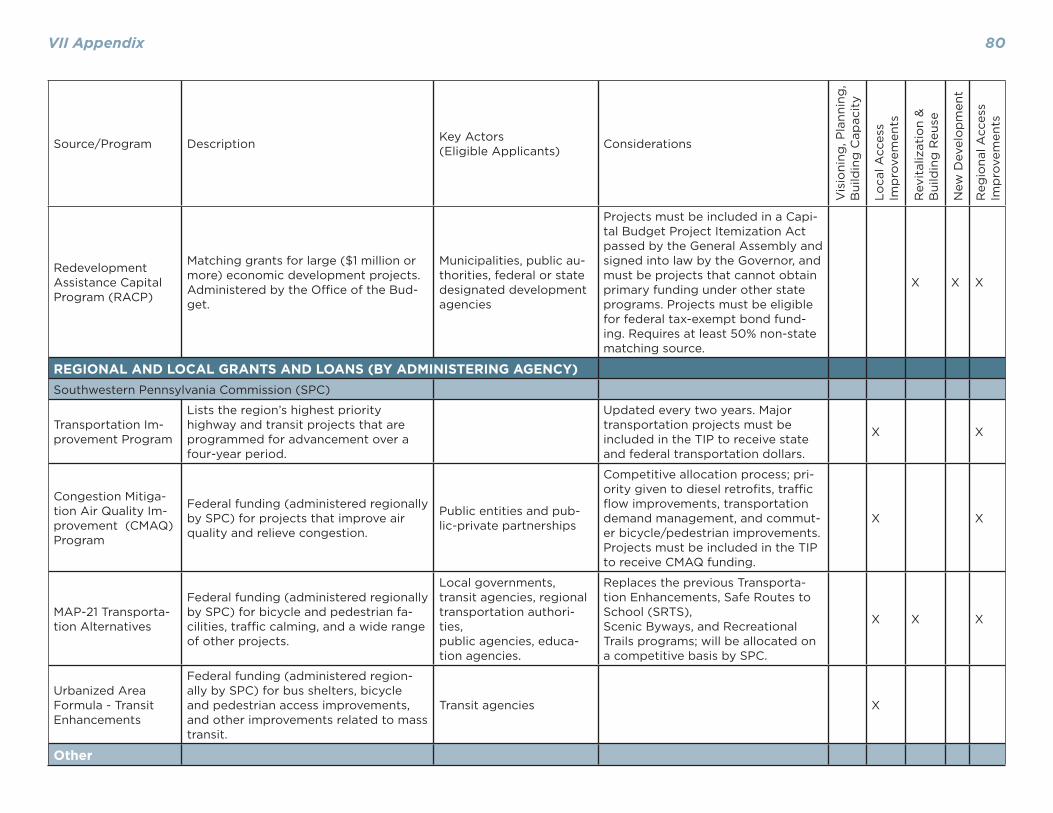
VII Appendix 80
Source/Program Description Key Actors (Eligible Applicants) Considerations
Vis
ioni
ng, P
lann
ing
, B
uild
ing
Cap
acit
y
Loca
l Acc
ess
Imp
rove
men
ts
Rev
ital
izat
ion
&
Bui
ldin
g R
euse
New
Dev
elo
pm
ent
Reg
iona
l Acc
ess
Imp
rove
men
ts
Redevelopment Assistance Capital Program (RACP)
Matching grants for large ($1 million or more) economic development projects. Administered by the Offi ce of the Bud-get.
Municipalities, public au-thorities, federal or state designated development agencies
Projects must be included in a Capi-tal Budget Project Itemization Act passed by the General Assembly and signed into law by the Governor, and must be projects that cannot obtain primary funding under other state programs. Projects must be eligible for federal tax-exempt bond fund-ing. Requires at least 50% non-state matching source.
X X X
REGIONAL AND LOCAL GRANTS AND LOANS (BY ADMINISTERING AGENCY)Southwestern Pennsylvania Commission (SPC)
Transportation Im-provement Program
Lists the region’s highest priority highway and transit projects that are programmed for advancement over a four-year period.
Updated every two years. Major transportation projects must be included in the TIP to receive state and federal transportation dollars.
X X
Congestion Mitiga-tion Air Quality Im-provement (CMAQ) Program
Federal funding (administered regionally by SPC) for projects that improve air quality and relieve congestion.
Public entities and pub-lic-private partnerships
Competitive allocation process; pri-ority given to diesel retrofi ts, traffi c fl ow improvements, transportation demand management, and commut-er bicycle/pedestrian improvements. Projects must be included in the TIP to receive CMAQ funding.
X X
MAP-21 Transporta-tion Alternatives
Federal funding (administered regionally by SPC) for bicycle and pedestrian fa-cilities, traffi c calming, and a wide range of other projects.
Local governments, transit agencies, regional transportation authori-ties,public agencies, educa-tion agencies.
Replaces the previous Transporta-tion Enhancements, Safe Routes to School (SRTS),Scenic Byways, and Recreational Trails programs; will be allocated on a competitive basis by SPC.
X X X
Urbanized Area Formula - Transit Enhancements
Federal funding (administered region-ally by SPC) for bus shelters, bicycle and pedestrian access improvements, and other improvements related to mass transit.
Transit agencies X
Other
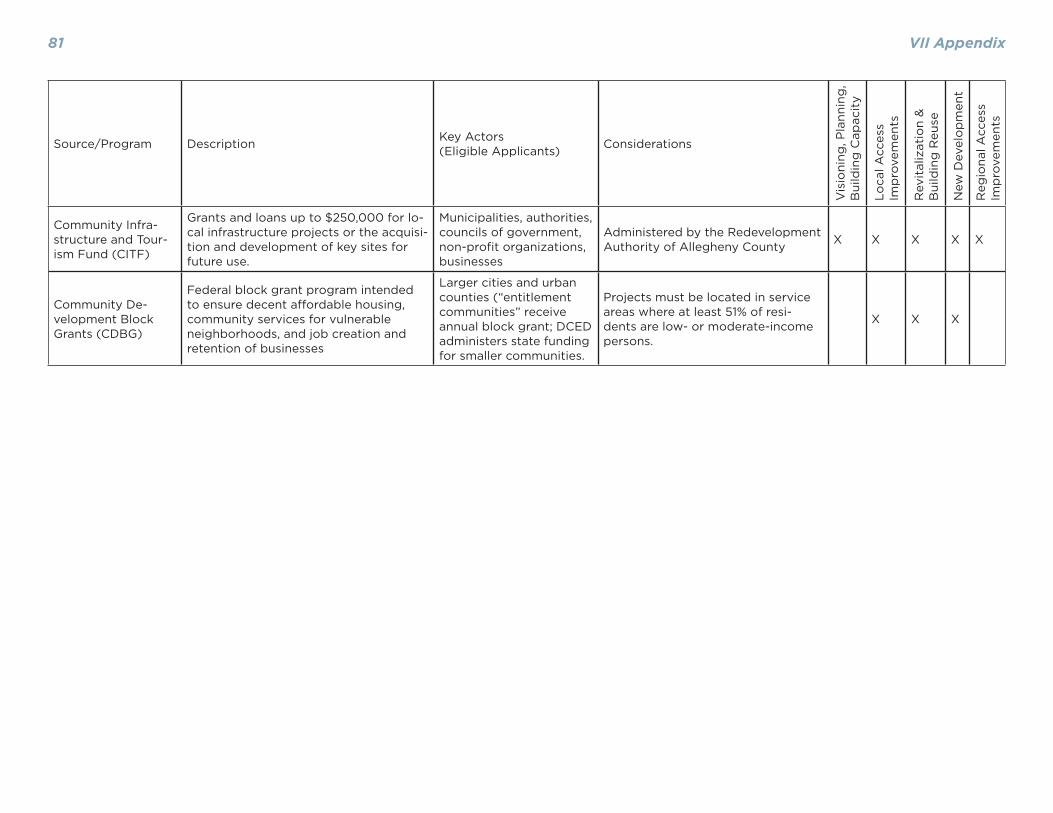
VII Appendix81
Source/Program Description Key Actors (Eligible Applicants) Considerations
Vis
ioni
ng, P
lann
ing
, B
uild
ing
Cap
acit
y
Loca
l Acc
ess
Imp
rove
men
ts
Rev
ital
izat
ion
&
Bui
ldin
g R
euse
New
Dev
elo
pm
ent
Reg
iona
l Acc
ess
Imp
rove
men
ts
Community Infra-structure and Tour-ism Fund (CITF)
Grants and loans up to $250,000 for lo-cal infrastructure projects or the acquisi-tion and development of key sites for future use.
Municipalities, authorities, councils of government, non-profi t organizations, businesses
Administered by the Redevelopment Authority of Allegheny County X X X X X
Community De-velopment Block Grants (CDBG)
Federal block grant program intended to ensure decent aff ordable housing, community services for vulnerable neighborhoods, and job creation and retention of businesses
Larger cities and urban counties (“entitlement communities” receive annual block grant; DCED administers state funding for smaller communities.
Projects must be located in service areas where at least 51% of resi-dents are low- or moderate-income persons.
X X X
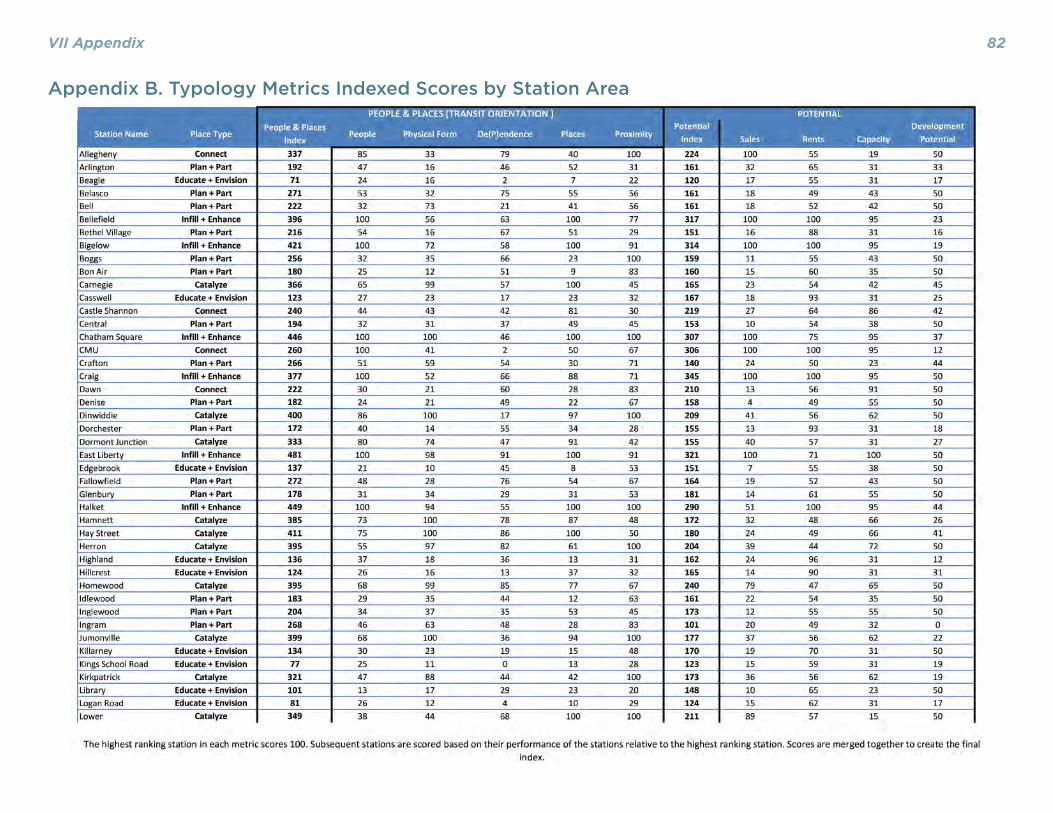
VII Appendix 82
Appendix B. Typology Metrics Indexed Scores by Station Area

VII Appendix83

VII Appendix 84
Appendix C. Typology Radar Graphs by CorridorEast Busway

VII Appendix85
East Busway (continued)
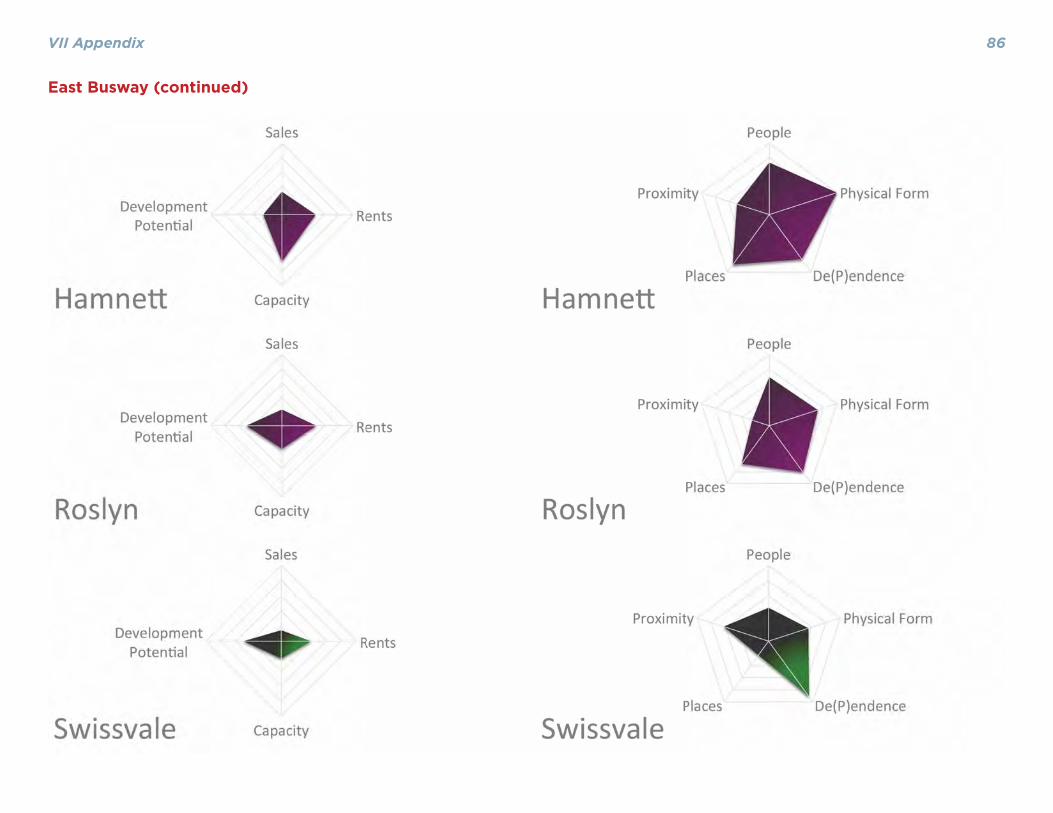
VII Appendix 86
East Busway (continued)
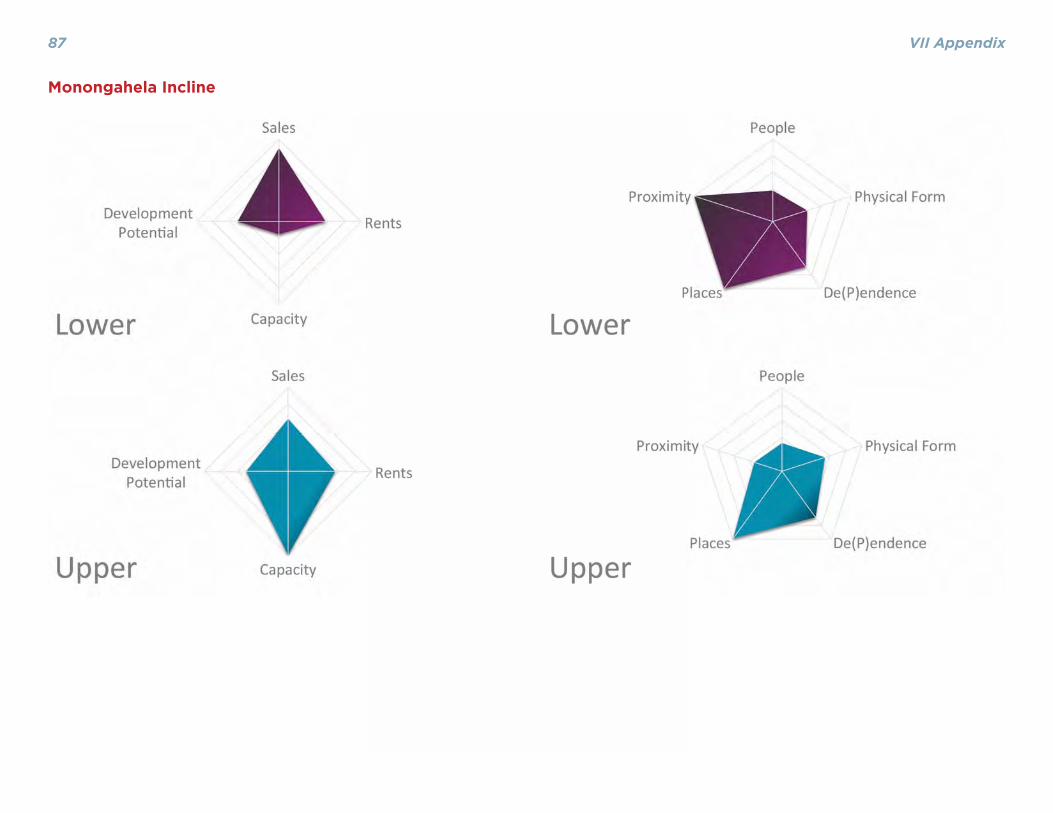
VII Appendix87
Monongahela Incline
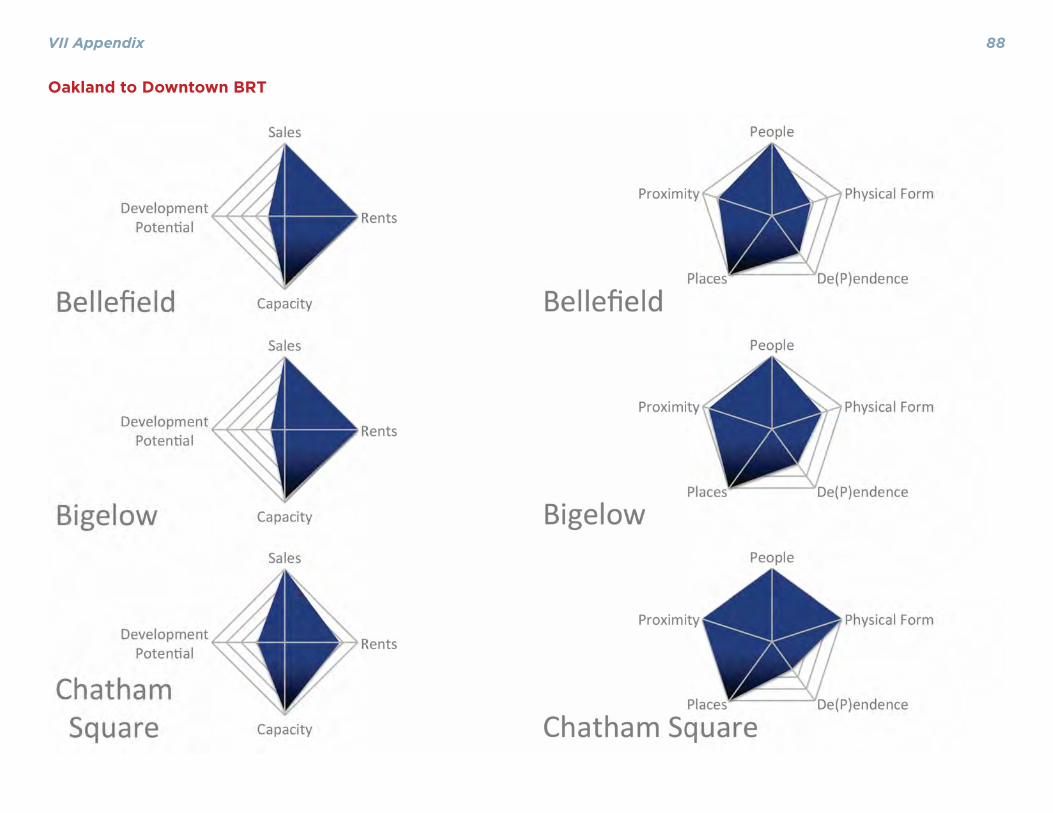
VII Appendix 88
Oakland to Downtown BRT

VII Appendix89
Oakland to Downtown BRT (continued)
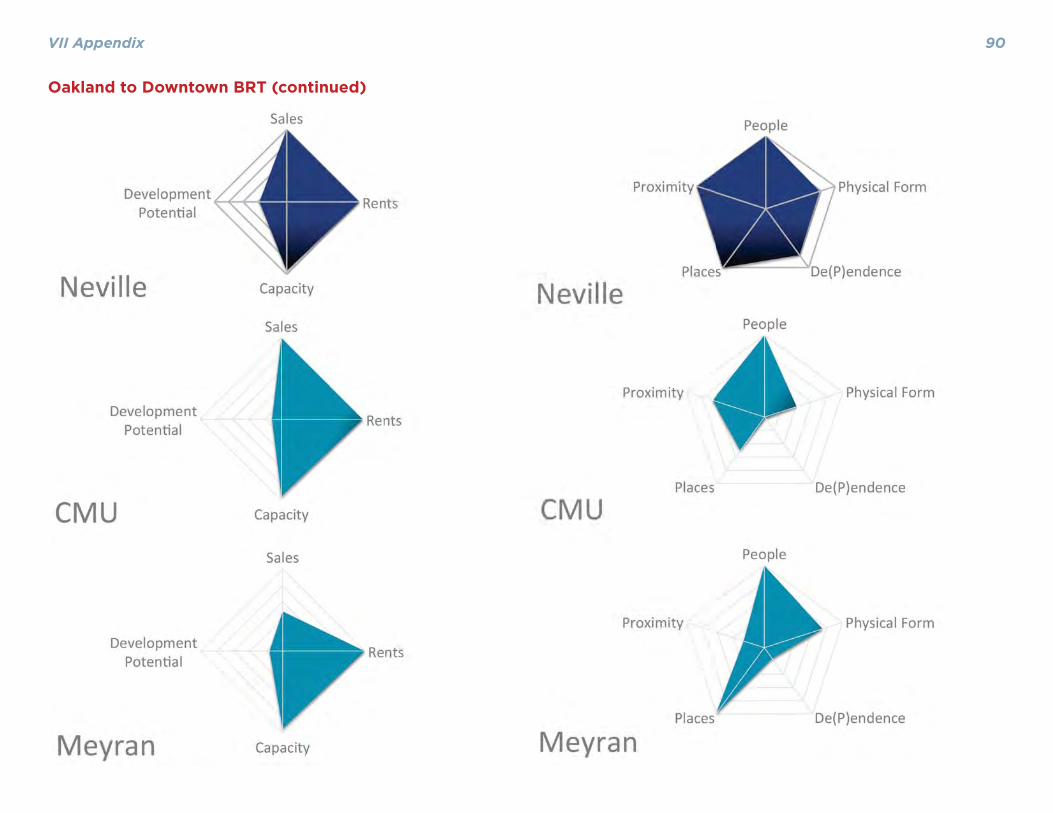
VII Appendix 90
Oakland to Downtown BRT (continued)

VII Appendix91
Oakland to Downtown BRT (continued)
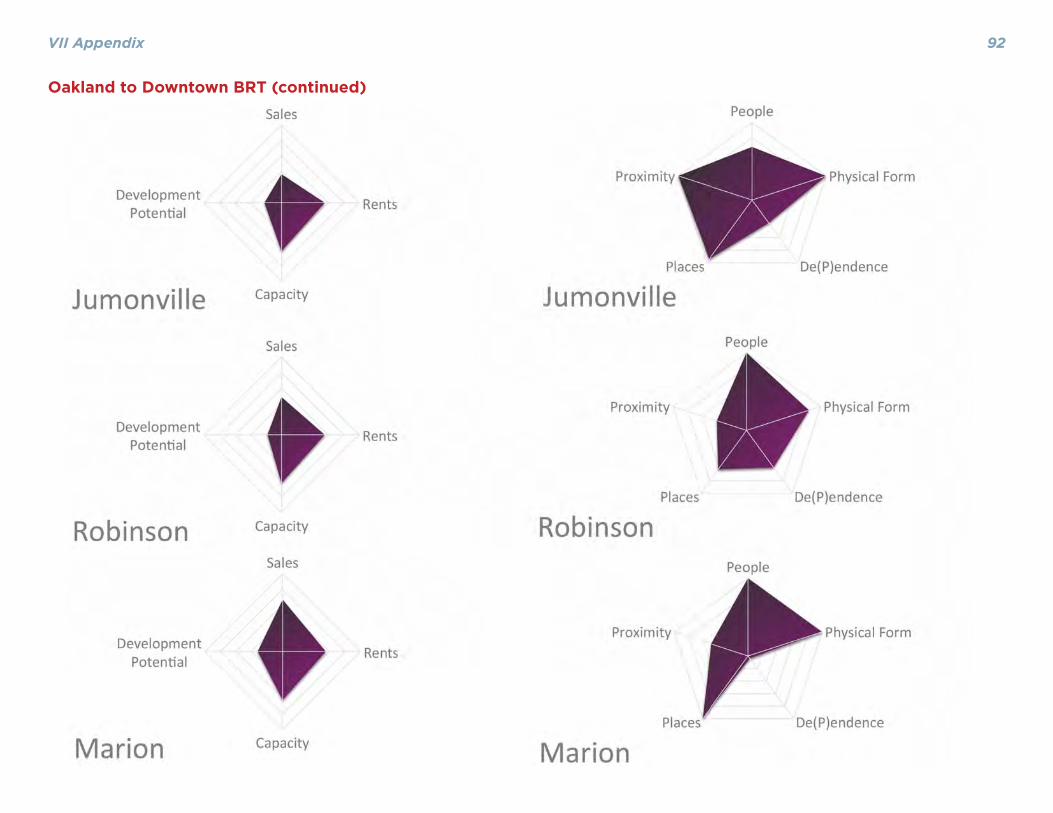
VII Appendix 92
Oakland to Downtown BRT (continued)
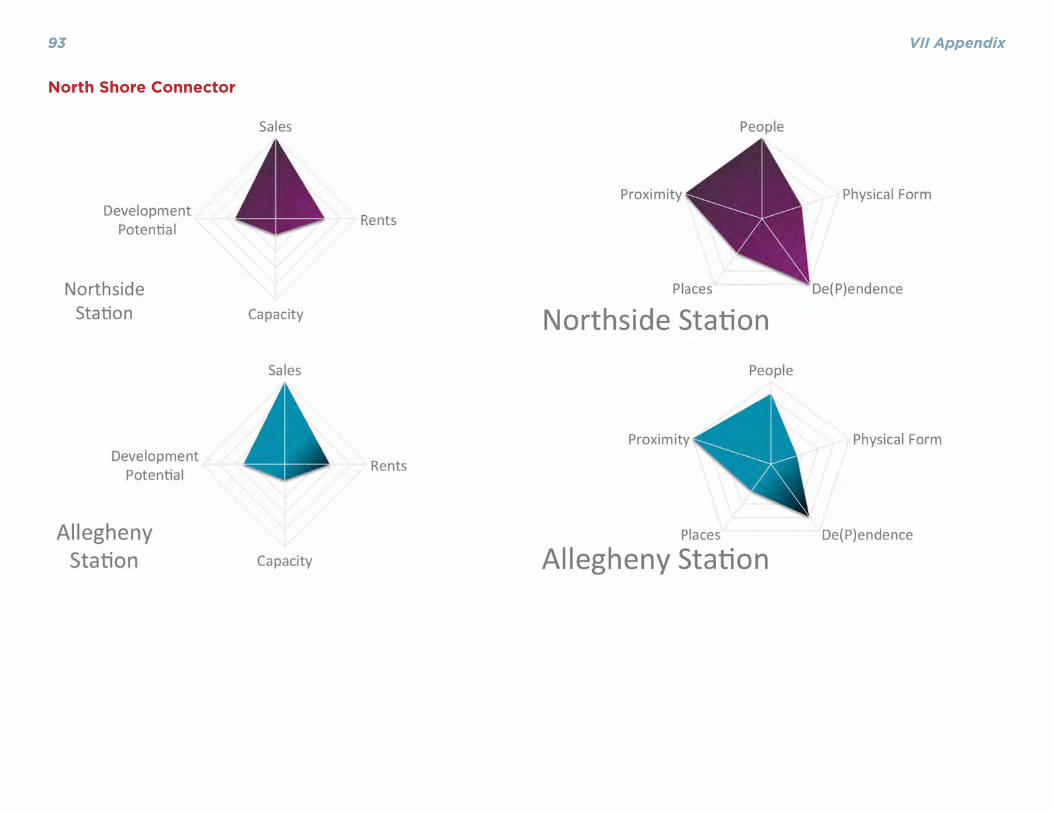
VII Appendix93
North Shore Connector

VII Appendix 94
Red Line

VII Appendix95
Red Line (continued)
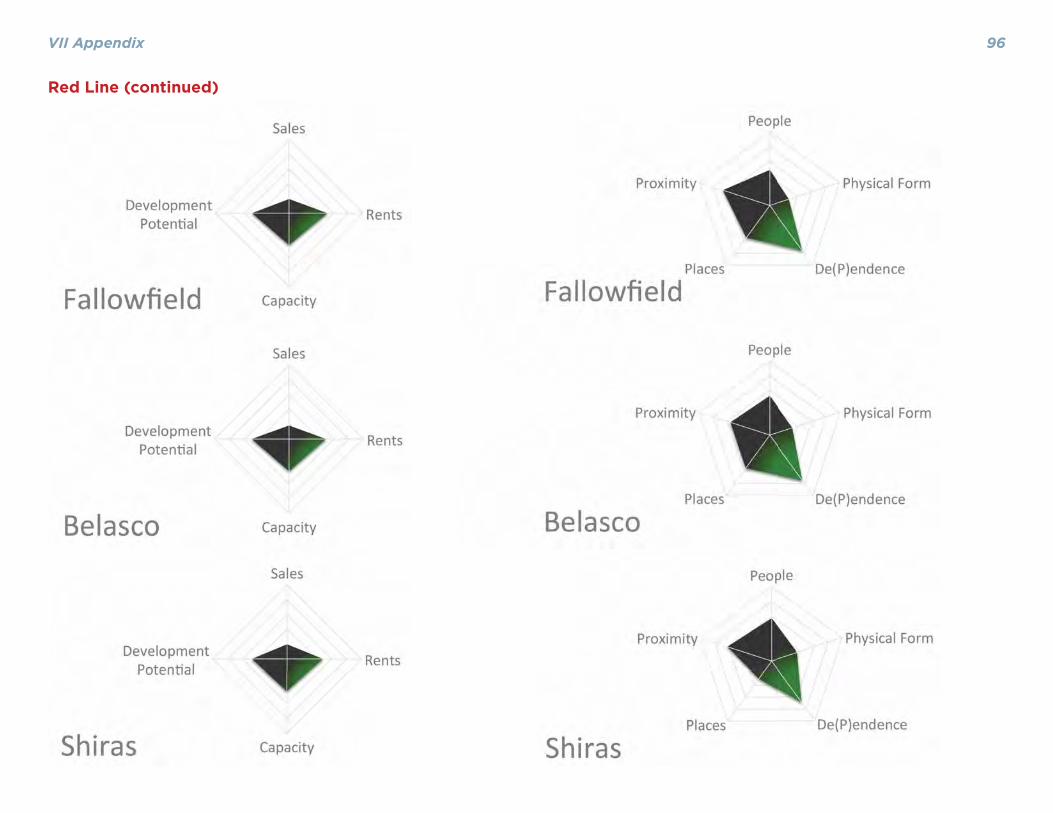
VII Appendix 96
Red Line (continued)

VII Appendix97
Red Line (continued)

VII Appendix 98
Red Line (continued)
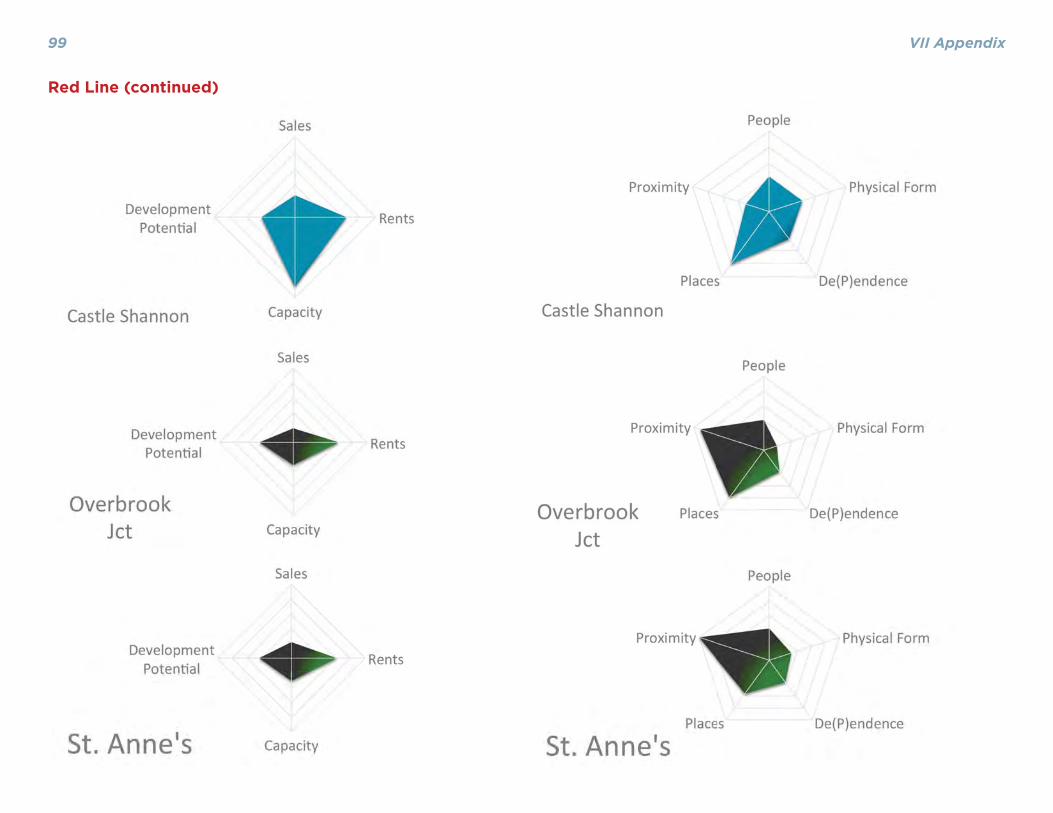
VII Appendix99
Red Line (continued)
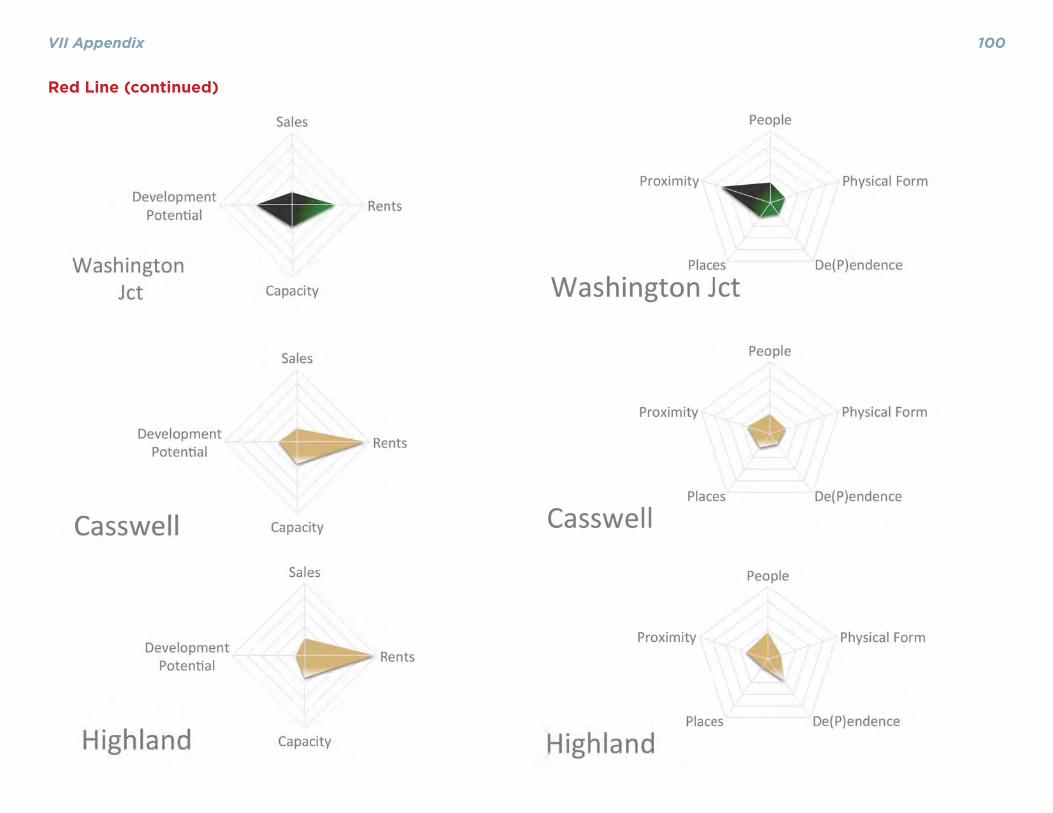
VII Appendix 100
Red Line (continued)

VII Appendix101
Red Line (continued)

VII Appendix 102
Blue Line

VII Appendix103
Blue Line (continued)

VII Appendix 104
Blue Line (continued)
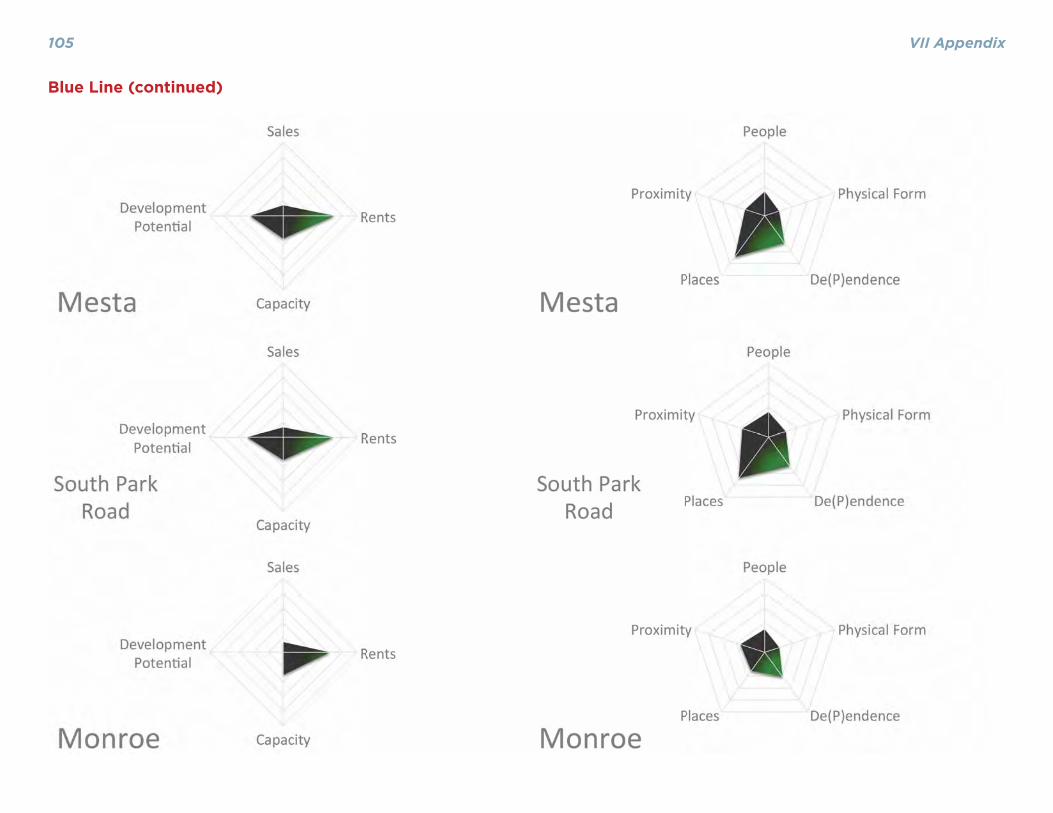
VII Appendix105
Blue Line (continued)
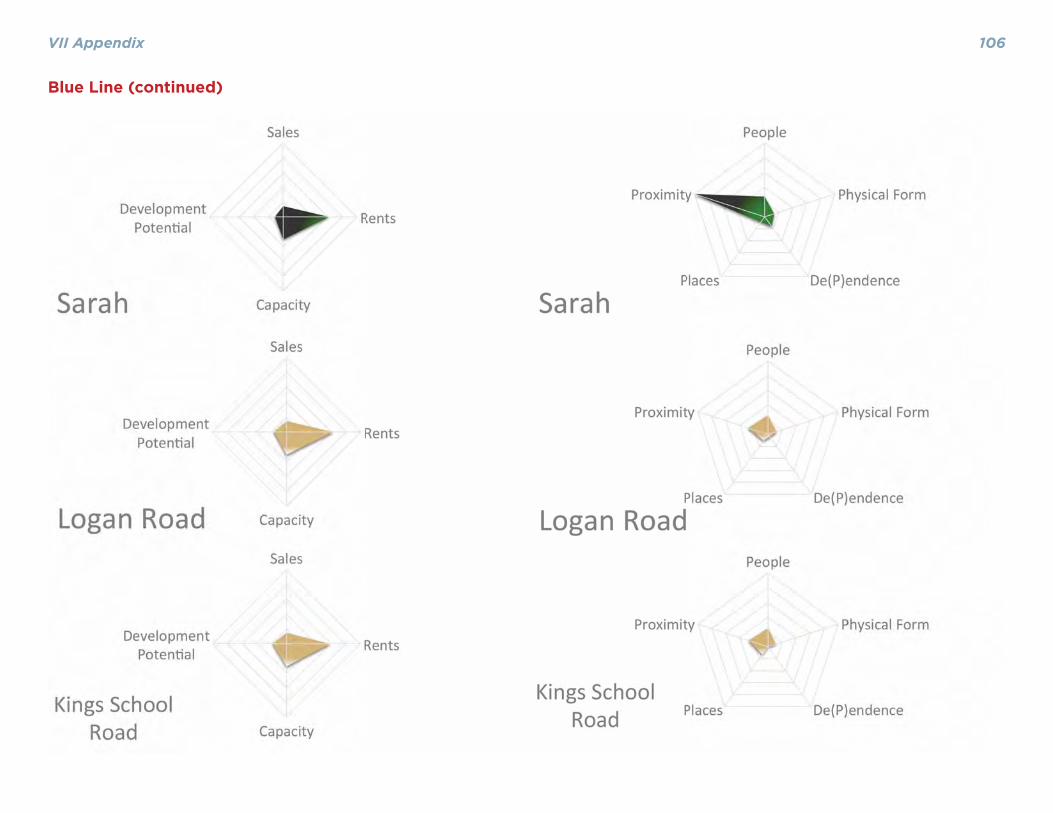
VII Appendix 106
Blue Line (continued)

VII Appendix107
Blue Line (continued)
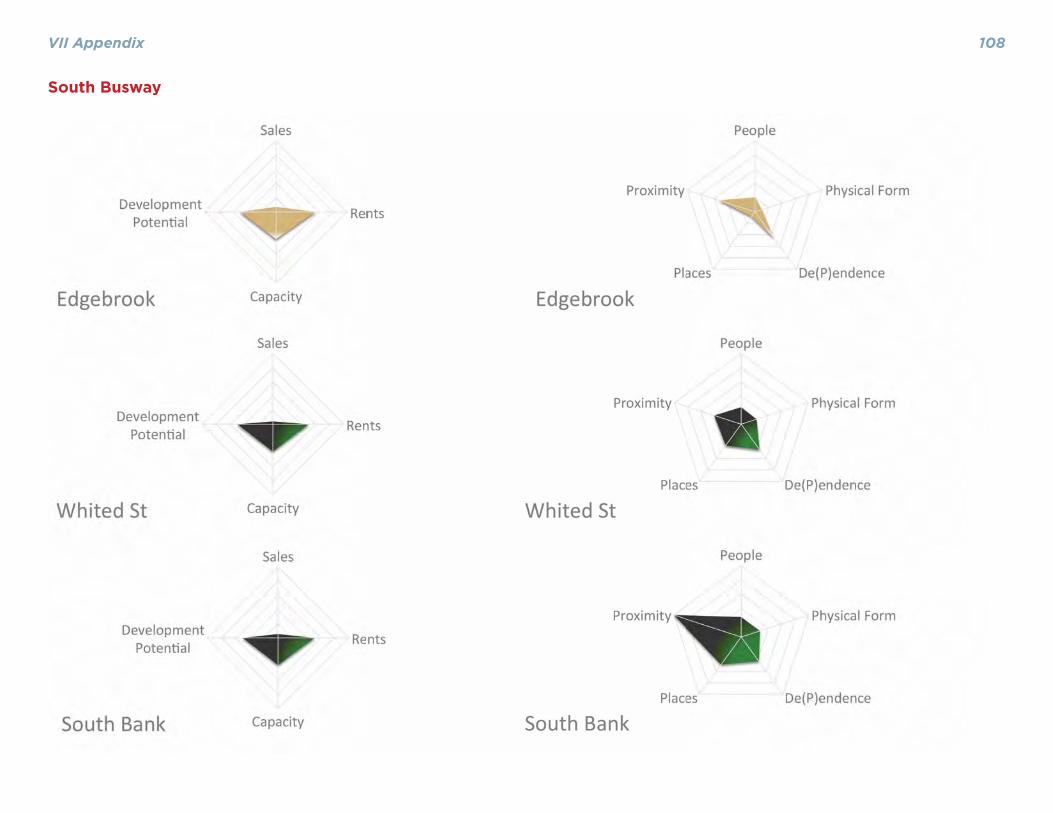
VII Appendix 108
South Busway

VII Appendix109
South Busway (continued)
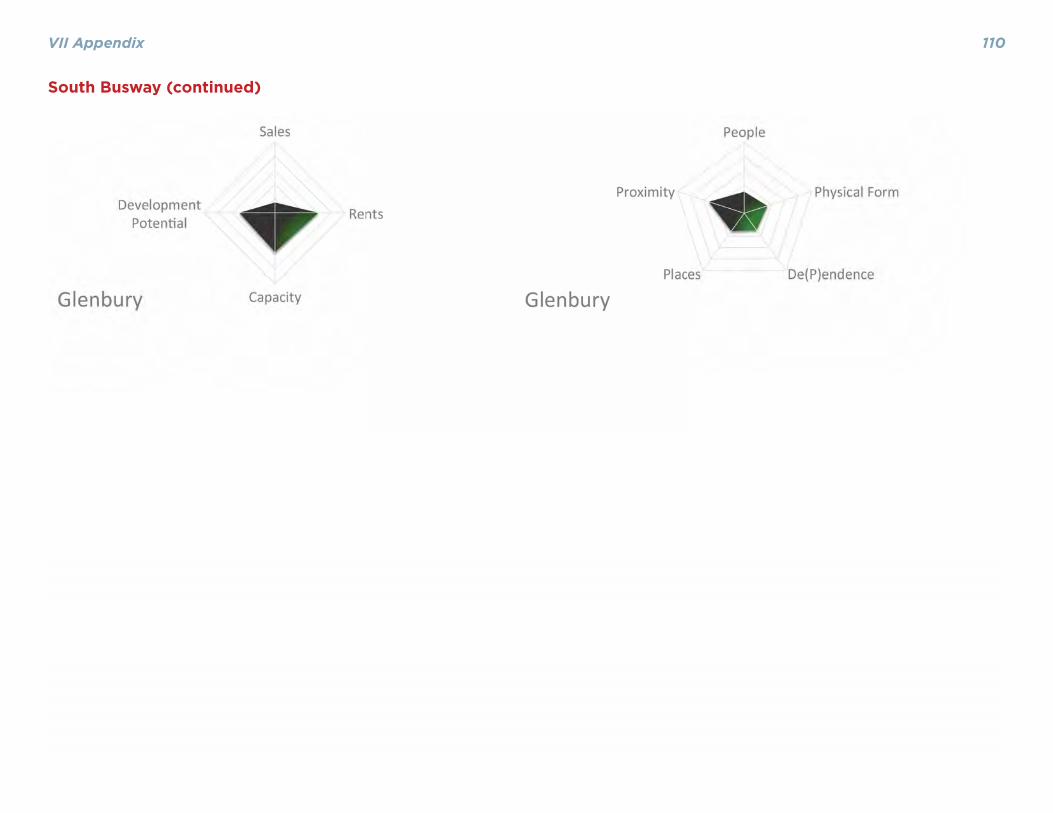
VII Appendix 110
South Busway (continued)

VII Appendix111
West Busway

VII Appendix 112
West Busway (continued)

VII Appendix113
Transit Travel Time Ratios
Station
Transit Travel Time (min)1
Auto Travel Time (min)2
Transit / Auto Travel Time Ratio
Stevenson 31 11 2.92
Whited Street 31 11 2.92
Mt Lebanon 39 14 2.75
Edgebrook 29 11 2.73
Neeld 29 11 2.73
Roslyn 35 13 2.70
Hamnett 31 12 2.63
Dormont Jct. 34 13 2.62
Kelton 34 13 2.62
Swissvale 37 14 2.61
Inglewood 32 13 2.47
Potomac 32 13 2.47
Glenbury 29 12 2.46
Shiras 29 12 2.46
Castle Shannon 43 18 2.43
Poplar 40 17 2.42
Belasco 28 12 2.37
Boustead 28 12 2.37
Dawn 22 9 2.33
Overbrook 30 13 2.31
Central 32 14 2.26
Arlington 42 19 2.22
Coast 26 12 2.20
Washington Jct. 39 18 2.20
Library 61 28 2.15
West Library 58 27 2.14
S. Hills Junction 20 9 2.12
Transit Travel Time Ratios
Station
Transit Travel Time (min)1
Auto Travel Time (min)2
Transit / Auto Travel Time Ratio
Denise 25 12 2.12
Fallowfi eld 25 12 2.12
Hampshire 25 12 2.12
Hay Street 30 14 2.12
McNeilly 30 14 2.12
St. Anne’s 37 18 2.09
Beagle 55 27 2.03
Killarney 31 15 2.
Sarah 50 25 2.02
Memorial Hall 33 17 2.00
Mine 3 40 20 1.99
S. Hills Village 47 24 1.99
South Park Road
47 24 1.99
Palm Garden 21 11 1.98
Bell 28 14 1.98
Overbrook Junction
35 18 1.98
Willow 35 18 1.98
Sandy Creek 56 28 1.98
Dorchester 46 24 1.95
Mesta 46 24 1.95
Monroe 48 25 1.94
Casswell 41 21 1.93
Hillcrest 41 21 1.93
Santa Barbara 43 22 1.92
Logan Road 45 24 1.91Lytle 45 24 1.91
Transit Travel Time Ratios
Station
Transit Travel Time (min)1
Auto Travel Time (min)2
Transit / Auto Travel Time Ratio
Martin Villa 36 19 1.91
Latimer 49 26 1.89
Boggs 20 11 1.88
Sheraden 20 11 1.88
Highland 42 22 1.87
Lindermere 42 22 1.87
Center 44 24 1.86
Kings School Road
46 25 1.86
Westfi eld 24 13 1.85
South Bank 26 14 1.84
Bethel Village 45 25 1.82
Carnegie 32 18 1.81
Smith Road 34 19 1.80
Pennant 23 13 1.77
Wilkinsburg 29 17 1.76
Traymore 22 13 1.69
Crafton 24 14 1.69
Idlewood 26 15 1.69
Bon Air 22 14 1.55
Ingram 22 14 1.55
East Liberty 21 14 1.48
Negley 20 14 1.41
Homewood 25 18 1.41
1 Transit travel time from station to Steel Plaza2 Auto travel time from station to Steel Plaza with a congestion multiplier based on the Texas Transportation Institute’s 2011 Annual Urban Mobility Report
Appendix D. Transit Travel to Auto Travel Time Ratios by Station Area

VII Appendix 114
Appendix E. Capacity Rankings: Score Components

VII Appendix115
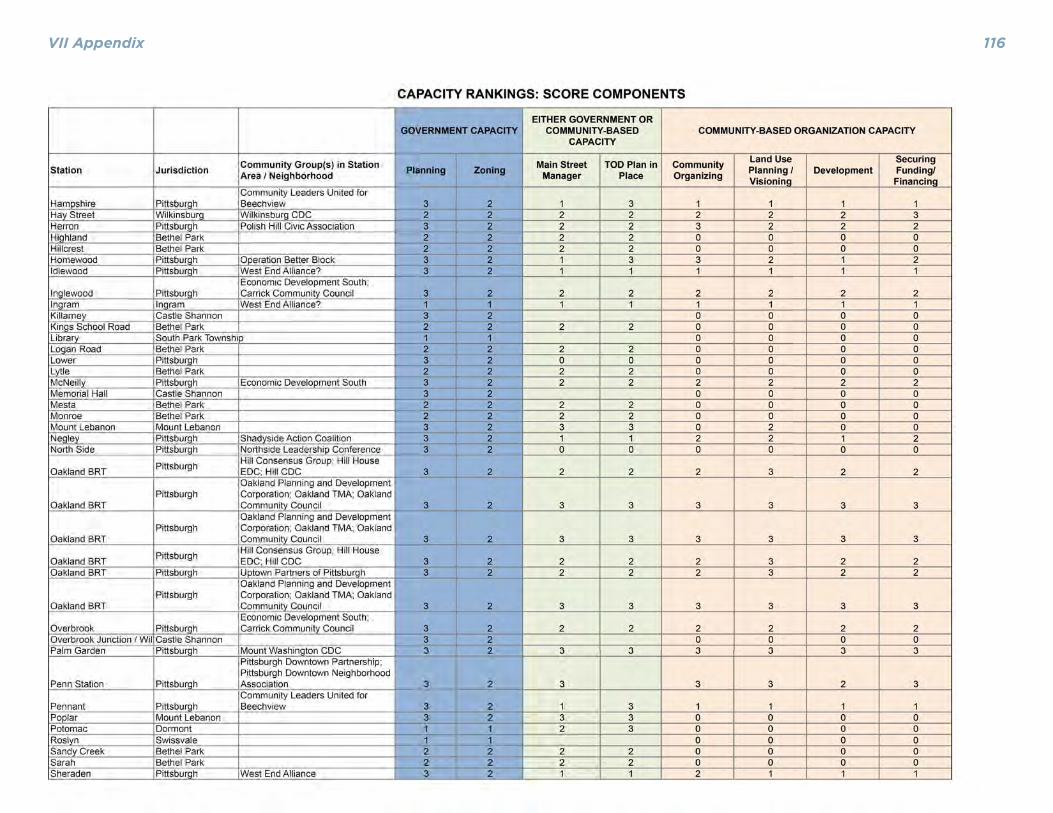
VII Appendix 116

VII Appendix117
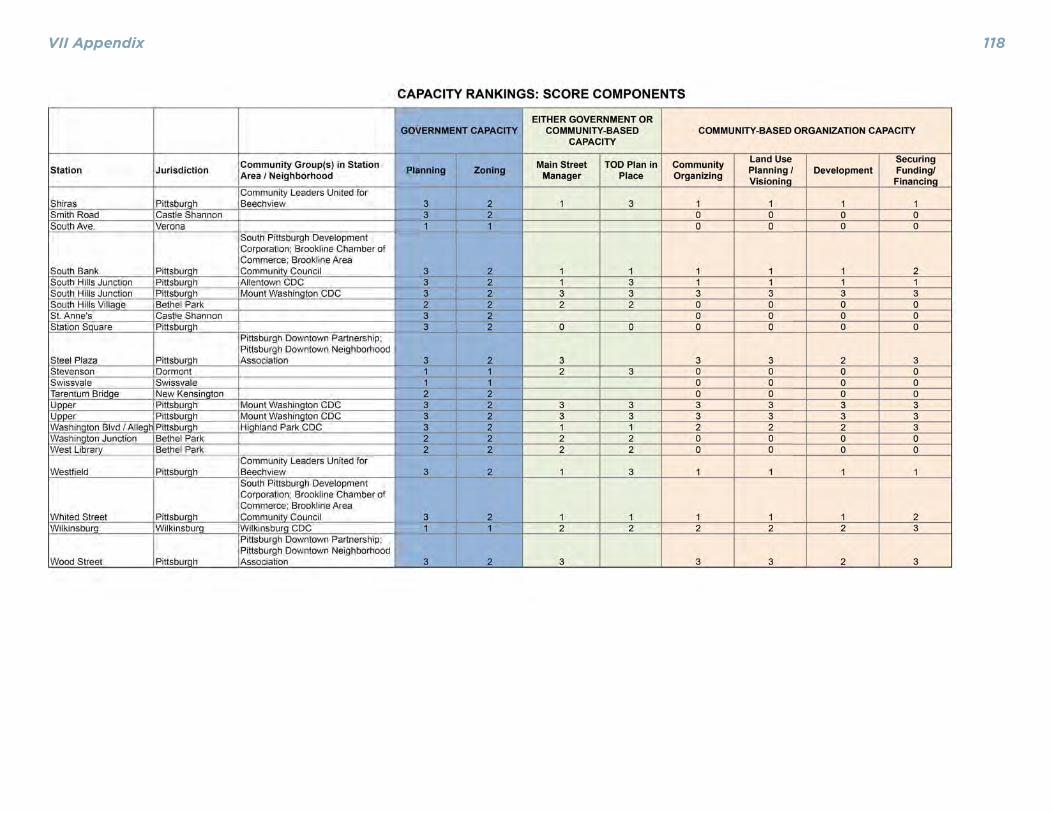
VII Appendix 118

VII Appendix119