Embed Size (px)
Citation preview
Transit Development Plan
(TDP) Update 2017-2021
Montgomery Transit System
PREPARED FOR
City of Montgomery/Montgomery MPO
103 North Perry St.
Montgomery, AL 36104
PREPARED BY
3379 Peachtree Rd NE, Suite 440
Atlanta, GA 30326
In coordination with DW & Associates, J. R. Wilburn and
Associates Inc., and STRADA Professional Services
October, 2016
Montgomery Transit Development Plan Update 2017-2021
ES-1
Executive Summary
An update of the M Transit System’s 5-year Transit Development Plan
(TDP) was conducted by the M Transit System in partnership with the
Montgomery Metropolitan Planning Organization (MPO) and the City of
Montgomery. The intent of the TDP is to guide operational changes and
capital investments in the short-term to enhance the system, provide an
improved experience for existing riders, and attract potential new
customers.
This update is an analysis of the current transit service and ridership as
well as demographics, employment, and land use in the City of
Montgomery. A list of recommendations to increase the efficiency of
transit service and improve accessibility to employment centers, hospitals
and medical facilities, and shopping opportunities for M Transit riders is a
key outcome of this process. Initial service recommendations were based
on a review of existing conditions as well as system goals and objectives
that were developed with input from the public, stakeholders, M Transit,
and the City of Montgomery. These service recommendations were tested
using the Transit Boardings Estimation and Simulation Tool (TBEST)
modeling software and evaluated using performance measures tied to the
goals and objectives.
A list of final recommendations was created from the highest performing
recommendations. Systemwide performance measures were then
calculated. Next, operating costs for the recommended system were
estimated and potential funding sources were documented. Finally, an
implementation plan for rolling out the recommended changes across the
M Transit system was developed. The key findings of this update are
grouped by section below.
Existing Service Structure
The M Transit system operates 14 fixed routes Monday through
Saturday
Paratransit service is provided within the City of Montgomery limits
There are two transfer centers located at:
o Water and Molton Streets in Downtown Montgomery
o West Fairview Avenue and Mobile Highway
Montgomery Transit Development Plan Update 2017-2021
ES-2
All vehicles, equipment and facilities are owned by the City of
Montgomery
First Transit operates the system under contract
Review of Previous Studies
The 2009 – 2013 Transit Development Plan developed a set of
recommendations to improve service efficiency. Due to funding shortfalls as a
result of the Great Recession beginning at the end of 2007 and limited local
support for the changes, none of the below recommendations were
implemented:
Routes were reconfigured to reduce run times and improve
performance
Routes 1 and 16 should be merged
Route 9 should be divided into two routes
Service to southwest Montgomery should be increased
The above recommendations were tested with new demographic and land use
data to determine if they are still valid. Other findings from the 2009 – 2013
TDP Update are:
Highest transit demand was in neighborhoods south and west of
downtown
Poor on-time performance impacted timed transfers and system
reliability
The Intermodal Center offers good amenities, but opportunities for
improving bicycle and pedestrian access exist
Findings from other relevant plans include:
The M Transit is projected to receive approximately $21.6 million in
federal funds through 2021, all of which is planned or programmed for
fleet replacement and facilities rehabilitation (i.e. the Downtown
Transfer Center, Fairview Transfer Center, and the
Administrative/Maintenance Facility)
The City of Montgomery population declined 2.5% between 2010 and
2015
Employment is concentrated in Downtown Montgomery, along
Southern and Eastern boulevards, and on I-85 between Taylor Road
and Chantilly Parkway
Low-income populations are located in southwest Montgomery and
around the downtown area
Montgomery Transit Development Plan Update 2017-2021
ES-3
MPO projections show the density of the city will be constant through
2040
Several bicycle routes and planned pedestrian improvements are
adjacent to existing bus routes
Routes 2, 3, 5, and 9 are all on roadways segments with congestion
relief needs identified in the Congestion Management Plan
Public and Stakeholder Engagement
Throughout the TDP Update, a number of opportunities for the public,
stakeholders, and partner agencies were held to gather input on the existing
system as well as potential and final recommendations. Examples of
engagement strategies include:
Public meetings and open houses
Interviews with key decision-makers
Focus groups with major transit and mobility stakeholders
Surveys of current transit riders and the general public
Market Analysis
The following traditional transit markets are generally served by the existing
transit routes:
Zero car households are in the northern part of Downtown
Montgomery, near the Fairview Transfer Center, West Boulevard and
US Route 331, Baptist Medical Center, Atlanta Highway, and East
Boulevard
Low income areas are concentrated in Downtown Montgomery, to the
north and west of Downtown, and in Woodland Hills
Young persons and seniors are fairly evenly distributed throughout the
city
The M Transit System provides access to areas with the high job
densities, which are not projected to change much between 2010 and
2040
From a land use perspective, within the City of Montgomery most
areas and corridors with retail and residential uses are served by
existing routes
Transit Development Plan Goals
Goals and objectives were based on a peer review of five other transit
agencies and public and stakeholder input. The TDP goals include:
Enhance the integration of transit services to support the economy and
local land uses.
Montgomery Transit Development Plan Update 2017-2021
ES-4
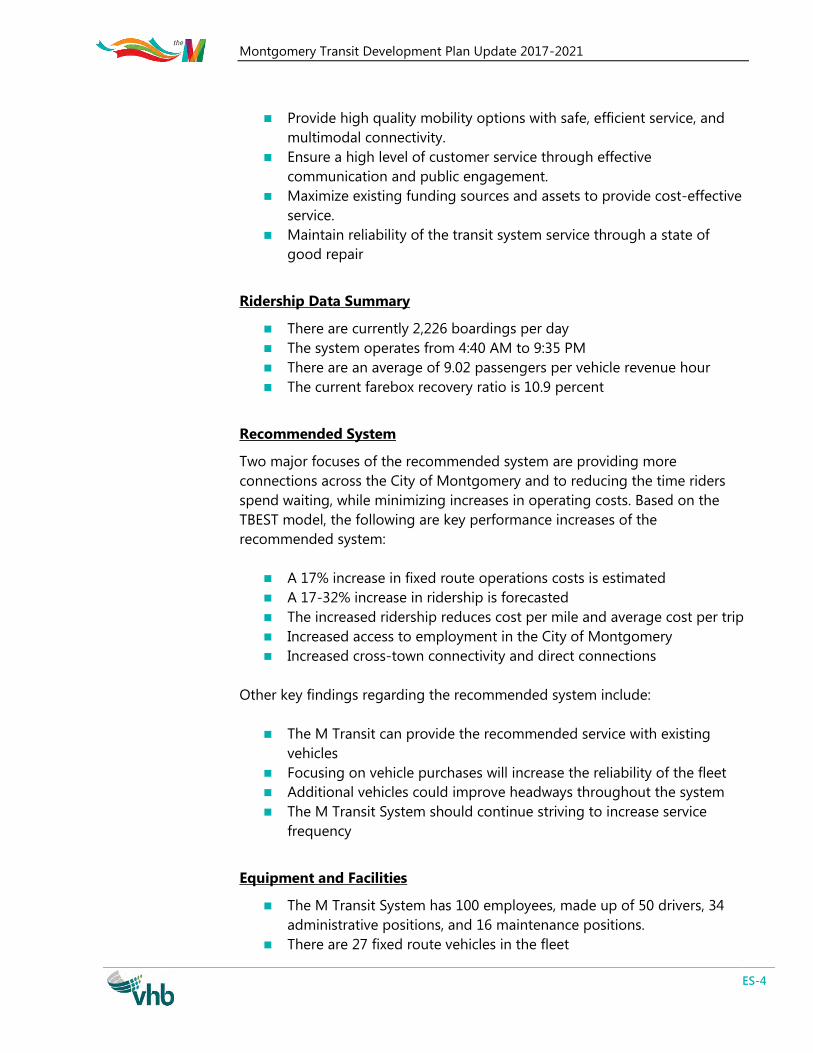
Provide high quality mobility options with safe, efficient service, and
multimodal connectivity.
Ensure a high level of customer service through effective
communication and public engagement.
Maximize existing funding sources and assets to provide cost-effective
service.
Maintain reliability of the transit system service through a state of
good repair
Ridership Data Summary
There are currently 2,226 boardings per day
The system operates from 4:40 AM to 9:35 PM
There are an average of 9.02 passengers per vehicle revenue hour
The current farebox recovery ratio is 10.9 percent
Recommended System
Two major focuses of the recommended system are providing more
connections across the City of Montgomery and to reducing the time riders
spend waiting, while minimizing increases in operating costs. Based on the
TBEST model, the following are key performance increases of the
recommended system:
A 17% increase in fixed route operations costs is estimated
A 17-32% increase in ridership is forecasted
The increased ridership reduces cost per mile and average cost per trip
Increased access to employment in the City of Montgomery
Increased cross-town connectivity and direct connections
Other key findings regarding the recommended system include:
The M Transit can provide the recommended service with existing
vehicles
Focusing on vehicle purchases will increase the reliability of the fleet
Additional vehicles could improve headways throughout the system
The M Transit System should continue striving to increase service
frequency
Equipment and Facilities
The M Transit System has 100 employees, made up of 50 drivers, 34
administrative positions, and 16 maintenance positions.
There are 27 fixed route vehicles in the fleet
Montgomery Transit Development Plan Update 2017-2021
ES-5
Currently there are 11 demand response vehicles
All fixed route vehicles are equipped with bicycle racks
There are two transfer centers and one maintenance facility
Revenue and Expenditures
Funding is through federal grants, the general fund, and farebox
revenue
The total operating cost for the M Transit System in 2014 was
$7,310,783
The TBEST model projected a 12% overall increase in costs to
$8,288,495 including fixed route and paratransit operations
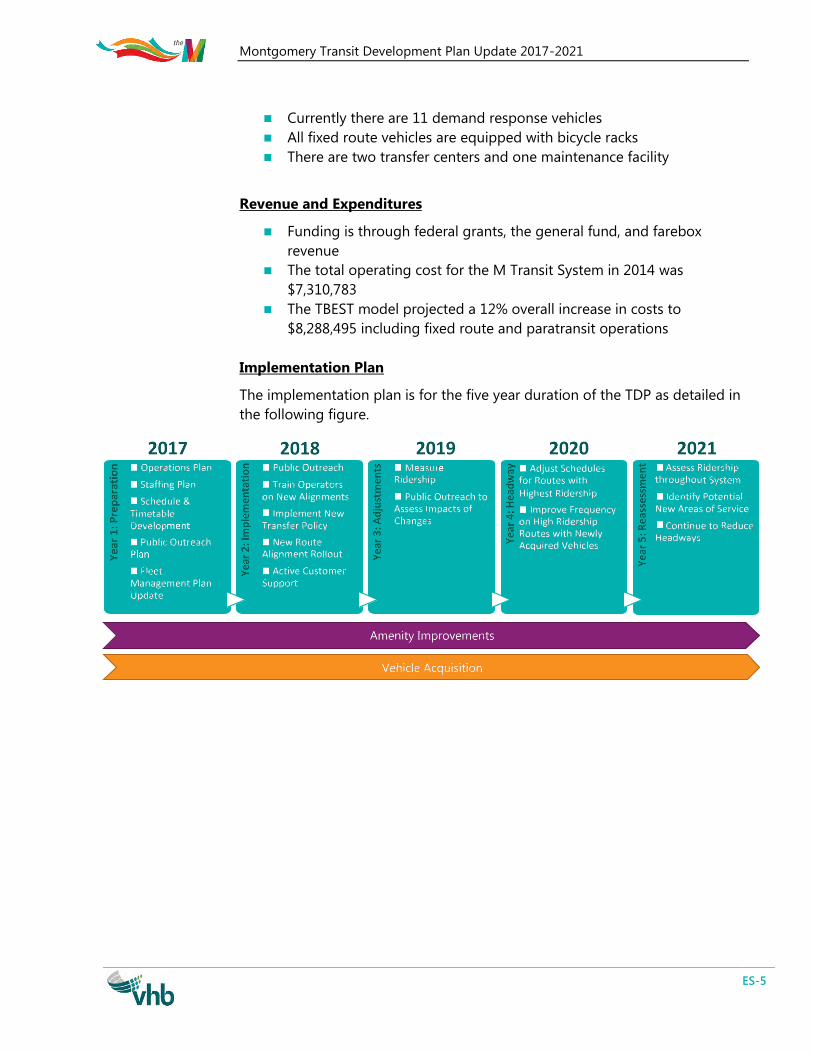
Implementation Plan
The implementation plan is for the five year duration of the TDP as detailed in
the following figure.
¾¿
¾¿
Montgomery County
Autauga County
ElmoreCounty
City of Montgomery
¬«152
East B
ouleva
rd
£¤231
West Boulevard
Mobil
e High
way
£¤31
Vaughn Rd
¬«21
£¤331
State Rte 143
Atlanta Highway
Selma Hwy, US Hwy 80
I- 85
I- 65
US Hwy 82 State Rte 6State Rte 21
State Rte 8
West Blvd
State
Rte 9
US H
wy 23
1
US Hwy 31State Rte 3 US Hwy 80
Bell R
d
State Rte 110
Vaughn Rd
Co Rd 43
State Rte 53
Taylo
r Rd
Woodley Rd
Atlanta Hwy
State Rte 152
Northern Blvd
Co Rd 54
S Cou
rt St
Bell St
Troy HwyEastern Blvd
Narro
w La
ne R
d
Wares Ferry Rd
Norm
an Br
idge R
dS P
erry S
t
Oak S
t
Park Xing
State
Rte 42
Hill S
t
Co Rd 42
State Rte 108
Hall S
t
Hunte
r Loo
p Rd Birmingham Hwy
Ann S
t
Colise
um Bl
vd
US H
wy 33
1Ro
sa L
Parks
Ave Carter Hill Rd
River Rd
Co Rd 15
Co Rd 33
March St
Mill St
Old Selma Rd
N Co
urt St
Federal Dr
Foshee RdMo
bile Hw
y
S Hull
StHayn
eville R
d
Co Rd 39
McGehee Rd
Forbes Dr
State
Rte 2
77
McLemore Dr
Air Base Blvd
Highland Ave
Ray Dr
S Holt
StDay St
Gilm
er Av
eGaston Ave
Perry
Hill R
d
N Ripley S
t
Felder Ave
Virgin
ia Lo
op R
d
Concrete Dr
Tower Rd
Eastchase PkwyWell Rd
N De
catur
St
Ray Thorington Rd
Tine Ave
Dalra
ida R
d
Fernway Dr
Rigby St
Co Rd 83
Roquemore St
Duff St
Harrison Rd
6th St
Seibles Rd
W Fleming Rd
Kelly St
Ellis
Dr
Arrowhead DrGood
e St
Co Rd 2120
Audu
bon R
d
Hillm
an St
Folmar P
kwy
April
St
Chisholm St
Semi
nole
Dr
Wille
na St 3rd St
Halcyon Blvd
Beardsley Dr
Payn
e Rd
Felder Rd
Ash St
Buckingham Dr
Bienville Rd
Oldfi
eld D
r
Milton Rd
Co Rd 64
Milan Dr
University DrMo
bile D
r
Durbi
n St
Lakeridge Dr
Dunb
arton
Rd
Monticello Dr
Pike R
d
Eric
Ln
Thom
as Av
e
Kings
bury
Dr
N Pe
rry St
Adler Dr
Lemay Plz
Briar
Gate
Dr
Bran
twoo
d Dr
Rabbitt Rd
Aronov Ave
David
Dr
Marston Way
Mimosa Rd
Lancaster Ln
Lagoon Park Dr
Otis Ln
Jeffrey Dr
Midpark Rd
East Dr
Sanders Ln
Herbert Dr
Henry Dr
Wiltshire D
r
Leno
x Ln
Co Rd 40
Meriw
ether
Rd
Larki
n Ln
Argyle Rd
Wildwood Dr
W Ab
erdee
n Dr
Hill H
edge
Dr
Salary St
Lafay
ette S
t
Chantilly Pkwy
Lomac St
North Dr
Arrowleaf Rd
Oak Grov
e DrSutton Dr
E Vandiver Blvd9th St
Gorga
s St
Hunte
r Ln
Bent
Broo
k Dr
Donna D
r
Linco
ln RdStarr St
Grande Ave
Mona Lisa Dr
Elaine Dr
Monte
zuma
Rd
Civic St
Rita Ln
Division
Rd
Donovan Dr
Coral Ln
E Ava
lon Pk
wy
Ira Ln
Wasden Rd
S Pine St
Meridian Ln Sprot
t Dr
Red B
arn Rd
Brewer C
ir
State Rte 8
State R
te 21 I- 85
I- 65
Taylor Rd
Montgomery Regional Airport
Maxwell Airforce Base
logos
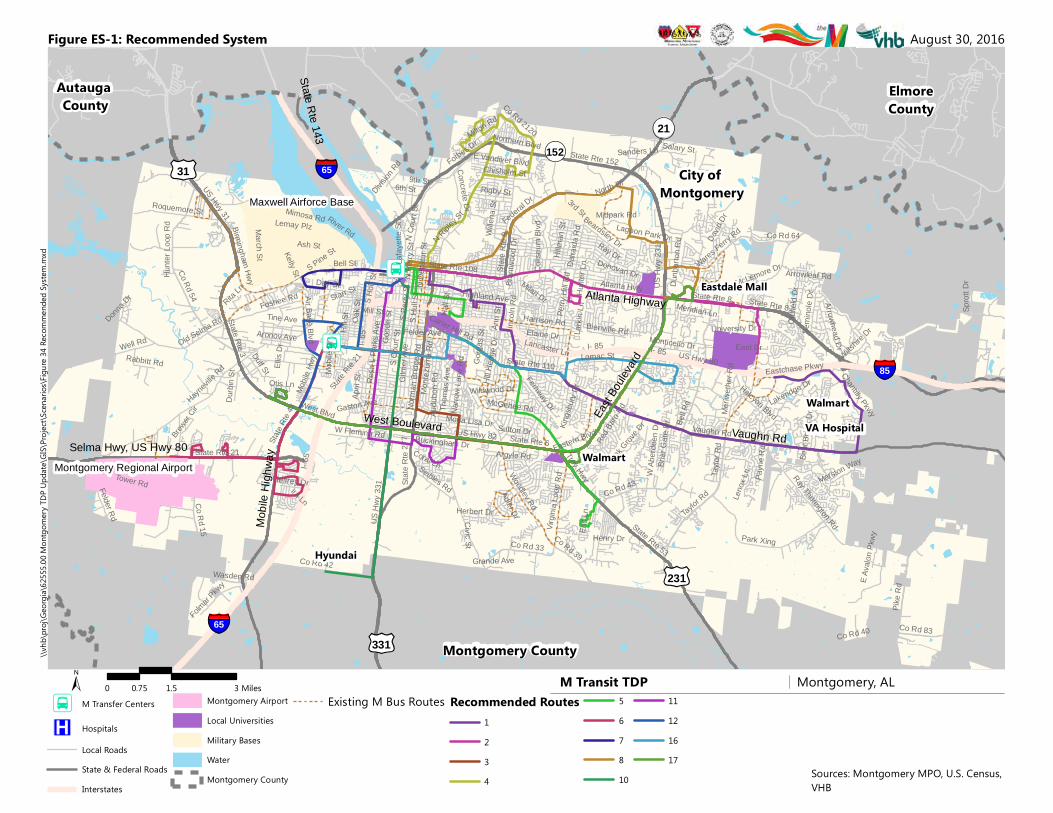
M Transit TDP Montgomery, AL
Figure ES-1: Recommended System
Sources: Montgomery MPO, U.S. Census, VHB
± 0 1.5 30.75 Miles
August 30, 2016\\v
hb\pr
oj\Ge
orgia\
6255
5.00 M
ontgo
mery
TDP U
pdate
\GIS\
Projec
t\Scen
arios
\Figu
re 34
Reco
mmen
ded S
ystem
.mxd
¾¿ M Transfer Centers
®v Hospitals
Local RoadsState & Federal RoadsInterstates
Montgomery AirportLocal UniversitiesMilitary BasesWaterMontgomery County
Existing M Bus Routes Recommended Routes1234
567810
11121617
§̈¦85
§̈¦65
§̈¦65
Hyundai
VA HospitalWalmart
Walmart
Eastdale Mall
Montgomery Transit Development Plan Update 2017-2021
i
Table of Contents
Table of Contents ......................................................................................... i
Introduction ................................................................................................. 1
Service Structure ......................................................................................... 2
2.1 Existing System ......................................................................................................... 2
2.2 Existing Contract ...................................................................................................... 3
Review of Previous Studies ........................................................................ 5
3.1 Introduction ............................................................................................................... 5
3.2 TDP 2009-2013 ......................................................................................................... 5
3.3 Other Relevant Studies ......................................................................................... 7
3.4 Key Takeaways for TDP Update ...................................................................... 16
Public & Stakeholder Engagement .........................................................18
4.1 Public Engagement Objectives ....................................................................... 18
4.2 Public Engagement Activities .......................................................................... 18
Market Analysis .........................................................................................34
5.1 Overview and Purpose ....................................................................................... 34
5.2 Market Analysis ..................................................................................................... 34
5.3 Implications for Scenarios ................................................................................. 35
TDP Goals & Performance Measures .....................................................47
6.1 Introduction ............................................................................................................ 47
6.2 Peer Review ............................................................................................................ 49
6.3 Goals and Performance Metrics ..................................................................... 52
Ridership Data Summary..........................................................................54
7.1 Overview .................................................................................................................. 54
7.2 Methodology ......................................................................................................... 54
7.3 System Evaluation ................................................................................................ 55
Recommended System .............................................................................61
8.1 Methodology & Recommendation Development ................................. 61
8.2 Recommended System ...................................................................................... 62
Equipment and Facilities ..........................................................................68
Montgomery Transit Development Plan Update 2017-2021
ii
9.1 Vehicles .................................................................................................................... 68
9.2 Facilities & Transfer Locations......................................................................... 70
Existing Funding & Recommendation Costs .........................................72
10.1 Current Revenue Sources & Expenditures ................................................. 72
10.2 Recommendation Cost Discussion ................................................................ 73
Implementation Plan ................................................................................76
11.1 Implementation Action Items .......................................................................... 76
11.2 Additional Improvement Considerations .................................................... 79
Appendix A: Stakeholder Meeting Notes
Appendix B: Route Profiles
Appendix C: Individual Route Recommendations
Montgomery Transit Development Plan Update 2017-2021
iii
Figure No. & Description Page
Figure 1: Existing M Transit System Routes ............................................................. 1
Figure 2: Montgomery Transit Timeline.................................................................... 6
Figure 3: Level of Congestion .................................................................................... 15
Figure 4: Boards Used at Public Meeting .............................................................. 20
Figure 5: Rider-Requested Service Areas .............................................................. 22
Figure 6: Rider Survey Race/Ethnicity ..................................................................... 23
Figure 7: Rider Survey Income ................................................................................... 24
Figure 8: Rider Survey ................................................................................................... 24
Figure 9: Riding History ................................................................................................ 24
Figure 10: Rider Survey Riding .................................................................................. 24
Figure 11: Rider Survey ................................................................................................. 24
Figure 12: Rider Survey Destination ........................................................................ 24
Figure 13: Dependence on Service .......................................................................... 25
Figure 14: Rider Vehicles .............................................................................................. 25
Figure 15: Non-Rider Vehicles ................................................................................... 26
Figure 16: Rider Income ............................................................................................... 26
Figure 17: Non-Rider Income..................................................................................... 27
Figure 18: What Would it take for Non-Riders to Consider Transit? ......... 28
Figure 19: M Transit Bus Routes and Existing Sidewalks ................................ 31
Figure 20: Stakeholder Engagement ....................................................................... 32
Figure 21: Zero Car Households ............................................................................... 37
Figure 22: Median Income .......................................................................................... 38
Figure 23: Youth Population ....................................................................................... 39
Figure 24: Senior Population ...................................................................................... 40
Figure 25: Household Density .................................................................................... 41
Figure 26: Median Income & Household Density Overlay ............................. 42
Figure 27: Employment Density ................................................................................ 43
Figure 28: Travel Demand Model Trip Origins .................................................... 44
Figure 29: Travel Demand Model Trip Destinations ......................................... 45
Figure 30: Observed Land Use ................................................................................... 46
Figure 31: Systemwide Heat Map ............................................................................. 58
Figure 32: Systemwide Heat Map without Intermodal or West Fairview
Transfer Center ................................................................................................................ 59
Figure 33: Systemwide Heat Map with all Recorded Stops ........................... 60
Figure 34: Recommended System ........................................................................... 66
Figure 35: Operating Funding Sources .................................................................. 72
Figure 36: Recommendations Cost Comparison ................................................ 74
Figure 37: TDP 5 Year Action Items & Schedule ................................................ 76
Montgomery Transit Development Plan Update 2017-2021
iv
Table No. & Description Page
Table 1: M Transit System Projected Federal Funding (2017-2021) ........... 10
Table 2: LRTP Projects through 2040 ...................................................................... 11
Table 3: Relationship between LRTP Goals & TDP ............................................ 48
Table 4: Comparison of Emphasis Areas ............................................................... 51
Table 5: TDP Goals and Associated Performance Measures ......................... 53
Table 6: M Transit Systemwide Statistics ............................................................... 55
Table 7: Route Level Statistics .................................................................................... 57
Table 8: Recommended Changes by Route ......................................................... 62
Table 9: Recommended Headways for Rollout of New System ................... 65
Table 10: Relative Changes in Performance Measures .................................... 67
Table 11: Fixed Route Vehicle List ............................................................................ 69
Table 12: Demand Response Fleet Characteristics ............................................ 70
Montgomery Transit Development Plan Update 2017-2021
1
1 Introduction
The M Transit System, in partnership with the Montgomery Metropolitan
Planning Organization (MPO) and the City of Montgomery is updating its
5-year Transit Development Plan (TDP). This plan identifies service
changes intended to increase transit service efficiency throughout
Montgomery, as well as improve service, mobility and accessibility to jobs,
medical appointments, and shopping.
This TDP Update provides background on previous transit plans in
Montgomery and relevant other plans, describes findings from public
engagement activities, provides a demographic market analysis, and
performs a systemwide analysis to understand how the system is
performing now and where the travel needs are. Using the goals and
performance measures developed in this TDP Update, service
recommendations were developed along with a discussion about funding
sources, equipment needs, and implementation.
Montgomery Transit Development Plan Update 2017-2021
2
2 Service Structure
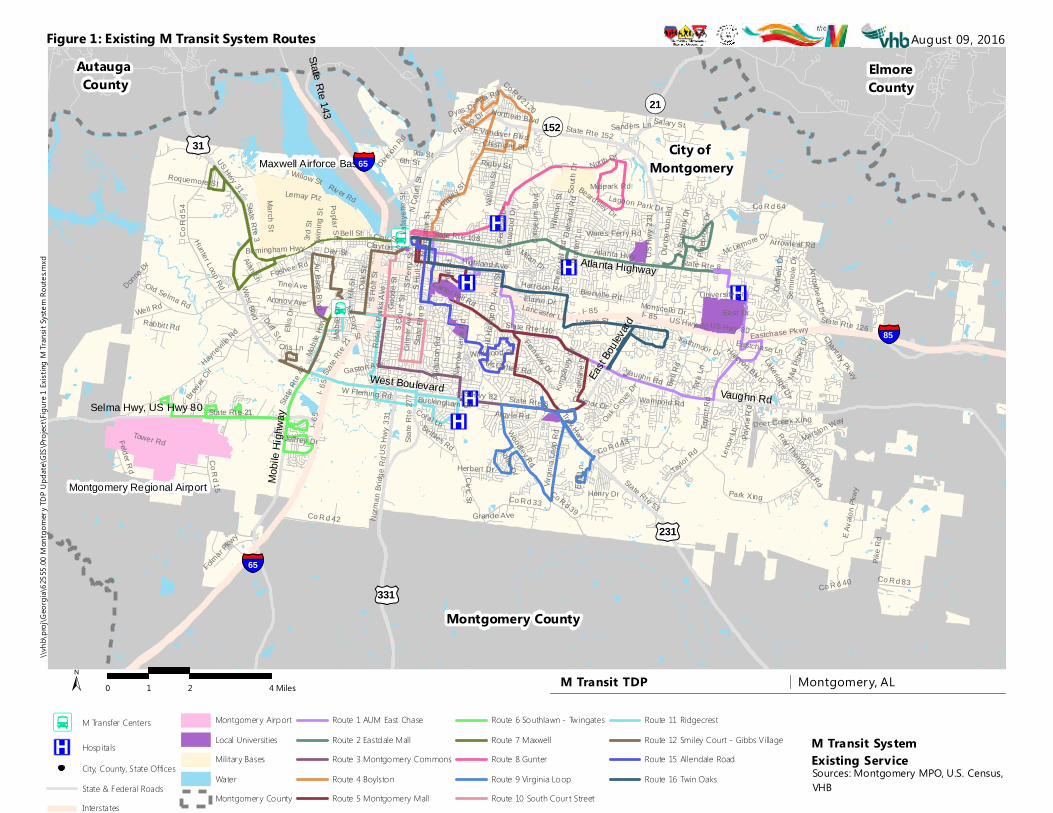
2.1 Existing System The M Transit System in Montgomery provides service Monday through
Saturday within Montgomery City limits. There are 14 fixed routes (Figure
1) with complementary paratransit service available within the City of
Montgomery limits. The M Transit System provides connections
throughout the City through two transfer centers located at the
intersection of W. Fairview Avenue and Mobile Highway (2346 West
Fairview Avenue) as well as Water Street and Molton Street downtown
(495 Molton Street).
All routes connect to one of these transfer centers except Route 9 which
provides a loop around Trenholm State Community college, Montgomery
Town Center, and surrounding neighborhoods with opportunities for a
free transfer at the One Center.
The M Transit System provides critical mobility options to those in
neighborhoods that tend to be lower income and are more dependent on
transit services, as well as local universities, hospitals, shopping
destinations such as East Chase shopping center, and connections to the
Montgomery Regional Airport. Services also provide access to the
Maxwell Gunter Airforce Base main campus and annex, located on
separate sides of the City.
Fares for the system are $2.00 for a one-way trip with free transfers at the
transfer centers between routes. The system operates with a pulse
schedule, where multiple routes pull into the transfer centers at the same
time and allow transfers for rides. However, not all routes are operating
on the same pulse schedule so some rider must wait at the transfer
centers for their desired bus.
Montgomery Transit Development Plan Update 2017-2021
3
While the M Transit System does have designated stop locations with
signs, schedules, benches, and/or shelters, this system is unique in that it
also picks up at flagged stops. Anyone can hail the bus along its
designated fixed alignment and if the bus driver deems it safe to stop, the
bus will stop and pick-up that passenger. While this makes it convenient
for riders, this can cause travel time issues if there are a lot of pickups
located close to each other, as well as potential safety issues with riders
desiring to board in unsafe locations. The final report will analyze how the
flagger system is affecting the M Transit System and identify any
associated recommendations.
The City of Montgomery provides the local match for federal capital and
operating expenses from its general fund.
2.2 Existing Contract The M Transit System is owned by the City of Montgomery. Management
and operations services are contracted out to First Transit. First Transit
receives an annual fee of $285,000 for managing the service in addition to
the operations costs for providing service and maintaining the vehicles
and facilities. All equipment, facilities, and vehicles are owned by the City
of Montgomery.
®v
®v
®v
®v
®v
®v®v
¾¿
¾¿
Montgomery County
Autauga County
ElmoreCounty
City of Montgomery
¬«152
East B
oulev
ard
£¤231
West Boulevard
Mobil
e High
way
£¤31
Vaughn Rd
¬«21
£¤331
State Rte 143
Atlanta Highway
Selma Hwy, US Hwy 80
I- 85I- 6
5
US Hwy 82 State Rte 6State Rte 21
State Rte 8
West Blvd
State
Rte 9
US H
wy 23
1
US Hwy 31State Rte 3
US Hwy 80
Bell R
d
State Rte 110
Vaughn Rd
Co R d 43
State Rte 53
Taylo
r Rd
Woodley Rd
Atlanta Hwy
State Rte 152
Northern Blvd
Co R
d 54
S Cou
rt St
Bell St
Troy HwyNa
rrow
Lane
Rd
Wares Ferry Rd
Norm
an B
ridge
Rd
S Perr
y St
Oak S
t
Park Xing
State
Rte 4
2
Hill S
t
Co R d 42
State Rte 108
Hall S
t
Hunter Loop Rd
Birmingham Hwy
Ann S
t
Colis
eum
Blvd
US H
wy 33
1Ro
sa L
Parks
Ave
Carter Hill Rd
River Rd
Co Rd 15
Co R d 33
March St
Old Selma Rd
N Co
urt S
t
Fede
ral D
r
Foshee Rd
Mobile
Hwy
S Hull
St
Hayneville
Rd
Co Rd 39
McGehee Rd
Forbes Dr
State
Rte 2
77
McLemore Dr
Air Base Blvd
Highland Ave
S Holt
St
Day St
Gilm
er Av
e
Gaston Ave
Perry
Hill
Rd
N Ripley S
t
Virgin
ia Lo
op R
dTower Rd
Eastchase PkwyWell Rd
N De
catur
St
Ray Thorington Rd
Tine Ave
Dalra
ida R
d
Fernway Dr
Rigby St
Co R d 83
Roquemore St
Duff St
Harrison Rd
6th St
Seibles Rd
W Fleming Rd
N Bu
rbank
Dr
Ellis
Dr
Fairla
ne D
r
Arrowhead DrGood
e St
Co Rd 2120
Audu
bon R
d
Hillm
an S
t
Folmar Pkwy
Chisholm St
Semi
nole
Dr
Wille
na S
t
3rd St
Halcyon Blvd
Beardsley Dr
Payn
e Rd
Felder Rd
Pineb
rook D
r
Buckingham Dr
Bienville Rd Oldfi
eld D
r
Co R d 64
Milan Dr
Clay St
University Dr
Mobil
e Dr
Poplar St
Lakeridge D r
Dunb
arton
Rd
Monticello Dr
Pike R
d
Eric
Ln
Kingsb
ury Dr
Adler Dr
Lemay Plz
Bran
twoo
d Dr
Rabbit t Rd
Clayton St
Eastchase Ln
Aronov Ave
Alta Rd
Marston Way
Lancaster LnTw
ining
St
Lagoon Park Dr
Otis Ln
Tara L
n
Jeffrey Dr
Midpark Rd
East Dr
Sanders Ln
Herbert Dr
South
Dr
Henry Dr
Leno
x Ln
Co R d 40
Argy le R d
Wildwood DrHill H
edge
Dr
Salary St
Lafay
ette S
t
Chant illy Pkwy
Lomac St
North Dr
Arrowleaf Rd
Oak Grov
e Dr
E Vandiver Blvd
Willow St
9th St
Kathmoor Dr
State Rte 126
Wampold Rd
Hunte
r Ln
Donna Dr
Deer Creek Xing
Dyas Dr
Calmar Dr
Grande Ave
Elaine Dr
Civic St
Div ision
RdCoral Ln
E Ava
lon P
kwy
Mid Pi
nes D
r
McElvy St
Alan Ln
Brewer C
ir State R
te 21
I- 65
US Hwy 80I- 85
Taylor Rd
Montgomery Regional Airport
Maxwell Airforce Base
logos
M Transit TDP Montgomery, AL
M Transit SystemExisting ServiceSources: Montgomery MPO, U.S. Census, VHB
± 0 2 41 Miles
August 09, 2016\\v
hb\p
roj\G
eorg
ia\62
555.0
0 Mon
tgom
ery T
DP U
pdate
\GIS\
Projec
t\Figu
re 1 E
xistin
g M
Trans
it Sy
stem
Route
s.mxd
¾¿ M Transfer Centers
®v Hospitals
City, County, State OfficesState & Federal RoadsInterstates
Montgomery AirportLocal UniversitiesMilitary BasesWaterMontgomery County
Route 1 AUM East ChaseRoute 2 Eastdale MallRoute 3 Montgomery CommonsRoute 4 BoylstonRoute 5 Montgomery Mall
Route 6 Southlawn - TwingatesRoute 7 MaxwellRoute 8 GunterRoute 9 Virginia LoopRoute 10 South Cour t Street
Route 11 RidgecrestRoute 12 Smiley Court - Gibbs VillageRoute 15 Allendale RoadRoute 16 Twin Oaks
§̈¦85
§̈¦65
§̈¦65
Figure 1: Existing M Transit System Routes
Montgomery Transit Development Plan Update 2017-2021
5
3 Review of Previous Studies
3.1 Introduction The purpose of this section is to review policy documents relevant to the
update of The M Transit’s Transit Development Plan. In coordination with
the client, it was determined the following documents would be reviewed
as part of this effort:
2009-2013 Transit Development Plan (TDP)
Montgomery Transit Needs Assessment in the 2030 Long Range
Transportation Plan (LRTP)
Montgomery MPO 2040 Long Range Transportation Plan (LRTP)
2012 Montgomery MPO Bicycle and Pedestrian Plan
Montgomery Congestion Management Program (2014-2018)
The subsections that follow describe the overall purpose of these
documents and the relevance of their recommendations to developing
goals and recommendations for transit mobility in Montgomery.
3.2 TDP 2009-2013 The 2009-2012 Transit Development Plan (TDP) was completed in
September 2008. Based on transit services and demographic
characteristics in 2008, the TDP provided a performance review of existing
transit routes to develop a set of recommendations for more efficient
services throughout the system. The primary means of determining
transit needs was through an assessment of service trends with respect to
servicing specific demographics and employment, the conducting of
surveys, and an inventory of performance characteristics.
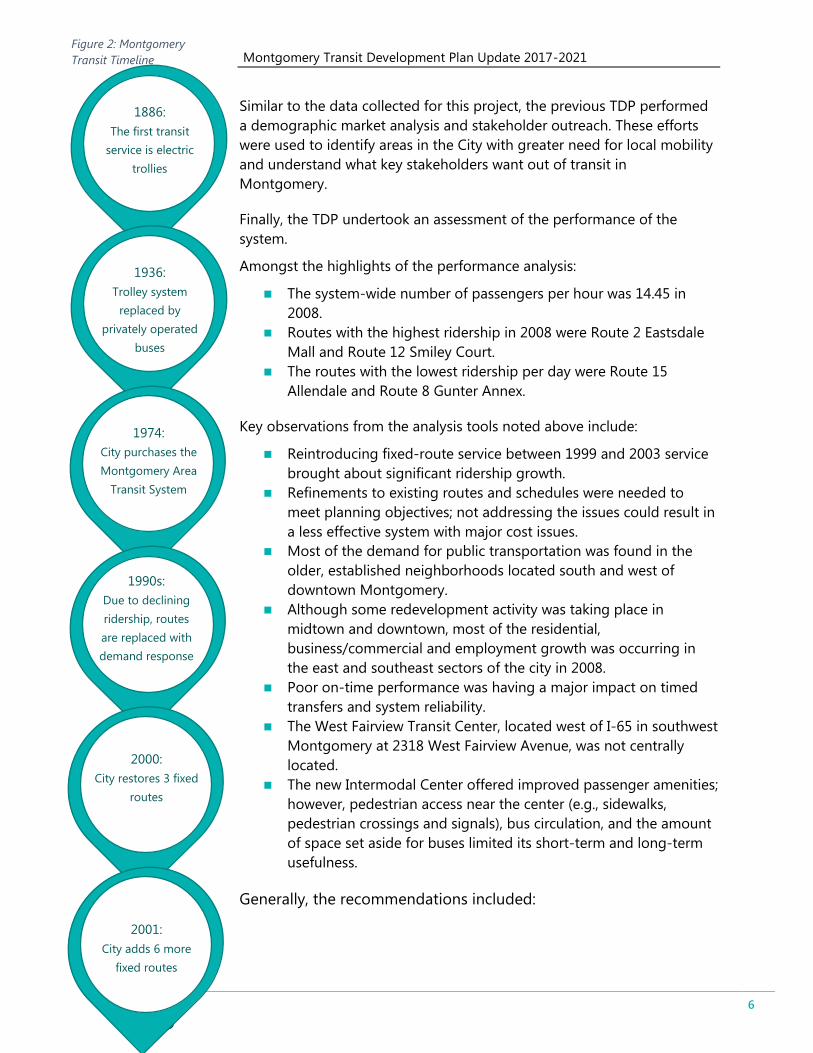
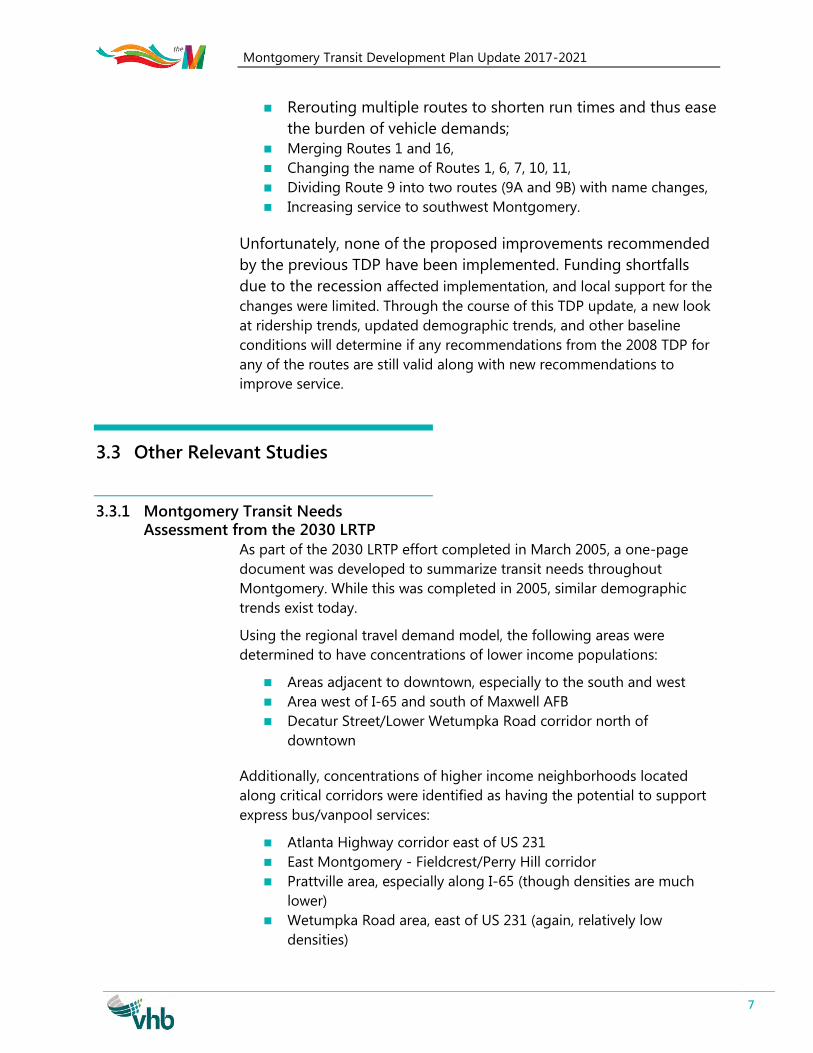
One item included within the previous TDP was a historical perspective of
transit service with Montgomery. Highlights are included in Figure 2.
Montgomery Transit Development Plan Update 2017-2021
6
Similar to the data collected for this project, the previous TDP performed
a demographic market analysis and stakeholder outreach. These efforts
were used to identify areas in the City with greater need for local mobility
and understand what key stakeholders want out of transit in
Montgomery.
Finally, the TDP undertook an assessment of the performance of the
system.
Amongst the highlights of the performance analysis:
The system-wide number of passengers per hour was 14.45 in
2008.
Routes with the highest ridership in 2008 were Route 2 Eastsdale
Mall and Route 12 Smiley Court.
The routes with the lowest ridership per day were Route 15
Allendale and Route 8 Gunter Annex.
Key observations from the analysis tools noted above include:
Reintroducing fixed-route service between 1999 and 2003 service
brought about significant ridership growth.
Refinements to existing routes and schedules were needed to
meet planning objectives; not addressing the issues could result in
a less effective system with major cost issues.
Most of the demand for public transportation was found in the
older, established neighborhoods located south and west of
downtown Montgomery.
Although some redevelopment activity was taking place in
midtown and downtown, most of the residential,
business/commercial and employment growth was occurring in
the east and southeast sectors of the city in 2008.
Poor on-time performance was having a major impact on timed
transfers and system reliability.
The West Fairview Transit Center, located west of I-65 in southwest
Montgomery at 2318 West Fairview Avenue, was not centrally
located.
The new Intermodal Center offered improved passenger amenities;
however, pedestrian access near the center (e.g., sidewalks,
pedestrian crossings and signals), bus circulation, and the amount
of space set aside for buses limited its short-term and long-term
usefulness.
Generally, the recommendations included:
Figure 2: Montgomery
Transit Timeline
1886:
The first transit
service is electric
trollies
1936:
Trolley system
replaced by
privately operated
buses
1974:
City purchases the
Montgomery Area
Transit System
1990s:
Due to declining
ridership, routes
are replaced with
demand response
2000:
City restores 3 fixed
routes
2001:
City adds 6 more
fixed routes
Montgomery Transit Development Plan Update 2017-2021
7
Rerouting multiple routes to shorten run times and thus ease
the burden of vehicle demands;
Merging Routes 1 and 16,
Changing the name of Routes 1, 6, 7, 10, 11,
Dividing Route 9 into two routes (9A and 9B) with name changes,
Increasing service to southwest Montgomery.
Unfortunately, none of the proposed improvements recommended
by the previous TDP have been implemented. Funding shortfalls
due to the recession affected implementation, and local support for the
changes were limited. Through the course of this TDP update, a new look
at ridership trends, updated demographic trends, and other baseline
conditions will determine if any recommendations from the 2008 TDP for
any of the routes are still valid along with new recommendations to
improve service.
3.3 Other Relevant Studies
3.3.1 Montgomery Transit Needs Assessment from the 2030 LRTP
As part of the 2030 LRTP effort completed in March 2005, a one-page
document was developed to summarize transit needs throughout
Montgomery. While this was completed in 2005, similar demographic
trends exist today.
Using the regional travel demand model, the following areas were
determined to have concentrations of lower income populations:
Areas adjacent to downtown, especially to the south and west
Area west of I-65 and south of Maxwell AFB
Decatur Street/Lower Wetumpka Road corridor north of
downtown
Additionally, concentrations of higher income neighborhoods located
along critical corridors were identified as having the potential to support
express bus/vanpool services:
Atlanta Highway corridor east of US 231
East Montgomery - Fieldcrest/Perry Hill corridor
Prattville area, especially along I-65 (though densities are much
lower)
Wetumpka Road area, east of US 231 (again, relatively low
densities)
Montgomery Transit Development Plan Update 2017-2021
8
Major (non-retail) employment centers were identified as potential
destinations of express bus/vanpool service using the regional travel
demand model. This assessment identified the following areas:
Primary concentration: Downtown Montgomery (107 non-retail
jobs/acre in 14-TAZ area bounded by I-85, Court, Madison,
Jackson)
Secondary concentration: Forest Avenue at I-85, just southeast of
Downtown (51 non-retail jobs/acre in 1 TAZ)
Secondary concentration: Gunter Industrial Park in northeast
Montgomery (11 non-retail jobs/acre in 1 TAZ)
Secondary concentration: US 80 (South Boulevard) at Woodley
Road (23 non-retail jobs/acre in 2 TAZs)
This assessment noted that the need for improved transit service was
greatest along corridors that were expected to experience severe
congestion. Major commute corridors expected to operate primarily at
LOS F include:
I-85 from Atlanta Highway to Downtown Montgomery
SW commute corridor: US 82 from McGehee Road to Carter Hill
Road
Eastern/Northern Boulevard from US 231 to Norman Bridge Road
Other corridors that will be approaching LOS F: Atlanta Highway, I-
65 North, US 231 Eastern Boulevard to Wetumpka Road.
Based on the demographic analyses completed, preliminary findings from
the 2030 LRTP regarding transit needs included:
Low income areas were generally served by existing bus routes,
but could benefit from improved service/frequency.
The opportunity exists for express bus service from major
middle/high income areas to downtown Montgomery, particularly
along corridors expected to operate primarily at LOS F, however
some of these areas fall outside of the city limits.
The opportunity exists for vanpool service from middle/high
income areas to secondary non-retail employment centers (Gunter
Park, Forest Avenue, and Woodley Road).
The Forest Avenue area could also serve as a stop along express
bus service to downtown given its central location.
3.3.2 Montgomery MPO 2040 Long Range Transportation Plan Update
The 2040 LRTP adopted in 2015 serves as the overall transportation policy
document for the Montgomery region. It identifies long-range and short-
Montgomery Transit Development Plan Update 2017-2021
9
range multimodal strategies to improve mobility and presents a
financially-constrained improvement program based on projected
funding through 2040.
The portions of the 2040 LRTP most relevant to this TDP update include:
Identification of funding allocations for transit through 2040,
Visionary projects through 2040,
LRTP goals, and
Socioeconomic information regarding potential transit dependent
populations.
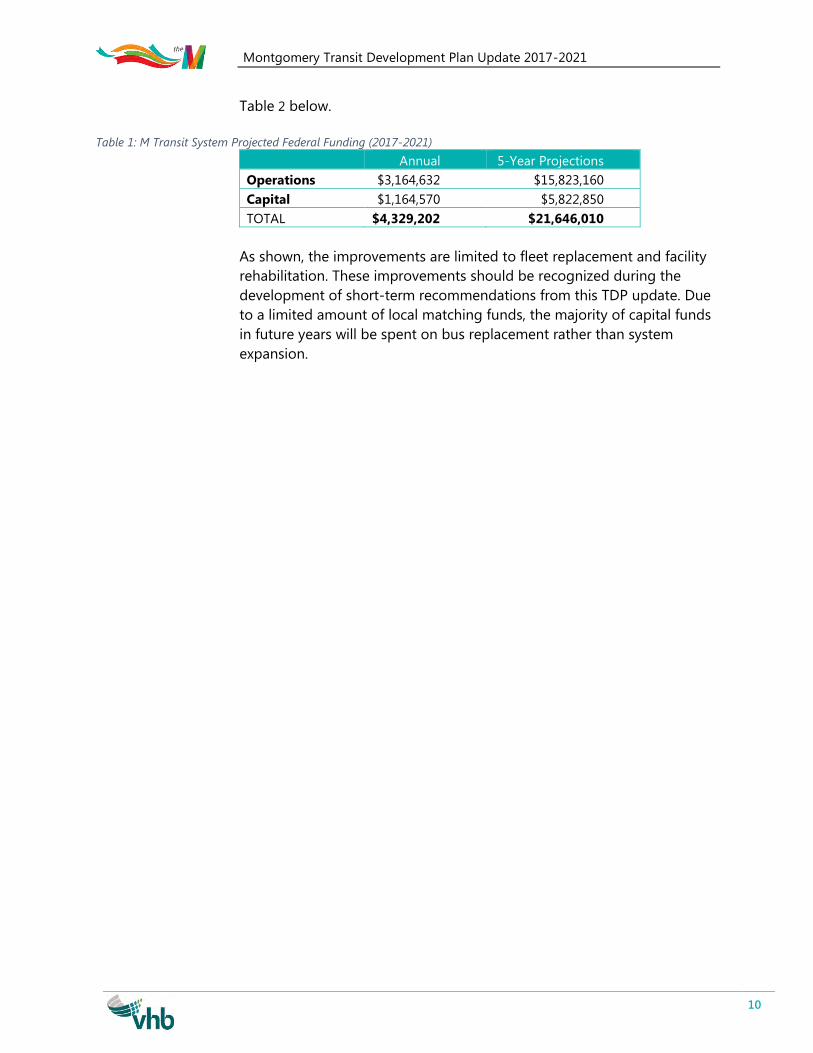
Pursuant to the 2040 LRTP, the Montgomery MPO is projected to receive
federal funding totaling approximately $108.2 million, or $4,329,202
annually, through the year 2040. Given the TDP’s short-term focus, the
amount of federal funding through 2021 is most relevant. A breakdown of
operations and capital expenditures of annual funds and those expected
during the TDP’s five-year horizon period (2017-2021) is provided in Table
1. As shown, The M Transit is projected to receive approximately $21.6 M
in federal funds through 2021. Transit projects included the LRTP are
listed in
Montgomery Transit Development Plan Update 2017-2021
10
Table 2 below.
Table 1: M Transit System Projected Federal Funding (2017-2021)
Annual 5-Year Projections
Operations $3,164,632 $15,823,160
Capital $1,164,570 $5,822,850
TOTAL $4,329,202 $21,646,010
As shown, the improvements are limited to fleet replacement and facility
rehabilitation. These improvements should be recognized during the
development of short-term recommendations from this TDP update. Due
to a limited amount of local matching funds, the majority of capital funds
in future years will be spent on bus replacement rather than system
expansion.
Montgomery Transit Development Plan Update 2017-2021
11
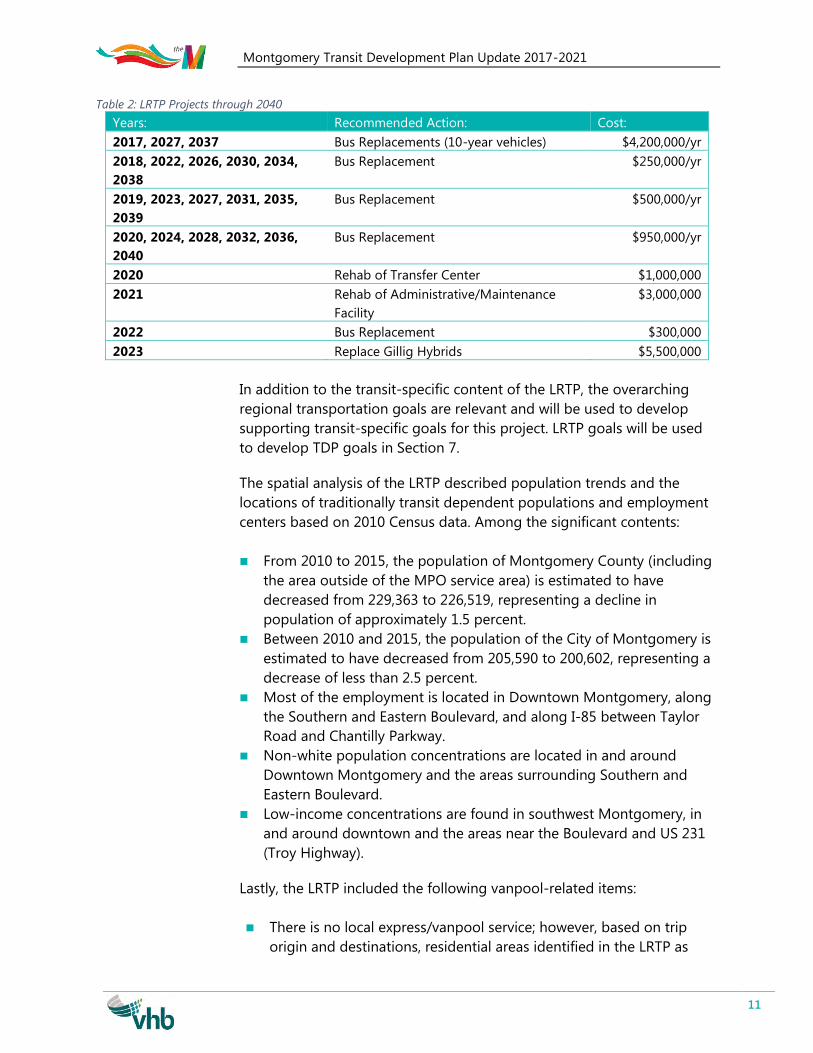
Table 2: LRTP Projects through 2040
Years: Recommended Action: Cost:
2017, 2027, 2037 Bus Replacements (10-year vehicles) $4,200,000/yr
2018, 2022, 2026, 2030, 2034,
2038
Bus Replacement $250,000/yr
2019, 2023, 2027, 2031, 2035,
2039
Bus Replacement $500,000/yr
2020, 2024, 2028, 2032, 2036,
2040
Bus Replacement $950,000/yr
2020 Rehab of Transfer Center $1,000,000
2021 Rehab of Administrative/Maintenance
Facility
$3,000,000
2022 Bus Replacement $300,000
2023 Replace Gillig Hybrids $5,500,000
In addition to the transit-specific content of the LRTP, the overarching
regional transportation goals are relevant and will be used to develop
supporting transit-specific goals for this project. LRTP goals will be used
to develop TDP goals in Section 7.
The spatial analysis of the LRTP described population trends and the
locations of traditionally transit dependent populations and employment
centers based on 2010 Census data. Among the significant contents:
From 2010 to 2015, the population of Montgomery County (including
the area outside of the MPO service area) is estimated to have
decreased from 229,363 to 226,519, representing a decline in
population of approximately 1.5 percent.
Between 2010 and 2015, the population of the City of Montgomery is
estimated to have decreased from 205,590 to 200,602, representing a
decrease of less than 2.5 percent.
Most of the employment is located in Downtown Montgomery, along
the Southern and Eastern Boulevard, and along I-85 between Taylor
Road and Chantilly Parkway.
Non-white population concentrations are located in and around
Downtown Montgomery and the areas surrounding Southern and
Eastern Boulevard.
Low-income concentrations are found in southwest Montgomery, in
and around downtown and the areas near the Boulevard and US 231
(Troy Highway).
Lastly, the LRTP included the following vanpool-related items:
There is no local express/vanpool service; however, based on trip
origin and destinations, residential areas identified in the LRTP as
Montgomery Transit Development Plan Update 2017-2021
12
potential origin areas include Wetumpka, Prattville, and Pike Road –
all of which are outside of the M service area. Potential destinations
identified included Downtown Montgomery, east Montgomery,
Airport and the Industrial area off of I-65 in southwest Montgomery.
CommuteSmart is a program that coordinates car/vanpools between
and within the metropolitan areas of the state of Alabama.
Car/vanpools travel to and from Montgomery every day. Currently,
345 persons from the Montgomery area are in the rideshare
database, 10 persons vanpool from Montgomery to Birmingham and
60 persons vanpool from Birmingham to Montgomery.
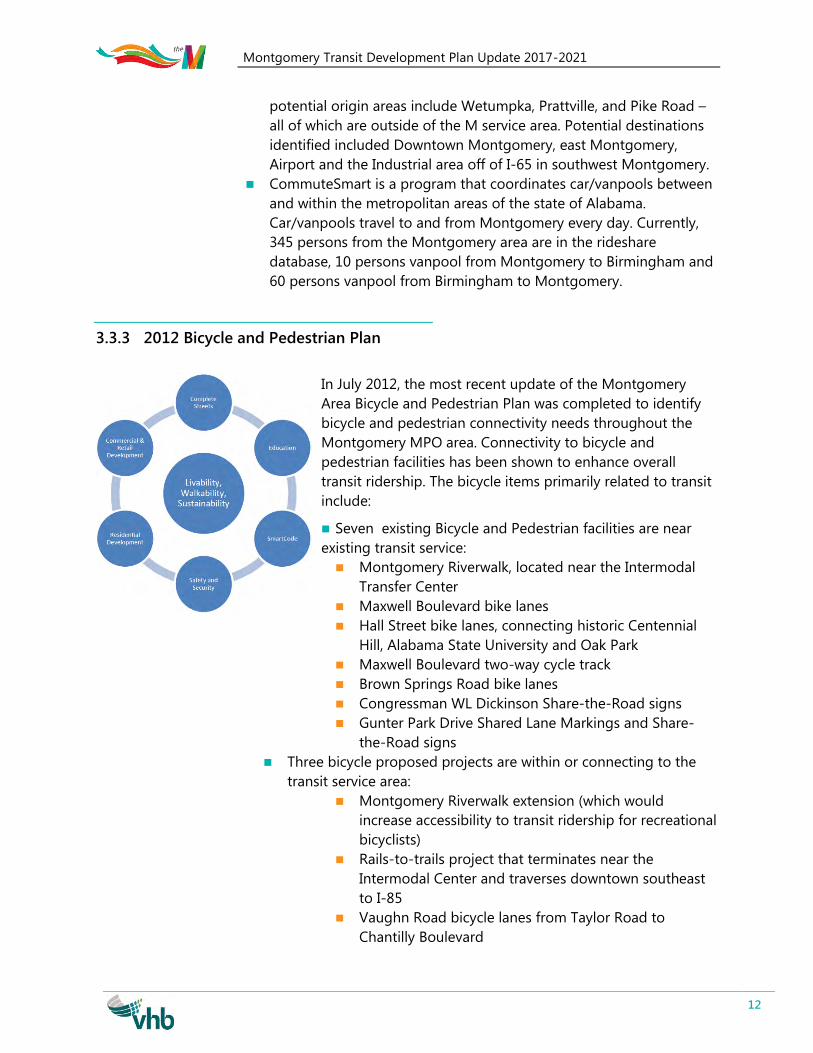
3.3.3 2012 Bicycle and Pedestrian Plan
In July 2012, the most recent update of the Montgomery
Area Bicycle and Pedestrian Plan was completed to identify
bicycle and pedestrian connectivity needs throughout the
Montgomery MPO area. Connectivity to bicycle and
pedestrian facilities has been shown to enhance overall
transit ridership. The bicycle items primarily related to transit
include:
Seven existing Bicycle and Pedestrian facilities are near
existing transit service:
Montgomery Riverwalk, located near the Intermodal
Transfer Center
Maxwell Boulevard bike lanes
Hall Street bike lanes, connecting historic Centennial
Hill, Alabama State University and Oak Park
Maxwell Boulevard two-way cycle track
Brown Springs Road bike lanes
Congressman WL Dickinson Share-the-Road signs
Gunter Park Drive Shared Lane Markings and Share-
the-Road signs
Three bicycle proposed projects are within or connecting to the
transit service area:
Montgomery Riverwalk extension (which would
increase accessibility to transit ridership for recreational
bicyclists)
Rails-to-trails project that terminates near the
Intermodal Center and traverses downtown southeast
to I-85
Vaughn Road bicycle lanes from Taylor Road to
Chantilly Boulevard
Montgomery Transit Development Plan Update 2017-2021
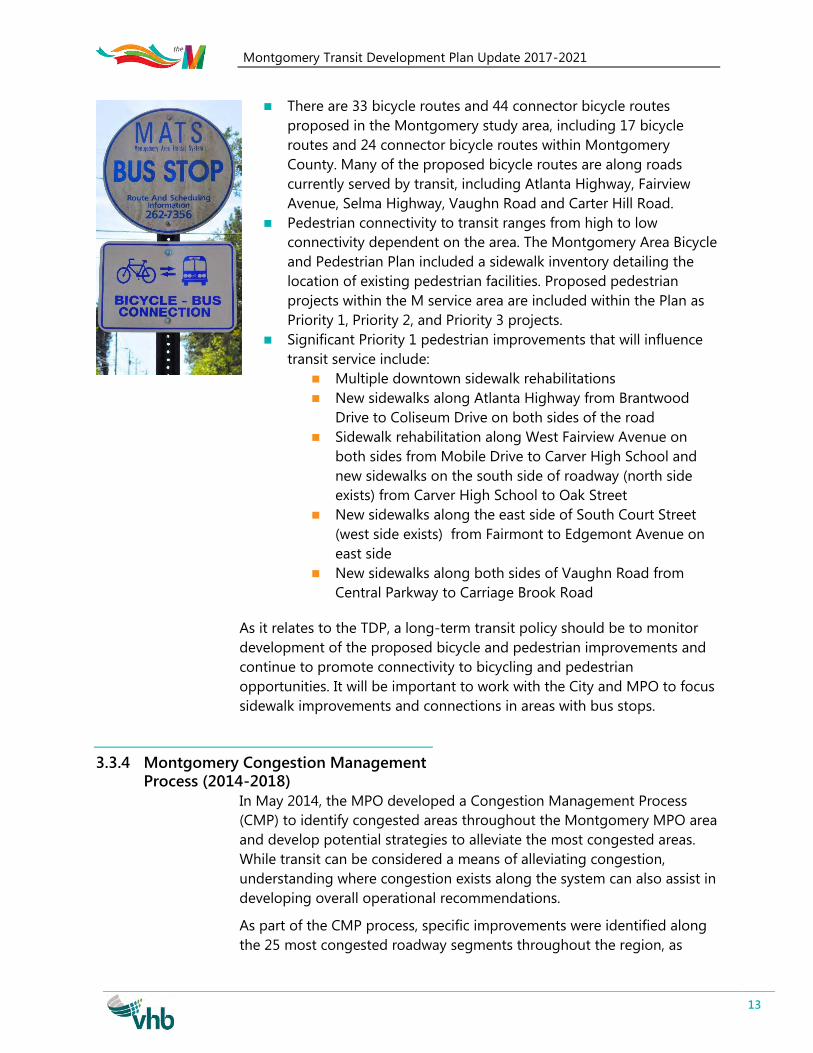
13
There are 33 bicycle routes and 44 connector bicycle routes
proposed in the Montgomery study area, including 17 bicycle
routes and 24 connector bicycle routes within Montgomery
County. Many of the proposed bicycle routes are along roads
currently served by transit, including Atlanta Highway, Fairview
Avenue, Selma Highway, Vaughn Road and Carter Hill Road.
Pedestrian connectivity to transit ranges from high to low
connectivity dependent on the area. The Montgomery Area Bicycle
and Pedestrian Plan included a sidewalk inventory detailing the
location of existing pedestrian facilities. Proposed pedestrian
projects within the M service area are included within the Plan as
Priority 1, Priority 2, and Priority 3 projects.
Significant Priority 1 pedestrian improvements that will influence
transit service include:
Multiple downtown sidewalk rehabilitations
New sidewalks along Atlanta Highway from Brantwood
Drive to Coliseum Drive on both sides of the road
Sidewalk rehabilitation along West Fairview Avenue on
both sides from Mobile Drive to Carver High School and
new sidewalks on the south side of roadway (north side
exists) from Carver High School to Oak Street
New sidewalks along the east side of South Court Street
(west side exists) from Fairmont to Edgemont Avenue on
east side
New sidewalks along both sides of Vaughn Road from
Central Parkway to Carriage Brook Road
As it relates to the TDP, a long-term transit policy should be to monitor
development of the proposed bicycle and pedestrian improvements and
continue to promote connectivity to bicycling and pedestrian
opportunities. It will be important to work with the City and MPO to focus
sidewalk improvements and connections in areas with bus stops.
3.3.4 Montgomery Congestion Management Process (2014-2018)
In May 2014, the MPO developed a Congestion Management Process
(CMP) to identify congested areas throughout the Montgomery MPO area
and develop potential strategies to alleviate the most congested areas.
While transit can be considered a means of alleviating congestion,
understanding where congestion exists along the system can also assist in
developing overall operational recommendations.
As part of the CMP process, specific improvements were identified along
the 25 most congested roadway segments throughout the region, as
Montgomery Transit Development Plan Update 2017-2021
14
highlighted in red in Figure 3. Of these 25 segments, those currently
served by transit included:
Taylor Road from I-85 to East Chase Parkway (Route 1)
Atlanta Highway from South Burbank Drive and East Boulevard
(Route 2)
South Boulevard from Narrow Lane Road to Troy Highway/US 231
(Routes 3 and 9)
Carter Hill Road from McGhee to Vaughn Road (Route 5)
Roadway improvements along existing routes can help with both
reliability and travel time along the corridor to improve on time
performance. Furthermore, the CMP recommended the following
congested segments for bus service and operations improvements (in
addition to other enhancements):
Atlanta Highway from South Burbank Drive and East Boulevard
(Route 2)
Carter Hill Road from McGhee to Vaughn Road (Route 5)
Perry Hill Road from Atlanta Highway to I-85 (Not currently
served)
Lastly, two congested segments outside the transit service area (located in
Prattville) that were recommended for transit and ridesharing programs
amongst other improvements were:
Cobbs Ford Road from US 82 to I-65
East Main Street from US 82 to Greystone Way
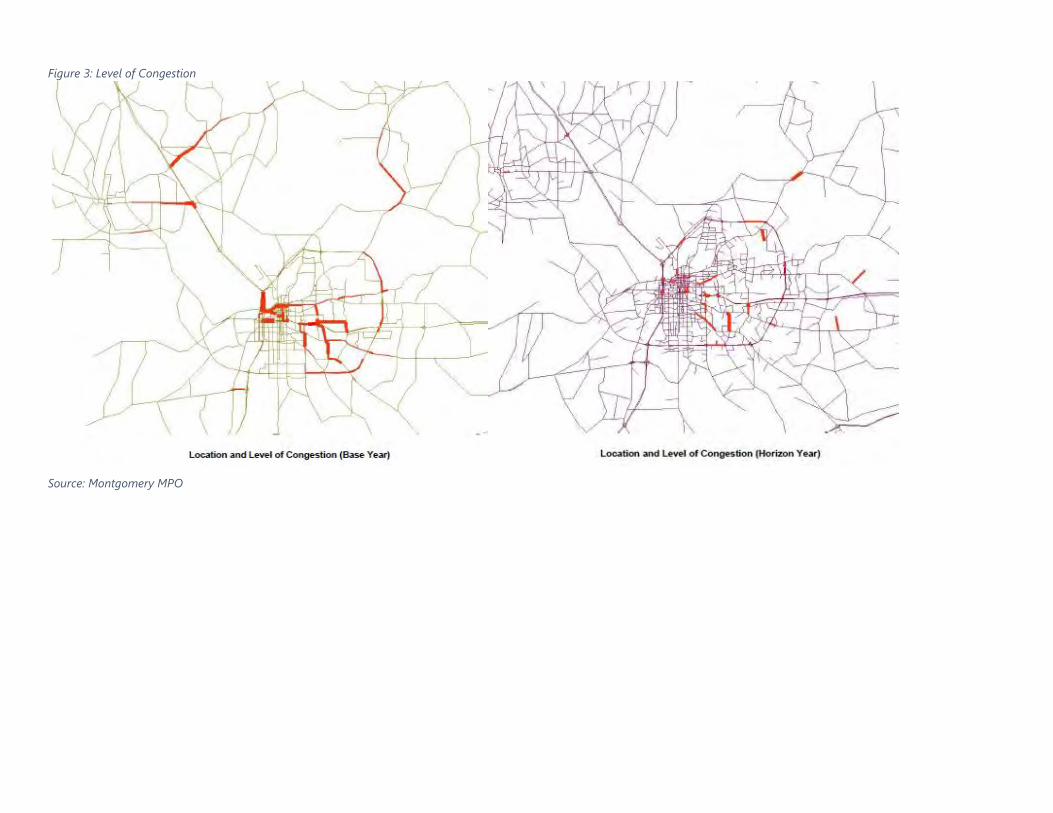
Figure 3: Level of Congestion
Source: Montgomery MPO
Montgomery Transit Development Plan Update 2017-2021
16
3.4 Key Takeaways for TDP Update Moving forward in the TDP update, the following major findings from
relevant studies should be considered:
The previous TDP identified certain M routes that performed
poorly when compared to the rest of the system that are still in
operation – particularly Routes 7 Maxwell, 9 Virginia Loop, 1 AUM
Campus, 8 Gunter Annex, and 15 Allendale. Routing changes were
recommended to all but Route 15 to correct these issues (2009-
2012 TDP).
The most notable takeaway from the review of previous studies is
the lack of significant changes to the demographic characteristics
in the Montgomery area since the completion of the previous TDP.
The population for the area has remained the same, the
concentrations of low-income populations also appear to be
unchanged, and many of the employment centers within the area
have not shifted. Depending on the results of the baseline
conditions assessment and system performance evaluations, these
factors serve as an initial indication that many of the
recommendations from the previous TDP – based in part on
similar characteristics - may still be relevant. This is particularly
true if the same performance has remained consistent with that
reported in the previous TDP (2009-2012 TDP, 2040 LRTP).
The M is projected to receive a total of $21.6 M in federal aid
through 2021 and all of the transit projects identified in the 2040
LRTP are associated with bus replacement and rehabilitation of
facilities. One of the primary objectives of this TDP update is to
investigate the best uses for these funds moving forward (2040
LRTP Update).
There are several bicycle routes and planned pedestrian
improvements along existing bus routes. The potential for the
placement of bicycle and pedestrian amenities along existing
routes suggests a need for coordination with respect to the
placement of stop amenities such as shelters, wayfinding, etc. to
maximize City investments. This also suggests a need for
educational programs to promote the connection between
bicycling and transit moving forward (2012 Bicycle and Pedestrian
Plan).
Analysis has shown that the best origins for local express/bus
vanpools are from outside of the City (Wetumpka, Prattville, and
Pike Road) to locations inside the City. This is somewhat consistent
with the findings from the 2030 LRTP assessment. Regardless, this
trend reinforces the need for interjurisdictional coordination to
Montgomery Transit Development Plan Update 2017-2021
17
implement intra-regional commuter-related services such as
express bus and/or vanpools (2030 LRTP, 2040 LRTP).
Routes 2, 3, 5, and 9 all traverse roadway segments identified as
needing congestion relief strategies. Given that bus transit is
susceptible to the same congestion as general traffic, peak hour
operation modifications may be needed for these routes
(Montgomery CMP).
Montgomery Transit Development Plan Update 2017-2021
18
4 Public & Stakeholder
Engagement
4.1 Public Engagement Objectives To fully capture the issues, needs, and context around developing service
recommendations for the M Transit System, the following are objectives
of the public involvement process:
Engage the general public through open house meetings,
Engage current transit riders to identify issues and successes with
current service,
Engage drivers and system operators to understand where there
are issues in the system;
Engage Key Decision-Makers, including City council members, the
mayor, City department heads, and the MPO director, and
Engage community stakeholders through focus groups to identify
their individual and agency mobility needs
4.2 Public Engagement Activities To engage as many stakeholders as possible, public engagement activities
were conducted through various media. This included public meetings for
in-person conversations, interviews with key decision-makers, focus
groups with major transit and mobility stakeholders, and surveys for the
public that were available in both in paper format and online.
Through all of these activities, VHB was able to gather information on how
the system works, is perceived, service priorities, and what both riders and
non-riders want to see from transit in Montgomery in the future.
Montgomery Transit Development Plan Update 2017-2021
19
4.2.1 Public Open House
To directly reach transit riders and gather input, a public meeting was
held at the Intermodal Transfer Center, located on Molton Street on April
20, 2016 from 5:30 PM to 7:00 PM. The project team, accompanied by City
of Montgomery Planning Staff, were on hand to solicit feedback from
citizens and riders on ways to provide more efficient transportation in the
City of Montgomery and to receive feedback on ways to improve existing
service. The team discussed the study and distributed Project Fact Sheets
to approximately 30 riders in the bus waiting area, bus boarding area and
Intermodal Transfer Center.
Almost without exception, the participants advocated for more public
transportation, even while recognizing the severe constraints on resources
available to fund such expansion. More service for the transit-dependent
population was especially encouraged to provide critical access to jobs,
training, recreational activities, medical and other essential services.
Commuter service from nearby towns and cities was proposed by
attendees. The need to extend operating hours was also identified as
critical because, while some employees can get to work on transit, they
can’t get back home because the bus stops running before their shift
ends, rendering transit of limited value to these workers.
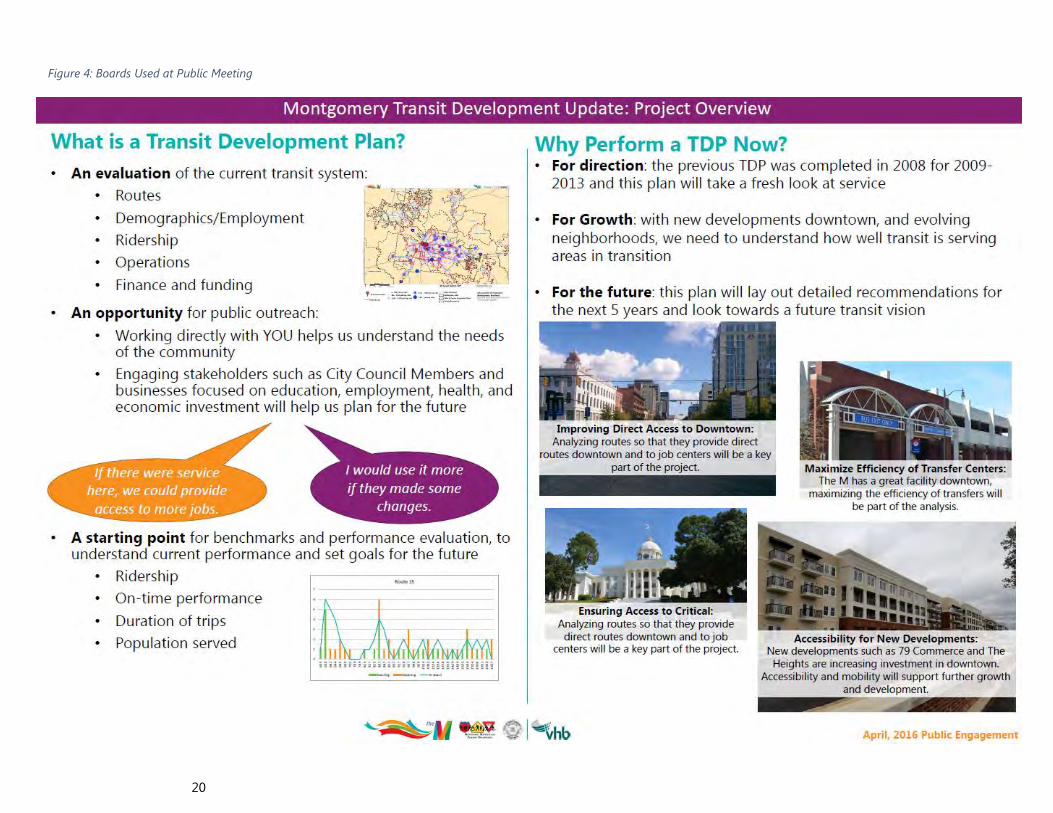
Attendees of the open house meeting were given the opportunity to
provide input on open-ended comment cards. These cards were also
distributed through the transfer centers and to various stakeholders. The
complete text of these comments can be found in Appendix A. Over 120
comment forms were collected. From the forms gathered, the comments
could be categorized into the following:
Weekend Service: This includes a desire for Sunday service as well
as earlier and later service on Saturdays. The Saturday/Sunday
service were the most frequent requests. While not as highly
requested, it was also mentioned that service on Holidays is
important to some participants.
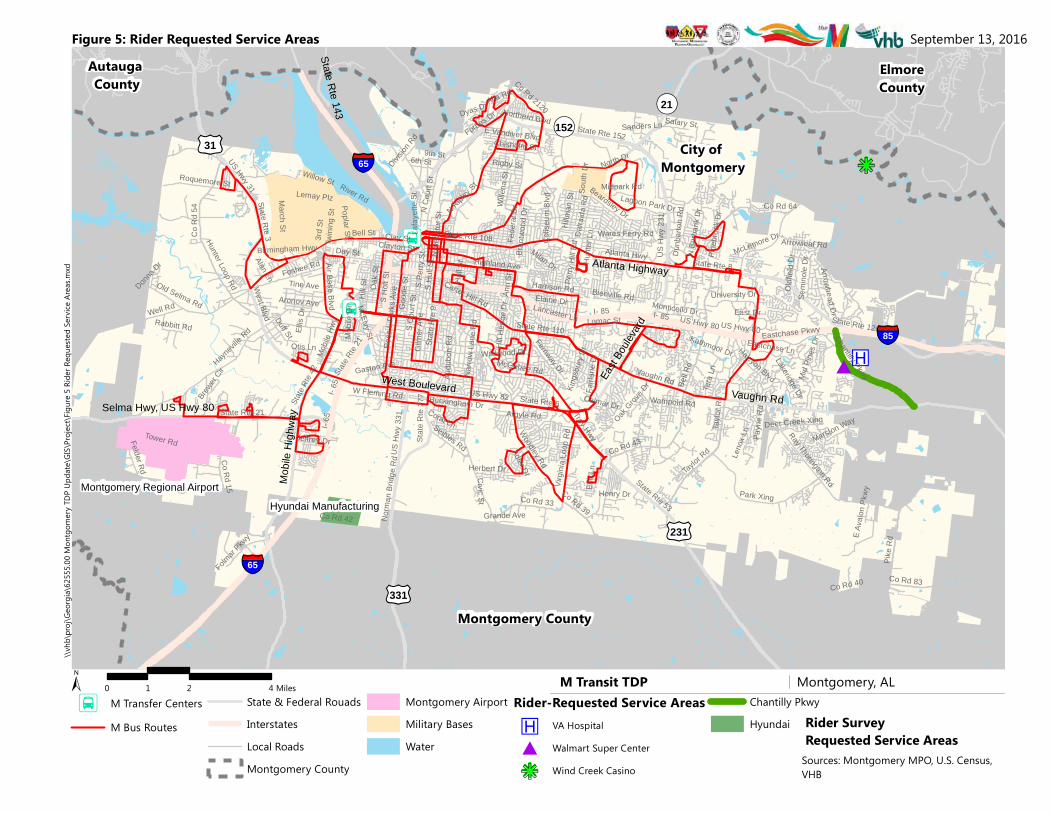
Locations: The riders of the M Transit System suggested service
expansion to many locations, but the locations mentioned the
most were Chantilly Parkway and Hyundai Boulevard, none of the
current bus routes reach that far east. Many riders would like to
reach the Hyundai Manufacturing Plant, which is located just
inside the Montgomery City boundary. These two locations were
the most requested, followed by the Wind Creek Casino, which is
located outside of City of Montgomery to the northeast.
20
Figure 4: Boards Used at Public Meeting
21
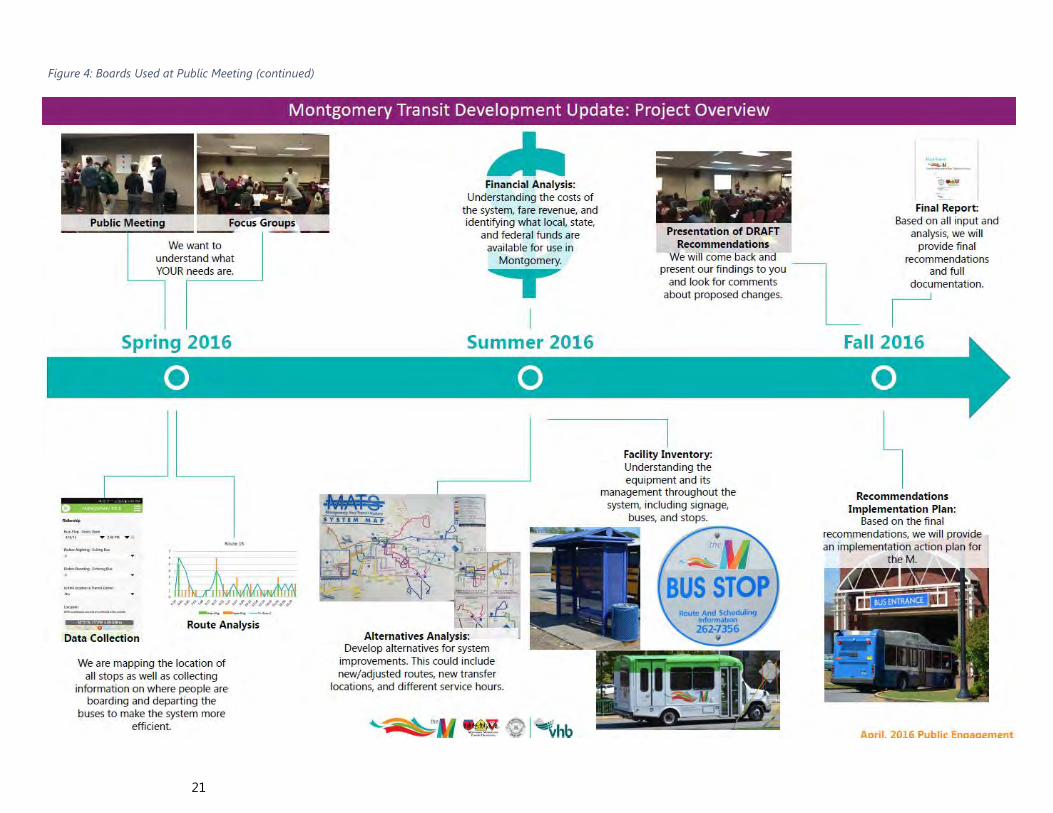
Figure 4: Boards Used at Public Meeting (continued)
¾¿
¾¿
"u#
kj
Montgomery County
Autauga County
ElmoreCounty
City of Montgomery
¬«152
East B
ouleva
rd
£¤231
West Boulevard
Mobil
e High
way
£¤31
Vaughn Rd
¬«21
£¤331
State Rte 143
Atlanta Highway
Selma Hwy, US Hwy 80
I- 85I- 6
5
US Hwy 82 State Rte 6State Rte 21
State Rte 8
West Blvd
State
Rte 9
US H
wy 23
1
US Hwy 31State Rte 3
US Hwy 80
Bell R
d
State Rte 110
Vaughn Rd
Co Rd 43
State Rte 53
Taylo
r Rd
Woodley Rd
Atlanta Hwy
State Rte 152
Northern Blvd
Co R
d 54
S Cou
rt St
Bell St
Troy HwyNa
rrow
Lane
Rd
Wares Ferry Rd
Norm
an Br
idge R
d
S Perr
y St
Oak S
t
Park Xing
State
Rte 42
Hill S
t
Co Rd 42
State Rte 108
Hall S
t
Hunter Loop Rd
Birmingham Hwy
Ann S
t
Colise
um B
lvd
US H
wy 33
1Ro
sa L
Parks
Ave Carter Hill Rd
River Rd
Co Rd 15
Co Rd 33
March St
Old Selma Rd
N Co
urt St
Fede
ral D
r
Foshee Rd
Mobile
Hwy
S Hull
St
Haynevil
le Rd
Co Rd 39
McGehee Rd
Forbes Dr
State
Rte 2
77
McLemore Dr
Air Base Blvd
Highland Ave
S Holt
St
Day St
Gilm
er Av
e
Gaston Ave
Perry
Hill R
d
N Ripley S
t
Virgin
ia Lo
op R
dTower Rd
Eastchase PkwyWell Rd
N De
catur
St
Ray Thorington Rd
Tine Ave
Dalra
ida R
d
Fernway Dr
Rigby St
Co Rd 83
Roquemore St
Duff St
Harrison Rd
6th St
Seibles Rd
W Fleming Rd
N Bu
rbank
Dr
Ellis
Dr
Fairla
ne D
r
Arrowhead DrGood
e St
Co Rd 2120
Audu
bon R
d
Hillm
an St
Folmar P
kwy
Chisholm St
Semi
nole
Dr
Wille
na S
t
3rd St
Halcyon Blvd
Beardsley Dr
Payn
e Rd
Felder Rd
Pineb
rook D
r
Buckingham Dr
Bienville Rd
Oldfi
eld D
r
Co Rd 64
Milan Dr
Clay St
University Dr
Mobil
e Dr
Poplar St
Lakeridge Dr
Dunb
arton
Rd
Monticello Dr
Pike R
d
Eric
Ln
Kings
bury
Dr
Adler Dr
Lemay Plz
Bran
twoo
d Dr
Rabbitt Rd
Clayton St
Eastchase Ln
Aronov Ave
Alta Rd
Marston Way
Lancaster LnTw
ining
St
Lagoon Park Dr
Otis Ln
Tara
Ln
Jeffrey Dr
Midpark Rd
East Dr
Sanders Ln
Herbert Dr
South
Dr
Henry Dr
Leno
x Ln
Co Rd 40
Argyle Rd
Wildwood DrHill H
edge
Dr
Salary St
Lafay
ette S
t
Chantilly Pkwy
Lomac St
North Dr
Arrowleaf Rd
Oak Grov
e Dr
E Vandiver Blvd
Willow St
9th St
Kathmoor Dr
State Rte 126
Wampold Rd
Hunte
r Ln
Donna D
r
Deer Creek Xing
Dyas Dr
Calmar Dr
Grande Ave
Elaine Dr
Civic St
Division
RdCoral Ln
E Ava
lon Pk
wy
Mid P
ines D
r
McElvy St
Alan Ln
Brewer C
ir State R
te 21
I- 65
US Hwy 80I- 85
Taylor Rd
Hyundai ManufacturingMontgomery Regional Airport
logos
M Transit TDP Montgomery, AL
Figure 5: Rider Requested Service Areas
Rider SurveyRequested Service Areas
Sources: Montgomery MPO, U.S. Census, VHB
± 0 2 41 Miles
September 13, 2016\\v
hb\p
roj\G
eorgi
a\625
55.00
Mon
tgome
ry TD
P Upd
ate\G
IS\Pro
ject\F
igure
5 Ride
r Req
ueste
d Serv
ice Ar
eas.m
xd
¾¿ M Transfer CentersM Bus Routes
State & Federal RouadsInterstatesLocal RoadsMontgomery County
Montgomery AirportMilitary BasesWater
Rider-Requested Service Areas"u VA Hospital
# Walmart Super Center
kj Wind Creek Casino
Chantilly PkwyHyundai
§̈¦85
§̈¦65
§̈¦65
Montgomery Transit Development Plan Update 2017-2021
23
Service Hours & Running Time: Several riders commented that
extending the hours of the bus service, both starting the service
earlier and extending the service significantly later into the
evening, specifically on routes 2, 4, 5, and 10. Riders also
expressed a desire for shorter travel times. VHB team members
noted that some vehicles require a layover time somewhere in the
route to ensure that they reach the transfer centers in
coordination with other routes. While this allows for easy transfers,
it requires riders to sit on the bus for a significantly longer time.
Amenities: Several of the riders mentioned concerns and desires
for amenities throughout the system, including more shelters,
benches, schedule information, bus cleanliness, and functioning air
conditioning.
4.2.2 Community Surveys
To gather input from M System transit riders two surveys were conducted;
one to capture travel habits of riders and one to gather the opinion of the
general public towards transit in Montgomery. The rider survey was
conducted from April 18 through May 25, 2016 with paper surveys and
open comment forms were available at the Intermodal Transfer Center
and Fairview Transfer Center in Montgomery, AL. The surveys were
designed to collect demographics of existing riders, to understand their
travel habits, and to provide an opportunity for them to share insight into
where services are needed.
To reach the general public, an online survey was available from April 18-
May 25, 2016. This survey received mostly responses from participants
who do not use the M Transit System and asks what could be done to
affect their travel decisions and behavior to utilize transit.
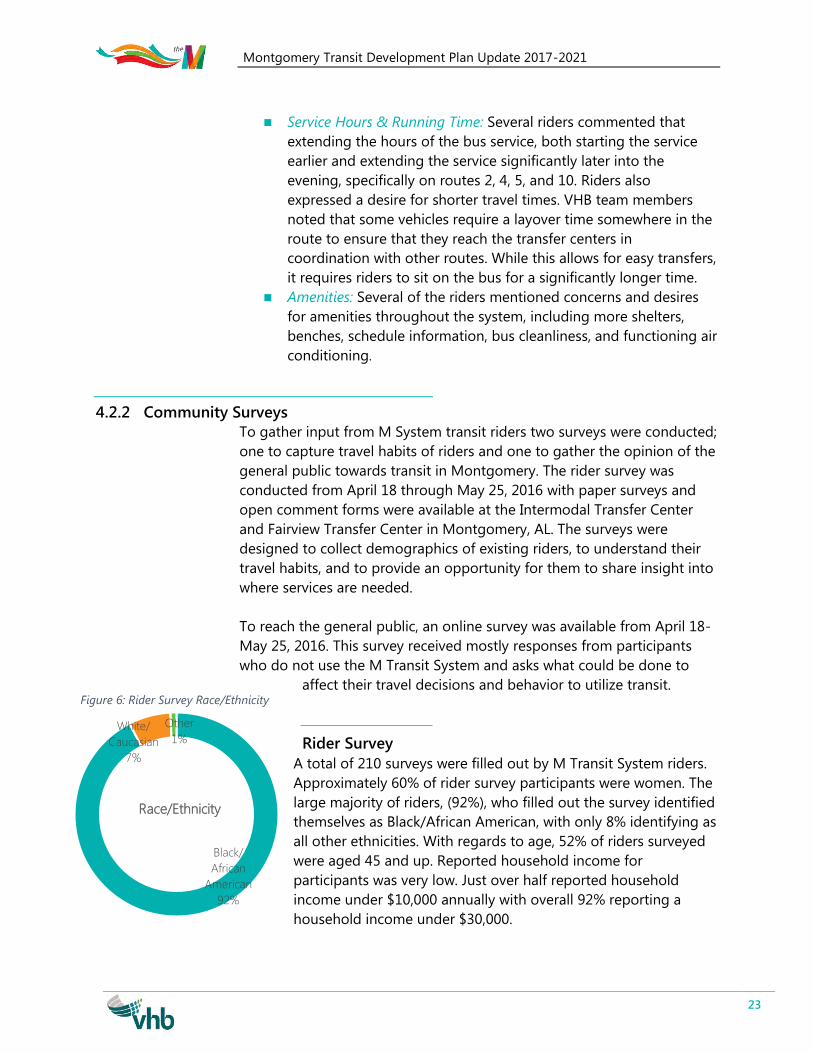
Rider Survey
A total of 210 surveys were filled out by M Transit System riders.
Approximately 60% of rider survey participants were women. The
large majority of riders, (92%), who filled out the survey identified
themselves as Black/African American, with only 8% identifying as
all other ethnicities. With regards to age, 52% of riders surveyed
were aged 45 and up. Reported household income for
participants was very low. Just over half reported household
income under $10,000 annually with overall 92% reporting a
household income under $30,000.
Figure 6: Rider Survey Race/Ethnicity
Black/
African
American
92%
White/
Caucasian
7%
Other
1%
Race/Ethnicity
Montgomery Transit Development Plan Update 2017-2021
24
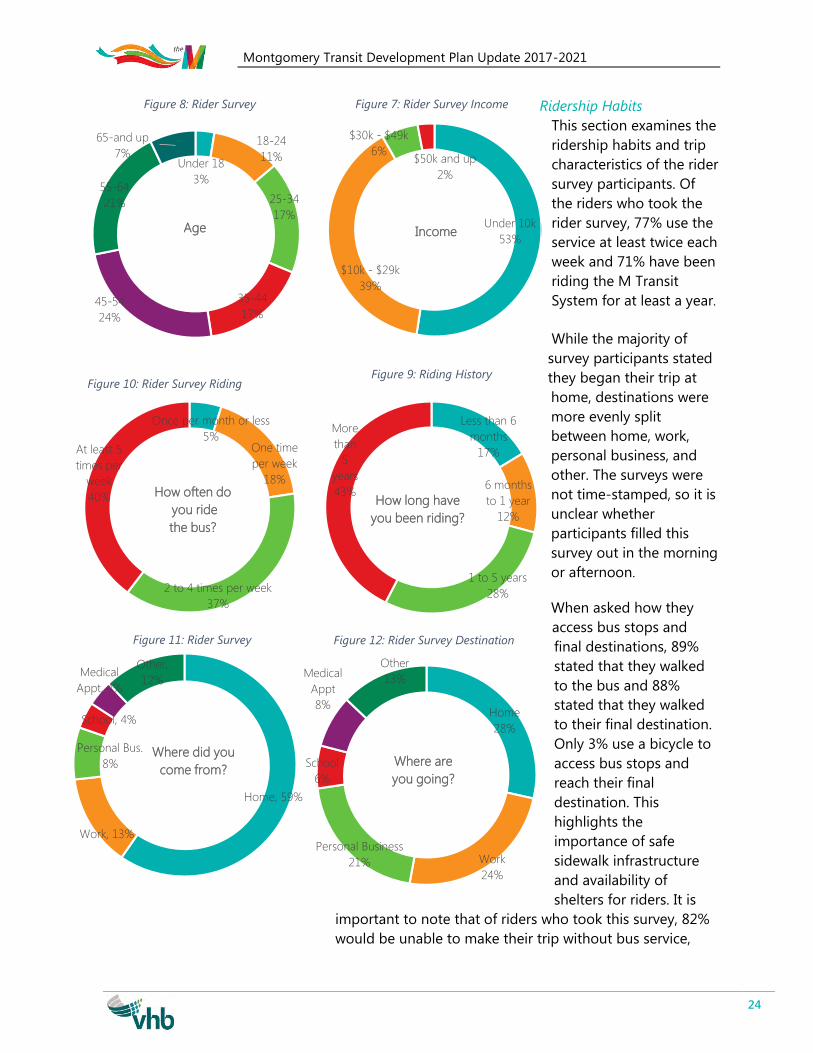
Ridership Habits
This section examines the
ridership habits and trip
characteristics of the rider
survey participants. Of
the riders who took the
rider survey, 77% use the
service at least twice each
week and 71% have been
riding the M Transit
System for at least a year.
While the majority of
survey participants stated
they began their trip at
home, destinations were
more evenly split
between home, work,
personal business, and
other. The surveys were
not time-stamped, so it is
unclear whether
participants filled this
survey out in the morning
or afternoon.
When asked how they
access bus stops and
final destinations, 89%
stated that they walked
to the bus and 88%
stated that they walked
to their final destination.
Only 3% use a bicycle to
access bus stops and
reach their final
destination. This
highlights the
importance of safe
sidewalk infrastructure
and availability of
shelters for riders. It is
important to note that of riders who took this survey, 82%
would be unable to make their trip without bus service,
Less than 6
months
17%
6 months
to 1 year
12%
1 to 5 years
28%
More
than
5
years
43%How long have
you been riding?
Once per month or less
5%One time
per week
18%
2 to 4 times per week
37%
At least 5
times per
week
40% How often do
you ride
the bus?
Figure 8: Rider Survey
Figure 10: Rider Survey Riding
Figure 11: Rider Survey
Under 18
3%
18-24
11%
25-34
17%
35-44
17%45-54
24%
55-64
21%
65-and up
7%
Age Under 10k
53%
$10k - $29k
39%
$30k - $49k
6%$50k and up
2%
Income
Home
28%
Work
24%
Personal Business
21%
School
6%
Medical
Appt
8%
Other
13%
Where are
you going?
Home, 59%
Work, 13%
Personal Bus.
8%
School, 4%
Medical
Appt, 4%
Other,
12%
Where did you
come from?
Figure 7: Rider Survey Income
Figure 9: Riding History
Figure 12: Rider Survey Destination
Montgomery Transit Development Plan Update 2017-2021
25
highlighting the critical connections provided by the M
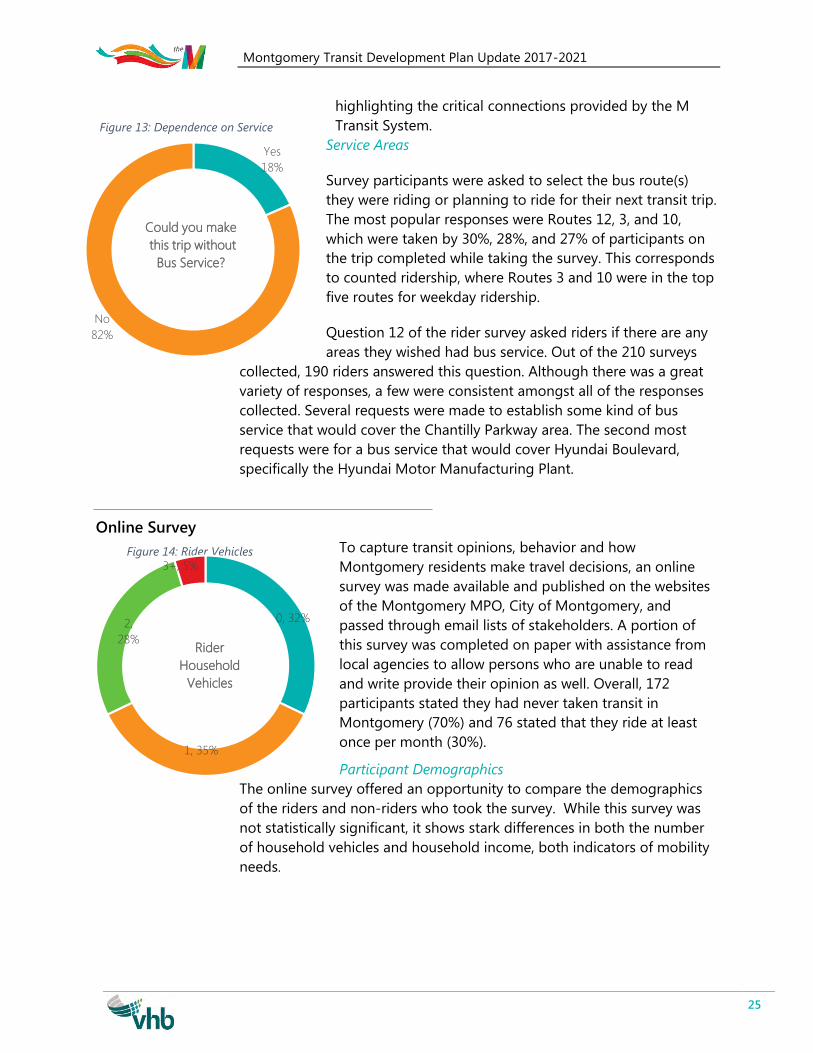
Transit System.
Service Areas
Survey participants were asked to select the bus route(s)
they were riding or planning to ride for their next transit trip.
The most popular responses were Routes 12, 3, and 10,
which were taken by 30%, 28%, and 27% of participants on
the trip completed while taking the survey. This corresponds
to counted ridership, where Routes 3 and 10 were in the top
five routes for weekday ridership.
Question 12 of the rider survey asked riders if there are any
areas they wished had bus service. Out of the 210 surveys
collected, 190 riders answered this question. Although there was a great
variety of responses, a few were consistent amongst all of the responses
collected. Several requests were made to establish some kind of bus
service that would cover the Chantilly Parkway area. The second most
requests were for a bus service that would cover Hyundai Boulevard,
specifically the Hyundai Motor Manufacturing Plant.
Online Survey
To capture transit opinions, behavior and how
Montgomery residents make travel decisions, an online
survey was made available and published on the websites
of the Montgomery MPO, City of Montgomery, and
passed through email lists of stakeholders. A portion of
this survey was completed on paper with assistance from
local agencies to allow persons who are unable to read
and write provide their opinion as well. Overall, 172
participants stated they had never taken transit in
Montgomery (70%) and 76 stated that they ride at least
once per month (30%).
Participant Demographics
The online survey offered an opportunity to compare the demographics
of the riders and non-riders who took the survey. While this survey was
not statistically significant, it shows stark differences in both the number
of household vehicles and household income, both indicators of mobility
needs.
Yes
18%
No
82%
Could you make
this trip without
Bus Service?
Figure 13: Dependence on Service
Figure 14: Rider Vehicles
0, 32%
1, 35%
2,
28%
3+, 5%
Rider
Household
Vehicles
Montgomery Transit Development Plan Update 2017-2021
26
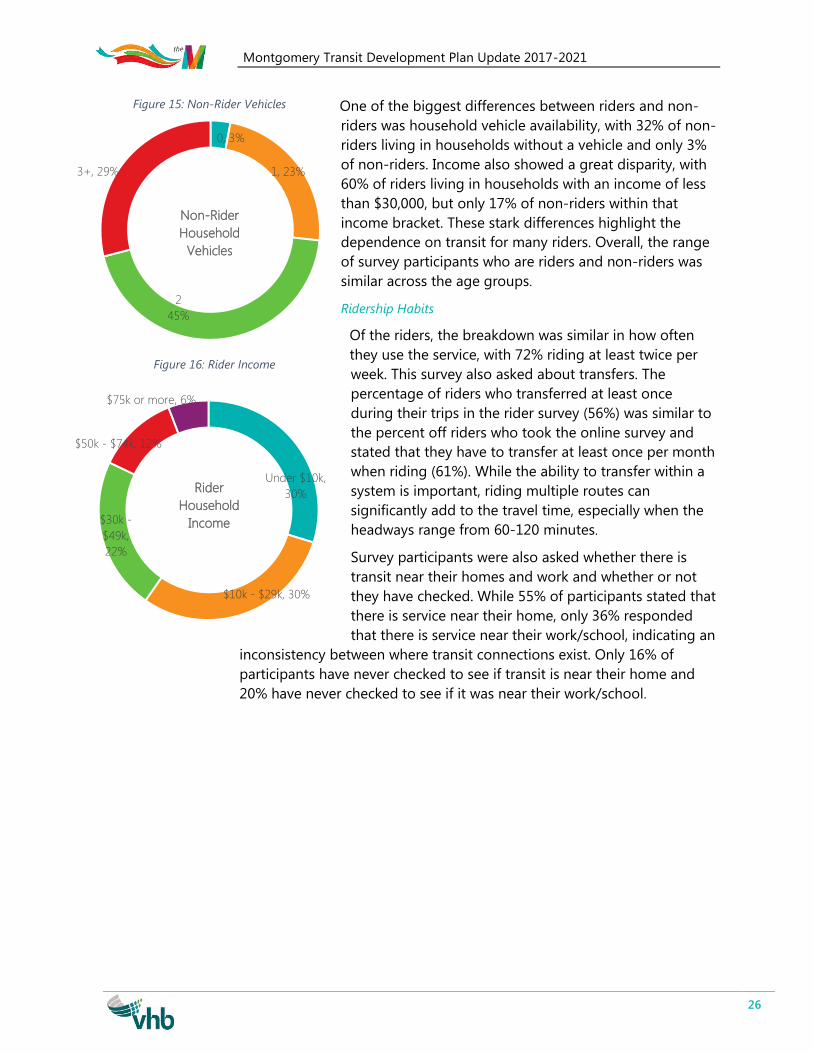
One of the biggest differences between riders and non-
riders was household vehicle availability, with 32% of non-
riders living in households without a vehicle and only 3%
of non-riders. Income also showed a great disparity, with
60% of riders living in households with an income of less
than $30,000, but only 17% of non-riders within that
income bracket. These stark differences highlight the
dependence on transit for many riders. Overall, the range
of survey participants who are riders and non-riders was
similar across the age groups.
Ridership Habits
Of the riders, the breakdown was similar in how often
they use the service, with 72% riding at least twice per
week. This survey also asked about transfers. The
percentage of riders who transferred at least once
during their trips in the rider survey (56%) was similar to
the percent off riders who took the online survey and
stated that they have to transfer at least once per month
when riding (61%). While the ability to transfer within a
system is important, riding multiple routes can
significantly add to the travel time, especially when the
headways range from 60-120 minutes.
Survey participants were also asked whether there is
transit near their homes and work and whether or not
they have checked. While 55% of participants stated that
there is service near their home, only 36% responded
that there is service near their work/school, indicating an
inconsistency between where transit connections exist. Only 16% of
participants have never checked to see if transit is near their home and
20% have never checked to see if it was near their work/school.
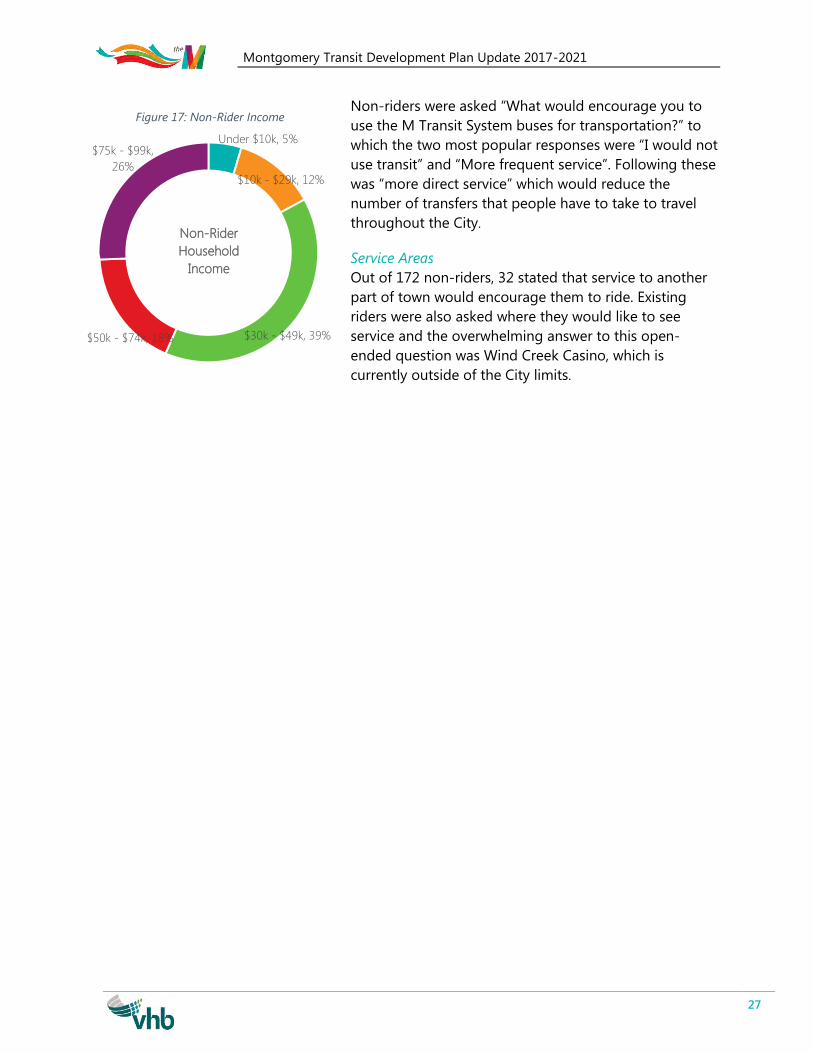
Under $10k,
30%
$10k - $29k, 30%
$30k -
$49k,
22%
$50k - $74k, 12%
$75k or more, 6%
Rider
Household
Income
0, 3%
1, 23%
2
45%
3+, 29%
Non-Rider
Household
Vehicles
Figure 15: Non-Rider Vehicles
Figure 16: Rider Income
Montgomery Transit Development Plan Update 2017-2021
27
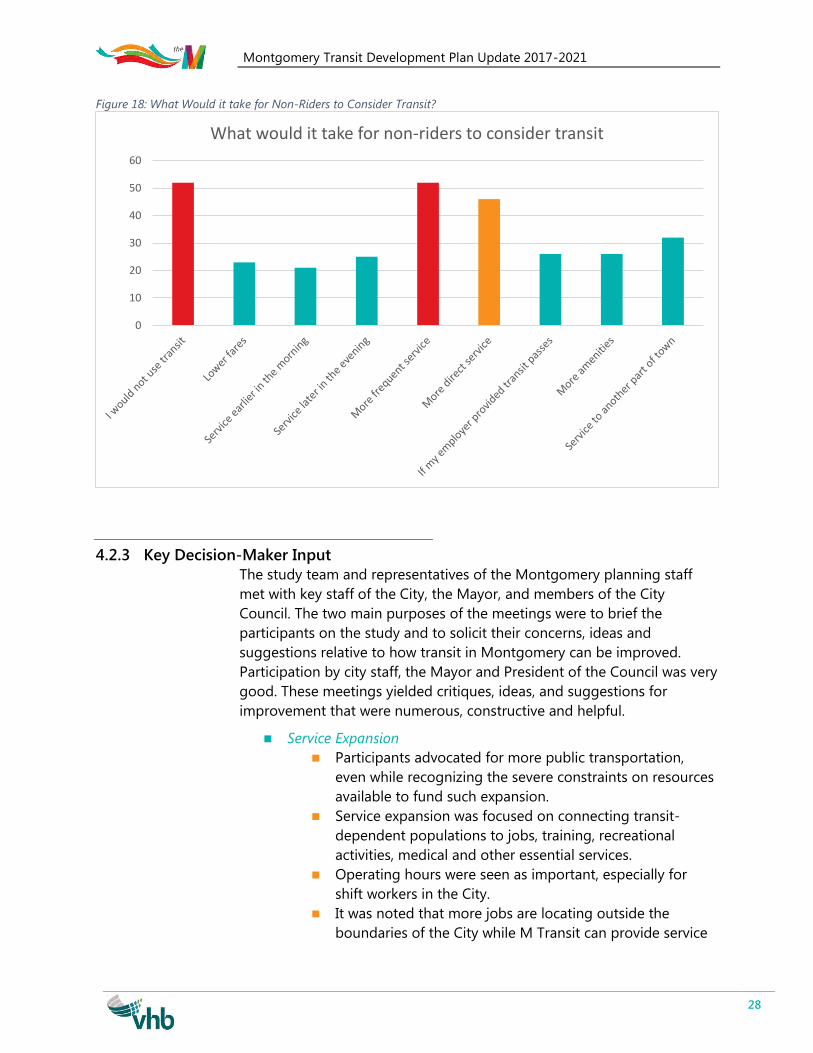
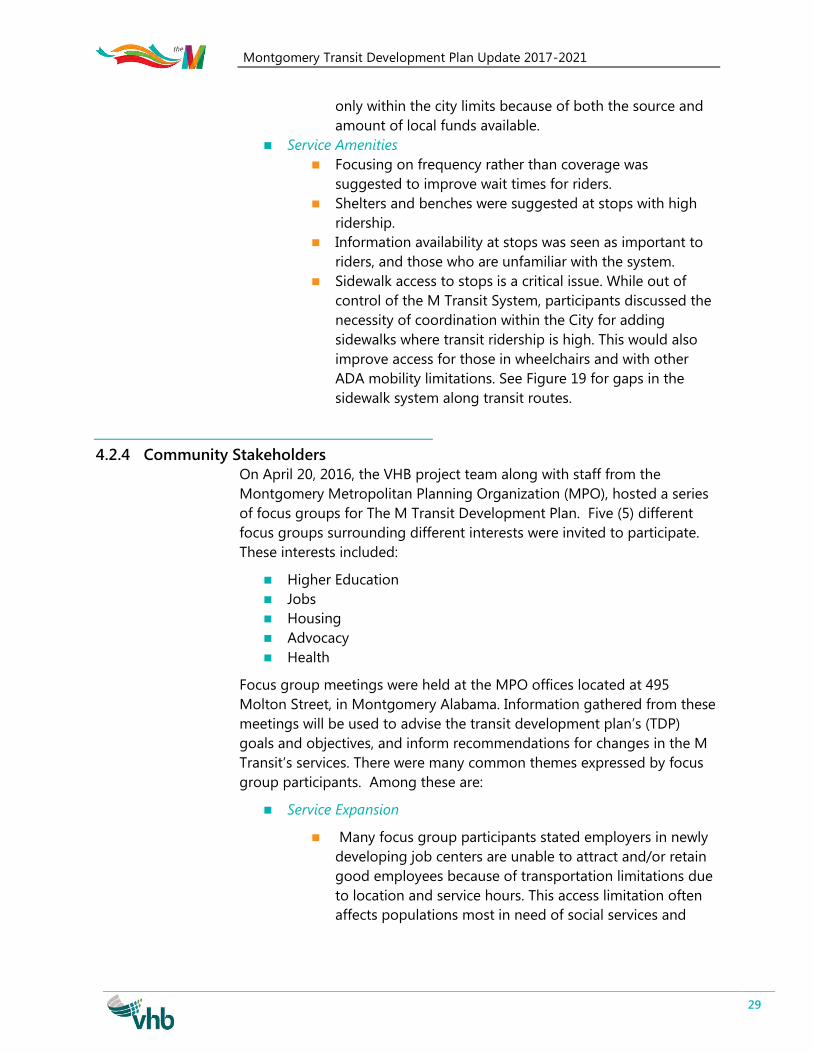
Non-riders were asked “What would encourage you to
use the M Transit System buses for transportation?” to
which the two most popular responses were “I would not
use transit” and “More frequent service”. Following these
was “more direct service” which would reduce the
number of transfers that people have to take to travel
throughout the City.
Service Areas
Out of 172 non-riders, 32 stated that service to another
part of town would encourage them to ride. Existing
riders were also asked where they would like to see
service and the overwhelming answer to this open-
ended question was Wind Creek Casino, which is
currently outside of the City limits.
Under $10k, 5%
$10k - $29k, 12%
$30k - $49k, 39%$50k - $74k, 18%
$75k - $99k,
26%
Non-Rider
Household
Income
Figure 17: Non-Rider Income
Montgomery Transit Development Plan Update 2017-2021
28
Figure 18: What Would it take for Non-Riders to Consider Transit?
4.2.3 Key Decision-Maker Input
The study team and representatives of the Montgomery planning staff
met with key staff of the City, the Mayor, and members of the City
Council. The two main purposes of the meetings were to brief the
participants on the study and to solicit their concerns, ideas and
suggestions relative to how transit in Montgomery can be improved.
Participation by city staff, the Mayor and President of the Council was very
good. These meetings yielded critiques, ideas, and suggestions for
improvement that were numerous, constructive and helpful.
Service Expansion
Participants advocated for more public transportation,
even while recognizing the severe constraints on resources
available to fund such expansion.
Service expansion was focused on connecting transit-
dependent populations to jobs, training, recreational
activities, medical and other essential services.
Operating hours were seen as important, especially for
shift workers in the City.
It was noted that more jobs are locating outside the
boundaries of the City while M Transit can provide service
0
10
20
30
40
50
60
What would it take for non-riders to consider transit
Montgomery Transit Development Plan Update 2017-2021
29
only within the city limits because of both the source and
amount of local funds available.
Service Amenities
Focusing on frequency rather than coverage was
suggested to improve wait times for riders.
Shelters and benches were suggested at stops with high
ridership.
Information availability at stops was seen as important to
riders, and those who are unfamiliar with the system.
Sidewalk access to stops is a critical issue. While out of
control of the M Transit System, participants discussed the
necessity of coordination within the City for adding
sidewalks where transit ridership is high. This would also
improve access for those in wheelchairs and with other
ADA mobility limitations. See Figure 19 for gaps in the
sidewalk system along transit routes.
4.2.4 Community Stakeholders
On April 20, 2016, the VHB project team along with staff from the
Montgomery Metropolitan Planning Organization (MPO), hosted a series
of focus groups for The M Transit Development Plan. Five (5) different
focus groups surrounding different interests were invited to participate.
These interests included:
Higher Education
Jobs
Housing
Advocacy
Health
Focus group meetings were held at the MPO offices located at 495
Molton Street, in Montgomery Alabama. Information gathered from these
meetings will be used to advise the transit development plan’s (TDP)
goals and objectives, and inform recommendations for changes in the M
Transit’s services. There were many common themes expressed by focus
group participants. Among these are:
Service Expansion
Many focus group participants stated employers in newly
developing job centers are unable to attract and/or retain
good employees because of transportation limitations due
to location and service hours. This access limitation often
affects populations most in need of social services and
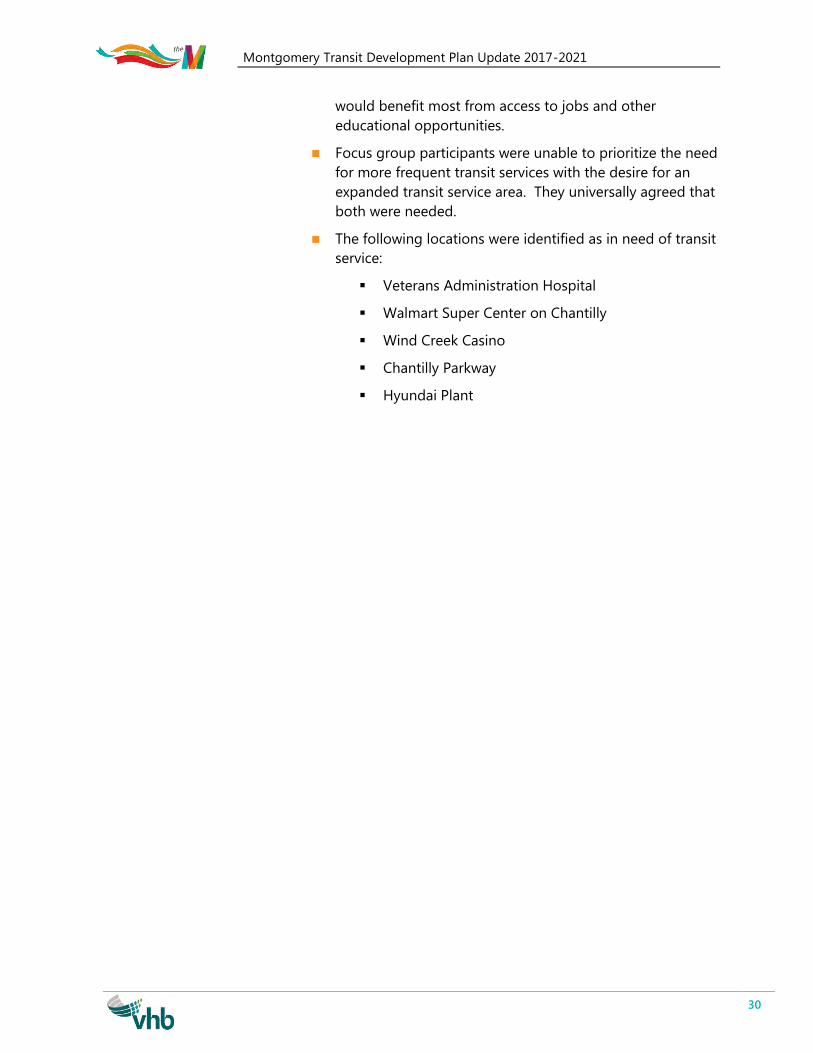
Montgomery Transit Development Plan Update 2017-2021
30
would benefit most from access to jobs and other
educational opportunities.
Focus group participants were unable to prioritize the need
for more frequent transit services with the desire for an
expanded transit service area. They universally agreed that
both were needed.
The following locations were identified as in need of transit
service:
Veterans Administration Hospital
Walmart Super Center on Chantilly
Wind Creek Casino
Chantilly Parkway
Hyundai Plant
¾¿
¾¿
Montgomery County
Autauga County
ElmoreCounty
City of Montgomery
¬«152
East B
oulev
ard
£¤231
West Boulevard
Mobil
e High
way
£¤31
Vaughn Rd
¬«21
£¤331
State Rte 143
Atlanta HighwayState Rte 6
Selma Hwy, US Hwy 80
I- 85
I- 65
US Hwy 82
State Rte 6
State Rte 21
State Rte 8
West Blvd
State
Rte 9
US H
wy 23
1
US Hwy 31
State Rte 3
US Hwy 80
Bell R
d
State Rte 110 Vaughn Rd Co R
d 43
State Rte 53
Taylo
r Rd
Woodley Rd
Atlanta Hwy
State Rte 152
Northern Blvd
Co Rd 54
S Cou
rt St
Bell St
Troy HwyNa
rrow
Lane
Rd
Wares Ferry Rd
Norm
an B
ridge
Rd
S Perr
y St
Oak S
t
Park Xing
Hill S
t
Co R d 42
State Rte 108
Hall S
tHunte
r Loo
p Rd
Birmingham Hwy
Ann S
t
Colis
eum
Blvd
Rosa
L Pa
rks A
ve Carter Hill Rd
River Rd
Co Rd 15
Co R d 33
March St
Old Selma Rd
N Co
urt S
t
Fede
ral D
r
Foshee Rd
Mobile
Hwy
Hayneville
Rd
Co Rd 39
McGehee Rd
Forbes Dr
McLem
ore Dr
Air Base Blvd
Day St
Perry
Hill
Rd
N Ripley S
t
Tower Rd
Well RdRay Thorington Rd
Tine Ave
Dalra
ida R
d
Fernway DrRy
an S
t
Rigby St
Co R d 83
Roquemore St
Duff St
6th St
Wynlakes Blvd
Seibles Rd
W Fleming Rd
Arrowhead Dr
Co Rd 2120
Hillm
an S
t
Folmar Pkwy
S Unio
n St
April
St
Chisholm St
Semi
nole
Dr
Wille
na S
t3rd
St
Beardsley Dr
Karen
Rd
E Patton Ave
Felder Rd
Ash St
Le B
ron R
d
Bienville Rd Oldfi
eld D
r
Co R d 64
Clay St
University Dr
Mobil
e Dr
Youn
g Mea
dows
Rd
Lakeridge D rMonticello Dr
Pike R
d
Eric
Ln
Adler Dr
Lemay Plz
Briar
Gate
Dr
Old Post Ln
Aronov Ave
Marston Way
Tara L
n
Bradley Dr
East Dr
Herbert Dr
Henry Dr
Leno
x Ln
Co R d 40
Argy le R d
2nd St
Chantilly Pkwy
Rolind D r
North Dr
Kirkw
ood D
r
Arrowleaf Rd
Donna Dr
Grande Ave
Taylor Rd
US Hw
y 80
State Rte 8I- 85I- 6
5
Oak St
Montgomery Regional Airport
Maxwell Airforce Base
logos
M Transit TDP Montgomery, AL
Figure 19: M Transit Bus Routes and Existing Sidewalks
M Transit Bus Routes andExisting SidewalksSources: Montgomery MPO, U.S. Census, VHB
± 0 2 41 Miles
August 09, 2016\\v
hb\p
roj\G
eorg
ia\62
555.0
0 Mon
tgom
ery T
DP U
pdate
\GIS\
Projec
t\Figu
re 19
M Tr
ansit
Bus
Route
s and
Exist
ing Si
dewa
lks.m
xd
¾¿ M Transfer CentersM Bus RoutesExisting Sidewalks Along Bus Routes
State & Federal RouadsInterstatesLocal RoadsMontgomery County
Montgomery AirportMilitar y BasesWater
§̈¦85
§̈¦65
§̈¦65
Montgomery Transit Development Plan Update 2017-2021
32
Shopping areas in east Montgomery
The Veteran’s Administration (VA) Hospital at
Chantilly Parkway
High employment areas outside of City limits
Minority and low-income population
concentrations with a higher proportion of zero-car
households
Suburban commuter corridors
Figure 20: Stakeholder Engagement
Service Amenities
Universally, focus group participants agreed that access to
bus stops and basic bus stop features, particularly benches
and shelters were important because of the headways on
some routes and the heat.
Focus group participants noted that not all stops are
accessible by sidewalks, and that some stops are only
accessed from the street.
Focus group participants offered that M Transit bus stops
could offer bicycle parking in order to encourage and/or
support the use of bicycles to access transit.
Transit Education, Information, and Perception
Montgomery Transit Development Plan Update 2017-2021
33
Focus group participants stated that even among transit
dependent individuals, transit carries a negative stigma and
is avoided due to perceived crime at stations and long
travel times.
Other common perceptions include that the vehicles are
uncomfortable, not well maintained, and that the services
do not go to the places where people want to/need to go.
Focus group participants stated that all stops should
include some basic information about the route and
contact information for the M Transit customer service.
Focus group participants collectively agreed that there is a
need to better educate the public on how to use the buses
and transit system, as well as read schedules and use the
mobile application.
Lastly, focus group participants suggested that the M
Transit make a more concerted effort to inform people
about the improvements that they have made and are
planning to make in order to help change popular
misperceptions about the system
Focus group participants agreed that the existing M Transit’s service
delivery must be improved. Participants collectively agreed that the
system needed to improve its on-time performance and overall reliability.
Participants also agreed that closer coordination with paratransit and
human service transportation services is needed.
Montgomery Transit Development Plan Update 2017-2021
34
5 Market Analysis
5.1 Overview and Purpose A market analysis provides a spatial snapshot of demographics,
employment, land use, and travel characteristics within the City of
Montgomery. These categories can be indicators of mobility needs,
identifying where there are dense pockets of traditionally-transit
dependent populations, or clusters of job locations that could efficiently
be served by transit. While not the only indicator of mobility needs,
assessing the spatial attributes of demographics, jobs, land use, and travel
characteristics can be used to develop and assess routing scenarios.
5.2 Market Analysis Demographics
Examining the demographics of a service area can be used to indicate
potential transit and mobility needs. Spatial data in this section are based
on the 2015 American Community Survey. Often, households with more
drivers than available vehicles or those that cannot afford vehicles need
alternative transportation. The areas with the highest density of zero car
households are Downtown Montgomery north of downtown, as well as
areas near the Fairview Transfer Center, West Boulevard and US Route
331, Baptist Medical Center, Atlanta Highway and East Boulevard. Areas
with a median income of $30,000 or less are concentrated Downtown,
north and west of Downtown, and Woodland Hills.
Concentrations of areas with high proportions of youths and/or seniors
are more spread throughout the City. The northeast corner of the City
limits and the area to the west of the Maxwell Airforce Base have higher
concentrations of youths. The area west of the airport has seniors make
Montgomery Transit Development Plan Update 2017-2021
35
up 20%-70% of the population. The existing routes cover many of the
areas identified by demographic analysis.
Employment and Population
Examining the density of population and employment is critical to
understanding potential success of transit. Fixed route transit services
provide the most efficient service when they can reach a large number of
homes and jobs within a smaller area, and more directly along a single
corridor. Figure 25 shows the 2010 population density for Montgomery. It
is anticipated that the density of the city will remain constant through
2040 according to MPO projections. One thing that is important to note is
the relationship between of household density and low income. Figure 26
overlays areas with a density of 500 households or less per square mile
over the median income. West of I-65 and north of Maxwell-Gunter Air
Force Base Annex are areas with low income populations and low density.
While income is an indicator of mobility need, low densities are
particularly difficult to serve with fixed route transit and oftentimes results
in either low frequencies, circuitous routes, or a combination of both.
With regards to employment, the M Transit System provides access to the
areas with the highest job density, which are not projected to change
much between 2010 and 2040 as projected by the Montgomery MPO. The
existing and projected employment densities can be seen in Figure 27. By
far, the area with the highest employment density is Downtown
Montgomery, with other hubs including East Chase, the Baptist Medical
Center, Atlanta Highway, and the Maxwell-Gunter Airforce Annex.
Similarly, Figure 27 and Figure 28 show the home origins and work
destinations for all modeled home-based-work trips in the City, which are
in line with the household and employment densities.
Land Use
Land use and transportation connections are critical to identify travel
needs. Observed land use by parcel can be seen in Figure 30. Efficient
transit systems provide direct connections between homes and common
destinations, such as school, work, shopping, and medical appointments.
Within City limits, many of these areas and corridors with retail and
residential are served by existing routes.
5.3 Implications for Scenarios The current system provides coverage to areas within the City of
Montgomery with high densities of populations with higher mobility
needs. However, by spanning this large coverage area, the level of service
suffers, and riders are required to spend more time waiting and riding.
Montgomery Transit Development Plan Update 2017-2021
36
While frequency for some routes is low, existing service does reach the
major hospitals and employment areas. These should be the focus of
frequency and installation of amenities to improve service delivery to
those who already use the service
One of the largest issues is highlighted in Figure 26, showing that the
areas with the low median incomes ($50,000 or less annually) also tend to
be located in some of the least dense areas. This makes fixed route service
difficult and less efficient. One potential solution to this is to reduce the
number of trips to these areas, or designate some of these areas as flex
zones where they can schedule demand response trips. This will be further
explored in the scenario development.
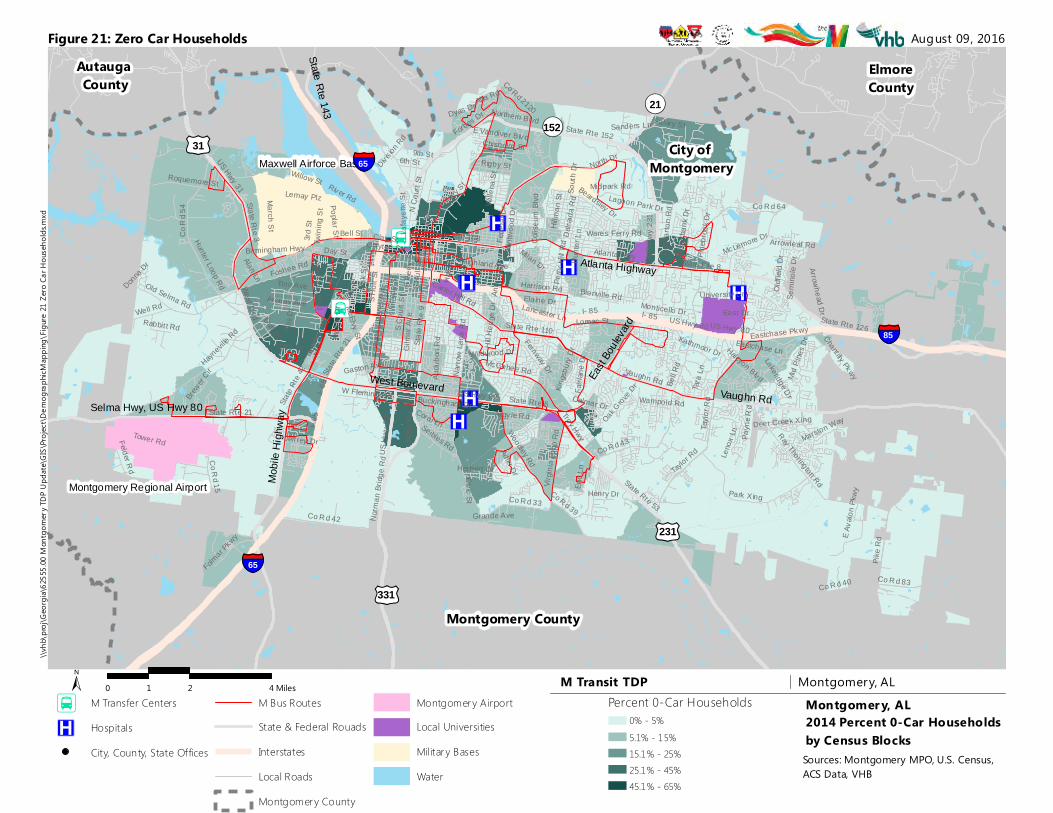
®v
®v
®v
®v
®v
®v®v
¾¿
¾¿
Montgomery County
Autauga County
ElmoreCounty
City of Montgomery
¬«152
East B
oulev
ard
£¤231
West Boulevard
Mobil
e High
way
£¤31
Vaughn Rd
¬«21
£¤331
State Rte 143
Atlanta Highway
Selma Hwy, US Hwy 80
I- 85I- 6
5
US Hwy 82 State Rte 6State Rte 21
State Rte 8
West Blvd
State
Rte 9
US H
wy 23
1
US Hwy 31State Rte 3
US Hwy 80
Bell R
d
State Rte 110
Vaughn Rd
Co R d 43
State Rte 53
Taylo
r Rd
Woodley Rd
Atlanta Hwy
State Rte 152
Northern Blvd
Co R
d 54
S Cou
rt St
Bell St
Troy HwyNa
rrow
Lane
Rd
Wares Ferry Rd
Norm
an B
ridge
Rd
S Perr
y St
Oak S
t
Park Xing
State
Rte 4
2
Hill S
t
Co R d 42
State Rte 108
Hall S
t
Hunter Loop Rd
Birmingham Hwy
Ann S
t
Colis
eum
Blvd
US H
wy 33
1Ro
sa L
Parks
Ave
Carter Hill Rd
River Rd
Co Rd 15
Co R d 33
March St
Old Selma Rd
N Co
urt S
t
Fede
ral D
r
Foshee Rd
Mobile
Hwy
S Hull
St
Hayneville
Rd
Co Rd 39
McGehee Rd
Forbes Dr
State
Rte 2
77
McLemore Dr
Air Base Blvd
Highland Ave
S Holt
St
Day St
Gilm
er Av
e
Gaston Ave
Perry
Hill
Rd
N Ripley S
t
Virgin
ia Lo
op R
dTower Rd
Eastchase PkwyWell Rd
N De
catur
St
Ray Thorington Rd
Tine Ave
Dalra
ida R
d
Fernway Dr
Rigby St
Co R d 83
Roquemore St
Duff St
Harrison Rd
6th St
Seibles Rd
W Fleming Rd
N Bu
rbank
Dr
Ellis
Dr
Fairla
ne D
r
Arrowhead DrGood
e St
Co Rd 2120
Audu
bon R
d
Hillm
an S
t
Folmar Pkwy
Chisholm St
Semi
nole
Dr
Wille
na S
t
3rd St
Halcyon Blvd
Beardsley Dr
Payn
e Rd
Felder Rd
Pineb
rook D
r
Buckingham Dr
Bienville Rd Oldfi
eld D
r
Co R d 64
Milan Dr
Clay St
University Dr
Mobil
e Dr
Poplar St
Lakeridge D r
Dunb
arton
Rd
Monticello Dr
Pike R
d
Eric
Ln
Kingsb
ury Dr
Adler Dr
Lemay Plz
Bran
twoo
d Dr
Rabbit t Rd
Clayton St
Eastchase Ln
Aronov Ave
Alta Rd
Marston Way
Lancaster LnTw
ining
St
Lagoon Park Dr
Otis Ln
Tara L
n
Jeffrey Dr
Midpark Rd
East Dr
Sanders Ln
Herbert Dr
South
Dr
Henry Dr
Leno
x Ln
Co R d 40
Argy le R d
Wildwood DrHill H
edge
Dr
Salary St
Lafay
ette S
t
Chant illy Pkwy
Lomac St
North Dr
Arrowleaf Rd
Oak Grov
e Dr
E Vandiver Blvd
Willow St
9th St
Kathmoor Dr
State Rte 126
Wampold Rd
Hunte
r Ln
Donna Dr
Deer Creek Xing
Dyas Dr
Calmar Dr
Grande Ave
Elaine Dr
Civic St
Div ision
RdCoral Ln
E Ava
lon P
kwy
Mid Pi
nes D
r
McElvy St
Alan Ln
Brewer C
ir State R
te 21
I- 65
US Hwy 80I- 85
Taylor Rd
Montgomery Regional Airport
Maxwell Airforce Base
logos
M Transit TDP Montgomery, ALMontgomer y, AL2014 Percent 0-Car Householdsby Census BlocksSources: Montgomery MPO, U.S. Census, ACS Data, VHB
± 0 2 41 Miles
August 09, 2016\\v
hb\p
roj\G
eorg
ia\62
555.0
0 Mon
tgom
ery T
DP U
pdate
\GIS\
Projec
t\Dem
ograp
hicM
appin
g\Fig
ure 21
Zero
Car H
ouse
holds
.mxd
¾¿ M Transfer Centers
®v HospitalsCity, County, State Offices
M Bus RoutesState & Federal RouadsInterstatesLocal RoadsMontgomery County
Montgomery AirportLocal UniversitiesMilitar y BasesWater
Percent 0-Car Households0% - 5%5.1% - 15%15.1% - 25%25.1% - 45%45.1% - 65%
§̈¦85
§̈¦65
§̈¦65
Figure 21: Zero Car Households
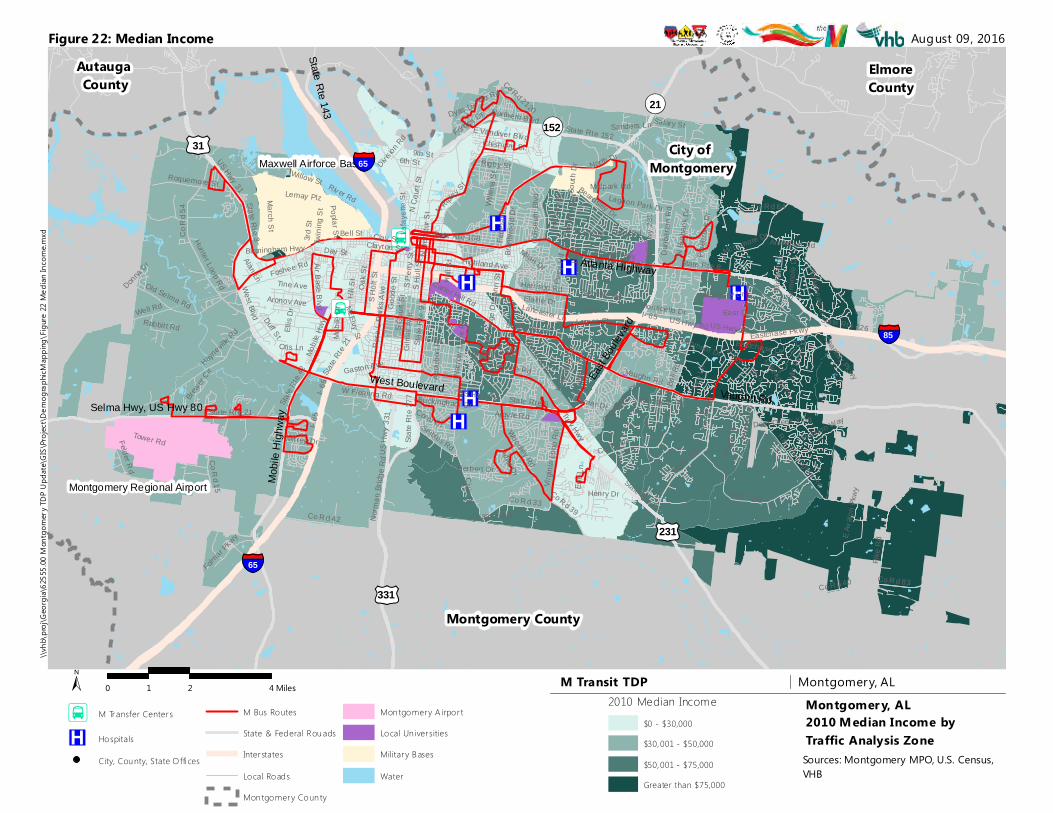
®v
®v
®v
®v
®v
®v®v
¾¿
¾¿
Montgomery County
Autauga County
ElmoreCounty
City of Montgomery
¬«152
East B
oulev
ard
£¤231
West Boulevard
Mobil
e High
way
£¤31
Vaughn Rd
¬«21
£¤331
State Rte 143
Atlanta Highway
Selma Hwy, US Hwy 80
I- 85I- 6
5
US Hwy 82 State Rte 6State Rte 21
State Rte 8
West Blvd
State
Rte 9
US H
wy 23
1
US Hwy 31State Rte 3
US Hwy 80
Bell R
d
State Rte 110
Vaughn Rd
Co R d 43
State Rte 53
Taylo
r Rd
Woodley Rd
Atlanta Hwy
State Rte 152
Northern Blvd
Co R
d 54
S Cou
rt St
Bell St
Troy HwyNa
rrow
Lane
Rd
Wares Ferry Rd
Norm
an B
ridge
Rd
S Perr
y St
Oak S
t
Park Xing
State
Rte 4
2
Hill S
t
Co R d 42
State Rte 108
Hall S
t
Hunter Loop Rd
Birmingham Hwy
Ann S
t
Colis
eum
Blvd
US H
wy 33
1Ro
sa L
Parks
Ave
Carter Hill Rd
River Rd
Co Rd 15
Co R d 33
March St
Old Selma Rd
N Co
urt S
t
Fede
ral D
r
Foshee Rd
Mobile
Hwy
S Hull
St
Hayneville
Rd
Co Rd 39
McGehee Rd
Forbes Dr
State
Rte 2
77
McLemore Dr
Air Base Blvd
Highland Ave
S Holt
St
Day St
Gilm
er Av
e
Gaston Ave
Perry
Hill
Rd
N Ripley S
t
Virgin
ia Lo
op R
dTower Rd
Eastchase PkwyWell Rd
N De
catur
St
Ray Thorington Rd
Tine Ave
Dalra
ida R
d
Fernway Dr
Rigby St
Co R d 83
Roquemore St
Duff St
Harrison Rd
6th St
Seibles Rd
W Fleming Rd
N Bu
rbank
Dr
Ellis
Dr
Fairla
ne D
r
Arrowhead DrGood
e St
Co Rd 2120
Audu
bon R
d
Hillm
an S
t
Folmar Pkwy
Chisholm St
Semi
nole
Dr
Wille
na S
t
3rd St
Halcyon Blvd
Beardsley Dr
Payn
e Rd
Felder Rd
Pineb
rook D
r
Buckingham Dr
Bienville Rd Oldfi
eld D
r
Co R d 64
Milan Dr
Clay St
University Dr
Mobil
e Dr
Poplar St
Lakeridge D r
Dunb
arton
Rd
Monticello Dr
Pike R
d
Eric
Ln
Kingsb
ury Dr
Adler Dr
Lemay Plz
Bran
twoo
d Dr
Rabbit t Rd
Clayton St
Eastchase Ln
Aronov Ave
Alta Rd
Marston Way
Lancaster LnTw
ining
St
Lagoon Park Dr
Otis Ln
Tara L
n
Jeffrey Dr
Midpark Rd
East Dr
Sanders Ln
Herbert Dr
South
Dr
Henry Dr
Leno
x Ln
Co R d 40
Argy le R d
Wildwood DrHill H
edge
Dr
Salary St
Lafay
ette S
t
Chant illy Pkwy
Lomac St
North Dr
Arrowleaf Rd
Oak Grov
e Dr
E Vandiver Blvd
Willow St
9th St
Kathmoor Dr
State Rte 126
Wampold Rd
Hunte
r Ln
Donna Dr
Deer Creek Xing
Dyas Dr
Calmar Dr
Grande Ave
Elaine Dr
Civic St
Div ision
RdCoral Ln
E Ava
lon P
kwy
Mid Pi
nes D
r
McElvy St
Alan Ln
Brewer C
ir State R
te 21
I- 65
US Hwy 80I- 85
Taylor Rd
Montgomery Regional Airport
Maxwell Airforce Base
M Transit TDP Montgomery, ALMontgomer y, AL2010 Median Income by Traffic Analysis ZoneSources: Montgomery MPO, U.S. Census, VHB
± 0 2 41 Miles
August 09, 2016\\v
hb\p
roj\G
eorg
ia\62
555.0
0 Mon
tgom
ery T
DP U
pdate
\GIS\
Projec
t\Dem
ograp
hicM
appin
g\Fig
ure 22
Med
ian In
come
.mxd
¾¿ M Transfer Centers
®v Hospitals
City, County, State O ffi ces
M Bus Routes
State & Federal Rouads
Interstates
Local Roads
Mon tgomery Coun ty
Mon tgomery A irpor t
Local Un iversities
Military Bases
Water
2010 Median Income$0 - $30,000$30,001 - $50,000
$50,001 - $75,000Greater than $75,000
§̈¦85
§̈¦65
§̈¦65
Figure 22: Median Income
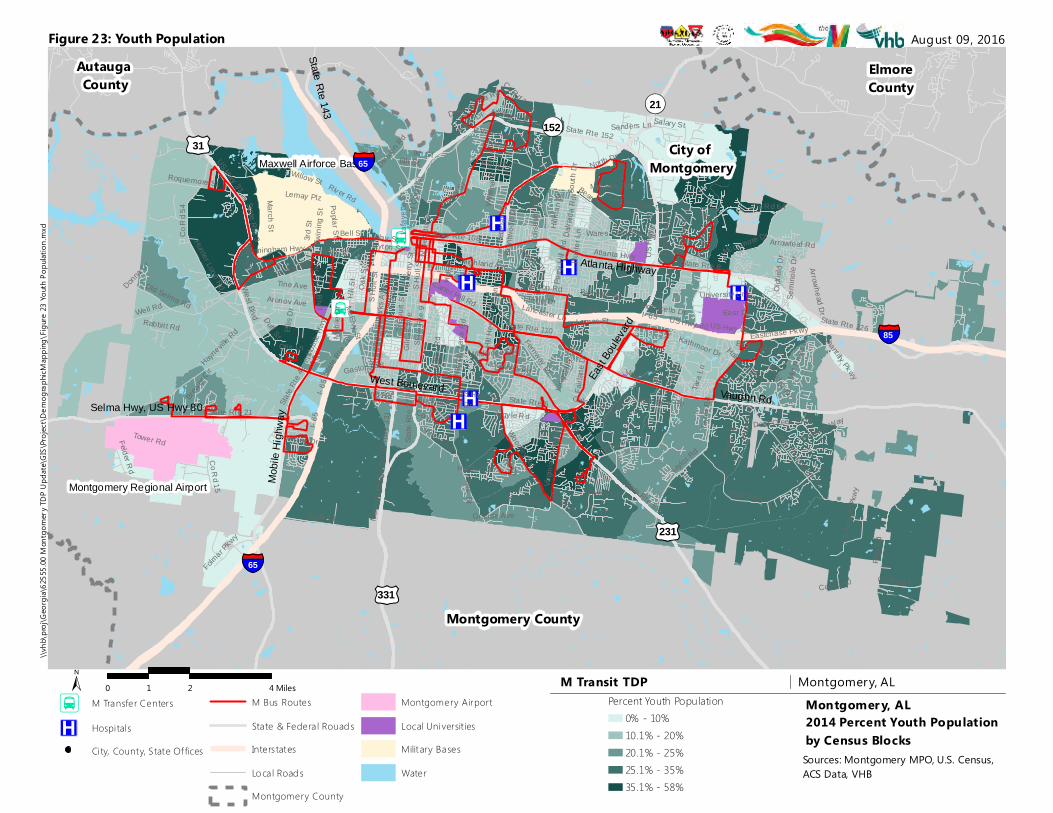
®v
®v
®v
®v
®v
®v®v
¾¿
¾¿
Montgomery County
Autauga County
ElmoreCounty
City of Montgomery
¬«152
East B
oulev
ard
£¤231
West Boulevard
Mobil
e High
way
£¤31
Vaughn Rd
¬«21
£¤331
State Rte 143
Atlanta Highway
Selma Hwy, US Hwy 80
I- 85I- 6
5
US Hwy 82 State Rte 6State Rte 21
State Rte 8
West Blvd
State
Rte 9
US H
wy 23
1
US Hwy 31State Rte 3
US Hwy 80
Bell R
d
State Rte 110
Vaughn Rd
Co R d 43
State Rte 53
Taylo
r Rd
Woodley Rd
Atlanta Hwy
State Rte 152
Northern Blvd
Co R
d 54
S Cou
rt St
Bell St
Troy HwyNa
rrow
Lane
Rd
Wares Ferry Rd
Norm
an B
ridge
Rd
S Perr
y St
Oak S
t
Park Xing
State
Rte 4
2
Hill S
t
Co R d 42
State Rte 108
Hall S
t
Hunter Loop Rd
Birmingham Hwy
Ann S
t
Colis
eum
Blvd
US H
wy 33
1Ro
sa L
Parks
Ave
Carter Hill Rd
River Rd
Co Rd 15
Co R d 33
March St
Old Selma Rd
N Co
urt S
t
Fede
ral D
r
Foshee Rd
Mobile
Hwy
S Hull
St
Hayneville
Rd
Co Rd 39
McGehee Rd
Forbes Dr
State
Rte 2
77
McLemore Dr
Air Base Blvd
Highland Ave
S Holt
St
Day St
Gilm
er Av
e
Gaston Ave
Perry
Hill
Rd
N Ripley S
t
Virgin
ia Lo
op R
dTower Rd
Eastchase PkwyWell Rd
N De
catur
St
Ray Thorington Rd
Tine Ave
Dalra
ida R
d
Fernway Dr
Rigby St
Co R d 83
Roquemore St
Duff St
Harrison Rd
6th St
Seibles Rd
W Fleming Rd
N Bu
rbank
Dr
Ellis
Dr
Fairla
ne D
r
Arrowhead DrGood
e St
Co Rd 2120
Audu
bon R
d
Hillm
an S
t
Folmar Pkwy
Chisholm St
Semi
nole
Dr
Wille
na S
t
3rd St
Halcyon Blvd
Beardsley Dr
Payn
e Rd
Felder Rd
Pineb
rook D
r
Buckingham Dr
Bienville Rd Oldfi
eld D
r
Co R d 64
Milan Dr
Clay St
University Dr
Mobil
e Dr
Poplar St
Lakeridge D r
Dunb
arton
Rd
Monticello Dr
Pike R
d
Eric
Ln
Kingsb
ury Dr
Adler Dr
Lemay Plz
Bran
twoo
d Dr
Rabbit t Rd
Clayton St
Eastchase Ln
Aronov Ave
Alta Rd
Marston Way
Lancaster LnTw
ining
St
Lagoon Park Dr
Otis Ln
Tara L
n
Jeffrey Dr
Midpark Rd
East Dr
Sanders Ln
Herbert Dr
South
Dr
Henry Dr
Leno
x Ln
Co R d 40
Argy le R d
Wildwood DrHill H
edge
Dr
Salary St
Lafay
ette S
t
Chant illy Pkwy
Lomac St
North Dr
Arrowleaf Rd
Oak Grov
e Dr
E Vandiver Blvd
Willow St
9th St
Kathmoor Dr
State Rte 126
Wampold Rd
Hunte
r Ln
Donna Dr
Deer Creek Xing
Dyas Dr
Calmar Dr
Grande Ave
Elaine Dr
Civic St
Div ision
RdCoral Ln
E Ava
lon P
kwy
Mid Pi
nes D
r
McElvy St
Alan Ln
Brewer C
ir State R
te 21
I- 65
US Hwy 80I- 85
Taylor Rd
Montgomery Regional Airport
Maxwell Airforce Base
logos
M Transit TDP Montgomery, ALMontgomer y, AL2014 Percent Youth Populationby Census BlocksSources: Montgomery MPO, U.S. Census, ACS Data, VHB
± 0 2 41 Miles
August 09, 2016\\v
hb\p
roj\G
eorg
ia\62
555.0
0 Mon
tgom
ery T
DP U
pdate
\GIS\
Projec
t\Dem
ograp
hicM
appin
g\Fig
ure 23
Youth
Popu
lation
.mxd
¾¿ M Transfer Centers
®v HospitalsCity, County, State Of fices
M Bus Routes
State & Federa l Rouad sInters tates
Lo ca l Road sMontgomery County
Montgomery Airport
Local Universit iesMilitary Bases
Water
Percent Youth Population0% - 10%10.1% - 20%20.1% - 25%25.1% - 35%35.1% - 58%
§̈¦85
§̈¦65
§̈¦65
Figure 23: Youth Population
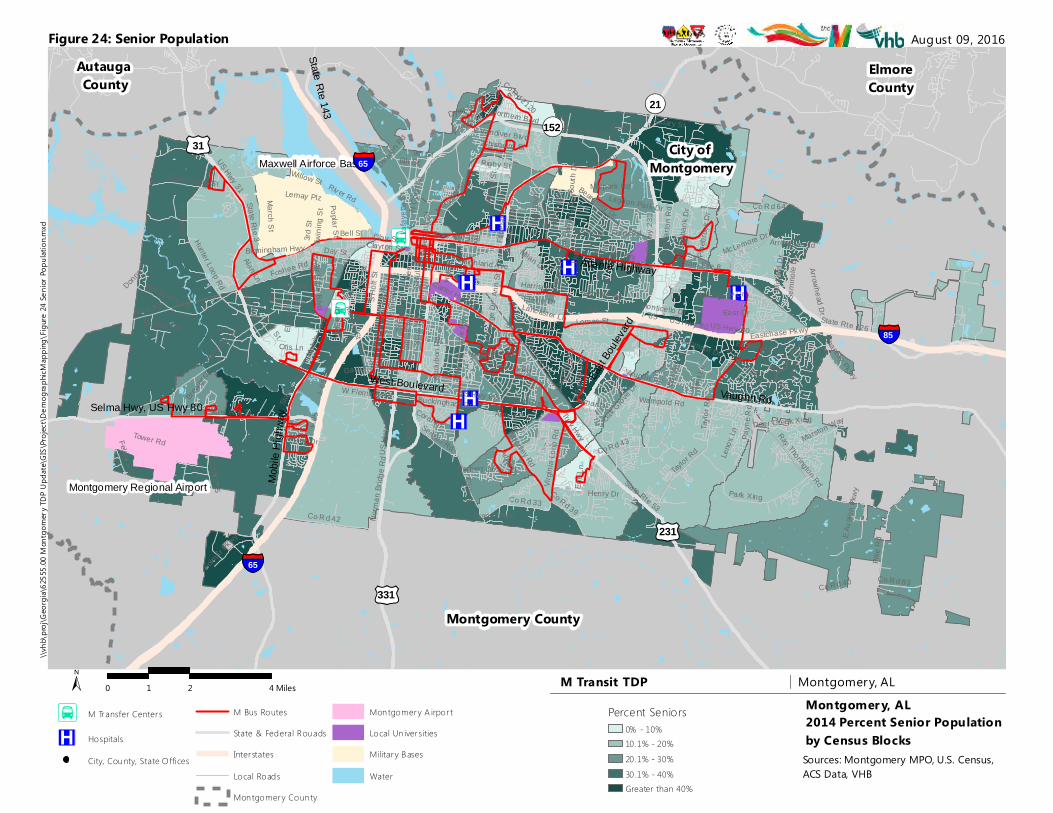
®v
®v
®v
®v
®v
®v®v
¾¿
¾¿
Montgomery County
Autauga County
ElmoreCounty
City of Montgomery
¬«152
East B
oulev
ard
£¤231
West Boulevard
Mobil
e High
way
£¤31
Vaughn Rd
¬«21
£¤331
State Rte 143
Atlanta Highway
Selma Hwy, US Hwy 80
I- 85I- 6
5
US Hwy 82 State Rte 6State Rte 21
State Rte 8
West Blvd
State
Rte 9
US H
wy 23
1
US Hwy 31State Rte 3
US Hwy 80
Bell R
d
State Rte 110
Vaughn Rd
Co R d 43
State Rte 53
Taylo
r Rd
Woodley Rd
Atlanta Hwy
State Rte 152
Northern Blvd
Co R
d 54
S Cou
rt St
Bell St
Troy HwyNa
rrow
Lane
Rd
Wares Ferry Rd
Norm
an B
ridge
Rd
S Perr
y St
Oak S
t
Park Xing
State
Rte 4
2
Hill S
t
Co R d 42
State Rte 108
Hall S
t
Hunter Loop Rd
Birmingham Hwy
Ann S
t
Colis
eum
Blvd
US H
wy 33
1Ro
sa L
Parks
Ave
Carter Hill Rd
River Rd
Co Rd 15
Co R d 33
March St
Old Selma Rd
N Co
urt S
t
Fede
ral D
r
Foshee Rd
Mobile
Hwy
S Hull
St
Hayneville
Rd
Co Rd 39
McGehee Rd
Forbes Dr
State
Rte 2
77
McLemore Dr
Air Base Blvd
Highland Ave
S Holt
St
Day St
Gilm
er Av
e
Gaston Ave
Perry
Hill
Rd
N Ripley S
t
Virgin
ia Lo
op R
dTower Rd
Eastchase PkwyWell Rd
N De
catur
St
Ray Thorington Rd
Tine Ave
Dalra
ida R
d
Fernway Dr
Rigby St
Co R d 83
Roquemore St
Duff St
Harrison Rd
6th St
Seibles Rd
W Fleming Rd
N Bu
rbank
Dr
Ellis
Dr
Fairla
ne D
r
Arrowhead DrGood
e St
Co Rd 2120
Audu
bon R
d
Hillm
an S
t
Folmar Pkwy
Chisholm St
Semi
nole
Dr
Wille
na S
t
3rd St
Halcyon Blvd
Beardsley Dr
Payn
e Rd
Felder Rd
Pineb
rook D
r
Buckingham Dr
Bienville Rd Oldfi
eld D
r
Co R d 64
Milan Dr
Clay St
University Dr
Mobil
e Dr
Poplar St
Lakeridge D r
Dunb
arton
Rd
Monticello Dr
Pike R
d
Eric
Ln
Kingsb
ury Dr
Adler Dr
Lemay Plz
Bran
twoo
d Dr
Rabbit t Rd
Clayton St
Eastchase Ln
Aronov Ave
Alta Rd
Marston Way
Lancaster LnTw
ining
St
Lagoon Park Dr
Otis Ln
Tara L
n
Jeffrey Dr
Midpark Rd
East Dr
Sanders Ln
Herbert Dr
South
Dr
Henry Dr
Leno
x Ln
Co R d 40
Argy le R d
Wildwood DrHill H
edge
Dr
Salary St
Lafay
ette S
t
Chant illy Pkwy
Lomac St
North Dr
Arrowleaf Rd
Oak Grov
e Dr
E Vandiver Blvd
Willow St
9th St
Kathmoor Dr
State Rte 126
Wampold Rd
Hunte
r Ln
Donna Dr
Deer Creek Xing
Dyas Dr
Calmar Dr
Grande Ave
Elaine Dr
Civic St
Div ision
RdCoral Ln
E Ava
lon P
kwy
Mid Pi
nes D
r
McElvy St
Alan Ln
Brewer C
ir State R
te 21
I- 65
US Hwy 80I- 85
Taylor Rd
Montgomery Regional Airport
Maxwell Airforce Base
logos
M Transit TDP Montgomery, ALMontgomer y, AL2014 Percent Senior Populationby Census BlocksSources: Montgomery MPO, U.S. Census, ACS Data, VHB
± 0 2 41 Miles
August 09, 2016\\v
hb\p
roj\G
eorg
ia\62
555.0
0 Mon
tgom
ery T
DP U
pdate
\GIS\
Projec
t\Dem
ograp
hicM
appin
g\Fig
ure 24
Senio
r Pop
ulatio
n.mxd
¾¿ M Transfer Centers
®v Hospitals
City, County, State O ffi ces
M Bus Routes
State & Federal Rouads
Interstates
Local Roads
Mon tgomery Coun ty
Mon tgomery A irpor t
Local Un iversities
Military Bases
Water
Percent Seniors0% - 10%10.1% - 20%20.1% - 30%30.1% - 40%Greater than 40%
§̈¦85
§̈¦65
§̈¦65
Figure 24: Senior Population
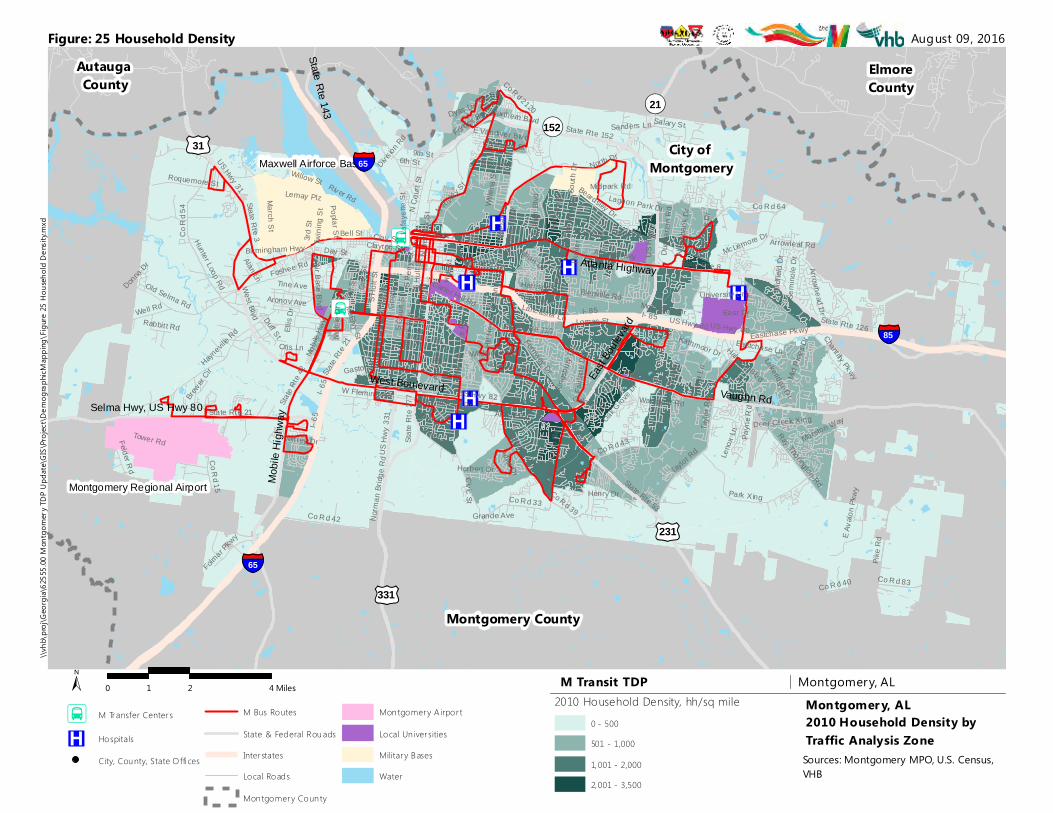
®v
®v
®v
®v
®v
®v®v
¾¿
¾¿
Montgomery County
Autauga County
ElmoreCounty
City of Montgomery
¬«152
East B
oulev
ard
£¤231
West Boulevard
Mobil
e High
way
£¤31
Vaughn Rd
¬«21
£¤331
State Rte 143
Atlanta Highway
Selma Hwy, US Hwy 80
I- 85I- 6
5
US Hwy 82 State Rte 6State Rte 21
State Rte 8
West Blvd
State
Rte 9
US H
wy 23
1
US Hwy 31State Rte 3
US Hwy 80
Bell R
d
State Rte 110
Vaughn Rd
Co R d 43
State Rte 53
Taylo
r Rd
Woodley Rd
Atlanta Hwy
State Rte 152
Northern Blvd
Co R
d 54
S Cou
rt St
Bell St
Troy HwyNa
rrow
Lane
Rd
Wares Ferry Rd
Norm
an B
ridge
Rd
S Perr
y St
Oak S
t
Park Xing
State
Rte 4
2
Hill S
t
Co R d 42
State Rte 108
Hall S
t
Hunter Loop Rd
Birmingham Hwy
Ann S
t
Colis
eum
Blvd
US H
wy 33
1Ro
sa L
Parks
Ave
Carter Hill Rd
River Rd
Co Rd 15
Co R d 33
March St
Old Selma Rd
N Co
urt S
t
Fede
ral D
r
Foshee Rd
Mobile
Hwy
S Hull
St
Hayneville
Rd
Co Rd 39
McGehee Rd
Forbes Dr
State
Rte 2
77
McLemore Dr
Air Base Blvd
Highland Ave
S Holt
St
Day St
Gilm
er Av
e
Gaston Ave
Perry
Hill
Rd
N Ripley S
t
Virgin
ia Lo
op R
dTower Rd
Eastchase PkwyWell Rd
N De
catur
St
Ray Thorington Rd
Tine Ave
Dalra
ida R
d
Fernway Dr
Rigby St
Co R d 83
Roquemore St
Duff St
Harrison Rd
6th St
Seibles Rd
W Fleming Rd
N Bu
rbank
Dr
Ellis
Dr
Fairla
ne D
r
Arrowhead DrGood
e St
Co Rd 2120
Audu
bon R
d
Hillm
an S
t
Folmar Pkwy
Chisholm St
Semi
nole
Dr
Wille
na S
t
3rd St
Halcyon Blvd
Beardsley Dr
Payn
e Rd
Felder Rd
Pineb
rook D
r
Buckingham Dr
Bienville Rd Oldfi
eld D
r
Co R d 64
Milan Dr
Clay St
University Dr
Mobil
e Dr
Poplar St
Lakeridge D r
Dunb
arton
Rd
Monticello Dr
Pike R
d
Eric
Ln
Kingsb
ury Dr
Adler Dr
Lemay Plz
Bran
twoo
d Dr
Rabbit t Rd
Clayton St
Eastchase Ln
Aronov Ave
Alta Rd
Marston Way
Lancaster LnTw
ining
St
Lagoon Park Dr
Otis Ln
Tara L
n
Jeffrey Dr
Midpark Rd
East Dr
Sanders Ln
Herbert Dr
South
Dr
Henry Dr
Leno
x Ln
Co R d 40
Argy le R d
Wildwood DrHill H
edge
Dr
Salary St
Lafay
ette S
t
Chant illy Pkwy
Lomac St
North Dr
Arrowleaf Rd
Oak Grov
e Dr
E Vandiver Blvd
Willow St
9th St
Kathmoor Dr
State Rte 126
Wampold Rd
Hunte
r Ln
Donna Dr
Deer Creek Xing
Dyas Dr
Calmar Dr
Grande Ave
Elaine Dr
Civic St
Div ision
RdCoral Ln
E Ava
lon P
kwy
Mid Pi
nes D
r
McElvy St
Alan Ln
Brewer C
ir State R
te 21
I- 65
US Hwy 80I- 85
Taylor Rd
Montgomery Regional Airport
Maxwell Airforce Base
logos
M Transit TDP Montgomery, ALMontgomer y, AL2010 Household Density by Traffic Analysis ZoneSources: Montgomery MPO, U.S. Census, VHB
± 0 2 41 Miles
August 09, 2016\\v
hb\p
roj\G
eorg
ia\62
555.0
0 Mon
tgom
ery T
DP U
pdate
\GIS\
Projec
t\Dem
ograp
hicM
appin
g\Fig
ure 25
Hou
sehold
Den
sity.m
xd
¾¿ M Transfer Centers
®v Hospitals
City, County, State O ffi ces
M Bus Routes
State & Federal Rouads
Interstates
Local Roads
Mon tgomery Coun ty
Mon tgomery A irpor t
Local Un iversities
Military Bases
Water
2010 Household Density, hh/sq mile0 - 500 501 - 1,000
1,001 - 2,0002,001 - 3,500
§̈¦85
§̈¦65
§̈¦65
Figure: 25 Household Density
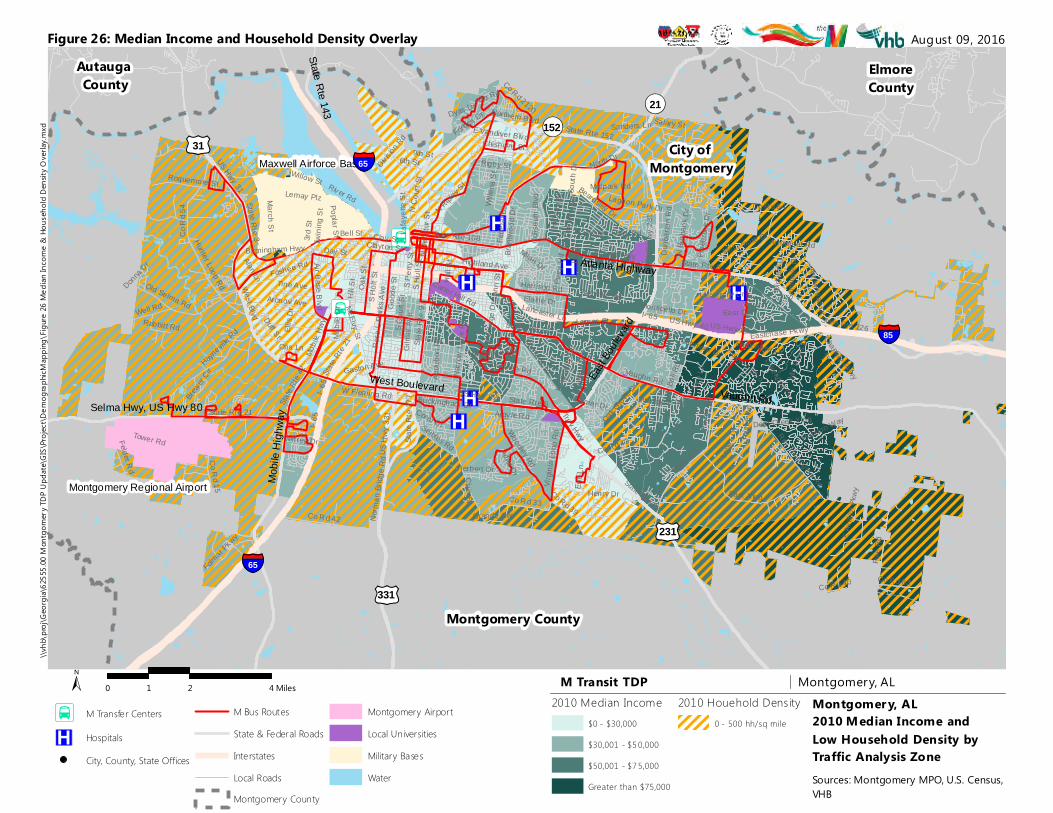
®v
®v
®v
®v
®v
®v®v
¾¿
¾¿
Montgomery County
Autauga County
ElmoreCounty
City of Montgomery
¬«152
East B
oulev
ard
£¤231
West Boulevard
Mobil
e High
way
£¤31
Vaughn Rd
¬«21
£¤331
State Rte 143
Atlanta Highway
Selma Hwy, US Hwy 80
I- 85I- 6
5
US Hwy 82 State Rte 6State Rte 21
State Rte 8
West Blvd
State
Rte 9
US H
wy 23
1
US Hwy 31State Rte 3
US Hwy 80
Bell R
d
State Rte 110
Vaughn Rd
Co R d 43
State Rte 53
Taylo
r Rd
Woodley Rd
Atlanta Hwy
State Rte 152
Northern Blvd
Co R
d 54
S Cou
rt St
Bell St
Troy HwyNa
rrow
Lane
Rd
Wares Ferry Rd
Norm
an B
ridge
Rd
S Perr
y St
Oak S
t
Park Xing
State
Rte 4
2
Hill S
t
Co R d 42
State Rte 108
Hall S
t
Hunter Loop Rd
Birmingham Hwy
Ann S
t
Colis
eum
Blvd
US H
wy 33
1Ro
sa L
Parks
Ave
Carter Hill Rd
River Rd
Co Rd 15
Co R d 33
March St
Old Selma Rd
N Co
urt S
t
Fede
ral D
r
Foshee Rd
Mobile
Hwy
S Hull
St
Hayneville
Rd
Co Rd 39
McGehee Rd
Forbes Dr
State
Rte 2
77
McLemore Dr
Air Base Blvd
Highland Ave
S Holt
St
Day St
Gilm
er Av
e
Gaston Ave
Perry
Hill
Rd
N Ripley S
t
Virgin
ia Lo
op R
dTower Rd
Eastchase PkwyWell Rd
N De
catur
St
Ray Thorington Rd
Tine Ave
Dalra
ida R
d
Fernway Dr
Rigby St
Co R d 83
Roquemore St
Duff St
Harrison Rd
6th St
Seibles Rd
W Fleming Rd
N Bu
rbank
Dr
Ellis
Dr
Fairla
ne D
r
Arrowhead DrGood
e St
Co Rd 2120
Audu
bon R
d
Hillm
an S
t
Folmar Pkwy
Chisholm St
Semi
nole
Dr
Wille
na S
t
3rd St
Halcyon Blvd
Beardsley Dr
Payn
e Rd
Felder Rd
Pineb
rook D
r
Buckingham Dr
Bienville Rd Oldfi
eld D
r
Co R d 64
Milan Dr
Clay St
University Dr
Mobil
e Dr
Poplar St
Lakeridge D r
Dunb
arton
Rd
Monticello Dr
Pike R
d
Eric
Ln
Kingsb
ury Dr
Adler Dr
Lemay Plz
Bran
twoo
d Dr
Rabbit t Rd
Clayton St
Eastchase Ln
Aronov Ave
Alta Rd
Marston Way
Lancaster LnTw
ining
St
Lagoon Park Dr
Otis Ln
Tara L
n
Jeffrey Dr
Midpark Rd
East Dr
Sanders Ln
Herbert Dr
South
Dr
Henry Dr
Leno
x Ln
Co R d 40
Argy le R d
Wildwood DrHill H
edge
Dr
Salary St
Lafay
ette S
t
Chant illy Pkwy
Lomac St
North Dr
Arrowleaf Rd
Oak Grov
e Dr
E Vandiver Blvd
Willow St
9th St
Kathmoor Dr
State Rte 126
Wampold Rd
Hunte
r Ln
Donna Dr
Deer Creek Xing
Dyas Dr
Calmar Dr
Grande Ave
Elaine Dr
Civic St
Div ision
RdCoral Ln
E Ava
lon P
kwy
Mid Pi
nes D
r
McElvy St
Alan Ln
Brewer C
ir State R
te 21
I- 65
US Hwy 80I- 85
Taylor Rd
Montgomery Regional Airport
Maxwell Airforce Base
logos
M Transit TDP Montgomery, ALMontgomer y, AL2010 Median Income andLow Household Density byTraffic Analysis ZoneSources: Montgomery MPO, U.S. Census, VHB
± 0 2 41 Miles
August 09, 2016\\v
hb\p
roj\G
eorg
ia\62
555.0
0 Mon
tgom
ery T
DP U
pdate
\GIS\
Projec
t\Dem
ograp
hicM
appin
g\Fig
ure 26
Med
ian In
come
& H
ouse
hold
Dens
ity O
verla
y.mxd
¾¿ M Transfer Centers
®v HospitalsCity, County, State Offices
M Bus RoutesState & Federal RoadsInterstatesLocal RoadsMontgomery County
Montgomery AirportLocal UniversitiesMilitary BasesWater
2010 Median Income$0 - $30,000
$30,001 - $5 0,000
$50,001 - $7 5,000
Greater than $75,000
2010 Houehold Dens ity0 - 500 hh/sq mile
§̈¦85
§̈¦65
§̈¦65
Figure 26: Median Income and Household Density Overlay
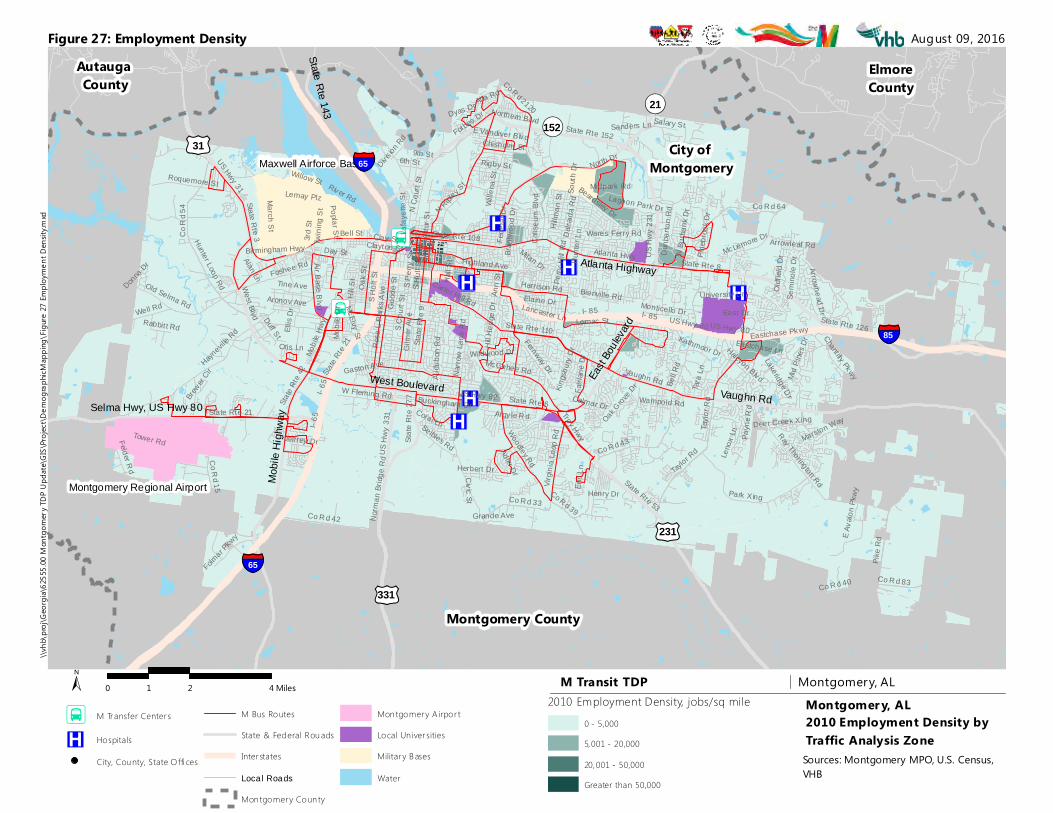
®v
®v
®v
®v
®v
®v®v
¾¿
¾¿
Montgomery County
Autauga County
ElmoreCounty
City of Montgomery
¬«152
East B
oulev
ard
£¤231
West Boulevard
Mobil
e High
way
£¤31
Vaughn Rd
¬«21
£¤331
State Rte 143
Atlanta Highway
Selma Hwy, US Hwy 80
I- 85I- 6
5
US Hwy 82 State Rte 6State Rte 21
State Rte 8
West Blvd
State
Rte 9
US H
wy 23
1
US Hwy 31State Rte 3
US Hwy 80
Bell R
d
State Rte 110
Vaughn Rd
Co R d 43
State Rte 53
Taylo
r Rd
Woodley Rd
Atlanta Hwy
State Rte 152
Northern Blvd
Co R
d 54
S Cou
rt St
Bell St
Troy HwyNa
rrow
Lane
Rd
Wares Ferry Rd
Norm
an B
ridge
Rd
S Perr
y St
Oak S
t
Park Xing
State
Rte 4
2
Hill S
t
Co R d 42
State Rte 108
Hall S
t
Hunter Loop Rd
Birmingham Hwy
Ann S
t
Colis
eum
Blvd
US H
wy 33
1Ro
sa L
Parks
Ave
Carter Hill Rd
River Rd
Co Rd 15
Co R d 33
March St
Old Selma Rd
N Co
urt S
t
Fede
ral D
r
Foshee Rd
Mobile
Hwy
S Hull
St
Hayneville
Rd
Co Rd 39
McGehee Rd
Forbes Dr
State
Rte 2
77
McLemore Dr
Air Base Blvd
Highland Ave
S Holt
St
Day St
Gilm
er Av
e
Gaston Ave
Perry
Hill
Rd
N Ripley S
t
Virgin
ia Lo
op R
dTower Rd
Eastchase PkwyWell Rd
N De
catur
St
Ray Thorington Rd
Tine Ave
Dalra
ida R
d
Fernway Dr
Rigby St
Co R d 83
Roquemore St
Duff St
Harrison Rd
6th St
Seibles Rd
W Fleming Rd
N Bu
rbank
Dr
Ellis
Dr
Fairla
ne D
r
Arrowhead DrGood
e St
Co Rd 2120
Audu
bon R
d
Hillm
an S
t
Folmar Pkwy
Chisholm St
Semi
nole
Dr
Wille
na S
t
3rd St
Halcyon Blvd
Beardsley Dr
Payn
e Rd
Felder Rd
Pineb
rook D
r
Buckingham Dr
Bienville Rd Oldfi
eld D
r
Co R d 64
Milan Dr
Clay St
University Dr
Mobil
e Dr
Poplar St
Lakeridge D r
Dunb
arton
Rd
Monticello Dr
Pike R
d
Eric
Ln
Kingsb
ury Dr
Adler Dr
Lemay Plz
Bran
twoo
d Dr
Rabbit t Rd
Clayton St
Eastchase Ln
Aronov Ave
Alta Rd
Marston Way
Lancaster LnTw
ining
St
Lagoon Park Dr
Otis Ln
Tara L
n
Jeffrey Dr
Midpark Rd
East Dr
Sanders Ln
Herbert Dr
South
Dr
Henry Dr
Leno
x Ln
Co R d 40
Argy le R d
Wildwood DrHill H
edge
Dr
Salary St
Lafay
ette S
t
Chant illy Pkwy
Lomac St
North Dr
Arrowleaf Rd
Oak Grov
e Dr
E Vandiver Blvd
Willow St
9th St
Kathmoor Dr
State Rte 126
Wampold Rd
Hunte
r Ln
Donna Dr
Deer Creek Xing
Dyas Dr
Calmar Dr
Grande Ave
Elaine Dr
Civic St
Div ision
RdCoral Ln
E Ava
lon P
kwy
Mid Pi
nes D
r
McElvy St
Alan Ln
Brewer C
ir State R
te 21
I- 65
US Hwy 80I- 85
Taylor Rd
Montgomery Regional Airport
Maxwell Airforce Base
logos
M Transit TDP Montgomery, ALMontgomer y, AL2010 Employment Density by Traffic Analysis ZoneSources: Montgomery MPO, U.S. Census, VHB
± 0 2 41 Miles
August 09, 2016\\v
hb\p
roj\G
eorg
ia\62
555.0
0 Mon
tgom
ery T
DP U
pdate
\GIS\
Projec
t\Dem
ograp
hicM
appin
g\Fig
ure 27
Emplo
ymen
t Den
sity.m
xd
¾¿ M Transfer Centers
®v Hospitals
City, County, State O ffi ces
M Bus Routes
State & Federal Rouads
Interstates
Local Roads
Montgomery Coun ty
Mon tgomery A irpor t
Local Un iversities
Military Bases
Water
2010 Employment Density, jobs/sq mile0 - 5,0005,001 - 20,000
20,001 - 50,000Greater than 50,000
§̈¦85
§̈¦65
§̈¦65
Figure 27: Employment Density
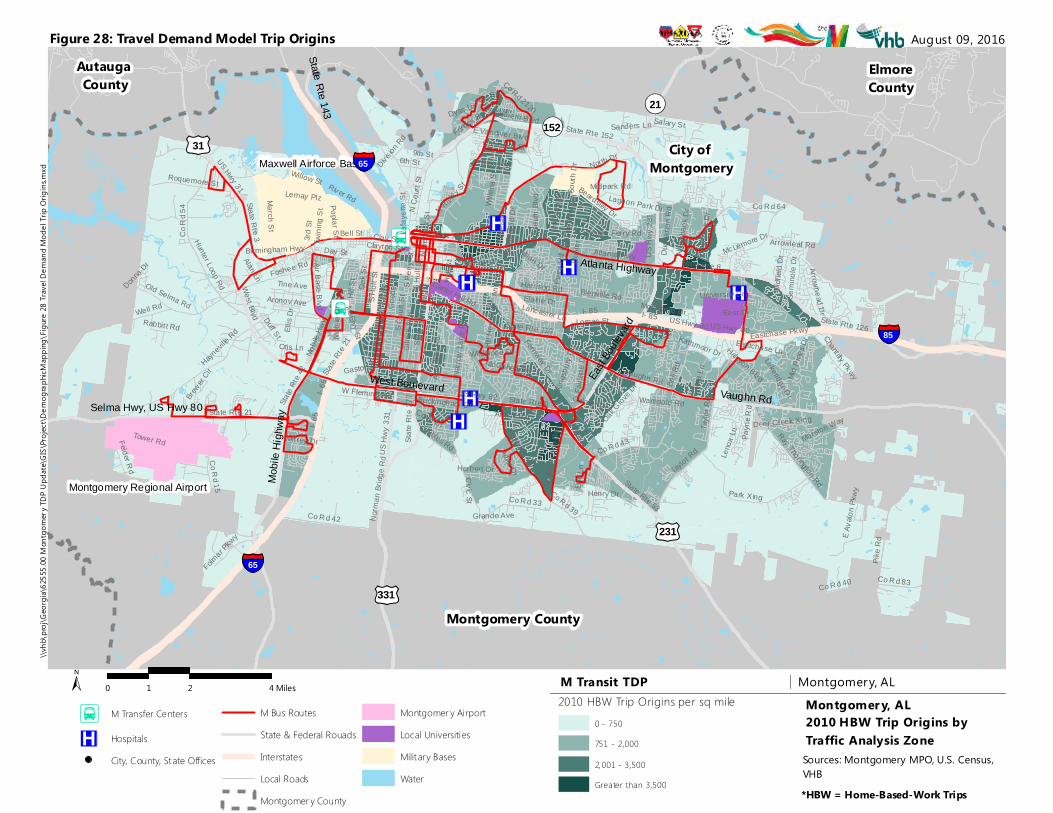
®v
®v
®v
®v
®v
®v®v
¾¿
¾¿
Montgomery County
Autauga County
ElmoreCounty
City of Montgomery
¬«152
East B
oulev
ard
£¤231
West Boulevard
Mobil
e High
way
£¤31
Vaughn Rd
¬«21
£¤331
State Rte 143
Atlanta Highway
Selma Hwy, US Hwy 80
I- 85I- 6
5
US Hwy 82 State Rte 6State Rte 21
State Rte 8
West Blvd
State
Rte 9
US H
wy 23
1
US Hwy 31State Rte 3
US Hwy 80
Bell R
d
State Rte 110
Vaughn Rd
Co R d 43
State Rte 53
Taylo
r Rd
Woodley Rd
Atlanta Hwy
State Rte 152
Northern Blvd
Co R
d 54
S Cou
rt St
Bell St
Troy HwyNa
rrow
Lane
Rd
Wares Ferry Rd
Norm
an B
ridge
Rd
S Perr
y St
Oak S
t
Park Xing
State
Rte 4
2
Hill S
t
Co R d 42
State Rte 108
Hall S
t
Hunter Loop Rd
Birmingham Hwy
Ann S
t
Colis
eum
Blvd
US H
wy 33
1Ro
sa L
Parks
Ave
Carter Hill Rd
River Rd
Co Rd 15
Co R d 33
March St
Old Selma Rd
N Co
urt S
t
Fede
ral D
r
Foshee Rd
Mobile
Hwy
S Hull
St
Hayneville
Rd
Co Rd 39
McGehee Rd
Forbes Dr
State
Rte 2
77
McLemore Dr
Air Base Blvd
Highland Ave
S Holt
St
Day St
Gilm
er Av
e
Gaston Ave
Perry
Hill
Rd
N Ripley S
t
Virgin
ia Lo
op R
dTower Rd
Eastchase PkwyWell Rd
N De
catur
St
Ray Thorington Rd
Tine Ave
Dalra
ida R
d
Fernway Dr
Rigby St
Co R d 83
Roquemore St
Duff St
Harrison Rd
6th St
Seibles Rd
W Fleming Rd
N Bu
rbank
Dr
Ellis
Dr
Fairla
ne D
r
Arrowhead DrGood
e St
Co Rd 2120
Audu
bon R
d
Hillm
an S
t
Folmar Pkwy
Chisholm St
Semi
nole
Dr
Wille
na S
t
3rd St
Halcyon Blvd
Beardsley Dr
Payn
e Rd
Felder Rd
Pineb
rook D
r
Buckingham Dr
Bienville Rd Oldfi
eld D
r
Co R d 64
Milan Dr
Clay St
University Dr
Mobil
e Dr
Poplar St
Lakeridge D r
Dunb
arton
Rd
Monticello Dr
Pike R
d
Eric
Ln
Kingsb
ury Dr
Adler Dr
Lemay Plz
Bran
twoo
d Dr
Rabbit t Rd
Clayton St
Eastchase Ln
Aronov Ave
Alta Rd
Marston Way
Lancaster LnTw
ining
St
Lagoon Park Dr
Otis Ln
Tara L
n
Jeffrey Dr
Midpark Rd
East Dr
Sanders Ln
Herbert Dr
South
Dr
Henry Dr
Leno
x Ln
Co R d 40
Argy le R d
Wildwood DrHill H
edge
Dr
Salary St
Lafay
ette S
t
Chant illy Pkwy
Lomac St
North Dr
Arrowleaf Rd
Oak Grov
e Dr
E Vandiver Blvd
Willow St
9th St
Kathmoor Dr
State Rte 126
Wampold Rd
Hunte
r Ln
Donna Dr
Deer Creek Xing
Dyas Dr
Calmar Dr
Grande Ave
Elaine Dr
Civic St
Div ision
RdCoral Ln
E Ava
lon P
kwy
Mid Pi
nes D
r
McElvy St
Alan Ln
Brewer C
ir State R
te 21
I- 65
US Hwy 80I- 85
Taylor Rd
Montgomery Regional Airport
Maxwell Airforce Base
logos
M Transit TDP Montgomery, ALMontgomer y, AL2010 HBW Trip Origins byTraffic Analysis ZoneSources: Montgomery MPO, U.S. Census, VHB
± 0 2 41 Miles
August 09, 2016\\v
hb\p
roj\G
eorg
ia\62
555.0
0 Mon
tgom
ery T
DP U
pdate
\GIS\
Projec
t\Dem
ograp
hicM
appin
g\Fig
ure 28
Trav
el De
mand
Mod
el Tri
p Orig
ins.m
xd
¾¿ M Transfer Centers
®v HospitalsCity, County, State Offices
M Bus RoutesState & Federal RouadsInterstatesLocal RoadsMontgomer y County
Montgomer y AirportLocal UniversitiesMilitary BasesWater
2010 HBW Trip Origins per sq mile0 - 750751 - 2,000
2,001 - 3,500Greater than 3,500
§̈¦85
§̈¦65
§̈¦65
*HBW = Home-Based-Work Trips
Figure 28: Travel Demand Model Trip Origins
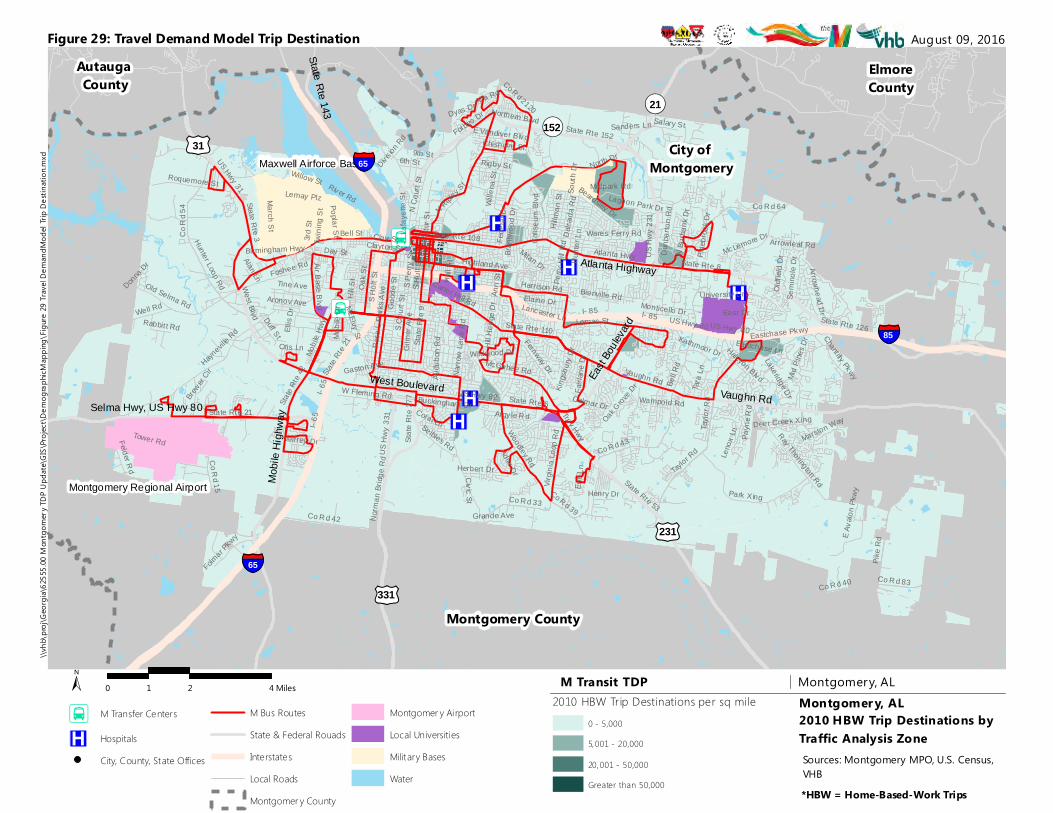
®v
®v
®v
®v
®v
®v®v
¾¿
¾¿
Montgomery County
Autauga County
ElmoreCounty
City of Montgomery
¬«152
East B
oulev
ard
£¤231
West Boulevard
Mobil
e High
way
£¤31
Vaughn Rd
¬«21
£¤331
State Rte 143
Atlanta Highway
Selma Hwy, US Hwy 80
I- 85I- 6
5
US Hwy 82 State Rte 6State Rte 21
State Rte 8
West Blvd
State
Rte 9
US H
wy 23
1
US Hwy 31State Rte 3
US Hwy 80
Bell R
d
State Rte 110
Vaughn Rd
Co R d 43
State Rte 53
Taylo
r Rd
Woodley Rd
Atlanta Hwy
State Rte 152
Northern Blvd
Co R
d 54
S Cou
rt St
Bell St
Troy HwyNa
rrow
Lane
Rd
Wares Ferry Rd
Norm
an B
ridge
Rd
S Perr
y St
Oak S
t
Park Xing
State
Rte 4
2
Hill S
t
Co R d 42
State Rte 108
Hall S
t
Hunter Loop Rd
Birmingham Hwy
Ann S
t
Colis
eum
Blvd
US H
wy 33
1Ro
sa L
Parks
Ave
Carter Hill Rd
River Rd
Co Rd 15
Co R d 33
March St
Old Selma Rd
N Co
urt S
t
Fede
ral D
r
Foshee Rd
Mobile
Hwy
S Hull
St
Hayneville
Rd
Co Rd 39
McGehee Rd
Forbes Dr
State
Rte 2
77
McLemore Dr
Air Base Blvd
Highland Ave
S Holt
St
Day St
Gilm
er Av
e
Gaston Ave
Perry
Hill
Rd
N Ripley S
t
Virgin
ia Lo
op R
dTower Rd
Eastchase PkwyWell Rd
N De
catur
St
Ray Thorington Rd
Tine Ave
Dalra
ida R
d
Fernway Dr
Rigby St
Co R d 83
Roquemore St
Duff St
Harrison Rd
6th St
Seibles Rd
W Fleming Rd
N Bu
rbank
Dr
Ellis
Dr
Fairla
ne D
r
Arrowhead DrGood
e St
Co Rd 2120
Audu
bon R
d
Hillm
an S
t
Folmar Pkwy
Chisholm St
Semi
nole
Dr
Wille
na S
t
3rd St
Halcyon Blvd
Beardsley Dr
Payn
e Rd
Felder Rd
Pineb
rook D
r
Buckingham Dr
Bienville Rd Oldfi
eld D
r
Co R d 64
Milan Dr
Clay St
University Dr
Mobil
e Dr
Poplar St
Lakeridge D r
Dunb
arton
Rd
Monticello Dr
Pike R
d
Eric
Ln
Kingsb
ury Dr
Adler Dr
Lemay Plz
Bran
twoo
d Dr
Rabbit t Rd
Clayton St
Eastchase Ln
Aronov Ave
Alta Rd
Marston Way
Lancaster LnTw
ining
St
Lagoon Park Dr
Otis Ln
Tara L
n
Jeffrey Dr
Midpark Rd
East Dr
Sanders Ln
Herbert Dr
South
Dr
Henry Dr
Leno
x Ln
Co R d 40
Argy le R d
Wildwood DrHill H
edge
Dr
Salary St
Lafay
ette S
t
Chant illy Pkwy
Lomac St
North Dr
Arrowleaf Rd
Oak Grov
e Dr
E Vandiver Blvd
Willow St
9th St
Kathmoor Dr
State Rte 126
Wampold Rd
Hunte
r Ln
Donna Dr
Deer Creek Xing
Dyas Dr
Calmar Dr
Grande Ave
Elaine Dr
Civic St
Div ision
RdCoral Ln
E Ava
lon P
kwy
Mid Pi
nes D
r
McElvy St
Alan Ln
Brewer C
ir State R
te 21
I- 65
US Hwy 80I- 85
Taylor Rd
Montgomery Regional Airport
Maxwell Airforce Base
logos
M Transit TDP Montgomery, ALMontgomer y, AL2010 HBW Trip Destinations byTraffic Analysis ZoneSources: Montgomery MPO, U.S. Census, VHB
± 0 2 41 Miles
August 09, 2016\\v
hb\p
roj\G
eorg
ia\62
555.0
0 Mon
tgom
ery T
DP U
pdate
\GIS\
Projec
t\Dem
ograp
hicM
appin
g\Fig
ure 29
Trav
el De
mand
Mode
l Trip
Des
tinati
on.m
xd
¾¿ M Transfer Centers
®v HospitalsCity, County, State Offices
M Bus RoutesState & Federal RouadsInterstatesLocal RoadsMontgomer y County
Montgomer y AirportLocal UniversitiesMilitary BasesWater
2010 HBW Trip Destinations per sq mile0 - 5,0005,001 - 20,000
20,001 - 50,000Greater than 50,000
§̈¦85
§̈¦65
§̈¦65
*HBW = Home-Based-Work Trips
Figure 29: Travel Demand Model Trip Destination
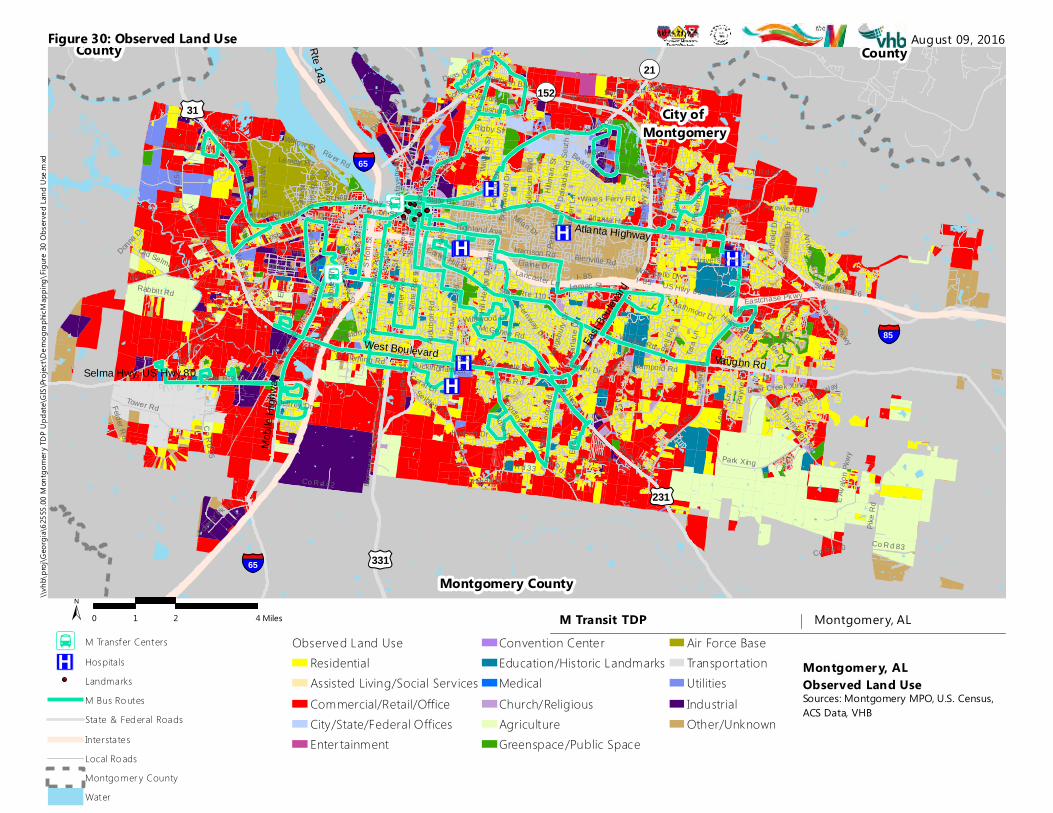
®v
®v
®v
®v
®v
®v®v
¾¿
¾¿
Montgomery County
Autauga County
ElmoreCounty
City of Montgomery
¬«152
East B
oulev
ard
£¤231
West Boulevard
Mobil
e High
way
£¤31
Vaughn Rd
¬«21
£¤331
State Rte 143
Atlanta Highway
Selma Hwy, US Hwy 80
I- 85
I- 65
US Hwy 82 State Rte 6State Rte 21
State Rte 8
West Blvd
State
Rte 9
US H
wy 23
1
US Hwy 31State Rte 3
US Hwy 80
Bell R
d
State Rte 110
Vaughn Rd
Co R d 43
State Rte 53
Taylo
r Rd
Woodley Rd
Atlanta Hwy
State Rte 152
Northern Blvd
Co R
d 54
S Cou
rt St
Bell St
Troy Hwy
Narro
w La
ne R
d
Wares Ferry Rd
Norm
an B
ridge
Rd
S Perr
y St
Oak S
t
Park Xing
State
Rte 4
2
Hill S
t
Co R d 42
State Rte 108
Hall S
t
Hunter Loop Rd
Birmingham Hwy
Ann S
t
Colis
eum
Blvd
US H
wy 33
1Ro
sa L
Parks
Ave
Carter Hill Rd
River Rd
Co Rd 15
Co R d 33
March St
Old Selma Rd
N Co
urt S
t
Fede
ral D
r
Foshee Rd
Mobile
Hwy
S Hull
St
Hayneville
Rd
Co Rd 39
McGehee Rd
Forbes Dr
State
Rte 2
77
McLemore Dr
Air Base Blvd
Highland Ave
S Holt
St
Day St
Gilm
er Av
e
Gaston Ave
Perry
Hill
Rd
N Ripley S
t
Virgin
ia Lo
op R
dTower Rd
Eastchase PkwyWell Rd
N De
catur
St
Ray Thorington RdTine Ave
Dalra
ida R
d
Fernway Dr
Rigby St
Co R d 83
Roquemore St
Duff St
Harrison Rd
6th St
Seibles Rd
W Fleming Rd
N Bu
rbank
Dr
Ellis
Dr
Fairla
ne D
r
Arrowhead DrGood
e St
Audu
bon R
d
Hillm
an S
t
Folmar Pkwy
Chisholm St
Semi
nole
Dr
Wille
na S
t
3rd St
Halcyon Blvd
Beardsley Dr
Payn
e Rd
Felder Rd
Pineb
rook D
r
Buckingham Dr
Bienville Rd
Oldfi
eld D
r
Co R d 64
Milan Dr
Clay St
University Dr
Mobil
e Dr
Poplar St
Lakeridge D r
Dunb
arton
Rd
Monticello Dr
Pike R
d
Eric
Ln
Kingsb
ury Dr
Adler Dr
Lemay Plz
Bran
twoo
d Dr
Rabbit t Rd
Clayton St
Eastchase Ln
Aronov Ave
Alta Rd
Marston Way
Lancaster Ln
Twini
ng S
t
Lagoon Park Dr
Otis Ln
Tara L
n
Jeffrey Dr
Midpark Rd
East Dr
Sanders Ln
Herbert Dr
South
Dr
Henry Dr
Leno
x Ln
Co R d 40
Argy le R d
Wildwood DrHill H
edge
Dr
Salary St
Lafay
ette S
t
Chant illy Pkwy
Lomac St
North Dr
Arrowleaf Rd
Oak Grov
e Dr
E Vandiver Blvd
Willow St
9th St
Kathmoor Dr
State Rte 126
Wampold Rd
Hunte
r Ln
Donna Dr
Deer Creek Xing
Dyas Dr
Calmar Dr
Grande Ave
Elaine Dr
Civic St
Div ision
RdCoral Ln
E Ava
lon P
kwy
Mid Pi
nes D
r
McElvy St
Alan Ln
Brewer C
ir State R
te 21
I- 65
US Hwy 80I- 85
Taylor Rd
logos
M Transit TDP Montgomery, AL
Montgomer y, ALObserved Land UseSources: Montgomery MPO, U.S. Census, ACS Data, VHB
± 0 2 41 Miles
August 09, 2016\\v
hb\p
roj\G
eorg
ia\62
555.0
0 Mon
tgom
ery T
DP U
pdate
\GIS\
Projec
t\Dem
ograp
hicM
appin
g\Fig
ure 30
Obs
erved
Land
Use
.mxd
¾¿ M Transfer Centers
®v Hospita lsLandmarksM Bus Ro utesState & Fed eral RoadsInterstatesLocal Ro adsMontgo mer y CountyWater
Observed Land UseResidentialAssisted Living/Social ServicesCommercial/Retail/OfficeCity/State/Federal OfficesEnter tainment
Convention CenterEducation/Historic LandmarksMedicalChurch/ReligiousAgricultureGreenspace/Public Space
Air Force BaseTransportationUtilitiesIndustrialOther/Unknown
§̈¦85
§̈¦65
§̈¦65
Figure 30: Observed Land Use
Montgomery Transit Development Plan Update 2017-2021
47
6 TDP Goals & Performance
Measures
6.1 Introduction The previous TDP did not have any specified goals for the M Transit
System. To guide the development and selection of scenarios, this section
draws from the Montgomery regional Long-Range Transportation Plan
(LRTP), stakeholder input, and peer reviews to develop transit-specific
goals for the TDP. The goals developed here will include associated
performance measure that are SMART (Specific, Measurable, Achievable,
Realistic, Time-Bound) and make use of existing data.
As noted within the review of the previous studies, there were no goals
included within the previous TDP. In fact, the only study reviewed with
goals that would lend themselves to the TDP was the 2040 LRTP update.
The table below lists the LRTP goals, the MAP-21 (FAST Act) emphasis
areas they were meant to address, and their linkage to the TDP.
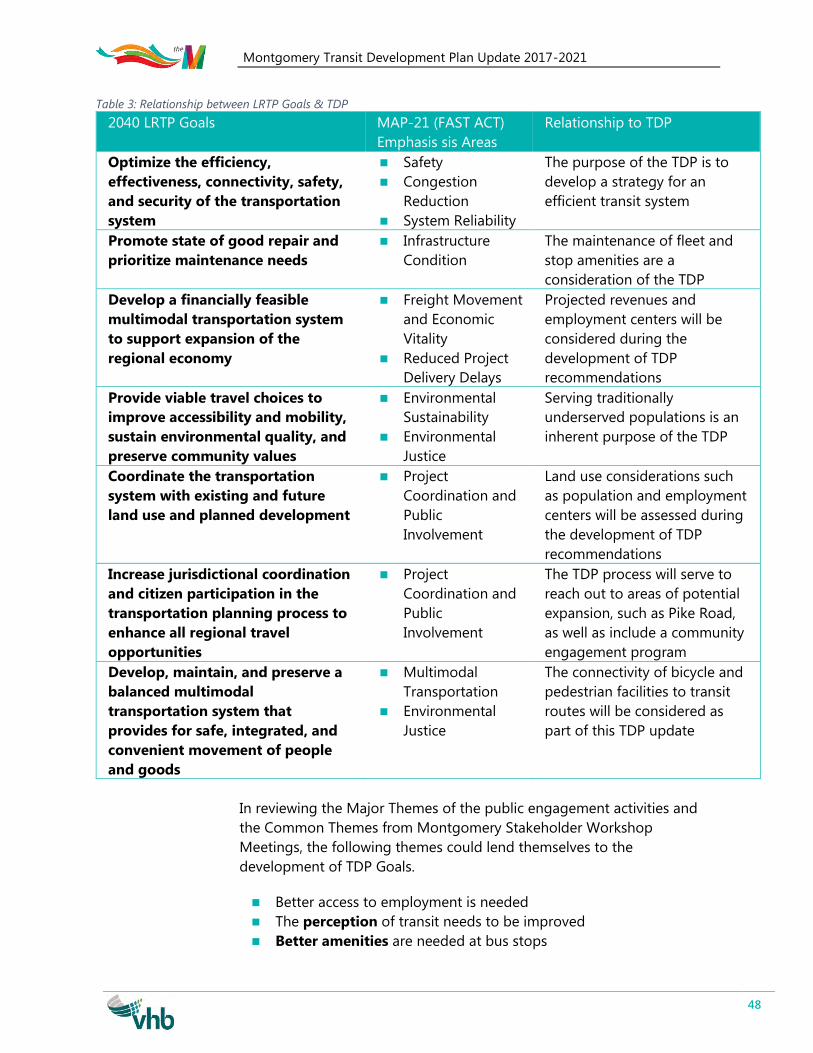
Montgomery Transit Development Plan Update 2017-2021
48
Table 3: Relationship between LRTP Goals & TDP
2040 LRTP Goals MAP-21 (FAST ACT)
Emphasis sis Areas
Relationship to TDP
Optimize the efficiency,
effectiveness, connectivity, safety,
and security of the transportation
system
Safety
Congestion
Reduction
System Reliability
The purpose of the TDP is to
develop a strategy for an
efficient transit system
Promote state of good repair and
prioritize maintenance needs
Infrastructure
Condition
The maintenance of fleet and
stop amenities are a
consideration of the TDP
Develop a financially feasible
multimodal transportation system
to support expansion of the
regional economy
Freight Movement
and Economic
Vitality
Reduced Project
Delivery Delays
Projected revenues and
employment centers will be
considered during the
development of TDP
recommendations
Provide viable travel choices to
improve accessibility and mobility,
sustain environmental quality, and
preserve community values
Environmental
Sustainability
Environmental
Justice
Serving traditionally
underserved populations is an
inherent purpose of the TDP
Coordinate the transportation
system with existing and future
land use and planned development
Project
Coordination and
Public
Involvement
Land use considerations such
as population and employment
centers will be assessed during
the development of TDP
recommendations
Increase jurisdictional coordination
and citizen participation in the
transportation planning process to
enhance all regional travel
opportunities
Project
Coordination and
Public
Involvement
The TDP process will serve to
reach out to areas of potential
expansion, such as Pike Road,
as well as include a community
engagement program
Develop, maintain, and preserve a
balanced multimodal
transportation system that
provides for safe, integrated, and
convenient movement of people
and goods
Multimodal
Transportation
Environmental
Justice
The connectivity of bicycle and
pedestrian facilities to transit
routes will be considered as
part of this TDP update
In reviewing the Major Themes of the public engagement activities and
the Common Themes from Montgomery Stakeholder Workshop
Meetings, the following themes could lend themselves to the
development of TDP Goals.
Better access to employment is needed
The perception of transit needs to be improved
Better amenities are needed at bus stops
Montgomery Transit Development Plan Update 2017-2021
49
More service coverage is needed
Reliability is a perceived problem
The M needs to explore more funding
More education and awareness is needed
6.2 Peer Review The section provides examples of goals from other peer transit planning
documents. The peer agencies for this analysis were selected because: 1)
of similarities with regard to size, such as the Mobile Wave and Sarasota
County Area Transit; and/or 2) they provided good examples of goals and
performance measures applicable to the M Transit System, such as
Jacksonville Transit, Miami-Dade Transit and the Orlando Lynx. As a result,
the documents included in this review were:
Mobile Wave Transit Development Plan
Sarasota County Area Transit System Service Standards Report
Jacksonville Transit Authority Transit Development Plan
Miami-Dade Transit Development Plan
Orlando Lynx Transit Development Plan
Mobile Wave Transit Development Plan
The Mobile Wave TDP contained best practices for route planning and
phasing. These standards are as follows:
Service should be simple (Easy to understand)
Routes should operate along a direct path (Easy to understand)
Route deviations should be minimized (Easy to understand)
Major routes should operate along arterials (Serve existing traffic)
Routes should be symmetrical (Easy to understand)
Service should be well-coordinated (Efficiency)
Service should be consistent (Reliable)
Service design should maximize service (Efficiency)
Sarasota County Area Transit Service Standards Plan
Much like Mobile, this plan contained standards that dealt specifically on
route efficiency based on the following subject areas:
Route Productivity Standards – passengers per revenue hour,
passengers per revenue mile, etc.
Service Delivery – on time performance and trips completed
Route Design – route/stop spacing, stop amenities, etc.
Schedule - headway and span of service
Jacksonville Transit Authority Transit Development Plan
Montgomery Transit Development Plan Update 2017-2021
50
The Jacksonville JTA TDP contained five goals associated with customer
service, safety and security, mobility, financial stability, education and
training, and effectiveness and efficiency, which are provided below:
Increase customer satisfaction by providing a superior and reliable
customer experience
Ensure safety and security throughout the transit system and in the
agency work environment
Deliver accessible transportation choices, providing mobility,
livability, economic prosperity and environmental sustainability
throughout the community
Provide for long-term financial stability, while increasing our
modal share and service
Inform the community on the value of a quality public
transportation system and develop a highly qualified JTA workforce
To deliver effective and quality multimodal transportation services
and facilities in an efficient manner
Miami-Dade Transit Development Plan
The Miami-Dade TDP had the following goals:
Improve convenience, reliability and customer service of transit
services
Improve operational safety and security
Improve coordination and outreach
Enhance the integration of transit services to support the economy
and preserve the environment
Maximize use of all funding sources
Maximize and expand transit services (efficiency)
Transit system shall fully meet requirements of the Americans with
Disabilities Act (ADA).
Orlando LYNX Transit Development Plan
The Orlando TDP has three goals focused on service characteristics,
communication, and funding.
Provide high quality mobility options with effective and efficient
service
Improve internal and external communication to improve
organizational efficiency and meet the evolving needs of the
community
Secure a dedicated source of funding to allow LYNX to better meet
varying transportation and infrastructure needs
Observations from Peer Review
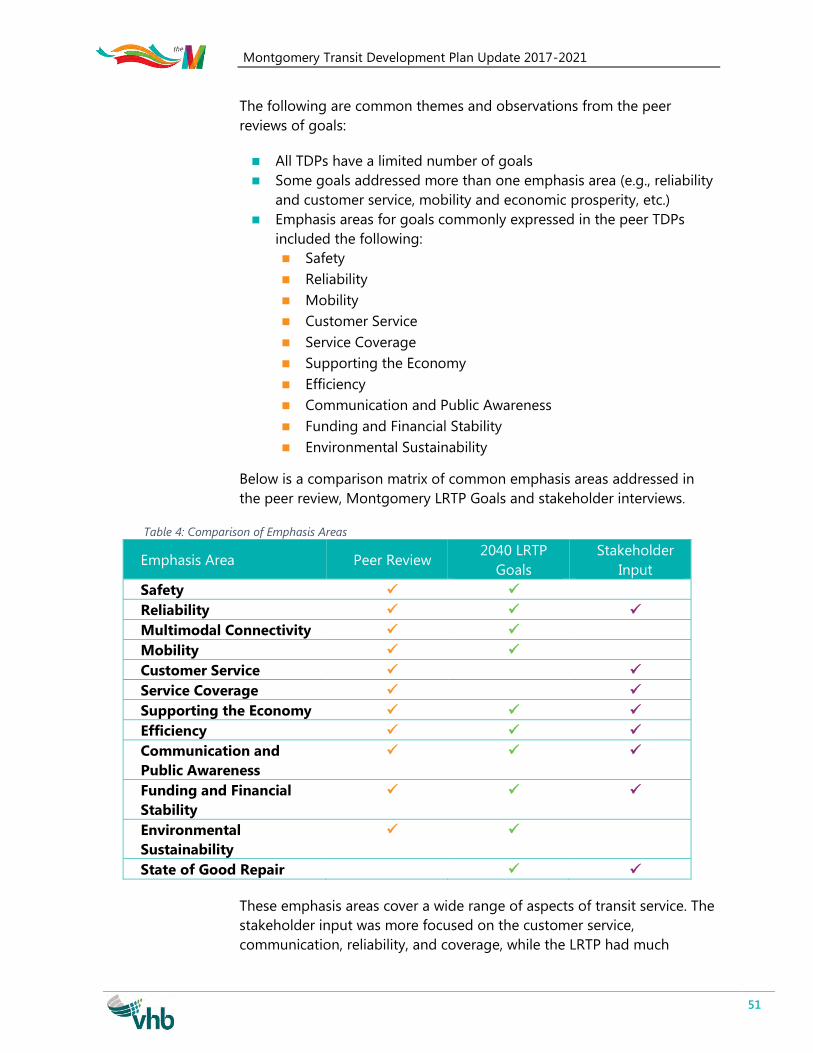
Montgomery Transit Development Plan Update 2017-2021
51
The following are common themes and observations from the peer
reviews of goals:
All TDPs have a limited number of goals
Some goals addressed more than one emphasis area (e.g., reliability
and customer service, mobility and economic prosperity, etc.)
Emphasis areas for goals commonly expressed in the peer TDPs
included the following:
Safety
Reliability
Mobility
Customer Service
Service Coverage
Supporting the Economy
Efficiency
Communication and Public Awareness
Funding and Financial Stability
Environmental Sustainability
Below is a comparison matrix of common emphasis areas addressed in
the peer review, Montgomery LRTP Goals and stakeholder interviews.
Table 4: Comparison of Emphasis Areas
Emphasis Area Peer Review 2040 LRTP
Goals
Stakeholder
Input
Safety
Reliability
Multimodal Connectivity
Mobility
Customer Service
Service Coverage
Supporting the Economy
Efficiency
Communication and
Public Awareness
Funding and Financial
Stability
Environmental
Sustainability
State of Good Repair
These emphasis areas cover a wide range of aspects of transit service. The
stakeholder input was more focused on the customer service,
communication, reliability, and coverage, while the LRTP had much
Montgomery Transit Development Plan Update 2017-2021
52
broader transportation emphasis areas. It is important to balance goal
development to ensure the goals facilitate system improvements while
remaining realistic in light of system constraints.
6.3 Goals and Performance Metrics Using peer review analysis input from the Montgomery MPO, as well as
feedback from stakeholders and the public, the following goals for the
TDP have been developed:
Enhance the integration of transit services to support the economy
and local land uses.
Provide high quality mobility options with safe, efficient service, and
multimodal connectivity.
Ensure a high level of customer service through effective
communication and public engagement.
Maximize existing funding sources and assets to provide cost-
effective service.
Maintain reliability of the transit system service through a state of
good repair
It should be noted that under the new federal transportation funding bill,
the Fixing America’s Surface Transportation (FAST) Act, performance
measures developed for the M Transit System will become part of the
required overall performance monitoring process for MPOs reporting to
the Federal Highway Administration (FHWA). Performance measures for
each goal were developed in recognition of the annual reporting needed
for the National Transit Database (NTD) to the Federal Transit
Administration (FTA). Therefore, the performance measures derived from
the TDP goals were developed based on the following factors:
Data available for analysis
Relevancy to Montgomery area and transit characteristics
Availability of staff resources for review
Transparency of process to members of policy boards (Transit Board,
MPO), transit riders and other constituents
Streamlined for reporting responsibilities to FHWA and FTA
The performance measures developed for the M Transit are provided in
Table 5.
It should be noted that the FHWA and FTA are currently in the process of
developing guidelines for performance monitoring at the MPO level.
Therefore, the performance measures presented within may need to be
amended per FHWA guidance.
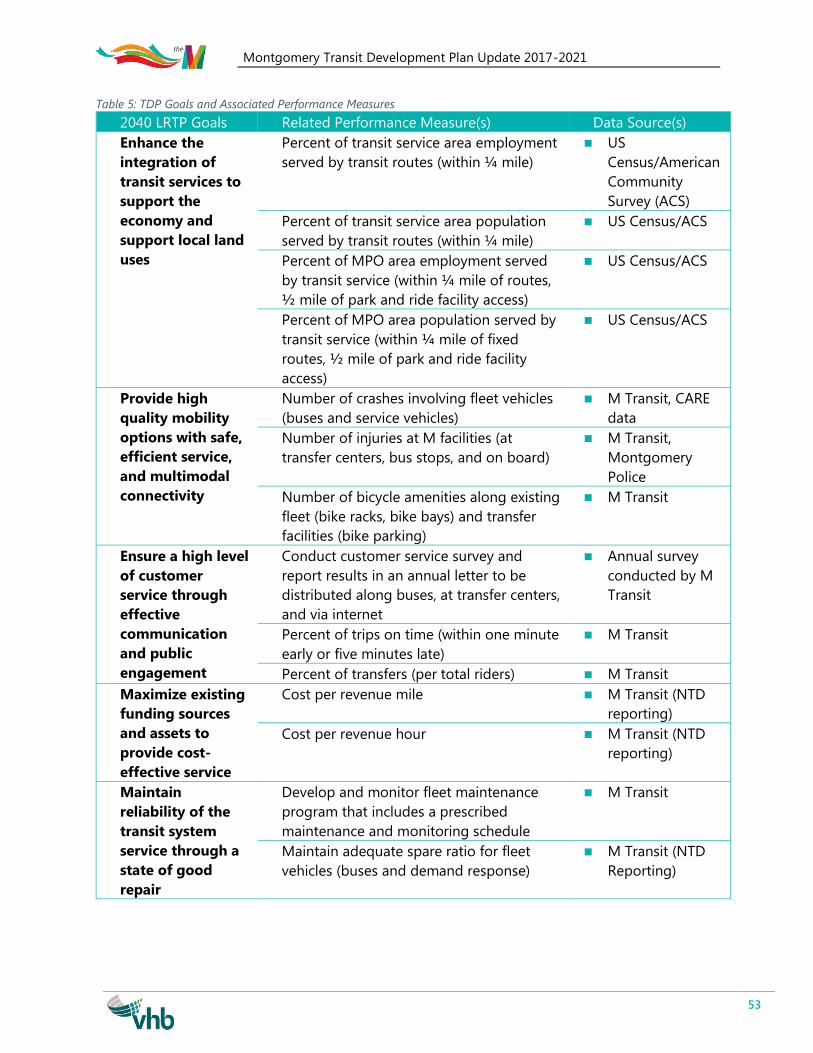
Montgomery Transit Development Plan Update 2017-2021
53
Table 5: TDP Goals and Associated Performance Measures
2040 LRTP Goals Related Performance Measure(s) Data Source(s)
Enhance the
integration of
transit services to
support the
economy and
support local land
uses
Percent of transit service area employment
served by transit routes (within ¼ mile)
US
Census/American
Community
Survey (ACS)
Percent of transit service area population
served by transit routes (within ¼ mile)
US Census/ACS
Percent of MPO area employment served
by transit service (within ¼ mile of routes,
½ mile of park and ride facility access)
US Census/ACS
Percent of MPO area population served by
transit service (within ¼ mile of fixed
routes, ½ mile of park and ride facility
access)
US Census/ACS
Provide high
quality mobility
options with safe,
efficient service,
and multimodal
connectivity
Number of crashes involving fleet vehicles
(buses and service vehicles)
M Transit, CARE
data
Number of injuries at M facilities (at
transfer centers, bus stops, and on board)
M Transit,
Montgomery
Police
Number of bicycle amenities along existing
fleet (bike racks, bike bays) and transfer
facilities (bike parking)
M Transit
Ensure a high level
of customer
service through
effective
communication
and public
engagement
Conduct customer service survey and
report results in an annual letter to be
distributed along buses, at transfer centers,
and via internet
Annual survey
conducted by M
Transit
Percent of trips on time (within one minute
early or five minutes late)
M Transit
Percent of transfers (per total riders) M Transit
Maximize existing
funding sources
and assets to
provide cost-
effective service
Cost per revenue mile M Transit (NTD
reporting)
Cost per revenue hour M Transit (NTD
reporting)
Maintain
reliability of the
transit system
service through a
state of good
repair
Develop and monitor fleet maintenance
program that includes a prescribed
maintenance and monitoring schedule
M Transit
Maintain adequate spare ratio for fleet
vehicles (buses and demand response)
M Transit (NTD
Reporting)
Montgomery Transit Development Plan Update 2017-2021
54
7 Ridership Data Summary
7.1 Overview To properly understand how the system operates, develop profiles of
individual routes, and develop recommendations; detailed ridership
information is critical. The M Transit System operates using signed and
flagged stops. Flagged stops allow anyone to board at any street corner
along routes that the operators deem safe. The purpose of this policy was
to allow those with disabilities or mobility impairments to find a place
where they can safely board the bus, if they cannot do so at a signed stop.
However, this allows all riders to take advantage of this policy and
therefore can cause delays when multiple people board separately within
a short distance, or try to chase the bus and potentially cause unsafe
situations.
This section describes the methodology used to collect data, system wide
analysis, and individual route performance. The individual route profiles
are included in the appendix.
7.2 Methodology Passenger data collection occurred April 12-15, 2016 and covered all
routes. Data were collected using tablets with ArcGIS Online (AGOL)
technology and an in-house VHB mobile application. Every time the bus
stopped, data collectors used the app to automatically record the date,
time, and location. Data collectors entered in the number of passengers
boarding and alighting. In this way, ridership on the M Transit System was
mapped.
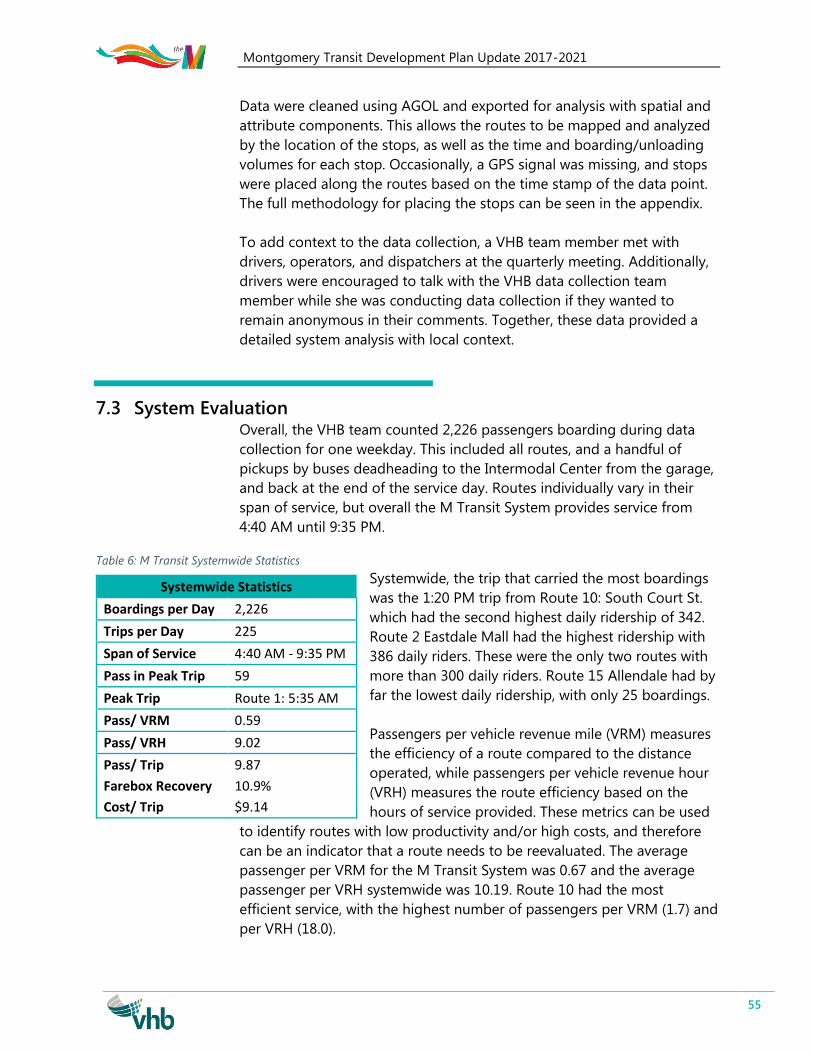
Montgomery Transit Development Plan Update 2017-2021
55
Data were cleaned using AGOL and exported for analysis with spatial and
attribute components. This allows the routes to be mapped and analyzed
by the location of the stops, as well as the time and boarding/unloading
volumes for each stop. Occasionally, a GPS signal was missing, and stops
were placed along the routes based on the time stamp of the data point.
The full methodology for placing the stops can be seen in the appendix.
To add context to the data collection, a VHB team member met with
drivers, operators, and dispatchers at the quarterly meeting. Additionally,
drivers were encouraged to talk with the VHB data collection team
member while she was conducting data collection if they wanted to
remain anonymous in their comments. Together, these data provided a
detailed system analysis with local context.
7.3 System Evaluation Overall, the VHB team counted 2,226 passengers boarding during data
collection for one weekday. This included all routes, and a handful of
pickups by buses deadheading to the Intermodal Center from the garage,
and back at the end of the service day. Routes individually vary in their
span of service, but overall the M Transit System provides service from
4:40 AM until 9:35 PM.
Table 6: M Transit Systemwide Statistics
Systemwide, the trip that carried the most boardings
was the 1:20 PM trip from Route 10: South Court St.
which had the second highest daily ridership of 342.
Route 2 Eastdale Mall had the highest ridership with
386 daily riders. These were the only two routes with
more than 300 daily riders. Route 15 Allendale had by
far the lowest daily ridership, with only 25 boardings.
Passengers per vehicle revenue mile (VRM) measures
the efficiency of a route compared to the distance
operated, while passengers per vehicle revenue hour
(VRH) measures the route efficiency based on the
hours of service provided. These metrics can be used
to identify routes with low productivity and/or high costs, and therefore
can be an indicator that a route needs to be reevaluated. The average
passenger per VRM for the M Transit System was 0.67 and the average
passenger per VRH systemwide was 10.19. Route 10 had the most
efficient service, with the highest number of passengers per VRM (1.7) and
per VRH (18.0).
Systemwide Statistics
Boardings per Day 2,226
Trips per Day 225
Span of Service 4:40 AM - 9:35 PM
Pass in Peak Trip 59
Peak Trip Route 1: 5:35 AM
Pass/ VRM 0.59
Pass/ VRH 9.02
Pass/ Trip 9.87
Farebox Recovery 10.9%
Cost/ Trip $9.14
Montgomery Transit Development Plan Update 2017-2021
56
Farebox recovery ratio examines the relationship between operating costs
and fares. Based on 2014 NTD data, approximately $1.00 was recovered
per unlinked passenger trip, despite the fact that the fare is $2.00. While it
is expected to be lower than the actual fare because of multi-day passes
and discounts for seniors and disabled riders, this is particularly low
because of the large number of transfers. In surveys, a large number of
riders stated they had to transfer on most trips, some even stating they
needed to transfer twice within a one-way trip, which likely contributed to
the low systemwide farebox recovery of 12.3%. Routes 10 and 2 had the
highest farebox recovery ratio with 21.7% and 20.3% respectively.
Systemwide, the average cost per trip was $8.09, with a large range across
all routes from $23.09 on Route 15 Allendale down to $4.58 on Route 10
Ridgecrest. The cost per trip for individual routes can be on indicator of
routes that are financially unfeasible and those with a high demand.
Another way to analyze the system is by using heat maps. Figure 31
shows heat maps of the system to identify areas where a lot of riders are
boarding. Figure 33Figure 32 shows all boardings for the system, and there
are clearly two main hotspots where the Intermodal and West Fairview
Transfer Centers are. These are inflated due to the number of people
transferring at these locations and not necessarily beginning their trips
here. To address this, Figure 32 performs the same density analysis
without those two transfer centers. Once removed, the One Center stands
out along with the intersection of Fairview Street and Rosa Parks Avenue,
the area just west of downtown, and Eastdale Mall.
It is also worth noting that while the neighborhood of Winderton on
Route 6 registers on the density analysis, the neighborhoods along
Highway 80, Gunter Annex, and at the intersection of Taylor Road and
Vaughn Road do not even register and have the lowest boarding density
within the system.
Individual route heat maps can be found in the appendix as part of the
route profiles. The systemwide as well as detailed route-level analysis was
to develop the recommended scenario in Section 8.
.
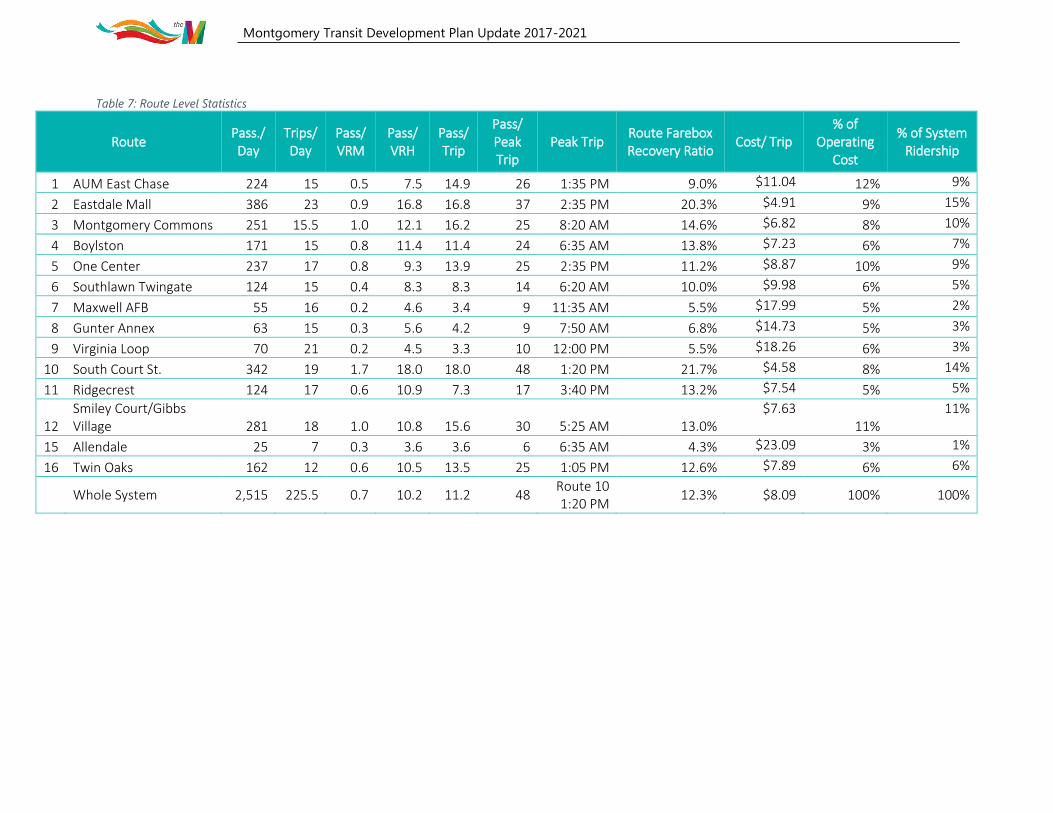
Montgomery Transit Development Plan Update 2017-2021
Table 7: Route Level Statistics
Route Pass./ Day
Trips/ Day
Pass/ VRM
Pass/ VRH
Pass/ Trip
Pass/ Peak Trip
Peak Trip Route Farebox Recovery Ratio
Cost/ Trip % of
Operating Cost
% of System Ridership
1 AUM East Chase 224 15 0.5 7.5 14.9 26 1:35 PM 9.0% $11.04 12% 9%
2 Eastdale Mall 386 23 0.9 16.8 16.8 37 2:35 PM 20.3% $4.91 9% 15%
3 Montgomery Commons 251 15.5 1.0 12.1 16.2 25 8:20 AM 14.6% $6.82 8% 10%
4 Boylston 171 15 0.8 11.4 11.4 24 6:35 AM 13.8% $7.23 6% 7%
5 One Center 237 17 0.8 9.3 13.9 25 2:35 PM 11.2% $8.87 10% 9%
6 Southlawn Twingate 124 15 0.4 8.3 8.3 14 6:20 AM 10.0% $9.98 6% 5%
7 Maxwell AFB 55 16 0.2 4.6 3.4 9 11:35 AM 5.5% $17.99 5% 2%
8 Gunter Annex 63 15 0.3 5.6 4.2 9 7:50 AM 6.8% $14.73 5% 3%
9 Virginia Loop 70 21 0.2 4.5 3.3 10 12:00 PM 5.5% $18.26 6% 3%
10 South Court St. 342 19 1.7 18.0 18.0 48 1:20 PM 21.7% $4.58 8% 14%
11 Ridgecrest 124 17 0.6 10.9 7.3 17 3:40 PM 13.2% $7.54 5% 5%
12 Smiley Court/Gibbs Village 281 18 1.0 10.8 15.6 30 5:25 AM 13.0%
$7.63 11%
11%
15 Allendale 25 7 0.3 3.6 3.6 6 6:35 AM 4.3% $23.09 3% 1%
16 Twin Oaks 162 12 0.6 10.5 13.5 25 1:05 PM 12.6% $7.89 6% 6%
Whole System 2,515 225.5 0.7 10.2 11.2 48 Route 10 1:20 PM
12.3% $8.09 100% 100%
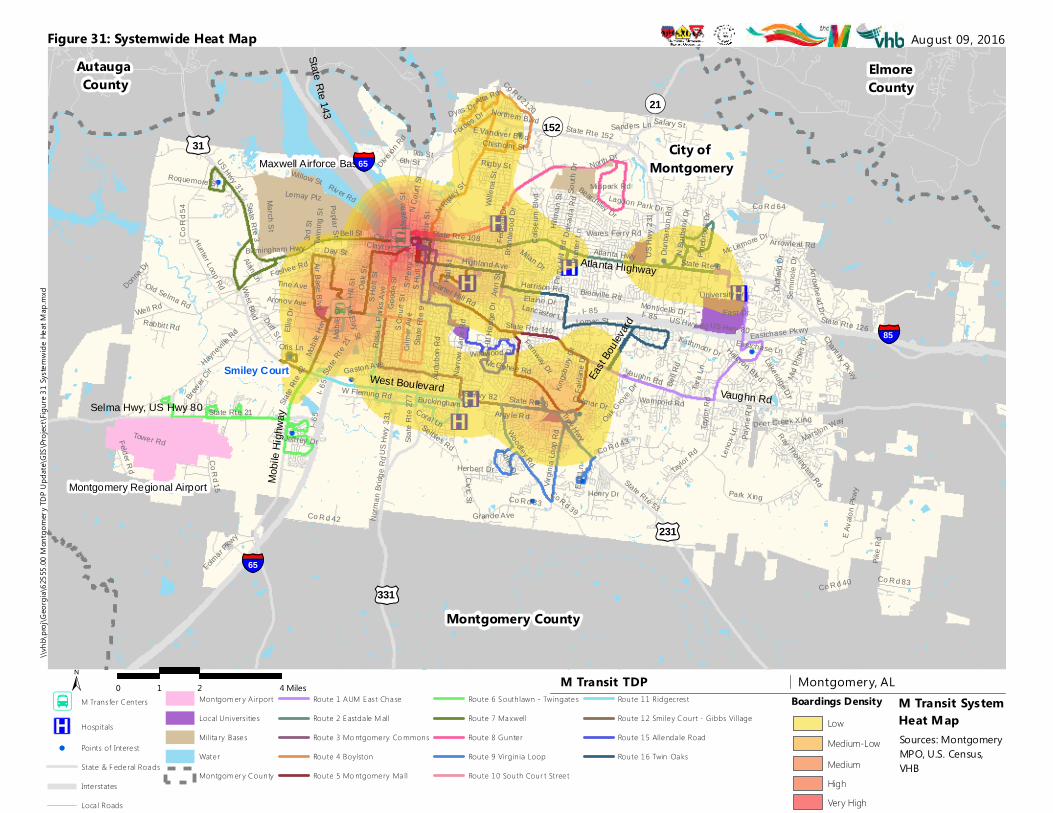
Montgomery County
Autauga County
ElmoreCounty
City of Montgomery
¬«152
East B
oulev
ard
£¤231
West Boulevard
Mobil
e High
way
£¤31
Vaughn Rd
¬«21
£¤331
State Rte 143
Atlanta Highway
Selma Hwy, US Hwy 80
I- 85I- 6
5
US Hwy 82 State Rte 6State Rte 21
State Rte 8
West Blvd
State
Rte 9
US H
wy 23
1
US Hwy 31State Rte 3
US Hwy 80
Bell R
d
State Rte 110
Vaughn Rd
Co R d 43
State Rte 53
Taylo
r Rd
Woodley Rd
Atlanta Hwy
State Rte 152
Northern Blvd
Co R
d 54
S Cou
rt St
Bell St
Troy HwyNa
rrow
Lane
Rd
Wares Ferry Rd
Norm
an B
ridge
Rd
S Perr
y St
Oak S
t
Park Xing
State
Rte 4
2
Hill S
t
Co R d 42
State Rte 108
Hall S
t
Hunter Loop Rd
Birmingham Hwy
Ann S
t
Colis
eum
Blvd
US H
wy 33
1Ro
sa L
Parks
Ave
Carter Hill Rd
River Rd
Co Rd 15
Co R d 33
March St
Old Selma Rd
N Co
urt S
t
Fede
ral D
r
Foshee Rd
Mobile
Hwy
S Hull
St
Hayneville
Rd
Co Rd 39
McGehee Rd
Forbes Dr
State
Rte 2
77
McLemore Dr
Air Base Blvd
Highland Ave
S Holt
St
Day St
Gilm
er Av
e
Gaston Ave
Perry
Hill
Rd
N Ripley S
t
Virgin
ia Lo
op R
dTower Rd
Eastchase PkwyWell Rd
N De
catur
St
Ray Thorington Rd
Tine Ave
Dalra
ida R
d
Fernway Dr
Rigby St
Co R d 83
Roquemore St
Duff St
Harrison Rd
6th St
Seibles Rd
W Fleming Rd
N Bu
rbank
Dr
Ellis
Dr
Fairla
ne D
r
Arrowhead DrGood
e St
Co Rd 2120
Audu
bon R
d
Hillm
an S
t
Folmar Pkwy
Chisholm St
Semi
nole
Dr
Wille
na S
t
3rd St
Halcyon Blvd
Beardsley Dr
Payn
e Rd
Felder Rd
Pineb
rook D
r
Buckingham Dr
Bienville Rd Oldfi
eld D
r
Co R d 64
Milan Dr
Clay St
University Dr
Mobil
e Dr
Poplar St
Lakeridge D r
Dunb
arton
Rd
Monticello Dr
Pike R
d
Eric
Ln
Kingsb
ury Dr
Adler Dr
Lemay Plz
Bran
twoo
d Dr
Rabbit t Rd
Clayton St
Eastchase Ln
Aronov Ave
Alta Rd
Marston Way
Lancaster LnTw
ining
St
Lagoon Park Dr
Otis Ln
Tara L
n
Jeffrey Dr
Midpark Rd
East Dr
Sanders Ln
Herbert Dr
South
Dr
Henry Dr
Leno
x Ln
Co R d 40
Argy le R d
Wildwood DrHill H
edge
Dr
Salary St
Lafay
ette S
t
Chant illy Pkwy
Lomac St
North Dr
Arrowleaf Rd
Oak Grov
e Dr
E Vandiver Blvd
Willow St
9th St
Kathmoor Dr
State Rte 126
Wampold Rd
Hunte
r Ln
Donna Dr
Deer Creek Xing
Dyas Dr
Calmar Dr
Grande Ave
Elaine Dr
Civic St
Div ision
RdCoral Ln
E Ava
lon P
kwy
Mid Pi
nes D
r
McElvy St
Alan Ln
Brewer C
ir State R
te 21
I- 65
US Hwy 80I- 85
Taylor Rd
Smiley Court
Montgomery Regional Airport
Maxwell Airforce Base
logos
M Transit TDP Montgomery, ALM Transit SystemHeat MapSources: Montgomery MPO, U.S. Census, VHB
± 0 2 41 Miles
August 09, 2016\\v
hb\p
roj\G
eorg
ia\62
555.0
0 Mon
tgom
ery T
DP U
pdate
\GIS\
Projec
t\Figu
re 31
Syste
mwide
Hea
t Map
.mxd
¾¿ M Trans fe r Centers
®v Hospitals
! Points of Interest
State & F ederal Roads
Inte rstates
Loca l Roads
Montgom er y A irport
Local Univers it ie s
Milita ry Bases
Water
Montgom er y County
Route 1 AUM Eas t Chase
Route 2 Eastda le M all
Route 3 Mo ntgomery Co mmons
Route 4 Boylston
Route 5 Mo ntgomery Ma ll
Route 6 Southlawn - Twingates
Route 7 Maxwell
Route 8 Gunte r
Route 9 Virginia Loop
Route 10 South Cour t Stree t
Route 11 Ridgecres t
Route 12 Smiley Court - Gibbs Village
Route 15 Allenda le Road
Route 16 Twin Oaks
§̈¦85
§̈¦65
§̈¦65
LowMedium-LowMediumHighVery High
Boardings Density
Figure 31: Systemwide Heat Map
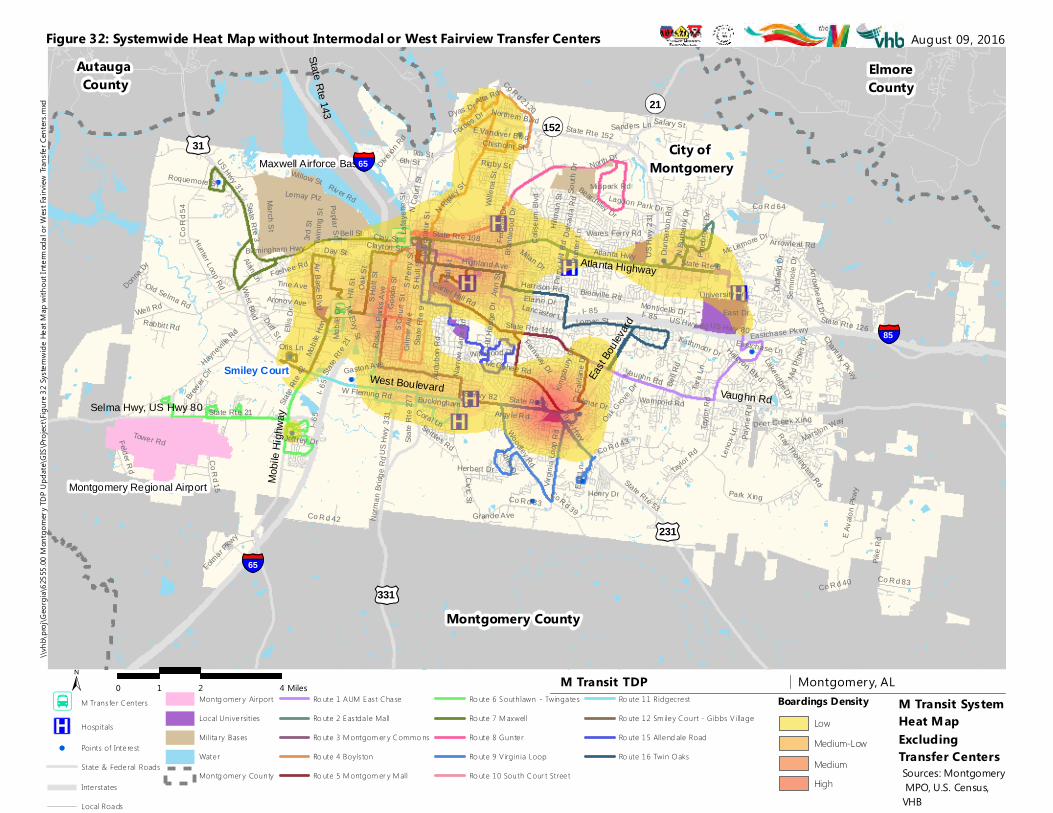
Montgomery County
Autauga County
ElmoreCounty
City of Montgomery
¬«152
East B
oulev
ard
£¤231
West Boulevard
Mobil
e High
way
£¤31
Vaughn Rd
¬«21
£¤331
State Rte 143
Atlanta Highway
Selma Hwy, US Hwy 80
I- 85I- 6
5
US Hwy 82 State Rte 6State Rte 21
State Rte 8
West Blvd
State
Rte 9
US H
wy 23
1
US Hwy 31State Rte 3
US Hwy 80
Bell R
d
State Rte 110
Vaughn Rd
Co R d 43
State Rte 53
Taylo
r Rd
Woodley Rd
Atlanta Hwy
State Rte 152
Northern Blvd
Co R
d 54
S Cou
rt St
Bell St
Troy HwyNa
rrow
Lane
Rd
Wares Ferry Rd
Norm
an B
ridge
Rd
S Perr
y St
Oak S
t
Park Xing
State
Rte 4
2
Hill S
t
Co R d 42
State Rte 108
Hall S
t
Hunter Loop Rd
Birmingham Hwy
Ann S
t
Colis
eum
Blvd
US H
wy 33
1Ro
sa L
Parks
Ave
Carter Hill Rd
River Rd
Co Rd 15
Co R d 33
March St
Old Selma Rd
N Co
urt S
t
Fede
ral D
r
Foshee Rd
Mobile
Hwy
S Hull
St
Hayneville
Rd
Co Rd 39
McGehee Rd
Forbes Dr
State
Rte 2
77
McLemore Dr
Air Base Blvd
Highland Ave
S Holt
St
Day St
Gilm
er Av
e
Gaston Ave
Perry
Hill
Rd
N Ripley S
t
Virgin
ia Lo
op R
dTower Rd
Eastchase PkwyWell Rd
N De
catur
St
Ray Thorington Rd
Tine Ave
Dalra
ida R
d
Fernway Dr
Rigby St
Co R d 83
Roquemore St
Duff St
Harrison Rd
6th St
Seibles Rd
W Fleming Rd
N Bu
rbank
Dr
Ellis
Dr
Fairla
ne D
r
Arrowhead DrGood
e St
Co Rd 2120
Audu
bon R
d
Hillm
an S
t
Folmar Pkwy
Chisholm St
Semi
nole
Dr
Wille
na S
t
3rd St
Halcyon Blvd
Beardsley Dr
Payn
e Rd
Felder Rd
Pineb
rook D
r
Buckingham Dr
Bienville Rd Oldfi
eld D
r
Co R d 64
Milan Dr
Clay St
University Dr
Mobil
e Dr
Poplar St
Lakeridge D r
Dunb
arton
Rd
Monticello Dr
Pike R
d
Eric
Ln
Kingsb
ury Dr
Adler Dr
Lemay Plz
Bran
twoo
d Dr
Rabbit t Rd
Clayton St
Eastchase Ln
Aronov Ave
Alta Rd
Marston Way
Lancaster LnTw
ining
St
Lagoon Park Dr
Otis Ln
Tara L
n
Jeffrey Dr
Midpark Rd
East Dr
Sanders Ln
Herbert Dr
South
Dr
Henry Dr
Leno
x Ln
Co R d 40
Argy le R d
Wildwood DrHill H
edge
Dr
Salary St
Lafay
ette S
t
Chant illy Pkwy
Lomac St
North Dr
Arrowleaf Rd
Oak Grov
e Dr
E Vandiver Blvd
Willow St
9th St
Kathmoor Dr
State Rte 126
Wampold Rd
Hunte
r Ln
Donna Dr
Deer Creek Xing
Dyas Dr
Calmar Dr
Grande Ave
Elaine Dr
Civic St
Div ision
RdCoral Ln
E Ava
lon P
kwy
Mid Pi
nes D
r
McElvy St
Alan Ln
Brewer C
ir State R
te 21
I- 65
US Hwy 80I- 85
Taylor Rd
Smiley Court
Montgomery Regional Airport
Maxwell Airforce Base
logos
M Transit TDP Montgomery, ALM Transit SystemHeat MapExcludingTransfer CentersSources: Montgomery MPO, U.S. Census, VHB
± 0 2 41 Miles
August 09, 2016\\v
hb\p
roj\G
eorg
ia\62
555.0
0 Mon
tgom
ery T
DP U
pdate
\GIS\
Projec
t\Figu
re 32
Syste
mwide
Hea
t Map
with
out I
nterm
odal
or W
est F
airvie
w Tra
nsfer
Cent
ers.m
xd
¾¿ M Trans fe r Centers
®v Hospitals
! Points of Inte rest
State & Federal Roads
Inte rstates
Local Roads
Montg omer y Airport
Local Unive rsit ies
Milita ry Bases
Water
Montg omer y County
Ro ute 1 AUM Eas t Chase
Ro ute 2 Eas tda le Ma ll
Ro ute 3 M ontgom er y Commo ns
Ro ute 4 Boyls ton
Ro ute 5 M ontgom er y M all
Ro ute 6 Southlawn - Twinga tes
Ro ute 7 M axwell
Ro ute 8 Gunte r
Ro ute 9 V irginia Loop
Ro ute 10 South Cour t Stree t
Ro ute 11 Ridgecrest
Ro ute 12 Sm iley Court - Gibbs V illage
Ro ute 15 Allend ale Road
Ro ute 16 Twin Oaks
§̈¦85
§̈¦65
§̈¦65
Figure 32: Systemwide Heat Map without Intermodal or West Fairview Transfer Centers
Boardings DensityLowMedium-LowMediumHigh
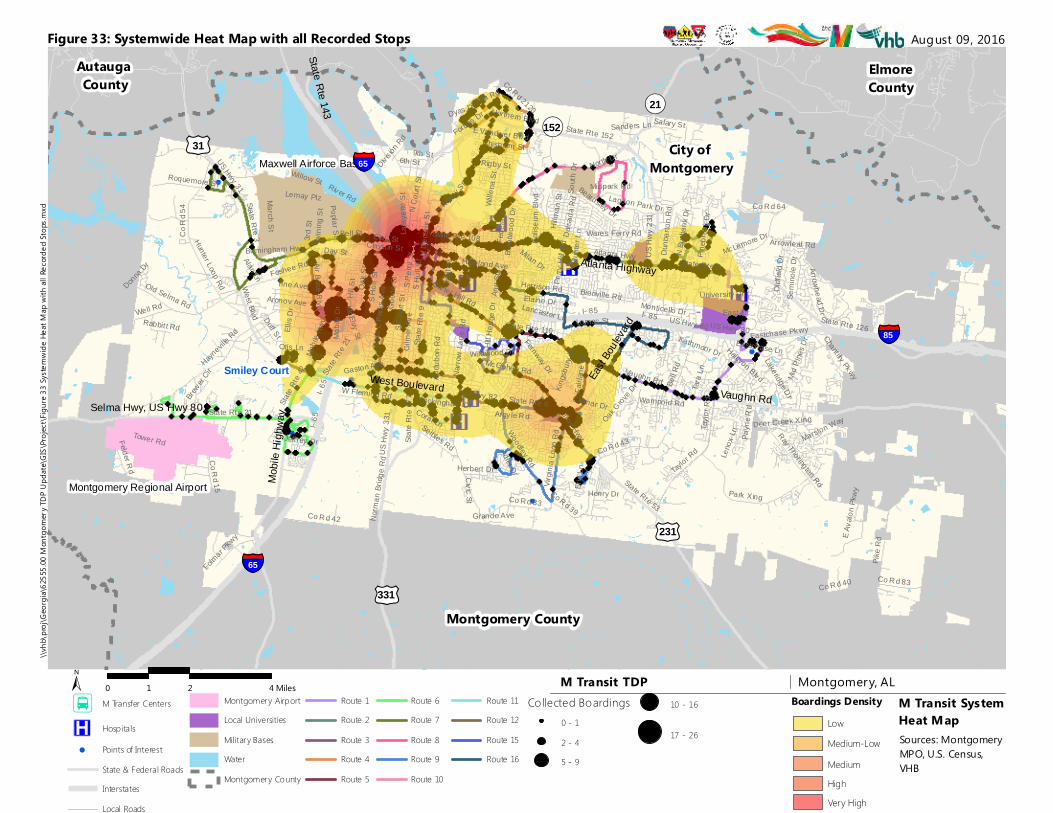
Montgomery County
Autauga County
ElmoreCounty
City of Montgomery
¬«152
East B
oulev
ard
£¤231
West Boulevard
Mobil
e High
way
£¤31
Vaughn Rd
¬«21
£¤331
State Rte 143
Atlanta Highway
Selma Hwy, US Hwy 80
I- 85I- 6
5
US Hwy 82 State Rte 6State Rte 21
State Rte 8
West Blvd
State
Rte 9
US H
wy 23
1
US Hwy 31State Rte 3
US Hwy 80
Bell R
d
State Rte 110
Vaughn Rd
Co R d 43
State Rte 53
Taylo
r Rd
Woodley Rd
Atlanta Hwy
State Rte 152
Northern Blvd
Co R
d 54
S Cou
rt St
Bell St
Troy HwyNa
rrow
Lane
Rd
Wares Ferry Rd
Norm
an B
ridge
Rd
S Perr
y St
Oak S
t
Park Xing
State
Rte 4
2
Hill S
t
Co R d 42
State Rte 108
Hall S
t
Hunter Loop Rd
Birmingham Hwy
Ann S
t
Colis
eum
Blvd
US H
wy 33
1Ro
sa L
Parks
Ave
Carter Hill Rd
River Rd
Co Rd 15
Co R d 33
March St
Old Selma Rd
N Co
urt S
t
Fede
ral D
r
Foshee Rd
Mobile
Hwy
S Hull
St
Hayneville
Rd
Co Rd 39
McGehee Rd
Forbes Dr
State
Rte 2
77
McLemore Dr
Air Base Blvd
Highland Ave
S Holt
St
Day St
Gilm
er Av
e
Gaston Ave
Perry
Hill
Rd
N Ripley S
t
Virgin
ia Lo
op R
dTower Rd
Eastchase PkwyWell Rd
N De
catur
St
Ray Thorington Rd
Tine Ave
Dalra
ida R
d
Fernway Dr
Rigby St
Co R d 83
Roquemore St
Duff St
Harrison Rd
6th St
Seibles Rd
W Fleming Rd
N Bu
rbank
Dr
Ellis
Dr
Fairla
ne D
r
Arrowhead DrGood
e St
Co Rd 2120
Audu
bon R
d
Hillm
an S
t
Folmar Pkwy
Chisholm St
Semi
nole
Dr
Wille
na S
t
3rd St
Halcyon Blvd
Beardsley Dr
Payn
e Rd
Felder Rd
Pineb
rook D
r
Buckingham Dr
Bienville Rd Oldfi
eld D
r
Co R d 64
Milan Dr
Clay St
University Dr
Mobil
e Dr
Poplar St
Lakeridge D r
Dunb
arton
Rd
Monticello Dr
Pike R
d
Eric
Ln
Kingsb
ury Dr
Adler Dr
Lemay Plz
Bran
twoo
d Dr
Rabbit t Rd
Clayton St
Eastchase Ln
Aronov Ave
Alta Rd
Marston Way
Lancaster LnTw
ining
St
Lagoon Park Dr
Otis Ln
Tara L
n
Jeffrey Dr
Midpark Rd
East Dr
Sanders Ln
Herbert Dr
South
Dr
Henry Dr
Leno
x Ln
Co R d 40
Argy le R d
Wildwood DrHill H
edge
Dr
Salary St
Lafay
ette S
t
Chant illy Pkwy
Lomac St
North Dr
Arrowleaf Rd
Oak Grov
e Dr
E Vandiver Blvd
Willow St
9th St
Kathmoor Dr
State Rte 126
Wampold Rd
Hunte
r Ln
Donna Dr
Deer Creek Xing
Dyas Dr
Calmar Dr
Grande Ave
Elaine Dr
Civic St
Div ision
RdCoral Ln
E Ava
lon P
kwy
Mid Pi
nes D
r
McElvy St
Alan Ln
Brewer C
ir State R
te 21
I- 65
US Hwy 80I- 85
Taylor Rd
Smiley Court
Montgomery Regional Airport
Maxwell Airforce Base
logos
M Transit TDP Montgomery, ALM Transit SystemHeat MapSources: Montgomery MPO, U.S. Census, VHB
± 0 2 41 Miles
August 09, 2016\\v
hb\p
roj\G
eorg
ia\62
555.0
0 Mon
tgom
ery T
DP U
pdate
\GIS\
Projec
t\Figu
re 33
Syste
mwide
Hea
t Map
with
all R
ecord
ed St
ops.m
xd
¾¿ M Transfer Centers
®v Hospitals
! Points of InterestState & Federal RoadsInterstatesLocal Roads
Montgomery AirportLocal UniversitiesMilitary BasesWaterMontgomery County
Route 1 Route 2 Route 3 Route 4 Route 5
Route 6Route 7 Route 8 Route 9 Route 10
Route 11 Route 12 Route 15 Route 16
Collected Boardings0 - 12 - 45 - 9
10 - 16
17 - 26
§̈¦85
§̈¦65
§̈¦65
LowMedium-LowMediumHighVery High
Boardings Density
Figure 33: Systemwide Heat Map with all Recorded Stops
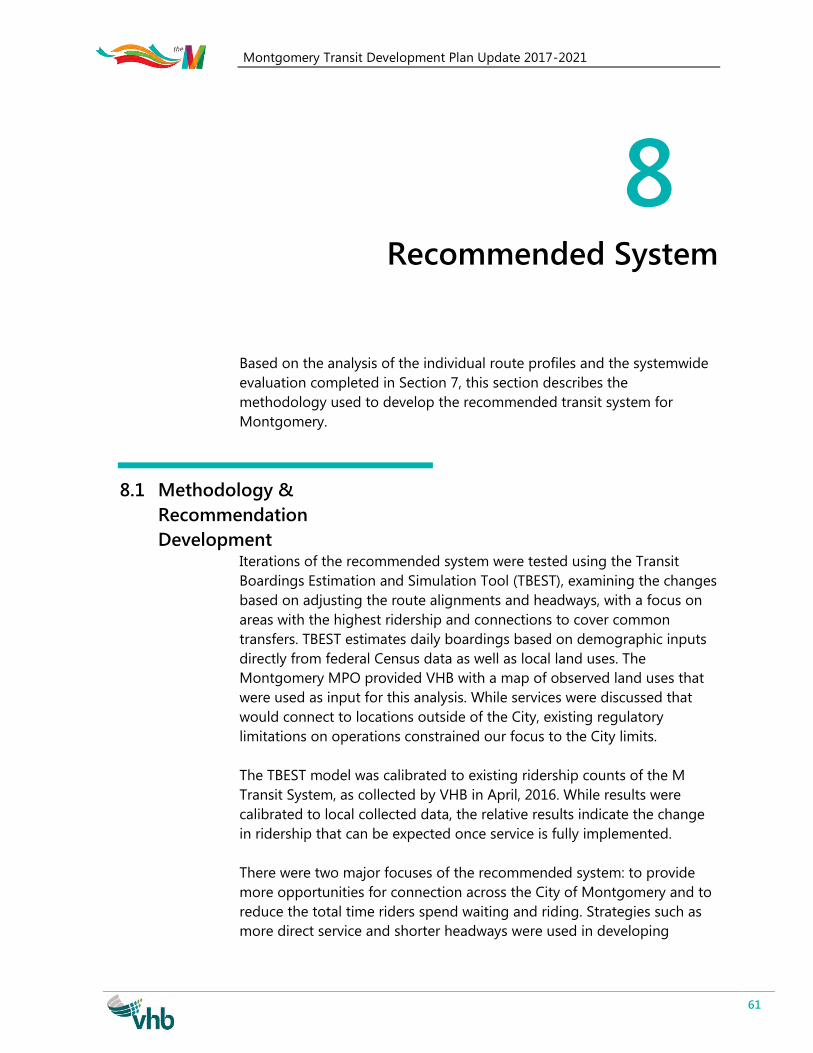
Montgomery Transit Development Plan Update 2017-2021
61
8 Recommended System
Based on the analysis of the individual route profiles and the systemwide
evaluation completed in Section 7, this section describes the
methodology used to develop the recommended transit system for
Montgomery.
8.1 Methodology &
Recommendation
Development Iterations of the recommended system were tested using the Transit
Boardings Estimation and Simulation Tool (TBEST), examining the changes
based on adjusting the route alignments and headways, with a focus on
areas with the highest ridership and connections to cover common
transfers. TBEST estimates daily boardings based on demographic inputs
directly from federal Census data as well as local land uses. The
Montgomery MPO provided VHB with a map of observed land uses that
were used as input for this analysis. While services were discussed that
would connect to locations outside of the City, existing regulatory
limitations on operations constrained our focus to the City limits.
The TBEST model was calibrated to existing ridership counts of the M
Transit System, as collected by VHB in April, 2016. While results were
calibrated to local collected data, the relative results indicate the change
in ridership that can be expected once service is fully implemented.
There were two major focuses of the recommended system: to provide
more opportunities for connection across the City of Montgomery and to
reduce the total time riders spend waiting and riding. Strategies such as
more direct service and shorter headways were used in developing
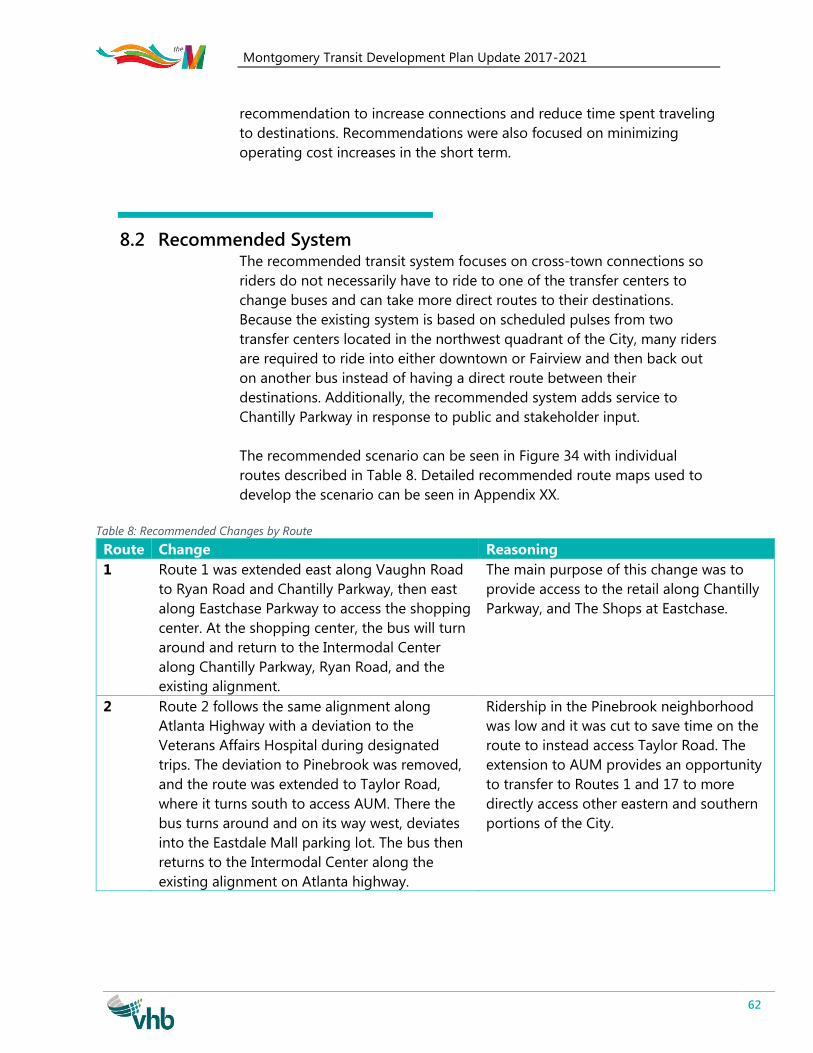
Montgomery Transit Development Plan Update 2017-2021
62
recommendation to increase connections and reduce time spent traveling
to destinations. Recommendations were also focused on minimizing
operating cost increases in the short term.
8.2 Recommended System The recommended transit system focuses on cross-town connections so
riders do not necessarily have to ride to one of the transfer centers to
change buses and can take more direct routes to their destinations.
Because the existing system is based on scheduled pulses from two
transfer centers located in the northwest quadrant of the City, many riders
are required to ride into either downtown or Fairview and then back out
on another bus instead of having a direct route between their
destinations. Additionally, the recommended system adds service to
Chantilly Parkway in response to public and stakeholder input.
The recommended scenario can be seen in Figure 34 with individual
routes described in Table 8. Detailed recommended route maps used to
develop the scenario can be seen in Appendix XX.
Table 8: Recommended Changes by Route
Route Change Reasoning
1 Route 1 was extended east along Vaughn Road
to Ryan Road and Chantilly Parkway, then east
along Eastchase Parkway to access the shopping
center. At the shopping center, the bus will turn
around and return to the Intermodal Center
along Chantilly Parkway, Ryan Road, and the
existing alignment.
The main purpose of this change was to
provide access to the retail along Chantilly
Parkway, and The Shops at Eastchase.
2 Route 2 follows the same alignment along
Atlanta Highway with a deviation to the
Veterans Affairs Hospital during designated
trips. The deviation to Pinebrook was removed,
and the route was extended to Taylor Road,
where it turns south to access AUM. There the
bus turns around and on its way west, deviates
into the Eastdale Mall parking lot. The bus then
returns to the Intermodal Center along the
existing alignment on Atlanta highway.
Ridership in the Pinebrook neighborhood
was low and it was cut to save time on the
route to instead access Taylor Road. The
extension to AUM provides an opportunity
to transfer to Routes 1 and 17 to more
directly access other eastern and southern
portions of the City.
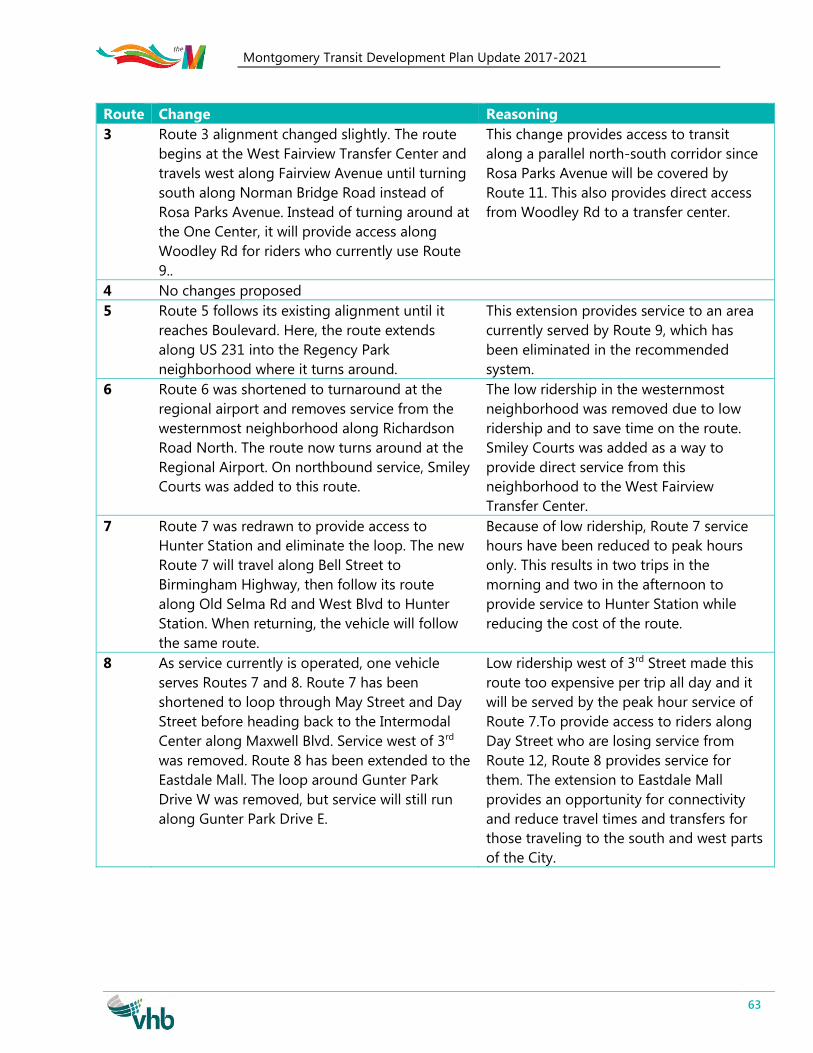
Montgomery Transit Development Plan Update 2017-2021
63
Route Change Reasoning
3 Route 3 alignment changed slightly. The route
begins at the West Fairview Transfer Center and
travels west along Fairview Avenue until turning
south along Norman Bridge Road instead of
Rosa Parks Avenue. Instead of turning around at
the One Center, it will provide access along
Woodley Rd for riders who currently use Route
9..
This change provides access to transit
along a parallel north-south corridor since
Rosa Parks Avenue will be covered by
Route 11. This also provides direct access
from Woodley Rd to a transfer center.
4 No changes proposed
5 Route 5 follows its existing alignment until it
reaches Boulevard. Here, the route extends
along US 231 into the Regency Park
neighborhood where it turns around.
This extension provides service to an area
currently served by Route 9, which has
been eliminated in the recommended
system.
6 Route 6 was shortened to turnaround at the
regional airport and removes service from the
westernmost neighborhood along Richardson
Road North. The route now turns around at the
Regional Airport. On northbound service, Smiley
Courts was added to this route.
The low ridership in the westernmost
neighborhood was removed due to low
ridership and to save time on the route.
Smiley Courts was added as a way to
provide direct service from this
neighborhood to the West Fairview
Transfer Center.
7 Route 7 was redrawn to provide access to
Hunter Station and eliminate the loop. The new
Route 7 will travel along Bell Street to
Birmingham Highway, then follow its route
along Old Selma Rd and West Blvd to Hunter
Station. When returning, the vehicle will follow
the same route.
Because of low ridership, Route 7 service
hours have been reduced to peak hours
only. This results in two trips in the
morning and two in the afternoon to
provide service to Hunter Station while
reducing the cost of the route.
8 As service currently is operated, one vehicle
serves Routes 7 and 8. Route 7 has been
shortened to loop through May Street and Day
Street before heading back to the Intermodal
Center along Maxwell Blvd. Service west of 3rd
was removed. Route 8 has been extended to the
Eastdale Mall. The loop around Gunter Park
Drive W was removed, but service will still run
along Gunter Park Drive E.
Low ridership west of 3rd Street made this
route too expensive per trip all day and it
will be served by the peak hour service of
Route 7.To provide access to riders along
Day Street who are losing service from
Route 12, Route 8 provides service for
them. The extension to Eastdale Mall
provides an opportunity for connectivity
and reduce travel times and transfers for
those traveling to the south and west parts
of the City.
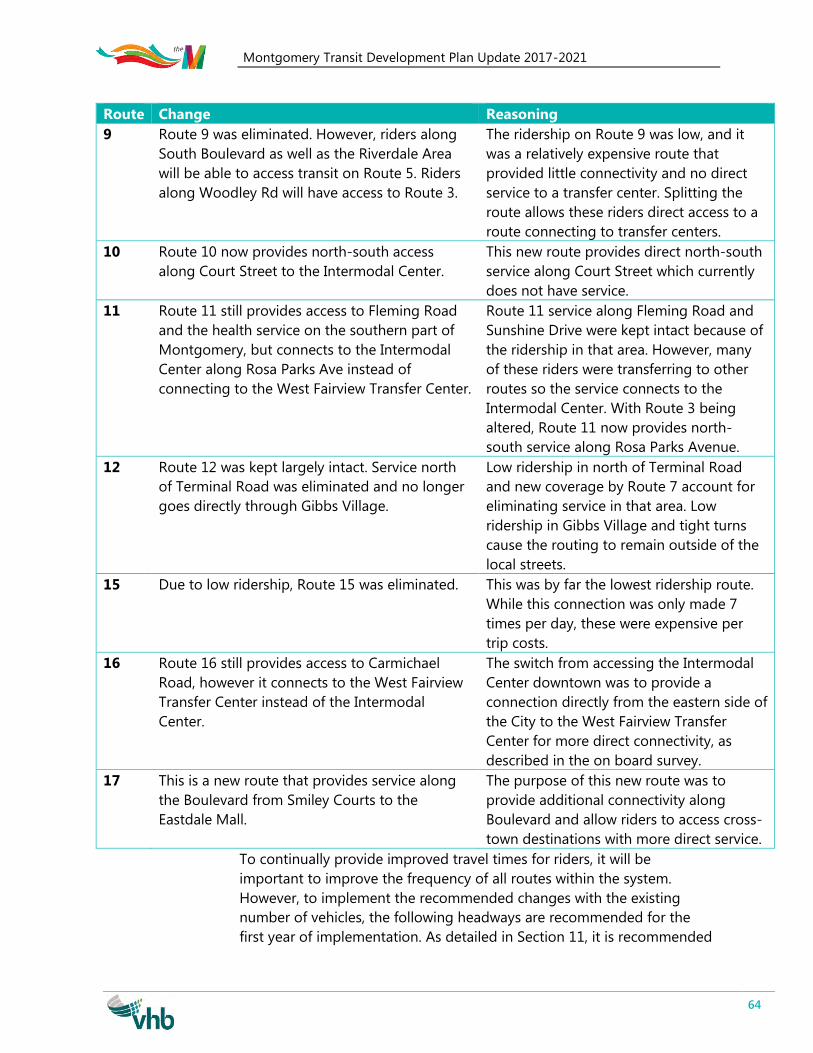
Montgomery Transit Development Plan Update 2017-2021
64
Route Change Reasoning
9 Route 9 was eliminated. However, riders along
South Boulevard as well as the Riverdale Area
will be able to access transit on Route 5. Riders
along Woodley Rd will have access to Route 3.
The ridership on Route 9 was low, and it
was a relatively expensive route that
provided little connectivity and no direct
service to a transfer center. Splitting the
route allows these riders direct access to a
route connecting to transfer centers.
10 Route 10 now provides north-south access
along Court Street to the Intermodal Center.
This new route provides direct north-south
service along Court Street which currently
does not have service.
11 Route 11 still provides access to Fleming Road
and the health service on the southern part of
Montgomery, but connects to the Intermodal
Center along Rosa Parks Ave instead of
connecting to the West Fairview Transfer Center.
Route 11 service along Fleming Road and
Sunshine Drive were kept intact because of
the ridership in that area. However, many
of these riders were transferring to other
routes so the service connects to the
Intermodal Center. With Route 3 being
altered, Route 11 now provides north-
south service along Rosa Parks Avenue.
12 Route 12 was kept largely intact. Service north
of Terminal Road was eliminated and no longer
goes directly through Gibbs Village.
Low ridership in north of Terminal Road
and new coverage by Route 7 account for
eliminating service in that area. Low
ridership in Gibbs Village and tight turns
cause the routing to remain outside of the
local streets.
15 Due to low ridership, Route 15 was eliminated. This was by far the lowest ridership route.
While this connection was only made 7
times per day, these were expensive per
trip costs.
16 Route 16 still provides access to Carmichael
Road, however it connects to the West Fairview
Transfer Center instead of the Intermodal
Center.
The switch from accessing the Intermodal
Center downtown was to provide a
connection directly from the eastern side of
the City to the West Fairview Transfer
Center for more direct connectivity, as
described in the on board survey.
17 This is a new route that provides service along
the Boulevard from Smiley Courts to the
Eastdale Mall.
The purpose of this new route was to
provide additional connectivity along
Boulevard and allow riders to access cross-
town destinations with more direct service.
To continually provide improved travel times for riders, it will be
important to improve the frequency of all routes within the system.
However, to implement the recommended changes with the existing
number of vehicles, the following headways are recommended for the
first year of implementation. As detailed in Section 11, it is recommended
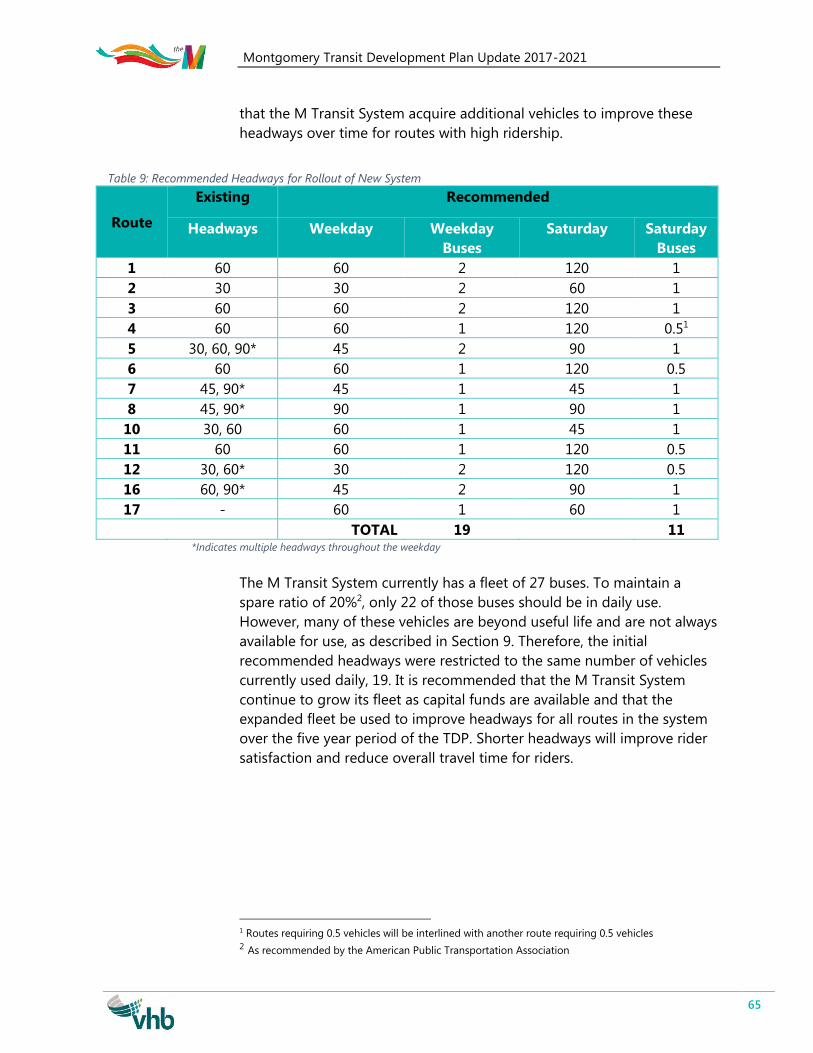
Montgomery Transit Development Plan Update 2017-2021
65
that the M Transit System acquire additional vehicles to improve these
headways over time for routes with high ridership.
Table 9: Recommended Headways for Rollout of New System
Route
Existing Recommended
Headways Weekday Weekday
Buses
Saturday Saturday
Buses
1 60 60 2 120 1
2 30 30 2 60 1
3 60 60 2 120 1
4 60 60 1 120 0.51
5 30, 60, 90* 45 2 90 1
6 60 60 1 120 0.5
7 45, 90* 45 1 45 1
8 45, 90* 90 1 90 1
10 30, 60 60 1 45 1
11 60 60 1 120 0.5
12 30, 60* 30 2 120 0.5
16 60, 90* 45 2 90 1
17 - 60 1 60 1
TOTAL 19 11 *Indicates multiple headways throughout the weekday
The M Transit System currently has a fleet of 27 buses. To maintain a
spare ratio of 20%2, only 22 of those buses should be in daily use.
However, many of these vehicles are beyond useful life and are not always
available for use, as described in Section 9. Therefore, the initial
recommended headways were restricted to the same number of vehicles
currently used daily, 19. It is recommended that the M Transit System
continue to grow its fleet as capital funds are available and that the
expanded fleet be used to improve headways for all routes in the system
over the five year period of the TDP. Shorter headways will improve rider
satisfaction and reduce overall travel time for riders.
1 Routes requiring 0.5 vehicles will be interlined with another route requiring 0.5 vehicles 2 As recommended by the American Public Transportation Association
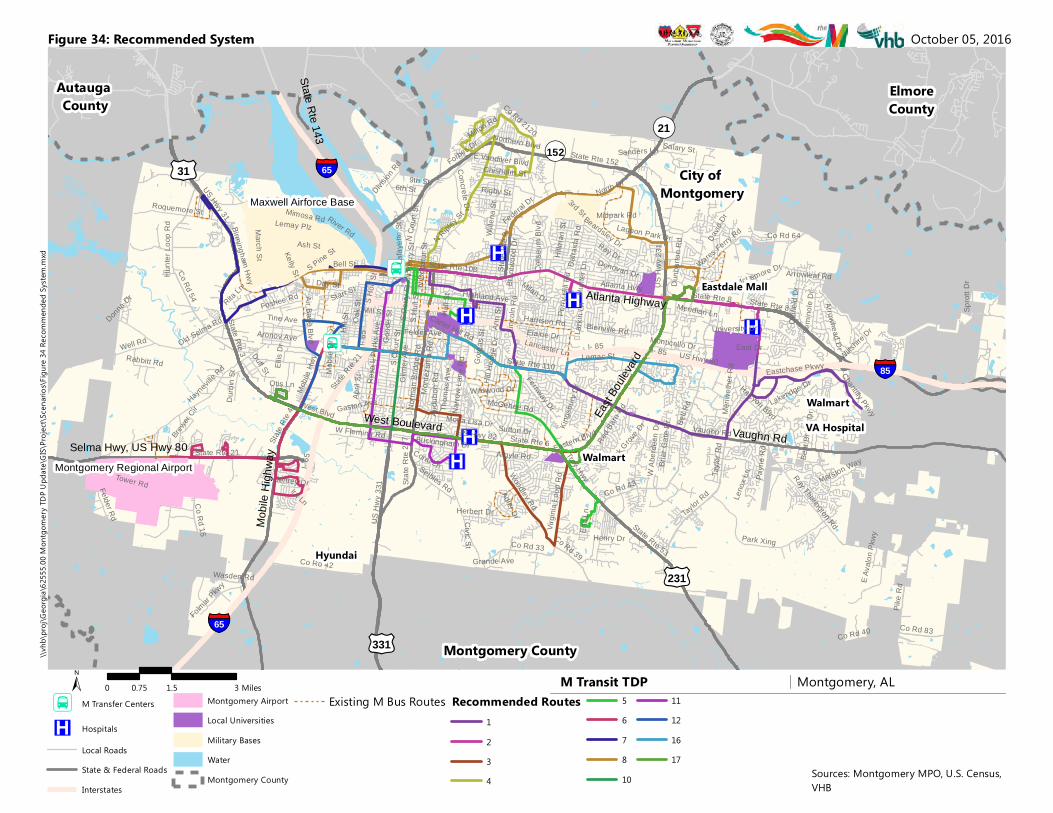
®v
®v
®v
®v
®v
®v®v
¾¿
¾¿
Montgomery County
Autauga County
ElmoreCounty
City of Montgomery
¬«152
East B
ouleva
rd
£¤231
West Boulevard
Mobil
e High
way
£¤31
Vaughn Rd
¬«21
£¤331
State Rte 143
Atlanta Highway
Selma Hwy, US Hwy 80
I- 85
I- 65
US Hwy 82 State Rte 6State Rte 21
State Rte 8
West Blvd
State
Rte 9
US H
wy 23
1
US Hwy 31State Rte 3 US Hwy 80
Bell R
d
State Rte 110
Vaughn Rd
Co Rd 43
State Rte 53
Taylo
r Rd
Woodley Rd
Atlanta Hwy
State Rte 152
Northern Blvd
Co Rd 54
S Cou
rt St
Bell St
Troy Hwy
Eastern Blvd
Narro
w La
ne R
d
Wares Ferry Rd
Norm
an B
ridge
Rd
S Perr
y St
Oak S
t
Park Xing
State
Rte 42
Hill S
t
Co Rd 42
State Rte 108
Hall S
t
Hunte
r Loo
p Rd Birmingham Hwy
Ann S
t
Colis
eum
Blvd
US H
wy 33
1Ro
sa L
Parks
Ave Carter Hill Rd
River Rd
Co Rd 15
Co Rd 33
March St
Mill St
Old Selma Rd
N Co
urt S
t
Federal Dr
Foshee RdMo
bile H
wy
S Hull
St
Hayneville
Rd
Co Rd 39
McGehee Rd
Forbes Dr
State
Rte 2
77
McLemore Dr
Air Base Blvd
Highland Ave
Ray Dr
S Holt
St
Day St
Gilm
er Av
eGaston Ave
Perry
Hill
Rd
N Ripley S
t
Felder Ave
Virgin
ia Lo
op R
d
Concrete Dr
Tower Rd
Eastchase PkwyWell Rd
N De
catur
St
Ray Thorington Rd
Tine Ave
Dalra
ida R
d
Fernway Dr
Rigby St
Co Rd 83
Roquemore St
Duff St
Harrison Rd
6th St
Seibles Rd
W Fleming Rd
Kelly St
Ellis
Dr
Arrowhead DrGood
e St
Co Rd 2120
Audu
bon R
d
Hillm
an St
Folmar P
kwy
April
St
Chisholm St
Semi
nole
Dr
Wille
na St
3rd St
Halcyon Blvd
Beardsley Dr
Payn
e Rd
Felder Rd
Ash St
Buckingham Dr
Bienville Rd
Oldfi
eld D
r
Milton Rd
Co Rd 64
Milan Dr
University DrMo
bile D
r
Durbi
n St
Lakeridge Dr
Dunb
arton
Rd
Monticello Dr
Pike R
d
Eric
Ln
Thom
as Av
e
Kings
bury
Dr
N Pe
rry S
t
Adler Dr
Lemay Plz
Briar
Gate
Dr
Bran
twoo
d Dr
Rabbitt Rd
Aronov Ave
David
Dr
Marston Way
Mimosa Rd
Lancaster Ln
Lagoon Park Dr
Otis Ln
Jeffrey Dr
Midpark Rd
East Dr
Sanders Ln
Herbert Dr
Henry Dr
Wiltshire
Dr
Leno
x Ln
Co Rd 40
Meriw
ether
Rd
Larki
n Ln
Argyle Rd
Wildwood Dr
W Ab
erdee
n Dr
Hill H
edge
Dr
Salary St
Lafay
ette S
t
Chantilly Pkwy
Lomac St
North Dr
Arrowleaf Rd
Oak Grov
e DrSutton Dr
E Vandiver Blvd9th St
Gorga
s St
Hunte
r Ln
Bent
Broo
k Dr
Donna D
r
Linco
ln RdStarr St
Grande Ave
Mona Lisa Dr
Elaine Dr
Monte
zuma
Rd
Civic St
Rita Ln
Division
Rd
Donovan Dr
Coral Ln
E Ava
lon P
kwy
Ira Ln
Wasden Rd
S Pine St
Meridian Ln Sprot
t Dr
Red B
arn Rd
Brewer C
ir
State Rte 8
State R
te 21 I- 85
I- 65
Taylor Rd
Montgomery Regional Airport
Maxwell Airforce Base
logos
M Transit TDP Montgomery, AL
Figure 34: Recommended System
Sources: Montgomery MPO, U.S. Census, VHB
± 0 1.5 30.75 Miles
October 05, 2016\\v
hb\p
roj\G
eorgi
a\625
55.00
Mon
tgome
ry TD
P Upd
ate\G
IS\Pro
ject\S
cena
rios\F
igure
34 Re
comm
ende
d Syst
em.m
xd
¾¿ M Transfer Centers
®v Hospitals
Local RoadsState & Federal RoadsInterstates
Montgomery AirportLocal UniversitiesMilitary BasesWaterMontgomery County
Existing M Bus Routes Recommended Routes1234
567810
11121617
§̈¦85
§̈¦65
§̈¦65
Hyundai
VA Hospital
Walmart
Walmart
Eastdale Mall
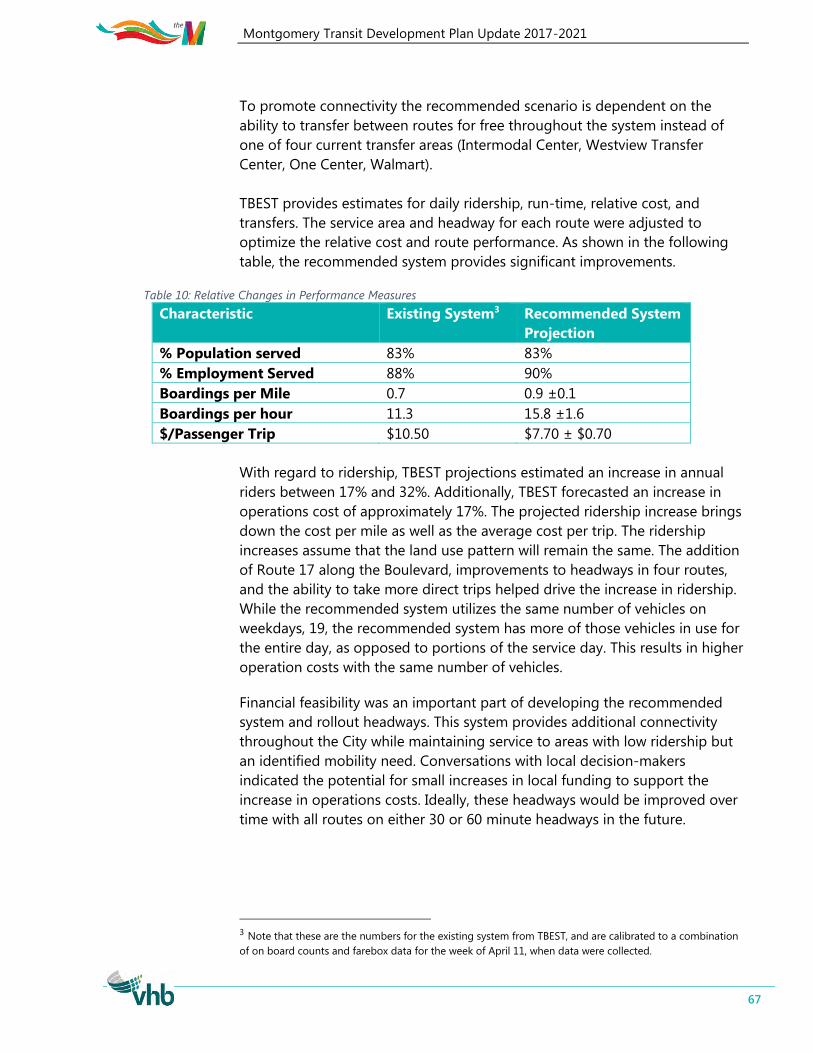
Montgomery Transit Development Plan Update 2017-2021
67
To promote connectivity the recommended scenario is dependent on the
ability to transfer between routes for free throughout the system instead of
one of four current transfer areas (Intermodal Center, Westview Transfer
Center, One Center, Walmart).
TBEST provides estimates for daily ridership, run-time, relative cost, and
transfers. The service area and headway for each route were adjusted to
optimize the relative cost and route performance. As shown in the following
table, the recommended system provides significant improvements.
Table 10: Relative Changes in Performance Measures
Characteristic Existing System3 Recommended System
Projection
% Population served 83% 83%
% Employment Served 88% 90%
Boardings per Mile 0.7 0.9 ±0.1
Boardings per hour 11.3 15.8 ±1.6
$/Passenger Trip $10.50 $7.70 ± $0.70
With regard to ridership, TBEST projections estimated an increase in annual
riders between 17% and 32%. Additionally, TBEST forecasted an increase in
operations cost of approximately 17%. The projected ridership increase brings
down the cost per mile as well as the average cost per trip. The ridership
increases assume that the land use pattern will remain the same. The addition
of Route 17 along the Boulevard, improvements to headways in four routes,
and the ability to take more direct trips helped drive the increase in ridership.
While the recommended system utilizes the same number of vehicles on
weekdays, 19, the recommended system has more of those vehicles in use for
the entire day, as opposed to portions of the service day. This results in higher
operation costs with the same number of vehicles.
Financial feasibility was an important part of developing the recommended
system and rollout headways. This system provides additional connectivity
throughout the City while maintaining service to areas with low ridership but
an identified mobility need. Conversations with local decision-makers
indicated the potential for small increases in local funding to support the
increase in operations costs. Ideally, these headways would be improved over
time with all routes on either 30 or 60 minute headways in the future.
3 Note that these are the numbers for the existing system from TBEST, and are calibrated to a combination
of on board counts and farebox data for the week of April 11, when data were collected.
Montgomery Transit Development Plan Update 2017-2021
68
9 Equipment and Facilities
This section provides an overview of the equipment and facilities managed
and operated by the M Transit System. The M Transit System has 100
employees, made up of 50 drivers, 34 administrative positions, and 16
maintenance positions. Of the 100 employees, 82 are full time.
9.1 Vehicles The section provides an overall description of the current fleet in operation by
The M Transit System. Fleet inventory characteristics were provided by M
transit staff. There are a total of 38 vehicles in the M fleet - 27 fixed route
vehicles and 11 demand response vehicles.
9.1.1 Fixed Route Service Fleet
Characteristics for the fixed route fleet are provided in Table 11. A summary of
key characteristics of the M Transit System fixed route fleet shown in Table 11
follows:
Of the 27 fixed route vehicles, all but six of the vehicles have been in
operation for five of fewer years.
All six of the older vehicles have bene in operation for at least 10 years.
Four of the older vehicles, which are shaded in Table 11, will be
replaced in FY 2017, however they were originally scheduled for
replacement in 2012 or 2013.
There are two other vehicles that were slated for replacement in 2015
and 2016 that have no determined replacement date.
Collectively, there appears to be a shortfall of available revenues to
meet their anticipated fleet replacement schedule.
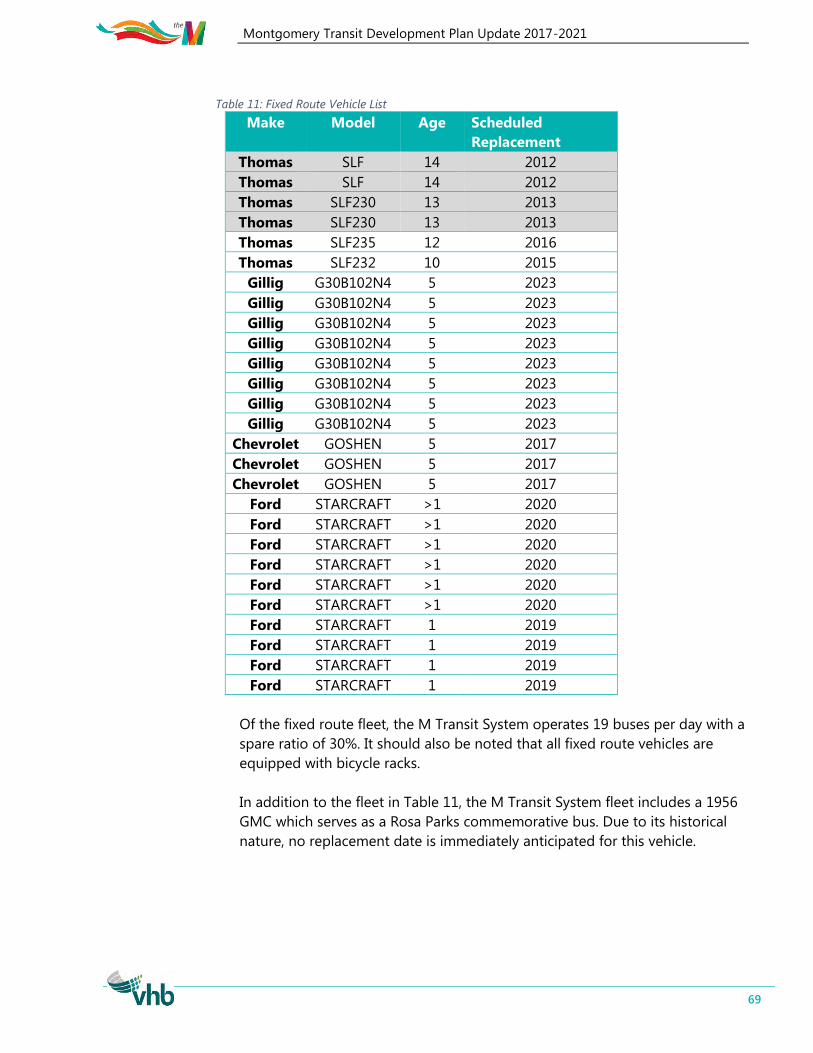
Montgomery Transit Development Plan Update 2017-2021
69
Table 11: Fixed Route Vehicle List
Make Model Age Scheduled
Replacement
Thomas SLF 14 2012
Thomas SLF 14 2012
Thomas SLF230 13 2013
Thomas SLF230 13 2013
Thomas SLF235 12 2016
Thomas SLF232 10 2015
Gillig G30B102N4 5 2023
Gillig G30B102N4 5 2023
Gillig G30B102N4 5 2023
Gillig G30B102N4 5 2023
Gillig G30B102N4 5 2023
Gillig G30B102N4 5 2023
Gillig G30B102N4 5 2023
Gillig G30B102N4 5 2023
Chevrolet GOSHEN 5 2017
Chevrolet GOSHEN 5 2017
Chevrolet GOSHEN 5 2017
Ford STARCRAFT >1 2020
Ford STARCRAFT >1 2020
Ford STARCRAFT >1 2020
Ford STARCRAFT >1 2020
Ford STARCRAFT >1 2020
Ford STARCRAFT >1 2020
Ford STARCRAFT 1 2019
Ford STARCRAFT 1 2019
Ford STARCRAFT 1 2019
Ford STARCRAFT 1 2019
Of the fixed route fleet, the M Transit System operates 19 buses per day with a
spare ratio of 30%. It should also be noted that all fixed route vehicles are
equipped with bicycle racks.
In addition to the fleet in Table 11, the M Transit System fleet includes a 1956
GMC which serves as a Rosa Parks commemorative bus. Due to its historical
nature, no replacement date is immediately anticipated for this vehicle.
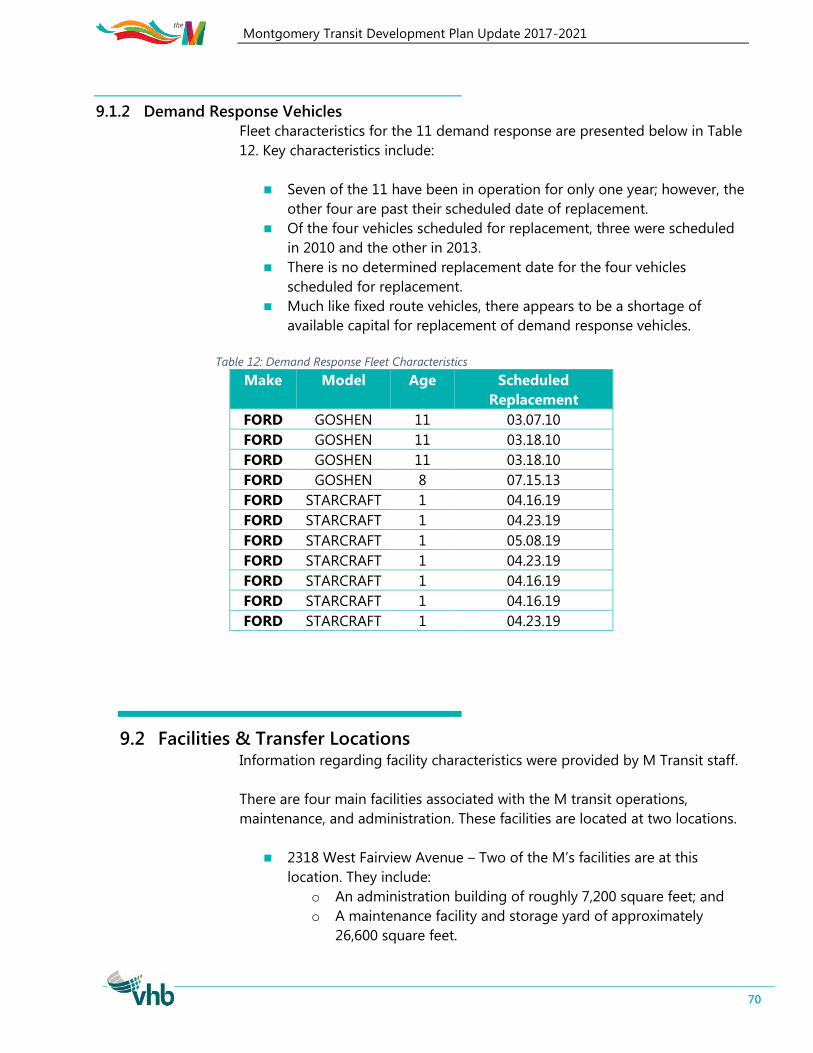
Montgomery Transit Development Plan Update 2017-2021
70
9.1.2 Demand Response Vehicles
Fleet characteristics for the 11 demand response are presented below in Table
12. Key characteristics include:
Seven of the 11 have been in operation for only one year; however, the
other four are past their scheduled date of replacement.
Of the four vehicles scheduled for replacement, three were scheduled
in 2010 and the other in 2013.
There is no determined replacement date for the four vehicles
scheduled for replacement.
Much like fixed route vehicles, there appears to be a shortage of
available capital for replacement of demand response vehicles.
Table 12: Demand Response Fleet Characteristics
Make Model Age Scheduled
Replacement
FORD GOSHEN 11 03.07.10
FORD GOSHEN 11 03.18.10
FORD GOSHEN 11 03.18.10
FORD GOSHEN 8 07.15.13
FORD STARCRAFT 1 04.16.19
FORD STARCRAFT 1 04.23.19
FORD STARCRAFT 1 05.08.19
FORD STARCRAFT 1 04.23.19
FORD STARCRAFT 1 04.16.19
FORD STARCRAFT 1 04.16.19
FORD STARCRAFT 1 04.23.19
9.2 Facilities & Transfer Locations Information regarding facility characteristics were provided by M Transit staff.
There are four main facilities associated with the M transit operations,
maintenance, and administration. These facilities are located at two locations.
2318 West Fairview Avenue – Two of the M’s facilities are at this
location. They include:
o An administration building of roughly 7,200 square feet; and
o A maintenance facility and storage yard of approximately
26,600 square feet.
Montgomery Transit Development Plan Update 2017-2021
71
2340 West Fairview Avenue - A transfer center for local fixed route
service of approximately 530 square feet
495 Molton Street – The Intermodal Transfer Center facility in
downtown Montgomery. This location also includes the intercity
passenger bus terminal and planning offices for M Transit, City of
Montgomery, and the Montgomery MPO.
Immediate maintenance needs for the facilities above include:
Expansion of the Fairview Transfer Center to enclose the facility, which
is currently underway, and.
The replacement of a bus washer at the maintenance facility.
The maintenance facility and administrative building are located next door to
the West Fairview Transfer Center and 3.2 miles from the Intermodal Center.
With the transfer centers in close proximity to the maintenance facility, there is
minimal dead head time for the buses, improving cost effectiveness.
In addition to the bike racks on the fixed route fleet, the M has an inventory of
the following amenities throughout its fixed route network:
A total of 125 benches with an average cost of $600.
A total of 20 bus shelters with an average cost of $7,000.
Bus stop shelters were a common request during public outreach. The
combination of hot summers and headways ranging from 30 to 90 minutes
throughout the system increases the need for shelters, particularly at high
volume stops. The M Transit System currently has seven shelters in storage
that can be installed in the short term once stops are selected.
The M Transit System spends nearly all funds on operations and makes capital
investments with one-time grants. Installing bus shelters would require
additional local capital funds or partnerships with partners and stakeholders
throughout the City. Shelters could be an opportunity for local sponsorships
and advertisements to provide the necessary funds. New shelters would
benefit waiting riders and also act as advertisement of service throughout the
system to increase visibility. Priority for the installation of shelters should be at
stops where at least two routes come together to provide shelter for riders
transferring outside of the two transfer centers
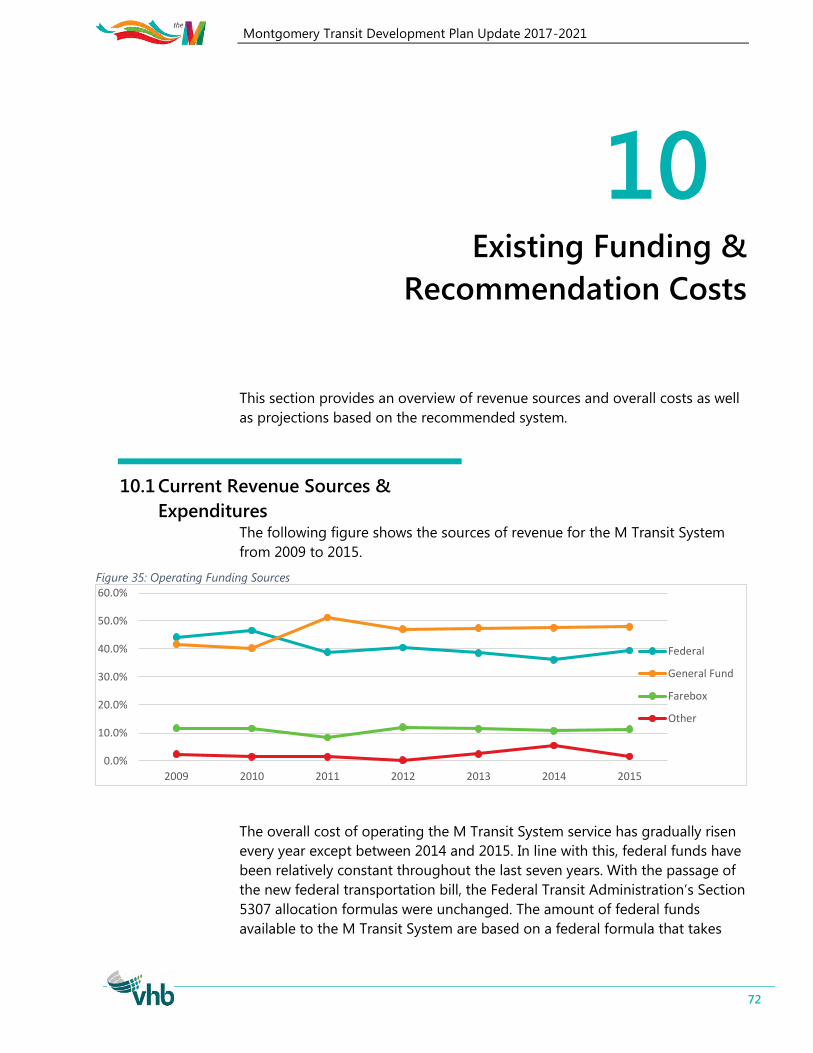
Montgomery Transit Development Plan Update 2017-2021
72
10 Existing Funding &
Recommendation Costs
This section provides an overview of revenue sources and overall costs as well
as projections based on the recommended system.
10.1 Current Revenue Sources &
Expenditures The following figure shows the sources of revenue for the M Transit System
from 2009 to 2015.
Figure 35: Operating Funding Sources
The overall cost of operating the M Transit System service has gradually risen
every year except between 2014 and 2015. In line with this, federal funds have
been relatively constant throughout the last seven years. With the passage of
the new federal transportation bill, the Federal Transit Administration’s Section
5307 allocation formulas were unchanged. The amount of federal funds
available to the M Transit System are based on a federal formula that takes
0.0%
10.0%
20.0%
30.0%
40.0%
50.0%
60.0%
2009 2010 2011 2012 2013 2014 2015
Federal
General Fund
Farebox
Other
Montgomery Transit Development Plan Update 2017-2021
73
into account the population and revenue hours of service provided, both of
which have remained constant over this time.
Fare revenue has gradually increased with slight increases in ridership over the
2009-2015 time period.
As illustrated in Figure 35, the portion of funds provided by the City of
Montgomery general fund now provides more funds for transit than federal
sources. Any increase in costs or unplanned costs for repairs must be covered
by the City because federal funds are allocated before the fiscal year begins.
Additionally, any capital expenditures, such as for buses in recent years, must
be matched with local funds.
The M Transit System is a small enough system that it qualifies to use a
portion of its federal funds to spend on operations expenditures, unlike large
systems that operate over 100 buses daily. However, by spending federal
funds on operations, it leaves the M Transit System with fewer dollars to spend
on capital investments. In 2015, less than 5% of these funds were spend on
capital investments. In the past, when the M Transit System has purchased
new vehicles it was done through additional grants and not the apportioned
Federal Transit Administration’s 5307 program. The lack of funds to spend on
capital expenses, such as vehicles, has caused the M Transit System to fall
behind in replacing vehicles. While federal grants often provide 80% of the
funds for these purchases, identifying the 20% local match can be difficult
when local funds are being used to operate the system. Replacing the vehicles
will require additional local funds to match beyond those used to operate the
system day to day.
10.2 Recommendation Cost Discussion The total operating cost for the M Transit System in 2014 according to the
National Transit Database (NTD) was $7,310,783. Of this, approximately 80% of
these costs ($5,735,083) went to fixed route services, with the other 20%
supporting operations of paratransit services.
Using the revenue hours projected from the TBEST model and proposed
headways, along with the fully allocated cost of $86.16 per revenue hour, the
estimated cost for fixed route services is $6,712,800. This is an increase of fixed
route operating cost of 17%, and totals an overall increase of $977,717.
However, with the higher ridership projections, additional farebox recovery is
anticipated.
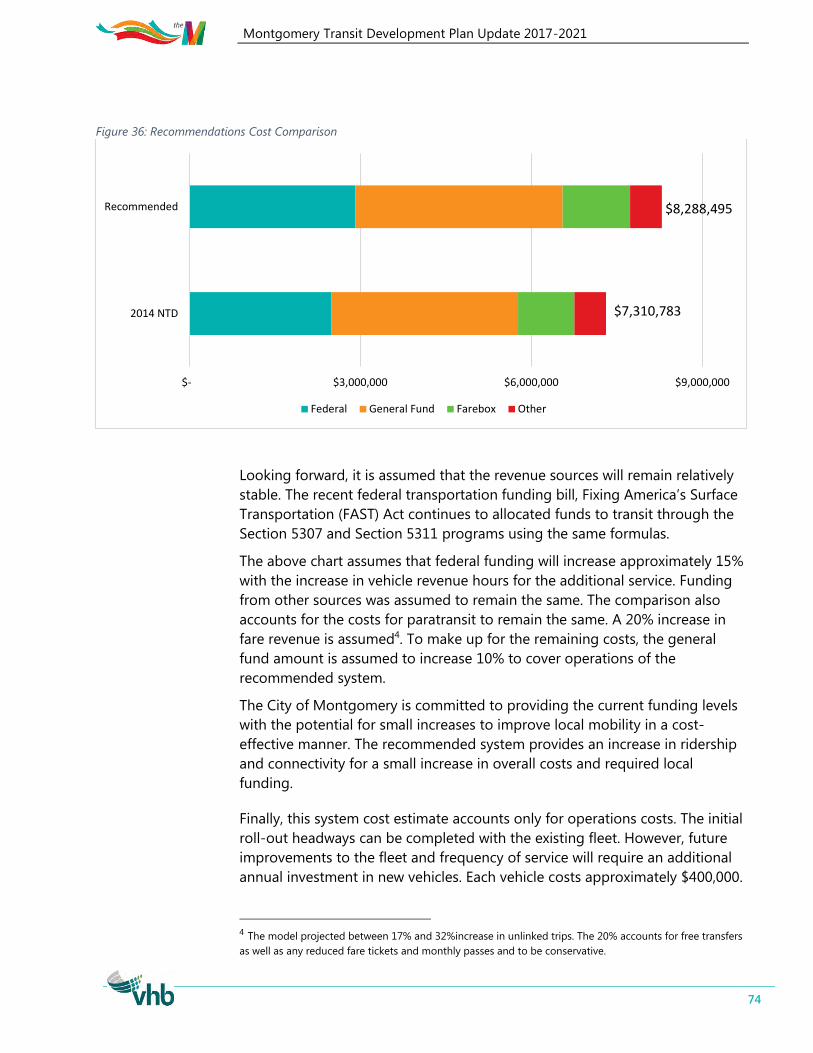
Montgomery Transit Development Plan Update 2017-2021
74
Figure 36: Recommendations Cost Comparison
Looking forward, it is assumed that the revenue sources will remain relatively
stable. The recent federal transportation funding bill, Fixing America’s Surface
Transportation (FAST) Act continues to allocated funds to transit through the
Section 5307 and Section 5311 programs using the same formulas.
The above chart assumes that federal funding will increase approximately 15%
with the increase in vehicle revenue hours for the additional service. Funding
from other sources was assumed to remain the same. The comparison also
accounts for the costs for paratransit to remain the same. A 20% increase in
fare revenue is assumed4. To make up for the remaining costs, the general
fund amount is assumed to increase 10% to cover operations of the
recommended system.
The City of Montgomery is committed to providing the current funding levels
with the potential for small increases to improve local mobility in a cost-
effective manner. The recommended system provides an increase in ridership
and connectivity for a small increase in overall costs and required local
funding.
Finally, this system cost estimate accounts only for operations costs. The initial
roll-out headways can be completed with the existing fleet. However, future
improvements to the fleet and frequency of service will require an additional
annual investment in new vehicles. Each vehicle costs approximately $400,000.
4 The model projected between 17% and 32%increase in unlinked trips. The 20% accounts for free transfers
as well as any reduced fare tickets and monthly passes and to be conservative.
$- $3,000,000 $6,000,000 $9,000,000
2014 NTD
Recommended
Federal General Fund Farebox Other
$8,288,495
$7,310,783

Montgomery Transit Development Plan Update 2017-2021
75
Leveraging federal funds for capital, this would require a local match of 20%,
totaling $80,000 per vehicle.
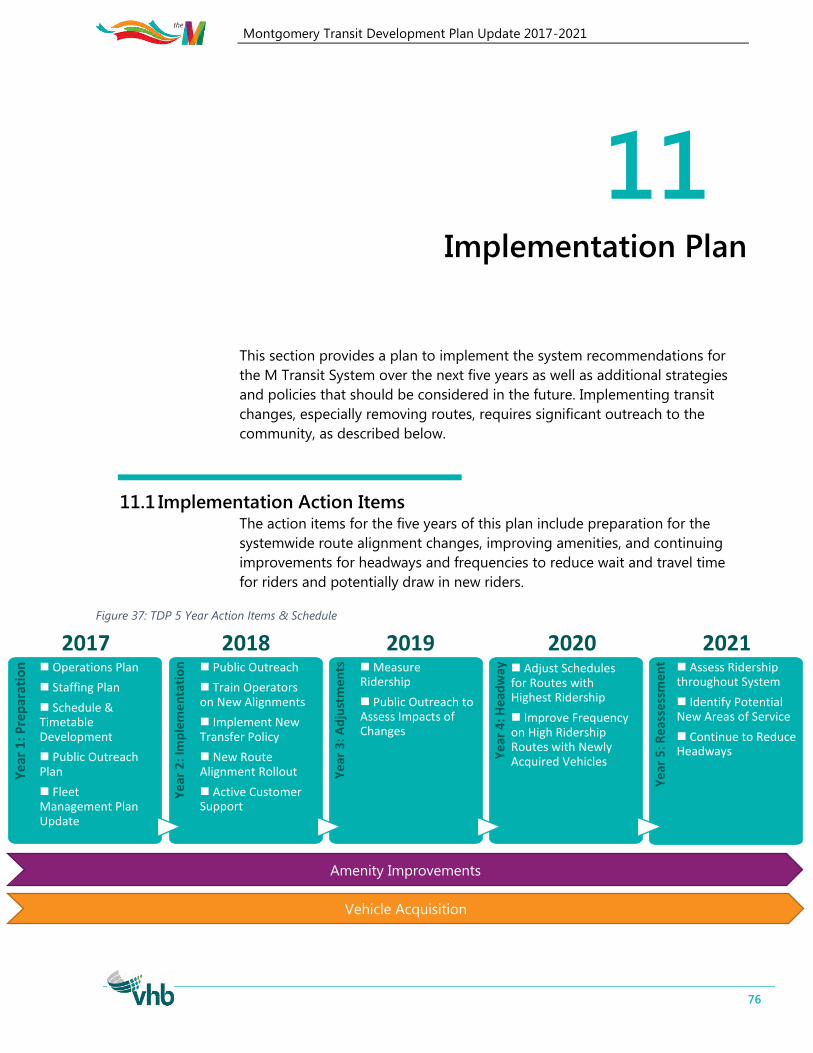
Montgomery Transit Development Plan Update 2017-2021
76
11 Implementation Plan
This section provides a plan to implement the system recommendations for
the M Transit System over the next five years as well as additional strategies
and policies that should be considered in the future. Implementing transit
changes, especially removing routes, requires significant outreach to the
community, as described below.
11.1 Implementation Action Items The action items for the five years of this plan include preparation for the
systemwide route alignment changes, improving amenities, and continuing
improvements for headways and frequencies to reduce wait and travel time
for riders and potentially draw in new riders.
Figure 37: TDP 5 Year Action Items & Schedule
Vehicle Acquisition
Amenity Improvements
Ye
ar 1
: Pre
par
atio
n
Operations Plan
Staffing Plan
Schedule & Timetable Development
Public Outreach Plan
Fleet Management Plan Update
Ye
ar 2
: Im
ple
men
tati
on
Public Outreach
Train Operators on New Alignments
Implement New Transfer Policy
New Route Alignment Rollout
Active Customer Support
Ye
ar 3
: A
dju
stm
ents
Measure Ridership
Public Outreach to Assess Impacts of Changes
Ye
ar 4
: Hea
dw
ay
Ye
ar 5
: Rea
sses
sme
nt
Adjust Schedules for Routes with Highest Ridership
Improve Frequency on High Ridership Routes with Newly Acquired Vehicles
Assess Ridership throughout System
Identify Potential New Areas of Service
Continue to Reduce Headways
2017 2018 2019 2020 2021
Montgomery Transit Development Plan Update 2017-2021
77
2017: Preparation
Implementing significant service changes, particularly where entire routes are
changing or being removed/added require detailed operations planning and
significant outreach to engage existing and potential riders.
A detailed Operations Plan will take the alignments recommended in this TDP
to test the time of runs, ensure that both size buses can fit around all turns,
and that routes have an adequate and safe location to turn around. The
Operations Plan would also include a plan for when buses arrive at transfer
centers. Buses should be scheduled to keep regular headways that are easier
for riders to remember and do not necessarily need to meet on a pulse at
transfer centers. This plan would also determine which routes would be best
suited for which size buses. Along with the Operations Plan, a Staffing Plan will
be necessary, to determine the number of part-time and full-time drivers
necessary to provide the service, and how they will be scheduled on a typical
weekday and Saturday.
A detailed Public Engagement Plan will be critical to reaching riders and
stakeholders about the changes, and why they are happening. Setting a
schedule to reach out to riders, stakeholder groups, and specific
neighborhoods that are most adversely being affected will be important to
help everyone understand how the new system schedule will function, where
the routes will be, and how transfers will be used. At this time, an
announcement that service changes will be coming within six months should
be provided along with the planned public engagement activities.
2018: Implementation
Once the routes are completed and the Public Engagement Plan is set,
reaching out to the public should begin approximately 3 months prior to
service rollout. The three month timeframe should allow time to reach out to
major employers and agencies with a large number of riders, as well as local
neighborhoods that will experience the most change, particularly those who
will be losing service. This will allow enough time for riders to understand
changes affecting them, as well as implement the changes before riders have
forgotten issues and conversations they had with M Transit representatives
about why and how the changes will be occurring. 2018 will include initial
public outreach about changes, increased customer service staff to address
questions and assist passengers when the changes are made and for the first
few months of new service.
At this time, the Operations Plan will have been completed. Any staffing
changes that need to happen to provide the required number of part-time
and full-time drivers should begin to be addressed at this time. With regards
to fare technology, transferring throughout the system will have to be tested.
Important Public
Engagement Items:
Stakeholder
meetings
Working with local
neighborhood
associations
Target local
universities to
identify potential
partnerships
Flyers and poster
information in
transfer centers
and on board
buses
Assistance route
planning with the
new route structure
Clear overview of
the new transfer
policy
Rider engagement
throughout the
system
Montgomery Transit Development Plan Update 2017-2021
78
One of the intentions of the recommended system was to provide more
opportunities for connections throughout the system outside of the existing
transfer centers. This will allow riders to take more direct routes as they travel
throughout the City. Currently, drivers provide transfer passes only at the four
existing transfer locations. Moving forward, riders could request transfer
passes at any location where more than one bus stops. Typically, limits are put
on these transfer that place a time limit (45-120 minutes, depending on the
system to allow for the existing headways) and are not allowed to be used on
board the same route they were issued from. This prevents riders from using
transfers as a pass on a return trip for free.
Finally, in the last month prior to service rollout, it will be important to have
route-specific flyers available at transfer stations and onboard buses as well as
representatives available at transfer stations to talk through how riders will be
able to plan and take their trip. Announcements about the timing of the new
service should be posted throughout the system so all riders and staff are
aware of the impending changes and when to expect them.
It is important to engage the public and change the system at once, ideally
within a year of plan adoption. The short timeframe will allow the public
remembers the conversations they heard about why and when the changes
are occurring. Changing the alignment of all affected routes at once will be a
significant change, but making at once will require riders to only learn their
new routing options once, instead of gradually changing routes and requiring
riders to constantly learn new paths and transfers they must take through the
system.
2019: Adjustments
Once service is implemented, it will be important not to make too many, if any,
reactionary changes within a short period of time. It will take a few months for
riders to get used to the new system, how their trips are affected, and ways to
make their trip most efficiently. It will be important to have staff ready to
answer questions during the first few months of service to assist riders in
adjusting to the new schedules and answer questions.
Ideally, the adjustments made in 2018 will be minimal to reduce additional
route and schedule changes for riders. 2018 will be spend assessing the
ridership throughout to identify routes with high ridership for the
improvement of headways as well as popular stops for installation of new
shelters and/or benches.
2020: Headway Improvements
Reducing headways for routes with high ridership, such as Routes 2 and 12 are
projected to be, could improve service and satisfaction for riders. Reducing
Montgomery Transit Development Plan Update 2017-2021
79
wait time along busy routes also shows investment in the system and
continued improvement. Working to provide more frequent service will not
only better provide service to existing riders, but may draw additional riders as
well. Vehicles acquired in 2018 and 2019 should be put into service to improve
the headways of the routes with the highest ridership.
2021: Reassessment
Continued improvement of headways is recommended until all routes have at
least 30 or 60 minute headways for the top and bottom half of routes when
accounting for overall ridership, trips per mile, and cost per trip.
Continuous Amenity Improvements
The amenity mentioned the most through public engagement was shelters.
During rain and heat, riders desire shelters and/or benches to wait for the bus,
particularly along routes with low frequencies. Additionally, benches and
shelters can increase system visibility. Stop amenities also improve rider
satisfaction and can improve ridership experience.
Vehicle Acquisition
As discussed in Section 9.1, the M Transit System is behind in replacing
vehicles within its fleet. It is recommended that in 2017 the M Transit System
update its Fleet Management Plan to update the age of vehicles and secure
funding to replace vehicles that have passed their useful life. Therefore, while
the schedule shows vehicle acquisition in all five years, vehicles acquired in
2017-2018 will be used to replace the oldest vehicles in the system. Vehicles
acquired in 2019-2021 will be used to increase services through headway
improvements on the most heavily ridden routes.
11.2 Additional Improvement
Considerations Based on observations during data collection, conversations with drivers, and
public outreach, the following additional improvements throughout the
system should be considered if funding becomes available:
Permanent Stops
Many bus drivers discussed the issues that are caused by the existing flagged
stops. While flagged stops were implemented to allow those with physical
disabilities to board the bus where they are best able to, this also adds
complications. Any rider can flag down a bus to stop and different bus drivers
approach this mandate differently. Some stop only where there is a safe place
to pull over to the side, while some will allow boardings anywhere along the
Montgomery Transit Development Plan Update 2017-2021
80
route. This does not send a consistent message to riders who expect to be
able to board anywhere along routes. Additionally, riders will flag stops where
convenient to them, sometimes having a bus stop multiple times within a
quarter mile stretch. Multiple stops where one stop could serve multiple
individuals adds to the drive time of routes and can negatively effect on-time
performance.
It is recommended that the M Transit System transition to fixed, signed stops.
This would include assessing safety along routes to identify stop locations and
implementing policies about stop locations, i.e. nearside, far side, midblock,
and setting a standard distance between stops.
Flex Routes for Low Ridership Areas and Potential New Service Areas
Providing service throughout the City of Montgomery is difficult because of
the low residential density. Routes eliminated in the recommendations were
too expensive to warrant regular, fixed route service. However, these areas
could be served by flex routes. Flex routes provide service to an area and
anyone in that area can schedule a trip. This provides the accessibility of a
paratransit vehicle with a schedule of a fixed route. In areas such as Hunter
Station and Allendale, vehicles could provide flex service during various parts
of the day, or make trips only as schedule and requested by riders. If funds are
available to invest in an additional vehicle to provide this service, or allow
paratransit vehicles to also provide flex service in designated areas along with
providing the complementary service that is federally required, it could bring
service back to these low density, low ridership areas.
Potential Partnerships within City Limits
Service to the Hyundai Plant and Veteran’s Affairs Hospital on Chantilly
Parkway were discussed during stakeholder outreach. However, because these
locations are on the border of the City, requiring vehicles to travel on roads
outside City limits to reach them was a barrier. It is recommended that the M
Transit System reach out to these facilities to discuss partnerships for service
that could be added onto nearby routes to efficiently provide access to these
locations, and other major employers or destinations that desire connectivity.
Connections beyond City Limits
Public outreach identified the Wind Creek Montgomery Casino as destination
riders and potential riders need to access for employment. Currently, all local
funding for the M Transit System comes from the City of Montgomery,
limiting service to within the City limits. The casino presents an opportunity for
a partnership to cross the municipal boundary and increase access. The M
Transit System should pursue discussions with the Casino to operate a shuttle
from the casino to either a location just within the City or a transfer point.
Success working with an employer outside of City limits could open the door
Montgomery Transit Development Plan Update 2017-2021
81
for additional partnerships and/or longer distance commuter service into/out
of Montgomery.
Stakeholders also identified commuter and express buses as something
desired by those commuting into the Montgomery Central Business District
from bordering communities. In the long term, the M Transit System should
pursue partnerships with bordering municipalities with a significant number of
commuters. This could include nearby cities and/or counties. This type of
partnership would require a financial component to allow M Transit System
vehicles to provide service outside of the Montgomery City limits. This would
require a study concerning the number of commuters from nearby
communities, demographics, and what transit amenities would affect their
travel mode decisions.