Embed Size (px)
Citation preview

Aalborg Universitet
Transient Studies in Large Offshore Wind Farms, Employing Detailed Circuit BreakerRepresentation
Glasdam, Jakob Bærholm; Bak, Claus Leth; Hjerrild, Jesper
Published in:Energies
DOI (link to publication from Publisher):10.3390/en5072214
Publication date:2012
Document VersionPublisher's PDF, also known as Version of record
Link to publication from Aalborg University
Citation for published version (APA):Glasdam, J. B., Bak, C. L., & Hjerrild, J. (2012). Transient Studies in Large Offshore Wind Farms, EmployingDetailed Circuit Breaker Representation. Energies, 2214-2231. https://doi.org/10.3390/en5072214
General rightsCopyright and moral rights for the publications made accessible in the public portal are retained by the authors and/or other copyright ownersand it is a condition of accessing publications that users recognise and abide by the legal requirements associated with these rights.
? Users may download and print one copy of any publication from the public portal for the purpose of private study or research. ? You may not further distribute the material or use it for any profit-making activity or commercial gain ? You may freely distribute the URL identifying the publication in the public portal ?
Take down policyIf you believe that this document breaches copyright please contact us at [email protected] providing details, and we will remove access tothe work immediately and investigate your claim.

Energies 2012, 5, 2214-2231; doi:10.3390/en5072214
energies ISSN 1996-1073
www.mdpi.com/journal/energies
Article
Transient Studies in Large Offshore Wind Farms Employing Detailed Circuit Breaker Representation
Jakob Glasdam 1,*, Claus Leth Bak 2 and Jesper Hjerrild 1
1 DONG Energy A/S, Kraftværksvej 53, Skærbæk, Fredericia 7000, Denmark;
E-Mail: [email protected] 2 Institute of Energy Technology, Aalborg University, Pontoppidanstræde 101, Aalborg SE 9220,
Denmark; E-Mail: [email protected]
* Author to whom correspondence should be addressed; E-Mail: [email protected];
Tel.: +45-9955-9268.
Received: 25 May 2012; in revised form: 18 June 2012 / Accepted: 29 June 2012/
Published: 5 July 2012
Abstract: Switching overvoltages (SOV) are considered a possible source of component
failures experienced in existing offshore wind farms (OWFs). The inclusion of sufficiently
accurate and validated models of the main electrical components in the OWF in the
simulation tool is therefore an important issue in order to ensure reliable switching
operations. Transient measurement results in an OWF are compared with simulation results
in PSCAD EMTDC and DigSILENT Power Factory. A user-defined model of the vacuum
circuit breaker (VCB) is included in both tools, capable of simulating multiple prestrikes
during the closing operation. An analysis of the switching transients that might occur in
OWFs will be made on the basis of the validated model, and the importance of the
inclusion of a sufficiently accurate representation of the VCB in the simulation tool will be
described. The inclusion of the VCB model in PSCAD greatly improves the simulation
results, whereas little improvement is found in DigSILENT. Based on the transient study it
is found that the simulated SOV can be up to 60% higher at the sending end when using the
detailed VCB representation compared to the built-in switch, which emphasises the need
for accurate representation of the VCB for energisation studies.
Keywords: cable modelling; circuit breaker modelling; DigSILENT Power Factory; model
validation; offshore wind; transient studies; PSCAD
OPEN ACCESS

Energies 2012, 5 2215
1. Introduction
In OWF applications, the consequences of component failure are more severe compared to land
based wind farms, due to higher repair costs and lost revenue [1]. Switching overvoltages are considered
a possible cause of component failure observed in Horns Rev 1 OWF as well as in Middelgrunden
OWF [2]. Simulations are widely used to identify the overvoltages that might occur in the OWF due to
faults and switching operations and in order to verify the design decisions [1]. Validation of OWF
component models is therefore an important issue in order to ensure reliable switching studies. It has
been shown in [3,4], that insufficient representation of the radial circuit breaker in the simulation tool
is the main contributor to discrepancies between measurement and simulation results for radial
energisation in OWFs. The vacuum circuit breaker (VCB) is the preferred choice as the radial circuit
breaker in OWFs due to its low maintenance requirement and long operation life [5,6]. Due to the
dielectric properties of vacuum, a number of so-called prestrikes are almost inevitable during the
closing operation. The prestrike is a consequence of the decreasing contact gap distance during the
closing operation, which facilitates the formation of a low impedance vacuum arc before galvanic
contact is established. Because of the working principle of the VCB, there exists a high possibility that
the high frequency (HF) inrush current is interrupted at its zero crossing [7]. Depending on the voltage
impressed on the contacts, multiple prestrikes might occur. The occurrence of multiple prestrikes is a
complex matter and difficult to predict, as the generated voltages and currents depend on many factors
such as the dielectric and current interruption properties of the VCB, on the surge impedances of the
surrounding network, pole scatter, point on wave of closing and so on [8]. This sets up a demand for the
inclusion of a sufficiently accurate VCB representation in the simulation tool, capable of taking into
account network/circuit breaker interaction during the closing operation. There is a number of
published VCB models in [9–13]. However these models are intended for investigation on the VCB’s
capability of prematurely interrupting low-amplitude 50 Hz inductive currents during an open operation.
This paper presents a user-defined model representation of the VCB intended for radial energisation
studies in OWFs. The model has been implemented in PSCAD EMTDC and DigSILENT Power
Factory and will be described in section 2. The usability of the model will be discussed in section 3
based on comparison with measurement data and the proposed model will be used in section 4 in order
to investigate possible occurring SOV in OWFs.
2. System Description
In this paper, the Nysted OWF (NOWF) is taken into consideration as an example, where GPS
synchronised, HF measuring systems were installed and used for measurement at different locations in
the OWF during the transient measurement campaign as indicated in Figure 1.
The NOWF consists of 72 × 2.3 MW rated Siemens wind turbines (WTs). The WTs are arranged in
a parallelogram formed by eight strings or radials. Nine WTs are connected to each radial. The cable
collecting grid is operated at 33 kV, and the voltage is increased to 132 kV through the 90/90/180
MVA park transformer, located offshore. Each radial is connected to one of the park transformers two
medium voltage (MV) bus bars through a VCB.

Energies 2012, 5 2216
Figure 1. Schematic of the Nysted Offshore Wind Farm. The three locations where
the measurement system was installed during the transient measurement campaign are
also indicated.
The transient measurement is done by energising radial A, when all other radial are energised.
The WTs were not under production during the recording of the transients. The transient measurements
are recorded using a novel high-frequency, GPS-synchronised measurement system, developed by
DELTA A/S and is described in more detail in [1]. The measurement system consists of three units
installed at the three locations indicated in Figure 1.
2.1. System Modelling
A model of NOWF has been implemented in DigSILENT and PSCAD based on the information
available from the OWF as-built documentation. The export cable system, consisting of a submarine
cable and a land-based cable, is modelled using the lumped π-model in both simulation tools.
The external network is represented by its Thevenin equivalent. Only the radials connected to the same
bus bar as radial A (radials B to D) are included in the model and are each represented by one long
cable, hence the transformers on radials B to D are omitted in the model as shown in Figure 2.
Figure 2. Schematic of network model where only radial A is modelled in detail.
Energies 2012, 5 2217
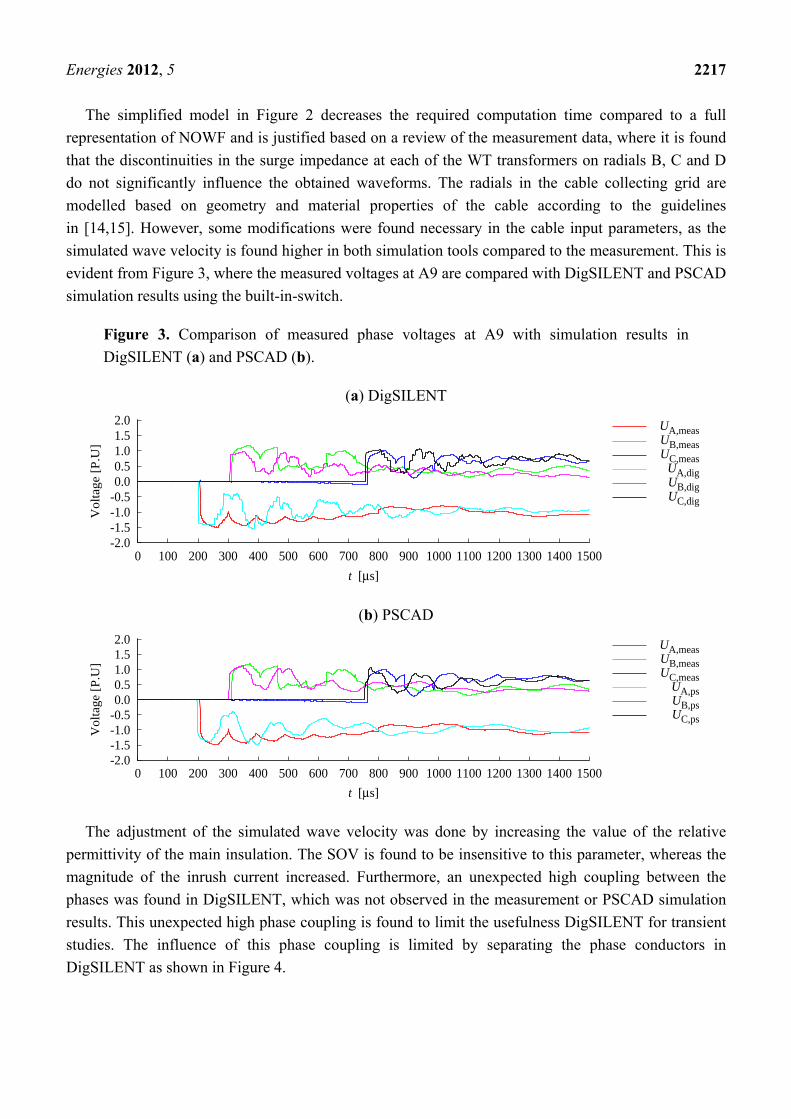
The simplified model in Figure 2 decreases the required computation time compared to a full
representation of NOWF and is justified based on a review of the measurement data, where it is found
that the discontinuities in the surge impedance at each of the WT transformers on radials B, C and D
do not significantly influence the obtained waveforms. The radials in the cable collecting grid are
modelled based on geometry and material properties of the cable according to the guidelines
in [14,15]. However, some modifications were found necessary in the cable input parameters, as the
simulated wave velocity is found higher in both simulation tools compared to the measurement. This is
evident from Figure 3, where the measured voltages at A9 are compared with DigSILENT and PSCAD
simulation results using the built-in-switch.
Figure 3. Comparison of measured phase voltages at A9 with simulation results in
DigSILENT (a) and PSCAD (b).
(a) DigSILENT
(b) PSCAD
The adjustment of the simulated wave velocity was done by increasing the value of the relative
permittivity of the main insulation. The SOV is found to be insensitive to this parameter, whereas the
magnitude of the inrush current increased. Furthermore, an unexpected high coupling between the
phases was found in DigSILENT, which was not observed in the measurement or PSCAD simulation
results. This unexpected high phase coupling is found to limit the usefulness DigSILENT for transient
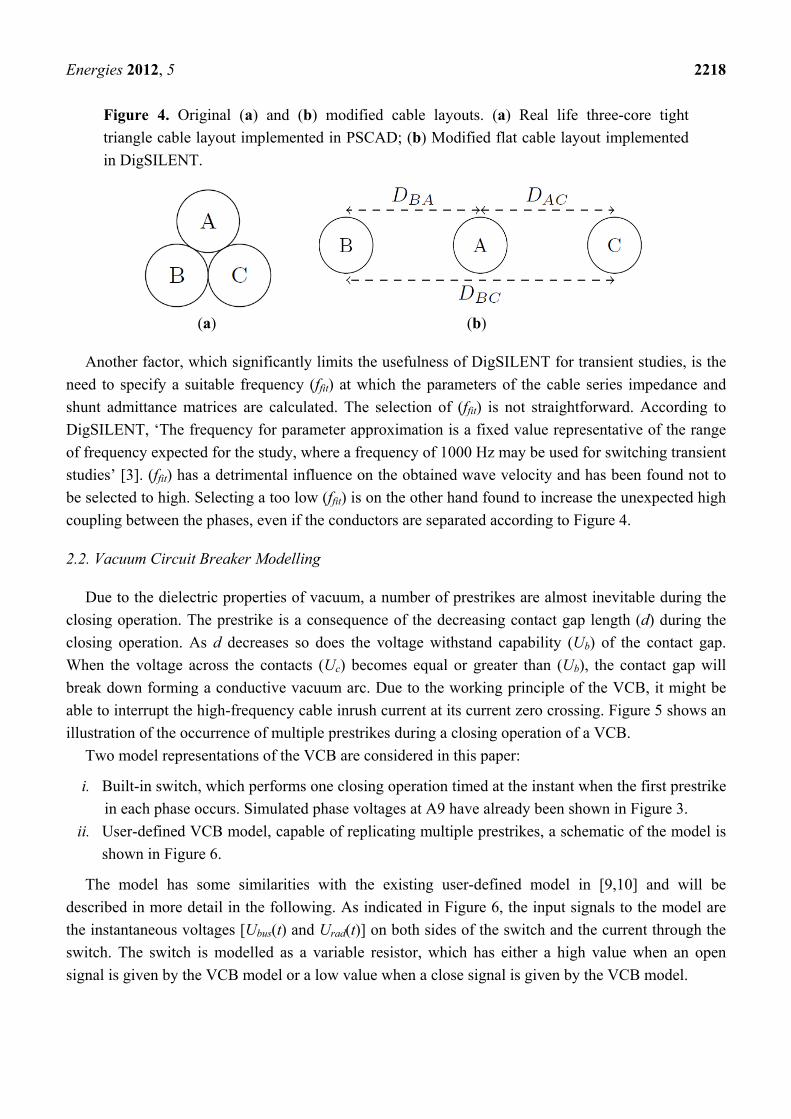
studies. The influence of this phase coupling is limited by separating the phase conductors in
DigSILENT as shown in Figure 4.
-2.0-1.5-1.0-0.50.00.51.01.52.0
0 100 200 300 400 500 600 700 800 900 1000 1100 1200 1300 1400 1500
Vol
tage
[P
.U]
t [μs]
UA,measUB,measUC,meas
UA,digUB,digUC,dig
-2.0-1.5-1.0-0.50.00.51.01.52.0
0 100 200 300 400 500 600 700 800 900 1000 1100 1200 1300 1400 1500
Vol
tage
[P
.U]
t [μs]
UA,measUB,measUC,meas
UA,psUB,psUC,ps
Energies 2012, 5 2218
Figure 4. Original (a) and (b) modified cable layouts. (a) Real life three-core tight
triangle cable layout implemented in PSCAD; (b) Modified flat cable layout implemented
in DigSILENT.
(a) (b)
Another factor, which significantly limits the usefulness of DigSILENT for transient studies, is the
need to specify a suitable frequency (ffit) at which the parameters of the cable series impedance and
shunt admittance matrices are calculated. The selection of (ffit) is not straightforward. According to
DigSILENT, ‘The frequency for parameter approximation is a fixed value representative of the range
of frequency expected for the study, where a frequency of 1000 Hz may be used for switching transient
studies’ [3]. (ffit) has a detrimental influence on the obtained wave velocity and has been found not to
be selected to high. Selecting a too low (ffit) is on the other hand found to increase the unexpected high
coupling between the phases, even if the conductors are separated according to Figure 4.
2.2. Vacuum Circuit Breaker Modelling
Due to the dielectric properties of vacuum, a number of prestrikes are almost inevitable during the
closing operation. The prestrike is a consequence of the decreasing contact gap length (d) during the
closing operation. As d decreases so does the voltage withstand capability (Ub) of the contact gap.
When the voltage across the contacts (Uc) becomes equal or greater than (Ub), the contact gap will
break down forming a conductive vacuum arc. Due to the working principle of the VCB, it might be
able to interrupt the high-frequency cable inrush current at its current zero crossing. Figure 5 shows an
illustration of the occurrence of multiple prestrikes during a closing operation of a VCB.
Two model representations of the VCB are considered in this paper:
i. Built-in switch, which performs one closing operation timed at the instant when the first prestrike
in each phase occurs. Simulated phase voltages at A9 have already been shown in Figure 3.
ii. User-defined VCB model, capable of replicating multiple prestrikes, a schematic of the model is
shown in Figure 6.
The model has some similarities with the existing user-defined model in [9,10] and will be
described in more detail in the following. As indicated in Figure 6, the input signals to the model are
the instantaneous voltages [Ubus(t) and Urad(t)] on both sides of the switch and the current through the
switch. The switch is modelled as a variable resistor, which has either a high value when an open
signal is given by the VCB model or a low value when a close signal is given by the VCB model.

Energies 2012, 5 2219
Figure 5. Schematic of multiple prestrikes during the VCB closing operation. At time
t = t0, the voltage impressed on the VCB contacts (Uc) becomes equal the withstand voltage
of the contact gap (Ub), which then breaks down allowing an inrush current to flow, which
is being interrupted at one of its zero crossings at t1. At t2 the voltage built op across the
contacts becomes equal Ub and the gap breaks down again. This sequence occurs again at t3
and t4. At t5, the contacts are touching.
Figure 6. Schematic of the VCB model.
The closing signal is created by comparing the contact gap voltage (Ub(t) = Ubus(t) − Urad(t) with the
withstand voltage (Ub(t)) of the contact gap and is triggered when Uc(t) ≥ Ub(t) The contacts of a VCB
close with a more or less constant velocity during the closing operation, but vary from operation to
operation in the range of 0.5–1.0 ms−1. Furthermore, there is a linear relationship between Ub and the
length of the contact gap (d) for medium-voltage levels encountered in OWFs [16]. The linear
relationship is expressed in terms of the rate of decay of the dielectric strength (rdds in V·µs−1). The
value of rdds is considered stochastic as the closing velocity can vary from operation to operation. The
withstand voltage during the closing operation can then be represented according to Equation (1):
, [V] (1)
where tcl is the instant of the closing start time and Ub,init is the withstand voltage in the open position
prior to t = tcl.

Energies 2012, 5 2220
If the calculated Ub is lower than Uc, the switch in Figure 6 is signalled to close, allowing an inrush
current to flow as indicated in Figure 5. Depending on the slope of the current (dI/dt) at its zero
crossing, there is a finite possibility that the VCB will be able to interrupt the current [9]. The current
zero crossing is detected and dI/dt is calculated according to Equation (2), where I(t − ∆t) is the
simulated current at the previous time step:
dd
Δ
Δ (2)
If the current quenching capability (CQ in A·µs−1) is higher than the calculated dI/dt, the switch is
signalled to open. The current quenching capability of the VCB is experimentally found in the range of
150–600 A·µs−1 [9,11].
3. Vacuum Circuit Breaker Model Validation
There is no information available for the VCBs installed at NOWF; hence the input parameters to
the VCB model have been adjusted in each phase in order to best fit the simulation results with the
measurement results. This is further justified by the fact that the parameters are stochastic by nature as
the closing operation can begin with equal likelihood throughout one period of the 50 Hz voltage sine
wave and rdds can range from 25 to 100 V·µs−1 [12,13]. It was observed in the measurement results
from different study cases in NOWF, that the current is being interrupted each time it crosses zero, hence
the value of CQ has been set to 600 A·µs−1, as this is the highest measured value for this parameter [17].
3.1. PSCAD
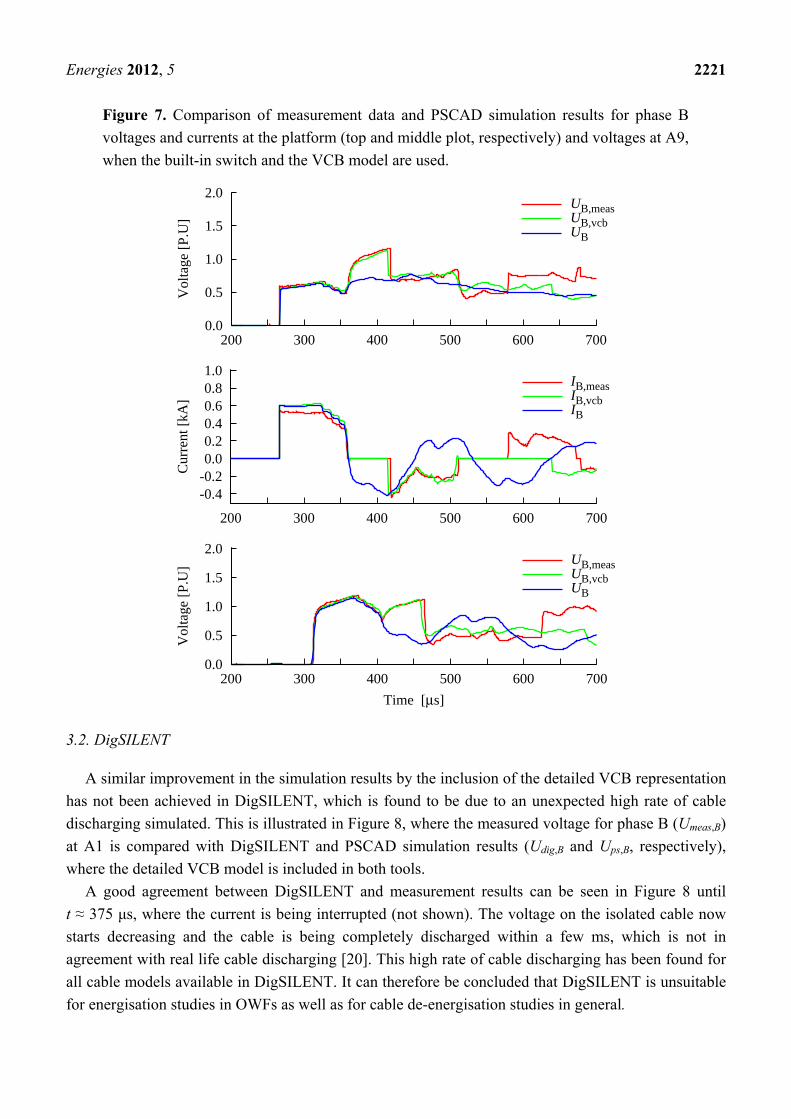
Figure 7 shows the comparison of measurement (red curves) and PSCAD simulation results with
the built-in switch (blue) and with the detailed VCB representation (green) for phase B voltages and
currents at the platform and the voltages at A9. It is possible to the see that the measured current
(Imeas,B) is being interrupted at its zero crossing and therefore appears as “half waves”, which is an
indication that multiple prestrikes are occurring. The current interruption causes an energy transfer
from the magnetic field associated with the propagating current wave to the electric field associated
with the propagating voltage wave in order to comply with energy conservation. The result is an
increase in Umeas,B at the platform, which propagates toward the receiving end of radial A, where it is
superimposed on the initial wave. IB in the PSCAD simulation using the built-in switch is not being
interrupted at its zero crossing and hence the voltage built up at the platform as well as at A9 is not
replicated. IB,VCB is being interrupted at its zero crossing in the PSCAD simulation using the detailed
VCB representation. A good agreement between the measured and simulated wave forms at the two
locations can therefore be seen for the initial part of the transient. It has not been possible to further
improve the simulation results for the remaining part of the transient. However, this is considered to be
of little importance as the generated SOV is highest in the initial part of the transient. From Figure 7 it
is evident that a sufficiently accurate representation of the VCB in the simulation tool is required in
order to replicate the multiple prestrikes inherent to the VCB technology and hence to OWFs due to
the widespread use of the VCB.
Energies 2012, 5 2221
Figure 7. Comparison of measurement data and PSCAD simulation results for phase B
voltages and currents at the platform (top and middle plot, respectively) and voltages at A9,
when the built-in switch and the VCB model are used.
3.2. DigSILENT
A similar improvement in the simulation results by the inclusion of the detailed VCB representation
has not been achieved in DigSILENT, which is found to be due to an unexpected high rate of cable
discharging simulated. This is illustrated in Figure 8, where the measured voltage for phase B (Umeas,B)
at A1 is compared with DigSILENT and PSCAD simulation results (Udig,B and Ups,B, respectively),
where the detailed VCB model is included in both tools.
A good agreement between DigSILENT and measurement results can be seen in Figure 8 until
t ≈ 375 μs, where the current is being interrupted (not shown). The voltage on the isolated cable now
starts decreasing and the cable is being completely discharged within a few ms, which is not in
agreement with real life cable discharging [20]. This high rate of cable discharging has been found for
all cable models available in DigSILENT. It can therefore be concluded that DigSILENT is unsuitable
for energisation studies in OWFs as well as for cable de-energisation studies in general.
0.0
0.5
1.0
1.5
2.0
200 300 400 500 600 700
Vol
tage
[P.
U]
UB,measUB,vcbUB
-0.4-0.20.00.20.40.60.81.0
200 300 400 500 600 700
Cur
rent
[kA
]
IB,measIB,vcbIB
0.0
0.5
1.0
1.5
2.0
200 300 400 500 600 700
Vol
tage
[P.
U]
Time [μs]
UB,measUB,vcbUB

Energies 2012, 5 2222
Figure 8. Comparison of measurement data and DigSILENT and PSCAD simulation.
Results at A1.
4. Transient Studies in Nysted Offshore Wind Farm
The radials in an OWF are supposed to be energised randomly [4]. Different scenarios are
investigated in the following in order to give an insight into the SOV that might occur within an OWF
using the validated PSCAD model of NOWF, where the detailed VCB model is included.
4.1. Energisation of Radial A
Figure 9 shows the results of three simulations for phase A at the platform, where the number of
radials connected to the same bus bar as radial A (radials B to D, see Figure 1) is varied. The subscript
number in the figure denotes the number of radials connected during the energisation of radial A
(i.e., subscript 3 is for the situation, where radials B, C and D are connected, 2 is for the situation,
where radials C and D are connected, and 1 is when only radial D is connected).
Figure 9. Simulated platform voltages and currents for the three study cases for phase A.
Label numbering corresponds to the number or radials connected when radial A is
being energised.
0.0
0.5
1.0
1.5
200 300 400 500 600 700
Vol
tage
[P.U
]
Time [μs]
UB,measUB,digUB,ps
-1.5
-1.0
-0.5
0.0
100 200 300 400 500 600 700 800 900
Vol
tage
[P.U
]
UA,3UA,2UA,1
-0.8
-0.4
0.0
0.4
0.8
100 200 300 400 500 600 700 800 900
Cur
rent
[kA
]
Time [μs]
IA,3IA,2IA,1

Energies 2012, 5 2223
The magnitude of the generated SOV in Figure 9 is increased when more radials are connected.
This is due to the fact that impedance ZBus at the bus bar side of the VCB is lowered when the number
of radials connected is increased. The voltage drop on ZBus is therefore lowered when radial A is being
energised. The peak of the simulated inrush current in Figure 9 is also increased when more radials are
connected. The cables in NOWF are equipped with XLPE insulation with a high value of the relative
permittivity (єr), hence it is possible for the sake of simplicity to represent the cable as a capacitor (C),
where the voltage/current relationship is given by Equation (3) [18]:
· [A] (3)
A drop in the voltage at the platform can be seen prior to the current interruption at t ≈ 250 µs,
which is also occurring in the current traces due to the linear relationship between voltage and current
given by the characteristic impedance (Zc) of the cable during the transient. The voltage drop at the
platform when radial A is being energised propagates on the radials connected to the same bus bar.
The cables on each radial are identical; hence the difference in the travelling times depends only on the
length of the radials. The difference in the lengths of radial A to D depends on the location of the first
WT on each radial relative to the platform, where D is the shortest and A is the longest radial. This
explains that the three stepwise decreases in UA,3 in Figure 9 before the wave propagating on radial A
reappears at the platform and the current is interrupted. Similarly, two stepwise decreases in UA,2 are
simulated for radials C and D connected and one drop is simulated for UA,2, when only radial D is
connected. The total voltage drop due to the interaction with the other radials is highest when only
radial D is connected, which is due to the higher drop in the bus bar voltage at the instant, when radial
A is energised, as explained in the above.
As previously explained, the current interruption causes an increase in the platform voltage (Uplat,
on the radial side of the VCB), which is simulated in all three cases. The magnitude of the voltage
increase is highest for UA,3 and lowest for UA,1, which is due to the different voltage drops as explained
in the above. The frequency of the transients is f = 5.3 kHz for all cases, indicating that the energy into
radial A is transferred from the other radials connected. This is the so-called back-to-back energisation,
which is equivalent to the connection of a capacitor bank to an already energised capacitor bank [19].
A highly simplified schematic of the situation is shown in Figure 10, where radial A is being
connected to the bus bar, where an already energised cable is connected. Lgrid is the Thevenin
inductance of the external network. The series impedance of the cable is low, hence the capacitances
CA and CB can be considered in parallel and an energy transfer from cable B to cable A is taking place.
The frequency of the inrush current in Figure 8 can be calculated as in Equation (4) [18]:
√
[Hz] (4)
where µr and єr are the relative permeability and permittivity of the cable, respectively. Equation (4)
indicates that the frequency of the transients when other cables depends only on the materials and
length of the cable.

Energies 2012, 5 2224
Figure 10. Simplified schematic of the connection of cable A to the already energised
cable B, losses are neglected.
The situation is different when no cables are connected to the bus bar, as cable A will interact with
the external network as shown in Figure 11.
Figure 11. Simplified schematic of the connection of cable A, when no cables
are connected.
The frequency of the transients in case no radials are connected is given in Equation (5), where it is
evident that Lgrid will lower the transient frequency:
[Hz] (5)
The simulation results for the case with no radials connected are shown in Figure 12, where
f = 3.8 kHz, which is 28% lower compared to the situation, where other radials are connected.
Figure 12. Simulated platform voltages and currents for phase A when no radials are connected.
-2.0
-1.5
-1.0
-0.5
0.0
100 200 300 400 500 600 700 800 900
Vol
tage
[P.U
]
UA,0
-0.8
-0.4
0.0
0.4
100 200 300 400 500 600 700 800 900
Cur
rent
[kA
]
Time [μs]
IA,0

Energies 2012, 5 2225
4.2. Comparison of Different OWF Configurations
The influence of the OWF configuration on the SOV will be investigated in the following, where
three cases are considered:
(i) Radial A energisation.
(ii) Radial D energisation, Figure 13(a).
(iii) Radial A energisation, where the length of radial A is doubled and the lengths of radials B to D
are increased in order to maintain the original radial inter spacing, Figure 13(b).
Figure 13. Schematic of the model representation of the internal network of NOWF for
(a) case (ii) and (b) case (iii).
(a) Case (ii) (b) Case (iii)
D3
D2
D5
D4
D7
D6
D9
D8
D1
Three radials are connected to the platform in each of the three cases (i.e., radials B–D are already
energised in case (i) and (iii) and radials A–C are energised in (ii). Case (i) is the same as in the
previous section and the network model was shown in Figure 2. Case (iii) is a hypothetical case, where
the step up transformer is located onshore and hence the radial lengths are increased.
Figure 14 shows the initial part of the simulated phase A voltages and currents at the sending end of
the radial being energised. The initial parts of the transients are identical in the three cases, which is
due to the identical types and number of cables connected to the bus bar in the three cases.
Differences can be seen for the travelling wave times and hence the transient frequency, which is
due to the different length of the radial being energised in the three cases. The three stepwise decreases
in the waveforms for case (i) (red curves) due to interaction with the other radials connected are also
occurring in case (iii) (blue curves), whereas they are more attenuated, which is due to the longer

Energies 2012, 5 2226
travelling distances in this case. The radial interaction is not occurring in case (ii), where radial D is
being energised. Because of the shorter length of radial D compared to the other radials, the wave
propagating on this radial will reappear at the platform, where the current is interrupted before the
waves on the other radials reappear at the platform.
Figure 14. Simulated sending end voltages and currents for the three study cases for phase A.
4.3. Point on Wave Influence on the Generated SOV
The most important parameter on the generated SOV is the point on voltage wave (POW). The
POW is the instantaneous voltage at the instant t0, when the closing operation begins, as shown in
Figure 15. In the figure, it is for simplicity assumed that t0 occurs simultaneously in each phase, which
might not occur in real life due to mechanical tolerances in the drive mechanism [20]. As seen in
Figure 15, the voltage impressed on the cable when the prestrike occurs at t1 is dependent on the POW.
However, the first prestrike will not necessarily occur in the phase with the highest POW at t0, as can
be seen in Figure 15, where phase B breaks down before phase A. The SOV in phase B will therefore
be higher than in phase A.
t0 is uniformly distributed over one period of the fundamental frequency, which results in an infinite
number of switching combinations. Different methods to capture the highest possible SOV are
available, namely the systematic and the statistical switches [21,22]. However, none of the existing
methods is taking into account the possibility of the occurrence of multiple prestrikes, inherent to the
VCB technology.
-2.0
-1.6
-1.2
-0.8
-0.4
0.0
150 200 250 300 350 400 450 500 550
Vol
tage
[P.U
]
UA,c1UA,c2UA,c3
-0.8
-0.6
-0.4
-0.2
0.0
150 200 250 300 350 400 450 500 550
Cur
rent
[kA
]
Time [μs]
IA,c1IA,c2IA,c3

Energies 2012, 5 2227
Figure 15. Schematic showing the closing of the VCB in a three phase system, where Uc is
the voltage impressed on the vacuum gap. t0 is the instant when the closing begins, t1 when
the first prestrike in the respective phase occurs and the contacts are closed at t2.
A number of simulations have been carried out in order to investigate the influence of the POW on
the generated SOV. This is done by systematically varying the instant t0, when the closing operation
begins by an increment of 1 ms over one period of the fundamental frequency. The simulations have
been done for both VCB representations investigated in the current paper in order to compare the
simulation results. The simulations are done by energising radial A, when radials B to D are connected
and the highest case SOV has been captured for each simulation at the platform and at A9, as shown
in Figure 16. The time axis in Figure 16 indicates the instant, when the closing operation begins in
the simulation.
Half wave symmetry of the highest case SOV is evident for both VCB representations in Figure 12.
It is therefore possible to confine t0 at an interval of 10 ms in a 50 Hz system in order to reduce the
required computational time.
It is suggested in [22], that t0 can be confined to the peak portion of the voltage wave and for
positive values of dU/dt of the voltage wave, and hence further reduce the computational time.
However, this is not in agreement with the measurement results in NOWF, as it has been found that the
multiple prestrikes are occurring for a negative value of dU/dt for one of the phases during the closing
operation. The author therefore proposes that t0 should be confined to an interval of 10 ms. From the
top plot in Figure 16, it appears that there are large differences in the simulated case OV at the
platform using the two VCB representations; the highest difference being 60%. This therefore stresses
out the importance of the inclusion of a sufficiently accurate VCB representation in the simulation

Energies 2012, 5 2228
tool, as it was found from Figure 7 that the detailed VCB representation greatly improves the accuracy
of the simulation results. Little difference can be observed in the simulation results at A9 in the bottom
plot in Figure 16, which is also in good agreement with Figure 7. A similar agreement is also found at
A1 (not shown). It can therefore be concluded that a sufficiently accurate VCB representation is
required in the simulation tool in order to predict the SOV at the platform, whereas the built-in switch
can be used if only the SOV at the wind turbines is investigated. From Figure 16 it is furthermore
evident that the selected resolution of 1 ms for t0 is too low, as there are large differences between
some of the successive simulation results at both locations. This is true for both VCB representations.
This finding implies the importance of the inclusion of a VCB representation, capable of taking into
account the randomness of the closing instant as described in the above.
Figure 16. Simulated case SOV using the built-in switch and the detailed VCB description.
Top plot at the platform and bottom plot at A9.
5. Conclusions
Transient measurement results from NOWF have been compared with simulation results in this
paper with emphasis on the radial vacuum circuit breaker, which has previously been found to be the
main limitation in the accuracy of simulation results in OWFs. A user-defined representation of the
VCB has been implemented in PSCAD EMTDC and DigSILENT Power Factory and the simulation
results have been compared with transient measurement results in NOWF, where one of the radials is
being energised. The inclusion of the VCB in PSCAD greatly improves the accuracy of the simulation
results, whereas little improvement was found in the DigSILENT simulation results, which was found
to be due to an unexpected high rate of cable discharging after current interruption. DigSILENT is
therefore found unsuitable for energisation studies in OWFs as well as for cable de-energisation
studies in general.
1.0
1.1
1.2
1.3
1.4
1.5
1.6
1.7
1.8
0 2 4 6 8 10 12 14 16 18 20
Vol
tage
[P.U
]
OV, vcbOVRatio [-]
0.91.01.11.21.31.41.51.61.71.81.9
0 2 4 6 8 10 12 14 16 18 20
Vol
tage
[P.
U]
Instant of closing [ms]
OV, vcbOVRatio [-]

Energies 2012, 5 2229
A transient analysis has been carried out in order to investigate the possible SOV that might occur
in large OWFs during radial energisation. It has been found that a sufficiently accurate VCB
representation is required in the simulation tool in order to predict the SOV at the platform, whereas
the built-in switch can be used if only the SOV at the wind turbines is required. The magnitude of the
SOV is found to increase with the increased number of radials connected. The transient frequency is
found to be insensitive to the number of connected radials, as long as at least one radial is connected.
This indicates the little influence of the external network. The accuracy of the external network
becomes important with no radials connected as the frequency is lowered by ≈ 28% compared to the
situations with one or more radials connected. This is due to the interaction with the short circuit
inductance of the external network.
The analysis has shown that all possible scenarios regarding radial energisation should be
investigated in the design phase of future OWFs.
Acknowledgments
The transient measurement results used in this study were obtained under a project entitled
“Voltage conditions and transient phenomena in medium voltage grids of modern wind farms”,
contract 2005-2-6345, supported by the Danish TSO Energinet.dk.
References
1. Christensen, L.; Ulletved, M.; Sørensen, P.; Sørensen, T.; Olsen, T.; Nielsen, H.; Sørensen, P.;
Holmstrøm, O. GPS Synchronized High Voltage Measuring System. In Proceedings of Nordic
Wind Power Conference, Roskilde, Denmark, 1–2 November 2007.
2. Sweet, W. Danish wind turbines take unfortunate turn. Spectrum IEEE 2004, 41, 30–34.
3. Sørensen, P.; Hansen, A.D.; Sørensen, T.; Nielsen, C.S.; Nielsen, H.K.; Christensen, L.; Ulletved, M.
Switching Transients in Wind Farm Grids. In Proceedings of European Wind Energy Conference
and Exhibition, Lyngby, Denmark, 28–31 August 2007.
4. Arana, I.; Holbøll, J.; Sørensen, T.; Nielsen, A.H.; Sørensen, P.; Holmstrøm, O. Comparison of
Measured Transient Overvoltages in the Collection Grid of Nysted Offshore Wind Farm with
EMT Simulations. In Proceedings of International Conference on Power Systems Transients
(IPST2009), Kyoto, Japan, 3–6 June 2009.
5. Liljestrand, L.; Sannino, A.; Breder, H.; Thorburn, S. Transients in collection grids of large
offshore wind parks. Wind Energy 2008, 11, 45–61.
6. Arana, I.; Kocewiak, L.; Holbøll, J.; Bak, C.; Nielsen, A.; Jensen, A.; Hjerrild, J.; Sørensen, T.
How to Improve the Design of the Electrical System in Future Wind Power Plants. In
Proceedings of the Nordic Wind Power Conference, Bornholm, Denmark, 10–11 September 2009.
7. Falkingham, L.T. The Strengths and Weaknesses of Vacuum Circuit Breaker Technology. In
Proceedings of the 1st International Conference on Electric Power Equipment-Switching
Technology (ICEPE-ST), Xi’an, China, 23–27 October 2011; pp. 701–703.
Energies 2012, 5 2230
8. Barbieri, M.B.; Lastra, R.E.B.; Arnera, P.E.; Aguero, J.E. Transients Due to Multiple Prestrike
Phenomenon when Energizing Capacitor Banks with a Vacuum Circuit-Breaker. In Proceedings
of the IEEE/PES Transmission & Distribution Conference and Exposition: Latin America
(TDC ’06), Bogota, Colombia, 13–15 August 2008; pp. 1–6.
9. Helmer, J.; Lindmayer, M. Mathematical modeling of the high frequency behavior of vacuum
interrupters and comparison with measured transients in power systems. In Proceedings of the
XVIIth International Symposium on Discharges and Electrical Insulation in Vacuum, Berkeley,
CA, USA, 21–26 July 1996; Volume 1, pp. 323–331.
10. Rao, B.K.; Gajjar, G. Development and Application of Vacuum Circuit Breaker Model in
Electromagnetic Transient Simulation. In Proceedings of 2006 IEEE Power India Conference,
New Delhi, India, 10–12 April 2006.
11. Wong, S.; Snider, L.; Lo, E. Overvoltages and Reignition Behavior of Vacuum Circuit Breaker. In
Proceedings of the Sixth International Conference on Advances in Power System Control,
Operation and Management (ASDCOM 2003), Hong Kong, China, 11–14 November 2003;
pp. 653–658.
12. Wu, G.-B.; Ruan, J.-J.; Huang, D.-C.; Shu, S.-W. Voltage Distribution Characteristics of
Multiple-Break Vacuum Circuit Breakers. In Proceedings of the 24th International Symposium on
Discharges and Electrical Insulation in Vacuum (ISDEIV 2010), Braunschweig, Germany,
30 August–3 September 2010.
13. Popov, M.; van der Sluis, L. Comparison of two Vacuum Circuit Breaker arc Models for Small
Inductive Current Switching. In Proceedings of the XVIIIth International Symposium on
Discharges and Electrical Insulation in Vacuum (ISDEIV), Xi’an, China, 18–22 September 2000.
14. Gustavsen, B. Panel Session on Data for Modeling System Transients Insulated Cables.
In Proceedings of 2001 IEEE Power Engineering Society Winter Meeting, Columbus, OH, USA,
28 January–1 February 2011; Volume 2, pp. 718–723.
15. Gustavsen, B.; Martinez, J.; Durbak, D. Parameter determination for modeling system
transients—part ii: Insulated cables. IEEE Trans. Power Deliv. 2005, 20, 2045–2050.
16. Slade, P. The Vacuum Interrupter: Theory, Design, and Application; CRC Press: Boca Raton, FL,
USA, 2007.
17. Cornick, J.; Tleis, A. Computer simulation of three-phase prestriking transients in
cable-connected motor systems. IEE Proc. B Electr. Power Appl. 1991, 138, 105–114.
18. Greenwood, A. Electrical Transients in Power Systems, 2nd ed.; John Wiley & Sons Ltd.:
Hoboken, NJ, USA, 1991.
19. Silva, F.; Bak, C.; Hansen, M. Back-to-Back Energization of a 60 kV Cable Network—Inrush
Currents Phenomenon. In Proceedings of 2010 IEEE Power and Energy Society General Meeting,
Minneapolis, MN, USA, 25–29 July 2010.
20. Ryan, H.M. High Voltage Engineering and Testing; The Institution of Electrical Engineers:
London, UK, 2001.
21. Martinez, J.; Natarajan, R.; Camm, E. Comparison of Statistical Switching Results Using
Gaussian, Uniform and Systematic Switching Approaches. In Proceedings of 2000 IEEE Power
Engineering Society Summer Meeting, Seattle, WA, USA, 16–20 July 2000.

Energies 2012, 5 2231
22. IEEE PES Switching Transients Task Force. Task Force Report: Modeling Guidelines for
Switching Transients; IEEE Operation Center: Piscataway, NJ, USA, 1997.
© 2012 by the authors; licensee MDPI, Basel, Switzerland. This article is an open access article
distributed under the terms and conditions of the Creative Commons Attribution license
(http://creativecommons.org/licenses/by/3.0/).


![PSCAD/EMTDC CVCF Micro-grid · 2019-05-20 · 2018년한국산학기술학회추계학술발표논문집-179-[ 1]CVCF그림 인버터기반Micro-grid의보호협조개념도 3.PSCAD/EMTDC](https://img.pdfslide.us/doc/110x75/5e81a459466d0016fd48ee32/pscademtdc-cvcf-micro-2019-05-20-2018eoeeeoeeeoeoeee-179-.jpg)