Embed Size (px)
Citation preview

Transient Storage, Discharge, and Nutrient Uptake in Small Streams of the Kolyma
River Basin, Siberia
Travis W. Drake Senior Integrative Exercise
March 10th 2010
Submitted in partial fulfillment of the requirements for a
Bachelor of Arts degree from Carleton College, Northfield, Minnesota

Table of Contents
Abstract
1. Introduction…………………………………………………………………………....1
2. Study Site……………………………………………………………………………....6
3. Methods………………………………………………………………………………...8
3.1 Experimental Solute Injections 8
3.2 Solute Transport Modeling 10
3.3. Transient Storage Metrics 13
3.4 The Damkolher Index 15
3.5 Nutrient Spiraling 16
3.6 Nutrient Uptake Calculations 18
4. Results………………………………………………………………………………...18
4.1 Transient Storage Properties 18
4.2 Transient Storage Data Quality 21
4.3 Nutrient Uptake 23
4.4 Nutrient Uptake relative to Transient Storage 27
5. Discussion…………………………………………………………………………….27
5.1 Nutrient Uptake 27
5.2 Transient Storage and Discharge 29
5.3 Transient Storage Location 30
5.4 Transient Storage in Arctic and Temperate Streams 31
5.5 Transient Storage and Nutrient Uptake 31
5.6 Implications with Climate Change 34
6. Conclusions…………………………………………………………………………...34
7. Acknowledgements…………………………………………………………………..36
8. References……………………………………………………………………………37

Transient Storage, Discharge, and Nutrient Uptake in Small Streams of the Kolyma River Basin
Travis W. Drake Carleton College
Senior Integrative Exercise March 10th 2010
Advisors:
Clint Cowan, Carleton College Bereket Haileab, Carleton College
John Schade, St. Olaf College
ABSTRACT Discharge is increasing in arctic rivers and is predicted to continue to increase under future climate change scenarios. At the same time, permafrost thaw is predicted to increase with arctic warming, potentially increasing nutrient and organic matter inputs to headwater streams. Understanding how increased discharge will alter the ability of streams to process these material inputs is critical to assessing the potential impact of these changes on downstream ecosystems. Hydrologic factors, particularly transient storage of water as it moves downhill, are likely to change with discharge and to influence nutrient exports to larger streams. NH4 and PO4 enrichment experiments and conservative tracer additions were used to simultaneously assess nutrient uptake and the size of the transient storage zone in several small streams in the Kolyma River basin in Eastern Siberia. Results indicate a clear negative relationship between transient storage and discharge. Moreover, phosphorus uptake was negatively related to transient storage, while nitrogen uptake showed no relationship with transient storage. Results suggest the transient storage zone is relatively inactive in terms of nutrient uptake. Implications of this result are an increase in P uptake and a decrease in the N:P of uptake as discharge increases. Given the possibility that both discharge and nutrient inputs will increase as permafrost thaws, longer-term nutrient enrichment experiments are needed to develop predictions of change in these ecosystems with changes in climate. Keywords: Transient storage, nutrient spiraling, arctic streams, discharge, nutrient uptake, active processing, Kolyma River

1. INTRODUCTION
In the coming century, warming is likely to be greater in arctic ecosystems than
any other ecosystems on Earth (ACIA, 2005). One consequence of Arctic warming is the
thawing of permafrost soils that underlay many Arctic ecosystems (Prowse et al., 2006).
In Northeastern Siberia, permafrost is comprised of frozen organic-rich loess deposits,
which represent important reservoirs of carbon (C) and other nutrients (Dutta et al.,
2006). Permafrost thaw releases these reservoirs of organic matter (OM) and nutrients
into the surrounding ecosystems. Thus, thawing presents a significant source of carbon,
nutrients, and energy for organisms living in recipient ecosystems (Frey and Smith,
2005). To date, most studies have been concerned with processing of these materials in
terrestrial soils, since elevated temperatures are likely to speed up bacterial
decomposition and thus increase the rate of CO2 respired to the atmosphere (Dutta et al.,
2006). But in addition to being decomposed on land, liberated OM and nutrients can also
leach into aquatic ecosystems as water moves through soils and into stream networks.
Much of this material originally enters surface water in small headwater stream
channels, which occupy a key position in the Arctic landscape. Because these streams
link terrestrial uplands to larger rivers and coastal oceans, they have the potential to
regulate the export of dissolved organic carbon (DOC) and other nutrients (i.e. DON,
DOP) to downstream ecosystems. In spite of the extensive area they occupy and the key
position they hold in the cycle of nutrients, arctic headwater streams have received very
little attention. The overarching goal of this study is to examine the role of these streams
in the processing of organic matter and nutrient inputs from thawing permafrost, and how
this impact may change as the Arctic warms.
1

Over the past three decades, following the publication of the “river continuum
concept” (Vannote et al., 1980), there has been much research on the delivery and
processing of terrestrial-derived organic matter in stream ecosystems. Terrestrial sources
of organic matter generally dominate energy flow or organic matter flux through stream,
riverine, and estuarine ecosystems (Mulholland et al., 1997; Frey and Smith, 2005;
Holmes et al., 2008), but the fate of this material remains poorly understood (Webster
and Meyer, 1997; Raymond and Bauer, 2000; Wetzel, 2001; Sobczak et al., 2005).
Biological processes within streams alter the transport of organic matter to downstream
ecosystems (Webster and Meyer, 1997), but the impact of these processes on carbon or
nutrient cycling at larger scales is less clear. Cole et al. (2007) argue forcefully for the
significance of inland aquatic ecosystems for global carbon cycling, suggesting that a
large proportion of terrestrial-derived organic carbon is processed during hydrologic
transport from terrestrial to marine ecosystems. They also point out the lack of
quantitative information on the role of small streams, which they suggest could be
substantial at the landscape scale and may further increase estimates of the impact of
freshwater ecosystems. To help clarify the factors influencing the role of lotic
ecosystems, they developed a conceptual model in which streams are classified as either
‘active processors’ or ‘passive transporters’ of carbon as a way to think about the impact
of streams and rivers on biogeochemical cycling. This conceptual model can be expanded
to include N and P cycles, and is the basic framework for this study (Fig. 1).
Interestingly, a single stream can be classified as ‘passive transporter’ for some elements
(i.e. conservative elements or elements that are not limiting to biological processes) and
‘active processor’ for others, depending on physical features and relative availability of
2

Spring Floods
Passive Transporter
Late Summ
er and Fall
Passive Transporter
OR
Active Processor
High N
, P, & C
High Bioavailable N
, P, & C
Low N
, P, & C
Low Bioavailable N
, P, & C
Low N
, P, & C
Low Bioavailable N
, P, & C
High N
, P, & C
High Bioavailable N
, P, & C
Low N
, P, & C
Low Bioavailable N
, P, & C
Headw
atersM
outh
AB
High N
, P, & C
High Bioavailable N
, P, & C
Figure 1. Conceptual m
odel representing hypotheses about temporal variation in am
ount and bioavailability of Nitrogen (N
), Phosphorus (P), and C
arbon (C) and the role of headw
ater streams in processing each. D
uring the spring floods, headwater
streams are likely to be passive transporters. In late sum
mer and fall, low
concentration and bioavailability at the mouth
suggests either A) universal low
input to streams or B
) or processing of bioavailable inputs from thaw
ing permafrost in head-
water stream
s. (Inspired by Cole et al. 2007)
3

elements. Furthermore, the classification of a particular stream may change over time as
physical conditions change, for instance in the spring when discharge is high and/or
biological activity is low, streams are more likely to be passive transporters (Holmes et
al., 2008).
The main objectives of this study are to assess whether small arctic headwater
streams are active processors or passive transporters of carbon or nutrients and whether
hydrologic properties affect the rate of processing. I hypothesized that the small arctic
streams of the Kolyma River basin are active processors. Previous work provides good
evidence to suggest that small headwater streams play a disproportionate role in the
uptake (removal from the water column) of carbon and nutrients. Alexander et al. (2000)
found that nitrogen-loss rates declined rapidly with increasing channel size throughout
the Mississippi watershed. Small streams have greater potential to develop into active
processors than larger rivers because there is more contact between water and the
streambed where microbes will decompose organic forms of nutrients (Sobczak and
Findlay, 2002) and take up inorganic forms of nutrients (Alexander et al., 2000).
Furthermore, carbon concentration and bioavailability within the Kolyma River basin
showed significant declines with increasing channel size (Bill Sobczak, College of the
Holy Cross, Personal Communication; Fig. 2).
Missing from Cole et al. (2007) is discussion of how in-stream hydrologic
properties can dramatically affect the processing of water-borne carbon or nutrients.
These hydrologic properties include discharge, morphology, and transient storage.
Transient storage refers to the temporary detainment of water-borne solutes by stream
features in “storage zones” such as eddies or porous sediments (Runkel, 1998). Carbon or
4

45
8
6
4
2
0
DO
C (m
g L-1
)
DOC concentrationA
3.0
2.5
2.0
1.5
1.0
0.5
0.0
mg
C co
nsum
ed L
-1
DOC Bioavailability
Alas Stream River Kolyma
B
Figure 2. Measured dissolved organic carbon (DOC) concentrations (A) and bioavailability (B) in different sized waterbodies in the Kolyma River Basin during July, 2009.
5

nutrients can be retained in these storage zones and experience different rates of
processing. I hypothesized that transient storage would be correlated to nutrient
processing, although I could not predict whether transient storage would facilitate active
or passive transport. Some studies relating transient storage and nutrient processing have
found positive correlations, suggesting that biological activity or physical sorption can be
facilitated by the detainment of solutes in storage zones (Hall et al., 2002). Other studies
have found a negative relationship between transient storage and nutrient processing,
which suggests that some transient storage zones may be biologically less active (Marti et
al., 1997; Valett et al., 2002).
This study has two main objectives: to examine whether small arctic streams
within the Kolyma Basin are active processors of N and P and to explore the affect of
hydrologic properties on processing rates. Nutrient limitation likely plays a vital role in
carbon processing, and thus an initial focus on N and P processing provides an important
first look at the potential for active processing of carbon in small headwater streams.
2. STUDY SITE
The study area was located in the Kolyma River Basin, near the town of Cherskiy
in Northeastern Siberia (Fig. 3). The Kolyma River Basin is unique in that it is the only
watershed in the world underlain by continuous permafrost (Walter et al., 2006). This
study focused on 5 streams, selected based on proximity to and accessibility from the
Northeast Science Station. Two streams were located in the low-lying floodplain and
three were located in the topographically higher Yedoma soils. Floodplain soils are
primarily comprised of Holocene sediments whereas the Yedoma complex is a largely
6

Figure 3. Location of study site within the K
olyma R
iver Basin. Stream
locations were all
within 5km
of Cherskiy, R
ussia.
7

frozen and distinct deposit of Pleistocene loess-sediments that extends over much of
Northeastern Siberia (Walter et al., 2007).
The surrounding Boreal Forest ecosystem is a densely vegetated and peat
dominated landscape. All study streams tended to be small (discharge of .5-3 L/s) and
beaded, with heavily vegetated banks and silty substrates. The floodplain stream channels
were more silty, wide, and tortuous than those in the Yedoma soils.
3. METHODS
3.1 Experimental Solute Injections
Simultaneous injections of a conservative tracer (non-biologically active solute,
i.e. Cl) and two biologically active solutes (PO4 and NH4) were conducted in 5 arctic
streams during summer base flow in July, 2009. Of the 5 streams, 3 were located in
Yedoma deposits and 2 were located in the topographically lower flood plain.
The solutes were added to 30 liters of stream water and dissolved in a separate
reservoir. Solute concentrations varied based on the specific discharge of each stream.
Streams with higher estimated discharge were injected with more a concentrated mixture.
The concentrated mixture was added at a constant rate to the top of each reach (T1, Fig.
4) using a metering pump (Fluid Metering Inc.). Pump sites were chosen based on their
degree of constriction and mixing potential. Constricted sites that were followed
immediately by a riffle provided thorough mixing thereby ensuring an equal distribution
of solutes downstream. Reach lengths varied from 40 to 60 meters and were divided into
5 equally spaced transects. Background water samples were taken at every transect prior
to the injection.
8

Figure 4. Example setup for solute addition experim
ent. T1 - T5 represent the different transects for nutrient sampling. The tw
o plots illustrate times
series of conductivity at T1 (red) and T5 (green).
Reservoir
Pump
Injection SiteStream
FLOW
Upstream
YSI
Dow
nstream YSI
Ri�e (M
ixing)
T1
T2
T3T4
T5
Time
Cond.Tim
e
Cond.
9

Two YSI 560 multiprobe meters were used to monitor conductivity (a proxy for
Cl concentration), temperature, dissolved oxygen, and pH. One YSI was placed just
below the pump and mixing zone at the top of the reach while the second was placed at
the last transect downstream (T5, Fig. 4). After the pumping commenced, the
downstream YSI was monitored until it reached plateau. At this point, the entire stream
was saturated with the mixture, and water samples were taken at each transect.
Experimental setup is summarized in Figure 4.
3.2 Solute Transport Modeling
One-dimensional modeling of transport with transient storage was used to
characterize some of the hydrologic properties of the sample streams. The model, One-
Dimensional Transport with Inflow and Storage (OTIS), was developed by the USGS to
characterize the fate of solutes in rivers and streams (Runkel, 1998), and has been used in
many studies since (Edwardson et al., 2003; Salehin et al., 2003; Ensign and Doyle,
2005; Zarnetske et al., 2007). The OTIS model is an extension of the advection-
dispersion equation, which accurately describes the movement of solutes in the main
channel of a river or stream. The OTIS model is comprised of a set of mass balance
equations for two conceptual parts of the stream 1) the main channel in which solute
transport is governed by the advection-dispersion equation and 2) the storage zone, where
advection and dispersion are disregarded because downstream transport from these zones
is negligible (Runkel, 1998). Transient storage refers to the temporary retention of solutes
in the storage zone, which may exist as small eddies, stagnant pools, or within the porous
banks outside the main channel (Fig. 5). Because the fate of solutes, including organic
10

AB
Figure 5. Schematic m
echanisms of transient storage. Transient storage occurs w
hen A) solutes enter a side pool or eddy and B
) when
solutes enter the porous sediments that com
prise the bed and banks of the channel. Arrow
s indicate solute movem
ent between the m
ain channel and the storage zone. (A
dapted from R
unkel 1995)
11

matter and nutrients, can depend on the residence time and biological activity of different
stream zones, it is important to experimentally model the physical size and exchange
between the main channel and the transient storage zone.
The primary assumption of the model is that solute concentrations vary only
longitudinally (hence the ‘one-dimensional’ model). In other words, it is assumed that
solute concentrations do not vary with width or depth (Runkel, 2000). Lateral inflow and
outflow, or the volume of water moving in and out of the stream for a given reach, were
deemed to be a negligible component of channel flow due to the small reach lengths
(max. 60 m). Over this short distance, the potential for lateral inflow or outflow to affect
solute addition experiments is minimal (Ensign and Doyle, 2005). For this reason, OTIS
was run assuming no lateral inflow or outflow. The mass balance equations used by the
OTIS model to couple the concentration of solutes in (1) the main channel and (2) the
storage zone are:
(1)
(2)
where A is the main channel cross-sectional area (m2), AS is the storage zone cross-
sectional area (m2), C is the main channel solute concentration (spc m-3), CS is the storage
zone solute concentration (spc m-3), D is the dispersion coefficient (m2 s-1), Q is the
volumetric flow rate or discharge (m3 s-1), t is time (s), x is distance (m), and α is the
storage zone exchange coefficient (s-1) (Modified from Runkel, 1998 to exclude lateral
inflow/outflow).
12
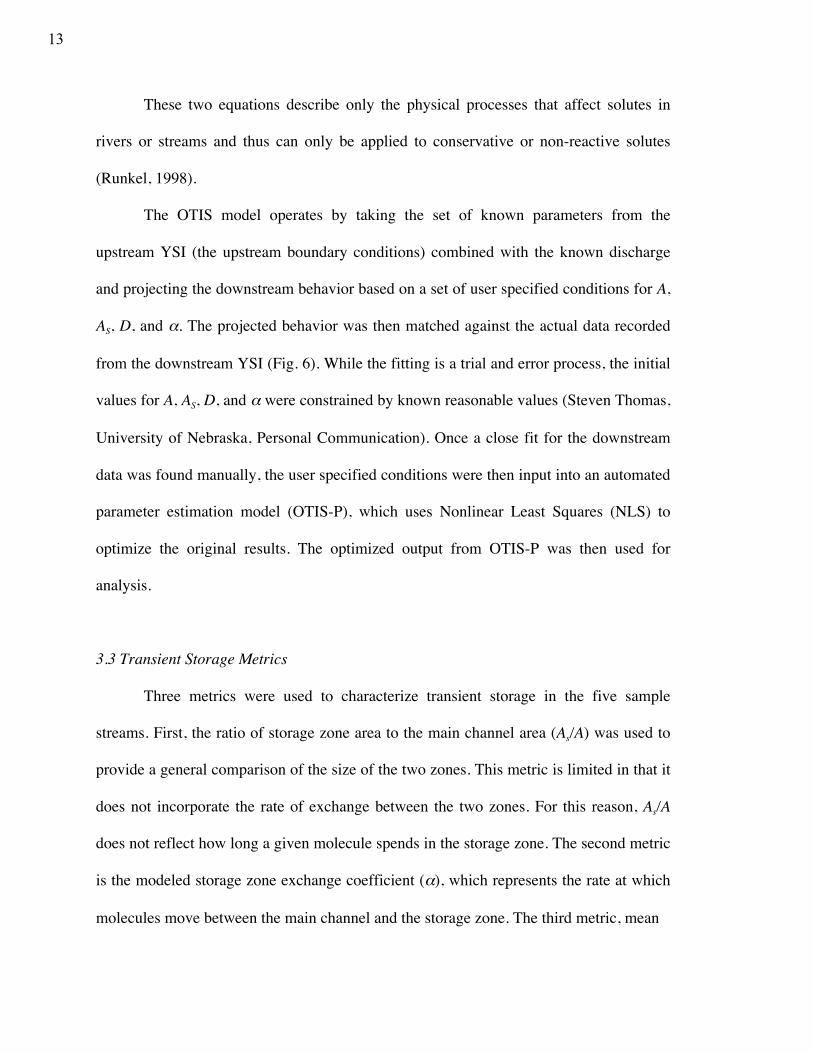
These two equations describe only the physical processes that affect solutes in
rivers or streams and thus can only be applied to conservative or non-reactive solutes
(Runkel, 1998).
The OTIS model operates by taking the set of known parameters from the
upstream YSI (the upstream boundary conditions) combined with the known discharge
and projecting the downstream behavior based on a set of user specified conditions for A,
AS, D, and α. The projected behavior was then matched against the actual data recorded
from the downstream YSI (Fig. 6). While the fitting is a trial and error process, the initial
values for A, AS, D, and α were constrained by known reasonable values (Steven Thomas,
University of Nebraska, Personal Communication). Once a close fit for the downstream
data was found manually, the user specified conditions were then input into an automated
parameter estimation model (OTIS-P), which uses Nonlinear Least Squares (NLS) to
optimize the original results. The optimized output from OTIS-P was then used for
analysis.
3.3 Transient Storage Metrics
Three metrics were used to characterize transient storage in the five sample
streams. First, the ratio of storage zone area to the main channel area (As/A) was used to
provide a general comparison of the size of the two zones. This metric is limited in that it
does not incorporate the rate of exchange between the two zones. For this reason, As/A
does not reflect how long a given molecule spends in the storage zone. The second metric
is the modeled storage zone exchange coefficient (α), which represents the rate at which
molecules move between the main channel and the storage zone. The third metric, mean
13

35
45
55
65
75
85
95
105 0.
00
0.20
0.
40
0.60
0.
80
1.00
1.
20
1.40
1.
60
1.80
2.
00
Dow
nstr
eam
YSI
for F
PL1
OTI
S-P
Mod
eled
Fit
Figu
re 6
. Spe
cific
con
duct
ivity
mea
sure
d in
the
chan
nel (
sym
bols
) in
FPL1
at 5
0 m
eter
s dow
nstre
am o
f so
lute
add
ition
poi
nt. S
olid
line
repr
esen
ts d
owns
tream
pat
tern
pre
dict
ed b
y O
TIS
mod
el.
Speci�c Conductivity (Spc)
Tim
e (h
rs)
14

storage residence time (tstor), which represents the average time that a water particle
spends in storage, is calculated as:
€
tstor =1α⋅AS
A(3)
where As/A is the ratio of the storage zone area to the main channel area and α is the
storage zone exchange coefficient. Thus, tstor is the most useful metric because it
incorporates both the spatial ratio of the storage zone to the main channel and the
exchange rate between the two zones.
3.4 The Damkolher Index
The Damkohler Index number (DaI) was calculated to evaluate the reliability of
OTIS-P parameter estimations for each reach (Edwardson et al., 2003). Wagner and
Harvey (1997) explain that the uncertainties in OTIS-P estimation of exchange rates and
storage-zone size are strongly dependent on the experimental Damkohler number. The
DaI is a dimensionless combination of the rates of exchange between the main channel
and storage zones, the velocity, and reach length of the experimental stream. DaI is
calculated as:
€
DaI =α(1+ A /AS )L
v(4)
where α is the storage zone exchange coefficient, A is the main channel cross-sectional
area, AS is the storage zone cross-sectional area, L is the experimental reach length, and v
is the stream velocity.
15
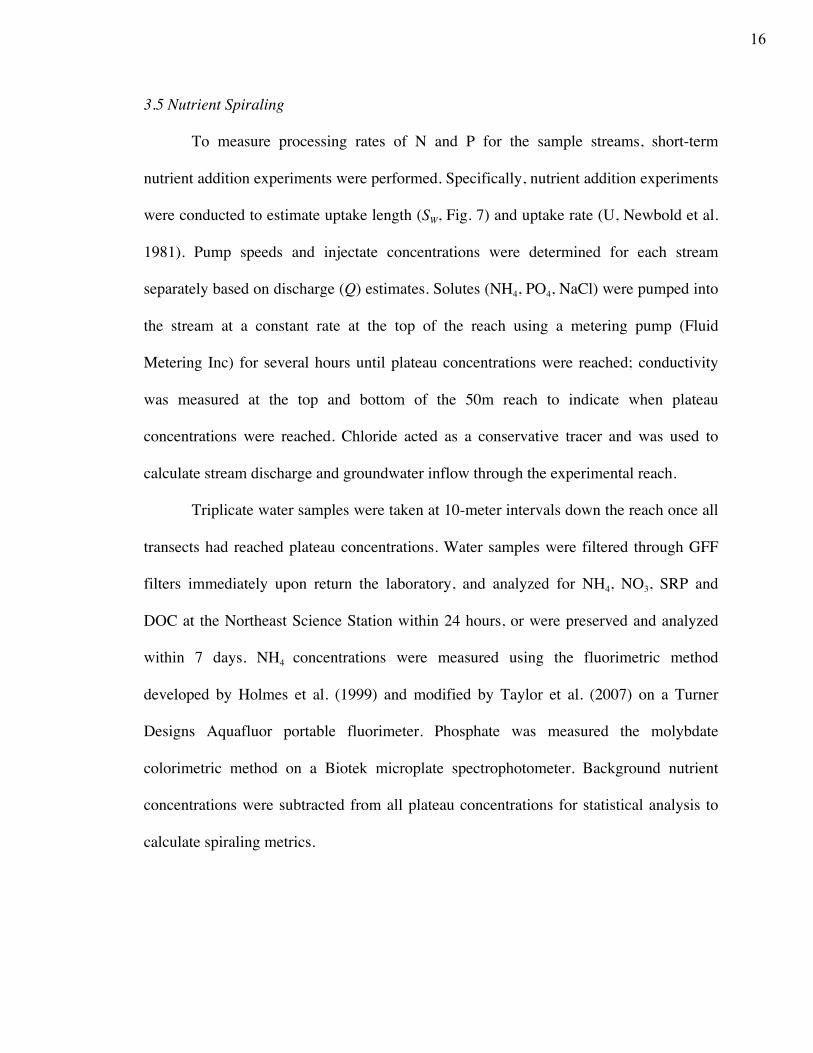
3.5 Nutrient Spiraling
To measure processing rates of N and P for the sample streams, short-term
nutrient addition experiments were performed. Specifically, nutrient addition experiments
were conducted to estimate uptake length (SW, Fig. 7) and uptake rate (U, Newbold et al.
1981). Pump speeds and injectate concentrations were determined for each stream
separately based on discharge (Q) estimates. Solutes (NH4, PO4, NaCl) were pumped into
the stream at a constant rate at the top of the reach using a metering pump (Fluid
Metering Inc) for several hours until plateau concentrations were reached; conductivity
was measured at the top and bottom of the 50m reach to indicate when plateau
concentrations were reached. Chloride acted as a conservative tracer and was used to
calculate stream discharge and groundwater inflow through the experimental reach.
Triplicate water samples were taken at 10-meter intervals down the reach once all
transects had reached plateau concentrations. Water samples were filtered through GFF
filters immediately upon return the laboratory, and analyzed for NH4, NO3, SRP and
DOC at the Northeast Science Station within 24 hours, or were preserved and analyzed
within 7 days. NH4 concentrations were measured using the fluorimetric method
developed by Holmes et al. (1999) and modified by Taylor et al. (2007) on a Turner
Designs Aquafluor portable fluorimeter. Phosphate was measured the molybdate
colorimetric method on a Biotek microplate spectrophotometer. Background nutrient
concentrations were subtracted from all plateau concentrations for statistical analysis to
calculate spiraling metrics.
16

Add NH
4 and PO4 nutrients
Figure 7. Diagram
of nutrient uptake length (SW ) in a stream
. Uptake Length is the distance a nutrient atom
travels before it is taken up from
the water colum
n and converted to organic form.
organic
inorganic nutrient path
organic nutrient-hungry bio�lm
Uptake Length (S
W )Stream
bed
Water Colum
n
17

3.6 Nutrient Uptake Calculations
Uptake lengths were estimated by regressing log-transformed, background-
corrected nutrient concentrations at each plateau against distance downstream. The
inverse of the regression slope is equivalent to the uptake length (SW; Newbold et al.,
1981) under specific enrichment conditions. Areal nutrient uptake rates were calculated
as:
€
U =QCw⋅ SW
(5)
where U is the areal uptake rate (µg m-2 s-1), Q is the discharge (L s-1), C is the nutrient
concentration (µg L-1), and SW is the uptake length (m).
4. RESULTS
4.1 Transient Storage Properties
The ratio of storage zone area to main channel area (As/A) displayed a strong
inverse relationship with increasing discharge (Q) for four streams (R2 = .95; Fig. 8A). It
should be noted that AS could not be accurately modeled for stream FPS2 due to
incomplete upstream boundary conditions. For all streams, mean storage residence time
(tstor) decreased exponentially with increasing discharge, with a strong correlation (R2 =
.97; Fig. 8B). The relationships between discharge and AS/A and tstor are consistent, and
they show a well-defined link between increasing discharge and decreasing transient
storage in the sample streams.
The modeled storage zone exchange coefficient (α), which describes the rate of
exchange between the main channel and storage zone, displayed a strong positive
correlation with discharge among four streams (R2 = .88, Fig. 9). As with AS, α could not
18

Figure 8. The relationship between discharge and (A) tstor and (B) As/A for ourstudy reaches. Note: As /A could not be accurately modeled for stream FPS2.
Q (m3 s-1)
R2 = .9669
1.0 1.5 2.0 2.5 3.0 3.5 4.0
0
20
40
60
80
t stor
(min
)
0.15
0.20
0.25
0.30
0.35
0.40
As / A
R2 = .9501
A
B
19

1.0
1.5
2.0
2.5
3.0
3.5
4.0
0.00
010
0.00
015
0.00
020
0.00
025
0.00
030
α (s-1)
Q (m
3 s-1
)
Figu
re 9
. The
rela
tions
hip
betw
een
stor
age
zone
exc
hang
e co
effic
ient
(α )
and
disc
harg
e (Q
). N
ote:
α co
uld
not b
eac
cura
tely
mod
eled
for s
tream
FPS
2.
R2 = .8
802
20

be modeled for FPS2. The relationship between Q and α is also consistent with the above
transient storage metrics; it shows how the storage zones become assimilated with the
main channel as discharge increases, thereby reducing mean storage residence time and
size of the storage zone. Transient storage stream metrics for all streams are summarized
in Table 1.
4.2 Transient Storage Data Quality
Wagner and Harvey (1997) explain that parameter estimation uncertainties are
lowest at DaI values on the order of 1.0. For DaI values much less than 1.0, parameter
uncertainties are high due to high velocity, long exchange timescale, and/or short reach
lengths. For DaI much greater than 1.0, solute exchange rates are fast relative to the
stream velocity and thus all of the solute is exchanged with the storage zone. Wagner and
Harvey (1997) experimentally manipulated the reach length to find the effect of the DaI
on the coefficient of variation and found that the coefficient of variation for AS and α
estimates remains below ~0.5 from DaI values of 0.2-15. For this study, the DaI values
for all streams ranged from good (~1) to acceptable (~5) (Edwardson et al., 2003).
Interestingly, while all sample stream DaI values were in the acceptable range, they all
exhibited values greater than 1.0. According to Wagner and Harvey (1997), the
uncertainty of these slightly elevated DaI values tends to blend the effects of dispersion
and storage zone exchange. This uncertainty is expected in streams where flow is
extremely low and dispersion is high. DaI numbers for all streams are summarized in
Table 1.
21

Tabl
e 1.
Dis
char
ge c
ondi
tions
, Opt
imiz
ed O
TIS-
P So
lute
Tra
nspo
rt M
odel
Par
amet
ers,
and
Tran
sien
t Sto
rage
Met
rics f
or a
ll st
ream
s.
Stre
am
TDO
DVY
Y4_7
FPS1
FPS2
Q (m
3 s-1
)
1.82
03.
534
0.99
73.
580
2.47
7
Type
Yedi
ma
Yedi
ma
Yedi
ma
Floo
d Pl
ain
Floo
d Pl
ain
u (m
/s)
7.37
E-03
1.83
E-02
1.04
E-02
1.66
E-02
8.05
E-03
A S /A
0.36
70.
170
0.38
00.
183
0.07
7
t stor
(min
)
31.7 9.4
78.1
12.3
23.5
α (s -1
)
1.93
E-04
2.99
E-04
8.03
E-05
2.48
E-04
5.47
E-05
Dat
e
7/14
/09
7/17
/09
7/20
/09
7/20
/09
7/23
/09
4.88
5.68
1.41
4.84
4.74
DiA
22

4.3 Nutrient Uptake
Mean uptake lengths of N (SWN) were much longer in Floodplain streams than
Yedoma streams (455 and 81 respectively; p = 0.006; Fig. 10A), while uptake lengths of
P were similar (31 and 52 respectively; p = 0.43; Fig. 10A). As a result, SWN:SWP were
much higher in Floodplain than Yedoma streams (15 and 1.6 respectively, p = .005; Fig.
10B). UN and UP showed a similar pattern to uptake lengths, although the differences
were not statistically significant (Fig. 11A). The ratio of UN:UP was higher in Yedoma
streams than Floodplain streams, although this difference was only marginally significant
(p = .056; Fig. 11B).
Within Yedoma streams, SWN and SWP uptake lengths were not significantly
different (~55-65m, p = .53), suggesting that these streams are co-limited by P and N
(Fig. 10A). In the Floodplain streams however, P uptake lengths were significantly lower
than N uptake lengths (~30 and ~450 respectively; p = .003; Fig. 10A), suggesting the
possibility that the streams are P limited.
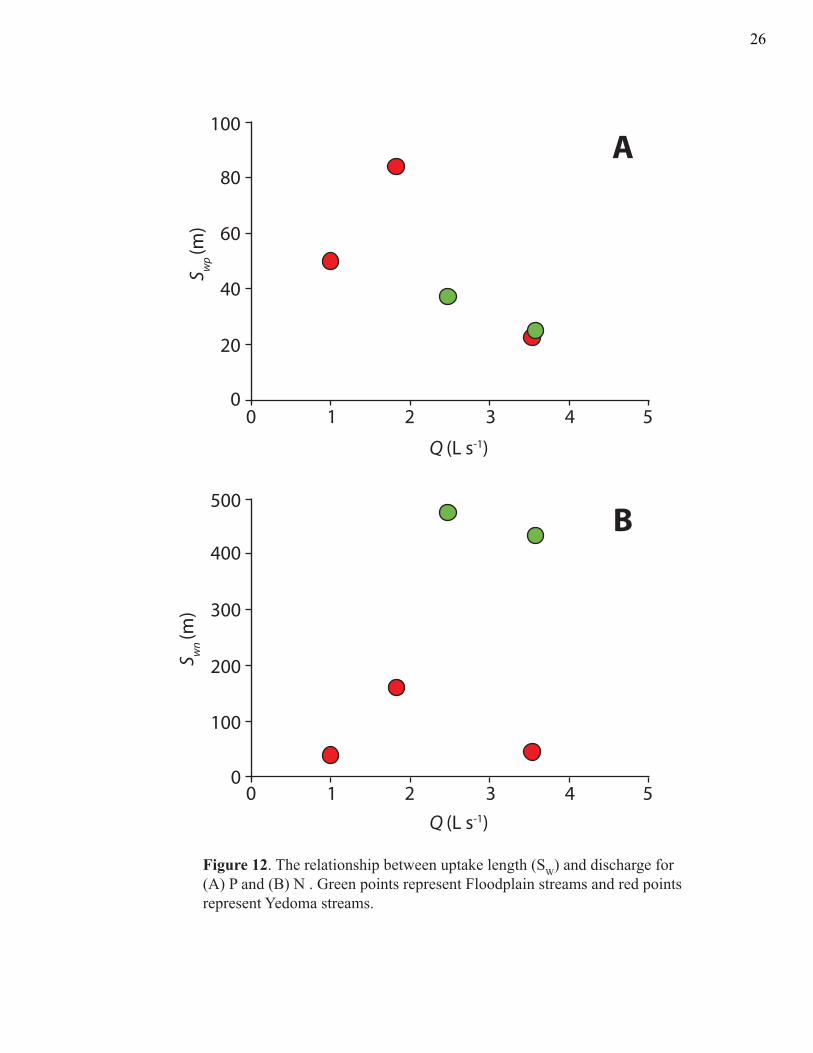
Uptake length for N and P also varied differently with discharge. In all streams,
uptake length of P generally decreased with increasing discharge (Fig. 12A). Uptake
lengths of N displayed a weak positive relationship with discharge and a clear difference
between Yedoma and Floodplain streams (Fig. 12B). Floodplain streams exhibited much
higher uptake lengths of N relative to the Yedoma streams, despite their similar discharge
(Fig. 12B).
23

20
15
10
5
0Yedoma Floodplain
S wn
: Sw
p
450
120
90
60
30
0Yedoma Floodplain
Swn
Swp
S w (m
)
A
B
Figure 10. (A) Uptake lengths for N and P and (B) ratio of uptake lengths for Yedoma and Floodplain streams. Error bars indicate standard error.
24

U (μ
g m
-2 s
-1)
3
2
1
0
Un
Up
Yedoma Floodplain
1.0
0.8
0.6
0.4
0.2
0.0
Un
: Up
Yedoma Floodplain
A
B
Figure 11. A) Uptake rates of N and P and (B) Ratio of uptake rates for Yedoma and Floodplain streams. Error bars indicate standard errror.
25
100
80
60
40
20
00 1 2 4 5
S wp
(m)
Q (L s-1)
3
0 1 2 4 53Q (L s-1)
S wn
(m)
500
400
300
200
100
0
Figure 12. The relationship between uptake length (SW) and discharge for (A) P and (B) N . Green points represent Floodplain streams and red points represent Yedoma streams.
A
B
26

4.4 Nutrient Uptake Relative to Transient Storage
For all streams, UP decreased with transient storage (tstor) (R2 = ~.53; Fig. 13),
while UN showed no relationship with tstor. Nutrient uptake length for P (Swp) increased
with transient storage, but this relationship was weaker (R2 = ~.30). Again, N uptake
length showed no relationship with transient storage.
5. DISCUSSION 5.1 Nutrient Uptake
Nutrient spiraling results indicate that Yedoma streams are active processors of N
and P, while Floodplain streams are active processors of P and passive transporters of N.
In Yedoma streams, both uptake lengths and rates were similar for N and P, which
indicate an equal demand for both nutrients. In Floodplain streams, however, uptake
lengths for P were significantly shorter than N. Correspondingly, uptake rates of P were
more than 5 times those of N. Bacteria living in the stream require specific amounts of N
and P to carry out their metabolic functions (Sterner and Elser 2002). Assuming that
uptake is biological, this disproportionate demand for P in Floodplain streams may
indicate a scarcity of P relative to N. Thus, P can be considered limiting in Floodplain
streams, whereas both N and P are co-limiting in Yedoma streams.
The difference in nutrient demand between Yedoma and Floodplain may be
biological or physical (Hall and Tank, 2003). In other words, the bacterial community
living in Floodplain stream channels may be in metabolic need of P, which would
increase the uptake rate. Alternatively, the elevated uptake rates of Phosphorus may be
due to physical sorption, a process by which P is taken out of the water column through
27

020
4060
80
1.0
1.5
2.0
2.5
3.0
UP (µg m-2
s-1
)
t stor
(min
)
Figu
re 1
3. R
elat
ions
hip
betw
een
UP a
nd tr
ansi
ent s
troag
e (t st
or ).
The
rela
tions
hip
can
be in
terp
rete
d tw
o w
ays:
(A) t
he g
ener
al d
ecre
ase
in U
P with
incr
easi
ng t st
or re
pres
ente
d by
the
solid
line
or (
B) a
s a t
stor
th
resh
old
for u
ptak
e of
P re
pres
ente
d by
the
dash
ed li
ne.
R2 =
.529
9
A
BU
P = 0
.184
e-0.0
26(t
stor
)
28

its chemical attraction to certain sediments (Lottig and Stanley, 2007). Thus, the P
limitation in Floodplain streams could reflect a biologic demand or a physical condition
unique from Yedoma streams.
Regardless of how P is taken up, nutrient uptake patterns indicate a difference in
biogeochemical cycling between Yedoma and Floodplain streams, which may reflect
differences in the surrounding soil. Yedoma soils are comprised of Pleistocene loess
sediments and are rich in nutrients and carbon (Zimov et al., 2006). If both N and P are in
abundance in Yedoma soils, this pattern may explain apparent co-limitation uptake
processes by N and P in Yedoma streams. Floodplain streams, on the other hand, are
surrounded by more recent Holocene sediments, which are relatively depleted in nutrients
(Zimov et al., 2006). Thus, it is likely that the surrounding soils and their relative nutrient
content are impacting the availability of nutrients to the sample streams. Indeed, the
relationship between soil nutrients and their stream availability has been well
documented in ecosystems around the world (Dillon et al., 1975; Mulholland, 1992;
Sebestyen et al., 2008).
5.2 Transient Storage and Discharge
The results of this study are in agreement with previous studies that found an
inverse relationship between transient storage (tstor, As/A) and discharge (Q) (Zarnetske et
al., 2007; Edwardson et al., 2003; D’Angelo et al., 1993). Transient storage seems to be
driven by discharge, as evidenced by the strong correlations (>.95) between tstor or As/A
and Q.
29

The pattern of increasing exchange rate (α) with increasing discharge is consistent
with hydrodynamic theory and the direct relationship between velocity and hyporheic
exchange (Packman and Salehin, 2003). In essence, as discharge increases, the rate of
exchange between storage zones and the main channel increases. Effectively, this greater
exchange rate assimilates the storage zones and the main channel. Thus, the clear
relationship between α and discharge provides insight into the mechanism by which
discharge influences transient storage.
Zarnetske et al. (2007) found similarly strong correlations between discharge and
transient storage in small arctic tundra streams. They suggested that the dominance of
discharge might be due to the fact that their study streams were underlain by permafrost.
Insofar as this permafrost was a barrier to deeper hyporheic exchange with groundwater
aquifers and sediments, greater discharge may have resulted in increased advection and
turbulent flow rates within the storage zones. Thus, the permafrost boundary in the
sample streams may have increased the amount of ‘flushing’ in the storage zones, thereby
amplifying the effect of discharge on the exchange rate (α).
5.3 Transient Storage Location
One of the limitations of the OTIS model is that it cannot differentiate between
possible storage locations. Thus, the results of this study give no indication as to whether
transient storage occurred in the hyporheic zone or in surficial pockets such as eddies. In
their study of small arctic streams, Zarnetske (2007) did not find a significant relationship
between transient storage and the depth of the thaw bulb underneath the stream. If storage
were hyporheic, increasing the thaw bulb would presumably increase the size of the
30

transient storage zone, since the space between the sediments left from thawed ice could
be filled by stream water. This suggests that the transient storage in their study streams
may have been primarily due to surface features. In-channel storage is commonly
produced by eddies, side pools, and slowed sections due to debris or vegetation (Runkel,
1998). This study’s streams are characterized by dense stream vegetation and debris,
suggesting the possibility that transient storage is caused by in-channel features.
Furthermore, the stream banks of all 5 of the sample streams were comprised of silt to
mud sized sediments, which likely reduced the porosity of the hyporheic zone and
thereby lowered the potential for stream water to enter the hyporheic zone.
5.4 Transient Storage in Arctic and Temperate Streams
The results from this study indicate that the transient storage dynamics of arctic
study streams are comparable to those in temperate ecosystems. The average AS/A for the
5 study streams was ~.24 which is similar to the range of mean values of .2-.6 for
temperate streams (Harvey et al., 2003; D’Angelo et al., 1993). Furthermore, the mean
for this study is notably similar to the values reported by Zarnetske (2007) and
Edwardson et al. (2003) who reported .31 and .32, respectively, for comparably small
arctic streams.
5.5 Transient Storage and Nutrient Uptake
Results from this study also indicate that hydrologic properties, particularly
transient storage, are likely affecting N and P processing rates. The results can be
interpreted two ways. The first interpretation considers only the general decrease in UP
31

with increasing tstor. This inverse relationship is consistent with previous studies that
found the transient storage zone to be less biologically active relative to the main channel
(Marti et al., 1997; Valett, 2002). If uptake is biological, the location of transient storage
can greatly affect whether nutrient uptake is positively or negatively correlated with size
of the transient storage zone. When transient storage is primarily hyporheic, water
flowing through sediments is more likely to reach biofilms, the site of most biological
uptake (Mulholland et al., 1997; Harvey and Wagner, 2000; Hall et al., 2002). In this
situation, higher transient storage reflects longer hyporheic residence times, which
correspond to higher rates of biogeochemical processing, and a positive relationship
between uptake and transient storage (Findlay, 1995). Alternatively, the storage zones
may be located in in-channel features, such as side pools or eddies, which are less
biologically active than the hyporheic zone. In these zones, the interaction between the
water column and the sediments is lower, reducing the opportunity for microbes to take
up nutrients (Hall et al., 2002). Thus, the negative relationship between transient storage
and nutrient uptake found in this study would suggest that the storage zones modeled in
the study streams were primarily surface zones. The qualitative observations of dense
vegetation both in-stream and along the stream bank, the abundance of side pools, and the
fine sediment size within the channel, also indicate surficial storage.
The second interpretation considers the dramatic drop in UP above about 20
minutes of storage (tstor) seen in Figure 13. While the sample size in this study is too small
to say anything definitive, this sudden drop may indicate a transient storage threshold for
P uptake, which would present an alternative relationship to the general inverse
relationship discussed above. This would suggest that when the mean storage residence
32

time (tstor) is above ~20 minutes, water spends disproportionately more time in the
biological inactive storage zones and thereby reduces the rates of biogeochemical
processing. Because tstor is so closely related to discharge, this trend can also be seen in
Figure 12A, where increasing discharge corresponds with an increase in UP. In other
words, for active processing of P, discharge must be high enough to overcome the
residence times in biologically inactive storage zones. It has been widely acknowledged
that nutrient uptake varies with discharge (Ensign and Doyle, 2006). All else being equal,
nutrient uptake lengths are expected to increase with discharge. Thus, most studies report
an upper threshold at which high discharges flush nutrients through the stream too
quickly to be processed. If the drop in uptake rates with tstor above 20 minutes is indeed a
threshold, than this study suggests that small streams may be more affected by a lower
threshold, at which low discharge contributes to higher storage in biological inactive
zones.
If uptake is physical rather than biological, the location of transient storage is still
likely to be surficial. If transient storage were primarily hyporheic, than as the time spent
in storage zones increased, P molecules would have more time to interact with potentially
sorptive sediments, thereby increasing uptake (Lottig and Stanley, 2007). Since this is not
the pattern observed in this study, transient storage is likely to be surficial, regardless of
whether or not uptake is due to physical sorption.
33

5.6 Implications with Climate Change
The patterns of nutrient uptake in the study streams, whether physical or
biological, suggest that Yedoma streams are active processors of N and P, whereas
Floodplain streams are active processors of P but passive transporters of N.
In the arctic, both permafrost thaw and discharge are projected to increase with
continued warming (Peterson et al. 2002, Frey et al. 2007). In a study in West Siberia,
Frey et al. (2007) found that with further permafrost thaw due to warming, export of
DON, total dissolved nitrogen (TDN), and total dissolved phosphorus (TDP) are
predicted to increase by ~30-50% by the year 2100. These changes are not likely to be
isolated to West Siberia; warming in the Kolyma River basin is also likely to increase
discharge and nutrient input. As this study has suggested, when discharge increases,
transient storage decreases and nutrient uptake increases. If Yedoma streams are active
for both N and P, that is, if Yedoma streams are not limited by a single nutrient, then their
response to changes caused by warming are critical. The processing responses of Yedoma
streams are of particular interest given their vast quantities of stored carbon (Zimov et al.
2006). In short, with continued warming, processing rates in Yedoma streams will likely
first increase, due to an influx of C, N, and P, higher discharge, and lower transient
storage. Yet this relationship will likely change if discharge increases substantially, given
the extremely low discharge of Yedoma streams.
6. CONCLUSIONS
Nutrient spiraling results suggest that Yedoma streams are active processors of
both N and P, while floodplain streams are active processors of P, but appear to be
relatively passive transporters of N. Thus, N and P processing results of this study build
34

on the carbon-processing model provided by Cole et al. (1997) by suggesting that small
streams may be active processors of other nutrients. Carbon processing may be strongly
influenced by the availability of limiting nutrients (Holmes et al. 2008), emphasizing the
importance of N and P cycling for understanding the carbon cycle within small streams.
Thus, this study provides an initial framework on which the biogeochemical cycles of N,
P, and C can be linked.
This study expands on the Cole et al. (2007) model, by incorporating the role of
hydrologic properties on nutrient cycling. Results from this investigation indicate that
transient storage dynamics within small arctic streams in the Kolyma River basin are
primarily governed by discharge. Furthermore, the results indicate that nutrient uptake
may be inversely related to transient storage. This relationship, along with the qualitative
observations of the sediment composition and dense vegetation in the 5 streams, points to
surficial storage where there is either less biogeochemical processing or less physical
sorption.
Future warming in the arctic is likely to result in permafrost thaw and increasing
discharge within the Kolyma River basin, both of which have the potential to increase
nutrient inputs to, and fluxes from, small streams in the Arctic. Results from this study
suggest that increasing discharge may actually increase processing rates of materials in
these streams, at least for P. Given the immense stores of carbon that remain frozen in the
permafrost, this preliminary study illuminates the need for further research into the
biogeochemical processing potential of small arctic streams, especially with respect to the
biological influence on nutrient uptake. As suggested by Cole et al. (1997), these small
streams may occupy key positions in the carbon cycle. If carbon is released by thawing
35

permafrost and actively processed in recipient streams, it can be converted to CO2 and
exported directly out of the stream to the atmosphere rather than exported to the ocean.
By coupling the biogeochemical cycles of N, P, and C, future research can assess the
extent to which small arctic streams will influence carbon fluxes, and the potential for
future climate change. Thus, it is crucial that future studies examine the relationships
between carbon and other nutrient cycles, as well as the general ecosystem functions of
small arctic streams.
7. ACNOWLEDGEMENTS
I would like to thank, first and foremost, John Schade at St. Olaf College, for
introducing me to the concepts of nutrient spiraling and transient storage, as well as for
the hours of guidance, discussion, and editing. I would also like to thank Erin Seybold
’11 at St. Olaf for her great partnership during our field stay in Cherskiy. I must thank the
entire Polaris Project, especially Max Holmes at the Woods Hole Research Center, for
providing me an amazing first-hand look at the Siberian Arctic.
Thank you to Clint Cowan for the sage advice over the years and encouraging me
to participate in the Polaris Project. Thank you to Bereket Haileab for the far-reaching
encouragement and assistance. Lastly, I would like to thank the entire Carleton College
Geology Department and faculty for their support throughout the comps process.
36

8. REFERENCES
Alexander, R., Smith, R., and Schwarz, G., 2000, Effect of stream channel size on the delivery of nitrogen to the Gulf of Mexico: Nature, v. 403, p. 758-761.
Arctic Climate Impact Assessment, 2005, Arctic Climate Impact Assessment: Cambridge University Press, New York, 1042 pp. (Available at http:// www.acia.uaf.edu)
Cole, J. J., Prairie, Y. T., Caraco, N. F., McDowell, W. H., Tranvik, L. J., Striegl, R. G., Duarte, C. M., Kortelainen, P., Downing, J. A., Middelburg, J. J., and Melack, J., 2007, Plumbing the global carbon cycle: Integrating inland waters into the terrestrial carbon budget: Ecosystems, v. 10, p. 171-184.
D’Angelo, D., Webster, J., Gregory, S., And Meyer, J., 1993, Transient storage in appalachian and cascade mountain streams as related to hydraulic characteristics: Journal of the North American Benthological Society, v. 12, p. 223-235.
Dillon, P., and Kirchner, W., 1975, Effects of geology and land-use on export of phosphorus from watersheds: Water Research, v. 9, p. 135-148.
Dutta, K., Schuur, E. A. G., Neff, J. C., and Zimov, S. A., 2006, Potential carbon release from permafrost soils of Northeastern Siberia: Global Change Biology, v. 12, p. 2336-2351.
Edwardson, K., Bowden, W., Dahm, C., and Morrice, J., 2003, The hydraulic characteristics and geochemistry of hyporheic and parafluvial zones in Arctic tundra streams, north slope, Alaska: Advances in Water Resources, v. 26, p. 907-923.
Ensign, S., and Doyle, M., 2005, In-channel transient storage and associated nutrient retention: Evidence from experimental manipulations: Limnology and Oceanography, v. 50, p. 1740-1751.
Ensign, S. H., and Doyle, M. W., 2006, Nutrient spiraling in streams and river networks: Journal of Geophysical Resources - Biogeosciences, v. 111, p. G04009.
Findlay, S., 1995, Importance of surface-subsurface exchange in stream ecosystems - the hyporheic zone: Limnology and Oceanography, v. 40, p. 159-164.
Frey, K., and Smith, L., 2005, Amplified carbon release from vast West Siberian peatlands by 2100: Geophysical Research Letters, v. 32, p. L09401.
Frey, K. E., Siegel, D. I., and Smith, L. C., 2007, Geochemistry of west Siberian streams and their potential response to permafrost degradation: Water Resources Research, v. 43, p. W03406.
Hall, R., Bernhardt, E., and Likens, G., 2002, Relating nutrient uptake with transient storage in forested mountain streams: Limnology and Oceanography, v. 47, p. 255-265.
37

Hall, R., and Tank, J., 2003, Ecosystem metabolism controls nitrogen uptake in streams in Grand Teton National Park, Wyoming: Limnology and Oceanography, v. 48, p. 1120-1128.
Harvey, J., Conklin, M., and Koelsch, R., 2003, Predicting changes in hydrologic retention in an evolving semi-arid alluvial stream: Advances in Water Resources, v. 26, p. 939-950.
Harvey, J. and Wagner, B., 2000, Streams and Ground Waters, Chapter 1: Quantifying hydrologic interactions between streams and their subsurface hyporheic zones, Academic Press, p. 4-41.
Holmes, R., Aminot, A., Kerouel, R., Hooker, B., and Peterson, B., 1999, A simple and precise method for measuring ammonium in marine and freshwater ecosystems: Canadian Journal of Fisheries and Aquatic Sciences, v. 56, p. 1801-1808.
Holmes, R. M., Mcclelland, J. W., Raymond, P. A., Frazer, B. B., Peterson, B. J., and Stieglitz, M., 2008, Lability of DOC transported by Alaskan rivers to the arctic ocean: Geophysical Research Letters, v. 35, p. L03402.
Lottig, N. R., and Stanley, E. H., 2007, Benthic sediment influence on dissolved phosphorus concentrations in a headwater stream: Biogeochemistry, v. 84, p. 297-309.
Marti, E., Grimm, N., and Fisher, S., 1997, Pre- and post-flood retention efficiency of nitrogen in a Sonoran Desert stream: Journal of the North American Benthological Society, v. 16, p. 805-819.
Mulholland, P., 1992, Regulation of nutrient concentrations in a temperate forest stream - roles of upland, riparian, and in-stream processes: Limnology and Oceanography, v. 37, p. 1512-1526.
Mulholland, P., Marzolf, E., Webster, J., Hart, D., and Hendricks, S., 1997, Evidence that hyporheic zones increase heterotrophic metabolism and phosphorus uptake in forest streams: Limnology and Oceanography, v. 42, p. 443-451.
Newbold, J., Elwood, J., Oneill, R., And Vanwinkle, W., 1981, Measuring nutrient spiraling in streams: Canadian Journal of Fisheries and Aquatic Sciences, v. 38, p. 860-863.
Packman, A., and Salehin, M., 2003, Relative roles of stream flow and sedimentary conditions in controlling hyporheic exchange: Hydrobiologia, v. 494, p. 291-297.
Peterson, B., Holmes, R., McClelland, J., Vorosmarty, C., Lammers, R., Shiklomanov, A., Shiklomanov, I., and Rahmstorf, S., 2002, Increasing river discharge to the Arctic Ocean: Science, v. 298, p. 2171-2173.
Prowse, T. D., Wrona, F. J., Reist, J. D., Gibson, J. J., Hobbie, J. E., Levesque, L. M. J., and Vincent, W. F., 2006, Climate change effects on hydroecology of Arctic freshwater ecosystems: Ambio, v. 35, p. 347-358.
38

Raymond, P., and Bauer, J., 2001, Riverine export of aged terrestrial organic matter to the North Atlantic Ocean: Nature, v. 409, p. 497-500.
Runkel, R. L., 1998, One-dimensional transport with inflow and storage (OTIS): a solute transport model for streams and rivers: USGS Water-Resources Investigations Report 98-4018, 73 pp.
Runkel, R. L., 2000, Using the OTIS to model solute transport in streams and rivers, USGS Fact Sheet FS-138-99, 4 pp.
Salehin, M., Packman, A., and Worman, A., 2003, Comparison of transient storage in vegetated and unvegetated reaches of a small agricultural stream in Sweden: seasonal variation and anthropogenic manipulation: Advances in Water Resources, v. 26, p. 951-964.
Sebestyen, S. D., Boyer, E. W., Shanley, J. B., Kendall, C., Doctor, D. H., Aiken, G. R., and Ohte, N., 2008, Sources, transformations, and hydrological processes that control stream nitrate and dissolved organic matter concentrations during snowmelt in an upland forest: Water Resources Research, v. 44, p. W12410.
Sobczak, W., Cloern, J., Jassby, A., Cole, B., Schraga, T., and Arnsberg, A., 2005, Detritus fuels ecosystem metabolism but not metazoan food webs in San Francisco estuary's freshwater Delta: Estuaries, v. 28, p. 124-137.
Sobczak, W., and Findlay, S., 2002, Variation in bioavailability of dissolved organic carbon among stream hyporheic flowpaths: Ecology, v. 83, p. 3194-3209.
Sterner, R. W., and Elser, J. J., 2002, Ecological stoichiometry: the biology of elements from molecules to the biosphere, Princeton University Press, 439 pp.
Taylor, B. W., Keep, C. F., Hall, R. O., Koch, B. J., Tronstad, L. M., Flecker, A. S., and Ulseth, A. J., 2007, Improving the fluorometric ammonium method: matrix effects, background fluorescence, and standard additions: Journal of the North American Benthological Society, v. 26, p. 167-177.
Valett, H., Crenshaw, C., and Wagner, P., 2002, Stream nutrient uptake, forest succession, and biogeochemical theory: Ecology, v. 83, p. 2888-2901.
Vannote, R., Minshall, G., Cummins, K., Sedell, J., And Cushing, C., 1980, River continuum concept: Canadian Journal of Fisheries and Aquatic Sciences, v. 37, p. 130-137.
Wagner, B., and Harvey, J., 1997, Experimental design for estimating parameters of rate-limited mass transfer: Analysis of stream tracer studies: Water Resources Research, v. 33, p. 1731-1741.
Walter, K., Edwards, M., Grosse, G., Zimov, S., and Chapin III, F., 2007, Thermokarst lakes as a source of atmospheric CH4 during the last deglaciation: Science, v. 318, p. 633.
39

Walter, K., Zimov, S., Chanton, J., Verbyla, D., and Chapin III, F., 2006, Methane bubbling from Siberian thaw lakes as a positive feedback to climate warming: Nature, v. 443, p. 71-75.
Webster, J., and Meyer, J., 1997, Organic matter budgets for streams: A synthesis: Journal of the North American Benthological Society, v. 16, p. 141-161.
Wetzel, R. G., 2001, Limnology: Lake and River Ecosystems, 3rd edition: Academic Press, San Diego, California, 1006 pp.
Zarnetske, J. P., Gooseff, M. N., Brosten, T. R., Bradford, J. H., McNamara, J. P., and Bowden, W. B., 2007, Transient storage as a function of geomorphology, discharge, and permafrost active layer conditions in Arctic tundra streams: Water Resources Research, v. 43, p. W07410.
Zimov, S., Schuur, E., and Chapin, F., 2006, Permafrost and the global carbon budget: Science, v. 312, p. 1612-1613.
40