Embed Size (px)
Citation preview
www.elsevier.com/locate/paid
Personality and Individual Differences 40 (2006) 1201–1211
Transient error in personality scores: Considering honestand faked responses
Eric D. Heggestad a,*, Elisa George a, Charlie L. Reeve b
a Department of Psychology, Colorado State University, United Statesb Department of Psychology, University of North Carolina Charlotte, United States
Received 10 January 2005; accepted 10 October 2005Available online 4 January 2006
Abstract
Despite the importance of reliability in personality assessment, little research has evaluated the influenceof transient error on observed scores. In this study, we estimated transient error in scores from two person-ality measures and compared these estimates across honest and faking responding conditions. Results indi-cated that transient error was present in personality scores, with more transient error observed in fakedresponses. Consequently, the coefficient of equivalence (alpha) will overestimate the reliability of personalityscores. Use of alpha will under-correct criterion-related validity coefficients and under-estimate the standarderror of measurement. Results suggest these problems will be more severe when scores are affected by faking.� 2005 Elsevier Ltd. All rights reserved.
Keywords: Reliability; Faking; Transient error
1. Introduction
Measurement theorists have long known there are several sources of measurement error (e.g.,Cronbach, 1947; Thorndike, 1951). Regarding self-report measures of individual differences, three
0191-8869/$ - see front matter � 2005 Elsevier Ltd. All rights reserved.doi:10.1016/j.paid.2005.10.014
* Corresponding author. Present address: Department of Psychology, University of North Carolina at Charlotte, 9201University City Boulevard, Charlotte, NC 28223-0001, United States.
E-mail address: [email protected] (E.D. Heggestad).
1202 E.D. Heggestad et al. / Personality and Individual Differences 40 (2006) 1201–1211
primary sources of measurement error have been identified: random response error, specific factorerror, and transient error (Hunter & Schmidt, 2004; Schmidt & Hunter, 1999; Schmidt, Le, &Ilies, 2003). Random response errors occur and vary within an occasion. These errors are causedby momentary fluctuations in such factors as attention, mental efficiency, and distractions andhave been referred to as ‘‘neural noise’’ (Schmidt & Hunter, 1999). Random errors are specificto an individual responding to a given item at a given moment, such that if the same individualwere to respond to the same item at a different time he or she might provide a different response.The impact of this type of error is reduced by using multiple items because the errors tend to can-cel each other out during a measurement occasion.
Specific factor error reflects variance in responses to a specific type of item that is unrelated tothe construct of interest (Hunter & Schmidt, 2004). Unlike random errors, specific factor errorstend to be consistent across occasions for a given individual. However, because these errors arespecific to an item they will vary across items.
Transient error reflects the interaction between people and measurement occasions. Unlike ran-dom error that varies within measurement occasions, transient error varies across occasions but isconsistent within a single occasion (and thus influences responses to all items on that occasion).Transient error reflects variance in scores across occasions due to sources unrelated to the con-struct of interest, such as mood states, emotional states, mental states, temporary (but notmomentary) changes in information processing capacities, or temporary health problems (Hunter& Schmidt, 2004; Schmidt et al., 2003). For example, if a test taker is ill during the administrationof a measure, he or she may have difficulty concentrating and may perform more poorly than ex-pected on the items. Given a return to health, the individual may perform more in line with expec-tations. As such, the observed variance in scores across the two occasions for this individualwould be due to the transient factor of illness.
1.1. Transient error in personality assessment
While random response error and specific factor error variance have long garnered the atten-tion of measurement specialists, only recently have researchers turned their attention to transienterror (Becker, 2000; Schmidt et al., 2003). Understanding the role of transient errors in personal-ity assessments is important because of its effects on the coefficient of equivalence (CE) reliabilityestimates. CE estimates include correlations of alternate or parallel forms, split-half correlationscorrected by the Spearman–Brown prophecy formula, Kuder–Richardson-20 estimates, and coef-ficient alpha (Cronbach, 1947). Because each of these forms of the CE involve only a singleadministration of the measure, transient error variance, which is consistent within a single testingsession, is confounded with true score (i.e., reliable) variance (Schmidt & Hunter, 1999). Theseforms of reliability, therefore, will overestimate the reliability in a set of scores to the extent thatthose scores were influenced by transient error. Given that CE estimates of reliability are perhapsthe most common form of reliability information reported for personality tests (especially coeffi-cient alpha), test users are likely to conclude that personality test scores are more reliable thanthey are if those scores are impacted by transient error. As a consequence, using CE estimatesto correct criterion-related validity coefficients for attenuation due to unreliability may result inunder-corrections. Likewise, using CE estimates in the calculation of the standard error of mea-surement will result in a value that is too small.
E.D. Heggestad et al. / Personality and Individual Differences 40 (2006) 1201–1211 1203
Schmidt et al. (2003) examined estimates of transient error variance (TEV) among individualdifference measures, including two measures of the Big Five personality dimensions. They admin-istered parallel half scales constructed from the Personal Characteristics Inventory (PCI; Barrick& Mount, 1995) and the International Personality Inventory Pool (IPIP, Goldberg, 1999) at aone-week interval. Among the Big Five, estimates of transient error ranged from an average of0% (Openness) to an average of 11.3% (Neuroticism). These findings indicate that personalityscores are generally influenced by transient error and that CE estimates of reliability will tendto overestimate the reliability of the scores.
1.2. Estimating transient error
In contrast to CE (and coefficient of stability) reliability estimates, the coefficient of equivalenceand stability (CES) assigns both factor-specific error and transient error to unreliability. Estimat-ing the CES has typically required the administration of parallel forms of a measure on two occa-sions. The two assessment occasions allow transient error to be assigned to unreliable varianceand the use of different forms allows specific factor error to be assigned to unreliable variance.As the CES assigns all of the forms of error to unreliability and the CE assigns only specific factorerror and random response error to unreliability, the difference between the CE and the CES pro-vides an estimate of TEV.
Given that parallel forms are not available for many personality measures, CES estimates forpersonality are quite rare in the literature. As a result, estimation of, and attention to, the impactof transient error in personality assessment is quite limited. Recently, however, Schmidt et al.(2003) published a set of equations from which CES estimates can be derived from multipleadministrations of the same measure or the administration of different ‘‘half-scales’’ on differentoccasions. As such, estimates of TEV in personality test scores can be derived without the need forparallel forms. (We should note that TEV can also be estimated from a traditional test–retest de-sign using the logic of generalizability theory, see Brennan, 2001).
Given the importance of understanding the magnitude of error variance, Schmidt et al. calledfor research designed to estimate the CES of commonly employed measures so that more accurateestimates of reliability could be obtained. In response to Schmidt et al.’s call, the first purpose ofthis paper is to add to the emerging database of CES estimates for personality tests and to esti-mate the amount of TEV in scores from these measures.
1.3. Faking and transient error
Optimism is high for the use of personality tests in organizational contexts (Hough & Oswald,2000). However, that optimism is tempered to some degree by concerns about faking, or responsedistortion (Mueller-Hanson, Heggestad, & Thornton, 2003). Although considerable research hasexamined the impact of faking on personality test scores, no studies have explicitly examined howfaking affects the various forms of measurement error. Thus, the second purpose of this study wasto compare estimates of TEV from honest and faked responses to personality measures.
Although researchers have begun to examine the antecedents of faking (McFarland & Ryan,2001; Snell, Sydell, & Lueke, 1999), there is no theoretical perspective on the nature of fakingbehavior. However, an evaluation of TEV may help to shed light on that nature. Specifically, if
1204 E.D. Heggestad et al. / Personality and Individual Differences 40 (2006) 1201–1211
TEV estimates from faked scores are similar to TEV estimates from honest scores, then we couldinfer that faking behavior is consistent across similar assessment situations and may possess trait-like qualities. If, in contrast, there is more TEV in faked scores, then we could infer that fakingbehavior is transient in nature; that it varies from occasion to occasion. Such a finding would sug-gest that faking is influenced by temporal fluctuations in such factors as mood, motivation, andoccasion specific situational factors.
Understanding the amount of TEV in faked personality scores is also important from a prac-tical standpoint. Researchers are generally agreed that individuals can fake self-report personalityassessments (Hough, Eaton, Dunnette, Kamp, &McCloy, 1990) and that many will do so in selec-tion contexts (Hough, 1998; Rosse, Stecher, Miller, & Levin, 1998). If more transient error werefound in faked scores than honest scores, then CE estimates would overestimate reliability to agreater extent when scores are faked. As such, corrections of criterion-related validity coefficientsbased on CE estimates from faked scores would be more under-corrected and standard errors ofmeasurement for scores obtain in applied selection contexts would be inappropriately narrow.
2. Method
2.1. Participants
Participants were 279 undergraduate students from introductory psychology courses who vol-unteered for partial fulfillment of a course requirement. Thirty-seven individuals (13%) failed toreturn for the second testing session, leaving an operational sample of 242.
2.2. Measures
2.2.1. NEO-FFIThe 60-item NEO Five Factor Inventory (NEO-FFI; Costa & McCrae, 1992) is one of the most
well-established measures of the Big Five available. Each of the five traits is represented by 12items. Respondents indicated their agreement with each item on a five-point Likert-type scale(1 = Strongly disagree to 5 = Strongly agree). In contrast to standard scoring procedures, wescored the Neuroticism scale in the opposite direction and refer to this scale as EmotionalStability.
2.2.2. IPIP MeasureWe began by selecting items from the 1415 statements available from the IPIP (Goldberg, 1999)
for which there was factor-analytic information. Based on that information, we selected 200 state-ments that loaded saliently (k > .3) on their respective factor and did not load saliently on otherfactors. Two preliminary data collections were then conducted, and the item means, standarddeviations, and IRT parameters reflecting item ‘‘difficulty’’ and discrimination for the 200 itemswere examined. Twenty-five statements were selected for each of the Big Five dimensions, result-ing in a 125-item measure. Participants indicated the extent to which each item was an accuratedescription of themselves on a five-point Likert-type scale (1 = Very inaccurate to 5 = Veryaccurate).
E.D. Heggestad et al. / Personality and Individual Differences 40 (2006) 1201–1211 1205
2.3. Procedure
The study involved two testing sessions. To begin the first session, participants were seated atindividual computer workstations and informed consent was obtained. Participants were theninformed that they would be completing computer-administered questionnaires and that theirresponses would be anonymous. All participants began by completing the NEO-FFI under anhonest instruction set. Next, participants completed the IPIP measure. Approximately half ofthe participants (n = 139) completed the IPIP measure under an honest instructional set whilethe remaining participants (n = 140) completed this measure under a faking instructional set.In the honest condition, participants were told, ‘‘You should describe yourself as you arenow, not as you wish to be in the future. Describe yourself as you honestly see yourself.’’ Inthe faking condition, participants were asked to imagine that they were completing the measuresas part of the process of applying for a job they really wanted. Specifically, participants weretold:
As you complete the following questionnaires, we want you to pretend that you are a jobapplicant for a job that you really want. Take a minute to think about a job that you thinkwould be great. Imagine that the interviewer tells you that before she can hire you, you needto complete a couple of questionnaires to see if you really are good fit for the company. Ifyou score well, you will get the job. If you do not score well, you will not get the job.
We chose to use this more ‘‘generic’’ faking instruction set rather than a job-specific fakinginstruction set as we believe it is more appropriate for the current purpose. Commercially avail-able personality scales are administered to applicants across a wide range of occupations.Although some organizations may conduct reliability studies for each job, this is likely rare. Assuch, we purposely created an instruction set that would most closely match the nature of the dataused by organizations or test publishers to estimate reliability.
Four weeks after the first session, participants returned for the second session. The proceduresfor the second session were identical to those of the first. Participants completed the IPIP measureunder the same instructional set as they had in Session 1. Attrition was nearly equivalent in bothgroups; 18 individuals who completed the IPIP honestly and 19 individuals who completed theIPIP under faking instructions failed to return for Session 2.
2.4. Analyses
Because the full scales were administered on both occasions, randomly parallel half-scales werecreated through a post-hoc splitting in which items were randomly assigned to half-scales. Forexample, with respect to the 12-item NEO-FFI scales, a random number was assigned to eachitem within a scale and the items with the lowest six values were assigned to one half-scale andthe items with the highest six values were assigned to the second half-scale. The same procedurewas used with the 25-item IPIP scales; the first half-scale consisted of the 12 items with the lowestrandom values and the second half-scale consistent of the 13 items with the highest randomvalues.
Quantifying the degree of transient error requires the computation of two reliability estimates,CE and CES. The full scale CE for each scale was calculated as the average of the full scale
1206 E.D. Heggestad et al. / Personality and Individual Differences 40 (2006) 1201–1211
coefficient alphas from the assessments at Times 1 and 2. CES estimates for the NEO scales, whichhad an even number of items, were computed using Eq. (16) in Schmidt et al. (2003).
CES ¼ 2½Covðh1; g2Þ þ Covðh2; g1Þ�½VarðX1Þ�1=2 � ½VarðX2Þ�1=2
.
In this equation, Cov (h1,g2) is the covariance between the half-scale h administered at Time 1 (h1)and the other half-scale g administered at Time 2 (g2), Cov (h2,g1) is the covariance between thehalf-scale h administered at Time 2 (h2) and the half-scale g administered at Time 1 (g1), Var(X1) isthe variance of the full scale administered at Time 1, and Var(X2) is the variance of the full scaleadministered at Time 2 (Schmidt et al., 2003, p. 212). CES estimates for the IPIP scales, which hadan odd number of items, were computed using Eq. (17a) in Schmidt et al. (2003).
CES ¼ ½Covðh1; g2Þ þ Covðh2; g1Þ�2p1p2½VarðX1Þ�
1=2 � ½VarðX2Þ�1=2.
All of the terms are the same as the previous equation, except for the additional terms, p1 and p2,which refer to the ratio of the number of items in the subscale h to the number of items in the fullscale X and the ratio of the number of items in the subscale g to the number of items in the fullscale X, respectively (Schmidt et al., 2003, p. 212). Estimates of TEV, then, were calculated as thedifference between the CE and CES estimates.
Following the procedure described by Schmidt et al. (2003), a Monte Carlo simulation was con-ducted based on the obtained estimates of CE, CES, and TEV to obtain estimates of standarderrors of the reliability estimates. Specifically, 1000 data sets were generated for each scale in-cluded in the study. Each simulated data set contained the same number of subjects as did theoriginal data reported here. The analysis described above was then conducted on each of the1000 data sets for each scale to obtain estimates of CE, CES, and TEV. The standard deviationof the distributions of these estimates for each scale thus provides the standard errors for thesestatistics.
3. Results
Means and standard deviations for each of the study variables for each testing session are pre-sented in Table 1. Standardized mean difference effect sizes between scores for the honest and fak-ing instructional conditions within each testing session are also presented in Table 1. As shown,IPIP scores for those in the faking condition were substantially higher than for those in the honestcondition within both testing sessions. The effect sizes are similar to those found in comparisons ofscores for applicants and incumbents (Rosse et al., 1998).
Estimates of CE, CES and TEV, along with the associated standard errors, are presented inTable 2. The CES values were smaller than the CE values in all cases, except for the NEO-FFIAgreeableness scale, indicating that transient error variance is a component of observed scores.The estimates of transient error ranged from a low of .00 for NEO-FFI Agreeableness scale(Schmidt et al., 2003 explain that negative values result from sampling error and should be setto zero) to a high of .24 for the IPIP Agreeableness and Conscientiousness scales when given
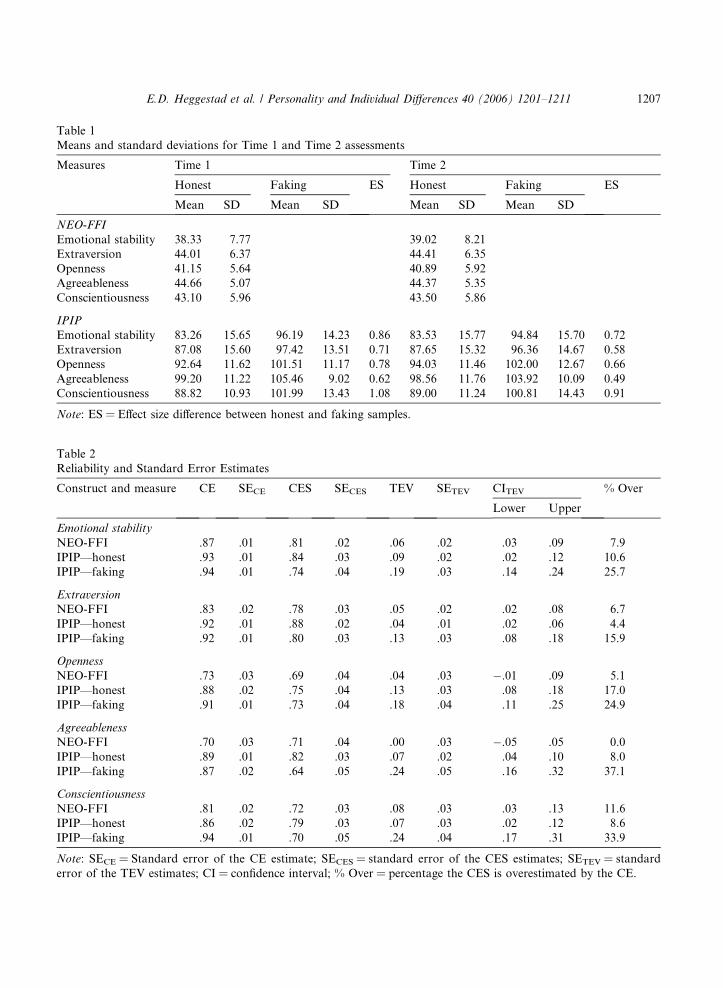
Table 1Means and standard deviations for Time 1 and Time 2 assessments
Measures Time 1 Time 2
Honest Faking ES Honest Faking ES
Mean SD Mean SD Mean SD Mean SD
NEO-FFI
Emotional stability 38.33 7.77 39.02 8.21Extraversion 44.01 6.37 44.41 6.35Openness 41.15 5.64 40.89 5.92Agreeableness 44.66 5.07 44.37 5.35Conscientiousness 43.10 5.96 43.50 5.86
IPIP
Emotional stability 83.26 15.65 96.19 14.23 0.86 83.53 15.77 94.84 15.70 0.72Extraversion 87.08 15.60 97.42 13.51 0.71 87.65 15.32 96.36 14.67 0.58Openness 92.64 11.62 101.51 11.17 0.78 94.03 11.46 102.00 12.67 0.66Agreeableness 99.20 11.22 105.46 9.02 0.62 98.56 11.76 103.92 10.09 0.49Conscientiousness 88.82 10.93 101.99 13.43 1.08 89.00 11.24 100.81 14.43 0.91
Note: ES = Effect size difference between honest and faking samples.
Table 2Reliability and Standard Error Estimates
Construct and measure CE SECE CES SECES TEV SETEV CITEV % Over
Lower Upper
Emotional stability
NEO-FFI .87 .01 .81 .02 .06 .02 .03 .09 7.9IPIP—honest .93 .01 .84 .03 .09 .02 .02 .12 10.6IPIP—faking .94 .01 .74 .04 .19 .03 .14 .24 25.7
Extraversion
NEO-FFI .83 .02 .78 .03 .05 .02 .02 .08 6.7IPIP—honest .92 .01 .88 .02 .04 .01 .02 .06 4.4IPIP—faking .92 .01 .80 .03 .13 .03 .08 .18 15.9
Openness
NEO-FFI .73 .03 .69 .04 .04 .03 �.01 .09 5.1IPIP—honest .88 .02 .75 .04 .13 .03 .08 .18 17.0IPIP—faking .91 .01 .73 .04 .18 .04 .11 .25 24.9
Agreeableness
NEO-FFI .70 .03 .71 .04 .00 .03 �.05 .05 0.0IPIP—honest .89 .01 .82 .03 .07 .02 .04 .10 8.0IPIP—faking .87 .02 .64 .05 .24 .05 .16 .32 37.1
Conscientiousness
NEO-FFI .81 .02 .72 .03 .08 .03 .03 .13 11.6IPIP—honest .86 .02 .79 .03 .07 .03 .02 .12 8.6IPIP—faking .94 .01 .70 .05 .24 .04 .17 .31 33.9
Note: SECE = Standard error of the CE estimate; SECES = standard error of the CES estimates; SETEV = standarderror of the TEV estimates; CI = confidence interval; % Over = percentage the CES is overestimated by the CE.
E.D. Heggestad et al. / Personality and Individual Differences 40 (2006) 1201–1211 1207
1208 E.D. Heggestad et al. / Personality and Individual Differences 40 (2006) 1201–1211
under the faking instructional set. The last column of the table indicates the percentage that theCE overestimates reliability. In the case of the NEO-Agreeableness scale, the CE was found to notoverestimate reliability. In contrast, the CE for the IPIP Agreeableness scale given under the fak-ing instructional set was found to overestimate the reliability of the scores by 37.1%.
In general, the estimates of transient error for the NEO-FFI scales were comparable to the esti-mates for the IPIP scales given under the honest instructional condition. For each of the fivetraits, the confidence intervals around the estimates overlapped. Thus, the estimates from theNEO-FFI cannot be said to differ from the estimates for the IPIP scales (when responded tohonestly).
The faking instructional set impacted the amount of transient error variance within the ob-served scores. For each of the five traits, the TEV estimates were the highest for the IPIP scalesgiven under the faking instructional set. The confidence intervals around the TEV estimates forthe NEO-FFI scales did not overlap with those for the faked IPIP scores in any case, indicatingthat there was significantly more transient error in the faked IPIP scores than in the NEO-FFIscores. Similarly, there was significantly more transient error in the faked IPIP scores thanthere was in the honest IPIP scores for four of the five traits, the one exception being theOpenness scale. This latter set of findings is particularly striking given that the measures werecomprised of the same items; only the conditions under which the measure was completed dif-fered. These findings indicate that faking increases the amount of variance in observed scoresdue to transient error and that CE estimates will substantially overestimate the reliability offaked scores.
4. Discussion
The first purpose of this study was to contribute to the emerging literature investigating the de-gree to which CE reliability estimates overestimate the actual reliable variance in measures of per-sonality. Considering the responses provided under honest instructional conditions, our findingsindicate that scale scores from the NEO-FFI and the IPIP are influenced by transient error (withthe exception of scores from the NEO-FFI Agreeableness scale). As a consequence, CE estimatesof reliability will overestimate the reliability of the scores on these scales. The implication of thesefindings is that corrections of criterion-related validity coefficients based on CE reliability will re-sult in underestimates of the true relationships between construct and underestimates of the stan-dard error of measurement.
The results from the honest responding conditions are consistent with those reported bySchmidt et al. (2003). Although the specific IPIP measure certainly differed across the studies, con-fidence intervals around the TEV estimates in the Schmidt et al. data overlapped those in our datain all cases except one (Openness). The difference for the openness scales could have been due todifferences in the items comprising the Openness scales and/or unknown sample differences.
The second purpose of this study was to explore how faking impacts the amount of transienterror variance in a set of observed scores. Our results indicate that there is notably more transienterror variance in faked scores than in honest scores. Under honest conditions, results from theNEO-FFI and the IPIP indicated that the CE overestimated reliability by generally 10% or less.When completed under faking conditions, however, the CE overestimated reliability by 15–35%.
E.D. Heggestad et al. / Personality and Individual Differences 40 (2006) 1201–1211 1209
Thus, if faking occurs in a set of scores, then conclusions about the reliability of these scores islikely to be erroneous when those conclusions are based on CE estimates of reliability.
4.1. Limitations
Reasonable caution should be exercised when interpreting our results given the study was con-ducted in a lab with a student sample. Although the impact of the artificiality of the research mayhave had some impact on the estimates of the CES and TEV for the measures completed honestly,of greater concern is the potential impact on the estimates for the faked scores.
Researchers have cautioned against assuming the results of directed-faking experiments willgeneralize to applicant contexts (Hough, 1998; Rosse et al., 1998). It is possible that studentsmay have been less motivated by the faking instructions on the second administration of the IPIP.Such a change in motivation, assuming it led to score differences from Time 1 to Time 2, couldshow up as transient error. If re-testing were to occur in a true high stakes setting, motivationmight be more consistent across time and the amount of transient error variance in the scoresmay be less than what we observed in the laboratory setting.
In addition, our faking instructions had participants imagine a job that they wanted. It’s pos-sible that participants considered different jobs at Time 1 than at Time 2. If they did and if thosejobs had different ‘‘profiles’’ of desirable traits (Furnham, 1990), then some of the differences inscores on the two assessments might be due to the differences in the imagined jobs and not dueto transient error. However, conscientiousness is likely to be seen as similarly desirable for all jobsand, therefore, scores should be less impacted by changes in imagined jobs. The fact that resultsfor this scale were similar to the results for the other scale suggests that the results were notstrongly influenced by the participants changing the jobs they imagined.
Given these limitations, our results may underestimate the CES for faked scores and, as a re-sult, overestimate the amount of TEV. While we do not believe that the dramatic increases in theTEV estimates observed in the faking condition are due to these factors alone, we strongly recom-mend that future research be conducted to estimate the influence of TEV among personality testscores that were administered in applicant settings. In this context, it would also be interesting toexamine the impact of TEV on criterion-related validity.
4.2. Implications
These results may have important theoretical and practical implications. Generally, little isknown about the nature of faking. Our results suggest that faking is somewhat transient; that fak-ing during one testing occasion is likely to be different from faking on another testing occasion(even when the testing situation is the same on both occasions). These findings suggest that fakingmay be impacted by various transient factors such as mood or motivation within the assessmentsituation. Recently, researchers have begun to look at the determinants of faking behavior(McFarland & Ryan, 2001; Snell et al., 1999). However, the predictors included in these modelshave, by and large, been trait-like predictors. Our results suggest that researchers might benefit bybeginning to also consider transient factors, such as mood, in the prediction of faking behavior.
Two practical implications of our findings are worthy of note. First, the correction of criterion-related validity coefficients based on personality measures are likely to be severely under-corrected
1210 E.D. Heggestad et al. / Personality and Individual Differences 40 (2006) 1201–1211
when the reliability coefficient used in that correction is the CE, or alpha, especially when thosescores may have been impacted by faking. In the present study, CE estimates for the faked scoreswere comparable to CE estimates for the honest scores. If criterion-related validities within honestand faked samples are both corrected using this CE estimate, then the correction will be biased toa greater degree in the faking sample than in the honest sample. Because faked scores are typicallyless criterion valid (Mueller-Hanson et al., 2003), this differential bias will make the corrected cor-relations appear more different than they truly are. Investigations of the impact of faking on cri-terion-related validity should take this fact into account when analyses are conducted andreported.
Second, the results suggest that caution should be exercised when calculating standard errors ofmeasurement. If one were to use CE, or alpha, to estimate the SEM among a set of scores that arelikely to have been influenced by faking, that observed SEM will notably underestimate the trueSEM. By way of example, consider the results for our IPIP Conscientiousness measure given un-der faking conditions. The formula for calculating the SEM is
rE ¼ rX
ffiffiffiffiffiffiffiffiffiffiffiffiffiffiffiffiffiffiffiffiffiffiffiffiffiffiffiqXX ð1� qXX Þ
p;
where rE is the SEM, rX is the standard deviation of the personality measure, and qXX is the reli-ability estimate for the personality measure. Using the standard deviation from the Time 1 assess-ment (13.43), we can calculate the SEM using both the CE and the CES as estimates of reliability.When using the CE, or alpha (.94), we get a SEM of 3.19. When using the CES (.70), the SEM is6.15; a substantially larger value. Thus, using a CE estimate to establish a SEM in a set of scoreswhere faking is likely to have occurred may result in inferences that individual’s scores are differ-ent when, in fact, they are not.
References
Barrick, M. R. & Mount, M. K. (1995). The personal characteristics inventory manual. Unpublished manuscript,University of Iowa, Iowa City.
Becker, G. (2000). How important is transient error in estimating reliability? Going beyond simulation studies.Psychological Methods, 5, 370–379.
Brennan, R. L. (2001). Generalizability Theory. New York: Springer-Verlag.Costa, P. T., & McCrae, R. R. (1992). Revised NEO personality inventory (NEO-PI-R) and NEO five factor inventory
(NEO-FFI) professional manual. Odessa, FL: PAR.Cronbach, L. J. (1947). Test ‘‘reliability’’: its meaning and determination. Psychometrika, 12, 1–16.Furnham, A. (1990). Faking personality questionnaires: fabricating different profiles for different purposes. Current
Psychology: Research & Reviews, 9, 46–55.Goldberg, L. R. (1999). A broad-bandwidth, public-domain, personality inventory measuring the lower-level facets of
several five-factor models. In I. Mervielde, I. Deary, F. De Fruyt, & F. Ostendorf (Eds.). Personality Psychology in
Europe (Vol. 7, pp. 7–28). Tilburg, the Netherlands: Tilburg University Press.Hough, L. M. (1998). Effects of intentional distortion in personality measurement and evaluation of suggested
palliatives. Human Performance, 11, 209–244.Hough, L. M., Eaton, N. K., Dunnette, M. D., Kamp, J. D., & McCloy, R. A. (1990). Criterion-related validities of
personality constructs and the effect of response distortion on those validities. Journal of Applied Psychology, 75,581–595.
Hough, L. M., & Oswald, F. L. (2000). Personnel selection: looking toward the future—remembering the past. AnnualReview of Psychology, 51, 631–664.
E.D. Heggestad et al. / Personality and Individual Differences 40 (2006) 1201–1211 1211
Hunter, J. E., & Schmidt, R. L. (2004). Methods of meta-analysis: correcting error and bias in research findings (seconded.). Thousand Oaks, CA: Sage Publications, Inc.
McFarland, L. A. & Ryan, A. M. (2001, April). Toward an integrated model of applicant faking behavior. In: 16thAnnual Conference of the Society for Industrial and Organizational Psychology, San Diego, CA.
Mueller-Hanson, R., Heggestad, E. D., & Thornton, G. C. III, (2003). Faking and selection: considering the use ofpersonality from a select-in and a select-out perspective. Journal of Applied Psychology, 88, 348–355.
Rosse, J. G., Stecher, M. D., Miller, J. L., & Levin, R. (1998). The impact of response distortion on preemploymentpersonality testing and hiring decisions. Journal of Applied Psychology, 83, 634–644.
Schmidt, F. L., & Hunter, J. E. (1999). Theory testing and measurement error. Intelligence, 27, 183–198.Schmidt, F. L., Le, H., & Ilies, R. (2003). Beyond alpha: an empirical examination of the effects of different sources of
measurement error on reliability estimates for measures of individual differences constructs. Psychological Methods,
8, 206–224.Snell, A. F., Sydell, E. J., & Lueke, S. B. (1999). Toward a theory of applicant faking: integrating studies of deception.
Human Resource Management Review, 9, 219–242.Thorndike, R. L. (1951). Reliability. In E. F. Lindquist (Ed.), Educational measurement (pp. 560–620). Washington,
DC: American Council on Education.