Embed Size (px)
Citation preview
Journal of Volcanology and Geothermal Research 178 (2008) 378–396
Contents lists available at ScienceDirect
Journal of Volcanology and Geothermal Research
j ourna l homepage: www.e lsev ie r.com/ locate / jvo lgeores
Transient 3D numerical simulations of column collapse and pyroclastic densitycurrent scenarios at Vesuvius
T. Esposti Ongaro a, A. Neri a,⁎, G. Menconi a, M. de'Michieli Vitturi a, P. Marianelli a, C. Cavazzoni b,G. Erbacci b, P.J. Baxter c
a Istituto Nazionale di Geofisica e Vulcanologia, Sezione di Pisa, Italyb CINECA, High Performance Computing Group, Casalecchio di Reno, Italyc Institute of Public Health, University of Cambridge, Cambridge, United Kingdom
⁎ Corresponding author. Fax: +39 050 8311942.E-mail address: [email protected] (A. Neri).
0377-0273/$ – see front matter © 2008 Elsevier B.V. Aldoi:10.1016/j.jvolgeores.2008.06.036
a b s t r a c t
a r t i c l e i n f oArticle history:
Numerical simulations of co Received 21 January 2008Accepted 27 June 2008Available online 17 July 2008Keywords:Vesuviuspyroclastic density currentcolumn collapsenumerical simulation3D modellinghazard assessment
lumn collapse and pyroclastic density current (PDC) scenarios at Vesuvius werecarried out using a transient 3D flow model based on multiphase transport laws. The model describes thedynamics of the collapse as well as the effects of the 3D topography of the volcano on PDC propagation.Source conditions refer to a medium-scale sub-Plinian event and consider a pressure-balanced jet.Simulation results provide new insights into the complex dynamics of these phenomena. In particular: 1)column collapse can be characterized by different regimes, from incipient collapse to partial or nearly totalcollapse, thus confirming the possibility of a transitional field of behaviour of the column characterized bythe contemporaneous and/or intermittent occurrence of ash fallout and PDCs; 2) the collapse regime can becharacterized by its fraction of eruptive mass reaching the ground and generating PDCs; 3) within the rangeof the investigated source conditions, the propagation and hazard potential of PDCs appear to be directlycorrelated with the flow-rate of the mass collapsing to the ground, rather than to the collapse height of thecolumn (this finding is in contrast with predictions based on the energy-line concept, which simplycorrelates the PDC runout and kinetic energy with the collapse height of the column); 4) first-order values ofhazard variables associated with PDCs (i.e., dynamic pressure, temperature, airborne ash concentration) canbe derived from simulation results, thereby providing initial estimates for the quantification of damagescenarios; 5) for scenarios assuming a location of the central vent coinciding with that of the present GranCono, Mount Somma significantly influences the propagation of PDCs, largely reducing their propagation inthe northern sector, and diverting mass toward the west and southeast, accentuating runouts and hazardvariables for these sectors; 6) the 2D modelling approximation can force an artificial radial propagation of thePDCs since it ignores azimuthal flows produced by real topographies that therefore need to be simulated infully 3D conditions.
© 2008 Elsevier B.V. All rights reserved.
1. Introduction
Historically, the explosive eruptions of Vesuvius have had a strongimpact on the life of the surrounding population. Examples includethe 3800 B.P. Avellino eruption, which widely impacted the CampaniaPlain (Lirer et al., 1973; Santacroce, 1987; Rolandi et al., 1993a; Cioniet al., 2000; Mastrolorenzo et al., 2006), and the famous AD 79eruption, which caused the destruction of the Roman towns ofPompeii, Herculaneum, and Stabiae (Lirer et al., 1973; Sigurdsson et al.,1982). The most catastrophic explosive eruption of the last milleniumoccurred in AD 1631. Slightly smaller than AD 79, this eruptionclaimed more than 1000 victims and caused extensive damage andsocial consequences in the area of Vesuvius (Rosi et al., 1993; Rolandiet al., 1993b; Guidoboni, 2008-this issue).
l rights reserved.
Although ash and lapilli fallout, i.e. the airborne dispersal anddeposition of volcanic particles (Cioni et al., 2003a; Macedonio et al.,2008-this issue), and lahars, i.e. the remobilization of such depositsunder the action of meteoric water (Bisson et al., 2006), are additionalsignificant hazards, the most catastrophic process characterizing thelarge explosive eruptions at Vesuvius is the collapse of the volcaniccolumn and the generation of devastating pyroclastic density currents(PDCs), or pyroclastic flows s.l. (Cioni et al., 2008-this issue).
This phenomenon, which typically characterizes the later stages ofthe explosive event, at Vesuvius is usually considered to be producedby two different mechanisms: 1) a gradual or sharp change in theeruptive conditions of the mixture at the vent that causes thedestabilization of the volcanic column, and gravitational collapse tothe ground of variable portions of the plume, and 2) the abrupt total orpartial collapse of the volcanic edifice to generate a caldera, witheffective increase of radius, that favours the formation of boiling-overtype PDCs fed by a relatively short-lived, low-altitude fountain. For
379T. Esposti Ongaro et al. / Journal of Volcanology and Geothermal Research 178 (2008) 378–396
instance, the first type of column collapse is thought to have occurredduring the AD 79 Plinian eruption, andwas associatedwith the changefromwhite magma to grey magma (Lirer et al., 1973; Sigurdsson et al.,1982; Cioni et al., 1992). The second type of column collapse,associated with caldera generation in the summit portion of thevolcano, probably occurred in the AD 1631 eruption (Rolandi et al.,1993b; Rosi et al., 1993), and in the late stages of the AD 79 event(Sigurdsson et al., 1982; Cioni et al., 1992).
Understanding the dynamics of column collapse mechanisms isthus vital for properly assessing the hazard associated with PDCsproduced by explosive eruptions of Vesuvius. The collapse dynamicsin fact determine the mass feeding conditions of the associated PDCsat the air-ground interface, as well as their spatial and temporalvariations. The crucial importance of the topic is underscored by anawareness of the present-day situation at Vesuvius, where more thanhalf a million people live in the Red Zone, a high-hazard area with aradius of about 8 km. According to the present Emergency Plan, thisarea could be affected by PDCs and should therefore be evacuated inadvance in the case of renewed volcanic activity (DPC, 1995, 2001).
Modelling column collapse and PDC propagation and runout hasalways been a very challenging task for volcanological researchers.Although simplified schemes have been developed, any attempt atrealism requires the description of an enormously complex 3Dtransient process, together with appropriate representation of themultiphase nature of the eruptive mixture. Moreover, initial andboundary conditions, such as atmospheric conditions and volcanotopography, are also intrinsically 3D and often time-dependent. Afurther complexity of PDCs is the dual nature of their flow, typicallyconsisting of a basal granular flow underlying a more dilute surge-likeash cloud (Druitt, 1998; Branney and Kokelaar, 2002; Burgisser andBergantz, 2002).
Sparks et al. (1978) first attempted to quantify the dynamics ofcolumn collapse and associated PDCs: by adopting a 1D steady-statehomogeneous flow formulation and simple geometrical constraints,they quantified the main influence of vent parameters on collapse andPDC features. A simplified approach for the definition of a regioninundated by PDCs generated by column collapse was later developedby Malin and Sheridan (1982); based on an energy-line conceptoriginally developed for landslides. This simplified approach and itsextensions have been widely applied to the assessment of PDC hazardin many areas, including Vesuvius (Sheridan andMalin, 1983; Rossanoet al., 1998; Mastrolorenzo et al., 2006).
A significant advance was made a few years later by a researchgroup at Los Alamos National Laboratory (US) through the adoption of2D transient two-phase flow codes able to provide insight into severalaspects of these complex phenomena as well as the influence of ventconditions on the eruptive style of the column (Wohletz et al., 1984;Valentine andWohletz, 1989). This approach was extended by Dobranet al. (1993), Neri and Macedonio (1996), and Neri et al. (2003), whofurther developed the 2D multiphase flow formulation by adoptingthe kinetic theory and multiparticle descriptions of the solid phase.
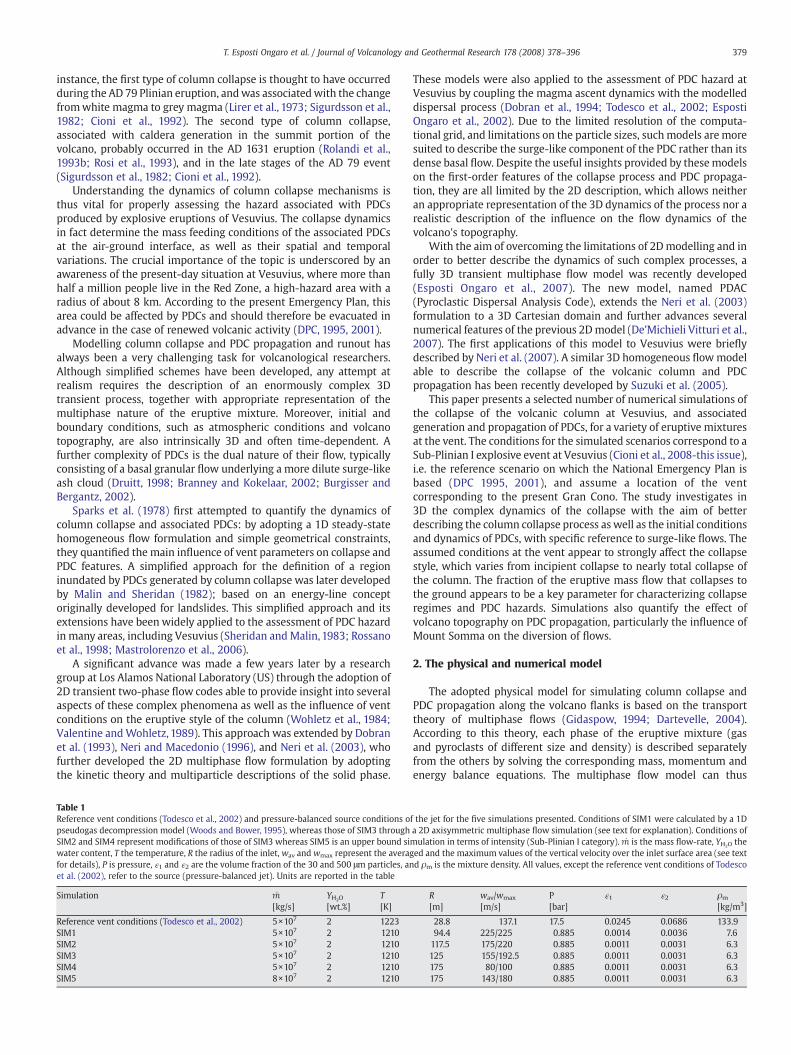
Table 1Reference vent conditions (Todesco et al., 2002) and pressure-balanced source conditions opseudogas decompression model (Woods and Bower, 1995), whereas those of SIM3 throughSIM2 and SIM4 represent modifications of those of SIM3 whereas SIM5 is an upper bound siwater content, T the temperature, R the radius of the inlet, wav and wmax represent the averagfor details), P is pressure, ɛ1 and ɛ2 are the volume fraction of the 30 and 500 μm particles, anet al. (2002), refer to the source (pressure-balanced jet). Units are reported in the table
Simulation m[kg/s]
YH2O
[wt.%]T[K]
Reference vent conditions (Todesco et al., 2002) 5×10⁷ 2 1223SIM1 5×10⁷ 2 1210SIM2 5×10⁷ 2 1210SIM3 5×10⁷ 2 1210SIM4 5×10⁷ 2 1210SIM5 8×10⁷ 2 1210
These models were also applied to the assessment of PDC hazard atVesuvius by coupling the magma ascent dynamics with the modelleddispersal process (Dobran et al., 1994; Todesco et al., 2002; EspostiOngaro et al., 2002). Due to the limited resolution of the computa-tional grid, and limitations on the particle sizes, suchmodels are moresuited to describe the surge-like component of the PDC rather than itsdense basal flow. Despite the useful insights provided by thesemodelson the first-order features of the collapse process and PDC propaga-tion, they are all limited by the 2D description, which allows neitheran appropriate representation of the 3D dynamics of the process nor arealistic description of the influence on the flow dynamics of thevolcano's topography.
With the aim of overcoming the limitations of 2Dmodelling and inorder to better describe the dynamics of such complex processes, afully 3D transient multiphase flow model was recently developed(Esposti Ongaro et al., 2007). The new model, named PDAC(Pyroclastic Dispersal Analysis Code), extends the Neri et al. (2003)formulation to a 3D Cartesian domain and further advances severalnumerical features of the previous 2Dmodel (De'Michieli Vitturi et al.,2007). The first applications of this model to Vesuvius were brieflydescribed by Neri et al. (2007). A similar 3D homogeneous flowmodelable to describe the collapse of the volcanic column and PDCpropagation has been recently developed by Suzuki et al. (2005).
This paper presents a selected number of numerical simulations ofthe collapse of the volcanic column at Vesuvius, and associatedgeneration and propagation of PDCs, for a variety of eruptive mixturesat the vent. The conditions for the simulated scenarios correspond to aSub-Plinian I explosive event at Vesuvius (Cioni et al., 2008-this issue),i.e. the reference scenario on which the National Emergency Plan isbased (DPC 1995, 2001), and assume a location of the ventcorresponding to the present Gran Cono. The study investigates in3D the complex dynamics of the collapse with the aim of betterdescribing the column collapse process as well as the initial conditionsand dynamics of PDCs, with specific reference to surge-like flows. Theassumed conditions at the vent appear to strongly affect the collapsestyle, which varies from incipient collapse to nearly total collapse ofthe column. The fraction of the eruptive mass flow that collapses tothe ground appears to be a key parameter for characterizing collapseregimes and PDC hazards. Simulations also quantify the effect ofvolcano topography on PDC propagation, particularly the influence ofMount Somma on the diversion of flows.
2. The physical and numerical model
The adopted physical model for simulating column collapse andPDC propagation along the volcano flanks is based on the transporttheory of multiphase flows (Gidaspow, 1994; Dartevelle, 2004).According to this theory, each phase of the eruptive mixture (gasand pyroclasts of different size and density) is described separatelyfrom the others by solving the corresponding mass, momentum andenergy balance equations. The multiphase flow model can thus
f the jet for the five simulations presented. Conditions of SIM1 were calculated by a 1Da 2D axisymmetric multiphase flow simulation (see text for explanation). Conditions ofmulation in terms of intensity (Sub-Plinian I category). m is the mass flow-rate, YH2O theed and the maximum values of the vertical velocity over the inlet surface area (see textd ρm is the mixture density. All values, except the reference vent conditions of Todesco
R[m]
wav/wmax
[m/s]P[bar]
ɛ1 ɛ2 ρm[kg/m3]
28.8 137.1 17.5 0.0245 0.0686 133.994.4 225/225 0.885 0.0014 0.0036 7.6117.5 175/220 0.885 0.0011 0.0031 6.3125 155/192.5 0.885 0.0011 0.0031 6.3175 80/100 0.885 0.0011 0.0031 6.3175 143/180 0.885 0.0011 0.0031 6.3
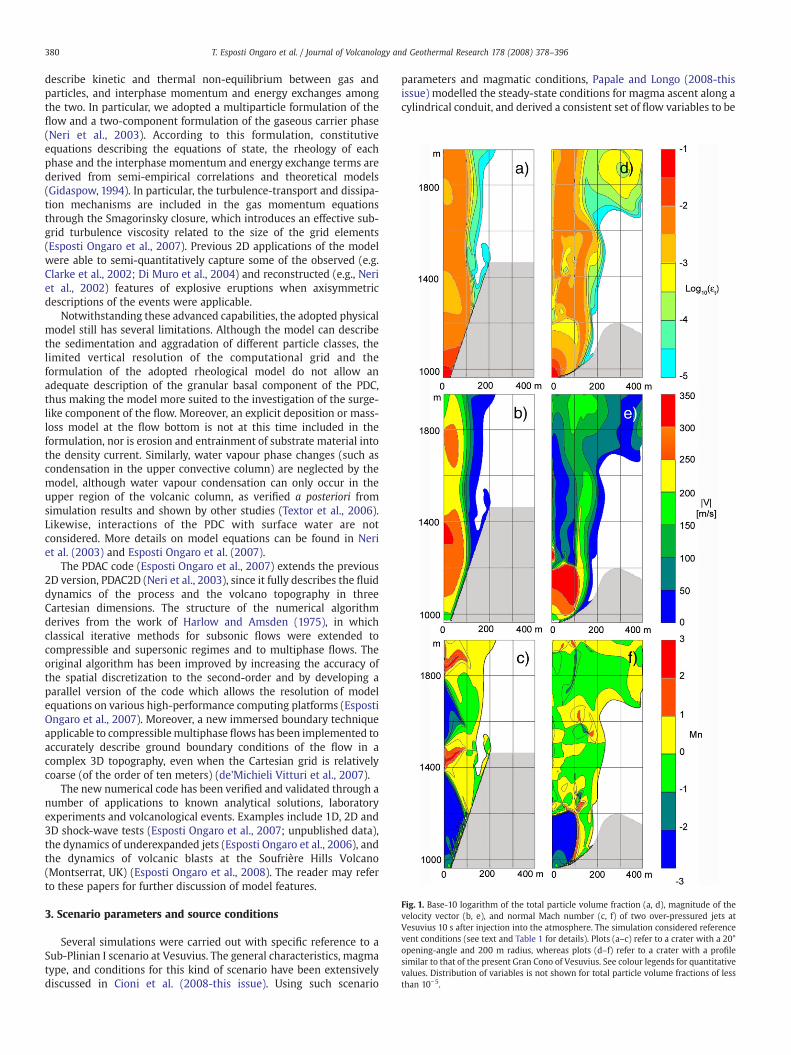
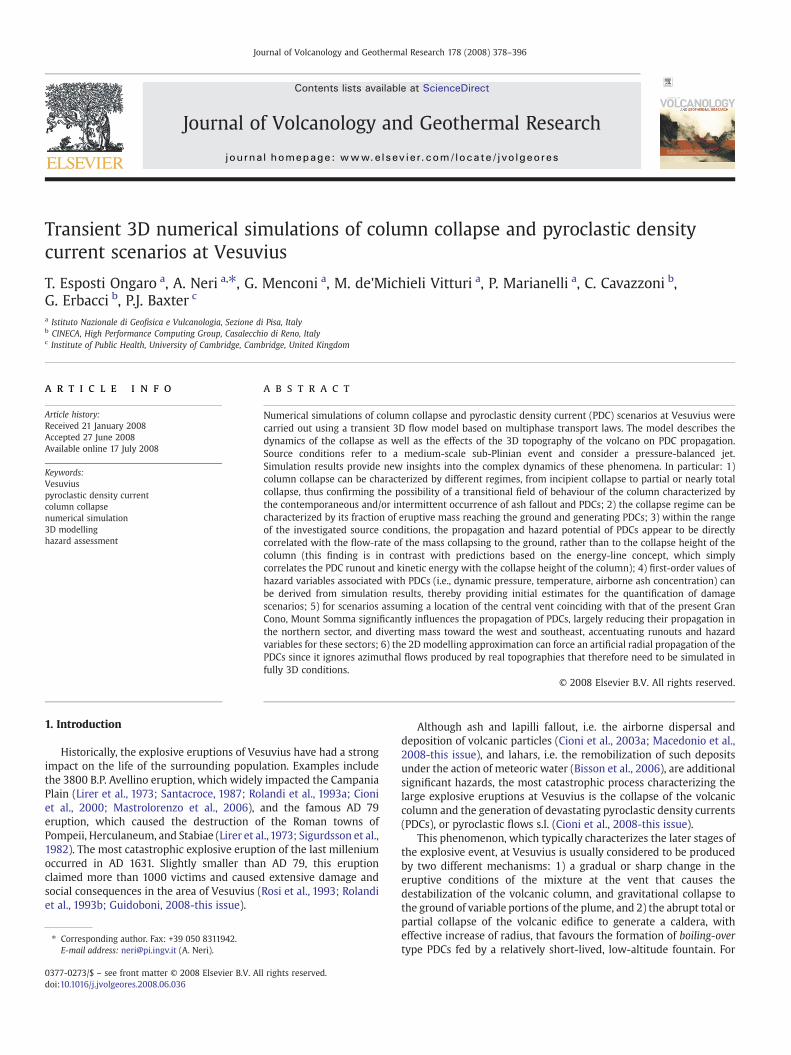
Fig. 1. Base-10 logarithm of the total particle volume fraction (a, d), magnitude of thevelocity vector (b, e), and normal Mach number (c, f) of two over-pressured jets atVesuvius 10 s after injection into the atmosphere. The simulation considered referencevent conditions (see text and Table 1 for details). Plots (a–c) refer to a crater with a 20°opening-angle and 200 m radius, whereas plots (d–f) refer to a crater with a profilesimilar to that of the present Gran Cono of Vesuvius. See colour legends for quantitativevalues. Distribution of variables is not shown for total particle volume fractions of lessthan 10−5.
380 T. Esposti Ongaro et al. / Journal of Volcanology and Geothermal Research 178 (2008) 378–396
describe kinetic and thermal non-equilibrium between gas andparticles, and interphase momentum and energy exchanges amongthe two. In particular, we adopted a multiparticle formulation of theflow and a two-component formulation of the gaseous carrier phase(Neri et al., 2003). According to this formulation, constitutiveequations describing the equations of state, the rheology of eachphase and the interphase momentum and energy exchange terms arederived from semi-empirical correlations and theoretical models(Gidaspow, 1994). In particular, the turbulence-transport and dissipa-tion mechanisms are included in the gas momentum equationsthrough the Smagorinsky closure, which introduces an effective sub-grid turbulence viscosity related to the size of the grid elements(Esposti Ongaro et al., 2007). Previous 2D applications of the modelwere able to semi-quantitatively capture some of the observed (e.g.Clarke et al., 2002; Di Muro et al., 2004) and reconstructed (e.g., Neriet al., 2002) features of explosive eruptions when axisymmetricdescriptions of the events were applicable.
Notwithstanding these advanced capabilities, the adopted physicalmodel still has several limitations. Although the model can describethe sedimentation and aggradation of different particle classes, thelimited vertical resolution of the computational grid and theformulation of the adopted rheological model do not allow anadequate description of the granular basal component of the PDC,thus making the model more suited to the investigation of the surge-like component of the flow. Moreover, an explicit deposition or mass-loss model at the flow bottom is not at this time included in theformulation, nor is erosion and entrainment of substrate material intothe density current. Similarly, water vapour phase changes (such ascondensation in the upper convective column) are neglected by themodel, although water vapour condensation can only occur in theupper region of the volcanic column, as verified a posteriori fromsimulation results and shown by other studies (Textor et al., 2006).Likewise, interactions of the PDC with surface water are notconsidered. More details on model equations can be found in Neriet al. (2003) and Esposti Ongaro et al. (2007).
The PDAC code (Esposti Ongaro et al., 2007) extends the previous2D version, PDAC2D (Neri et al., 2003), since it fully describes the fluiddynamics of the process and the volcano topography in threeCartesian dimensions. The structure of the numerical algorithmderives from the work of Harlow and Amsden (1975), in whichclassical iterative methods for subsonic flows were extended tocompressible and supersonic regimes and to multiphase flows. Theoriginal algorithm has been improved by increasing the accuracy ofthe spatial discretization to the second-order and by developing aparallel version of the code which allows the resolution of modelequations on various high-performance computing platforms (EspostiOngaro et al., 2007). Moreover, a new immersed boundary techniqueapplicable to compressiblemultiphase flows has been implemented toaccurately describe ground boundary conditions of the flow in acomplex 3D topography, even when the Cartesian grid is relativelycoarse (of the order of ten meters) (de'Michieli Vitturi et al., 2007).
The new numerical code has been verified and validated through anumber of applications to known analytical solutions, laboratoryexperiments and volcanological events. Examples include 1D, 2D and3D shock-wave tests (Esposti Ongaro et al., 2007; unpublished data),the dynamics of underexpanded jets (Esposti Ongaro et al., 2006), andthe dynamics of volcanic blasts at the Soufrière Hills Volcano(Montserrat, UK) (Esposti Ongaro et al., 2008). The reader may referto these papers for further discussion of model features.
3. Scenario parameters and source conditions
Several simulations were carried out with specific reference to aSub-Plinian I scenario at Vesuvius. The general characteristics, magmatype, and conditions for this kind of scenario have been extensivelydiscussed in Cioni et al. (2008-this issue). Using such scenario
parameters and magmatic conditions, Papale and Longo (2008-thisissue) modelled the steady-state conditions for magma ascent along acylindrical conduit, and derived a consistent set of flow variables to be

381T. Esposti Ongaro et al. / Journal of Volcanology and Geothermal Research 178 (2008) 378–396
used as vent conditions for atmospheric dispersal modelling. In thisanalysis, we rely on the results of these studies and on a recent workwhich made use of similar magmatic data and modelling tools(Todesco et al., 2002). Given the large uncertainties affecting thesevariables (Sparks and Aspinall, 2004; Papale and Longo, 2008-thisissue), we believe that the adopted scenario conditions are adequatefor the purpose of this study.
3.1. The reference conditions and jet dynamics
The source conditions assumed for the simulated scenarios arereported in detail in Table 1. Sub-Plinian I scenarios are characterizedby mass flow rates of 1–8×10⁷ kg/s (Cioni et al., 2008-this issue); inour simulations we therefore mostly referred to a rate of 5×10⁷ kg/s.The mass flow was assumed to steadily feed the column. The adoptedreference flow conditions of the mixture at the vent, i.e. at the exit ofthe volcanic conduit, were those estimated by Todesco et al. (2002) fora typical Vesuvian magma with 2 wt.% water and a temperature of1223 K. A two-sized particle formulation (assuming equal amount of30 and 500 μmparticles) was adopted in all simulations on the basis ofavailable grainsize data and previous modeling (Rosi et al., 1993;Todesco et al., 2002; Sulpizio et al., 2005). These two particle sizeswere assumed to be representative of the finest andmedian size of themixture whereas the coarsest particle component of some mm sizewas neglected. In the 2D simulations (Todesco et al., 2002), theseconditions favoured the collapse of the column and therefore becamethe reference for our variation of vent conditions. Similar ventconditions were computed by Papale and Longo (2008-this issue)for the same input parameters.
As shown by the results reported in Papale and Longo (2008-thisissue), the pressure at the exit of the volcanic conduit generally greatlyexceeds atmospheric pressure, so that the mixture decompresses andexpands above the vent (for instance, for our reference ventconditions, such an overpressure is about 17 bars, see Table 1). Thedecompression of a circular jet is a complex phenomenon thatinvolves the formation and reflection of oblique shock waves andrarefaction fans, which produce characteristic flow patterns in the jet(Kieffer, 1984; Kieffer and Sturtevant, 1984). Such flow structures canbe effectively simulated numerically, although a fine grid resolution isnecessary (Normann et al., 1982; Esposti Ongaro et al., 2006; Ogdenet al., 2007). Unfortunately, due to the large scale of the Vesuviusmodel, wewere unable to adopt themeter-size grid resolution neededfor capturing such jet structures. As a consequence, we simulated ourlarge-scale scenarios assuming inlet source conditions representativeof the expanded pressure-balanced jet, as derived by pre-computed2D high-resolution simulations and 1D steady-state approximations
Fig. 2. Simulation SIM1: (a) 3D view of 10−4 and 10−6 isosurfaces of total volume particle fracfraction, and (c) gas temperature after 200 s along a W–E section of the column (shown in
of the jet dynamics (Woods and Bower, 1995). We therefore did notinclude the crater topography in our large-scale simulations.
As an illustrative example of these jet flow patterns, we presentherein the decompression dynamics produced by our reference ventconditions for two different crater morphologies (Fig. 1). The shape ofthe volcano crater, like the nozzle geometry in industrial andaerospace devices, drastically influences the nature of overpressuredjets (Addy, 1981; Kieffer, 1984). In particular, the two simulations werecarried out using a high-resolution, 2D axisymmetric configuration ofthe PDAC code and assuming: 1) a crater with a 20° opening angle anda 200 m exit radius (Fig. 1a–c) and 2) a crater profile representing theaverage morphology of the present crater of Vesuvius, i.e. the GranCono formed after the last, 1944, eruption (Fig. 1d–f). The grid size wasequal to 2 m along the r-axis and 5 m along the z-axis and adequatelycaptured the main flow features.
Fig. 1 shows the colour contours of the total volume particlefraction, magnitude of the velocity vector, and normal Mach numberfor the two cases, 10 s after injection of the mixture into the at-mosphere. The normal Mach number is defined asMn ¼ Y
v � ∇YPc jj P j, where
v is the mixture velocity, c is the mixture speed of sound and P is thepressure; this number can be used to illustrate the complex structureof the jet (Lovely and Haimes, 1999). At 10 s, the flow reaches quasi-steady-state conditions, so that the plots in Fig. 1 also represents thetime-averaged pattern of the jet. Simulation results highlight the largevariations in jet structure as a function of crater shape. In particular,the crater with a 20° opening angle (Fig. 1a–c) produces a multiplereflection pattern, whereas the natural profile (Fig. 1d–f) producesnormal compressive shock (Mach disk) at a characteristic distancefrom the vent. These patterns can be explained in terms of transitionsfrom supersonic to subsonic regimes, and of different patterns ofshock wave reflection from the jet boundaries (Kieffer, 1984; EspostiOngaro et al., 2006; Ogden et al., 2007). Based on these results, it isevident that the jet is characterized by significant radial variations inflow parameters; therefore, steady-state 1D descriptions such as thosedeveloped by Woods and Bower (1995) cannot be accurate, particu-larly in the case of Mach disk formation (Ogden et al., 2007).
3.2. Pressure-balanced source conditions
The pressure-balanced conditions of the five large-scale numericalsimulations discussed hereafter are reported in Table 1. SIM3represents our reference simulation, and its source conditions werederived from the high-resolution 2D simulation results (describedabove and in Fig. 1) for a crater with a 20° opening angle. In this case,inlet conditions represent a pressure-balanced jet having the sameradius as the decompressed jet and the same average flow conditions
tions at 200 s; (b) colour contours of the base-10 logarithm of the total volume particleFig. 2a). See colour legends for concentrations and temperature values.
Fig. 3. Time-average vertical distribution of (a) mixture velocity and (b) density contrast(mixture-atmospheric density) sampled along the axis (dashed lines) of the SIM1volcanic column. Solid lines represent the time-averaged value of the same variablesaveraged over the jet cross-section. For all lines, horizontal bars indicate the standarddeviation of the oscillations.
382 T. Esposti Ongaro et al. / Journal of Volcanology and Geothermal Research 178 (2008) 378–396
over the jet cross-section (i.e. gas and particle velocities, assumedequals, particle concentration, and temperature). To avoid steepgradients on the vent rim, we imposed a power-law velocity profileinstead of a top-hat profile. As will be shown in the following sections,these conditions lead to the collapse of up to 65% of the mass of theeruptive column although a significantly lower amount (about 50%)reaches the ground due to effective particle re-entrainment in the jetand elutriation from the fountain margins (partial collapse). Thissimulation corresponds to Sim A of Neri et al. (2007).
SIM1 conditions were obtained by computing the free decom-pression of the jet in the atmosphere using the 1D, steady-state,pseudogas, adiabaticmodel ofWoods and Bower (1995).Wewill showthat these conditions represent an upper bound case in which all thecompression energy is converted adiabatically into kinetic energy.These conditions produce a convective column, with no generation ofPDCs.
SIM2 and SIM4 source conditions were derived from SIM3conditions by simply reducing or enlarging the inlet diameter,respectively (for a constant mixture density and mass flow rate).SIM2 conditions could be representative of a pressure-balanced jetproduced by a slightly narrower crater with respect to SIM3. As aresult, the inlet velocity is slightly higher than in SIM3.We will showthat these inlet conditions produce a regime of incipient collapse, inwhich up to a 50% of the mass feeding the column tend to collapse butonly a minimal part of it (less than 10%) reaches the ground due to theeffective re-entrainment and elutriation of particles.
In contrast, SIM4 conditions were computed assuming a majorincrease in crater diameter and an associated significant decrease ininlet velocity. These conditions could be representative of low-fountaining conditions or boiling-over type PDCs, which (as will beshown) are able to produce about 90% collapse of the mass of thecolumn (hereafter referred to as near-total collapse). In this casebasically all the mass that tends to collapse in the fountain is able toreach the ground and forms the PDCs. This simulation corresponds toSim B of Neri et al. (2007).
Lastly, SIM5 represents a possible upper bound scenario for theSub-Plinian I eruptive category characterized by a mass flow rate of8×107 kg/s. In this case, inlet conditions were obtained by simplyincreasing of 60% the vent velocity of SIM4 keeping all otherparameters constant. This assumption represents clearly an over-simplification of the source conditions but, given the uncertaintyaffecting the system, we believe it allows to have a first-orderassessment of the effect of mass flow rate on the eruption dynamics.Under these conditions, about 60% of the mass ejected tends tocollapse at the fountain top, increasing up to about 75% at the groundlevel due to the larger extension of the collapse region involving theentire fountain height.
In light of the complex dynamics of the jet and its non-linearrelationships with the crater shape, the adopted pressure-balancedsource conditions certainly represent a simplification. Nevertheless, forthe specific conditions considered herein, they are consistent with thedynamics of the jet and appear appropriate for a first-approximationanalysis of 3D column collapse mechanisms. In the following sections,simulation outcomes will be presented in numerical order to betterfollow the “classical” evolution of explosive eruptions at Vesuvius (Cioniet al., 2008-this issue). This is typically characterized by an initial periodin which the flow within the column is fully convective, followed byphases of possible partial and/or total collapse of the column. Note thatthe described series of simulations should not be considered torepresent a single continuous eruption but a series of regimes possiblyoccurring at different stages of the explosive eruption.
4. Computational parameters
The computational domain adopted in the large-scale simulationsextended 13 km in longitude (from 443,860 m to 456,860 m in UTM
33T coordinates), 11 km in latitude (from 4,513,340 m to 4,524,340 m)and up to 10 km vertically. The limited vertical extension of thedomain is due to the fact that the study focuses on the dynamics ofcolumn collapse rather than on the convective column. However, notethat the height of the top boundary does not significantly influencethe collapse dynamics, as confirmed by simulations with differentextensions of the vertical domain.
The domain was discretized into 215×185×160 computationalcells on a rectilinear, non-uniform grid. On the X–Y plane, a region of1.0×1.0 km2 around the source was discretized with uniform cells of20×20 m2. Outside this region, the resolution was increased at aconstant rate (equal to 1.05) up to 100 m in both the X and Ydirections. A uniform vertical discretization of 20 m was adoptedbelow 1.4 km (in order to include the entire topography of Vesuvius),and the size of vertical cells was increased at the same constant rate upto 100 m. These parameters were chosen in order to guarantee anaccurate description of flow features while maintaining a manageablecomputational load (see Esposti Ongaro et al., 2008, and appendixtherein for a detailed description of grid effects).
In the same coordinate system described above, the source center,i.e. the axis of the pressure-balanced jet, was located at (451,660 m;4,519,280 m). The discretization of the vent has an important effect onthe accuracy of the large-scale results, since it can give rise to lobesand spurious frequencies in the jet. To avoid these effects andsignificant numerical errors, a minimum of 10–12 elements must beused to describe the vent diameter (Suzuki et al., 2005; present study).Moreover, in order to accurately describe the circular vent with theCartesian grid, special rim cells were created inwhich the assigned gas
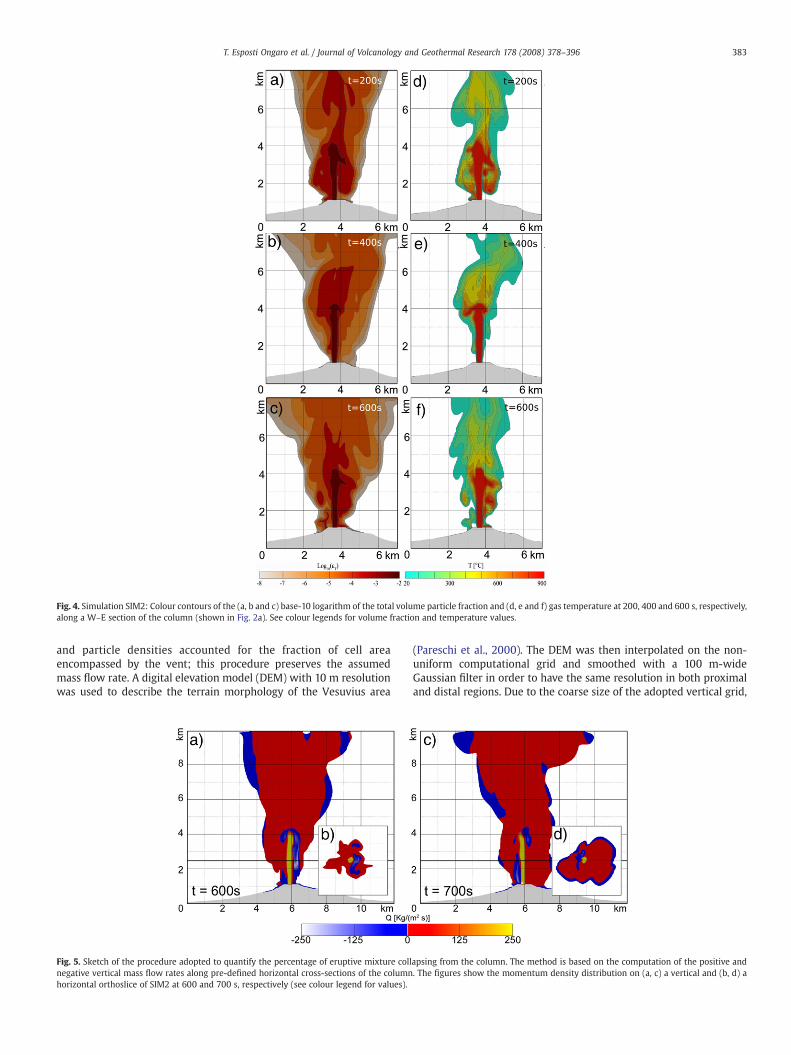
Fig. 4. Simulation SIM2: Colour contours of the (a, b and c) base-10 logarithm of the total volume particle fraction and (d, e and f) gas temperature at 200, 400 and 600 s, respectively,along a W–E section of the column (shown in Fig. 2a). See colour legends for volume fraction and temperature values.
383T. Esposti Ongaro et al. / Journal of Volcanology and Geothermal Research 178 (2008) 378–396
and particle densities accounted for the fraction of cell areaencompassed by the vent; this procedure preserves the assumedmass flow rate. A digital elevation model (DEM) with 10 m resolutionwas used to describe the terrain morphology of the Vesuvius area
Fig. 5. Sketch of the procedure adopted to quantify the percentage of eruptive mixture collnegative vertical mass flow rates along pre-defined horizontal cross-sections of the columnhorizontal orthoslice of SIM2 at 600 and 700 s, respectively (see colour legend for values).
(Pareschi et al., 2000). The DEM was then interpolated on the non-uniform computational grid and smoothed with a 100 m-wideGaussian filter in order to have the same resolution in both proximaland distal regions. Due to the coarse size of the adopted vertical grid,
apsing from the column. The method is based on the computation of the positive and. The figures show the momentum density distribution on (a, c) a vertical and (b, d) a
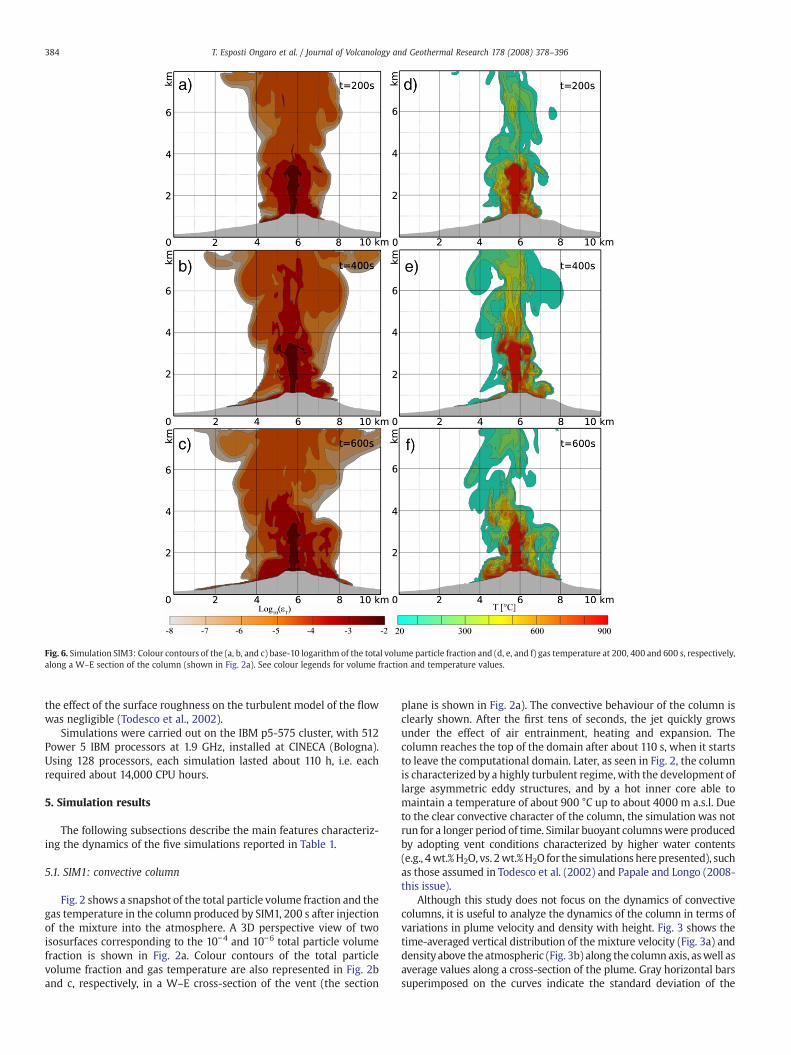
Fig. 6. Simulation SIM3: Colour contours of the (a, b, and c) base-10 logarithm of the total volume particle fraction and (d, e, and f) gas temperature at 200, 400 and 600 s, respectively,along a W–E section of the column (shown in Fig. 2a). See colour legends for volume fraction and temperature values.
384 T. Esposti Ongaro et al. / Journal of Volcanology and Geothermal Research 178 (2008) 378–396
the effect of the surface roughness on the turbulent model of the flowwas negligible (Todesco et al., 2002).
Simulations were carried out on the IBM p5-575 cluster, with 512Power 5 IBM processors at 1.9 GHz, installed at CINECA (Bologna).Using 128 processors, each simulation lasted about 110 h, i.e. eachrequired about 14,000 CPU hours.
5. Simulation results
The following subsections describe the main features characteriz-ing the dynamics of the five simulations reported in Table 1.
5.1. SIM1: convective column
Fig. 2 shows a snapshot of the total particle volume fraction and thegas temperature in the column produced by SIM1, 200 s after injectionof the mixture into the atmosphere. A 3D perspective view of twoisosurfaces corresponding to the 10−4 and 10−6 total particle volumefraction is shown in Fig. 2a. Colour contours of the total particlevolume fraction and gas temperature are also represented in Fig. 2band c, respectively, in a W–E cross-section of the vent (the section
plane is shown in Fig. 2a). The convective behaviour of the column isclearly shown. After the first tens of seconds, the jet quickly growsunder the effect of air entrainment, heating and expansion. Thecolumn reaches the top of the domain after about 110 s, when it startsto leave the computational domain. Later, as seen in Fig. 2, the columnis characterized by a highly turbulent regime, with the development oflarge asymmetric eddy structures, and by a hot inner core able tomaintain a temperature of about 900 °C up to about 4000 m a.s.l. Dueto the clear convective character of the column, the simulation was notrun for a longer period of time. Similar buoyant columnswere producedby adopting vent conditions characterized by higher water contents(e.g., 4wt.%H2O, vs. 2wt.%H2O for the simulations here presented), suchas those assumed in Todesco et al. (2002) and Papale and Longo (2008-this issue).
Although this study does not focus on the dynamics of convectivecolumns, it is useful to analyze the dynamics of the column in terms ofvariations in plume velocity and density with height. Fig. 3 shows thetime-averaged vertical distribution of the mixture velocity (Fig. 3a) anddensity above the atmospheric (Fig. 3b) along the column axis, aswell asaverage values along a cross-section of the plume. Gray horizontal barssuperimposed on the curves indicate the standard deviation of the
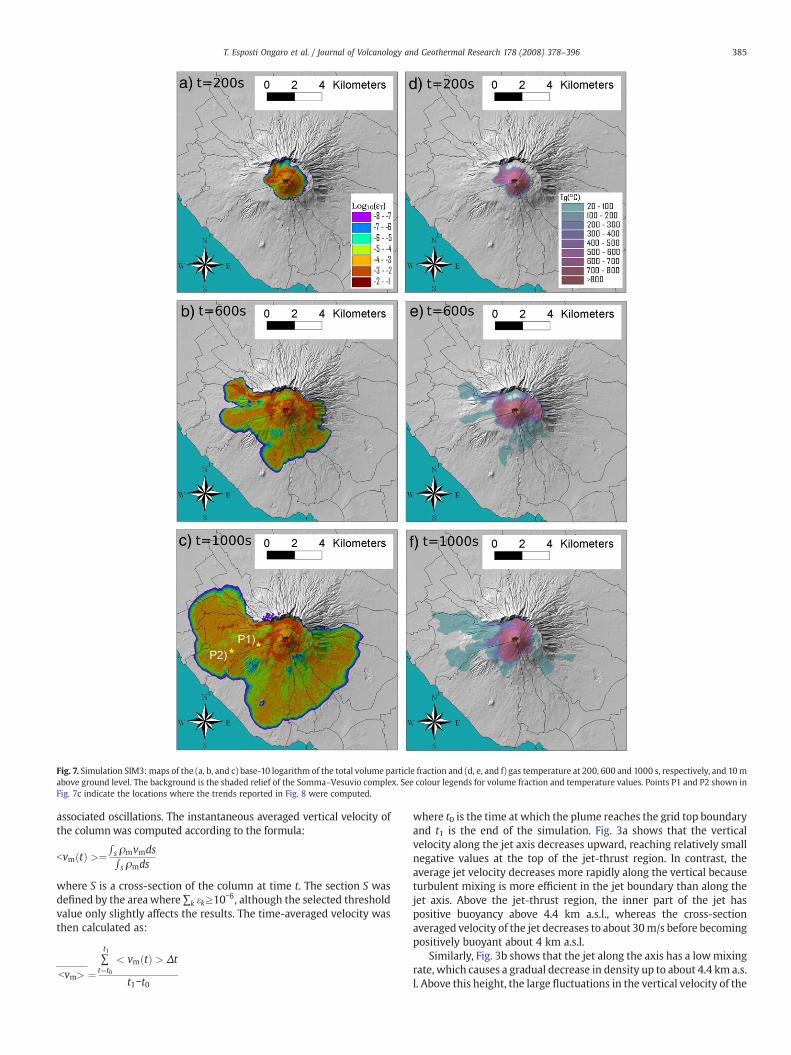
Fig. 7. Simulation SIM3:maps of the (a, b, and c) base-10 logarithm of the total volume particle fraction and (d, e, and f) gas temperature at 200, 600 and 1000 s, respectively, and 10mabove ground level. The background is the shaded relief of the Somma–Vesuvio complex. See colour legends for volume fraction and temperature values. Points P1 and P2 shown inFig. 7c indicate the locations where the trends reported in Fig. 8 were computed.
385T. Esposti Ongaro et al. / Journal of Volcanology and Geothermal Research 178 (2008) 378–396
associated oscillations. The instantaneous averaged vertical velocity ofthe columnwas computed according to the formula:
bvm tð Þ >¼ ∫ s ρmvmds∫ s ρmds
where S is a cross-section of the column at time t. The section S wasdefined by the areawhere ∑k ekz10−6, although the selected thresholdvalue only slightly affects the results. The time-averaged velocity wasthen calculated as:
bvm> ¼∑t1
t¼t0
< vm tð Þ > Δt
t1−t0
where t0 is the time at which the plume reaches the grid top boundaryand t1 is the end of the simulation. Fig. 3a shows that the verticalvelocity along the jet axis decreases upward, reaching relatively smallnegative values at the top of the jet-thrust region. In contrast, theaverage jet velocity decreases more rapidly along the vertical becauseturbulent mixing is more efficient in the jet boundary than along thejet axis. Above the jet-thrust region, the inner part of the jet haspositive buoyancy above 4.4 km a.s.l., whereas the cross-sectionaveraged velocity of the jet decreases to about 30m/s before becomingpositively buoyant about 4 km a.s.l.
Similarly, Fig. 3b shows that the jet along the axis has a lowmixingrate, which causes a gradual decrease in density up to about 4.4 km a.s.l. Above this height, the large fluctuations in the vertical velocity of the

386 T. Esposti Ongaro et al. / Journal of Volcanology and Geothermal Research 178 (2008) 378–396
mixture (see Fig. 3a) leads to intensemixing, which lowers the densityof the mixture below the atmospheric value, thereby forming acolumnwith positive buoyancy. In contrast, the mixture density alongthe jet boundary decreases more rapidly, so that the average cross-section curve approaches the atmospheric value about 3500 m a.s.l.
5.2. SIM2: incipient collapse
As shown in Table 1 and discussed above, simulation SIM2 wascharacterized by a lower inlet velocity, a slightly lower mixturedensity and a larger inlet radius than SIM1. All these variationsfavoured a shift in the eruptive regime toward collapse conditions.Fig. 4 shows the total particle volume fraction (a, b and c) and gastemperature (d, e and f) along a W–E cross-section through the vent200, 400 and 600 s after injection of the mixture into the atmosphere(the section plane is the same as in Fig. 2a).
The figure clearly shows the conditions of incipient collapse,characterized by the episodic release of mass batches from the upperregion of the fountain. These batches of mixture are uniformlydistributed around the fountain; their density is slightly higher thanthat of the atmosphere and their temperature can be as high as 700 °C.The periodicity of release of such batches of mass can vary from sometens of seconds up to 2–3 min. During the collapse, these batches arefurther diluted and often become re-entrained in the ascending jetbefore hitting the ground. In other cases, the batches of eruptivemixture are heavy enough to reach the ground and form dilute low-temperature, short-runout PDCs. In the case of SIM2, the PDC runoutdistance was no more than about 1 km. The less buoyant behaviour ofthe fountainwith respect to SIM1also produced a lower fountain height(or jet-thrust height) of about 3 km above the vent. The column alsoexhibits randomeccentricity, resulting invariable sectors being affectedpredominantly by the collapse from one time to the next (compareFig. 4a–c).
More quantitative information on the collapse regime of thecolumn was obtained by estimating the percentage of mass (withrespect to the mass erupted) that tends to collapse from the column.This was carried out through inspection of simulation outputs, i.e. byquantifying the positive and negative mass flow rates of the eruptivemixture across horizontal cross-sections of the fountain at different
Fig. 8. Simulation SIM3: temporal evolution of flow density, velocity and dynamic pressure 10source axis (point P1 of Fig. 7c), whereas plots d–f refer to a distal location about 4 km SW
heights. In Fig. 5 the positive (red to yellow) and negative (blue towhite) solid momentum densities (expressed in kg/(m2s)) at twodifferent times (600 and 700 s) are plotted on two orthoslices cuttingthe column along (a,c) a N–S vertical section and (b,d) a horizontalplane about 2500 m a.s.l. Fig. 5a and c clearly show the inner structureof the fountain: an upward-moving (vertical momentum positive)inner core surrounded by an asymmetric region made of collapsing(vertical momentum negative) batches of eruptive mixture, asdiscussed above. Similarly, Fig. 5b and d show the irregular innerhorizontal structure of the fountain at 600 and 700 s, respectively.
In order to synthesize information, the instantaneousflow rate datawere averaged over the entire simulation period. A “collapse region”was thus identified, approximately corresponding to the upper one-third portion of the fountain, where the positive flow rate rapidlydecreases toward the fountain top. The percentage of material thattends to collapse was estimated as the ratio between the maximumnegative (i.e. directed toward the ground) solid mass flow rate and thepositive solidmassflow rate at the source (vent). However, it should benoted that, in this collapse regime, the estimate of the collapsing massflow rate strongly depends on the location of the horizontal cross-section used to estimate the negative mass flow rate, since the collap-sing stream is subject to a vigorous air entrainment and because part ofthe material is re-entrained into the ascending jet.
In this specific case (SIM2), the maximum negative mass flow rateis about 50% of the mass flow rate leaving the source, and it reduces toless than 10% at the ground level.
5.3. SIM3: partial collapse
SIM3was selected as the reference simulation, and inlet conditionswere derived from the 2D high-resolution simulation of the decom-pression of the eruptive mixture in a narrow crater with a 20° openingangle (see Section 3.1). With respect to SIM2, SIM3 is characterized bya lower inlet velocity and a larger inlet radius, whereas the ventmixture density andmass flow rate remain the same. These conditionsshift the style of the column toward the collapse regime.
Fig. 6 shows the general behaviour of the column in threesnapshots of the total particle volume fraction and gas temperature200, 400 and 600 s after injection of the mixture into the atmosphere.
and 30m above ground level. Plots a–c refer to a proximal location about 2 km from theof the source (point P2 of Fig. 7c).
387T. Esposti Ongaro et al. / Journal of Volcanology and Geothermal Research 178 (2008) 378–396
Figure parameters are the same as in Fig. 4.With respect to SIM2, SIM3is characterized by a quasi-continuous collapse and formation of PDCs.Nevertheless, the collapsing stream of the fountain and the associatedre-entrainment of pyroclasts into the ascending jet effectivelydestabilize the column, which displays a marked oscillatory beha-viour. As for SIM2, the column regime is characterized by asymmetriccollapse of discrete but in this case more frequent batches of eruptivematerial in all directions around the axis of the fountain (producing atime-averaged quasi-axisymmetric collapse pattern). Inspection of thedynamics of the fountain reveals that the inner, denser part of thecolumn oscillates between 3 and 4 km a.s.l., and that the recirculationeffect of the collapse of material into the jet continuously modifies theshape of the fountain, so that it becomes asymmetric andunsteady (seealso Neri et al., 2007). Compared to SIM1 and SIM2, the fountain heightin SIM3 is significantly lower and more unstable. Velocity along thefountain also appears to significantly oscillate as a function of altitude,with a period of 20 to 50 s (Neri et al., 2007). The overall plume showstemporal changes in symmetry, including slight inclination of thejet one way or another even in this situation where atmosphericwinds are zero.
Themethod described previously was used to quantify the degree ofcollapse of the column; results show that up to 65% of the mass leavingthe vent tends to collapse (at about an altitude of 2500m a.s.l, i.e. at the
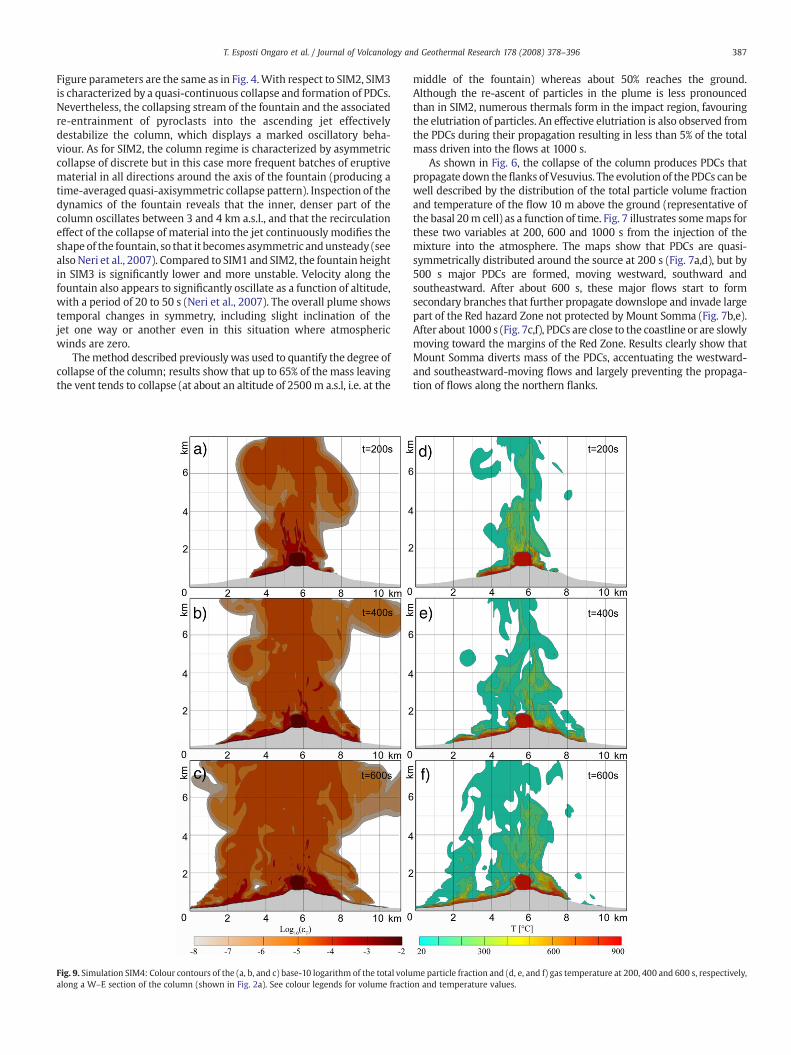
Fig. 9. Simulation SIM4: Colour contours of the (a, b, and c) base-10 logarithm of the total volualong a W–E section of the column (shown in Fig. 2a). See colour legends for volume fracti
middle of the fountain) whereas about 50% reaches the ground.Although the re-ascent of particles in the plume is less pronouncedthan in SIM2, numerous thermals form in the impact region, favouringthe elutriation of particles. An effective elutriation is also observed fromthe PDCs during their propagation resulting in less than 5% of the totalmass driven into the flows at 1000 s.
As shown in Fig. 6, the collapse of the column produces PDCs thatpropagate down theflanks of Vesuvius. The evolution of the PDCs can bewell described by the distribution of the total particle volume fractionand temperature of the flow 10 m above the ground (representative ofthe basal 20m cell) as a function of time. Fig. 7 illustrates somemaps forthese two variables at 200, 600 and 1000 s from the injection of themixture into the atmosphere. The maps show that PDCs are quasi-symmetrically distributed around the source at 200 s (Fig. 7a,d), but by500 s major PDCs are formed, moving westward, southward andsoutheastward. After about 600 s, these major flows start to formsecondary branches that further propagate downslope and invade largepart of the Red hazard Zone not protected by Mount Somma (Fig. 7b,e).After about 1000 s (Fig. 7c,f), PDCs are close to the coastline or are slowlymoving toward the margins of the Red Zone. Results clearly show thatMount Somma diverts mass of the PDCs, accentuating the westward-and southeastward-moving flows and largely preventing the propaga-tion of flows along the northern flanks.
me particle fraction and (d, e, and f) gas temperature at 200, 400 and 600 s, respectively,on and temperature values.
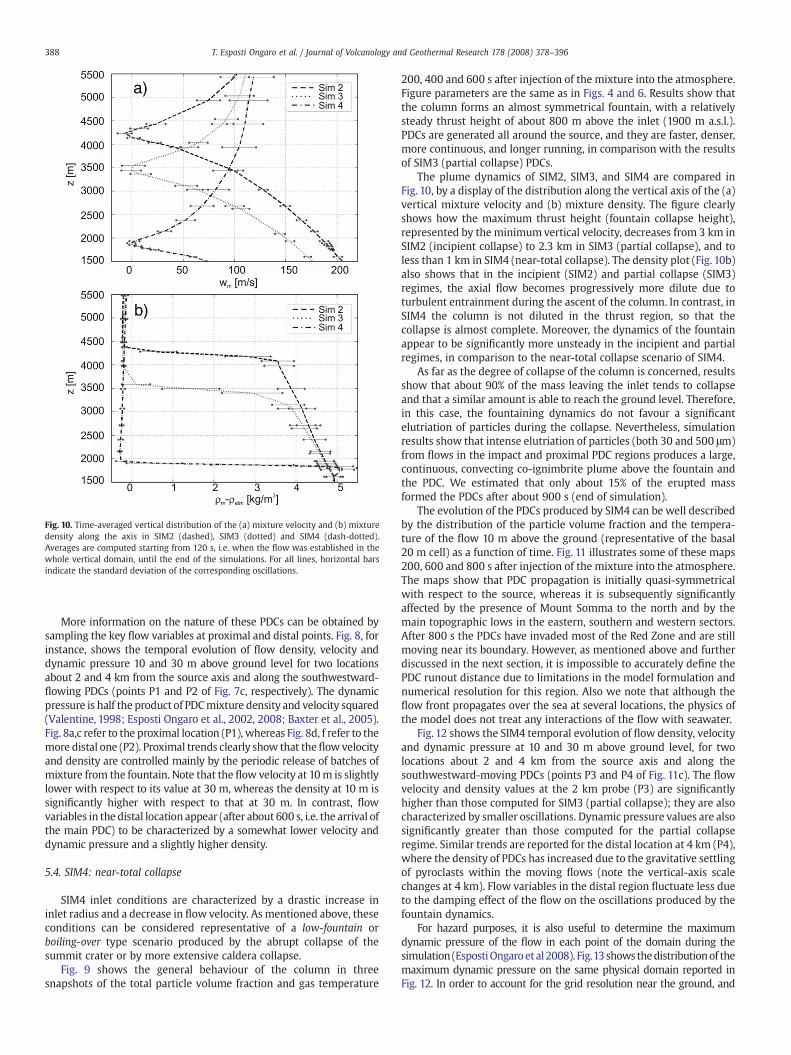
Fig. 10. Time-averaged vertical distribution of the (a) mixture velocity and (b) mixturedensity along the axis in SIM2 (dashed), SIM3 (dotted) and SIM4 (dash-dotted).Averages are computed starting from 120 s, i.e. when the flow was established in thewhole vertical domain, until the end of the simulations. For all lines, horizontal barsindicate the standard deviation of the corresponding oscillations.
388 T. Esposti Ongaro et al. / Journal of Volcanology and Geothermal Research 178 (2008) 378–396
More information on the nature of these PDCs can be obtained bysampling the key flow variables at proximal and distal points. Fig. 8, forinstance, shows the temporal evolution of flow density, velocity anddynamic pressure 10 and 30 m above ground level for two locationsabout 2 and 4 km from the source axis and along the southwestward-flowing PDCs (points P1 and P2 of Fig. 7c, respectively). The dynamicpressure is half the product of PDCmixture density and velocity squared(Valentine, 1998; Esposti Ongaro et al., 2002, 2008; Baxter et al., 2005).Fig. 8a,c refer to the proximal location (P1), whereas Fig. 8d, f refer to themore distal one (P2). Proximal trends clearly show that theflowvelocityand density are controlled mainly by the periodic release of batches ofmixture from the fountain. Note that the flow velocity at 10m is slightlylower with respect to its value at 30 m, whereas the density at 10 m issignificantly higher with respect to that at 30 m. In contrast, flowvariables in the distal location appear (after about 600 s, i.e. the arrival ofthe main PDC) to be characterized by a somewhat lower velocity anddynamic pressure and a slightly higher density.
5.4. SIM4: near-total collapse
SIM4 inlet conditions are characterized by a drastic increase ininlet radius and a decrease in flow velocity. As mentioned above, theseconditions can be considered representative of a low-fountain orboiling-over type scenario produced by the abrupt collapse of thesummit crater or by more extensive caldera collapse.
Fig. 9 shows the general behaviour of the column in threesnapshots of the total particle volume fraction and gas temperature
200, 400 and 600 s after injection of the mixture into the atmosphere.Figure parameters are the same as in Figs. 4 and 6. Results show thatthe column forms an almost symmetrical fountain, with a relativelysteady thrust height of about 800 m above the inlet (1900 m a.s.l.).PDCs are generated all around the source, and they are faster, denser,more continuous, and longer running, in comparison with the resultsof SIM3 (partial collapse) PDCs.
The plume dynamics of SIM2, SIM3, and SIM4 are compared inFig. 10, by a display of the distribution along the vertical axis of the (a)vertical mixture velocity and (b) mixture density. The figure clearlyshows how the maximum thrust height (fountain collapse height),represented by the minimumvertical velocity, decreases from 3 km inSIM2 (incipient collapse) to 2.3 km in SIM3 (partial collapse), and toless than 1 km in SIM4 (near-total collapse). The density plot (Fig. 10b)also shows that in the incipient (SIM2) and partial collapse (SIM3)regimes, the axial flow becomes progressively more dilute due toturbulent entrainment during the ascent of the column. In contrast, inSIM4 the column is not diluted in the thrust region, so that thecollapse is almost complete. Moreover, the dynamics of the fountainappear to be significantly more unsteady in the incipient and partialregimes, in comparison to the near-total collapse scenario of SIM4.
As far as the degree of collapse of the column is concerned, resultsshow that about 90% of the mass leaving the inlet tends to collapseand that a similar amount is able to reach the ground level. Therefore,in this case, the fountaining dynamics do not favour a significantelutriation of particles during the collapse. Nevertheless, simulationresults show that intense elutriation of particles (both 30 and 500 μm)from flows in the impact and proximal PDC regions produces a large,continuous, convecting co-ignimbrite plume above the fountain andthe PDC. We estimated that only about 15% of the erupted massformed the PDCs after about 900 s (end of simulation).
The evolution of the PDCs produced by SIM4 can be well describedby the distribution of the particle volume fraction and the tempera-ture of the flow 10 m above the ground (representative of the basal20 m cell) as a function of time. Fig. 11 illustrates some of these maps200, 600 and 800 s after injection of the mixture into the atmosphere.The maps show that PDC propagation is initially quasi-symmetricalwith respect to the source, whereas it is subsequently significantlyaffected by the presence of Mount Somma to the north and by themain topographic lows in the eastern, southern and western sectors.After 800 s the PDCs have invaded most of the Red Zone and are stillmoving near its boundary. However, as mentioned above and furtherdiscussed in the next section, it is impossible to accurately define thePDC runout distance due to limitations in the model formulation andnumerical resolution for this region. Also we note that although theflow front propagates over the sea at several locations, the physics ofthe model does not treat any interactions of the flow with seawater.
Fig. 12 shows the SIM4 temporal evolution of flow density, velocityand dynamic pressure at 10 and 30 m above ground level, for twolocations about 2 and 4 km from the source axis and along thesouthwestward-moving PDCs (points P3 and P4 of Fig. 11c). The flowvelocity and density values at the 2 km probe (P3) are significantlyhigher than those computed for SIM3 (partial collapse); they are alsocharacterized by smaller oscillations. Dynamic pressure values are alsosignificantly greater than those computed for the partial collapseregime. Similar trends are reported for the distal location at 4 km (P4),where the density of PDCs has increased due to the gravitative settlingof pyroclasts within the moving flows (note the vertical-axis scalechanges at 4 km). Flow variables in the distal region fluctuate less dueto the damping effect of the flow on the oscillations produced by thefountain dynamics.
For hazard purposes, it is also useful to determine the maximumdynamic pressure of the flow in each point of the domain during thesimulation (EspostiOngaroet al2008). Fig.13 shows thedistributionof themaximum dynamic pressure on the same physical domain reported inFig. 12. In order to account for the grid resolution near the ground, and
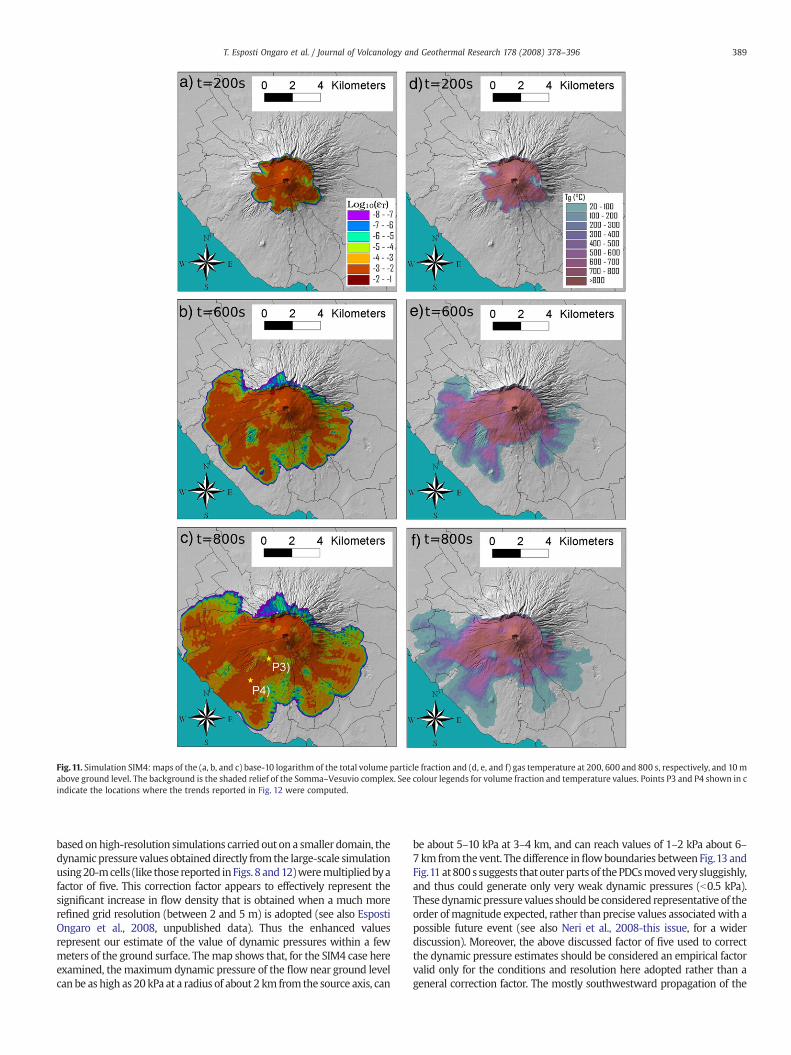
Fig.11. Simulation SIM4: maps of the (a, b, and c) base-10 logarithm of the total volume particle fraction and (d, e, and f) gas temperature at 200, 600 and 800 s, respectively, and 10mabove ground level. The background is the shaded relief of the Somma–Vesuvio complex. See colour legends for volume fraction and temperature values. Points P3 and P4 shown in cindicate the locations where the trends reported in Fig. 12 were computed.
389T. Esposti Ongaro et al. / Journal of Volcanology and Geothermal Research 178 (2008) 378–396
based on high-resolution simulations carried out on a smaller domain, thedynamic pressure values obtaineddirectly from the large-scale simulationusing20-mcells (like those reported in Figs. 8 and12)weremultipliedbyafactor of five. This correction factor appears to effectively represent thesignificant increase in flow density that is obtained when a much morerefined grid resolution (between 2 and 5 m) is adopted (see also EspostiOngaro et al., 2008, unpublished data). Thus the enhanced valuesrepresent our estimate of the value of dynamic pressures within a fewmeters of the ground surface. Themap shows that, for the SIM4 case hereexamined, themaximum dynamic pressure of the flow near ground levelcan be as high as 20 kPa at a radius of about 2 km from the source axis, can
be about 5–10 kPa at 3–4 km, and can reach values of 1–2 kPa about 6–7 km from the vent. The difference inflowboundaries between Fig.13 andFig.11 at 800 s suggests thatouterparts of thePDCsmovedvery sluggishly,and thus could generate only very weak dynamic pressures (b0.5 kPa).Thesedynamicpressure values shouldbe considered representative of theorder ofmagnitude expected, rather than precise values associatedwith apossible future event (see also Neri et al., 2008-this issue, for a widerdiscussion). Moreover, the above discussed factor of five used to correctthe dynamic pressure estimates should be considered an empirical factorvalid only for the conditions and resolution here adopted rather than ageneral correction factor. The mostly southwestward propagation of the
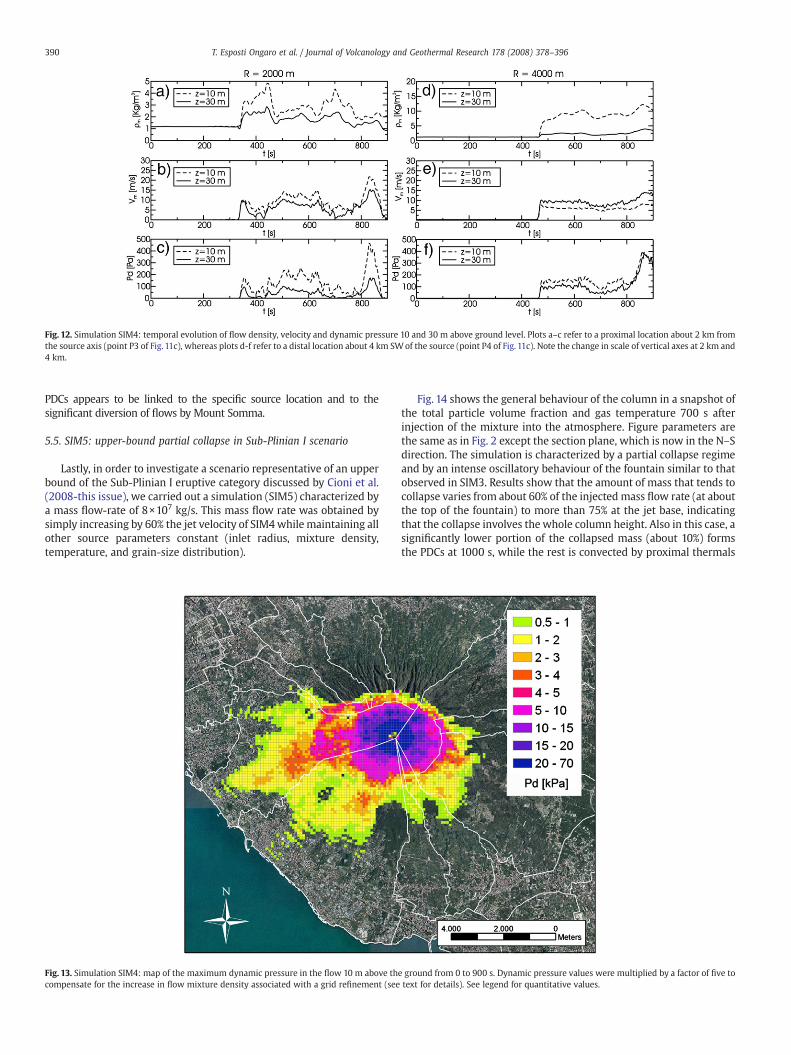
Fig. 12. Simulation SIM4: temporal evolution of flow density, velocity and dynamic pressure 10 and 30 m above ground level. Plots a–c refer to a proximal location about 2 km fromthe source axis (point P3 of Fig. 11c), whereas plots d-f refer to a distal location about 4 km SWof the source (point P4 of Fig. 11c). Note the change in scale of vertical axes at 2 km and4 km.
390 T. Esposti Ongaro et al. / Journal of Volcanology and Geothermal Research 178 (2008) 378–396
PDCs appears to be linked to the specific source location and to thesignificant diversion of flows by Mount Somma.
5.5. SIM5: upper-bound partial collapse in Sub-Plinian I scenario
Lastly, in order to investigate a scenario representative of an upperbound of the Sub-Plinian I eruptive category discussed by Cioni et al.(2008-this issue), we carried out a simulation (SIM5) characterized bya mass flow-rate of 8×10⁷ kg/s. This mass flow rate was obtained bysimply increasing by 60% the jet velocity of SIM4while maintaining allother source parameters constant (inlet radius, mixture density,temperature, and grain-size distribution).
Fig. 13. Simulation SIM4: map of the maximum dynamic pressure in the flow 10 m above thcompensate for the increase in flow mixture density associated with a grid refinement (see
Fig. 14 shows the general behaviour of the column in a snapshot ofthe total particle volume fraction and gas temperature 700 s afterinjection of the mixture into the atmosphere. Figure parameters arethe same as in Fig. 2 except the section plane, which is now in the N–Sdirection. The simulation is characterized by a partial collapse regimeand by an intense oscillatory behaviour of the fountain similar to thatobserved in SIM3. Results show that the amount of mass that tends tocollapse varies from about 60% of the injected mass flow rate (at aboutthe top of the fountain) to more than 75% at the jet base, indicatingthat the collapse involves the whole column height. Also in this case, asignificantly lower portion of the collapsed mass (about 10%) formsthe PDCs at 1000 s, while the rest is convected by proximal thermals
e ground from 0 to 900 s. Dynamic pressure values were multiplied by a factor of five totext for details). See legend for quantitative values.

Fig. 14. Simulation SIM5: (a) 3D view of 10−4 and 10−6 isosurfaces of total volume particle fractions at 700 s; (b) colour contours of the base-10 logarithm of the total volume particlefraction and (c) gas temperature at 700 s along a N–S section of the column (shown in (a)). See colour legends for concentration and temperature values.
391T. Esposti Ongaro et al. / Journal of Volcanology and Geothermal Research 178 (2008) 378–396
and co-ignimbrite plumes. In SIM5, Mount Somma is again aneffective barrier to the propagation of PDCs along the northernslope, although minor dilute, low velocity PDCs occasionally flow overthe eastern rim of Mount Somma.
6. Discussion
6.1. Collapse dynamics
The mechanisms controlling the dynamics of column collapse wereinvestigated through a set of transient 3D numerical simulations,adopting source conditions at the crater representative of a Sub-Plinian Iscenario at Vesuvius. The simulations were designed to characterize thedifferent styles and intensities of column collapse, in order to improveour understanding of the transition between fully convective and fullycollapsing regimes, and of the implications of transitional dynamics onthe eruption hazards. In the completed simulations, the transitionbetween eruptive styles was produced by varying the source (vent)diameter and flow velocity, while maintaining as constant the watercontent of the eruptivemixture. Furtherworkwill be required to extendthe results to more general variations in source conditions.
The 3D simulations provide new evidence for the existence of animportant transitional regime that separates the fully convective andfully collapsing regimes. This transitional regime is characterized by
the contemporaneous presence of a buoyant convective plume and acollapsing stream that feeds the PDCs. The possibility of such a regime,already postulated on the basis of laboratory experiments (e.g., Careyet al., 1988; Dellino et al., 2007a), stratigraphic evidence (e.g., Wilsonand Hildreth, 1997; Di Muro et al., 2004) and 2D/3D numericalmodelling results (Neri and Dobran, 1994; Neri et al., 1998; Clarke etal., 2002; Suzuki et al., 2005), was here reproduced for the first time bya transient 3Dmultiphase flowmodel. Results clearly show that such atransitional regime can be characterized by different degrees ofcollapse (i.e. from incipient to near-total collapse, with a likely smoothtransition between the two) as a function of the relative amount ofmass that tends to collapse or to reach the ground.
According to our simulation results, in this regime the column ischaracterized by an inner jet of dense fluid that only slowly dilutes dueto the inefficient entrainment of atmospheric air.
Once the jet has lost its momentum, a variable amount of mass (50to 90% of the mass injected in our simulations, depending on thesimulation parameters) tends to collapse from the jet top andboundary and form downward-flowing streams or batches of fluid,producing a fountain more or less surrounding the region of upflow.Thismechanism effectively destabilizes the column, which displays anoscillatory behaviour that is in part induced by the unsteady recyclingof collapsed material into the rising jet. Simulations reveal additionalcomplexities, for example how the effective entrainment of air affects
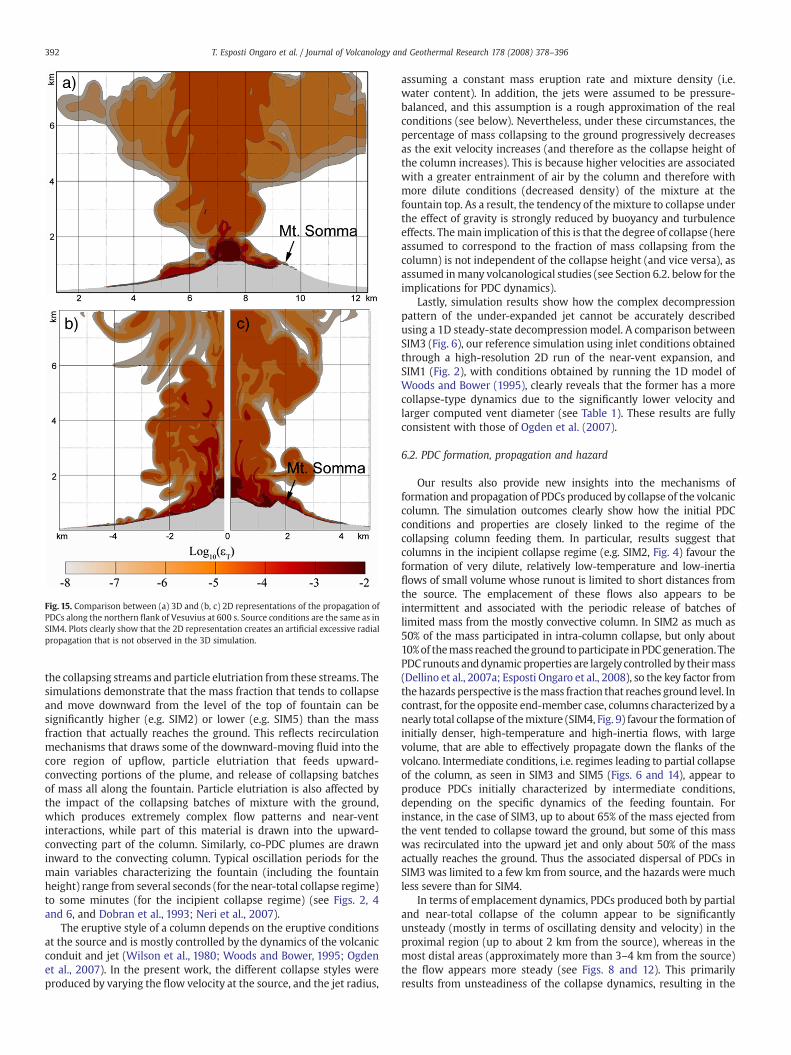
Fig. 15. Comparison between (a) 3D and (b, c) 2D representations of the propagation ofPDCs along the northern flank of Vesuvius at 600 s. Source conditions are the same as inSIM4. Plots clearly show that the 2D representation creates an artificial excessive radialpropagation that is not observed in the 3D simulation.
392 T. Esposti Ongaro et al. / Journal of Volcanology and Geothermal Research 178 (2008) 378–396
the collapsing streams and particle elutriation from these streams. Thesimulations demonstrate that the mass fraction that tends to collapseand move downward from the level of the top of fountain can besignificantly higher (e.g. SIM2) or lower (e.g. SIM5) than the massfraction that actually reaches the ground. This reflects recirculationmechanisms that draws some of the downward-moving fluid into thecore region of upflow, particle elutriation that feeds upward-convecting portions of the plume, and release of collapsing batchesof mass all along the fountain. Particle elutriation is also affected bythe impact of the collapsing batches of mixture with the ground,which produces extremely complex flow patterns and near-ventinteractions, while part of this material is drawn into the upward-convecting part of the column. Similarly, co-PDC plumes are drawninward to the convecting column. Typical oscillation periods for themain variables characterizing the fountain (including the fountainheight) range from several seconds (for the near-total collapse regime)to some minutes (for the incipient collapse regime) (see Figs. 2, 4and 6, and Dobran et al., 1993; Neri et al., 2007).
The eruptive style of a column depends on the eruptive conditionsat the source and is mostly controlled by the dynamics of the volcanicconduit and jet (Wilson et al., 1980; Woods and Bower, 1995; Ogdenet al., 2007). In the present work, the different collapse styles wereproduced by varying the flow velocity at the source, and the jet radius,
assuming a constant mass eruption rate and mixture density (i.e.water content). In addition, the jets were assumed to be pressure-balanced, and this assumption is a rough approximation of the realconditions (see below). Nevertheless, under these circumstances, thepercentage of mass collapsing to the ground progressively decreasesas the exit velocity increases (and therefore as the collapse height ofthe column increases). This is because higher velocities are associatedwith a greater entrainment of air by the column and therefore withmore dilute conditions (decreased density) of the mixture at thefountain top. As a result, the tendency of themixture to collapse underthe effect of gravity is strongly reduced by buoyancy and turbulenceeffects. Themain implication of this is that the degree of collapse (hereassumed to correspond to the fraction of mass collapsing from thecolumn) is not independent of the collapse height (and vice versa), asassumed inmany volcanological studies (see Section 6.2. below for theimplications for PDC dynamics).
Lastly, simulation results show how the complex decompressionpattern of the under-expanded jet cannot be accurately describedusing a 1D steady-state decompression model. A comparison betweenSIM3 (Fig. 6), our reference simulation using inlet conditions obtainedthrough a high-resolution 2D run of the near-vent expansion, andSIM1 (Fig. 2), with conditions obtained by running the 1D model ofWoods and Bower (1995), clearly reveals that the former has a morecollapse-type dynamics due to the significantly lower velocity andlarger computed vent diameter (see Table 1). These results are fullyconsistent with those of Ogden et al. (2007).
6.2. PDC formation, propagation and hazard
Our results also provide new insights into the mechanisms offormation and propagation of PDCs produced by collapse of the volcaniccolumn. The simulation outcomes clearly show how the initial PDCconditions and properties are closely linked to the regime of thecollapsing column feeding them. In particular, results suggest thatcolumns in the incipient collapse regime (e.g. SIM2, Fig. 4) favour theformation of very dilute, relatively low-temperature and low-inertiaflows of small volume whose runout is limited to short distances fromthe source. The emplacement of these flows also appears to beintermittent and associated with the periodic release of batches oflimited mass from the mostly convective column. In SIM2 as much as50% of the mass participated in intra-column collapse, but only about10%of themass reached theground toparticipate inPDCgeneration. ThePDCrunouts anddynamic properties are largely controlled by theirmass(Dellino et al., 2007a; Esposti Ongaro et al., 2008), so the key factor fromthehazards perspective is themass fraction that reaches ground level. Incontrast, for the opposite end-member case, columns characterized by anearly total collapse of themixture (SIM4, Fig. 9) favour the formation ofinitially denser, high-temperature and high-inertia flows, with largevolume, that are able to effectively propagate down the flanks of thevolcano. Intermediate conditions, i.e. regimes leading to partial collapseof the column, as seen in SIM3 and SIM5 (Figs. 6 and 14), appear toproduce PDCs initially characterized by intermediate conditions,depending on the specific dynamics of the feeding fountain. Forinstance, in the case of SIM3, up to about 65% of the mass ejected fromthe vent tended to collapse toward the ground, but some of this masswas recirculated into the upward jet and only about 50% of the massactually reaches the ground. Thus the associated dispersal of PDCs inSIM3 was limited to a few km from source, and the hazards were muchless severe than for SIM4.
In terms of emplacement dynamics, PDCs produced both by partialand near-total collapse of the column appear to be significantlyunsteady (mostly in terms of oscillating density and velocity) in theproximal region (up to about 2 km from the source), whereas in themost distal areas (approximately more than 3–4 km from the source)the flow appears more steady (see Figs. 8 and 12). This primarilyresults from unsteadiness of the collapse dynamics, resulting in the
393T. Esposti Ongaro et al. / Journal of Volcanology and Geothermal Research 178 (2008) 378–396
feeding of PDCs in batches. The batch-like character of the PDCsbecomes damped out with distance from the source. The flows appearto propagate initially under the thrust of the mass batches released bythe fountain, and then become PDCs s.s., propagating under thedominant effect of gravity, with the progressive aggradation ofparticles at the base of the flow.
A significant portion of particles forming the flows appears to beelutriated during their propagation as thermals and phoenix (co-ignimbrite, or CO-pdc) clouds, as testified by the significantly loweramount of mass forming the PDCs with respect to that initiallycollapsed to the ground. For instance, for the case of near-totalcollapse (SIM4), it was estimated that more than 50% of the eruptedmassmay be elutriated and convected away during flow emplacementalthough such estimates will largely depend on the collapse regimeand adopted initial grain-size distribution. This result appears to besemi-quantitatively consistent with first-order independent estimatesof the amount of mass elutriated based on field observations (SparksandWalker, 1977; Branney and Kokelaar, 2002) and suggests the needto further investigate fallout dispersal and hazard from co-ignimbriteplumes in the future.
Our 3D simulations provide new insights into the areas possiblyaffected by PDCs and related hazards. As clearly shown by thesimulations, PDC propagation is strongly affected by the presence ofMount Somma — the main 3D topographic feature other than thevolcanic cone. In all the simulations presented herein, including SIM5(an upper bound partial collapse scenario), Mount Somma is able tosignificantly reduce the propagation of PDCs in the northern sector. Itstopographic relief favours the blocking of PDCs, favouring localsedimentation within the caldera trough, and the deflection of PDCsalong the Mount Somma rim, i.e. toward the west or southeast. Oursimulations suggest that only low-inertia and low-temperature flowsare able to spill over the rim of Mount Somma, with a limited massthat constrains the runout. This is an important finding that derivesdirectly from the 3D representation of the process. Similar influencesof 3D topography has been reported for Mount St Helens andBezymianny ((Valentine, 1987, Belousov et al., 2002, 2007). However,we note that all simulations assumed a central vent located in theposition of the present Gran Cono and that the sensitivity of results tothe inlet location should be addressed in future works.
Our modelling illustrates also how 2D representations of PDCdynamics can be misleading. Fig. 15 shows (a) 3D and (b, c) 2Drepresentations of PDC propagation along the volcano flanks. Sourceconditions and simulation run times (600 s) are the same in all cases andare identical to those in SIM4. This comparison clearly reveals how the2D approximation artificially forces a radial propagation of the PDCstowards the north (Fig. 15c), thereby hindering any azimuthal flow thatwould be produced by blocking topography in 3D (Fig.15a). Thus the 3Dmodelling suggests that the hazards on the north flank are less severethan implied by the 2Dmodels (Todesco et al., 2002). Of course, as notedabove, we cannot exclude that different source conditions, mixtureproperties, or vent locations could favour a more substantial flow overMount Somma, and from a practical point of view and consideration ofadditional hazards (ballistics, fallout) the north flank must be retainedwithin a high hazard zone.
In contrast, PDC propagation along the southern sector appears tobe less affected by the volcano topography due to the lack of importanttopographic highs. Nevertheless, PDC emplacement appears to beinfluenced by terrain morphology. For example, remnants of theSomma edifice tend to deviate local flows mostly southwestward (seeFig.11). In addition,Mount Somma blocksmost of the flowage towardsthe north, and much of this flow mass is then diverted westward andsoutheastward increasing the mass of PDCs in these sectors andcontributing to the long runouts (see Figs. 7 and 11). The additionalmass of flow to the west also contributes to the development of somestrong distributary lobes of PDCs in thewest-southwest and southeast(Fig. 11).
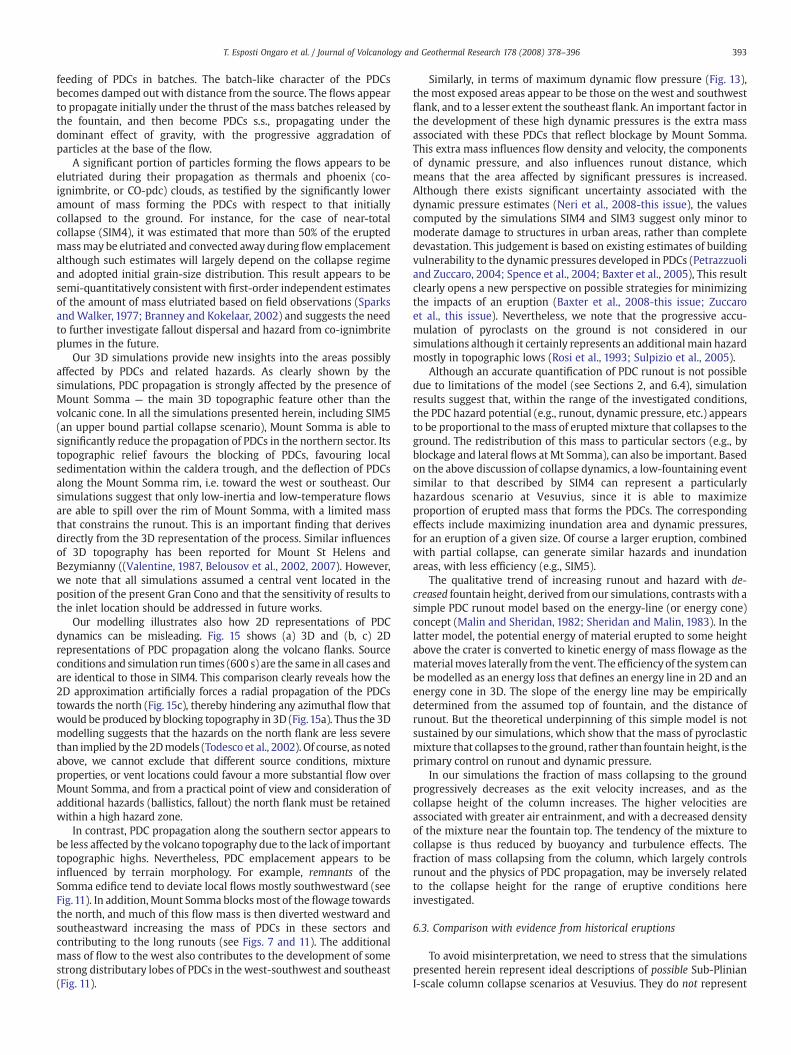
Similarly, in terms of maximum dynamic flow pressure (Fig. 13),the most exposed areas appear to be those on the west and southwestflank, and to a lesser extent the southeast flank. An important factor inthe development of these high dynamic pressures is the extra massassociated with these PDCs that reflect blockage by Mount Somma.This extra mass influences flow density and velocity, the componentsof dynamic pressure, and also influences runout distance, whichmeans that the area affected by significant pressures is increased.Although there exists significant uncertainty associated with thedynamic pressure estimates (Neri et al., 2008-this issue), the valuescomputed by the simulations SIM4 and SIM3 suggest only minor tomoderate damage to structures in urban areas, rather than completedevastation. This judgement is based on existing estimates of buildingvulnerability to the dynamic pressures developed in PDCs (Petrazzuoliand Zuccaro, 2004; Spence et al., 2004; Baxter et al., 2005), This resultclearly opens a new perspective on possible strategies for minimizingthe impacts of an eruption (Baxter et al., 2008-this issue; Zuccaroet al., this issue). Nevertheless, we note that the progressive accu-mulation of pyroclasts on the ground is not considered in oursimulations although it certainly represents an additional main hazardmostly in topographic lows (Rosi et al., 1993; Sulpizio et al., 2005).
Although an accurate quantification of PDC runout is not possibledue to limitations of the model (see Sections 2, and 6.4), simulationresults suggest that, within the range of the investigated conditions,the PDC hazard potential (e.g., runout, dynamic pressure, etc.) appearsto be proportional to the mass of eruptedmixture that collapses to theground. The redistribution of this mass to particular sectors (e.g., byblockage and lateral flows at Mt Somma), can also be important. Basedon the above discussion of collapse dynamics, a low-fountaining eventsimilar to that described by SIM4 can represent a particularlyhazardous scenario at Vesuvius, since it is able to maximizeproportion of erupted mass that forms the PDCs. The correspondingeffects include maximizing inundation area and dynamic pressures,for an eruption of a given size. Of course a larger eruption, combinedwith partial collapse, can generate similar hazards and inundationareas, with less efficiency (e.g., SIM5).
The qualitative trend of increasing runout and hazard with de-creased fountain height, derived fromour simulations, contrasts with asimple PDC runout model based on the energy-line (or energy cone)concept (Malin and Sheridan, 1982; Sheridan and Malin, 1983). In thelatter model, the potential energy of material erupted to some heightabove the crater is converted to kinetic energy of mass flowage as thematerialmoves laterally from the vent. The efficiency of the systemcanbe modelled as an energy loss that defines an energy line in 2D and anenergy cone in 3D. The slope of the energy line may be empiricallydetermined from the assumed top of fountain, and the distance ofrunout. But the theoretical underpinning of this simple model is notsustained by our simulations, which show that the mass of pyroclasticmixture that collapses to the ground, rather than fountain height, is theprimary control on runout and dynamic pressure.
In our simulations the fraction of mass collapsing to the groundprogressively decreases as the exit velocity increases, and as thecollapse height of the column increases. The higher velocities areassociated with greater air entrainment, and with a decreased densityof the mixture near the fountain top. The tendency of the mixture tocollapse is thus reduced by buoyancy and turbulence effects. Thefraction of mass collapsing from the column, which largely controlsrunout and the physics of PDC propagation, may be inversely relatedto the collapse height for the range of eruptive conditions hereinvestigated.
6.3. Comparison with evidence from historical eruptions
To avoid misinterpretation, we need to stress that the simulationspresented herein represent ideal descriptions of possible Sub-PlinianI-scale column collapse scenarios at Vesuvius. They do not represent
394 T. Esposti Ongaro et al. / Journal of Volcanology and Geothermal Research 178 (2008) 378–396
any specific past eruption, or anticipated future eruption, of Vesuvius.Instead, the simulations are intended as a tool to enable a betterunderstanding of the mechanisms that control such complex volcanicphenomena. In addition, a rigorous validation of simulation resultswith historical data would be impossible, due to the large uncertain-ties associated with the reconstruction of past events of this scale atVesuvius.
Nevertheless, it is possible to attempt some qualitative or semi-quantitative comparisons between our simulation results, and selectedevidence from deposits or other data from historical eruptions. Forexample, some comparisons can be made with the important AD 1631eruption, which occurred when the volcano morphology was quitesimilar to the present one. SIM4 results are consistent with thedistribution of PDCs of AD 1631, as reconstructed from exposed depositsand other evidence (Rosi et al., 1993; Rolandi et al., 1993b). There is alsoevidence that indicates that flows did not significantly spill over MountSomma (Rosi et al., 1993; Rolandi et al., 1993b). According to historicalchronicles,most PDCs spilled out along the coast (between SanGiovannia Teduccio andTorreAnnunziata) and consisted of a series of lobes about800mwide at their advancing fronts (Rosi et al.,1993; Guidoboni, 2008-this issue). Someof theseflowswere able to reach the sea and formsmallpeninsulas, although their dynamic pressures were relatively small andsufficient only to partially damage the buildings encountered (Rosi et al.,1993). Similarly, flow temperatures in the distal areaswere high enoughto set trees onfire but not to char large trunks (Rosi et al.,1993). All thesereconstructed features of the AD 1631 eruption are qualitativelyconsistent with simulation results above described.
A substantive comparison between our modelling results andother sub-Plinian I eruptions at Vesuvius, such as the Verdoline 16 kyrBP eruption (Cioni et al., 2003b) or the Pollena AD 472 eruption(Sulpizio et al., 2005), is more difficult. The reconstructed ventlocation and volcano topography for these eruptions differ signifi-cantly from those in our simulations (Cioni et al., 2008-this issue).Nevertheless, in both eruptions, fall deposits are frequently inter-layered with the deposits of small-scale PDCs (Cioni et al., 2008-thisissue) which, based on our simulation results, can be considered theproduct of an oscillating behaviour of the column under incipient andpartial collapse conditions (e.g., SIM2 and SIM3). Similarly, thestratigraphic succession of sub-Plinian and Plinian events at Vesuvius– typically characterized by basal fall deposits followed by pyroclasticsurge and pyroclastic flow (s.s.) deposits (Cioni et al., 2003a,b; Sulpizioet al., 2005) – can be explained, based on our results, as a progressiveshift in eruptive style from initially convective, towards collapseconditions. The degree of collapse of the column appears to stronglyaffect the initial PDC conditions in terms of flow density, velocity andtemperature. We believe such variations can also play a significant rolein defining the various PDC typologies at Vesuvius (e.g., Cioni et al.,2004; Cioni et al., 2008-this issue).
Lastly, it is useful to compare dynamic pressure estimates derivedfrom our simulations with independent estimates based on depositcharacterization and theoretical modelling. For instance, by investi-gating PDC deposits of sub-Plinian eruptions at Vesuvius and using thetheory of turbulent shear flows, Dellino et al. (2007b) derived dynamicpressure values of the order of a few kPa at a distance of about 5–7 kmfrom the source; these findings are consistent with our results(Fig. 13). Nevertheless, estimation of the actual force associated withPDCs during their emplacement remains an outstanding issue due tothe complex dynamics of the flows, and the limitations of modellingwhich includes both input parameters such as grain sizes, and gridrefinements.
6.4. Model limitations
During our modelling, we made several approximations regardingthe physical and numerical model, the boundary conditions, and inputdata. We here briefly discuss some of these limitations and note their
possible effects on the results. These limitations represent a potentialarea for future research.
An important limitation of the numerical model is the 20 mminimum grid size adopted along the terrain, which was necessary inorder have a manageable computational load given our currentcomputational facilities. This computational limit hinders the accuratedescription of the coarse granular basal flow underlying the moredilute, fine ash cloud. This limitation is more critical where the flowthickness is comparable to the vertical grid size (such as in the distalregion). The coarse grid biases the estimation of flow runout, andnear-ground hazard variables such as velocity and dynamic pressure,which exhibit large gradients near the base of the flow (EspostiOngaro et al., 2008). Moreover, the lack of a depositional model at theground (mass loss) forces the pyroclasts to remain fluidized andtherefore artificially increases the flow propagation. This process hasbeen recently investigated by Dufek and Bergantz (2007), and theirresults indicate that ground boundary conditions significantly affectflow mobility. As a consequence, flow runout and associated hazardsshould be considered upper-bound values for the consideredscenarios. Likewise, the entrainment of eroded mass into the flowsis not modelled, and this factor will also affect flow dynamics andrunout. Although some flows reach the sea in several runs, the readershould be aware that the physics of pyroclast-water interactions arenot simulated in our modelling (see Dufek et al., 2007 for a treatmentof the flow-water interaction).
As for boundary conditions, a key aspect is the assumed conditionsat the source. Again, in this case the limited grid resolution hinders theaccurate simulation of the under-expanded jet in a volcanic crater. Theassumption of a pressure-balanced jet, with simplified density andvelocity profiles, is certainly an oversimplification of source conditions(Esposti Ongaro et al., 2006; Ogden et al., 2007). Moreover, as provedby the high-resolution simulations presented in Fig. 1, the internalcrater morphology can have a strong influence on the jet structure.The shape of the crater is probably one of the most uncertain variablesin the volcanic system, and can vary throughout the course of aneruption, due to local collapse and wall erosion. Major fluctuations invent conditions likely occur at various temporal and spatial scales dueto conduit dynamics, thus producing further perturbations in thecolumn.
As for the input data for the simulations, large uncertainties stillaffect many key variables for eruption scenarios, including theeruption intensity, total grain-size distribution of the eruptivemixture, and flow properties at the source (Cioni et al., 2008-thisissue; Papale and Longo, 2008-this issue; Neri et al., 2008-this issue).As a result, the simulations we present here should be considered asjust the first of a larger set of runs needed to explore the effects of themain variables characterizing the investigated scenarios.
All the above limitations and uncertainties should be kept in mindby the reader, if the simulation results are evaluated for hazard andrisk assessment purposes. The uncertainty cannot be eliminated,although some expert elicitation techniques can be used to formallyand quantitatively account for simulation results and integrate themwith field observations (Cooke, 1991; Aspinall, 2006). In Neri et al.(2008-this issue) this method is applied to the production ofprobabilistic hazard maps for PDCs at Vesuvius.
7. Concluding remarks
Column collapse, and associated PDC formation and propagation,involve extremely complex physical processes, and present some ofthe most challenging problems in contemporary volcanology. Improv-ing our understanding of the dynamics of these phenomena isessential if we wish to mitigate the effects of explosive eruptions indensely populated regions.
Our transient 3D simulations of sub-Plinian column collapsescenarios at Vesuvius provide new insights into these events. In
395T. Esposti Ongaro et al. / Journal of Volcanology and Geothermal Research 178 (2008) 378–396
particular: 1) column collapse can be characterized by differentcollapsing regimes, from incipient to partial or near-total, thereforeconfirming the existence of a field of transitional behaviourcharacterized by contemporaneous and/or intermittent ash falloutand PDC propagation; 2) the collapse regime can best be characterizedby the amount or fraction of erupted mass that collapses to groundlevel, because this variable significantly affects the initial physicalproperties, and the transient and spatial emplacement features of thegenerated PDCs; 3) in the range of the investigated source conditions,PDC propagation, and hazard potential, appears to be directlycorrelated with the amount of mass that collapses to the groundrather than with the collapse height of the column; this finding is inopposition to the simple energy-cone model which correlates PDCrunout with the collapse height; 4) preliminary estimates of hazardvariables (i.e. dynamic pressure, temperature, airborne ash concen-tration) associated with PDCs can be derived from simulation results,providing a useful starting point for the quantification of damagescenarios; 5) for scenarios such as those discussed above, whichassume that the source location coincides with the position of thepresent Gran Cono, Mount Somma represents a first-order topo-graphic feature able to effectively reduce the propagation of the flowsin the northern sector, and to divert mass toward the west andsoutheast, accentuating PDC runouts and hazard variables for thesesectors; 6) we demonstrate some limitations of 2D vs 3D modelling,and reveal how the 2D approximation can force an artificial radialpropagation of the PDCs, ignoring azimuthal flows that could beproduced by blocking topography in 3D.
This study represents another step towards an accurate modellingof explosive eruptions. Further simulations using different inputparameters (e.g., vent location, source conditions, etc.) should becarried out in the future in order to gain a better understanding ofthese processes and a more robust definition of their influence on thePDC hazards at Vesuvius. Similarly, new studies must be undertakento further develop and validate improved models, targeting some ofthe limitations recognized at the current state of technology.
Acknowledgments
This work was funded by the EU-project EXPLORIS (EVR1-CT-2002-40026) and by the Italian Civil Protection Agency (Dipartimentodella Protezione Civile). We thank our colleagues of the EXPLORISproject for their special assistance and contributions to the carryingout of this work. The manuscript was significantly improved bythorough reviews of J. Dufek and B.Voight. We thank also P.Dellino foruseful comments and suggestions.
References
Addy, A.L., 1981. Effect of axisymmetric sonic nozzle geometry on Mach diskcharacteristics. AAIA J., 19, 121–122.
Aspinall, W.P., 2006. Structured elicitation of expert judgment for probabilistic hazardand risk assessment in volcanic eruptions. In: Mader, H.M., Coles, S.G., Connor, C.B.,Connor, L.J. (Eds.), Statistics in Volcanology. Geological Society of London, pp.15–30.on behalf of IAVCEI.
Baxter, P.J., Aspinall, W.P., Neri, A., Zuccaro, G., Spence, R.J.S., Cioni, R., Woo, G., 2008.Emergency planning andmitigation at Vesuvius: a new evidence-based approach. J.Volcanol. Geotherm. Res. 178, 454–473 (this issue).
Baxter, P.J., Boyle, R., Cole, P., Neri, A., Spence, R.J.S., Zuccaro, G., 2005. The impacts ofpyroclastic surges on buildings at the eruption of the Soufrière Hills volcano.Montserrat. Bull. Volcanol. 67, 292–313.
Belousov, A., Voight, B., Belousova, M., Petukhin, A., 2002. Powerful pyroclastic surgeand flows in the May 8-10, 1997 explosive eruption of Bezymianny volcano,Kamchatka, Russia. Bull. Volcanol., 64, 455–471.
Belousov, A.B., Voight, B., Belousova, M., 2007. Directed blasts and blast-generatedpyroclastic density currents: a comparison of the Bezymianny 1956, Mount St.Helens 1980, and Soufrière Hills, Montserrat 1997 eruptions and deposits. Bull.Volcanol. 69, 701–740. doi:10.1007/s00445-006-0109-y.
Bisson, M., Pareschi, M.T., Zanchetta, G., Sulpizio, R., Santacroce, R., 2006. Volcaniclasticdebris flow occurrences in the Campania region (southern Italy) and their relationto Holocene–late Pleistocene pyroclastic fall deposits: implications for large scalehazard mapping. Bull. Volcanol. doi:10.1007/s00445-0007-0127-4.
Branney, M.J., Kokelaar, P., 2002. Pyroclastic density currents and the sedimentation ofignimbrites. Geological Society, London, Memoirs, p. 27.
Burgisser, A., Bergantz,G.W., 2002. Reconcilingpyroclasticflows and surge: themultiphasephysics of pyroclastic density currents. Earth Planet. Sci. Lett., 202, 405–418.
Carey, S., Sigurdsson, H., Sparks, R.S.J., 1988. Experimental studies of particle-ladencolumns. J. Geophis. Res., 93, 15314–15328.
Cioni, R., Bertagnini, A., Santacroce, R., Andronico, D., 2008. Explosive activity and eruptionscenarios at Somma–Vesuvius (Italy): towards anewclassification scheme. J. Volcanol.Geotherm. Res. 178, 331–346 (this issue). doi:10.1016/j.jvolgeores.2008.04.024.
Cioni, R., Marianelli, P., Sbrana, A., 1992. Dynamics of the AD 79 eruption: stratigraphic,sedimentological, and geochemical daon ta the successions of the Somma–Vesuvius southern and eastern sectors. Acta Volcanol. 2, 109–123.
Cioni, R., Levi, S., Sulpizio, R., 2000. Apulian Bronze Age pottery as a long-distanceindicator for the Avellino Pomice eruption (Vesuvius, Italy). In: McGuire, W.G.,Griffiths, D.R., Hancock, P.L., Stewart, I.S. (Eds.), The Archaeology of GeologicalCatastrophes. Special Publication, vol. 171. Geological Society, London, pp. 159–177.
Cioni, R., Longo, A., Macedonio, G., Santacroce, R., Sbrana, A., Sulpizio, R., Andronico, D.,2003a. Assessing pyroclastic fall hazard throughfield data and numerical simulations:example from Vesuvius. J. Geophys. Res. 108, 2063. doi:10.1029/2002JB002251.
Cioni, R., Sulpizio, R., Garruccio, N., 2003b. Variability of eruption dynamics during aSubplinian event: the Greenish Pumice eruption of Somma–Vesuvius (Italy).J. Volcanol. Geotherm. Res., 124, 89–114.
Cioni, R., Gurioli, L., Lanza, R., Zanella, E., 2004. Temperatures of the AD 79 pyroclasticdensity current deposits (Vesuvius, Italy). J. Geophys. Res. 109, B02207. doi:10:1029/2002JB002251.
Clarke, A.B., Voight, B., Neri, A., Macedonio, G., 2002. Transient dynamics of Vulcanianexplosions and column collapse. Nature 415 897–901.
Cooke, R.M., 1991. Experts in Uncertainty. Oxford University Press. 321 pp.Dartevelle, S., 2004. Numerical modeling of geophysical granular flows: 1. A
comprehensive approach to granular rheologies and geophysical multiphaseflows. Geochem. Geophys. Geosyst. 5, Q08003. doi:10.1029/2003GC000636.
Dellino, P., Zimanowski, B., Buttner, R., La Volpe, L., Mele, D., Sul pizio, R., 2007a. Large-scale experiments on the mechanics of pyroclastic flows: design, engineering, andfirst results. J. Geophys. Res. 112, B04202. doi:10.1029/2006JB004313.
Dellino, P., et al., 2007b. INGV-DPC project V3-4 (Vesuvio). Final Report, RU V3-4/17.de'Michieli Vitturi, M., Esposti Ongaro, T., Neri, A., Salvetti, M.V., Beux, F., 2007. An
immersed boundary method for compressible multiphase flow: application to thedynamics of pyroclastic density currents. Comput. Geosci. doi:10.1007/s10596-007-9047-9.
Di Muro, A., Neri, A., Rosi, M., 2004. Contemporaneous convective and collapsingeruptive dynamics: the transitional regime of explosive eruptions. Geophys. Res.Lett. 31, L10607. doi:10.1029/2004GL019709.
Dobran, F., Neri, A., Macedonio, G., 1993. Numerical simulation of collapsing volcaniccolumns. J. Geophys. Res., 98, 4231–4259.
Dobran, F., Neri, A., Todesco, M., 1994. Assessing pyroclastic flow hazard at Vesuvius.Nature, 367, 551–554.
DPC, 1995. Pianificazione Nazionale d'Emergenza dell'Area Vesuviana. Dipartimento dellaProtezione Civile. Presidenza del Consiglio dei Ministri, Rome, p. 157 (in Italian).
DPC, 2001. Proposta di aggiornamento della Pianificazione Nazionale d'Emergenzadell'Area Vesuviana. Dipartimento della Protezione Civile. Presidenza del Consigliodei Ministri, Rome, p. 55 (in Italian).
Druitt, T.H., 1998. Pyroclastic density currents. In: Gilbert, J.S., Sparks, R.S.J. (Eds.), ThePhysics of Explosive Volcanic Eruptions. Geol. Soc. Spec. Publ, vol. 145, pp. 27–50.
Dufek, J., Bergantz, G.W., 2007. Suspended load and bed-load transport of particle-ladengravity currents: the role of particle bed interaction. Theor. Comput. Fluid Dyn. 21 (2),119–145.
Dufek, J., Manga, M., Staedter, M., 2007. Littoral Blasts: Pumice-water heat transfer andthe conditions for steam explosions when pyroclastic flows enter the ocean.J. Geophys. Res. 112, B11201. doi:10.1029/2006JB004910.
Esposti Ongaro, T., Cavazzoni, C., Erbacci, G., Neri, A., Salvetti, M.V., 2007. A parallelmultiphase flow code for the 3D simulation of explosive volcanic eruptions. ParallelComput. doi:10.1016/j.parco.2007.04.003.
Esposti Ongaro, T., Clarke, A., Neri, A., Voight, B., Widiwijayanti, C., 2008. Fluid-dynamicsof the 1997 Boxing Day lateral blast of Soufriere Hills volcano (Montserrat, WI).J. Geophys. Res. 113, B03211. doi:10.1029/2006JB004898.
Esposti Ongaro, T., Neri, A., Todesco, M., Macedonio, G., 2002. Pyroclastic flow hazardassessment at Vesuvius (Italy) by using numerical modelling: II Analysis of flowvariables. Bull. Volcanol., 64, 178–191.
Esposti Ongaro, T., Pelanti, M., Neri, A., LeVeque, R., 2006. Shock-wave pattern andatmospheric signature of underexpanded volcanic jets: a comparative study usingtwo numerical multiphase flow models. Workshop The Physics of Fluid Oscillationin Volcanic systems, Lancaster (UK), September 2006 (abstract).
Gidaspow, D., 1994. Multiphase Flow and Fluidization: Continuum and Kinetic TheoryDescriptions. Academic Press, New York. 467 pp.
Guidoboni, E., 2008. Vesuvius: Anhistorical approach to the 1631 Vesuvius eruption –
“Cold data” from the analysis of three contemporary treatises. J. Volcanol.Geotherm. Res. 178, 347–358 (this issue).
Harlow, F.H., Amsden, A.A., 1975. Numerical calculation of multiphase fluid flow.J. Comput. Phys., 17, 19–52.
Lirer, L., Pescatore, T., Booth, B., Walker, G.P.L., 1973. Two Plinian pumice-fall depositsfrom Somma–Vesuvius, Italy. Geol. Soc. Am. Bull., 84, 759–772.
Kieffer, S.W., 1984. Factors governing the structure of volcanic jets. Explosivevolcanism: Inception, evolution, and hazards. National Academy Press,Washington,pp. 143–157.
Kieffer, S.W., Sturtevant, B., 1984. Laboratory Studies of Volcanic Jets. J. Geophys. Res., 89(B10), 8353–8368.
396 T. Esposti Ongaro et al. / Journal of Volcanology and Geothermal Research 178 (2008) 378–396
Lovely, D., Haimes, R., 1999. Shock detection from computational fluid dynamics results.AIAA Paper 99–3285.
Macedonio, G., Costa, A., Folch, A., 2008. Ash fallout scenarios at Vesuvius: numericalsimulations and implications for hazard assessment. J. Volcanol. Geotherm. Res.178, 366–377 (this issue).
Malin, M.C., Sheridan, M.F., 1982. Computer-assisted mapping of pyroclastic surges.Science, 217, 637–639.
Mastrolorenzo, G., Petrone, P., Pappalardo, L., Sheridan, M.F., 2006. The Avellino 3780-yr-BP catastrophe as a worst-case scenario for a future eruption at Vesuvius. PNAS103, 4366–4370.
Neri, A., Aspinall, W., Cioni, R., Bertagnini, A., Baxter, P.G., Zuccaro, G., Andronico, D.,Barsotti, S., Cole, P.D., Esposti Ongaro, T., Hincks, T.K., Macedonio, G., Papale, P., Rosi,M., Santacroce, R., Woo, A., 2008. Developing an event tree for probabilistic hazardand risk assessment at Vesuvius. J. Volcanol. Geotherm. Res. 178, 397–415 (thisissue). doi:10.1016/j.jvolgeores.2008.05.014.
Neri, A., Dobran, F., 1994. Influence of eruption parameters on the thermo-fluiddynamics of collapsing volcanic columns. J. Geophys. Res., 99, 11833–11857.
Neri, A., Macedonio, G., 1996. Numerical simulation of collapsing volcanic columns withparticles of two sizes. J. Geophys. Res., 101, 8153–8174.
Neri, A., Papale, P., Macedonio, G., 1998. The role of magma composition and watercontent in explosive eruptions: II Pyroclastic dispersion dynamics. J. Volcanol.Geotherm. Res., 87, 95–115.
Neri, A., Papale, P., Del Seppia, D., Santacroce, R., 2002. Coupled conduit andatmospheric dispersal dynamics of the AD Plinian eruption of Vesuvius. J. Volcanol.Geotherm. Res., 120, 141–160.
Neri, A., Esposti Ongaro, T., Macedonio, G., Gidaspow, D., 2003. Multiparticle simulationof collapsing volcanic columns and pyroclastic flows. J. Geophys. Res.108 (B4), 2202.doi:10.1029/2001JB000508.
Neri, A., Esposti Ongaro, T., Menconi, G., De'Michieli Vitturi, M., Cavazzoni, C., Erbacci, G.,Baxter, P.J., 2007. 4D simulation of explosive eruption dynamics at Vesuvius.Geophys. Res. Lett. 34, L04309. doi:10.1029/2006GL028597.
Normann, M.L., Smarr, L., Winkler, K.H.A., Smith, M.D., 1982. Structure and dynamics ofsupersonic jets. Astron. Astrophys., 113, 285–302.
Ogden, D.E., Wohletz, K.H., Brodski, E.E., Glatzmaier, G.A., 2007. Numerical simulation ofvolcanic jets: importance of vent overpressure. J. Geophys. Res. doi:10.1029/2007JB005133.
Papale, P., Longo, A., 2008. Vent conditions for expected eruptions at Vesuvius. J. Volcanol.Geotherm. Res. 178, 359–365 (this issue). doi:10.1016/j.jvolgeores.2008.05.012.
Pareschi, M.T., Santacroce, R., Favalli, M., Giannini, F., Bisson, M., Meriggi, A., Cavarra, L.,2000. Un GIS per il Vesuvio. Felici Editori, Pisa.
Petrazzuoli, S.M., Zuccaro, G., 2004. Structural resistance of reinforced concretebuildings under pyroclastic flows: a study of the Vesuvian area. J. Volcanol.Geotherm. Res., 133, 353–367.
Rolandi, G., Mastrolorenzo, G., Barrella, A.N., Borrelli, A., 1993a. The Avellino Plinianeruption of Somma–Vesuvius (3760 yBP): the progressive evolution frommagmaticto hydromagmatic style. J. Volcanol. Geotherm. Res., 58, 67–88.
Rolandi, G., Barrella, A.M., Borrelli, A., 1993b. The 1631 eruption of Vesuvius. J. Volcanol.Geotherm. Res., 58, 183–201.
Rosi, M., Principe, C., Vecci, R., 1993. The 1631 eruption of Vesuvius reconstructed from thereview of chronicles and study of deposits. J. Volcanol. Geotherm. Res., 58, 151–182.
Rossano, S., Mastrolorenzo, G., De Natale, G., 1998. J. Volcanol. Geotherm. Res. 82, 113–137.
Santacroce, R., 1987. Somma–Vesuvius. Quaderni de “La Ricerca Scientifica”. Cons. Naz.Ric. 8 251 pp.
Sheridan, M., Malin, M.C., 1983. Application of computer assisted mapping to volcanichazard evaluation of surge eruptions: Vulcano, Lipari, and Vesuvius. J. Volcanol.Geotherm. Res. 17, 187–202.
Sigurdsson, H., Cashdollar, S., Sparks, R.S.J., 1982. The eruption of Vesuvius in AD 79:reconstruction from historical and volcanological evidence. Am. J. Archaeol. 86,39–51.
Sparks, R.S.J., Walker, G.P.L., 1977. The significance of vitric-enriched air-fall ashesassociated with crystal-enriched ignimbrites. J. Volcanol. Geotherm. Res., 2, 329–341.
Sparks, R.S.J., Aspinall, W.P., 2004. Volcanic activity: frontiers and challenges inforecasting prediction and risk assessment. In: Sparks, R.S.J., Hawkesworth, C.J.(Eds.), The State of the Planet: Frontiers and Challenges in Geophysics. GeophysicalMonograph, vol. 19. IUGG.
Sparks, R.S.J., Wilson, L., Hulme, G., 1978. Theoretical modeling of the generation,movement and emplacement of pyroclastic flows by column collapse. J. Geophys.Res. 83, 1727–1739.
Spence, R.J.S., Baxter, P.J., Zuccaro, G., 2004. Building vulnerability and human casualtyestimation for a pyroclastic flow: a model and its application to Vesuvius.J. Volcanol. Geotherm. Res., 133, 321–343.
Sulpizio, R., Mele, D., Dellino, P., La Volpe, L., 2005. A complex Subplinian-type eruptionfrom low-viscosity, phonolitic to tephri-phonolitic magma: the AD 472 (Pollena)eruption of Somma–Vesuvius, Italy. Bull. Volcanol., 67, 743–767.
Suzuki, Y.J., Koyaguchi, T., Ogawa, M., Hachisu, I., 2005. A numerical study of turbulentmixing in eruption clouds using three-dimensional fluid dynamics model.J. Geophys. Res. 110, B08201. doi:10.1029/2004JB003460.
Textor, C., Graf, H.F., Herzog, M., Oberhuber, J.M., Rose, W.I., Ernst, G.G.J., 2006. Volcanicparticle aggregation in explosive eruption columns. Part I: Parameterization of themicrophysics of hydrometeors and ash. J. Volcanol. Geotherm. Res., 150, 359–377.
Todesco, M., Neri, A., Esposti Ongaro, T., Papale, P., Macedonio, G., Santacroce, R., Longo,A., 2002. Pyroclastic flow hazard assessment at Vesuvius (Italy) by using numericalmodelling: I Large-scale dynamics. Bull. Volcanol. 64, 155–177.
Valentine, G., 1987. Stratified flow in pyroclastic surges. Bull. Volcanol., 49, 616–630.Valentine, G., 1998. Damage to structures by pyroclastic flows and surges inferred from
nuclear weapon effects. J. Volcanol. Geotherm. Res., 87, 117–140.Valentine, G., Wohletz, K., 1989. Numerical models of Plinian eruption columns and
pyroclastic flows. J. Geophys. Res., 94, 1867–1887.Wilson, L., Sparks, R.S.J., Walker, G.P.L., 1980. Explosive volcanic eruptions IV. The
control of magma properties and conduit geometry on eruption column behaviour.Geophys. J. R. Astr. Soc., 63, 117–148.
Wilson, C.J.N., Hildreth, W., 1997. The Bishop Tuff: new insights from the explosivestratigraphy. J. Geol., 105, 407–439.
Wohletz, K.H., McGetchin, T.R., Sandford, M.T., Jones, E.M., 1984. Hydrodynamic aspectsof caldera-forming eruptions: numerical models. J. Geophys. Res. 89, 8269–8285.
Woods, A.W., Bower, S.M., 1995. The decompression of volcanic jets in a crater duringexplosive volcanic eruptions. Earth Planet. Sci. Lett., 131, 189–205.
Zuccaro, G., Cacace, F., Baxter, P.J., Spence, R., 2008. Impact of explosive eruption scenariosat Vesuvius. J. Volcanol. Geotherm. Res. 178, 416–453 (this issue). doi:10.1016/j.jvolgeores.2008.01.0005.

![THREE-DIMENSIONAL SIMULATIONS OF TRANSIENT ...people.sabanciuniv.edu/syesilyurt/papers/fc/IMECE2007...in the transient analysis [5-7]. Here, we present time-dependent three-dimensional](https://img.pdfslide.us/doc/110x75/60b83134af6790465d416b3a/three-dimensional-simulations-of-transient-in-the-transient-analysis-5-7.jpg)