Embed Size (px)
Citation preview
Transfusion thresholds and other strategies for guiding
allogeneic red blood cell transfusion (Review)
Carson JL, Carless PA, Hebert PC
This is a reprint of a Cochrane review, prepared and maintained by The Cochrane Collaboration and published in The Cochrane Library2012, Issue 5
http://www.thecochranelibrary.com
Transfusion thresholds and other strategies for guiding allogeneic red blood cell transfusion (Review)
Copyright © 2012 The Cochrane Collaboration. Published by John Wiley & Sons, Ltd.
T A B L E O F C O N T E N T S
1HEADER . . . . . . . . . . . . . . . . . . . . . . . . . . . . . . . . . . . . . . .
1ABSTRACT . . . . . . . . . . . . . . . . . . . . . . . . . . . . . . . . . . . . . .
2PLAIN LANGUAGE SUMMARY . . . . . . . . . . . . . . . . . . . . . . . . . . . . . .
2BACKGROUND . . . . . . . . . . . . . . . . . . . . . . . . . . . . . . . . . . . .
3OBJECTIVES . . . . . . . . . . . . . . . . . . . . . . . . . . . . . . . . . . . . .
3METHODS . . . . . . . . . . . . . . . . . . . . . . . . . . . . . . . . . . . . . .
Figure 1. . . . . . . . . . . . . . . . . . . . . . . . . . . . . . . . . . . . . . 6
6RESULTS . . . . . . . . . . . . . . . . . . . . . . . . . . . . . . . . . . . . . . .
Figure 2. . . . . . . . . . . . . . . . . . . . . . . . . . . . . . . . . . . . . . 8
Figure 3. . . . . . . . . . . . . . . . . . . . . . . . . . . . . . . . . . . . . . 9
11DISCUSSION . . . . . . . . . . . . . . . . . . . . . . . . . . . . . . . . . . . . .
14AUTHORS’ CONCLUSIONS . . . . . . . . . . . . . . . . . . . . . . . . . . . . . . .
14ACKNOWLEDGEMENTS . . . . . . . . . . . . . . . . . . . . . . . . . . . . . . . .
15REFERENCES . . . . . . . . . . . . . . . . . . . . . . . . . . . . . . . . . . . . .
18CHARACTERISTICS OF STUDIES . . . . . . . . . . . . . . . . . . . . . . . . . . . . .
37DATA AND ANALYSES . . . . . . . . . . . . . . . . . . . . . . . . . . . . . . . . . .
Analysis 1.1. Comparison 1 Blood transfusions, Outcome 1 Patients exposed to blood transfusion (all studies). . . 39
Analysis 1.2. Comparison 1 Blood transfusions, Outcome 2 Patients exposed to allogeneic blood transfusion. . . . 41
Analysis 1.3. Comparison 1 Blood transfusions, Outcome 3 Patients exposed to autologous blood transfusion. . . . 42
Analysis 1.4. Comparison 1 Blood transfusions, Outcome 4 Patients exposed to blood transfusion (by clinical setting). 43
Analysis 1.5. Comparison 1 Blood transfusions, Outcome 5 Patients exposed to blood transfusion (by transfusion
threshold). . . . . . . . . . . . . . . . . . . . . . . . . . . . . . . . . . . . 45
Analysis 1.6. Comparison 1 Blood transfusions, Outcome 6 Patients exposed to blood transfusion (by allocation
concealment). . . . . . . . . . . . . . . . . . . . . . . . . . . . . . . . . . . 46
Analysis 1.7. Comparison 1 Blood transfusions, Outcome 7 Units of blood transfused. . . . . . . . . . . . 47
Analysis 1.8. Comparison 1 Blood transfusions, Outcome 8 Units of blood transfused in those transfused. . . . . 48
Analysis 2.1. Comparison 2 Haemoglobin concentration, Outcome 1 Haemoglobin concentration. . . . . . . 49
Analysis 3.1. Comparison 3 Mortality, Outcome 1 ≤14-day mortality. . . . . . . . . . . . . . . . . 50
Analysis 3.2. Comparison 3 Mortality, Outcome 2 30-day mortality. . . . . . . . . . . . . . . . . . 51
Analysis 3.3. Comparison 3 Mortality, Outcome 3 60-day mortality. . . . . . . . . . . . . . . . . . 52
Analysis 3.4. Comparison 3 Mortality, Outcome 4 120-day mortality. . . . . . . . . . . . . . . . . . 52
Analysis 3.5. Comparison 3 Mortality, Outcome 5 Hospital mortality. . . . . . . . . . . . . . . . . 53
Analysis 3.6. Comparison 3 Mortality, Outcome 6 ICU mortality. . . . . . . . . . . . . . . . . . . 54
Analysis 3.7. Comparison 3 Mortality, Outcome 7 Mortality (unspecified follow-up period). . . . . . . . . . 54
Analysis 4.1. Comparison 4 Length of stay, Outcome 1 Hospital length of stay. . . . . . . . . . . . . . 55
Analysis 4.2. Comparison 4 Length of stay, Outcome 2 ICU length of stay. . . . . . . . . . . . . . . . 56
Analysis 5.1. Comparison 5 Function and fatigue, Outcome 1 Inability to walk or death at 30 days. . . . . . . 56
Analysis 5.2. Comparison 5 Function and fatigue, Outcome 2 Inability to walk or death at 60 days. . . . . . . 57
Analysis 5.3. Comparison 5 Function and fatigue, Outcome 3 Lower extremity physical activities of daily living at 30
days. . . . . . . . . . . . . . . . . . . . . . . . . . . . . . . . . . . . . . 57
Analysis 5.4. Comparison 5 Function and fatigue, Outcome 4 Lower extremity physical activities of daily living at 60
days. . . . . . . . . . . . . . . . . . . . . . . . . . . . . . . . . . . . . . 58
Analysis 5.5. Comparison 5 Function and fatigue, Outcome 5 Instrumental activities of daily living at 30 days. . . 58
Analysis 5.6. Comparison 5 Function and fatigue, Outcome 6 Instrumental activities of daily living at 60 days. . . 59
Analysis 5.7. Comparison 5 Function and fatigue, Outcome 7 Energy/fatigue at 30 days. . . . . . . . . . . 59
Analysis 5.8. Comparison 5 Function and fatigue, Outcome 8 Energy/fatigue at 60 days. . . . . . . . . . . 60
Analysis 6.1. Comparison 6 Adverse events, Outcome 1 Cardiac events. . . . . . . . . . . . . . . . . 60
Analysis 6.2. Comparison 6 Adverse events, Outcome 2 Myocardial infarction. . . . . . . . . . . . . . 61
Analysis 6.3. Comparison 6 Adverse events, Outcome 3 Pulmonary oedema. . . . . . . . . . . . . . . 62
Analysis 6.4. Comparison 6 Adverse events, Outcome 4 Cerebrovascular accident (CVA) - stroke. . . . . . . . 63
Analysis 6.5. Comparison 6 Adverse events, Outcome 5 Pneumonia. . . . . . . . . . . . . . . . . . 64
iTransfusion thresholds and other strategies for guiding allogeneic red blood cell transfusion (Review)
Copyright © 2012 The Cochrane Collaboration. Published by John Wiley & Sons, Ltd.

Analysis 6.6. Comparison 6 Adverse events, Outcome 6 Thromboembolism. . . . . . . . . . . . . . . 65
Analysis 6.7. Comparison 6 Adverse events, Outcome 7 Rebleeding. . . . . . . . . . . . . . . . . . 65
Analysis 6.8. Comparison 6 Adverse events, Outcome 8 Infection. . . . . . . . . . . . . . . . . . . 66
Analysis 6.9. Comparison 6 Adverse events, Outcome 9 Renal failure. . . . . . . . . . . . . . . . . . 67
Analysis 6.10. Comparison 6 Adverse events, Outcome 10 Mental confusion. . . . . . . . . . . . . . . 67
67APPENDICES . . . . . . . . . . . . . . . . . . . . . . . . . . . . . . . . . . . . .
69WHAT’S NEW . . . . . . . . . . . . . . . . . . . . . . . . . . . . . . . . . . . . .
70HISTORY . . . . . . . . . . . . . . . . . . . . . . . . . . . . . . . . . . . . . . .
70CONTRIBUTIONS OF AUTHORS . . . . . . . . . . . . . . . . . . . . . . . . . . . . .
71DECLARATIONS OF INTEREST . . . . . . . . . . . . . . . . . . . . . . . . . . . . . .
71SOURCES OF SUPPORT . . . . . . . . . . . . . . . . . . . . . . . . . . . . . . . . .
71DIFFERENCES BETWEEN PROTOCOL AND REVIEW . . . . . . . . . . . . . . . . . . . . .
71INDEX TERMS . . . . . . . . . . . . . . . . . . . . . . . . . . . . . . . . . . . .
iiTransfusion thresholds and other strategies for guiding allogeneic red blood cell transfusion (Review)
Copyright © 2012 The Cochrane Collaboration. Published by John Wiley & Sons, Ltd.
[Intervention Review]
Transfusion thresholds and other strategies for guidingallogeneic red blood cell transfusion
Jeffrey L Carson1 , Paul A Carless2, Paul C Hebert3
1Division of General Internal Medicine, UMDNJ-Robert Wood Johnson Medical School, New Brunswick, New Jersey, USA.2Discipline of Clinical Pharmacology, Faculty of Health, University of Newcastle, Newcastle, Australia. 3Department of Medicine,
Ottawa General Hospital, Ottawa, Canada
Contact address: Jeffrey L Carson, Division of General Internal Medicine, UMDNJ-Robert Wood Johnson Medical School, 125
Paterson Street, New Brunswick, New Jersey, 08903, USA. [email protected].
Editorial group: Cochrane Injuries Group.
Publication status and date: Edited (no change to conclusions), published in Issue 5, 2012.
Review content assessed as up-to-date: 1 February 2011.
Citation: Carson JL, Carless PA, Hebert PC. Transfusion thresholds and other strategies for guiding allogeneic red blood cell transfusion.
Cochrane Database of Systematic Reviews 2012, Issue 4. Art. No.: CD002042. DOI: 10.1002/14651858.CD002042.pub3.
Copyright © 2012 The Cochrane Collaboration. Published by John Wiley & Sons, Ltd.
A B S T R A C T
Background
Most clinical practice guidelines recommend restrictive red cell transfusion practices, with the goal of minimising exposure to allogeneic
blood. The purpose of this review is to compare clinical outcomes in patients randomised to restrictive versus liberal transfusion
thresholds (triggers).
Objectives
To examine the evidence for the effect of transfusion thresholds on the use of allogeneic and/or autologous red cell transfusion, and the
evidence for any effect on clinical outcomes.
Search methods
We identified trials by searching: the Cochrane Injuries Group Specialised Register (searched 1 February 2011), the Cochrane Central
Register of Controlled Trials (CENTRAL) (The Cochrane Library 2011, Issue 1), MEDLINE (Ovid) 1948 to January Week 3 2011,
EMBASE (Ovid) 1980 to 2011 (Week 04), ISI Web of Science: Science Citation Index Expanded (1970 to February 2011) and ISI Web
of Science: Conference Proceedings Citation Index - Science (1990 to February 2011). We checked reference lists of other published
reviews and relevant papers to identify any additional trials.
Selection criteria
Controlled trials in which patients were randomised to an intervention group or to a control group. We included trials where intervention
groups were assigned on the basis of a clear transfusion ’trigger’, described as a haemoglobin (Hb) or haematocrit (Hct) level below
which a red blood cell (RBC) transfusion was to be administered.
Data collection and analysis
We pooled risk ratios of requiring allogeneic blood transfusion, transfused blood volumes and other clinical outcomes across trials using
a random-effects model. Two people performed data extraction and assessment of the risk of bias.
1Transfusion thresholds and other strategies for guiding allogeneic red blood cell transfusion (Review)
Copyright © 2012 The Cochrane Collaboration. Published by John Wiley & Sons, Ltd.

Main results
We included 19 trials involving a total of 6264 patients and they were similar enough that results could be combined. Restrictive
transfusion strategies reduced the risk of receiving a RBC transfusion by 39% (risk ratio (RR) 0.61, 95% confidence interval (CI) 0.52
to 0.72). This equates to an average absolute risk reduction (ARR) of 34% (95% CI 24% to 45%). The volume of RBCs transfused was
reduced on average by 1.19 units (95% CI 0.53 to 1.85 units). However, heterogeneity between trials was statistically significant (P <
0.00001; I² ≥ 93%) for these outcomes. Restrictive transfusion strategies did not appear to impact the rate of adverse events compared to
liberal transfusion strategies (i.e. mortality, cardiac events, myocardial infarction, stroke, pneumonia and thromboembolism). Restrictive
transfusion strategies were associated with a statistically significant reduction in hospital mortality (RR 0.77, 95% CI 0.62 to 0.95) but
not 30-day mortality (RR 0.85, 95% CI 0.70 to 1.03). The use of restrictive transfusion strategies did not reduce functional recovery,
hospital or intensive care length of stay. The majority of patients randomised were included in good-quality trials, but some items of
methodological quality were unclear. There are no trials in patients with acute coronary syndrome.
Authors’ conclusions
The existing evidence supports the use of restrictive transfusion triggers in most patients, including those with pre-existing cardiovascular
disease. As there are no trials, the effects of restrictive transfusion triggers in high-risk groups, such as acute coronary syndrome, need
to be tested in further large clinical trials. In countries with inadequate screening of donor blood, the data may constitute a stronger
basis for avoiding transfusion with allogeneic red cells.
P L A I N L A N G U A G E S U M M A R Y
Restricting the use of blood transfusion
Many people are given a transfusion of blood from an unrelated donor as part of their medical treatment. There are, however, risks
involved. In particular, infections (including HIV and certain types of hepatitis) may be passed on to the person receiving the blood.
This risk is very small in high-income countries but much larger in poor countries which do not test the blood for infections. Because
of the risks, doctors try to avoid giving blood unless it is really necessary. One approach is to give the transfusion only if the amount
of haemoglobin in the patient’s blood has dropped below a certain ’threshold’ level. We looked for controlled studies comparing the
effectiveness of giving more versus less blood. We found 19 studies, with a total of 6264 patients. We conclude that, for most patients,
giving less blood is safe and blood transfusion is probably not essential until haemoglobin levels drop below 7.0 to 8.0 grams per
decilitre. As no trials have been done involving patients with an acute heart problem, it is not currently known how much blood to
give these patients.
B A C K G R O U N D
Blood is an indispensable product in modern medical practice
(Amin 2004). Red blood cells (RBC) are used to improve oxygen
delivery to tissues in situations of haemorrhage and anaemia (
Napolitano 2009). Red blood cell transfusion constitutes one of
the mainstays of therapy in the management of anaemic patients
and is one of the few treatments that adequately restores tissue
oxygenation when oxygen demand exceeds supply (Klein 2007;
Wang 2010).
The risk and availability of red blood cell transfusion varies
throughout the world. In most developed countries with well-reg-
ulated blood supplies, the safety of allogeneic red cell transfusion
has improved significantly over the past 30 years. This has been
primarily due to improvements in donor blood screening proce-
dures and the implementation of more stringent quality control
measures (Klein 2007). It has been estimated that the residual risk
of transmission through transfusion of HIV, HCV and HBV in
Canada is 1 per 7.8 million donations, 1 per 2.3 million donations
and 1 per 153,000 donations respectively (O’Brien 2007). Glob-
ally, the estimated risks of infection per blood unit range from 1
per 100,000 to 1 per 400,000 for HBV, 1 per 1.6 million to 1
per 3.1 million for HCV, 1 per 1.4 million to 1 per 4.7 million
for HIV, and 1 per 500,000 to 1 per 3.0 million for human T
cell lymphotropic virus (Goodnough 2008). Data from seven de-
veloped countries from 2000 to 2005 showed the residual risk of
transfusion-transmitted viral infections ranged from 0.22 to 2.48
2Transfusion thresholds and other strategies for guiding allogeneic red blood cell transfusion (Review)
Copyright © 2012 The Cochrane Collaboration. Published by John Wiley & Sons, Ltd.

per 1 million donations for HIV, 0.05 to 3.94 per 1 million do-
nations for HCV and 1.51 to 9.78 per 1 million donations for
HBV (Kitchen 2008). In the USA, the estimated risk per unit for
HIV is 1:1,467,000 (Zou 2010), for HCV is 1:1,149,000 (Zou
2010) and for HBV is 1:282,000 to 357,000 (Zou 2009). In the
USA, life-threatening reactions were also estimated to occur in 1:
139,908 patients transfused (Whitaker 2011).
In developing countries, the supply of blood is inadequate and may
not be safe because it often is not tested for viral pathogens. Blood
donations are not routinely tested in 39 countries for transfusion-
transmissible infections including HIV, hepatitis B, hepatitis C
and syphilis (WHO 2011). In 40 countries, less than 25% of the
blood supply is collected from voluntary unpaid blood donors,
with most coming from family or paid blood donors (WHO
2011). The prevalence of HIV in low-income countries is 2.3% of
blood donations compared to 0.001% in high-income countries
(WHO 2011).
Blood transfusion is expensive. In 2008, the mean payment for one
unit of leukoreduced red blood cells in the United States was USD
223 (Whitaker 2011). However, if the costs of administration as
well as the acquisition expenses of red blood cell transfusion are
considered, the estimated cost derived from four US and European
hospitals rises to USD 761 per unit (standard deviation +/- USD
294) (Shander 2010).
Description of the intervention
Historically, the widely accepted clinical standard was to transfuse
patients when the haemoglobin level dropped below 10.0 g/dL or
the haematocrit fell below 30%. This ‘10/30 rule’ was first pro-
posed by Adams and Lundy in 1942 and served as a RBC transfu-
sion trigger for decades (Madjdpour 2005; Wang 2010). However,
the 1988 National Institutes of Health Consensus Conference in
the United States reported that the evidence did not support a
single criterion for transfusion (NIH 1988). Since then, several
published guidelines have advised against a single threshold for
red cell transfusion, recommending that a range of haemoglobin
values between 6.0 and 10.0 g/dL can be used, depending on the
presence of serious co-morbidity (AAGBI 2008; ASA 2006; ASBT
2001; BCTMAG 2003; Napolitano 2009; NBUGI 2001).
Clinical trials evaluating transfusion thresholds usually compare
two transfusion groups: 1) liberal transfusion where patients re-
ceive blood at a higher haemoglobin concentration, and 2) restric-
tive transfusion where patients receive blood at a lower haemoglo-
bin concentration.
Why it is important to do this review
The purpose of the review was to find, appraise and summarise
the data from high-quality trials that studied the clinical impact of
varying thresholds for transfusion with red cells. We were partic-
ularly interested in whether the results of randomised controlled
trials support the trend for increasingly restrictive red cell trans-
fusion practices and if red cell transfusions can be withheld in
some circumstances without harming patients. We have updated
the review because two recent trials (Carson 2011; Hajjar 2010)
were published, increasing the number of patients included in this
review from 3746 to 6264.
O B J E C T I V E S
To examine the evidence for the effect of transfusion thresholds
on the use of red cell transfusions and the evidence for any change
in clinical outcomes.
M E T H O D S
Criteria for considering studies for this review
Types of studies
Randomised controlled trials with a concurrent control group. We
included trials if the comparison groups were assigned on the basis
of a clear transfusion ’trigger’ or ’threshold’, described as a hae-
moglobin or haematocrit level (with or without a specified level
of haemodynamic instability) that had to be reached before a red
cell transfusion was administered. Control group patients were re-
quired to be either transfused with allogeneic and/or autologous
red blood cells at higher Hb or Hct levels (transfusion threshold)
than the intervention group or transfused in accordance with cur-
rent transfusion practices, which may not have included a well-
defined transfusion threshold, but involved liberal rather than re-
strictive transfusion practices.
Types of participants
We included trials of surgical or medical patients, involving adults
and/or children. We excluded neonates.
Types of interventions
The intervention considered was the use of transfusion thresholds
(’triggers’) as a means of guiding allogeneic and/or autologous red
blood cell transfusion.
3Transfusion thresholds and other strategies for guiding allogeneic red blood cell transfusion (Review)
Copyright © 2012 The Cochrane Collaboration. Published by John Wiley & Sons, Ltd.
Types of outcome measures
Primary outcomes
• The proportion of patients ’at risk’ who were transfused
with allogeneic and/or autologous red blood cells.
Secondary outcomes
• The amounts of allogeneic and autologous blood
transfused.
• Morbidity (non-fatal myocardial infarction, cardiac events,
pulmonary oedema, cerebral vascular accident,
thromboembolism, renal failure, infection, haemorrhage, mental
confusion), mortality, haematocrit levels (postoperative/
discharge) and length of hospital stay (LOS). We expected the
definitions of each of the morbidity events to vary between
studies.
Search methods for identification of studies
We did not restrict our search for trials by date, language or pub-
lication status.
Electronic searches
The Cochrane Injuries Group Trials Search Co-ordinator con-
ducted the latest search for trials and collated the results. We
searched the following databases:
• the Cochrane Injuries Group’s Specialised Register
(searched 1 February 2011);
• the Cochrane Central Register of Controlled Trials
(CENTRAL) (The Cochrane Library 2011, Issue 1);
• MEDLINE (Ovid) 1950 to January Week 3 2011;
• EMBASE (Ovid) 1980 to 2011 Week 04;
• ISI Web of Science: Science Citation Index Expanded (SCI-
EXPANDED) (1970 to February 2011);
• ISI Web of Science: Conference Proceedings Citation Index
- Science (CPCI-S) (1990 to February 2011).
The search strategies are presented in Appendix 1.
Searching other resources
We contacted experts in the field to identify information relevant
to the review. Where possible, we contacted authors of published
studies for clarification of trial methodology and data. This was
only possible where a contact address was reported in the pub-
lished study. We searched the reference lists of relevant reviews and
published papers as well as the reference lists of all included trials
for further studies.
Data collection and analysis
Selection of studies
Two authors (JLC and PAC) independently screened the titles,
abstracts, or both, of the search results and selected trials that met
the previously defined inclusion criteria. We discussed inclusion
of studies until consensus was reached; there were no disagree-
ments on the inclusion of studies. We identified trials in which pa-
tients were randomised to a restrictive transfusion strategy (trans-
fusion threshold and/or protocol), or to a control group which
was randomised to a liberal transfusion strategy. JLC and PAC
independently extracted study characteristics and outcomes using
a data extraction form. The extraction form recorded information
regarding: study type, methodology descriptions, the presence of
a transfusion threshold, transfusion protocol, the type of surgery
involved, clinical setting, treatment outcomes and general com-
ments.
Data extraction and management
JLC and PAC performed data extraction on articles that met the
inclusion criteria. JLC then entered data into Review Manager;
data were checked by PAC. We contacted authors of trials to re-
quest missing data.
We used a data extraction form to record data on the following
outcomes: the number of patients exposed to allogeneic blood,
the amount of allogeneic blood transfused, the number of patients
receiving any transfusion (allogeneic blood, autologous blood, or
both). For trials involving surgical patients, we recorded the fol-
lowing outcomes: postoperative complications (infection, haem-
orrhage, non-fatal myocardial infarction, cardiac events, renal fail-
ure, stroke, thromboembolism, pulmonary oedema, mental con-
fusion), mortality and length of hospital stay (LOS). We recorded
data for blood loss and haemoglobin and haematocrit levels (on
admission, pre-post transfusion and at discharge). We recorded
information regarding demographics (age, sex), type of surgery or
medical condition on the data extraction form. We extracted data
for allogeneic blood transfusion if it was expressed as packed red
blood cells (RBC). We documented information regarding the use
of fresh frozen plasma (FFP) and/or platelets.
Assessment of risk of bias in included studies
The Cochrane Collaboration’s tool for assessing risk of bias is de-
scribed in section 8.5 of the Cochrane Handbook for Systematic Re-views of Interventions (Higgins 2011).
JLC and PAC assessed the following domains for each study:
• sequence generation;
• allocation concealment;
• blinding;
• incomplete outcome data;
4Transfusion thresholds and other strategies for guiding allogeneic red blood cell transfusion (Review)
Copyright © 2012 The Cochrane Collaboration. Published by John Wiley & Sons, Ltd.
• selective outcome reporting;
• other potential sources of bias.
We completed a ’Risk of bias’ table for each study, incorporating
a description of the study’s performance against each of the above
domains and our overall judgement of the risk of bias for each
entry as follows: ’Low’, ’Unclear’ (indicating unclear or unknown
risk of bias) and ’High’ risk of bias.
Measures of treatment effect
We calculated the risk ratio (RR) for allogeneic blood transfusion
in the intervention group as compared with the control group and
the corresponding 95% confidence intervals for each trial using
the random-effects model (Der Simonian 1986). We adopted a
similar approach to examine the other outcomes of transfusion.
We also entered the mean number of units of red blood cells trans-
fused to each group and the corresponding standard deviations.
We used the mean difference (MD) and 95% confidence intervals
(CI) to express the average reduction in the number of units of
RBC administered to the intervention group, compared with the
control.
Unit of analysis issues
The unit of analysis was the patient. We converted data expressed
in millilitres (ml) for the volume of blood transfused to units of
blood by dividing by 300.
Dealing with missing data
All analyses were on an intention-to-treat basis. We imputed no
missing data.
Assessment of heterogeneity
There was significant clinical heterogeneity. The trials included
surgical, medical and critical care patients. We pooled the data for
all outcomes and presented data stratified by subgroups for the
primary outcome only. The subgroups evaluated were allogeneic
transfusion, autologous transfusion and clinical settings (cardiac
surgery, orthopaedic surgery, vascular surgery, acute blood loss/
trauma, cancer and critical care). We also examined the proportion
of patients exposed to transfusion stratified by the transfusion
threshold (difference > 2 g/dL, < 2 g/dL), risk of bias and units of
blood transfused.
We examined statistical heterogeneity using both the I² statistic
and Chi² test. The I² statistic describes the percentage of total
variation across studies due to heterogeneity rather than chance. A
value of 0% indicates no observed heterogeneity and larger values
show increasing heterogeneity; substantial heterogeneity is consid-
ered to exist when the I² > 50% (Higgins 2011). For the Chi² test,
we used a P value of < 0.10 to indicate the presence of statistically
significant heterogeneity.
Assessment of reporting biases
We examined funnel plots for evidence of publication bias. Al-
though the small number of trials hampered funnel plot assess-
ment, the outcome with the largest data set could be assessed for
the presence of publication bias. The funnel plot for this outcome
is presented in Figure 1.
5Transfusion thresholds and other strategies for guiding allogeneic red blood cell transfusion (Review)
Copyright © 2012 The Cochrane Collaboration. Published by John Wiley & Sons, Ltd.

Figure 1. Funnel plot of comparison 1.1 Patients exposed to blood transfusion (all studies).
Data synthesis
Due to the anticipated significant clinical heterogeneity of the
trials, we analysed data using a random-effects model.
We performed all analyses using Review Manager software. We
entered data on the numbers of patients exposed to allogeneic
blood and the numbers of patients in each treatment group into
Review Manager. We converted data in millilitres (ml) to units by
dividing by 300. We converted studies reporting haematocrit to
haemoglobin concentration by dividing by three.
Subgroup analysis and investigation of heterogeneity
We performed subgroup analyses to explore treatment effects by
blood product (allogeneic versus autologous, units of blood trans-
fused), clinical setting (cardiac surgery, orthopaedic surgery, vas-
cular surgery, acute blood loss/trauma, cancer, critical care), trans-
fusion threshold (difference > 2 grams per decilitre and difference
less than 2 grams per decilitre) and risk of bias.
Sensitivity analysis
We performed a sensitivity analysis to assess the effects of study
allocation concealment on the results.
R E S U L T S
Description of studies
See: Characteristics of included studies; Characteristics of
excluded studies; Characteristics of studies awaiting classification;
Characteristics of ongoing studies.
Results of the search
The original literature search conducted in 1999 identified 110
full-text articles. Of these 110 eligible studies, 99 were excluded
from further assessment (transfusion audits and reviews n = 94;
observational studies - cohort or case-control studies n = 5). We
considered 11 full-text articles for review. Of these 11 studies one
was excluded because the trigger was based on the level of HbS
not the haemoglobin or haematocrit level.
We conducted an updated search in November 2004. No new
trials were identified by this search.
An updated search conducted in 2009 identified an additional
seven trials. A further search conducted in February 2011 identi-
fied an additional two trials.
6Transfusion thresholds and other strategies for guiding allogeneic red blood cell transfusion (Review)
Copyright © 2012 The Cochrane Collaboration. Published by John Wiley & Sons, Ltd.
Included studies
We identified and included 19 eligible studies in this review.
Among the 19 included trials the clinical settings were variable.
Eight studies took place within the context of surgery: cardiac,
vascular or orthopaedic (Bracey 1999; Bush 1997; Carson 1998;
Carson 2011; Foss 2009; Grover 2005; Hajjar 2010; Johnson
1992; Lotke 1999; So-Osman 2010). Five trials were in the con-
text of acute blood loss and/or trauma (Blair 1986; Colomo 2008;
Fortune 1987; Topley 1956; Zygun 2009), three trials involved
patients in critical care units (Hebert 1995; Hebert 1999; Lacroix
2007) and one trial involved leukaemia patients undergoing che-
motherapy or stem cell transplantation (Webert 2008).
There was considerable variation with regard to the restrictive
transfusion strategies used. These varied from 7.0 to 9.0 g/dL,
with two further trials specifying haematocrit values of 25% or
30% (equivalent to haemoglobin levels of around 8.0 and 10.0
g/dL respectively). The liberal transfusion triggers varied: 100%
of ’normal red cell volume’ (Topley 1956), two units of blood
(immediately in one trial (Blair 1986), postoperatively in another
(Lotke 1999)) irrespective of clinical state; transfusion sufficient
to maintain haemoglobin levels at or above 12.0 g/dL (Webert
2008), 10.0 g/dL (Bush 1997; Carson 1998; Carson 2011; Foss
2009; Grover 2005; Hebert 1995; Hebert 1999); Hajjar 2010, 9.5
g/dL (Lacroix 2007) and 9.0 g/dL (Bracey 1999; Colomo 2008;
Zygun 2009). Two trials specified the liberal triggers as haematocrit
levels of 32% (Johnson 1992) and 40% (Fortune 1987). One trial
compared a new uniform, restrictive transfusion policy with more
liberal standard care (So-Osman 2010).
In these trials random allocation was at the level of the patient, not
the clinician or clinical unit. Consequently, participating clinicians
may have been responsible for patients in both arms of the trials.
Ten trials included more than 100 patients. Only one trial included
over 1000 patients (Carson 2011). A total of 6264 trial participants
were included in this systematic review.
Excluded studies
One randomised controlled trial was confined to patients with
sickle cell disease and was excluded as the trigger was based on the
level of HbS, not the haemoglobin or haematocrit level (Vichinsky
1995).
Risk of bias in included studies
For further details regarding the performance of the studies against
each domain, please see the ’Risk of bias’ tables. A summary of
the information in the tables is given below. Additionally, a visual
summary of judgements about each methodological quality item
for each included trial is shown in Figure 2 and Figure 3.
7Transfusion thresholds and other strategies for guiding allogeneic red blood cell transfusion (Review)
Copyright © 2012 The Cochrane Collaboration. Published by John Wiley & Sons, Ltd.
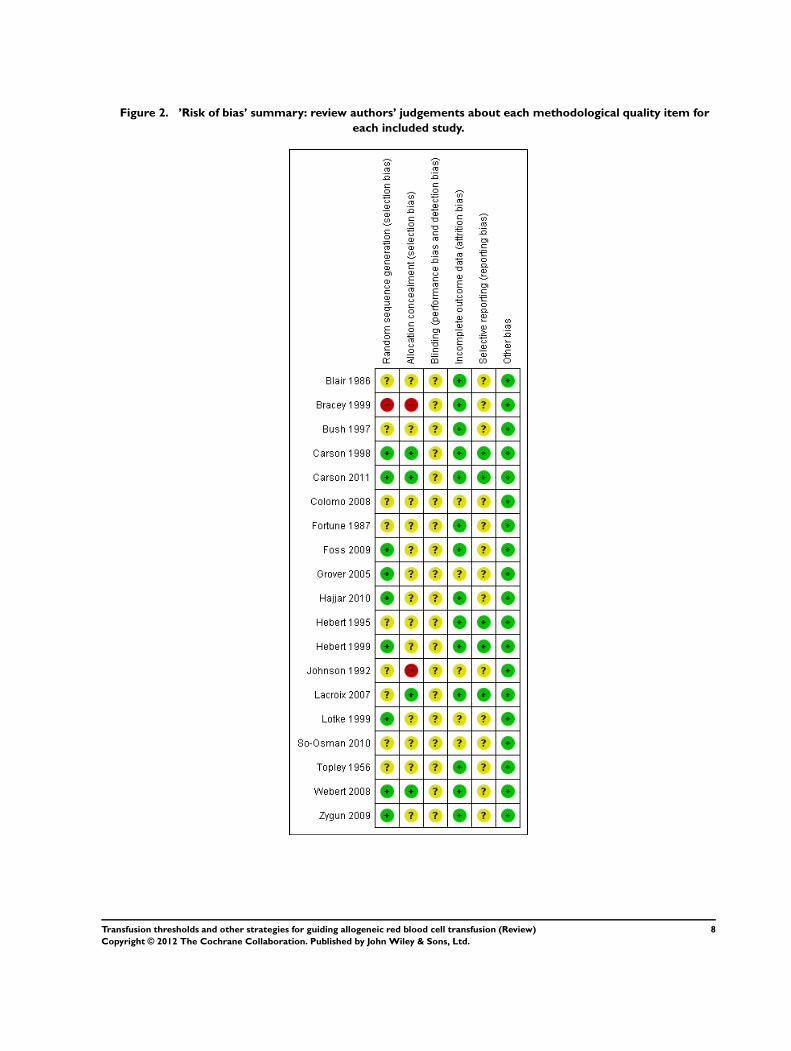
Figure 2. ’Risk of bias’ summary: review authors’ judgements about each methodological quality item for
each included study.
8Transfusion thresholds and other strategies for guiding allogeneic red blood cell transfusion (Review)
Copyright © 2012 The Cochrane Collaboration. Published by John Wiley & Sons, Ltd.

Figure 3. ’Risk of bias’ graph: review authors’ judgements about each risk of bias item presented as
percentages across all included studies. Nineteen studies are included in this review.
Sequence generation (selection bias)
We judged the risk of bias for this item to be low for nine trials,
eight of which used computer randomisation and one which used
a table of random numbers to generate the allocation sequence
for the patients. One trial based the randomisation sequence on
hospital record number and we judged it to be at high risk of bias,
while the remaining nine trials presented insufficient information
to assess the adequacy of sequence generation and we rated them
as unclear.
Allocation
We judged the risk of bias for this item to be low for four tri-
als which used central allocation. We rated 13 trials as unclear;
seven used sealed envelopes, however, it was not clear if they were
used with appropriate safeguards (e.g. sequentially numbered) to
adequately conceal allocation. The other six rated as unclear did
not present any information regarding allocation concealment. We
rated two trials as being at high risk of bias for this domain.
Blinding
The nature of the intervention means that blinding of clinicians in-
volved in the care and administration of blood transfusions would
not have been feasible. The extent to which this could have biased
the results is unclear, thus we have rated none of the studies as
being at low risk of bias for this domain. However, blind outcome
assessment was reported as being used in eight trials.
Incomplete outcome data
We rated 14 trials as being at low risk of bias for this domain
as they either had no missing data or performed intention-to-
treat analyses. A small number of exclusions were reported in the
remaining five trials, although the extent to which this may have
introduced bias is uncertain, thus we rated these trials as unclear.
Selective reporting
We could not find any evidence of reporting bias. Although we
did not have access to the trial protocols for the majority of trials,
the results for the primary and secondary outcomes, as described
in the methods sections of each trial, were clearly and concisely
reported. Trial protocols were available for the trials with which the
authors had some degree of involvement (Carson 1998; Carson
2011; Hebert 1995; Hebert 1999; Lacroix 2007).
Other potential sources of bias
We identified no other sources of bias.
9Transfusion thresholds and other strategies for guiding allogeneic red blood cell transfusion (Review)
Copyright © 2012 The Cochrane Collaboration. Published by John Wiley & Sons, Ltd.

Effects of interventions
Eighteen of the 19 trials presented data suitable for inclusion in the
meta-analyses. One trial evaluated changes in brain tissue oxygen
and other metabolic parameters (Zygun 2009).
Despite the heterogeneity in the methods and transfusion triggers
reported in these randomised trials, it was possible to aggregate
data from the following outcomes: exposure to red cell transfusion,
exposure to red cell transfusion (allogeneic), average volume of red
cells transfused in all patients, average volume of red cells trans-
fused in transfused patients, haemoglobin concentration, cardiac
events, myocardial infarction, pulmonary oedema, cerebrovascu-
lar accident, pneumonia, infection, mortality at 30 days, hospital
mortality, overall length of hospital stay and intensive care unit
length of hospital stay.
Proportion of patients transfused
Analysis 1.1
Data on the frequency of transfusions were available from 17 tri-
als. On average, the implementation of a restrictive transfusion
trigger reduced the risk of receiving a red cell transfusion by a
relative 39% (risk ratio (RR) 0.61, 95% confidence interval (CI)
0.52 to 0.72). Heterogeneity between these trials was statistically
significant (Chi² = 238.95, df = 16 (P < 0.00001); I² = 93%).
The funnel plot displays an absence of smaller studies showing
patients at elevated risk of receiving a transfusion with more re-
strictive transfusion triggers.
Quantity of red cells transfused
Analysis 1.7
The quantities of blood transfused were reported in eight trials.
The use of a restrictive transfusion trigger resulted in an average
saving of 1.19 units of red cells per transfused patient (mean dif-
ference (MD) -1.19, 95% CI -1.85 to -0.53). Heterogeneity be-
tween these trials was statistically significant (Chi² = 84.46, df = 7
(P < 0.00001); I² = 92%). One trial transfused autologous blood
(Lotke 1999).
Haemoglobin or haematocrit concentration
Analysis 2.1
Postoperative haemoglobin or haematocrit levels were reported
in 12 trials. In five trials the timing of measurement varied (the
average measured over a number of days after hospitalisation (or
operation)). In five trials a single value prior to discharge was
recorded and in one trial a single value after the first transfusion was
recorded. When we pooled data (without regard to timing, which
was consistent within studies) patients assigned to a restrictive
strategy had haemoglobin concentration on average 1.5% lower
than patients assigned to a liberal transfusion strategy (MD -1.48,
95% CI -1.92 to -1.03). Heterogeneity between these trials was
statistically significant (Chi² = 752.16, df = 11 (P < 0.00001); I²
= 99%).
Mortality
Analysis 3.2; Analysis 3.5
Thirty-day mortality data were reported for 11 trials. There was
no statistically significant difference in 30-day mortality between
restrictive and liberal transfusion strategies (RR 0.85, 95% CI 0.70
to 1.03). Heterogeneity between these trials was not statistically
significant (Chi² = 5.90, df = 9 (P = 0.75); I² = 0%). It should be
noted that one study of patients in intensive care (Hebert 1999)
contributed 52.0% and the study in patients with hip fracture
(Carson 2011) contributed 23.4% of the weight in the meta-anal-
ysis of this outcome. Hospital mortality was 23% lower in patients
in the restrictive compared to the liberal transfusion strategy (RR
0.77, 95% CI 0.62 to 0.95). Heterogeneity between the trials was
not significant (Chi² = 1.35, df = 3 (P = 0.72); I² = 0%).
Hospital length of stay
Analysis 4.1
Eight trials reported data for length of hospital stay. These data
indicated that the reduction in red blood cell transfusion was not
associated with a prolongation of hospital stay (MD 0.11 days,
95% CI -0.16 to 0.38 days). Heterogeneity between these trials
was not statistically significant (Chi² = 6.28, df = 7 (P = 0.51); I² =
0%). It is unclear if length of hospital stay included only patients
who survived.
Functional recovery
Analysis 5.1; Analysis 5.2
Two trials reported functional outcomes in hip fracture patients
(Carson 2011; Foss 2009). The functional measures were differ-
ent in the trials and could not be combined. Death or inability to
walk at 30 days (RR 1.05, 95% CI 0.95 to 1.15) or 60 days (RR
0.99, 95% CI 0.88 to 1.11) was not significant between transfu-
sion strategies. No other measures of function were significantly
different between transfusion strategies.
Cardiac events
Analysis 6.1
Seven trials reported data on cardiac events. The rates of cardiac
events (myocardial infarction, cardiac arrhythmias, cardiac arrest,
pulmonary oedema and angina) were not increased significantly
by the use of restrictive transfusion strategies (RR 0.96, 95% CI
0.70 to 1.32). Heterogeneity between these trials was statistically
significant (Chi²= 16.87, df = 6 (P = 0.010); I² = 64%). It is
likely that patients were counted in more than one category of this
composite outcome.
10Transfusion thresholds and other strategies for guiding allogeneic red blood cell transfusion (Review)
Copyright © 2012 The Cochrane Collaboration. Published by John Wiley & Sons, Ltd.

Myocardial infarction
Analysis 6.2
Eight trials reported data on myocardial infarction (fatal and non-
fatal). The use of a restrictive transfusion threshold did not appear
to impact adversely on the rates of myocardial infarction (RR
0.88, 95% CI 0.38 to 2.04). There was no statistical heterogeneity
between trials (Chi²= 10.42, df = 7 (P = 0.17); I² = 33%).
Pulmonary oedema
Analysis 6.3
Five trials reported data for pulmonary oedema. There was no
significant difference between the restrictive and liberal transfusion
strategies (RR 0.72, 95% CI 0.31 to 1.70). Heterogeneity between
the trials was significant (Chi² = 11.40, df = 4 (P = 0.02); I² =
65%).
Cerebrovascular accident - stroke
Analysis 6.4
Five trials reported on stroke. There was no significant difference
between transfusion strategies (RR 0.84, 95% CI 0.47 to 1.49).
Heterogeneity between the trials was not significant (Chi² = 2.61,
df = 4 (P = 0.63); I² = 0%).
Pneumonia
Analysis 6.5
Five trials reported data for pneumonia. In contrast to overall
infections; there was no significant difference between transfusion
strategies (RR 0.93, 95% CI 0.76 to 1.15). Heterogeneity between
these trials was not statistically significant (Chi²= 2.51, df = 4 (P
= 0.64); I² = 0%).
Infections
Analysis 6.8
Six trials reported data for infections. The rate of infections was
decreased by 19% with the use of restrictive transfusion strategies
although the results are not significant (RR 0.81, 95% CI 0.66
to 1.00). Heterogeneity between these trials was not statistically
significant (Chi² = 5.70, df = 5 (P = 0.34); I² = 12%).
Other outcomes
A number of other potentially relevant clinical outcomes were re-
ported in individual trials, including thromboembolism, multi-
organ failure, mental confusion and delayed wound healing. Al-
though there were no statistically significant differences between
restrictive and liberal transfusion strategies for any of these out-
comes, the overall event rates were low. Interestingly, one trial
(Blair 1986) reported a decreased risk of re-bleeding in patients
randomised to a restrictive transfusion strategy compared to pa-
tients randomised to a liberal transfusion strategy (RR 0.10, 95%
CI 0.01 to 0.75). Where reported, heart rates, cardiac index and
systemic vascular resistance also appeared to be unaffected (Bush
1997; Johnson 1992).
Sensitivity analyses
We performed a post hoc sensitivity analysis to explore the effects
of the inclusion of data from the Webert 2008 trial in the pooled
analyses. Webert 2008 explored whether a higher transfusion
threshold would be beneficial for patients with acute leukaemia,
unlike the other included studies which investigated the safety of a
lower transfusion threshold. When we excluded data from Webert
2008 from the pooled analysis of blood transfusion exposure, the
risk ratio was reduced slightly from 0.63 (95% CI 0.54 to 0.74)
to 0.61 (95% CI 0.53 to 0.71). Heterogeneity between these tri-
als remained statistically significant (Chi² = 96.82, df = 13, P <
0.00001; I² = 87%).
D I S C U S S I O N
We identified 19 randomised controlled trials evaluating different
red cell transfusion triggers carried out over a 55-year time period.
These trials enrolled 6264 patients from divergent patient popula-
tions. The results of the meta-analyses indicated that, on average,
restrictive transfusion strategies were associated with a reduction
of more than one-third in the number of patients receiving blood,
a red cell transfusion requirement that was approximately one unit
lower, and a haemoglobin concentration (average postoperative)
that was around 1.5 g/dL lower than in the liberal transfusion
group. However, such results need tempering against the signifi-
cant heterogeneity of the trials assessed.
Sources of heterogeneity
For the primary outcome (the number of patients exposed to blood
transfusion) we observed substantial heterogeneity. The variation
was in terms of the size (but not the direction) of the treatment ef-
fect. The individual trials (with five exceptions: Bush 1997; Grover
2005; So-Osman 2010; Topley 1956; Webert 2008) found that
a restrictive transfusion trigger statistically significantly reduced
the probability of receiving a red cell transfusion, with the risk
ratio estimates ranging from 0.21 to 0.96. However, some confi-
dence intervals were non-overlapping. Heterogeneity might have
been anticipated, as the clinical settings and the transfusion trig-
gers differed between trials. In addition, the primary outcome in
the meta-analysis, the decision to transfuse, is a practice variable
and involves a degree of subjectivity. It cannot be argued that the
treatment effect varied according to the rate of red cell transfusion
11Transfusion thresholds and other strategies for guiding allogeneic red blood cell transfusion (Review)
Copyright © 2012 The Cochrane Collaboration. Published by John Wiley & Sons, Ltd.

in the control groups, as most patients (84%) in the liberal trans-
fusion groups received red cell transfusions.
The level of the transfusion trigger between trials does not seem to
account for the variation in treatment effect size; the relative risk
appeared unrelated to it. However, the degree of difference within
trials, between the transfusion triggers of the intervention and con-
trol groups, may account for some of the variation observed in
the treatment effect size. The effect estimates for trials comparing
well-defined transfusion rates that differed by 2.0 g/dL tended to
be larger than the estimates for trials comparing thresholds differ-
ing by less than 2.0 g/dL. Although these apparent ’associations’
may also be due to the play of chance, such observations warrant
further discussion.
Two trials (Blair 1986; Lotke 1999) showed greater benefit (in
favour of restrictive transfusion strategies) in reducing exposure to
red cell transfusion, than any of the other trials. These two trials
appeared to add considerably to the observed heterogeneity. In
Blair 1986 the control group were routinely transfused (as dictated
by the trial protocol) at least two units of blood within 24 hours of
hospital admission, regardless of their Hb level and clinical state,
whereas the intervention group were only transfused blood when
their Hb concentration fell below 8.0 g/dL or they displayed signs
of shock. For this trial (Blair 1986) the transfusion exposure rate
for the intervention group was 19% compared to 100% for the
control group. For the trial conducted by Lotke 1999 the con-
trol group received all of their preoperatively donated autologous
(PAD) blood (2 units/patient) immediately after surgery (as dic-
tated by the trial protocol) whereas the patients in the interven-
tion group were not transfused their PAD blood unless their Hb
concentration fell to less than 9.0 g/dL. For this trial (Lotke 1999)
the transfusion exposure rate for the intervention group was 26%
compared to 100% in the control group.
Five trials (Bush 1997; Grover 2005; So-Osman 2010; Topley
1956; Webert 2008) failed to show a statistically significant reduc-
tion in red cell transfusion rates. For Bush 1997 and Webert 2008
protocol violations may have impacted significantly on the rates
of transfusion in the intervention groups. In Bush 1997, patients
randomised to the intervention group were to be transfused allo-
geneic red cells, and in some instances autologous red cells, when
their Hb concentration fell below 9.0 g/dL; the control group
were transfused when their Hb concentration fell below 10.0 g/dL.
The authors of Bush 1997 conceded that not all the patients ran-
domised to the restrictive transfusion strategy reached the trans-
fusion threshold level of Hb < 9.0 g/dL because they either had
minimal intra-operative blood loss or were excessively transfused
by the anaesthetists or surgeons. The later may account for the
relatively small difference in transfusion rates between the inter-
vention and control groups (88% versus 80%, respectively). In
Webert 2008, patients were allocated to receive RBC transfusion
when their Hb level fell below 8.0 g/dL in the intervention group
or 12.0 g/dL in the control. The trial authors note that a num-
ber of patients received transfusion before their assigned thresh-
old had been reached; compliance with the assigned threshold was
achieved only 64% of the time in the intervention and 70% of the
time in the control group. This also may explain the similar trans-
fusion rates observed in the two groups (90% and 94% for the
restrictive and liberal groups, respectively). The trial by So-Osman
2010 compared a new age-dependent restrictive transfusion policy
with the standard policy used in the three participating hospitals.
Deviation from the assigned trigger was not found to be a prob-
lem, however differences in the transfusion threshold forming the
standard policy of the hospitals may explain the lack of difference
observed in transfusion rates (36% and 39% for intervention and
control, respectively). The trial by Topley 1956 was designed so
that one group of patients (’under-transfused’ group) would have
a red cell volume (RCV) of 70% to 80% of normal at the end
of resuscitation, whilst the control group (’adequately transfused’
group) would have a RCV of 100% of normal or over at the end
of resuscitation. However, as reported, in practice these objectives
were achieved with an accuracy of only ± 20%.
There is no evidence to suggest that clinical setting or adequacy
of allocation concealment explains the variability in the effect es-
timates.
Adverse events and other outcomes
None of the outcomes evaluated, including mortality, cardiac mor-
bidity, infections and length of hospital stay, appear to be adversely
affected by the lower use of red cell transfusions. In contrast, the
evidence raises the possibility of harm associated with liberal trans-
fusion. In-hospital mortality and infections were 23% and 19%
higher in patients receiving liberal transfusion, respectively. How-
ever, these findings should be interpreted cautiously. Mortality was
not significantly different for the other time periods examined.
The infection results were borderline significant and the risk of
pneumonia was not elevated. Although very little heterogeneity
was seen for the outcome variable mortality, the meta-analysis was
dominated by two trials (Carson 2011; Hebert 1999) that con-
tributed 75% of the statistical information.
These data are quite informative and support the recent move to
more restrictive transfusion practices. Trials have now been per-
formed in several settings where transfusion is widely used. Trials
in adult and paediatric intensive care unit (ICU) patients confirm
the safety of a 7.0 g/dL threshold in patients with severe acute ill-
ness. One trial in elderly hip fracture patients undergoing surgery
and with extensive co-morbidity including underlying cardiovas-
cular disease suggests that restrictive transfusion to 8.0 g/dL is safe
as well. This trial is also the first to demonstrate that liberal trans-
fusion does not improve functional recovery.
Sources of bias
12Transfusion thresholds and other strategies for guiding allogeneic red blood cell transfusion (Review)
Copyright © 2012 The Cochrane Collaboration. Published by John Wiley & Sons, Ltd.

We performed extensive searches in an attempt to identify all eli-
gible trials irrespective of publication status. Despite these efforts,
inspection of the funnel plot (Figure 1) raises the possibility of
publication bias or other small study biases affecting the exposure
to blood transfusion outcome.
Our analyses demonstrate that only two trials in adults (Carson
2011; Hebert 1999) were adequately powered to evaluate the im-
pact of different transfusion strategies on mortality, morbidity and
function. Carson 2011 was the largest trial performed and in-
cluded 2016 patients undergoing surgical repair for hip fracture.
Hebert 1999 was the next largest study, involving 838 intensive
care patients. Given this, the meta-analysis of mortality is domi-
nated by studies in elderly surgical and intensive care patients and
therefore it is uncertain if the results can be applied to other clin-
ical settings. In paediatric intensive care unit patients there was
no difference in new or progressive multiple-organ dysfunction
syndrome (Lacroix 2007).
Several important clinical outcomes have not been adequately eval-
uated in the trials published to date. The studies evaluating my-
ocardial infarction are too small to detect moderate differences
and infection results are inconsistent. Observational data suggest
that higher blood counts may be associated with less postoperative
delirium (Weiskopf 2000).
This systematic review found new evidence of the safety of restric-
tive transfusion triggers in important subsets of patients with un-
derlying cardiovascular disease (Carson 2011). Overall, the rates
of cardiac events in this meta-analysis were not increased by the
use of restrictive transfusion triggers; the trial was too small to
detect small to moderate effects. However, evidence is still lacking
in other important subsets of patients, including those with acute
cardiovascular disease, renal failure and haematological disorders.
Some guidelines recommend transfusion for symptoms or haemo-
dynamic instability, rather than for a specific trigger haemoglobin
level (AAGBI 2008; ASA 2006; ASBT 2001; Napolitano 2009;
NBUGI 2001). This approach to transfusion was tested in a pilot
study involving 84 patients (Carson 1998) and in a trial involving
2016 patients (Carson 2011) in which patients could be trans-
fused with symptoms (cardiac chest pain, congestive heart failure
and orthostatic hypotension or tachycardia unresponsive to ade-
quate fluid challenge) or haemoglobin concentration less than 8.0
g/dL. These studies found no difference in functional recovery,
mortality or morbidity in patients in the restrictive (symptomatic)
transfusion group.
The results of these trials need to be viewed against six large obser-
vational studies that compared clinical outcomes at varying hae-
moglobin levels in transfused and non-transfused patients, and
found conflicting results. In a study of 2202 patients undergo-
ing coronary bypass surgery, the liberal transfusion group had a
higher incidence of myocardial infarction than the conservative
transfusion group (Spiess 1998). In a study of 8787 hip fracture
patients, there was no difference in short or long-term mortality
between patients transfused and not transfused down to a post-
operative haemoglobin of 8.0 g/dL (Carson 1998). In a study of
4470 ICU patients, mortality was reduced in patients receiving
transfusion of up to six units of blood (Hebert 1997). A retrospec-
tive study of 78,974 Medicare beneficiaries (Wu 2001) found that
blood transfusion was associated with a lower short-term mortal-
ity rate among elderly patients with acute myocardial infarction if
the haematocrit on admission was 30% or lower and that blood
transfusion may be effective with a haematocrit as high as 33% on
admission. A study of 310,311 patients 65 years or older who un-
derwent major non-cardiac surgery found a 1.6% increase in 30-
day postoperative mortality for each 1% decrease in preoperative
haematocrit (Wu 2007). A study of 239,286 patients 65 years or
older who underwent major non-cardiac surgery found intraoper-
ative blood transfusion was associated with a reduction in mortal-
ity in patients with preoperative haematocrit levels of < 24% or in
those with blood loss > 500 cc (Wu 2010). The main limitation of
these observational studies is that there may be residual confound-
ing by indication, despite the extensive statistical adjustment of
the results. It is possible that differences in patient characteristics
between transfused and non-transfused patients may not be iden-
tified, or adequately adjusted for. This point is emphasised by the
fact that a randomised controlled trial (Hebert 1999) and an obser-
vational study (Hebert 1997) in intensive care patients, performed
by the same group of investigators, came to opposite conclusions.
Despite recent assertions to the contrary (Benson 2000; Concato
2000), we believe that adequately powered, rigorously performed,
randomised clinical trials are the only way of overcoming these
limitations.
A study presented at the Cochrane Colloquium in Lyon, France
(9-13 October 2001) (Henry 2001a) highlighted the significant
discrepancies in the results reported by randomised controlled tri-
als compared to those reported by observational studies. This and
other studies (Ioannidis 2001) have shown that disagreements in
the magnitude of treatment effect between randomised controlled
trials (RCTs) and observational studies are common. The authors
of Henry 2001a analysed the data from studies of various interven-
tions including: preoperative autologous donation (PAD), acute
normovolemic haemodilution, cell salvage, laparoscopic cholecys-
tectomy, hormone replacement therapy and antioxidant therapy.
For PAD alone, the observational studies’ (n = 41) estimate of
treatment effect (risk ratio) for the number of patients exposed to
allogeneic blood transfusion was 0.30 (95% confidence interval
(CI) 0.26 to 0.35) compared to 0.39 (95% CI 0.27 to 0.57) for
the RCTs (n = 7). For this intervention (PAD) there appears to
be reasonable agreement between the results of the observational
studies and the randomised controlled trials. However, the obser-
vational studies have appeared to over-estimate the magnitude of
the treatment effect. Observational studies of the other interven-
tions have tended to under-estimate the magnitude of treatment
effect. Although the results obtained from well-conducted obser-
vational studies are extremely valuable, making inferences from
observational data sets is problematic, as the sources of error and
13Transfusion thresholds and other strategies for guiding allogeneic red blood cell transfusion (Review)
Copyright © 2012 The Cochrane Collaboration. Published by John Wiley & Sons, Ltd.
bias that afflict observational studies do not afflict randomised tri-
als (Henry 2001a).
Conducting randomised clinical trials, where one intervention is a
clinical policy regarding red cell transfusion, is demanding. Mask-
ing (blinding) the use of transfusion at the bedside is difficult to
achieve unless study personnel are assigned to each patient, an
expensive procedure. Outcomes that are determined by observers
who are blind to the treatment group is probably the most rig-
orous approach that is practical. This approach was reported in
only eight of the trials reviewed here (Carson 1998; Carson 2011;
Foss 2009; Grover 2005; Hajjar 2010; Johnson 1992; Lotke 1999;
Webert 2008). Maintaining the integrity of the randomisation
process becomes important if the trial is not to over-estimate the
benefit of the intervention (Schulz 1995). Some studies in this
review did not report the methods used to conceal the allocation
sequence from the treating clinicians. Four trials (Carson 1998;
Carson 2011; Lacroix 2007; Webert 2008) used a centralised al-
location and four others (Bush 1997; Foss 2009; Hebert 1999;
So-Osman 2010) used randomisation codes in sealed envelopes.
The latter method has the potential to be unmasked, leading to
the potential for selection bias in the inclusion of patients in the
trials (Schulz 1995).
The transfusion policies reviewed here represent fairly small
modifications to routine clinical practice. They are consistent
with the recommendations of published clinical practice guide-
lines (AAGBI 2008; ASA 2006; ASBT 2001; BCTMAG 2003;
Napolitano 2009; NBUGI 2001). The transfusion triggers (in
terms of haemoglobin levels) were most often in the range of 8.0
to 9.0 g/dL, although values as low as 7.0 g/dL were assessed. In
fact, the ’restrictive’ transfusion triggers in some trials were equiv-
alent to the ’liberal triggers’ used in other trials. Nevertheless, the
trials documented significant reductions in the rates of red cell
transfusion and worthwhile blood conservation. These effects are
similar to what has been documented in meta-analyses of trials of
blood sparing techniques, such as cell salvage and anti-fibrinolytic
drugs (Carless 2010; Henry 2011b). Adoption of a conservative
transfusion threshold appears to be as effective as these technolo-
gies in avoiding the need for transfusion and is likely to cost less.
In summary, a restrictive transfusion trigger reduces the risk of ex-
posure to red blood cell transfusion and the total number of units
transfused. The currently published evidence suggests that restric-
tive transfusion triggers do not adversely affect mortality, cardiac
morbidity, function or length of hospital stay. For the present we
recommend the use of a restrictive transfusion trigger, but suggest
using caution in patients from high-risk groups such as acute coro-
nary syndrome as there is currently no evidence from randomised
controlled trials to guide treatment. In countries where there are
serious doubts about the safety of donated blood, because of inad-
equate testing for viral pathogens, the existing data may constitute
a stronger basis for avoiding red cell transfusion in many clinical
settings.
A U T H O R S ’ C O N C L U S I O N S
Implications for practice
In patients who do not have acute coronary artery disease, blood
transfusion can probably be withheld in the presence of haemo-
globin levels as low as 7.0 g/dL to 8.0 g/dL as long as there is no
notable bleeding. The benefits of minimising allogeneic red cell
transfusion are likely to be greatest where there is doubt about the
safety of the blood supply.
Implications for research
Future trials of transfusion ’triggers’ should include patients with
acute coronary syndrome, elderly patients recovering from acute
illness, patients with gastrointestinal bleeding, coagulopathy or
haemorrhagic shock, and patients with traumatic brain injury. Tri-
als are also needed that evaluate lower haemoglobin concentra-
tions such as 6.0 g/dL. Trials should be large enough to measure
the impact that lower thresholds have on clinical outcomes.
A C K N O W L E D G E M E N T S
We acknowledge the contribution of Suzanne Hill (World Health
Organization), the first author of the original version and the 2004
update of the review. We also acknowledge the contribution of
Kim Henderson in the original review first published in 2000. We
also acknowledge David Henry (Institute of Clinical Evaluative
Sciences) and Brian McClelland who co-wrote reviews up to 2010;
Katharine Ker (London School of Hygiene & Tropical Medicine)
undertook the following tasks for the 2010 update: screened search
output, obtained articles, applied inclusion/exclusion criteria to
retrieved papers, assessed risk of bias, extracted data, performed
data analysis and revised the text of the review. We thank Karen
Blackhall (Injuries Group Trials Search Co-ordinator) who ran the
electronic database searches in 2009 and 2011.
14Transfusion thresholds and other strategies for guiding allogeneic red blood cell transfusion (Review)
Copyright © 2012 The Cochrane Collaboration. Published by John Wiley & Sons, Ltd.

R E F E R E N C E S
References to studies included in this review
Blair 1986 {published data only}
Blair SD, Janvrin SB, McCollum CN, Greenhalgh RM.
Effect of early blood transfusion on gastrointestinal
haemorrhage. British Journal of Surgery 1986;73(10):783–5.
Bracey 1999 {published data only}
Bracey AW, Radovancevic R, Riggs SA, Houston S, Cozart
H, Vaughn WK, et al.Lowering the hemoglobin threshold
for transfusion in coronary artery bypass procedures: effect
on patient outcome. Transfusion 1999;39(10):1070–7.
Bush 1997 {published data only}
Bush RL, Pevec WC, Holcroft JW. A prospective,
randomized trial limiting perioperative red blood cell
transfusions in vascular patients. American Journal of Surgery
1997;174(2):143–8.
Carson 1998 {published data only}
Carson JL, Terrin ML, Barton FB, Aaron R, Greenburg
AG, Heck DA, et al.A pilot randomized trial comparing
symptomatic vs. hemoglobin-level-driven red blood cell
transfusions following hip fracture. Transfusion 1998;38(6):
522–9.
Carson 2011 {published data only}
Carson JL, Terrin ML, Noveck H, Sanders DW, Chaitman
BR, Rhoads GR, et al.Liberal or restrictive transfusion in
high-risk patients after hip surgery. New England Journal of
Medicine 2011;365(26):2453–62.
Colomo 2008 {published data only}
Colomo A, Hernandez-Gea V, Muniz-Diaz E, Madoz P,
Aracil C, Alvarez-Urturi C, et al.Transfusion strategies in
patients with cirrhosis and acute gastrointestinal bleeding.
Hepatology 2008;48(4 (Suppl)):413A.
Fortune 1987 {published data only}
Fortune JB, Feustel PJ, Saifi J, Stratton HH, Newell JC,
Shah DM. Influence of hematocrit on cardiopulmonary
function after acute hemorrhage. Journal of Trauma 1987;
27(3):243–9.
Foss 2009 {published data only}
Foss NB, Kristensen MT, Jensen PS, Palm H,
Krasheninnikoff M, Kehlet H. The effects of liberal versus
restrictive transfusion thresholds on ambulation after hip
fracture surgery. Transfusion 2009;49(2):227–34.
Grover 2005 {published data only}∗ Grover M, Talwalkar S, Casbard A, Boralessa H, Contreras
M, Boralessa H, et al.Silent myocardial ischaemia and
haemoglobin concentration: a randomized controlled trial
of transfusion strategy in lower limb arthroplasty. Vox
Sanguinis 2006;90:105–12.
Grover M, Talwalker SA, Contreras, Soni N. Blood
transfusion threshold and silent myocardial ischemia after
lower limb arthroplasty: a randomized controlled trial of
transfusion strategy. Transfusion Alternatives in Transfusion
Medicine 2005;7(1 (Suppl)):62–3.
Hajjar 2010 {published data only}
Hajjar LA, Vincent JL, Galas, FRGB, Nakamura RE, Silva
CMP, Santos MH, et al.Transfusion requirements after
cardiac surgery. The TRACS randomized controlled trial.
JAMA 2010;304(14):1559–67.
Hebert 1995 {published data only}
Hebert PC, Wells G, Marshall J, Martin C, Tweeddale
M, Pagliarello G, et al.Transfusion requirements in critical
care. A pilot study. Canadian Critical Care Trials Group
[published erratum appears in JAMA 1995 Sep 27;274(12):
944]. JAMA 1995;273(18):1439–44.
Hebert 1999 {published data only}∗ Hebert PC. A multicenter, randomized, controlled clinical
trial of transfusion requirements in critical care. New
England Journal of Medicine 1999;340(6):409–17.
McIntyre L, Hebert PC, Wells G, Fergusson D, Marshall
J, Yetisir E, et al.Canadian Critical Care Trials Group. Is
a restrictive transfusion strategy safe for resuscitated and
critically ill trauma patients?. Journal of Trauma 2004;57
(3):563–8.
McIntyre LA, Fergusson DA, Hutchison JS, Pagliarello
G, Marshall JC, Yetisir E, et al.A pilot randomized trial
comparing symptomatic vs. hemoglobin-level-driven red
blood cell transfusions following hip fracture. Transfusion
1998;38(6):522–9.
Johnson 1992 {published data only}
Johnson RG, Thurer RL, Kruskall MS, Sirois C, Gervino
EV, Critchlow J, et al.Comparison of two transfusion
strategies after elective operations for myocardial
revascularization. Journal of Thoracic & Cardiovascular
Surgery 1992;104(2):307–14.
Lacroix 2007 {published data only}
Lacroix J, Hébert PC, Hutchison JS, Hume HA, Tucci
M, Ducruet T, et al.Transfusion strategies for patients in
pediatric intensive care units. New England Journal of
Medicine 2007;356(16):1609–19.
Lotke 1999 {published data only}
Lotke PA, Barth P, Garino JP, Cook EF. Predonated
autologous blood transfusions after total knee arthroplasty:
immediate versus delayed administration. Journal of
Arthroplasty 1999;14(6):647–50.
So-Osman 2010 {published data only}
So-Osman C. A restrictive transfusion trigger is a method
for blood saving in elective orthopaedic surgery. Vox
Sanguinis 2004;87(Suppl 3):52.∗ So-Osman C, Nelissen R, Te Slaa R, Coene L, Brand R,
Brand A. A randomized comparison of transfusion triggers
in elective orthopaedic surgery using leucocyte-depleted red
blood cells. Vox Sanguinis 2010;98:56–64.
Topley 1956 {published data only}
Topley ET, Fisher MR. The illness of trauma. British Journal
of Clinical Practice 1956;10(11):770–6.
15Transfusion thresholds and other strategies for guiding allogeneic red blood cell transfusion (Review)
Copyright © 2012 The Cochrane Collaboration. Published by John Wiley & Sons, Ltd.

Webert 2008 {published data only}
Webert KE, Cook RJ, Couban S, Carruthers J, Lee KA,
Blajchman MA, et al.A multicenter pilot-randomized
controlled trial of the feasibility of an augmented red
blood cell transfusion strategy for patients treated with
induction chemotherapy for acute leukemia or stem cell
transplantation. Transfusion 2008;48(1):81–91.
Zygun 2009 {published data only}
Zygun DA, Nortje J, Hutchinson PJ, Timofeev I, Menon
DK, Gupta AK. The effect of red blood cell transfusion on
cerebral oxygenation and metabolism after severe traumatic
brain injury. Critical Care Medicine 2009;37(3):1074–8.
References to studies excluded from this review
Vichinsky 1995 {published data only}
Vichinsky EP, Haberkern CM, Neumayr L, Earles AN,
Black D, Koshy M, et al.A comparison of conservative
and aggressive transfusion regimens in the perioperative
management of sickle cell disease. The Preoperative
Transfusion in Sickle Cell Disease Study Group. New
England Journal of Medicine 1995;333(4):206–13.
References to studies awaiting assessment
Cooper 2011 {published data only}
Cooper HA, Rao SV, Greenberg MD, Rumsey MP,
Mckenzie M, Alcorn KW, et al.Conservative versus liberal
red cell transfusion in acute myocardial infarction (the
CRIT randomized pilot study). American Journal of
Cardiology 2011;108:1108–11.
References to ongoing studies
MINT {published data only}
Carson JL, Noveck H. Myocardial Ischemia and Transfusion
(MINT). http://www.ClinicalTrials.gov. [: NCT01167582]
TITRe 2 {published data only}
Reeves B. A multi-centre randomised controlled trial of the
effects of a reduction in the threshold for blood transfusion
following heart surgery. http://www.controlled-trials.com.
[: ISRCTN70923932]
Additional references
AAGBI 2008
Association of Anaesthetists of Great Britain and Ireland.
Blood transfusion and the anaesthetist - red cell transfusion.
http://www.aagbi.org/publications/guidelines/docs/
red˙cell˙08.pdf 2008; Vol. June:1–20.
Amin 2004
Amin M, Fergusson D, Wilson K, Tinmouth A, Aziz A,
Coyle D, et al.The societal unit cost of allogenic red blood
cells and red blood cell transfusion in Canada. Transfusion
2004;44(10):1479–86.
ASA 2006
American Society of Anesthesiologists Task Force on
Perioperative Blood Transfusion and Adjuvant Therapies.
Practice guidelines for perioperative blood transfusion and
adjuvant therapies. Anesthesiology 2006;105(1):198–208.
ASBT 2001
National Health and Medical Research Council (NHMRC)/
Australasian Society of Blood Transfusion (ASBT). Clinical
Practice Guidelines: Appropriate Use of Red Blood Cells.
2001.
BCTMAG 2003
Guidelines for Red Blood Cell Transfusion. British
Columbia Transfusion Medicine Advisory Group 2003;
Vol. November:1–3.
Benson 2000
Benson K, Hartz AJ. A comparison of observational studies
and randomized, controlled trials. New England Journal of
Medicine 2000;342(25):1878–86.
Carless 2010
Carless PA, Henry DA, Moxey AJ, O’Connell D, Brown
T, Fergusson DA. Cell salvage for minimising perioperative
allogeneic blood transfusion. Cochrane Database of
Systematic Reviews 2010, Issue 4. [DOI: 10.1002/
14651858.CD001888.pub4]
Concato 2000
Concato J, Shah N, Horwitz RI. Randomized, controlled
trials, observational studies, and the hierarchy of research
designs. New England Journal of Medicine 2000;342(25):
1887–92.
Der Simonian 1986
Der Simonian R, Laird N. Meta-analysis in clinical trials.
Controlled Clinical Trials 1986;7:177–88.
Goodnough 2008
Goodnough LT, Shander A. Risks and complications of
blood transfusions: optimizing outcomes for patients
with chemotherapy-induced anemia. Advanced Studies in
Medicine 2008; Vol. 8, issue 10:357–62.
Hebert 1997
Hebert PC, Wells G, Tweeddale M, Martin C, Marshall J,
Pham B, et al.Does transfusion practice affect mortality in
critically ill patients? Transfusion Requirements in Critical
Care (TRICC) Investigators and the Canadian Critical Care
Trials Group. American Journal of Respiratory & Critical
Care Medicine 1997;155(5):1618–23.
Henry 2001a
Henry DA, Moxey AJ, O’Connell D. Agreement between
randomised and non-randomised studies - the effects of
bias and confounding. Poster presentation - 9th Cochrane
Colloquium, Lyon, France (October 9-13).
Henry 2011b
Henry DA, Carless PA, Moxey AJ, O’Connell D, Stokes BJ,
Ferugsson DA, et al.Anti-fibrinolytic use for minimising
perioperative allogeneic blood transfusion. Cochrane
Database of Systematic Reviews 2011, Issue 3. [DOI:
10.1002/14651858.CD001886.pub4]
Higgins 2011
Higgins JPT, Green S (editors). Cochrane Handbook
for Systematic Reviews of Interventions Version 5.1.0
16Transfusion thresholds and other strategies for guiding allogeneic red blood cell transfusion (Review)
Copyright © 2012 The Cochrane Collaboration. Published by John Wiley & Sons, Ltd.

[updated March 2011]. The Cochrane Collaboration,
2011. Available from www.cochrane-handbook.org.
Ioannidis 2001
Ioannidis JPA, Haidich AB, Pappa M, Pantazis N, Kokori
SI, Tektonidou MG, et al.Comparison of evidence of
treatment effects in randomised and nonrandomised studies.
JAMA 2001;286:821–30.
Kitchen 2008
Kitchen AD, Barbara JAJ. Current information on the
infectious risks of allogeneic blood transfusion. Transfusion
Alternative in Transfusion Medicine 2008;10:102–11.
Klein 2007
Klein HG, Spahn DR, Carson JL. Red blood cell transfusion
in clinical practice. Lancet 2007;370(9585):415–26.
Madjdpour 2005
Madjdpour C, Spahn DR. Allogeneic red blood cell
transfusions: efficacy, risks, alternatives and indications.
British Journal of Anaesthesia 2005;95(1):33–42.
Napolitano 2009
Napolitano LM, Kurek S, Luchette FA, Corwin HL, Barie
PS, Tisherman SA, et al.Clinical practice guideline: red
blood cell transfusion in adult trauma and critical care.
Critical Care Medicine 2009;37(12):3124–57.
NBUGI 2001
National Blood Users Group Ireland. A Guideline
for Transfusion of Red Blood Cells in Surgical
Patients. http://www.dohc.ie/publications/
transfusion˙of˙red˙blood˙cells.html 2001; Vol. January:
1–20.
NIH 1988
National Institutes of Health. Perioperative red blood cell
transfusion. JAMA 1988;260:2700–3.
O’Brien 2007
O’Brien SF, Yi QL, Fan W, Scalia V, Kleinman SH,
Vamvakas EC. Current incidence and estimated residual risk
of transfusion-transmitted infections in donations made to
Canadian Blood Services. Transfusion 2007;47(2):316–25.
Review Manager
The Nordic Cochrane Centre, The Cochrane Collaboration.
Review Manager (RevMan). 5.1. Copenhagen: The Nordic
Cochrane Centre, The Cochrane Collaboration, 2011.
Schulz 1995
Schulz KF, Chalmers I, Hayes RJ, Altman DJ. Empirical
evidence of bias. Dimensions of methodological quality
associated with estimates of treatment effects in controlled
clinical trials. JAMA 1995;273:408–12.
Shander 2010
Shander A, Hofmann A, Ozawa S, Theusinger OM,
Gomboz H, Spahn DR. Activity-based costs of blood
transfusions in surgical patients at four hospitals. Transfusion
2010;50(4):753–65.
Spiess 1998
Spiess BD, Ley C, Body SC, Siegel LC, Stover EP, Maddi
R, et al.Hematocrit value on intensive care unit entry
influences the frequency of Q-wave myocardial infarction
after coronary artery bypass grafting. The Institutions of
the Multicenter Study of Perioperative Ischemia (McSPI)
Research Group. Journal of Thoracic & Cardiovascular
Surgery 1998;116(3):460–7.
Wang 2010
Wang JK, Klein HG. Red blood cell transfusion in the
treatment and management of anaemia: the search for the
elusive transfusion trigger. Vox Sanguinis 2010;98(1):2–11.
Weiskopf 2000
Weiskopf RB, Kramer JH, Viele M, Neumann M, Feiner
JR, Watson JJ, et al.Acute severe isovolemic anemia impairs
cognitive function and memory in humans. Anesthesiology
2000;92(6):1646–52.
Whitaker 2011
U.S. Department of Health and Human Services, Office
of the Assistant Secretary for Health. Report of the US
Department of Health and Human Services. The 2009
national blood collection and utilization survey report.
www.hhs.gov/ophs/bloodsafety/2007nbcus˙survey.pdf.
U.S. Department of Health and Human Services, Office of
the Assistant Secretary for Health., 2011.
WHO 2011
WHO. Blood safety: key global facts and figures in
2011. http://www.who.int/worldblooddonorday/media/
who˙blood˙safety˙factsheet˙2011.pdf 2011; Vol. Fact Sheet
279:1–9.
Wu 2001
Wu WC, Rathore SS, Wang Y, Radford MJ, Krumholz HM.
Blood transfusion in elderly patients with acute myocardial
infarction. New England Journal of Medicine 2001;345(17):
1230–6.
Wu 2007
Wu WC, Schifftner TL, Henderson WG, Eaton CB,
Poses RM, Uttley G, et al.Preoperative hematocrit levels
and postoperative outcomes in older patients undergoing
noncardiac surgery. JAMA 2007;297(22):2481–8.
Wu 2010
Wu WC, Smith TS, Henderson WG, Eaton CB, Poses RM,
Uttley G, et al.Operative blood loss, blood transfusion, and
30-day mortality in older patients after major noncardiac
surgery. Annals of Surgery 2010;252(1):11–7.
Zou 2009
Zou S, Stramer SL, Notari EP, Kuhns MC, Krysztof D,
Musavi F, et al.Current incidence and residual risk of
hepatitis B infection among blood donors in the United
States. Transfusion 2009;49(8):1609–20.
Zou 2010
Zou S, Dorsey KA, Notari EP, Foster GA, Krysztof DE,
Musavi F, et al.Prevalence, incidence, and residual risk
of human immunodeficiency virus and hepatitis C virus
infections among United States blood donors since the
introduction of nucleic acid testing. Transfusion 2010;50
(7):1495–504.∗ Indicates the major publication for the study
17Transfusion thresholds and other strategies for guiding allogeneic red blood cell transfusion (Review)
Copyright © 2012 The Cochrane Collaboration. Published by John Wiley & Sons, Ltd.
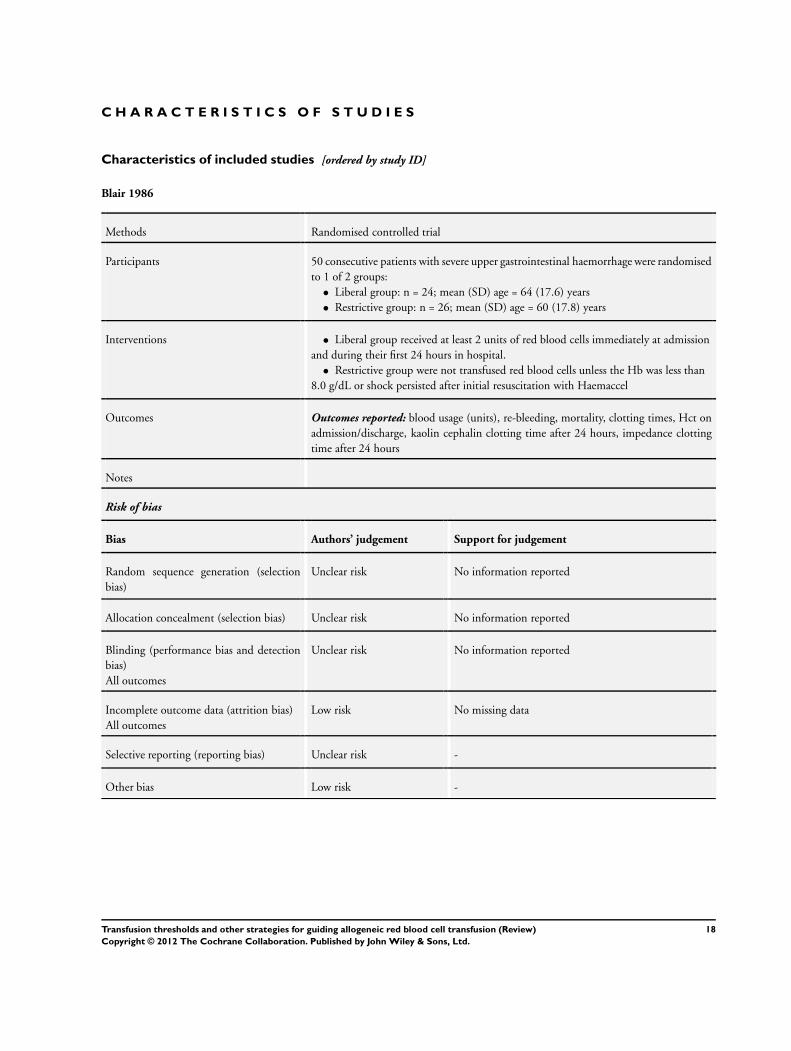
C H A R A C T E R I S T I C S O F S T U D I E S
Characteristics of included studies [ordered by study ID]
Blair 1986
Methods Randomised controlled trial
Participants 50 consecutive patients with severe upper gastrointestinal haemorrhage were randomised
to 1 of 2 groups:
• Liberal group: n = 24; mean (SD) age = 64 (17.6) years
• Restrictive group: n = 26; mean (SD) age = 60 (17.8) years
Interventions • Liberal group received at least 2 units of red blood cells immediately at admission
and during their first 24 hours in hospital.
• Restrictive group were not transfused red blood cells unless the Hb was less than
8.0 g/dL or shock persisted after initial resuscitation with Haemaccel
Outcomes Outcomes reported: blood usage (units), re-bleeding, mortality, clotting times, Hct on
admission/discharge, kaolin cephalin clotting time after 24 hours, impedance clotting
time after 24 hours
Notes
Risk of bias
Bias Authors’ judgement Support for judgement
Random sequence generation (selection
bias)
Unclear risk No information reported
Allocation concealment (selection bias) Unclear risk No information reported
Blinding (performance bias and detection
bias)
All outcomes
Unclear risk No information reported
Incomplete outcome data (attrition bias)
All outcomes
Low risk No missing data
Selective reporting (reporting bias) Unclear risk -
Other bias Low risk -
18Transfusion thresholds and other strategies for guiding allogeneic red blood cell transfusion (Review)
Copyright © 2012 The Cochrane Collaboration. Published by John Wiley & Sons, Ltd.

Bracey 1999
Methods Randomised controlled trial
Participants 428 consecutive patients undergoing elective primary coronary artery bypass graft surgery
were randomly assigned to 1 of 2 groups:
• Liberal group: n = 212; M/F = 82/18; mean (SD) age = 61 (11) years
• Restrictive group: n = 216; M/F = 83/17; mean (SD) age = 62 (11) years
Interventions • Liberal group received transfusions on the instructions of their individual
physicians, who considered the clinical assessment of the patient and the institutional
guidelines, which propose a Hb level < 9.0 g/dL as the postoperative threshold for
RBC transfusion
• Restrictive group received a RBC transfusion in the postoperative period at a Hb
level < 8.0 g/dL
Outcomes Outcomes reported: mortality, length of hospital stay, blood usage (units), blood loss,
complications, infection rates, cardiac events
Notes
Risk of bias
Bias Authors’ judgement Support for judgement
Random sequence generation (selection
bias)
High risk Patients were randomly assigned on the basis of the last
digit of their medical record number
Allocation concealment (selection bias) High risk Inadequately concealed (record number)
Blinding (performance bias and detection
bias)
All outcomes
Unclear risk No information
Incomplete outcome data (attrition bias)
All outcomes
Low risk Intention-to-treat analysis used. A small number of ex-
clusions were reported
Selective reporting (reporting bias) Unclear risk -
Other bias Low risk -
Bush 1997
Methods Randomised controlled trial
Participants 99 patients undergoing elective aortic or infrainguinal arterial reconstruction were ran-
domised to 1 of 2 groups:
• Liberal group: n = 49; M/F = 41/8; mean (SD) age = 64 (11) years
• Restrictive group: n = 50; M/F = 32/18; mean (SD) age = 66 (10) years
19Transfusion thresholds and other strategies for guiding allogeneic red blood cell transfusion (Review)
Copyright © 2012 The Cochrane Collaboration. Published by John Wiley & Sons, Ltd.

Bush 1997 (Continued)
Interventions • Liberal group had their Hb concentrations maintained at or above 10.0 g/dL
• Restrictive group were transfused only when their Hb concentration fell below 9.
0 g/dL
Outcomes Outcomes reported: 30-day mortality, length of ICU stay, length of hospital stay, blood
use (units), postoperative blood loss, cardiac events, Hct/Hb on admission
Notes
Risk of bias
Bias Authors’ judgement Support for judgement
Random sequence generation (selection
bias)
Unclear risk No information
Allocation concealment (selection bias) Unclear risk Sealed envelopes were chosen at random for patient as-
signment
Blinding (performance bias and detection
bias)
All outcomes
Unclear risk Both surgeons and anaesthesiologists were informed as
to the group of randomisation
Incomplete outcome data (attrition bias)
All outcomes
Low risk Appears to be complete
Selective reporting (reporting bias) Unclear risk -
Other bias Low risk -
Carson 1998
Methods Randomised controlled trial
Participants 84 hip fracture patients undergoing surgical repair who had postoperative Hb levels <
10.0 g/dL were randomly assigned to 1 of 2 groups:
• Liberal group: n = 42; M/F = 9/33; mean (SD) age = 81.3 (8.1) years
• Restrictive group: n = 42; M/F = 11/31; mean (SD) age = 83.3 (10.8) years
Interventions • Liberal group received 1 unit of packed RBC at the time of random assignment
and as much blood as necessary to keep the Hb level above 10.0 g/dL
• Restrictive group received a RBC transfusion for symptoms of anaemia or for a
Hb level that dropped below 8.0 g/dL
Outcomes Outcomes reported: mortality, length of hospital stay, blood usage (units), complications,
pneumonia, stroke, thromboembolism
Notes
20Transfusion thresholds and other strategies for guiding allogeneic red blood cell transfusion (Review)
Copyright © 2012 The Cochrane Collaboration. Published by John Wiley & Sons, Ltd.

Carson 1998 (Continued)
Risk of bias
Bias Authors’ judgement Support for judgement
Random sequence generation (selection
bias)
Low risk Randomisation schedules were stratified by clinical site
and cardiovascular disease state. The randomisation was
designed in blocks of 2 to 8 patients to avoid imbalance
within a site
Allocation concealment (selection bias) Low risk Study personnel at the clinical sites randomly assigned
patients by contacting the data co-ordinating centre’s 24-
hour automated telephone service
Blinding (performance bias and detection
bias)
All outcomes
Unclear risk Blinding of observers
Incomplete outcome data (attrition bias)
All outcomes
Low risk Intention-to-treat analysis used
Selective reporting (reporting bias) Low risk -
Other bias Low risk -
Carson 2011
Methods Randomised, unblinded, parallel, 2-group multicentre trial
Participants Patients 50 years or older, who are undergoing surgical repair of a hip fracture, with
Hb concentrations below 10.0 g/dL within 3 days after surgery and who have clinical
evidence for cardiovascular disease or cardiovascular risk factors
Sample size = 2016
Interventions • Liberal group - receive packed RBC when haemoglobin level dropped below 10.0
g/dL
• Restrictive (’symptomatic strategy’) group - receive transfusion if develop
symptoms of anaemia or if Hb falls below 8.0 g/dL
Outcomes Primary outcome is inability to walk 10 feet (or across a room) without human assistance
or death prior to closure of the window for the 60-day, 30 and 60-day mortality. Other
outcomes are Hb concentration, acute coronary syndrome (ACS), in-hospital myocar-
dial infarction, unstable angina or death, disposition on discharge, survival, functional
measures, fatigue/energy, readmission to hospital, pneumonia, wound infection, throm-
boembolism, stroke or transient ischaemic attack
Notes
Risk of bias
21Transfusion thresholds and other strategies for guiding allogeneic red blood cell transfusion (Review)
Copyright © 2012 The Cochrane Collaboration. Published by John Wiley & Sons, Ltd.

Carson 2011 (Continued)
Bias Authors’ judgement Support for judgement
Random sequence generation (selection
bias)
Low risk Data Co-ordinating Center staff prepared
randomisation schedules for each site using
randomly ordered block sizes of 2, 4, 6 or
8
Allocation concealment (selection bias) Low risk Used an automated telephone randomisa-
tion system
Blinding (performance bias and detection
bias)
All outcomes
Unclear risk After random allocation, clinical site staff,
clinicians and patients were not blinded
to treatment assignment. Primary and sec-
ondary outcomes were assessed blinded to
treatment assignment
Incomplete outcome data (attrition bias)
All outcomes
Low risk Intention-to-treat analysis
Selective reporting (reporting bias) Low risk -
Other bias Low risk -
Colomo 2008
Methods Randomised controlled trial
Participants 214 patients with acute gastrointestinal bleeding and cirrhosis were randomly allocated
to 1 of 2 groups:
• Liberal group: n = 105
• Restrictive group: n = 109
NB: no demographic information was presented, although stated that baseline charac-
teristics were similar in the 2 groups
Interventions • Liberal group received packed RBC when Hb level dropped below 9.0 g/dL (to
maintain Hb concentration at 9.0 to 10.0 g/dL)
• Restrictive group received packed RBC when Hb level dropped below 7.0 g/dL
(to maintain Hb concentration at 7.0 to 8.0 g/dL)
Outcomes Outcomes reported: mortality, therapeutic failures, transfusion, Hb concentration, side
effects
Notes Conference abstract
Risk of bias
Bias Authors’ judgement Support for judgement
22Transfusion thresholds and other strategies for guiding allogeneic red blood cell transfusion (Review)
Copyright © 2012 The Cochrane Collaboration. Published by John Wiley & Sons, Ltd.
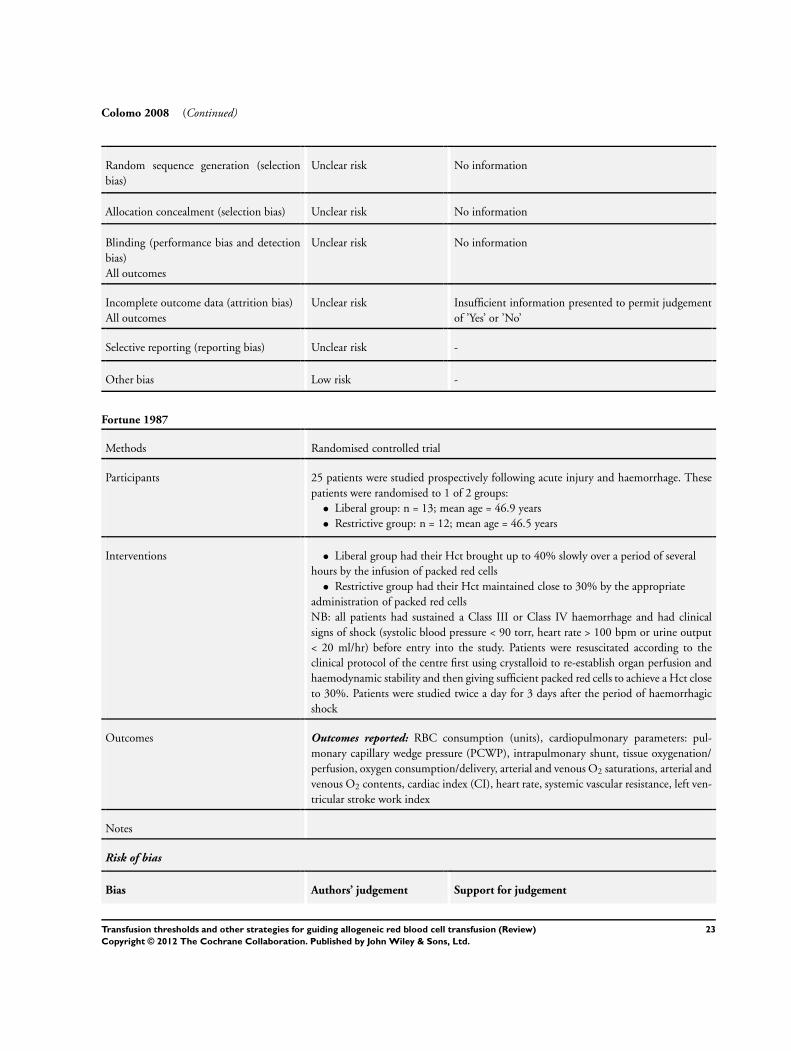
Colomo 2008 (Continued)
Random sequence generation (selection
bias)
Unclear risk No information
Allocation concealment (selection bias) Unclear risk No information
Blinding (performance bias and detection
bias)
All outcomes
Unclear risk No information
Incomplete outcome data (attrition bias)
All outcomes
Unclear risk Insufficient information presented to permit judgement
of ’Yes’ or ’No’
Selective reporting (reporting bias) Unclear risk -
Other bias Low risk -
Fortune 1987
Methods Randomised controlled trial
Participants 25 patients were studied prospectively following acute injury and haemorrhage. These
patients were randomised to 1 of 2 groups:
• Liberal group: n = 13; mean age = 46.9 years
• Restrictive group: n = 12; mean age = 46.5 years
Interventions • Liberal group had their Hct brought up to 40% slowly over a period of several
hours by the infusion of packed red cells
• Restrictive group had their Hct maintained close to 30% by the appropriate
administration of packed red cells
NB: all patients had sustained a Class III or Class IV haemorrhage and had clinical
signs of shock (systolic blood pressure < 90 torr, heart rate > 100 bpm or urine output
< 20 ml/hr) before entry into the study. Patients were resuscitated according to the
clinical protocol of the centre first using crystalloid to re-establish organ perfusion and
haemodynamic stability and then giving sufficient packed red cells to achieve a Hct close
to 30%. Patients were studied twice a day for 3 days after the period of haemorrhagic
shock
Outcomes Outcomes reported: RBC consumption (units), cardiopulmonary parameters: pul-
monary capillary wedge pressure (PCWP), intrapulmonary shunt, tissue oxygenation/
perfusion, oxygen consumption/delivery, arterial and venous O2 saturations, arterial and
venous O2 contents, cardiac index (CI), heart rate, systemic vascular resistance, left ven-
tricular stroke work index
Notes
Risk of bias
Bias Authors’ judgement Support for judgement
23Transfusion thresholds and other strategies for guiding allogeneic red blood cell transfusion (Review)
Copyright © 2012 The Cochrane Collaboration. Published by John Wiley & Sons, Ltd.

Fortune 1987 (Continued)
Random sequence generation (selection
bias)
Unclear risk No information
Allocation concealment (selection bias) Unclear risk No information
Blinding (performance bias and detection
bias)
All outcomes
Unclear risk No information
Incomplete outcome data (attrition bias)
All outcomes
Low risk Appears to have been complete
Selective reporting (reporting bias) Unclear risk -
Other bias Low risk -
Foss 2009
Methods
Participants 120 hip fracture patients were randomly allocated to 1 of 2 groups:
• Liberal group: n = 60; M/F = 14/46; mean (SD) age = 81 (6.8) years
• Restrictive group: n = 60; M/F = 14/46; mean (SD) age = 81 (7.3) years
Interventions • Liberal group received packed RBC when Hb level dropped below 10.0 g/dL
• Restrictive group received packed RBC when Hb level dropped below 8.0 g/dL
Outcomes Outcomes reported: ambulatory capacity, mortality, length of stay, cardiac complica-
tions, infectious complications
Notes
Risk of bias
Bias Authors’ judgement Support for judgement
Random sequence generation (selection
bias)
Low risk Computer-generated list
Allocation concealment (selection bias) Unclear risk Sealed envelopes
Blinding (performance bias and detection
bias)
All outcomes
Unclear risk Reported as being double-blind
Incomplete outcome data (attrition bias)
All outcomes
Low risk Intention-to-treat analysis used
24Transfusion thresholds and other strategies for guiding allogeneic red blood cell transfusion (Review)
Copyright © 2012 The Cochrane Collaboration. Published by John Wiley & Sons, Ltd.

Foss 2009 (Continued)
Selective reporting (reporting bias) Unclear risk -
Other bias Low risk -
Grover 2005
Methods Randomised controlled trial
Participants 260 patients undergoing elective lower limb joint replacement surgery were randomly
allocated to 1 of 2 groups:
• Liberal group: n = 109; M/F = 55/54; mean (SD) age = 71.5 (7.6) years
• Restrictive group: n = 109; M/F = 48/61; mean (SD) age = 70.7 (7.1) years
Interventions • Liberal group received packed RBC when Hb level dropped below 10.0 g/dL, and
Hb concentration maintained between 10.0 to 12.0 g/dL
• Restrictive group received packed RBC when Hb level dropped below 8.0 g/dL
and Hb concentration maintained between 8.0 to 9.5 g/dL
Outcomes Outcomes reported: ischaemic load, blood load, Hb concentration, number of units
transfused, length of hospital stay, adverse events, new infections requiring antibiotic
therapy
Notes
Risk of bias
Bias Authors’ judgement Support for judgement
Random sequence generation (selection
bias)
Low risk Random numbers table
Allocation concealment (selection bias) Unclear risk Sealed envelopes
Blinding (performance bias and detection
bias)
All outcomes
Unclear risk Anaesthetists and surgical team responsible for treatment
were aware of allocation. Outcome assessment was blind
Incomplete outcome data (attrition bias)
All outcomes
Unclear risk Of a recruited 260 patients, outcome data presented for
218. Missing 42 did not have analysable tape recordings
Selective reporting (reporting bias) Unclear risk -
Other bias Low risk -
25Transfusion thresholds and other strategies for guiding allogeneic red blood cell transfusion (Review)
Copyright © 2012 The Cochrane Collaboration. Published by John Wiley & Sons, Ltd.

Hajjar 2010
Methods Randomised clinical trial
Participants 502 adult patients who underwent cardiac surgery with cardiopulmonary bypass
• Liberal group: n = 257; M/F = 161/92; mean (SD) age 60.7 (12.5) years
• Restrictive group: n = 255; M/F = 149/100; mean (SD) age 58.6 (12.5)
Interventions • Liberal group were transfused RBC if the haematocrit was less than 30% at any
time from the start of surgery until discharge from the ICU
• Restrictive group were transfused if haematocrit values were less than 24%
Outcomes Outcomes reported: primary outcome composite endpoint that included 30-day all-
cause mortality and severe morbidity (cardiogenic shock, ARDS or acute renal injury re-
quiring dialysis or haemofiltration. Respiratory, cardiac, neurologic and infectious com-
plications; inflammatory complications; bleeding; ICU and hospital lengths of stay, RBC
transfusions.)
Notes
Risk of bias
Bias Authors’ judgement Support for judgement
Random sequence generation (selection
bias)
Low risk Random-number table prepared by chief statistician
Allocation concealment (selection bias) Unclear risk Opaque envelopes
Blinding (performance bias and detection
bias)
All outcomes
Unclear risk Patient and outcome assessors were blinded; clinicians were
not blinded
Incomplete outcome data (attrition bias)
All outcomes
Low risk Intention-to-treat. Complete follow-up.
Selective reporting (reporting bias) Unclear risk -
Other bias Low risk -
Hebert 1995
Methods Randomised controlled trial
Participants 69 normovolaemic critically ill patients admitted to 1 of 5 tertiary level intensive care
units with Hb values < 9.0 g/dL within 72 hours of admission were randomly assigned
to 1 of 2 groups:
• Liberal group: n = 36; M/F = 19/17; mean (SD) age = 59 (21) years
• Restrictive group: n = 33; M/F = 14/19; mean (SD) age = 58 (15) years
26Transfusion thresholds and other strategies for guiding allogeneic red blood cell transfusion (Review)
Copyright © 2012 The Cochrane Collaboration. Published by John Wiley & Sons, Ltd.

Hebert 1995 (Continued)
Interventions • Liberal group were transfused RBC if the Hb level fell to between 10.0 to 10.5 g/
dL. Hb level maintained between 10.0 to 12.0 g/dL.
• Restrictive group were transfused RBC if the Hb level fell to between 7.0 to 7.5 g/
dL. Hb level was maintained between 7.0 to 9.0 g/dL.
Outcomes Outcomes reported: mortality, length of hospital stay, length of ICU stay, blood usage
(units), complications, Hb levels
Notes
Risk of bias
Bias Authors’ judgement Support for judgement
Random sequence generation (selection
bias)
Unclear risk Patients were assigned to 1 of 2 groups by consecutive
allocation from a random listing stratified by centre and
disease severity
Allocation concealment (selection bias) Unclear risk No information
Blinding (performance bias and detection
bias)
All outcomes
Unclear risk “Blinding of treatment allocation was not feasible”
Incomplete outcome data (attrition bias)
All outcomes
Low risk Intention-to-treat analysis used
Selective reporting (reporting bias) Low risk -
Other bias Low risk -
Hebert 1999
Methods Randomised controlled trial
Participants 838 critically ill patients with euvolemia after initial treatment who had Hb concentra-
tions < 9.0 g/dL within 72 hours after admission to the intensive care unit were randomly
assigned to 1 of 2 groups:
• Liberal group: n = 420; M/F = 255/165; mean (SD) age = 58.1 (18.3) years
• Restrictive group: n = 418; M/F = 269/149; mean (SD) age = 57.1 (18.1) years
Interventions • Liberal group were transfused RBC when the Hb concentration fell below 10.0 g/
dL. The Hb concentration was maintained between 10.0 to 12.0 g/dL.
• Restrictive group were transfused RBC if the Hb concentration dropped below 7.
0 g/dL. The Hb concentration was maintained between 7.0 to 9.0 g/dL.
Outcomes Outcomes reported: mortality, length of hospital stay, length of ICU stay, blood usage
(units), complications, infection rates, cardiac events, pulmonary oedema, pneumonia
27Transfusion thresholds and other strategies for guiding allogeneic red blood cell transfusion (Review)
Copyright © 2012 The Cochrane Collaboration. Published by John Wiley & Sons, Ltd.
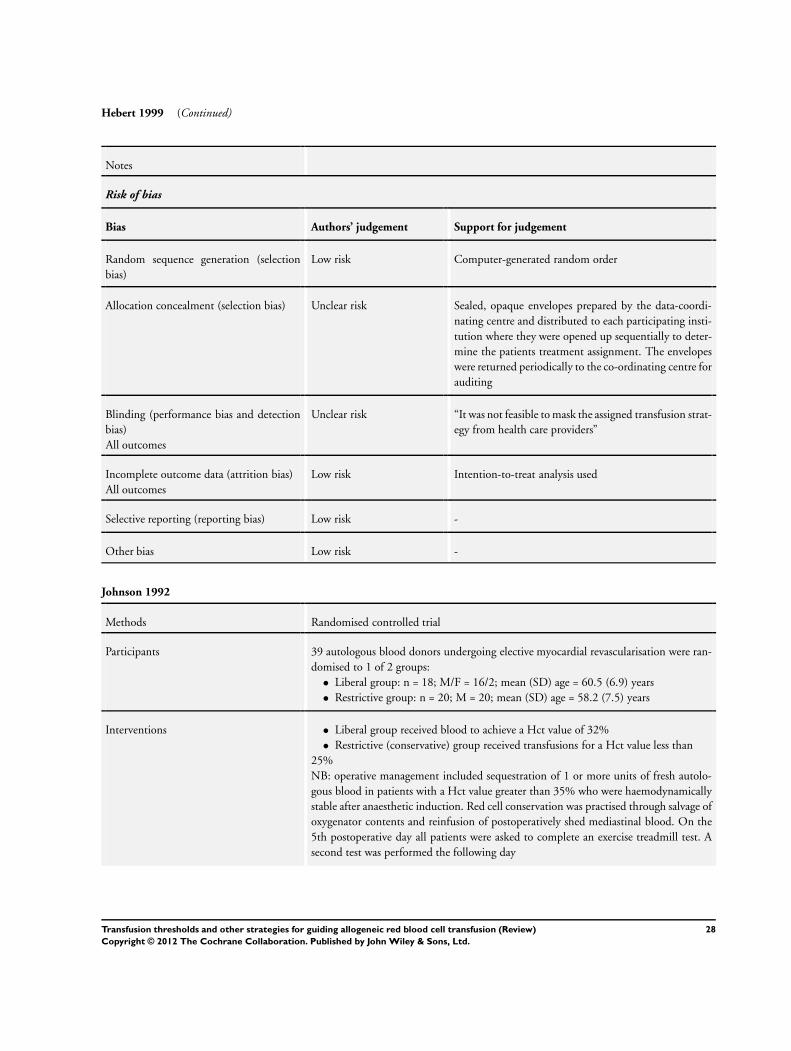
Hebert 1999 (Continued)
Notes
Risk of bias
Bias Authors’ judgement Support for judgement
Random sequence generation (selection
bias)
Low risk Computer-generated random order
Allocation concealment (selection bias) Unclear risk Sealed, opaque envelopes prepared by the data-coordi-
nating centre and distributed to each participating insti-
tution where they were opened up sequentially to deter-
mine the patients treatment assignment. The envelopes
were returned periodically to the co-ordinating centre for
auditing
Blinding (performance bias and detection
bias)
All outcomes
Unclear risk “It was not feasible to mask the assigned transfusion strat-
egy from health care providers”
Incomplete outcome data (attrition bias)
All outcomes
Low risk Intention-to-treat analysis used
Selective reporting (reporting bias) Low risk -
Other bias Low risk -
Johnson 1992
Methods Randomised controlled trial
Participants 39 autologous blood donors undergoing elective myocardial revascularisation were ran-
domised to 1 of 2 groups:
• Liberal group: n = 18; M/F = 16/2; mean (SD) age = 60.5 (6.9) years
• Restrictive group: n = 20; M = 20; mean (SD) age = 58.2 (7.5) years
Interventions • Liberal group received blood to achieve a Hct value of 32%
• Restrictive (conservative) group received transfusions for a Hct value less than
25%
NB: operative management included sequestration of 1 or more units of fresh autolo-
gous blood in patients with a Hct value greater than 35% who were haemodynamically
stable after anaesthetic induction. Red cell conservation was practised through salvage of
oxygenator contents and reinfusion of postoperatively shed mediastinal blood. On the
5th postoperative day all patients were asked to complete an exercise treadmill test. A
second test was performed the following day
28Transfusion thresholds and other strategies for guiding allogeneic red blood cell transfusion (Review)
Copyright © 2012 The Cochrane Collaboration. Published by John Wiley & Sons, Ltd.

Johnson 1992 (Continued)
Outcomes Outcomes reported: cardiac events, complications, postoperative blood loss, blood use
(total units), allogeneic blood use (units), autologous blood use (units), all product blood
use (units), number of patients receiving transfusions, mean cardiac index, mean systemic
resistance, exercise capacity, Hct levels, length of ICU stay, length of hospital stay
Notes
Risk of bias
Bias Authors’ judgement Support for judgement
Random sequence generation (selection
bias)
Unclear risk Randomised with the aid of a table of random numbers
and an odd-even designation
Allocation concealment (selection bias) High risk Inadequately concealed
Blinding (performance bias and detection
bias)
All outcomes
Unclear risk Surgeons and anaesthesiologists were blinded as to the
group of randomisation until the patient reached the in-
tensive care unit (ICU)
Incomplete outcome data (attrition bias)
All outcomes
Unclear risk A small number of exclusions were reported
Selective reporting (reporting bias) Unclear risk -
Other bias Low risk -
Lacroix 2007
Methods Randomised controlled trial
Participants 637 stable, critically ill children with Hb concentrations below 9.5 g/dL within 7 days
after admission to an ICU were randomly allocated to 1 of 2 groups:
• Liberal group: n = 317; M/F = 191/126; mean (SD) age = 39.6 (51.9) months
• Restrictive group: n = 320; M/F = 190/130; mean (SD) age = 35.8 (46.2) months
Interventions • Liberal group were transfused RBC when the Hb concentration fell below 9.5 g/
dL, with a target range of 11.0 to 12.0 g/dL
• Restrictive group were transfused RBC if the Hb concentration dropped below 7.
0 g/dL, with a target range of 8.5 to 9.5 g/dL
Outcomes Outcomes reported: 28-day mortality, sepsis, transfusion reactions, infections, length of
stay
Notes
Risk of bias
29Transfusion thresholds and other strategies for guiding allogeneic red blood cell transfusion (Review)
Copyright © 2012 The Cochrane Collaboration. Published by John Wiley & Sons, Ltd.

Lacroix 2007 (Continued)
Bias Authors’ judgement Support for judgement
Random sequence generation (selection
bias)
Unclear risk No information
Allocation concealment (selection bias) Low risk Internet-based, central allocation
Blinding (performance bias and detection
bias)
All outcomes
Unclear risk Clinical staff and parents of the patients were aware of
the assignments to study groups, but the statistician and
members of the data and safety monitoring committee
were unaware of the assignments
Incomplete outcome data (attrition bias)
All outcomes
Low risk Intention-to-treat analysis used
Selective reporting (reporting bias) Low risk -
Other bias Low risk -
Lotke 1999
Methods Randomised controlled trial
Participants 152 patients undergoing primary total knee arthroplasty (TKA) were randomly assigned
to 1 of 2 groups:
• Liberal group: n = 65; M/F = 19/46; mean age = 69.7 years
• Restrictive group: n = 62; M/F = 20/42; mean age = 68.7 years
Interventions • Liberal group were transfused autologous blood immediately after TKA,
beginning in the recovery room postoperatively
• Restrictive group were transfused autologous blood when the Hb level had fallen
to < 9.0 g/dL
Outcomes Outcomes reported: complications, cardiac events, Hb levels, blood usage (units), mental
confusion, lethargy, orthostatic hypotension, number of patients transfused
Notes
Risk of bias
Bias Authors’ judgement Support for judgement
Random sequence generation (selection
bias)
Low risk Computer random number generator
Allocation concealment (selection bias) Unclear risk Not reported
30Transfusion thresholds and other strategies for guiding allogeneic red blood cell transfusion (Review)
Copyright © 2012 The Cochrane Collaboration. Published by John Wiley & Sons, Ltd.

Lotke 1999 (Continued)
Blinding (performance bias and detection
bias)
All outcomes
Unclear risk Assessments were made by a person blind to the group
to which the patient was assigned
Incomplete outcome data (attrition bias)
All outcomes
Unclear risk Appears to have been complete
Selective reporting (reporting bias) Unclear risk -
Other bias Low risk -
So-Osman 2010
Methods Randomised controlled trial
Participants 619, patients undergoing elective orthopaedic hip/knee replacement surgery were ran-
domised to 1 of 2wo groups:
• Liberal (standard care) group: n = 304; M/F = 118/186; mean (SD) age = 70.3 (9.
7) years
• Restrictive (new transfusion policy) group: n = 299; M/F = 84/215; mean (SD)
age = 70.7 (10.2) years
Interventions • Liberal group received standard care
• Restrictive group were treated using a ’new transfusion policy’
Outcomes Outcomes reported: red blood cell usage, length of hospital stay, Hb levels, mobilisation
delay, postoperative complications
Notes
Risk of bias
Bias Authors’ judgement Support for judgement
Random sequence generation (selection
bias)
Unclear risk No information
Allocation concealment (selection bias) Unclear risk Sealed opaque envelopes
Blinding (performance bias and detection
bias)
All outcomes
Unclear risk Clinicians caring for the patients were aware of allocation
status, however, the study investigators were not
Incomplete outcome data (attrition bias)
All outcomes
Unclear risk Intention-to-treat analysis was not performed, although
unclear if this would have biased the results
Selective reporting (reporting bias) Unclear risk -
31Transfusion thresholds and other strategies for guiding allogeneic red blood cell transfusion (Review)
Copyright © 2012 The Cochrane Collaboration. Published by John Wiley & Sons, Ltd.

So-Osman 2010 (Continued)
Other bias Low risk -
Topley 1956
Methods Randomised controlled trial
Participants 22 trauma patients were randomly allocated to 1 of 2 groups:
• Liberal group: n = 10
• Restrictive group: n = 12
NB: no demographic data were reported
Interventions • Liberal group: the aim was to achieve 100% or more of the red cell volume at the
end of resuscitation
• Restrictive group: an attempt was made to leave the red cell volume at the end of
resuscitation at 70% to 80% of normal
Outcomes Outcomes reported: blood usage (units), blood loss, wound healing, elevated tempera-
ture, number of patients transfused, Hb levels
Notes
Risk of bias
Bias Authors’ judgement Support for judgement
Random sequence generation (selection
bias)
Unclear risk When the patient was considered eligible for the trial,
they were placed in a severity grade and an envelope
opened to decide which transfusion schedule was to be
used
Allocation concealment (selection bias) Unclear risk Sealed envelopes
Blinding (performance bias and detection
bias)
All outcomes
Unclear risk No information
Incomplete outcome data (attrition bias)
All outcomes
Low risk Appears to be complete
Selective reporting (reporting bias) Unclear risk -
Other bias Low risk -
32Transfusion thresholds and other strategies for guiding allogeneic red blood cell transfusion (Review)
Copyright © 2012 The Cochrane Collaboration. Published by John Wiley & Sons, Ltd.
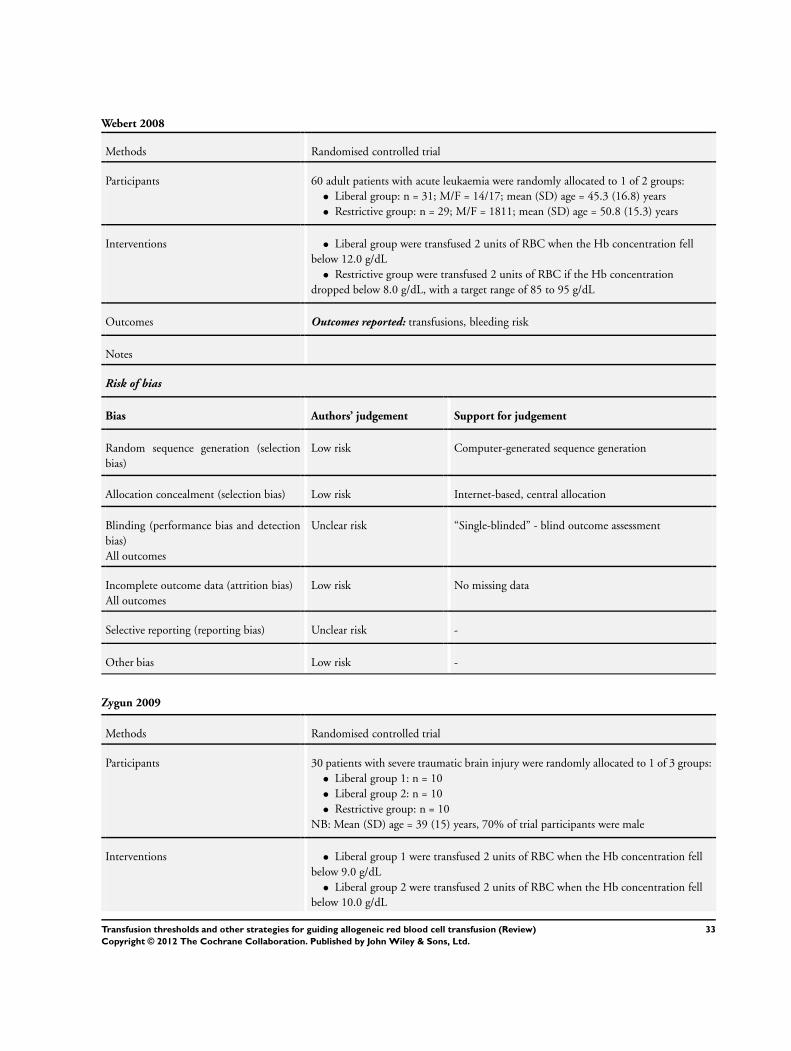
Webert 2008
Methods Randomised controlled trial
Participants 60 adult patients with acute leukaemia were randomly allocated to 1 of 2 groups:
• Liberal group: n = 31; M/F = 14/17; mean (SD) age = 45.3 (16.8) years
• Restrictive group: n = 29; M/F = 1811; mean (SD) age = 50.8 (15.3) years
Interventions • Liberal group were transfused 2 units of RBC when the Hb concentration fell
below 12.0 g/dL
• Restrictive group were transfused 2 units of RBC if the Hb concentration
dropped below 8.0 g/dL, with a target range of 85 to 95 g/dL
Outcomes Outcomes reported: transfusions, bleeding risk
Notes
Risk of bias
Bias Authors’ judgement Support for judgement
Random sequence generation (selection
bias)
Low risk Computer-generated sequence generation
Allocation concealment (selection bias) Low risk Internet-based, central allocation
Blinding (performance bias and detection
bias)
All outcomes
Unclear risk “Single-blinded” - blind outcome assessment
Incomplete outcome data (attrition bias)
All outcomes
Low risk No missing data
Selective reporting (reporting bias) Unclear risk -
Other bias Low risk -
Zygun 2009
Methods Randomised controlled trial
Participants 30 patients with severe traumatic brain injury were randomly allocated to 1 of 3 groups:
• Liberal group 1: n = 10
• Liberal group 2: n = 10
• Restrictive group: n = 10
NB: Mean (SD) age = 39 (15) years, 70% of trial participants were male
Interventions • Liberal group 1 were transfused 2 units of RBC when the Hb concentration fell
below 9.0 g/dL
• Liberal group 2 were transfused 2 units of RBC when the Hb concentration fell
below 10.0 g/dL
33Transfusion thresholds and other strategies for guiding allogeneic red blood cell transfusion (Review)
Copyright © 2012 The Cochrane Collaboration. Published by John Wiley & Sons, Ltd.

Zygun 2009 (Continued)
• Restrictive group were transfused 2 units of RBC if the Hb concentration
dropped below 8.0 g/dL
Outcomes Outcomes reported: change in brain tissue oxygen, brain pH, mortality
Notes Additional data were obtained from lead trialist for inclusion in the meta-analysis. Data
from liberal groups 1 and 2 combined for analysis
Risk of bias
Bias Authors’ judgement Support for judgement
Random sequence generation (selection
bias)
Low risk Computer random number generator
Allocation concealment (selection bias) Unclear risk No information
Blinding (performance bias and detection
bias)
All outcomes
Unclear risk No information
Incomplete outcome data (attrition bias)
All outcomes
Low risk No missing data
Selective reporting (reporting bias) Unclear risk -
Other bias Low risk -
Hb = haemoglobin
Hct = haematocrit
ICU = intensive care unit
PCWP = pulmonary capillary wedge pressure
RBC = red blood cells
Characteristics of excluded studies [ordered by study ID]
Study Reason for exclusion
Vichinsky 1995 Intervention not relevant
34Transfusion thresholds and other strategies for guiding allogeneic red blood cell transfusion (Review)
Copyright © 2012 The Cochrane Collaboration. Published by John Wiley & Sons, Ltd.

Characteristics of studies awaiting assessment [ordered by study ID]
Cooper 2011
Methods Randomised clinical trial
Participants Patients with acute myocardial infarction and haematocrit less than 30%
Sample size = 45 patients
Interventions Liberal transfusion: transfuse when haematocrit < 30% to maintain 30% to 33%)
Conservative transfusion: transfuse when haematocrit < 24% to maintain 24% to 27%
Outcomes The primary clinical safety measurement of in-hospital death, recurrent myocardial infarction, or new or worsening
congestive heart failure
Notes
Characteristics of ongoing studies [ordered by study ID]
MINT
Trial name or title Myocardial ischemia and transfusion
Methods Randomised, single-blinded, parallel trial
Participants Anaemic patients with acute coronary syndrome, aged 18 years or over
Sample size = 110
Interventions • Liberal group - receive 1 unit of packed RBC following randomisation and received enough blood to
raise Hb concentration above 10 g/dL, during hospitalisation for up to 30 days
• Restrictive group - receive transfusion if develop symptoms of anaemia or if Hb falls below 8.0 g/dL
Outcomes Trial performance and feasibility, Hb concentration, mortality or myocardial ischaemia, unscheduled hospital
admission, stroke, congestive hear failure, stent thrombosis, deep vein thrombosis, pulmonary embolism,
pneumonia, blood stream infection
Starting date September 2009
Contact information Jeffrey Carson ([email protected])
Notes
35Transfusion thresholds and other strategies for guiding allogeneic red blood cell transfusion (Review)
Copyright © 2012 The Cochrane Collaboration. Published by John Wiley & Sons, Ltd.

TITRe 2
Trial name or title A multi-centre randomised controlled trial of Transfusion Indication Threshold Reduction on transfusion
rates, morbidity and healthcare resources use following cardiac surgery
Methods Multicentre randomised controlled trial
Participants Patients aged 16 years and over undergoing cardiac surgery
Interventions • Liberal group - receive packed RBC if Hb concentration falls below 9 g/dL, objective is to maintain
Hb above 9 g/dL
• Restrictive group - receive packed RBC if Hb concentration falls below 7.5 g/dL, objective is to
maintain Hb above 7.5 g/dL
Outcomes Infectious events, ischaemic events, units of RBC transfused, duration of hospital stay, all-cause mortality,
resource use
Starting date December 2008
Contact information
Notes
Hb = haemoglobin
RBC = red blood cells
36Transfusion thresholds and other strategies for guiding allogeneic red blood cell transfusion (Review)
Copyright © 2012 The Cochrane Collaboration. Published by John Wiley & Sons, Ltd.

D A T A A N D A N A L Y S E S
Comparison 1. Blood transfusions
Outcome or subgroup titleNo. of
studies
No. of
participants Statistical method Effect size
1 Patients exposed to blood
transfusion (all studies)
17 6125 Risk Ratio (M-H, Random, 95% CI) 0.61 [0.52, 0.72]
2 Patients exposed to allogeneic
blood transfusion
10 4146 Risk Ratio (M-H, Random, 95% CI) 0.58 [0.46, 0.72]
3 Patients exposed to autologous
blood transfusion
2 165 Risk Ratio (M-H, Random, 95% CI) 0.46 [0.12, 1.82]
4 Patients exposed to blood
transfusion (by clinical setting)
17 6127 Risk Ratio (M-H, Random, 95% CI) 0.61 [0.52, 0.72]
4.1 Cardiac surgery 3 968 Risk Ratio (M-H, Random, 95% CI) 0.67 [0.58, 0.78]
4.2 Orthopaedic surgery 6 3170 Risk Ratio (M-H, Random, 95% CI) 0.53 [0.37, 0.75]
4.3 Vascular 1 99 Risk Ratio (M-H, Random, 95% CI) 0.91 [0.77, 1.08]
4.4 Acute blood loss/trauma 3 286 Risk Ratio (M-H, Random, 95% CI) 0.52 [0.30, 0.89]
4.5 Cancer 1 60 Risk Ratio (M-H, Random, 95% CI) 0.96 [0.82, 1.12]
4.6 Critical care 3 1544 Risk Ratio (M-H, Random, 95% CI) 0.56 [0.42, 0.75]
5 Patients exposed to blood
transfusion (by transfusion
threshold)
12 Risk Ratio (M-H, Random, 95% CI) Subtotals only
5.1 Difference ≥ 2 g/dL 10 4758 Risk Ratio (M-H, Random, 95% CI) 0.60 [0.49, 0.72]
5.2 Difference < 2 g/dL 2 527 Risk Ratio (M-H, Random, 95% CI) 0.82 [0.63, 1.07]
6 Patients exposed to blood
transfusion (by allocation
concealment)
17 Risk Ratio (M-H, Random, 95% CI) Subtotals only
6.1 Low risk of bias 4 2797 Risk Ratio (M-H, Random, 95% CI) 0.55 [0.37, 0.80]
6.2 Unclear risk of bias 11 2862 Risk Ratio (M-H, Random, 95% CI) 0.63 [0.54, 0.74]
6.3 High risk of bias 2 466 Risk Ratio (M-H, Random, 95% CI) 0.74 [0.62, 0.88]
7 Units of blood transfused 8 2715 Mean Difference (IV, Random, 95% CI) -1.19 [-1.85, -0.53]
8 Units of blood transfused in
those transfused
8 1555 Mean Difference (IV, Random, 95% CI) -0.75 [-1.30, -0.20]
Comparison 2. Haemoglobin concentration
Outcome or subgroup titleNo. of
studies
No. of
participants Statistical method Effect size
1 Haemoglobin concentration 12 5302 Mean Difference (IV, Random, 95% CI) -1.48 [-1.92, -1.03]
37Transfusion thresholds and other strategies for guiding allogeneic red blood cell transfusion (Review)
Copyright © 2012 The Cochrane Collaboration. Published by John Wiley & Sons, Ltd.

Comparison 3. Mortality
Outcome or subgroup titleNo. of
studies
No. of
participants Statistical method Effect size
1 ≤14-day mortality 2 821 Risk Ratio (M-H, Random, 95% CI) 0.44 [0.06, 2.96]
2 30-day mortality 11 4979 Risk Ratio (M-H, Random, 95% CI) 0.85 [0.70, 1.03]
3 60-day mortality 3 2938 Risk Ratio (M-H, Random, 95% CI) 0.88 [0.72, 1.06]
4 120-day mortality 1 Risk Ratio (M-H, Random, 95% CI) Subtotals only
5 Hospital mortality 5 3411 Risk Ratio (M-H, Random, 95% CI) 0.77 [0.62, 0.95]
6 ICU mortality 3 736 Risk Ratio (M-H, Random, 95% CI) 1.15 [0.59, 2.23]
7 Mortality (unspecified follow-up
period)
1 Risk Ratio (M-H, Random, 95% CI) Subtotals only
Comparison 4. Length of stay
Outcome or subgroup titleNo. of
studies
No. of
participants Statistical method Effect size
1 Hospital length of stay 8 4226 Mean Difference (IV, Random, 95% CI) 0.11 [-0.16, 0.38]
2 ICU length of stay 5 2114 Mean Difference (IV, Random, 95% CI) -0.15 [-0.66, 0.37]
Comparison 5. Function and fatigue
Outcome or subgroup titleNo. of
studies
No. of
participants Statistical method Effect size
1 Inability to walk or death at 30
days
1 Risk Ratio (M-H, Random, 95% CI) Subtotals only
2 Inability to walk or death at 60
days
1 Risk Ratio (M-H, Random, 95% CI) Subtotals only
3 Lower extremity physical
activities of daily living at 30
days
1 Mean Difference (IV, Random, 95% CI) Subtotals only
4 Lower extremity physical
activities of daily living at 60
days
1 Mean Difference (IV, Random, 95% CI) Subtotals only
5 Instrumental activities of daily
living at 30 days
1 Mean Difference (IV, Random, 95% CI) Subtotals only
6 Instrumental activities of daily
living at 60 days
1 Mean Difference (IV, Random, 95% CI) Subtotals only
7 Energy/fatigue at 30 days 1 Mean Difference (IV, Random, 95% CI) Subtotals only
8 Energy/fatigue at 60 days 1 Mean Difference (IV, Random, 95% CI) Subtotals only
38Transfusion thresholds and other strategies for guiding allogeneic red blood cell transfusion (Review)
Copyright © 2012 The Cochrane Collaboration. Published by John Wiley & Sons, Ltd.

Comparison 6. Adverse events
Outcome or subgroup titleNo. of
studies
No. of
participants Statistical method Effect size
1 Cardiac events 7 4048 Risk Ratio (M-H, Random, 95% CI) 0.96 [0.70, 1.32]
2 Myocardial infarction 8 3884 Risk Ratio (M-H, Random, 95% CI) 0.88 [0.38, 2.04]
3 Pulmonary oedema 5 3649 Risk Ratio (M-H, Random, 95% CI) 0.72 [0.31, 1.70]
4 Cerebrovascular accident (CVA)
- stroke
5 2760 Risk Ratio (M-H, Random, 95% CI) 0.84 [0.47, 1.49]
5 Pneumonia 5 3695 Risk Ratio (M-H, Random, 95% CI) 0.93 [0.76, 1.15]
6 Thromboembolism 3 2220 Risk Ratio (M-H, Random, 95% CI) 0.71 [0.32, 1.59]
7 Rebleeding 2 552 Risk Ratio (M-H, Random, 95% CI) 0.42 [0.03, 4.99]
8 Infection 6 4306 Risk Ratio (M-H, Random, 95% CI) 0.81 [0.66, 1.00]
9 Renal failure 3 1567 Risk Ratio (M-H, Random, 95% CI) 1.10 [0.56, 2.18]
10 Mental confusion 2 247 Risk Ratio (M-H, Random, 95% CI) 1.86 [0.63, 5.44]
Analysis 1.1. Comparison 1 Blood transfusions, Outcome 1 Patients exposed to blood transfusion (all
studies).
Review: Transfusion thresholds and other strategies for guiding allogeneic red blood cell transfusion
Comparison: 1 Blood transfusions
Outcome: 1 Patients exposed to blood transfusion (all studies)
Study or subgroup Restrictive Liberal Risk Ratio Weight Risk Ratio
n/N n/N
M-H,Random,95%
CI
M-H,Random,95%
CI
Blair 1986 5/26 24/24 2.8 % 0.21 [ 0.10, 0.44 ]
Bracey 1999 74/212 104/216 6.2 % 0.72 [ 0.58, 0.91 ]
Bush 1997 40/50 43/49 6.6 % 0.91 [ 0.77, 1.08 ]
Carson 1998 19/42 41/42 5.4 % 0.46 [ 0.33, 0.65 ]
Carson 2011 415/1009 974/1007 7.0 % 0.43 [ 0.39, 0.46 ]
Colomo 2008 68/109 95/105 6.6 % 0.69 [ 0.59, 0.81 ]
Foss 2009 22/60 44/60 5.2 % 0.50 [ 0.35, 0.72 ]
Grover 2005 37/109 46/109 5.4 % 0.80 [ 0.57, 1.13 ]
Hajjar 2010 118/249 198/253 6.7 % 0.61 [ 0.52, 0.70 ]
Hebert 1995 18/33 35/36 5.6 % 0.56 [ 0.41, 0.77 ]
Hebert 1999 280/418 420/420 7.0 % 0.67 [ 0.63, 0.72 ]
0.1 0.2 0.5 1 2 5 10
Favours Restrictive Favours Liberal
(Continued . . . )
39Transfusion thresholds and other strategies for guiding allogeneic red blood cell transfusion (Review)
Copyright © 2012 The Cochrane Collaboration. Published by John Wiley & Sons, Ltd.

(. . . Continued)Study or subgroup Restrictive Liberal Risk Ratio Weight Risk Ratio
n/N n/N
M-H,Random,95%
CI
M-H,Random,95%
CI
Johnson 1992 15/20 18/18 6.0 % 0.76 [ 0.58, 0.99 ]
Lacroix 2007 146/320 310/317 6.8 % 0.47 [ 0.41, 0.53 ]
Lotke 1999 16/62 65/65 4.8 % 0.26 [ 0.17, 0.40 ]
So-Osman 2010 109/299 119/304 6.4 % 0.93 [ 0.76, 1.14 ]
Topley 1956 8/12 10/10 4.8 % 0.68 [ 0.45, 1.04 ]
Webert 2008 26/29 29/31 6.7 % 0.96 [ 0.82, 1.12 ]
Total (95% CI) 3059 3066 100.0 % 0.61 [ 0.52, 0.72 ]
Total events: 1416 (Restrictive), 2575 (Liberal)
Heterogeneity: Tau?? = 0.10; Chi?? = 238.95, df = 16 (P<0.00001); I?? =93%
Test for overall effect: Z = 6.03 (P < 0.00001)
Test for subgroup differences: Not applicable
0.1 0.2 0.5 1 2 5 10
Favours Restrictive Favours Liberal
40Transfusion thresholds and other strategies for guiding allogeneic red blood cell transfusion (Review)
Copyright © 2012 The Cochrane Collaboration. Published by John Wiley & Sons, Ltd.

Analysis 1.2. Comparison 1 Blood transfusions, Outcome 2 Patients exposed to allogeneic blood transfusion.
Review: Transfusion thresholds and other strategies for guiding allogeneic red blood cell transfusion
Comparison: 1 Blood transfusions
Outcome: 2 Patients exposed to allogeneic blood transfusion
Study or subgroup Restrictive Liberal Risk Ratio Weight Risk Ratio
n/N n/N
M-H,Random,95%
CI
M-H,Random,95%
CI
Blair 1986 5/26 24/24 5.3 % 0.21 [ 0.10, 0.44 ]
Bracey 1999 74/212 104/216 11.8 % 0.72 [ 0.58, 0.91 ]
Bush 1997 40/50 43/49 12.6 % 0.91 [ 0.77, 1.08 ]
Carson 1998 19/42 41/42 10.3 % 0.46 [ 0.33, 0.65 ]
Carson 2011 415/1009 974/1007 13.4 % 0.43 [ 0.39, 0.46 ]
Hajjar 2010 118/249 198/253 12.8 % 0.61 [ 0.52, 0.70 ]
Hebert 1995 18/33 35/36 10.6 % 0.56 [ 0.41, 0.77 ]
Hebert 1999 280/418 420/420 13.5 % 0.67 [ 0.63, 0.72 ]
Johnson 1992 0/20 3/18 0.5 % 0.13 [ 0.01, 2.34 ]
Topley 1956 8/12 10/10 9.1 % 0.68 [ 0.45, 1.04 ]
Total (95% CI) 2071 2075 100.0 % 0.58 [ 0.46, 0.72 ]
Total events: 977 (Restrictive), 1852 (Liberal)
Heterogeneity: Tau?? = 0.09; Chi?? = 137.44, df = 9 (P<0.00001); I?? =93%
Test for overall effect: Z = 4.93 (P < 0.00001)
Test for subgroup differences: Not applicable
0.1 0.2 0.5 1 2 5 10
Favours Restrictive Favours Liberal
41Transfusion thresholds and other strategies for guiding allogeneic red blood cell transfusion (Review)
Copyright © 2012 The Cochrane Collaboration. Published by John Wiley & Sons, Ltd.
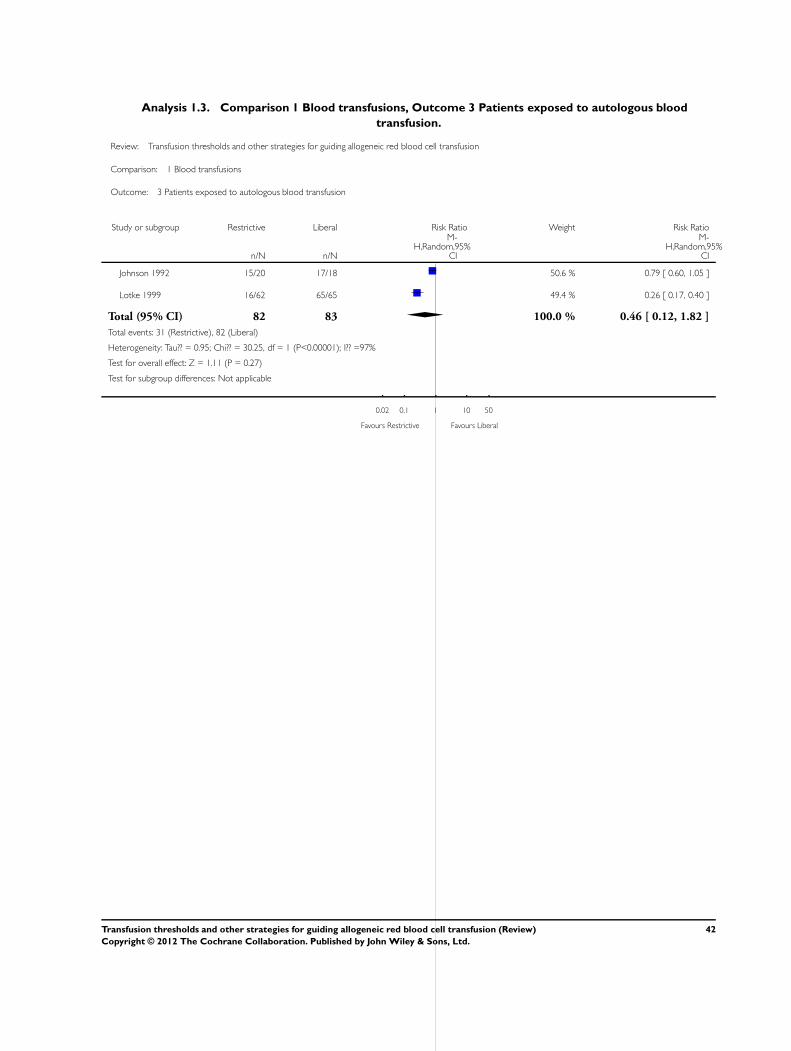
Analysis 1.3. Comparison 1 Blood transfusions, Outcome 3 Patients exposed to autologous blood
transfusion.
Review: Transfusion thresholds and other strategies for guiding allogeneic red blood cell transfusion
Comparison: 1 Blood transfusions
Outcome: 3 Patients exposed to autologous blood transfusion
Study or subgroup Restrictive Liberal Risk Ratio Weight Risk Ratio
n/N n/N
M-H,Random,95%
CI
M-H,Random,95%
CI
Johnson 1992 15/20 17/18 50.6 % 0.79 [ 0.60, 1.05 ]
Lotke 1999 16/62 65/65 49.4 % 0.26 [ 0.17, 0.40 ]
Total (95% CI) 82 83 100.0 % 0.46 [ 0.12, 1.82 ]
Total events: 31 (Restrictive), 82 (Liberal)
Heterogeneity: Tau?? = 0.95; Chi?? = 30.25, df = 1 (P<0.00001); I?? =97%
Test for overall effect: Z = 1.11 (P = 0.27)
Test for subgroup differences: Not applicable
0.02 0.1 1 10 50
Favours Restrictive Favours Liberal
42Transfusion thresholds and other strategies for guiding allogeneic red blood cell transfusion (Review)
Copyright © 2012 The Cochrane Collaboration. Published by John Wiley & Sons, Ltd.

Analysis 1.4. Comparison 1 Blood transfusions, Outcome 4 Patients exposed to blood transfusion (by
clinical setting).
Review: Transfusion thresholds and other strategies for guiding allogeneic red blood cell transfusion
Comparison: 1 Blood transfusions
Outcome: 4 Patients exposed to blood transfusion (by clinical setting)
Study or subgroup Restrictive Liberal Risk Ratio Weight Risk Ratio
n/N n/N
M-H,Random,95%
CI
M-H,Random,95%
CI
1 Cardiac surgery
Bracey 1999 74/212 104/216 6.2 % 0.72 [ 0.58, 0.91 ]
Hajjar 2010 118/249 198/253 6.7 % 0.61 [ 0.52, 0.70 ]
Johnson 1992 15/20 18/18 6.0 % 0.76 [ 0.58, 0.99 ]
Subtotal (95% CI) 481 487 18.9 % 0.67 [ 0.58, 0.78 ]
Total events: 207 (Restrictive), 320 (Liberal)
Heterogeneity: Tau?? = 0.01; Chi?? = 3.03, df = 2 (P = 0.22); I?? =34%
Test for overall effect: Z = 5.35 (P < 0.00001)
2 Orthopaedic surgery
Carson 1998 19/42 41/42 5.4 % 0.46 [ 0.33, 0.65 ]
Carson 2011 415/1009 974/1009 7.0 % 0.43 [ 0.40, 0.46 ]
Foss 2009 22/60 44/60 5.2 % 0.50 [ 0.35, 0.72 ]
Grover 2005 37/109 46/109 5.4 % 0.80 [ 0.57, 1.13 ]
Lotke 1999 16/62 65/65 4.8 % 0.26 [ 0.17, 0.40 ]
So-Osman 2010 109/299 119/304 6.4 % 0.93 [ 0.76, 1.14 ]
Subtotal (95% CI) 1581 1589 34.2 % 0.53 [ 0.37, 0.75 ]
Total events: 618 (Restrictive), 1289 (Liberal)
Heterogeneity: Tau?? = 0.17; Chi?? = 66.86, df = 5 (P<0.00001); I?? =93%
Test for overall effect: Z = 3.55 (P = 0.00039)
3 Vascular
Bush 1997 40/50 43/49 6.6 % 0.91 [ 0.77, 1.08 ]
Subtotal (95% CI) 50 49 6.6 % 0.91 [ 0.77, 1.08 ]
Total events: 40 (Restrictive), 43 (Liberal)
Heterogeneity: not applicable
Test for overall effect: Z = 1.04 (P = 0.30)
4 Acute blood loss/trauma
Blair 1986 5/26 24/24 2.8 % 0.21 [ 0.10, 0.44 ]
Colomo 2008 68/109 95/105 6.6 % 0.69 [ 0.59, 0.81 ]
Topley 1956 8/12 10/10 4.8 % 0.68 [ 0.45, 1.04 ]
0.1 0.2 0.5 1 2 5 10
Favours Restrictive Favours Liberal
(Continued . . . )
43Transfusion thresholds and other strategies for guiding allogeneic red blood cell transfusion (Review)
Copyright © 2012 The Cochrane Collaboration. Published by John Wiley & Sons, Ltd.

(. . . Continued)Study or subgroup Restrictive Liberal Risk Ratio Weight Risk Ratio
n/N n/N
M-H,Random,95%
CI
M-H,Random,95%
CI
Subtotal (95% CI) 147 139 14.3 % 0.52 [ 0.30, 0.89 ]
Total events: 81 (Restrictive), 129 (Liberal)
Heterogeneity: Tau?? = 0.18; Chi?? = 11.22, df = 2 (P = 0.004); I?? =82%
Test for overall effect: Z = 2.36 (P = 0.018)
5 Cancer
Webert 2008 26/29 29/31 6.7 % 0.96 [ 0.82, 1.12 ]
Subtotal (95% CI) 29 31 6.7 % 0.96 [ 0.82, 1.12 ]
Total events: 26 (Restrictive), 29 (Liberal)
Heterogeneity: not applicable
Test for overall effect: Z = 0.54 (P = 0.59)
6 Critical care
Hebert 1995 18/33 35/36 5.6 % 0.56 [ 0.41, 0.77 ]
Hebert 1999 280/418 420/420 7.0 % 0.67 [ 0.63, 0.72 ]
Lacroix 2007 146/320 310/317 6.8 % 0.47 [ 0.41, 0.53 ]
Subtotal (95% CI) 771 773 19.4 % 0.56 [ 0.42, 0.75 ]
Total events: 444 (Restrictive), 765 (Liberal)
Heterogeneity: Tau?? = 0.06; Chi?? = 29.71, df = 2 (P<0.00001); I?? =93%
Test for overall effect: Z = 3.82 (P = 0.00013)
Total (95% CI) 3059 3068 100.0 % 0.61 [ 0.52, 0.72 ]
Total events: 1416 (Restrictive), 2575 (Liberal)
Heterogeneity: Tau?? = 0.10; Chi?? = 237.89, df = 16 (P<0.00001); I?? =93%
Test for overall effect: Z = 6.04 (P < 0.00001)
Test for subgroup differences: Chi?? = 25.60, df = 5 (P = 0.00), I?? =80%
0.1 0.2 0.5 1 2 5 10
Favours Restrictive Favours Liberal
44Transfusion thresholds and other strategies for guiding allogeneic red blood cell transfusion (Review)
Copyright © 2012 The Cochrane Collaboration. Published by John Wiley & Sons, Ltd.

Analysis 1.5. Comparison 1 Blood transfusions, Outcome 5 Patients exposed to blood transfusion (by
transfusion threshold).
Review: Transfusion thresholds and other strategies for guiding allogeneic red blood cell transfusion
Comparison: 1 Blood transfusions
Outcome: 5 Patients exposed to blood transfusion (by transfusion threshold)
Study or subgroup Restrictive Liberal Risk Ratio Weight Risk Ratio
n/N n/N
M-H,Random,95%
CI
M-H,Random,95%
CI
1 Difference ??? 2 g/dL
Carson 1998 19/42 41/42 8.5 % 0.46 [ 0.33, 0.65 ]
Carson 2011 415/1009 974/1007 11.3 % 0.43 [ 0.39, 0.46 ]
Colomo 2008 68/109 95/105 10.7 % 0.69 [ 0.59, 0.81 ]
Foss 2009 22/60 44/60 8.1 % 0.50 [ 0.35, 0.72 ]
Grover 2005 37/109 46/109 8.5 % 0.80 [ 0.57, 1.13 ]
Hajjar 2010 118/249 198/253 10.8 % 0.61 [ 0.52, 0.70 ]
Hebert 1995 18/33 35/36 8.8 % 0.56 [ 0.41, 0.77 ]
Hebert 1999 280/418 420/420 11.4 % 0.67 [ 0.63, 0.72 ]
Lacroix 2007 146/320 310/317 11.0 % 0.47 [ 0.41, 0.53 ]
Webert 2008 26/29 29/31 10.7 % 0.96 [ 0.82, 1.12 ]
Subtotal (95% CI) 2378 2380 100.0 % 0.60 [ 0.49, 0.72 ]
Total events: 1149 (Restrictive), 2192 (Liberal)
Heterogeneity: Tau?? = 0.08; Chi?? = 165.02, df = 9 (P<0.00001); I?? =95%
Test for overall effect: Z = 5.27 (P < 0.00001)
2 Difference < 2 g/dL
Bracey 1999 74/212 104/216 46.1 % 0.72 [ 0.58, 0.91 ]
Bush 1997 40/50 43/49 53.9 % 0.91 [ 0.77, 1.08 ]
Subtotal (95% CI) 262 265 100.0 % 0.82 [ 0.63, 1.07 ]
Total events: 114 (Restrictive), 147 (Liberal)
Heterogeneity: Tau?? = 0.03; Chi?? = 3.48, df = 1 (P = 0.06); I?? =71%
Test for overall effect: Z = 1.45 (P = 0.15)
0.5 0.7 1 1.5 2
Favours Restrictive Favours Liberal
45Transfusion thresholds and other strategies for guiding allogeneic red blood cell transfusion (Review)
Copyright © 2012 The Cochrane Collaboration. Published by John Wiley & Sons, Ltd.

Analysis 1.6. Comparison 1 Blood transfusions, Outcome 6 Patients exposed to blood transfusion (by
allocation concealment).
Review: Transfusion thresholds and other strategies for guiding allogeneic red blood cell transfusion
Comparison: 1 Blood transfusions
Outcome: 6 Patients exposed to blood transfusion (by allocation concealment)
Study or subgroup Restrictive Liberal Risk Ratio Weight Risk Ratio
n/N n/N
M-H,Random,95%
CI
M-H,Random,95%
CI
1 Low risk of bias
Carson 1998 19/42 41/42 22.1 % 0.46 [ 0.33, 0.65 ]
Carson 2011 415/1009 974/1007 26.4 % 0.43 [ 0.39, 0.46 ]
Lacroix 2007 146/320 310/317 26.0 % 0.47 [ 0.41, 0.53 ]
Webert 2008 26/29 29/31 25.5 % 0.96 [ 0.82, 1.12 ]
Subtotal (95% CI) 1400 1397 100.0 % 0.55 [ 0.37, 0.80 ]
Total events: 606 (Restrictive), 1354 (Liberal)
Heterogeneity: Tau?? = 0.14; Chi?? = 96.05, df = 3 (P<0.00001); I?? =97%
Test for overall effect: Z = 3.09 (P = 0.0020)
2 Unclear risk of bias
Blair 1986 5/26 24/24 3.2 % 0.21 [ 0.10, 0.44 ]
Bush 1997 40/50 43/49 11.4 % 0.91 [ 0.77, 1.08 ]
Colomo 2008 68/109 95/105 11.7 % 0.69 [ 0.59, 0.81 ]
Foss 2009 22/60 44/60 7.6 % 0.50 [ 0.35, 0.72 ]
Grover 2005 37/109 46/109 8.1 % 0.80 [ 0.57, 1.13 ]
Hajjar 2010 118/249 198/253 11.9 % 0.61 [ 0.52, 0.70 ]
Hebert 1995 18/33 35/36 8.6 % 0.56 [ 0.41, 0.77 ]
Hebert 1999 280/418 420/420 13.0 % 0.67 [ 0.63, 0.72 ]
Lotke 1999 16/62 65/65 6.8 % 0.26 [ 0.17, 0.40 ]
So-Osman 2010 109/299 119/304 10.8 % 0.93 [ 0.76, 1.14 ]
Topley 1956 8/12 10/10 6.8 % 0.68 [ 0.45, 1.04 ]
Subtotal (95% CI) 1427 1435 100.0 % 0.63 [ 0.54, 0.74 ]
Total events: 721 (Restrictive), 1099 (Liberal)
Heterogeneity: Tau?? = 0.05; Chi?? = 58.50, df = 10 (P<0.00001); I?? =83%
Test for overall effect: Z = 5.83 (P < 0.00001)
3 High risk of bias
Bracey 1999 74/212 104/216 57.1 % 0.72 [ 0.58, 0.91 ]
0.1 0.2 0.5 1 2 5 10
Favours Restrictive Favours Liberal
(Continued . . . )
46Transfusion thresholds and other strategies for guiding allogeneic red blood cell transfusion (Review)
Copyright © 2012 The Cochrane Collaboration. Published by John Wiley & Sons, Ltd.

(. . . Continued)Study or subgroup Restrictive Liberal Risk Ratio Weight Risk Ratio
n/N n/N
M-H,Random,95%
CI
M-H,Random,95%
CI
Johnson 1992 15/20 18/18 42.9 % 0.76 [ 0.58, 0.99 ]
Subtotal (95% CI) 232 234 100.0 % 0.74 [ 0.62, 0.88 ]
Total events: 89 (Restrictive), 122 (Liberal)
Heterogeneity: Tau?? = 0.0; Chi?? = 0.08, df = 1 (P = 0.78); I?? =0.0%
Test for overall effect: Z = 3.41 (P = 0.00065)
0.1 0.2 0.5 1 2 5 10
Favours Restrictive Favours Liberal
Analysis 1.7. Comparison 1 Blood transfusions, Outcome 7 Units of blood transfused.
Review: Transfusion thresholds and other strategies for guiding allogeneic red blood cell transfusion
Comparison: 1 Blood transfusions
Outcome: 7 Units of blood transfused
Study or subgroup Restrictive LiberalMean
Difference WeightMean
Difference
N Mean(SD) N Mean(SD) IV,Random,95% CI IV,Random,95% CI
Blair 1986 26 2.6 (3) 24 4.6 (1.5) 10.2 % -2.00 [ -3.30, -0.70 ]
Bracey 1999 212 0.9 (1.5) 216 1.4 (1.8) 16.3 % -0.50 [ -0.81, -0.19 ]
Bush 1997 50 2.8 (3.1) 49 3.7 (3.5) 10.2 % -0.90 [ -2.20, 0.40 ]
Hebert 1999 418 2.6 (4.1) 420 5.6 (5.3) 14.6 % -3.00 [ -3.64, -2.36 ]
Johnson 1992 20 1 (0.86) 18 2.05 (0.93) 15.0 % -1.05 [ -1.62, -0.48 ]
Lacroix 2007 320 0.9 (2.6) 317 1.7 (2.2) 16.0 % -0.80 [ -1.17, -0.43 ]
So-Osman 2010 299 0.78 (1.4) 304 0.86 (1.6) 16.5 % -0.08 [ -0.32, 0.16 ]
Topley 1956 12 4.8 (6.7) 10 11.3 (6.9) 1.2 % -6.50 [ -12.21, -0.79 ]
Total (95% CI) 1357 1358 100.0 % -1.19 [ -1.85, -0.53 ]
Heterogeneity: Tau?? = 0.67; Chi?? = 84.46, df = 7 (P<0.00001); I?? =92%
Test for overall effect: Z = 3.54 (P = 0.00040)
Test for subgroup differences: Not applicable
-10 -5 0 5 10
Favours Restrictive Favours Liberal
47Transfusion thresholds and other strategies for guiding allogeneic red blood cell transfusion (Review)
Copyright © 2012 The Cochrane Collaboration. Published by John Wiley & Sons, Ltd.

Analysis 1.8. Comparison 1 Blood transfusions, Outcome 8 Units of blood transfused in those transfused.
Review: Transfusion thresholds and other strategies for guiding allogeneic red blood cell transfusion
Comparison: 1 Blood transfusions
Outcome: 8 Units of blood transfused in those transfused
Study or subgroup Restrictive LiberalMean
Difference WeightMean
Difference
N Mean(SD) N Mean(SD) IV,Random,95% CI IV,Random,95% CI
Blair 1986 5 2.6 (1.34) 24 4.6 (1.47) 9.4 % -2.00 [ -3.31, -0.69 ]
Bracey 1999 74 2.58 (1.45) 104 2.91 (1.53) 17.7 % -0.33 [ -0.77, 0.11 ]
Bush 1997 40 3.5 (3.09) 43 4.22 (3.43) 8.7 % -0.72 [ -2.12, 0.68 ]
Carson 1998 19 1.84 (1.12) 39 2 (0.89) 16.4 % -0.16 [ -0.74, 0.42 ]
Hebert 1999 280 3.88 (4.49) 420 5.6 (5.3) 14.8 % -1.72 [ -2.45, -0.99 ]
Johnson 1992 15 1 (0.86) 18 2.05 (0.93) 16.1 % -1.05 [ -1.66, -0.44 ]
Lacroix 2007 146 1.9 (3.4) 310 1.7 (2.1) 16.2 % 0.20 [ -0.40, 0.80 ]
Topley 1956 8 7.2 (7.13) 10 11.34 (6.87) 0.7 % -4.14 [ -10.66, 2.38 ]
Total (95% CI) 587 968 100.0 % -0.75 [ -1.30, -0.20 ]
Heterogeneity: Tau?? = 0.39; Chi?? = 27.05, df = 7 (P = 0.00033); I?? =74%
Test for overall effect: Z = 2.69 (P = 0.0072)
Test for subgroup differences: Not applicable
-10 -5 0 5 10
Favours Restrictive Favours Liberal
48Transfusion thresholds and other strategies for guiding allogeneic red blood cell transfusion (Review)
Copyright © 2012 The Cochrane Collaboration. Published by John Wiley & Sons, Ltd.

Analysis 2.1. Comparison 2 Haemoglobin concentration, Outcome 1 Haemoglobin concentration.
Review: Transfusion thresholds and other strategies for guiding allogeneic red blood cell transfusion
Comparison: 2 Haemoglobin concentration
Outcome: 1 Haemoglobin concentration
Study or subgroup Restrictive LiberalMean
Difference WeightMean
Difference
N Mean(SD) N Mean(SD) IV,Random,95% CI IV,Random,95% CI
Blair 1986 26 12.3 (2.4) 24 12.3 (2.6) 5.0 % 0.0 [ -1.39, 1.39 ]
Bush 1997 50 9.8 (1.3) 49 11 (1.2) 8.9 % -1.20 [ -1.69, -0.71 ]
Carson 1998 40 9.7 (0.9) 40 10.7 (0.9) 9.2 % -1.00 [ -1.39, -0.61 ]
Carson 2011 1009 9.6 (1.1) 1007 10.9 (0.9) 9.9 % -1.30 [ -1.39, -1.21 ]
Colomo 2008 109 9.2 (1.3) 105 10.1 (0.9) 9.5 % -0.90 [ -1.20, -0.60 ]
Fortune 1987 12 10.1 (0.7) 13 12.7 (0.7) 8.7 % -2.60 [ -3.15, -2.05 ]
Grover 2005 109 9.8 (1.23) 107 11.1 (0.93) 9.6 % -1.30 [ -1.59, -1.01 ]
Hajjar 2010 249 9.4 (10.5) 253 10.8 (8.9) 4.0 % -1.40 [ -3.10, 0.30 ]
Hebert 1999 418 8.5 (0.7) 420 10.7 (0.7) 9.9 % -2.20 [ -2.29, -2.11 ]
Lacroix 2007 320 8.7 (0.4) 317 10.8 (0.5) 10.0 % -2.10 [ -2.17, -2.03 ]
So-Osman 2010 299 11.4 (1.1) 304 11.4 (1.1) 9.8 % 0.0 [ -0.18, 0.18 ]
Topley 1956 12 11.3 (0.7) 10 15.6 (2) 5.4 % -4.30 [ -5.60, -3.00 ]
Total (95% CI) 2653 2649 100.0 % -1.48 [ -1.92, -1.03 ]
Heterogeneity: Tau?? = 0.51; Chi?? = 752.16, df = 11 (P<0.00001); I?? =99%
Test for overall effect: Z = 6.53 (P < 0.00001)
Test for subgroup differences: Not applicable
-10 -5 0 5 10
Favours Restrictive Favours Liberal
49Transfusion thresholds and other strategies for guiding allogeneic red blood cell transfusion (Review)
Copyright © 2012 The Cochrane Collaboration. Published by John Wiley & Sons, Ltd.

Analysis 3.1. Comparison 3 Mortality, Outcome 1 ≤14-day mortality.
Review: Transfusion thresholds and other strategies for guiding allogeneic red blood cell transfusion
Comparison: 3 Mortality
Outcome: 1 ???14-day mortality
Study or subgroup Restrictive Liberal Risk Ratio Weight Risk Ratio
n/N n/N
M-H,Random,95%
CI
M-H,Random,95%
CI
Grover 2005 0/109 1/109 36.1 % 0.33 [ 0.01, 8.09 ]
So-Osman 2010 1/299 2/304 63.9 % 0.51 [ 0.05, 5.58 ]
Total (95% CI) 408 413 100.0 % 0.44 [ 0.06, 2.96 ]
Total events: 1 (Restrictive), 3 (Liberal)
Heterogeneity: Tau?? = 0.0; Chi?? = 0.04, df = 1 (P = 0.84); I?? =0.0%
Test for overall effect: Z = 0.85 (P = 0.40)
Test for subgroup differences: Not applicable
0.001 0.01 0.1 1 10 100 1000
Favours Restrictive Favours Liberal
50Transfusion thresholds and other strategies for guiding allogeneic red blood cell transfusion (Review)
Copyright © 2012 The Cochrane Collaboration. Published by John Wiley & Sons, Ltd.

Analysis 3.2. Comparison 3 Mortality, Outcome 2 30-day mortality.
Review: Transfusion thresholds and other strategies for guiding allogeneic red blood cell transfusion
Comparison: 3 Mortality
Outcome: 2 30-day mortality
Study or subgroup Restrictive Liberal Risk Ratio Risk Ratio
n/N n/N
M-H,Random,95%
CI
M-H,Random,95%
CI
Blair 1986 0/26 2/24 0.19 [ 0.01, 3.67 ]
Bracey 1999 3/215 6/222 0.52 [ 0.13, 2.04 ]
Bush 1997 4/50 4/49 0.98 [ 0.26, 3.70 ]
Carson 1998 1/42 1/42 1.00 [ 0.06, 15.47 ]
Carson 2011 43/1009 52/1007 0.83 [ 0.56, 1.22 ]
Foss 2009 5/60 0/60 11.00 [ 0.62, 194.63 ]
Hajjar 2010 15/249 13/253 1.17 [ 0.57, 2.41 ]
Hebert 1995 8/33 9/36 0.97 [ 0.42, 2.22 ]
Hebert 1999 78/418 98/420 0.80 [ 0.61, 1.04 ]
Lacroix 2007 14/320 14/317 0.99 [ 0.48, 2.04 ]
Lotke 1999 0/62 0/65 0.0 [ 0.0, 0.0 ]
Total (95% CI) 2484 2495 0.85 [ 0.70, 1.03 ]
Total events: 171 (Restrictive), 199 (Liberal)
Heterogeneity: Tau?? = 0.0; Chi?? = 5.90, df = 9 (P = 0.75); I?? =0.0%
Test for overall effect: Z = 1.66 (P = 0.097)
Test for subgroup differences: Not applicable
0.005 0.1 1 10 200
Favours Restrictive Favours Liberal
51Transfusion thresholds and other strategies for guiding allogeneic red blood cell transfusion (Review)
Copyright © 2012 The Cochrane Collaboration. Published by John Wiley & Sons, Ltd.

Analysis 3.3. Comparison 3 Mortality, Outcome 3 60-day mortality.
Review: Transfusion thresholds and other strategies for guiding allogeneic red blood cell transfusion
Comparison: 3 Mortality
Outcome: 3 60-day mortality
Study or subgroup Restrictive Liberal Risk Ratio Weight Risk Ratio
n/N n/N
M-H,Random,95%
CI
M-H,Random,95%
CI
Carson 1998 5/42 2/42 1.4 % 2.50 [ 0.51, 12.17 ]
Carson 2011 66/1009 76/1007 35.4 % 0.87 [ 0.63, 1.19 ]
Hebert 1999 95/418 111/420 63.2 % 0.86 [ 0.68, 1.09 ]
Total (95% CI) 1469 1469 100.0 % 0.88 [ 0.72, 1.06 ]
Total events: 166 (Restrictive), 189 (Liberal)
Heterogeneity: Tau?? = 0.0; Chi?? = 1.72, df = 2 (P = 0.42); I?? =0.0%
Test for overall effect: Z = 1.38 (P = 0.17)
Test for subgroup differences: Not applicable
0.1 0.2 0.5 1 2 5 10
Favours Restrictive Favours Liberal
Analysis 3.4. Comparison 3 Mortality, Outcome 4 120-day mortality.
Review: Transfusion thresholds and other strategies for guiding allogeneic red blood cell transfusion
Comparison: 3 Mortality
Outcome: 4 120-day mortality
Study or subgroup Restrictive Liberal Risk Ratio Risk Ratio
n/N n/N
M-H,Random,95%
CI
M-H,Random,95%
CI
Hebert 1995 13/33 11/36 1.29 [ 0.67, 2.47 ]
Subtotal (95% CI) 0 0 0.0 [ 0.0, 0.0 ]
Total events: 13 (Restrictive), 11 (Liberal)
Heterogeneity: not applicable
Test for overall effect: Z = 0.0 (P < 0.00001)
0.2 0.5 1 2 5
Favours Restrictive Favours Liberal
52Transfusion thresholds and other strategies for guiding allogeneic red blood cell transfusion (Review)
Copyright © 2012 The Cochrane Collaboration. Published by John Wiley & Sons, Ltd.

Analysis 3.5. Comparison 3 Mortality, Outcome 5 Hospital mortality.
Review: Transfusion thresholds and other strategies for guiding allogeneic red blood cell transfusion
Comparison: 3 Mortality
Outcome: 5 Hospital mortality
Study or subgroup Restrictive Liberal Risk Ratio Risk Ratio
n/N n/N
M-H,Random,95%
CI
M-H,Random,95%
CI
Blair 1986 0/26 2/24 0.19 [ 0.01, 3.67 ]
Bracey 1999 3/215 6/222 0.52 [ 0.13, 2.04 ]
Carson 1998 0/42 0/42 0.0 [ 0.0, 0.0 ]
Carson 2011 14/1003 20/999 0.70 [ 0.35, 1.37 ]
Hebert 1999 93/418 118/420 0.79 [ 0.63, 1.00 ]
Total (95% CI) 1704 1707 0.77 [ 0.62, 0.95 ]
Total events: 110 (Restrictive), 146 (Liberal)
Heterogeneity: Tau?? = 0.0; Chi?? = 1.35, df = 3 (P = 0.72); I?? =0.0%
Test for overall effect: Z = 2.37 (P = 0.018)
Test for subgroup differences: Not applicable
0.005 0.1 1 10 200
Favours Restrictive Favours Liberal
53Transfusion thresholds and other strategies for guiding allogeneic red blood cell transfusion (Review)
Copyright © 2012 The Cochrane Collaboration. Published by John Wiley & Sons, Ltd.

Analysis 3.6. Comparison 3 Mortality, Outcome 6 ICU mortality.
Review: Transfusion thresholds and other strategies for guiding allogeneic red blood cell transfusion
Comparison: 3 Mortality
Outcome: 6 ICU mortality
Study or subgroup Restrictive Liberal Risk Ratio Weight Risk Ratio
n/N n/N
M-H,Random,95%
CI
M-H,Random,95%
CI
Hebert 1995 5/33 7/36 40.1 % 0.78 [ 0.27, 2.22 ]
Lacroix 2007 11/320 8/317 54.5 % 1.36 [ 0.56, 3.34 ]
Zygun 2009 3/20 0/10 5.3 % 3.67 [ 0.21, 64.80 ]
Total (95% CI) 373 363 100.0 % 1.15 [ 0.59, 2.23 ]
Total events: 19 (Restrictive), 15 (Liberal)
Heterogeneity: Tau?? = 0.0; Chi?? = 1.32, df = 2 (P = 0.52); I?? =0.0%
Test for overall effect: Z = 0.41 (P = 0.68)
Test for subgroup differences: Not applicable
0.002 0.1 1 10 500
Favours Restrictive Favours Liberal
Analysis 3.7. Comparison 3 Mortality, Outcome 7 Mortality (unspecified follow-up period).
Review: Transfusion thresholds and other strategies for guiding allogeneic red blood cell transfusion
Comparison: 3 Mortality
Outcome: 7 Mortality (unspecified follow-up period)
Study or subgroup Restrictive Liberal Risk Ratio Risk Ratio
n/N n/N
M-H,Random,95%
CI
M-H,Random,95%
CI
Colomo 2008 12/109 17/105 0.68 [ 0.34, 1.35 ]
Subtotal (95% CI) 0 0 0.0 [ 0.0, 0.0 ]
Total events: 12 (Restrictive), 17 (Liberal)
Heterogeneity: not applicable
Test for overall effect: Z = 0.0 (P < 0.00001)
0.2 0.5 1 2 5
Favours Restrictive Favours Liberal
54Transfusion thresholds and other strategies for guiding allogeneic red blood cell transfusion (Review)
Copyright © 2012 The Cochrane Collaboration. Published by John Wiley & Sons, Ltd.
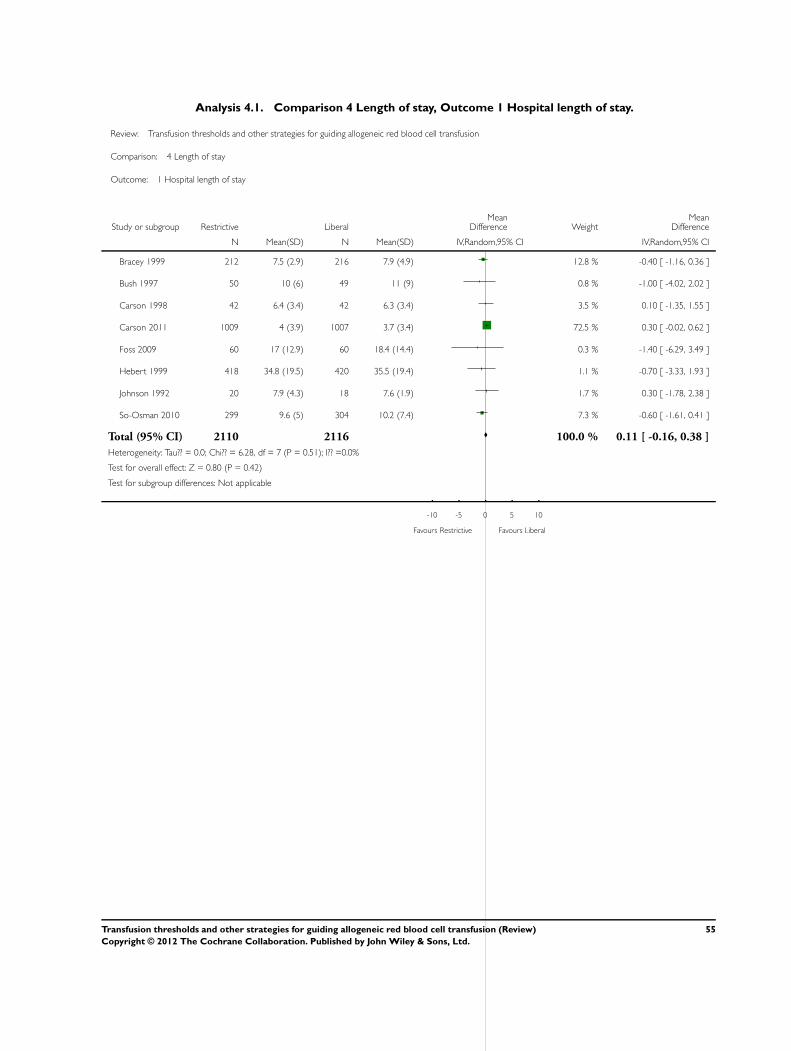
Analysis 4.1. Comparison 4 Length of stay, Outcome 1 Hospital length of stay.
Review: Transfusion thresholds and other strategies for guiding allogeneic red blood cell transfusion
Comparison: 4 Length of stay
Outcome: 1 Hospital length of stay
Study or subgroup Restrictive LiberalMean
Difference WeightMean
Difference
N Mean(SD) N Mean(SD) IV,Random,95% CI IV,Random,95% CI
Bracey 1999 212 7.5 (2.9) 216 7.9 (4.9) 12.8 % -0.40 [ -1.16, 0.36 ]
Bush 1997 50 10 (6) 49 11 (9) 0.8 % -1.00 [ -4.02, 2.02 ]
Carson 1998 42 6.4 (3.4) 42 6.3 (3.4) 3.5 % 0.10 [ -1.35, 1.55 ]
Carson 2011 1009 4 (3.9) 1007 3.7 (3.4) 72.5 % 0.30 [ -0.02, 0.62 ]
Foss 2009 60 17 (12.9) 60 18.4 (14.4) 0.3 % -1.40 [ -6.29, 3.49 ]
Hebert 1999 418 34.8 (19.5) 420 35.5 (19.4) 1.1 % -0.70 [ -3.33, 1.93 ]
Johnson 1992 20 7.9 (4.3) 18 7.6 (1.9) 1.7 % 0.30 [ -1.78, 2.38 ]
So-Osman 2010 299 9.6 (5) 304 10.2 (7.4) 7.3 % -0.60 [ -1.61, 0.41 ]
Total (95% CI) 2110 2116 100.0 % 0.11 [ -0.16, 0.38 ]
Heterogeneity: Tau?? = 0.0; Chi?? = 6.28, df = 7 (P = 0.51); I?? =0.0%
Test for overall effect: Z = 0.80 (P = 0.42)
Test for subgroup differences: Not applicable
-10 -5 0 5 10
Favours Restrictive Favours Liberal
55Transfusion thresholds and other strategies for guiding allogeneic red blood cell transfusion (Review)
Copyright © 2012 The Cochrane Collaboration. Published by John Wiley & Sons, Ltd.
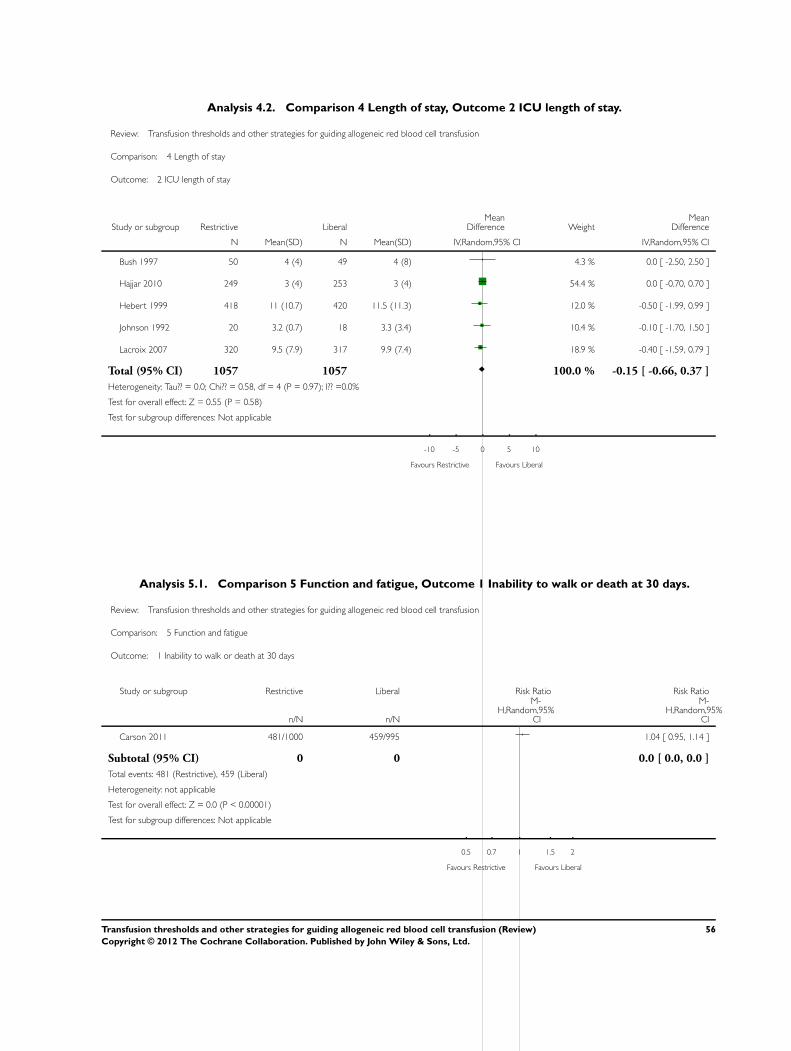
Analysis 4.2. Comparison 4 Length of stay, Outcome 2 ICU length of stay.
Review: Transfusion thresholds and other strategies for guiding allogeneic red blood cell transfusion
Comparison: 4 Length of stay
Outcome: 2 ICU length of stay
Study or subgroup Restrictive LiberalMean
Difference WeightMean
Difference
N Mean(SD) N Mean(SD) IV,Random,95% CI IV,Random,95% CI
Bush 1997 50 4 (4) 49 4 (8) 4.3 % 0.0 [ -2.50, 2.50 ]
Hajjar 2010 249 3 (4) 253 3 (4) 54.4 % 0.0 [ -0.70, 0.70 ]
Hebert 1999 418 11 (10.7) 420 11.5 (11.3) 12.0 % -0.50 [ -1.99, 0.99 ]
Johnson 1992 20 3.2 (0.7) 18 3.3 (3.4) 10.4 % -0.10 [ -1.70, 1.50 ]
Lacroix 2007 320 9.5 (7.9) 317 9.9 (7.4) 18.9 % -0.40 [ -1.59, 0.79 ]
Total (95% CI) 1057 1057 100.0 % -0.15 [ -0.66, 0.37 ]
Heterogeneity: Tau?? = 0.0; Chi?? = 0.58, df = 4 (P = 0.97); I?? =0.0%
Test for overall effect: Z = 0.55 (P = 0.58)
Test for subgroup differences: Not applicable
-10 -5 0 5 10
Favours Restrictive Favours Liberal
Analysis 5.1. Comparison 5 Function and fatigue, Outcome 1 Inability to walk or death at 30 days.
Review: Transfusion thresholds and other strategies for guiding allogeneic red blood cell transfusion
Comparison: 5 Function and fatigue
Outcome: 1 Inability to walk or death at 30 days
Study or subgroup Restrictive Liberal Risk Ratio Risk Ratio
n/N n/N
M-H,Random,95%
CI
M-H,Random,95%
CI
Carson 2011 481/1000 459/995 1.04 [ 0.95, 1.14 ]
Subtotal (95% CI) 0 0 0.0 [ 0.0, 0.0 ]
Total events: 481 (Restrictive), 459 (Liberal)
Heterogeneity: not applicable
Test for overall effect: Z = 0.0 (P < 0.00001)
Test for subgroup differences: Not applicable
0.5 0.7 1 1.5 2
Favours Restrictive Favours Liberal
56Transfusion thresholds and other strategies for guiding allogeneic red blood cell transfusion (Review)
Copyright © 2012 The Cochrane Collaboration. Published by John Wiley & Sons, Ltd.

Analysis 5.2. Comparison 5 Function and fatigue, Outcome 2 Inability to walk or death at 60 days.
Review: Transfusion thresholds and other strategies for guiding allogeneic red blood cell transfusion
Comparison: 5 Function and fatigue
Outcome: 2 Inability to walk or death at 60 days
Study or subgroup Restrictive Liberal Risk Ratio Risk Ratio
n/N n/N
M-H,Random,95%
CI
M-H,Random,95%
CI
Carson 2011 347/1001 351/998 0.99 [ 0.87, 1.11 ]
Subtotal (95% CI) 0 0 0.0 [ 0.0, 0.0 ]
Total events: 347 (Restrictive), 351 (Liberal)
Heterogeneity: not applicable
Test for overall effect: Z = 0.0 (P < 0.00001)
Test for subgroup differences: Not applicable
0.5 0.7 1 1.5 2
Favours Restrictive Favours Liberal
Analysis 5.3. Comparison 5 Function and fatigue, Outcome 3 Lower extremity physical activities of daily
living at 30 days.
Review: Transfusion thresholds and other strategies for guiding allogeneic red blood cell transfusion
Comparison: 5 Function and fatigue
Outcome: 3 Lower extremity physical activities of daily living at 30 days
Study or subgroup Restrictive LiberalMean
DifferenceMean
Difference
N Mean(SD) N Mean(SD) IV,Random,95% CI IV,Random,95% CI
Carson 2011 507 7.4 (3.7) 472 7.2 (3.6) 0.20 [ -0.26, 0.66 ]
Subtotal (95% CI) 0 0 0.0 [ 0.0, 0.0 ]
Heterogeneity: not applicable
Test for overall effect: Z = 0.0 (P < 0.00001)
Test for subgroup differences: Not applicable
-2 -1 0 1 2
Favours Restrictive Favours Liberal
57Transfusion thresholds and other strategies for guiding allogeneic red blood cell transfusion (Review)
Copyright © 2012 The Cochrane Collaboration. Published by John Wiley & Sons, Ltd.

Analysis 5.4. Comparison 5 Function and fatigue, Outcome 4 Lower extremity physical activities of daily
living at 60 days.
Review: Transfusion thresholds and other strategies for guiding allogeneic red blood cell transfusion
Comparison: 5 Function and fatigue
Outcome: 4 Lower extremity physical activities of daily living at 60 days
Study or subgroup Restrictive LiberalMean
DifferenceMean
Difference
N Mean(SD) N Mean(SD) IV,Random,95% CI IV,Random,95% CI
Carson 2011 553 5.1 (4.3) 523 5.1 (4.2) 0.0 [ -0.51, 0.51 ]
Subtotal (95% CI) 0 0 0.0 [ 0.0, 0.0 ]
Heterogeneity: not applicable
Test for overall effect: Z = 0.0 (P < 0.00001)
Test for subgroup differences: Not applicable
-2 -1 0 1 2
Favours Restrictive Favours Liberal
Analysis 5.5. Comparison 5 Function and fatigue, Outcome 5 Instrumental activities of daily living at 30
days.
Review: Transfusion thresholds and other strategies for guiding allogeneic red blood cell transfusion
Comparison: 5 Function and fatigue
Outcome: 5 Instrumental activities of daily living at 30 days
Study or subgroup Restrictive LiberalMean
DifferenceMean
Difference
N Mean(SD) N Mean(SD) IV,Random,95% CI IV,Random,95% CI
Carson 2011 450 3.9 (0.4) 437 3.9 (0.5) 0.0 [ -0.06, 0.06 ]
Subtotal (95% CI) 0 0 0.0 [ 0.0, 0.0 ]
Heterogeneity: not applicable
Test for overall effect: Z = 0.0 (P < 0.00001)
Test for subgroup differences: Not applicable
-0.2 -0.1 0 0.1 0.2
Favours Restrictive Favours Liberal
58Transfusion thresholds and other strategies for guiding allogeneic red blood cell transfusion (Review)
Copyright © 2012 The Cochrane Collaboration. Published by John Wiley & Sons, Ltd.
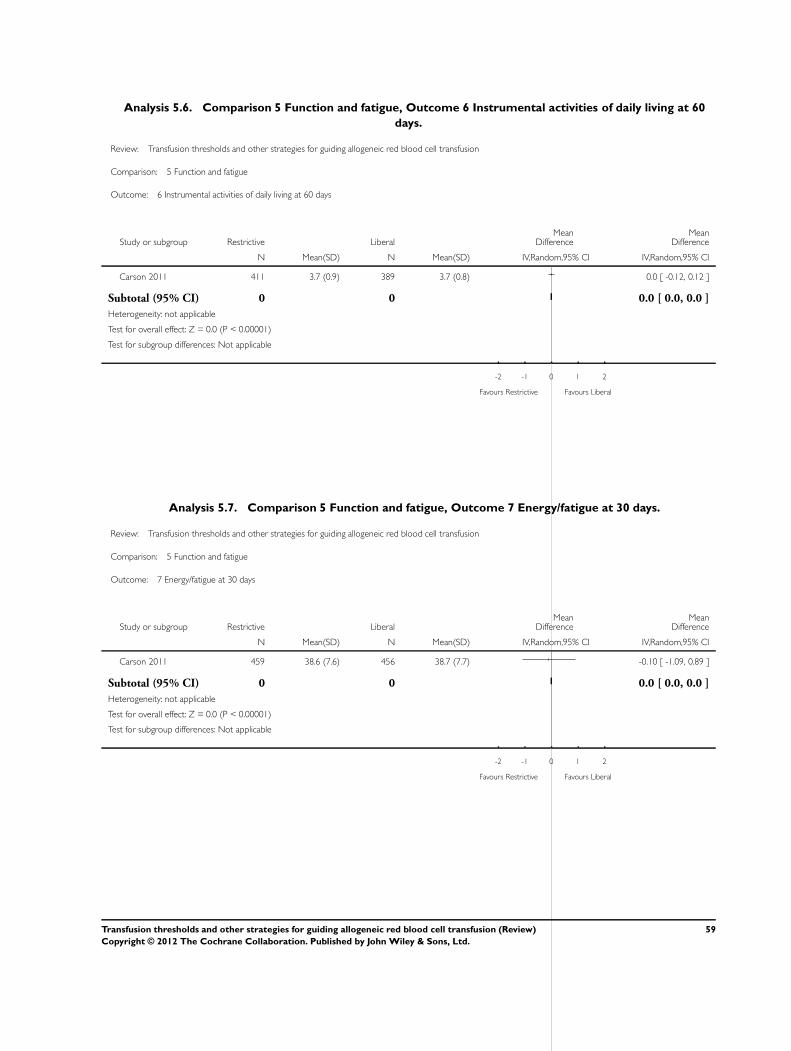
Analysis 5.6. Comparison 5 Function and fatigue, Outcome 6 Instrumental activities of daily living at 60
days.
Review: Transfusion thresholds and other strategies for guiding allogeneic red blood cell transfusion
Comparison: 5 Function and fatigue
Outcome: 6 Instrumental activities of daily living at 60 days
Study or subgroup Restrictive LiberalMean
DifferenceMean
Difference
N Mean(SD) N Mean(SD) IV,Random,95% CI IV,Random,95% CI
Carson 2011 411 3.7 (0.9) 389 3.7 (0.8) 0.0 [ -0.12, 0.12 ]
Subtotal (95% CI) 0 0 0.0 [ 0.0, 0.0 ]
Heterogeneity: not applicable
Test for overall effect: Z = 0.0 (P < 0.00001)
Test for subgroup differences: Not applicable
-2 -1 0 1 2
Favours Restrictive Favours Liberal
Analysis 5.7. Comparison 5 Function and fatigue, Outcome 7 Energy/fatigue at 30 days.
Review: Transfusion thresholds and other strategies for guiding allogeneic red blood cell transfusion
Comparison: 5 Function and fatigue
Outcome: 7 Energy/fatigue at 30 days
Study or subgroup Restrictive LiberalMean
DifferenceMean
Difference
N Mean(SD) N Mean(SD) IV,Random,95% CI IV,Random,95% CI
Carson 2011 459 38.6 (7.6) 456 38.7 (7.7) -0.10 [ -1.09, 0.89 ]
Subtotal (95% CI) 0 0 0.0 [ 0.0, 0.0 ]
Heterogeneity: not applicable
Test for overall effect: Z = 0.0 (P < 0.00001)
Test for subgroup differences: Not applicable
-2 -1 0 1 2
Favours Restrictive Favours Liberal
59Transfusion thresholds and other strategies for guiding allogeneic red blood cell transfusion (Review)
Copyright © 2012 The Cochrane Collaboration. Published by John Wiley & Sons, Ltd.

Analysis 5.8. Comparison 5 Function and fatigue, Outcome 8 Energy/fatigue at 60 days.
Review: Transfusion thresholds and other strategies for guiding allogeneic red blood cell transfusion
Comparison: 5 Function and fatigue
Outcome: 8 Energy/fatigue at 60 days
Study or subgroup Restrictive LiberalMean
DifferenceMean
Difference
N Mean(SD) N Mean(SD) IV,Random,95% CI IV,Random,95% CI
Carson 2011 525 42.3 (7.4) 544 41.8 (7.3) 0.50 [ -0.38, 1.38 ]
Subtotal (95% CI) 0 0 0.0 [ 0.0, 0.0 ]
Heterogeneity: not applicable
Test for overall effect: Z = 0.0 (P < 0.00001)
Test for subgroup differences: Not applicable
-2 -1 0 1 2
Favours Restrictive Favours Liberal
Analysis 6.1. Comparison 6 Adverse events, Outcome 1 Cardiac events.
Review: Transfusion thresholds and other strategies for guiding allogeneic red blood cell transfusion
Comparison: 6 Adverse events
Outcome: 1 Cardiac events
Study or subgroup Restrictive Liberal Risk Ratio Weight Risk Ratio
n/N n/N
M-H,Random,95%
CI
M-H,Random,95%
CI
Bracey 1999 44/212 49/216 20.1 % 0.91 [ 0.64, 1.31 ]
Bush 1997 8/50 8/49 8.5 % 0.98 [ 0.40, 2.40 ]
Carson 2011 76/1009 52/1007 20.7 % 1.46 [ 1.04, 2.05 ]
Hajjar 2010 60/249 53/253 21.2 % 1.15 [ 0.83, 1.59 ]
Hebert 1999 55/418 88/420 21.7 % 0.63 [ 0.46, 0.85 ]
Johnson 1992 4/20 7/18 6.8 % 0.51 [ 0.18, 1.47 ]
Lotke 1999 2/62 0/65 1.1 % 5.24 [ 0.26, 106.98 ]
Total (95% CI) 2020 2028 100.0 % 0.96 [ 0.70, 1.32 ]
Total events: 249 (Restrictive), 257 (Liberal)
Heterogeneity: Tau?? = 0.10; Chi?? = 16.87, df = 6 (P = 0.01); I?? =64%
Test for overall effect: Z = 0.25 (P = 0.80)
Test for subgroup differences: Not applicable
0.1 0.2 0.5 1 2 5 10
Favours Restrictive Favours Liberal
60Transfusion thresholds and other strategies for guiding allogeneic red blood cell transfusion (Review)
Copyright © 2012 The Cochrane Collaboration. Published by John Wiley & Sons, Ltd.
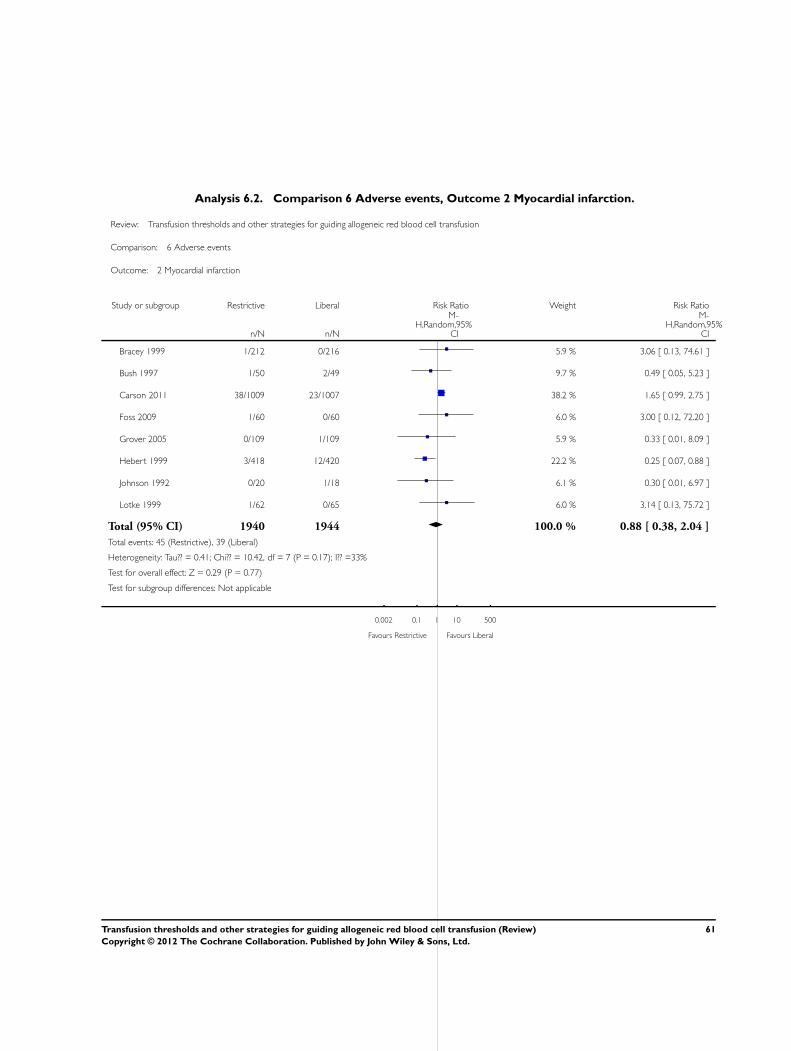
Analysis 6.2. Comparison 6 Adverse events, Outcome 2 Myocardial infarction.
Review: Transfusion thresholds and other strategies for guiding allogeneic red blood cell transfusion
Comparison: 6 Adverse events
Outcome: 2 Myocardial infarction
Study or subgroup Restrictive Liberal Risk Ratio Weight Risk Ratio
n/N n/N
M-H,Random,95%
CI
M-H,Random,95%
CI
Bracey 1999 1/212 0/216 5.9 % 3.06 [ 0.13, 74.61 ]
Bush 1997 1/50 2/49 9.7 % 0.49 [ 0.05, 5.23 ]
Carson 2011 38/1009 23/1007 38.2 % 1.65 [ 0.99, 2.75 ]
Foss 2009 1/60 0/60 6.0 % 3.00 [ 0.12, 72.20 ]
Grover 2005 0/109 1/109 5.9 % 0.33 [ 0.01, 8.09 ]
Hebert 1999 3/418 12/420 22.2 % 0.25 [ 0.07, 0.88 ]
Johnson 1992 0/20 1/18 6.1 % 0.30 [ 0.01, 6.97 ]
Lotke 1999 1/62 0/65 6.0 % 3.14 [ 0.13, 75.72 ]
Total (95% CI) 1940 1944 100.0 % 0.88 [ 0.38, 2.04 ]
Total events: 45 (Restrictive), 39 (Liberal)
Heterogeneity: Tau?? = 0.41; Chi?? = 10.42, df = 7 (P = 0.17); I?? =33%
Test for overall effect: Z = 0.29 (P = 0.77)
Test for subgroup differences: Not applicable
0.002 0.1 1 10 500
Favours Restrictive Favours Liberal
61Transfusion thresholds and other strategies for guiding allogeneic red blood cell transfusion (Review)
Copyright © 2012 The Cochrane Collaboration. Published by John Wiley & Sons, Ltd.

Analysis 6.3. Comparison 6 Adverse events, Outcome 3 Pulmonary oedema.
Review: Transfusion thresholds and other strategies for guiding allogeneic red blood cell transfusion
Comparison: 6 Adverse events
Outcome: 3 Pulmonary oedema
Study or subgroup Restrictive Liberal Risk Ratio Weight Risk Ratio
n/N n/N
M-H,Random,95%
CI
M-H,Random,95%
CI
Carson 2011 35/1009 27/1007 39.7 % 1.29 [ 0.79, 2.12 ]
Foss 2009 2/60 0/60 6.9 % 5.00 [ 0.25, 102.00 ]
Hebert 1999 22/418 45/420 39.7 % 0.49 [ 0.30, 0.80 ]
Johnson 1992 0/20 1/18 6.4 % 0.30 [ 0.01, 6.97 ]
Lacroix 2007 0/320 5/317 7.4 % 0.09 [ 0.01, 1.62 ]
Total (95% CI) 1827 1822 100.0 % 0.72 [ 0.31, 1.70 ]
Total events: 59 (Restrictive), 78 (Liberal)
Heterogeneity: Tau?? = 0.42; Chi?? = 11.40, df = 4 (P = 0.02); I?? =65%
Test for overall effect: Z = 0.74 (P = 0.46)
Test for subgroup differences: Not applicable
0.005 0.1 1 10 200
Favours Restrictive Favours Liberal
62Transfusion thresholds and other strategies for guiding allogeneic red blood cell transfusion (Review)
Copyright © 2012 The Cochrane Collaboration. Published by John Wiley & Sons, Ltd.

Analysis 6.4. Comparison 6 Adverse events, Outcome 4 Cerebrovascular accident (CVA) - stroke.
Review: Transfusion thresholds and other strategies for guiding allogeneic red blood cell transfusion
Comparison: 6 Adverse events
Outcome: 4 Cerebrovascular accident (CVA) - stroke
Study or subgroup Restrictive Liberal Risk Ratio Weight Risk Ratio
n/N n/N
M-H,Random,95%
CI
M-H,Random,95%
CI
Carson 1998 0/42 1/42 3.3 % 0.33 [ 0.01, 7.96 ]
Carson 2011 3/1009 8/1007 19.1 % 0.37 [ 0.10, 1.41 ]
Foss 2009 1/60 1/60 4.4 % 1.00 [ 0.06, 15.62 ]
Hajjar 2010 15/249 15/253 69.7 % 1.02 [ 0.51, 2.03 ]
Johnson 1992 1/20 0/18 3.4 % 2.71 [ 0.12, 62.70 ]
Total (95% CI) 1380 1380 100.0 % 0.84 [ 0.47, 1.49 ]
Total events: 20 (Restrictive), 25 (Liberal)
Heterogeneity: Tau?? = 0.0; Chi?? = 2.61, df = 4 (P = 0.63); I?? =0.0%
Test for overall effect: Z = 0.61 (P = 0.54)
Test for subgroup differences: Not applicable
0.01 0.1 1 10 100
Favours Restrictive Favours Liberal
63Transfusion thresholds and other strategies for guiding allogeneic red blood cell transfusion (Review)
Copyright © 2012 The Cochrane Collaboration. Published by John Wiley & Sons, Ltd.

Analysis 6.5. Comparison 6 Adverse events, Outcome 5 Pneumonia.
Review: Transfusion thresholds and other strategies for guiding allogeneic red blood cell transfusion
Comparison: 6 Adverse events
Outcome: 5 Pneumonia
Study or subgroup Restrictive Liberal Risk Ratio Weight Risk Ratio
n/N n/N
M-H,Random,95%
CI
M-H,Random,95%
CI
Carson 1998 0/42 2/42 0.5 % 0.20 [ 0.01, 4.04 ]
Carson 2011 48/1009 60/1007 31.6 % 0.80 [ 0.55, 1.16 ]
Foss 2009 1/60 2/60 0.8 % 0.50 [ 0.05, 5.37 ]
Hebert 1999 87/418 86/420 61.1 % 1.02 [ 0.78, 1.33 ]
Lacroix 2007 11/320 10/317 6.1 % 1.09 [ 0.47, 2.53 ]
Total (95% CI) 1849 1846 100.0 % 0.93 [ 0.76, 1.15 ]
Total events: 147 (Restrictive), 160 (Liberal)
Heterogeneity: Tau?? = 0.0; Chi?? = 2.51, df = 4 (P = 0.64); I?? =0.0%
Test for overall effect: Z = 0.65 (P = 0.52)
Test for subgroup differences: Not applicable
0.01 0.1 1 10 100
Favours Restrictive Favours Liberal
64Transfusion thresholds and other strategies for guiding allogeneic red blood cell transfusion (Review)
Copyright © 2012 The Cochrane Collaboration. Published by John Wiley & Sons, Ltd.

Analysis 6.6. Comparison 6 Adverse events, Outcome 6 Thromboembolism.
Review: Transfusion thresholds and other strategies for guiding allogeneic red blood cell transfusion
Comparison: 6 Adverse events
Outcome: 6 Thromboembolism
Study or subgroup Restrictive Liberal Risk Ratio Weight Risk Ratio
n/N n/N
M-H,Random,95%
CI
M-H,Random,95%
CI
Carson 1998 1/42 0/42 6.5 % 3.00 [ 0.13, 71.61 ]
Carson 2011 8/1009 12/1007 82.0 % 0.67 [ 0.27, 1.62 ]
Foss 2009 1/60 2/60 11.5 % 0.50 [ 0.05, 5.37 ]
Total (95% CI) 1111 1109 100.0 % 0.71 [ 0.32, 1.59 ]
Total events: 10 (Restrictive), 14 (Liberal)
Heterogeneity: Tau?? = 0.0; Chi?? = 0.90, df = 2 (P = 0.64); I?? =0.0%
Test for overall effect: Z = 0.83 (P = 0.40)
Test for subgroup differences: Not applicable
0.005 0.1 1 10 200
Favours Restrictive Favours Liberal
Analysis 6.7. Comparison 6 Adverse events, Outcome 7 Rebleeding.
Review: Transfusion thresholds and other strategies for guiding allogeneic red blood cell transfusion
Comparison: 6 Adverse events
Outcome: 7 Rebleeding
Study or subgroup Restrictive Liberal Risk Ratio Weight Risk Ratio
n/N n/N
M-H,Random,95%
CI
M-H,Random,95%
CI
Blair 1986 1/26 9/24 43.5 % 0.10 [ 0.01, 0.75 ]
Hajjar 2010 12/249 10/253 56.5 % 1.22 [ 0.54, 2.77 ]
Total (95% CI) 275 277 100.0 % 0.42 [ 0.03, 4.99 ]
Total events: 13 (Restrictive), 19 (Liberal)
Heterogeneity: Tau?? = 2.67; Chi?? = 5.43, df = 1 (P = 0.02); I?? =82%
Test for overall effect: Z = 0.69 (P = 0.49)
Test for subgroup differences: Not applicable
0.005 0.1 1 10 200
Favours Restrictive Favours Liberal
65Transfusion thresholds and other strategies for guiding allogeneic red blood cell transfusion (Review)
Copyright © 2012 The Cochrane Collaboration. Published by John Wiley & Sons, Ltd.

Analysis 6.8. Comparison 6 Adverse events, Outcome 8 Infection.
Review: Transfusion thresholds and other strategies for guiding allogeneic red blood cell transfusion
Comparison: 6 Adverse events
Outcome: 8 Infection
Study or subgroup Restrictive Liberal Risk Ratio Weight Risk Ratio
n/N n/N
M-H,Random,95%
CI
M-H,Random,95%
CI
Bracey 1999 5/212 3/216 2.1 % 1.70 [ 0.41, 7.02 ]
Carson 2011 56/1009 74/1007 29.2 % 0.76 [ 0.54, 1.06 ]
Foss 2009 6/60 11/60 4.8 % 0.55 [ 0.22, 1.38 ]
Hajjar 2010 30/249 25/253 15.0 % 1.22 [ 0.74, 2.01 ]
Lacroix 2007 65/320 79/317 36.6 % 0.82 [ 0.61, 1.09 ]
So-Osman 2010 18/299 31/304 12.4 % 0.59 [ 0.34, 1.03 ]
Total (95% CI) 2149 2157 100.0 % 0.81 [ 0.66, 1.00 ]
Total events: 180 (Restrictive), 223 (Liberal)
Heterogeneity: Tau?? = 0.01; Chi?? = 5.70, df = 5 (P = 0.34); I?? =12%
Test for overall effect: Z = 1.99 (P = 0.046)
Test for subgroup differences: Not applicable
0.1 0.2 0.5 1 2 5 10
Favours Restrictive Favours Liberal
66Transfusion thresholds and other strategies for guiding allogeneic red blood cell transfusion (Review)
Copyright © 2012 The Cochrane Collaboration. Published by John Wiley & Sons, Ltd.

Analysis 6.9. Comparison 6 Adverse events, Outcome 9 Renal failure.
Review: Transfusion thresholds and other strategies for guiding allogeneic red blood cell transfusion
Comparison: 6 Adverse events
Outcome: 9 Renal failure
Study or subgroup Restrictive Liberal Risk Ratio Weight Risk Ratio
n/N n/N
M-H,Random,95%
CI
M-H,Random,95%
CI
Bracey 1999 8/212 5/216 34.7 % 1.63 [ 0.54, 4.90 ]
Hajjar 2010 10/249 13/253 60.4 % 0.78 [ 0.35, 1.75 ]
Lacroix 2007 2/320 0/317 4.9 % 4.95 [ 0.24, 102.77 ]
Total (95% CI) 781 786 100.0 % 1.10 [ 0.56, 2.18 ]
Total events: 20 (Restrictive), 18 (Liberal)
Heterogeneity: Tau?? = 0.03; Chi?? = 2.14, df = 2 (P = 0.34); I?? =6%
Test for overall effect: Z = 0.29 (P = 0.77)
Test for subgroup differences: Not applicable
0.005 0.1 1 10 200
Favours Restrictive Favours Liberal
Analysis 6.10. Comparison 6 Adverse events, Outcome 10 Mental confusion.
Review: Transfusion thresholds and other strategies for guiding allogeneic red blood cell transfusion
Comparison: 6 Adverse events
Outcome: 10 Mental confusion
Study or subgroup Restrictive Liberal Risk Ratio Weight Risk Ratio
n/N n/N
M-H,Random,95%
CI
M-H,Random,95%
CI
Foss 2009 6/60 5/60 61.0 % 1.20 [ 0.39, 3.72 ]
Lotke 1999 7/62 2/65 39.0 % 3.67 [ 0.79, 16.99 ]
Total (95% CI) 122 125 100.0 % 1.86 [ 0.63, 5.44 ]
Total events: 13 (Restrictive), 7 (Liberal)
Heterogeneity: Tau?? = 0.16; Chi?? = 1.34, df = 1 (P = 0.25); I?? =25%
Test for overall effect: Z = 1.13 (P = 0.26)
Test for subgroup differences: Not applicable
0.05 0.2 1 5 20
Favours Restrictive Favours Liberal
67Transfusion thresholds and other strategies for guiding allogeneic red blood cell transfusion (Review)
Copyright © 2012 The Cochrane Collaboration. Published by John Wiley & Sons, Ltd.

A P P E N D I C E S
Appendix 1. Search strategy
Cochrane Injuries Group’s Specialised Register (searched 1 February 2011)
(Blood or “Red blood cell” or “Red blood cells” or RBC) and (therap* or transfus*) and (polic* or practice or protocol* or trigger* or
threshold* or indicator* or strateg* or criteri* or standard* or restrict* or liberal* or management or program*)
Cochrane Central Register of Controlled Trials (CENTRAL) (The Cochrane Library 2011, Issue 1)
#1 MeSH descriptor Blood Transfusion, this term only with qualifiers: MT,ST
#2 transfus* near5 (polic*or practic* or protocol* or trigger* or threshold*or indicator* or strateg* or criteri* or standard*)
#3 (Red blood cell* or RBC) near5 (polic*or practic* or protocol* or trigger* or threshold*or indicator* or strateg* or criteri* or
standard*) and (therap* or transfus*)
#4 (H?emoglobin or h?emocrit or HB or HCT) near5 (polic*or practic* or protocol* or trigger* or threshold*or indicator* or strateg*
or criteri* or standard*)
#5 transfus* near5 (restrict* or liberal*)
#6 (blood transfus*) near3 (management or program*)
#7 (#1 OR #2 OR #3 OR #4 OR #5 OR #6)
MEDLINE (Ovid) 1948 to January Week 3 2011
1. *Blood Transfusion/
2. ((Red blood cell* or RBC) adj3 (therap* or transfus*)).mp.
3. 1 or 2
4. exp Reference Standards/
5. standards.fs.
6. methods.fs.
7. 4 or 5 or 6
8. 3 and 7
9. (transfus* adj5 (polic*or practic* or protocol* or trigger* or threshold*or indicator* or strateg* or criteri* or standard*)).mp.
10. ((Red blood cell* or RBC) adj5 (polic*or practic* or protocol* or trigger* or threshold*or indicator* or strateg* or criteri* or
standard*)).mp.
11. ((H?emoglobin or h?emocrit or HB or HCT) adj5 (polic*or practic* or protocol* or trigger* or threshold*or indicator* or strateg*
or criteri* or standard*)).mp.
12. (transfus* adj5 (restrict* or liberal*)).mp.
13. ((blood or transfus*) adj3 (management or program*)).mp.
14. 8 or 9 or 10 or 11 or 12 or 13
15. randomi?ed.ab,ti.
16. randomized controlled trial.pt.
17. controlled clinical trial.pt.
18. placebo.ab.
19. clinical trials as topic.sh.
20. randomly.ab.
21. trial.ti.
22.15 or 16 or 17 or 18 or 19 or 20 or 21
23. (animals not (humans and animals)).sh.
24. 22 not 23
25. 24 and 14
68Transfusion thresholds and other strategies for guiding allogeneic red blood cell transfusion (Review)
Copyright © 2012 The Cochrane Collaboration. Published by John Wiley & Sons, Ltd.
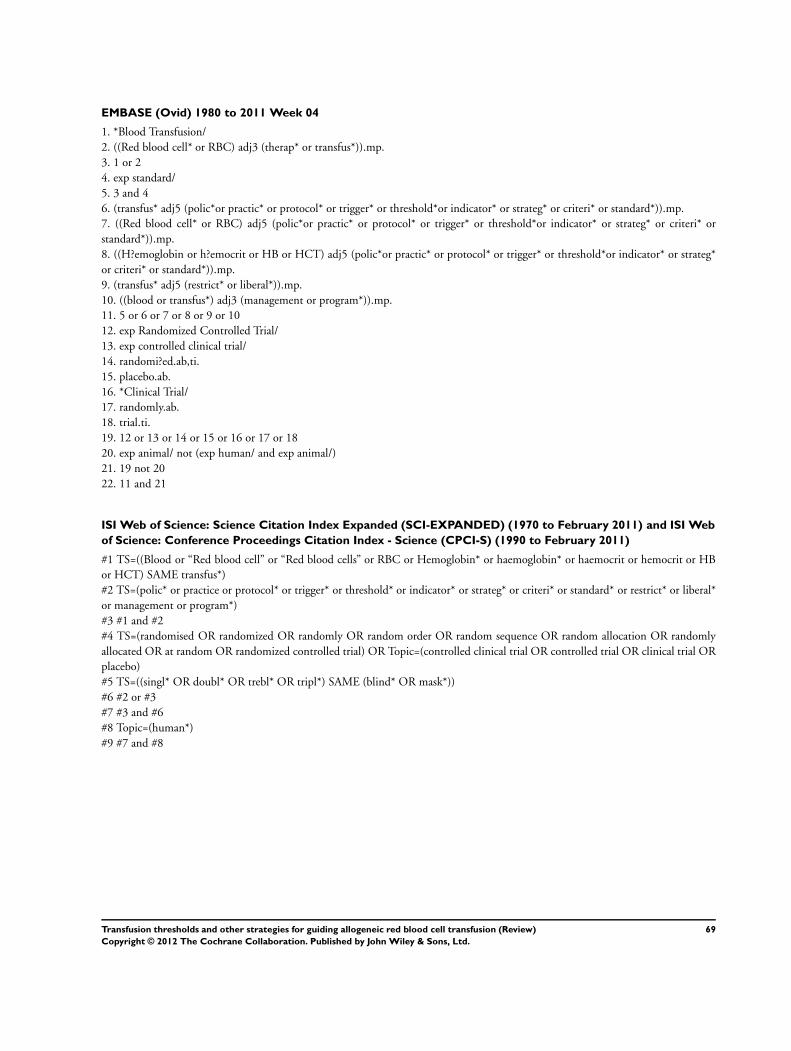
EMBASE (Ovid) 1980 to 2011 Week 04
1. *Blood Transfusion/
2. ((Red blood cell* or RBC) adj3 (therap* or transfus*)).mp.
3. 1 or 2
4. exp standard/
5. 3 and 4
6. (transfus* adj5 (polic*or practic* or protocol* or trigger* or threshold*or indicator* or strateg* or criteri* or standard*)).mp.
7. ((Red blood cell* or RBC) adj5 (polic*or practic* or protocol* or trigger* or threshold*or indicator* or strateg* or criteri* or
standard*)).mp.
8. ((H?emoglobin or h?emocrit or HB or HCT) adj5 (polic*or practic* or protocol* or trigger* or threshold*or indicator* or strateg*
or criteri* or standard*)).mp.
9. (transfus* adj5 (restrict* or liberal*)).mp.
10. ((blood or transfus*) adj3 (management or program*)).mp.
11. 5 or 6 or 7 or 8 or 9 or 10
12. exp Randomized Controlled Trial/
13. exp controlled clinical trial/
14. randomi?ed.ab,ti.
15. placebo.ab.
16. *Clinical Trial/
17. randomly.ab.
18. trial.ti.
19. 12 or 13 or 14 or 15 or 16 or 17 or 18
20. exp animal/ not (exp human/ and exp animal/)
21. 19 not 20
22. 11 and 21
ISI Web of Science: Science Citation Index Expanded (SCI-EXPANDED) (1970 to February 2011) and ISI Web
of Science: Conference Proceedings Citation Index - Science (CPCI-S) (1990 to February 2011)
#1 TS=((Blood or “Red blood cell” or “Red blood cells” or RBC or Hemoglobin* or haemoglobin* or haemocrit or hemocrit or HB
or HCT) SAME transfus*)
#2 TS=(polic* or practice or protocol* or trigger* or threshold* or indicator* or strateg* or criteri* or standard* or restrict* or liberal*
or management or program*)
#3 #1 and #2
#4 TS=(randomised OR randomized OR randomly OR random order OR random sequence OR random allocation OR randomly
allocated OR at random OR randomized controlled trial) OR Topic=(controlled clinical trial OR controlled trial OR clinical trial OR
placebo)
#5 TS=((singl* OR doubl* OR trebl* OR tripl*) SAME (blind* OR mask*))
#6 #2 or #3
#7 #3 and #6
#8 Topic=(human*)
#9 #7 and #8
69Transfusion thresholds and other strategies for guiding allogeneic red blood cell transfusion (Review)
Copyright © 2012 The Cochrane Collaboration. Published by John Wiley & Sons, Ltd.

W H A T ’ S N E W
Last assessed as up-to-date: 1 February 2011.
Date Event Description
17 April 2012 Amended Minor copy edits were made to the text.
H I S T O R Y
Protocol first published: Issue 2, 2000
Review first published: Issue 2, 2002
Date Event Description
20 December 2011 New citation required and conclusions have changed The searches were updated to February 2011. Data
from two new trials are included and the results have
been amended accordingly. One trial was identified
through the updated search; the other had previously
been included as an ongoing trial and the results re-
cently became available
The Background section of the review has been up-
dated. The overall conclusions of the review remain
similar but the clinical settings for which the results
can be generalised have been extended
As part of this update the assessment of methodolog-
ical quality used in earlier versions of this review has
been replaced with an assessment of the risk of bias.
This amendment is in accordance with a change in the
Cochrane Collaboration’s methodological guidance
The authors of the review have changed.
1 February 2011 New search has been performed The search for studies was updated to February 2011.
9 September 2008 Amended Converted to new review format.
17 November 2004 New search has been performed An updated search for new trials was conducted in
November 2004. No new trials for inclusion were iden-
tified
70Transfusion thresholds and other strategies for guiding allogeneic red blood cell transfusion (Review)
Copyright © 2012 The Cochrane Collaboration. Published by John Wiley & Sons, Ltd.

C O N T R I B U T I O N S O F A U T H O R S
Contributors (names are listed alphabetically):
Paul Carless (University of Newcastle) performed original database literature searches, screened abstracts and titles for relevant articles,
obtained relevant papers, applied inclusion/exclusion criteria to retrieved papers, extracted data from the trials, quality assessed trials,
entered data into Meta-View 4.1, entered all study details into Review Manager 5.1, and co-wrote the review; Jeffrey Carson (Robert
Wood Johnson Medical School) for the 2011 update, screened abstracts and titles for relevant articles, obtained relevant papers, applied
inclusion/exclusion criteria to retrieved papers, extracted data from the trials, quality assessed trials, entered data into Meta-View
4.1, entered all study details into Review Manager 5.1, and co-wrote review; Paul Hebert (Ottawa General Hospital) reviewed the
manuscript, provided expertise with analysis and content expert opinion.
D E C L A R A T I O N S O F I N T E R E S T
Dr. Carson reports receiving grant support to his institution from Amgen and US National Institutes of Health. He is involved with
guideline development. Dr. Hebert reports receiving grant support from Amgen and Johnson and Johnson.
S O U R C E S O F S U P P O R T
Internal sources
• No sources of support supplied
External sources
• NSW Ministerial Advisory Committee on Quality in Health Care, Australia.
• NSW Health Department, Australia.
D I F F E R E N C E S B E T W E E N P R O T O C O L A N D R E V I E W
There were no differences identified.
I N D E X T E R M S
Medical Subject Headings (MeSH)
∗Practice Guidelines as Topic; Erythrocyte Transfusion [adverse effects; mortality; ∗standards]; Hematocrit [standards]; Hemoglobin
A [analysis]; Randomized Controlled Trials as Topic; Reference Values; Transplantation, Autologous [standards]; Transplantation,
Homologous [mortality; standards]
71Transfusion thresholds and other strategies for guiding allogeneic red blood cell transfusion (Review)
Copyright © 2012 The Cochrane Collaboration. Published by John Wiley & Sons, Ltd.

MeSH check words
Humans
72Transfusion thresholds and other strategies for guiding allogeneic red blood cell transfusion (Review)
Copyright © 2012 The Cochrane Collaboration. Published by John Wiley & Sons, Ltd.