Embed Size (px)
Citation preview

1 | DocuSign PUBLICDocuSign PUBLICDocuSign PUBLIC
Transforming the foundation of doing businessFall 2021

2 | DocuSign PUBLIC
Safe HarborThis presentation contains forward-looking statements that are based on our management’s beliefs and assumptions and on information currently available to management. Forward-looking statements include all statements that are not historical facts and can be identified by terms such as “may,” “will,” “should,” “expects,” “plans,” “anticipates,” “could,” “intends,” “target,” “projects,” “contemplates,” “believes,” “estimates,” “predicts,” “potential,” or “continue” or the negative of these words or other similar terms or expressions that concern our expectations, strategy, plans or intentions. Forward-looking statements in this presentation include any statements about expected financial metrics, such as revenue, billings, non-GAAP gross margin, non-GAAP diluted weighted-average shares outstanding, and non-financial metrics, such as customer growth, as well as statements related to our expectations regarding the benefits of the DocuSign Agreement Cloud, enhancements and additions to it, including as a result of acquisitions. They also include statements about our future operating results and financial position, our business strategy and plans, market growth and trends, and our objectives for future operations. These statements are subject to substantial risks and uncertainties that could cause actual results to differ materially from those expressed or implied by such statements.
These risks and uncertainties include, among other things, risks related to our expectations regarding the impact of the evolving COVID-19 pandemic on our business, our results of operations and our financial condition, as well as our future profitability and growth once the pandemic and its related effects begin to abate or have abated; our expectations regarding the impact of the evolving COVID-19 pandemic on the businesses of our customers, partners and suppliers, and the economy, as well as the macro-and micro-effects of the pandemic, including the pace of the digital transformation of business and differing levels of demand for our products as our customers’ priorities, resources, financial conditions and economic outlook change; our ability to estimate the size of our total addressable market; our ability to effectively sustain and manage our growth and future expenses, achieve and maintain future profitability, attract new customers and maintain and expand our existing customer base; our ability to scale and update our platform to respond to customers' needs and rapid technological change; the effects of increased competition in our market and our ability to compete effectively; our ability to expand use cases within existing customers and vertical solutions; our ability to expand our operations and increase adoption of our platform internationally; our ability to strengthen and foster our relationships with developers; our ability to expand our direct sales force, customer success team and strategic partnerships around the world; our ability to identify targets for and execute potential acquisitions; our ability to successfully integrate the operations of businesses we may acquire, and to realize the anticipated benefits of such acquisitions; our ability to maintain, protect and enhance our brand; the sufficiency of our cash, cash equivalents and capital resources to satisfy our liquidity needs; limitations on us due to obligations we have under our credit facility or other indebtedness; our failure or the failure of our software to comply with applicable industry standards, laws and regulations; our ability to maintain, protect and enhance our intellectual property; our ability to successfully defend litigation against us; our ability to attract large organizations as users; our ability to maintain our corporate culture; our ability to offer high-quality customer support; our ability to hire, retain and motivate qualified personnel; our ability to estimate the size and potential growth of our target market; and our ability to maintain proper and effective internal controls. Additional risks and uncertainties that could affect our financial results are included in the sections titled "Risk Factors" and "Management's Discussion and Analysis of Financial Condition and Results of Operations" in our annual report on Form 10-K for the fiscal year ended January 31, 2021 filed on March 31, 2021, our quarterly report on Form 10-Q for the quarter ended April 30, 2021 filed on June 4, 2021 with the Securities and Exchange Commission (the “SEC”), and other filings that we make from time to time with the SEC. In addition, any forward-looking statements contained in this presentation are based on assumptions that we believe to be reasonable as of this date. Except as required by law, we assume no obligation to update these forward-looking statements, or to update the reasons if actual results differ materially from those anticipated in the forward-looking statements.

3 | DocuSign PUBLIC
To supplement our consolidated financial statements, which are prepared and presented in accordance with GAAP, we use certain non-GAAP financial measures, as described below, to understand and evaluate our core operating performance. These non-GAAP financial measures, which may be different than similarly-titled measures used by other companies, are presented to enhance investors’ overall understanding of our financial performance and should not be considered a substitute for, or superior to, the financial information prepared and presented in accordance with GAAP.
We believe that these non-GAAP financial measures provide useful information about our financial performance, enhance the overall understanding of our past performance and future prospects, and allow for greater transparency with respect to important metrics used by our management for financial and operational decision-making. We are presenting these non-GAAP measures to assist investors in seeing our financial performance using a management view, and because we believe that these measures provide an additional tool for investors to use in comparing our core financial performance over multiple periods with other companies in our industry.
Non-GAAP gross profit, non-GAAP gross margin, non-GAAP operating expenses, non-GAAP income from operations, non-GAAP operating margin, non-GAAP net income and non-GAAP net income per share: We define these non-GAAP financial measures as the respective GAAP measures, excluding expenses related to stock-based compensation, employer payroll tax on employee stock transactions, amortization of acquisition-related intangibles, amortization of debt discount and issuance costs, acquisition-related expenses, fair value adjustments to strategic investments, impairment of lease-related assets, and, as applicable, other special items. The amount of employer payroll tax-related items on employee stock transactions is dependent on our stock price and other factors that are beyond our control and do not correlate to the operation of the business. When evaluating the performance of our business and making operating plans, we do not consider these items (for example, when considering the impact of equity award grants, we place a greater emphasis on overall stockholder dilution rather than the accounting charges associated with such grants). We believe it is useful to exclude these expenses in order to better understand the long-term performance of our core business and to facilitate comparison of our results to those of peer companies and over multiple periods.
Free cash flow: We define free cash flow as net cash provided by (used in) operating activities less purchases of property and equipment. We believe free cash flow is an important liquidity measure of the cash (if any) that is available, after purchases of property and equipment, for operational expenses, investment in our business, and to make acquisitions. Free cash flow is useful to investors as a liquidity measure because it measures our ability to generate or use cash in excess of our capital investments in property and equipment. Once our business needs and obligations are met, cash can be used to maintain a strong balance sheet and invest in future growth.
Billings: We define billings as total revenues plus the change in our contract liabilities and refund liability less contract assets and unbilled accounts receivable in a given period. Billings reflects sales to new customers plus subscription renewals and additional sales to existing customers. Only amounts invoiced to a customer in a given period are included in billings. We believe billings is a key metric to measure our periodic performance. Given that most of our customers pay in annual installments one year in advance, but we typically recognize a majority of the related revenue ratably over time, we use billings to measure and monitor our ability to provide our business with the working capital generated by upfront payments from our customers.
For a reconciliation of these non-GAAP financial measures to the most directly comparable GAAP financial measure, please see “Reconciliation of GAAP to Non-GAAP Financial Measures” below.
Non-GAAP Financial Measures and Other Key Metrics
4 | DocuSign PUBLIC
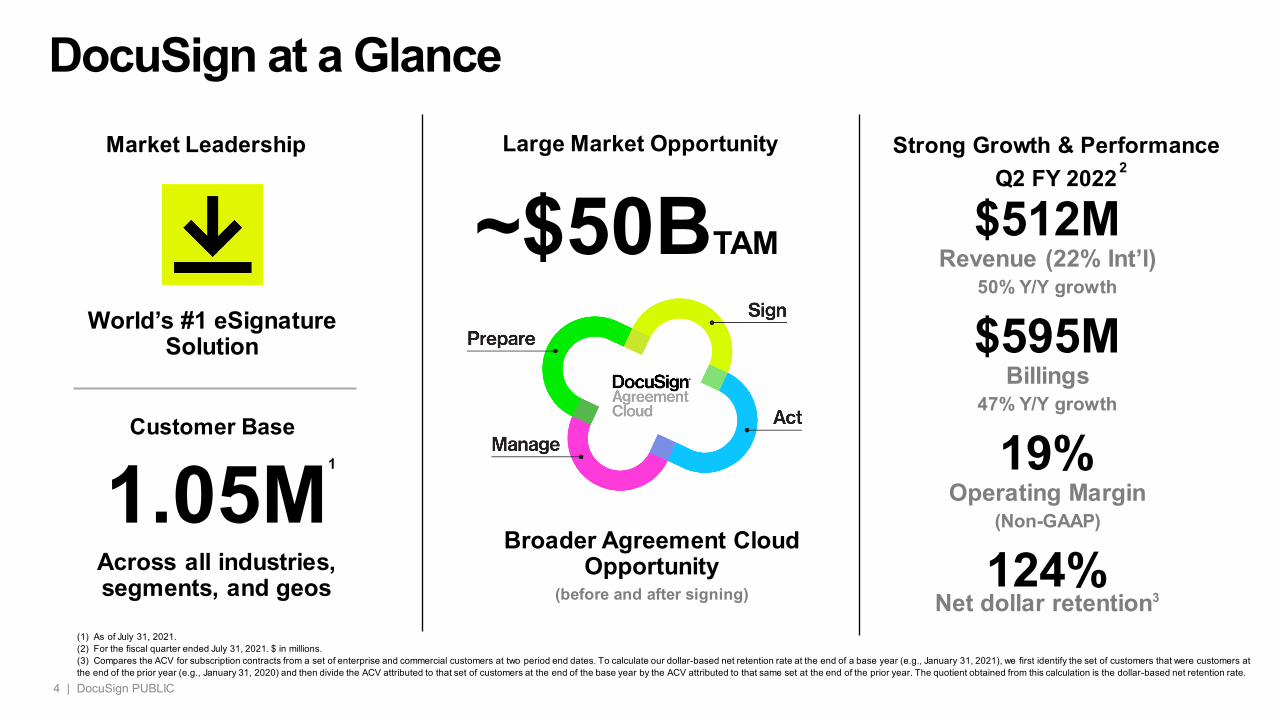
Strong Growth & Performance Q2 FY 2022
DocuSign at a Glance
1.05M
World’s #1 eSignature Solution
1
Large Market OpportunityMarket Leadership
Customer Base
Across all industries, segments, and geos
Broader Agreement Cloud Opportunity
(before and after signing)
~$50BTAM $512MRevenue (22% Int’l)
50% Y/Y growth
$595MBillings
47% Y/Y growth
19%Operating Margin
(Non-GAAP)
124%Net dollar retention3
2
(1) As of July 31, 2021.(2) For the fiscal quarter ended July 31, 2021. $ in millions.(3) Compares the ACV for subscription contracts from a set of enterprise and commercial customers at two period end dates. To calculate our dollar-based net retention rate at the end of a base year (e.g., January 31, 2021), we first identify the set of customers that were customers at the end of the prior year (e.g., January 31, 2020) and then divide the ACV attributed to that set of customers at the end of the base year by the ACV attributed to that same set at the end of the prior year. The quotient obtained from this calculation is the dollar-based net retention rate.
5 | DocuSign PUBLIC
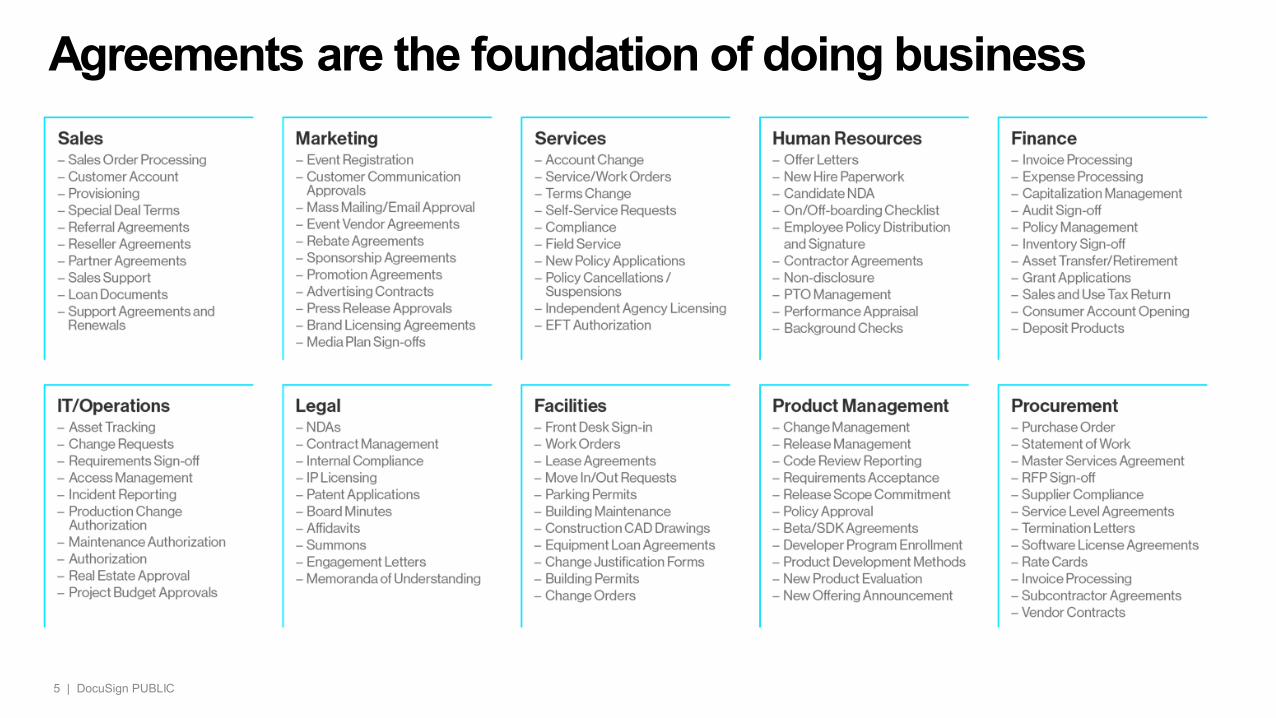
Agreements are the foundation of doing business

6 | DocuSign PUBLIC
But agreement processes are manual and disconnected
Result: Wasted time, needless costs, more errors, greater risk
7 | DocuSign PUBLIC
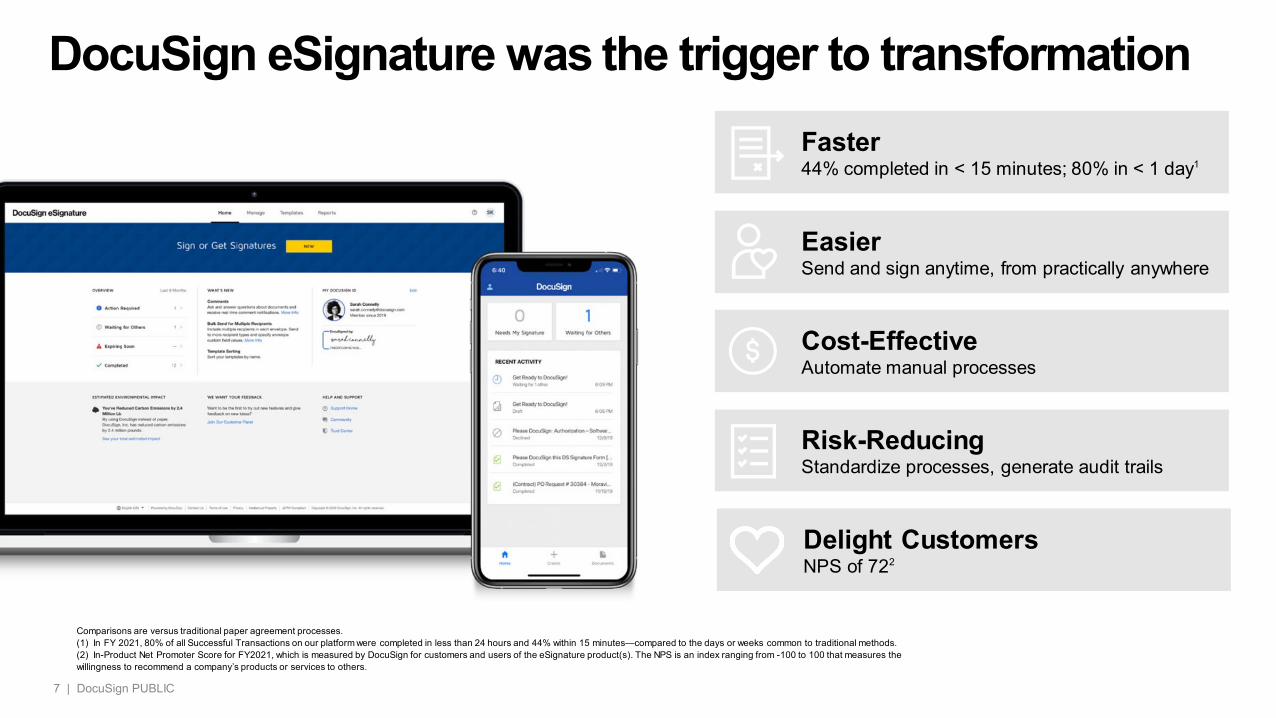
DocuSign eSignature was the trigger to transformation
Comparisons are versus traditional paper agreement processes.(1) In FY 2021, 80% of all Successful Transactions on our platform were completed in less than 24 hours and 44% within 15 minutes—compared to the days or weeks common to traditional methods.(2) In-Product Net Promoter Score for FY2021, which is measured by DocuSign for customers and users of the eSignature product(s). The NPS is an index ranging from -100 to 100 that measures the willingness to recommend a company’s products or services to others.
(2)
Faster44% completed in < 15 minutes; 80% in < 1 day1
EasierSend and sign anytime, from practically anywhere
Cost-EffectiveAutomate manual processes
Risk-ReducingStandardize processes, generate audit trails
Delight CustomersNPS of 722

The Next Must-Have Cloud Platform
MarketingClouds
SalesClouds
ServiceClouds
HRClouds
ERPClouds
IT/OpsClouds
Business Processes
Agreement Processes
Agreement Cloud
Front office Back office

9 | DocuSign PUBLIC
Financial Services | Life Sciences | Government | Real Estate | Mortgage
Industry SolutionsIntegrations
Salesforce | Microsoft | Google | SAP | Workday | Hundreds more
APIsREST | Send | Sign | Identity | Rooms | Webhooks | Workflow | Data Feed | SDK
Infrastructure | Administration | Authentication | Service Protection | Object Model | Repository | Search | Machine Learning | 508 Compliance
Platform
Prepare Sign Act ManageGen & NegotiateAnalyzerGuided Forms
NEW
eSignatureIdentifyNotary
LEADER CLM InsightPayments Monitor
LEADERLEADER
NEW
Agreement Cloud

Market Leader with Massive and Expanding TAM
~$50B+$25B 1 ~$25B 1
SignWorld’s #1eSignature
PrepareActManage
TAM 1
(1) DocuSign estimate combining commissioned third-party research with internal customer count, pricing and spending data.
=

11 | DocuSign PUBLIC11
Building on innovation and expanding opportunity
AGREEMENT CLOUDBroaden Automation to cover end-to-
end agreement processes
SMART AGREEMENT CLOUD
Deepen Automation with AI and Smart Contracts
eSignature LeadershipDigitize and Automate signing with
electronic signature
Launched eSignature
SpringCM Acquisition (CLM)
Agreement Cloud Introduced
Seal Acquisition
Announced Notary
Introduced Analyzer
Introduced Gen
Liveoak Acquisition
Introduced Negotiate
~$0.5BLTM
Revenue1
(1) For the trailing 12 months ended April 30, 2018.(2) For the fiscal year ended January 31, 2021.(3) DocuSign estimate combining commissioned third-party research with internal customer count, pricing and spending data.
IPO
~$1.5BFY21 revenue 2
~$50BTAM3

12 | DocuSign PUBLIC
Key Products
eSignatureWorld’s #1 way to send and sign documents electronically
CLMContract lifecycle management
NotaryRemote online notarization via videoconference
Insight / AnalyzerAI-based search, analysis, and risk-scoring of agreements

13 | DocuSign PUBLIC
Identify Click Notary
World’s #1 way to send and sign electronically
Most capabilities + larger R&D spend than all the competitors combined
LEADER
Industry leading availability
350+ pre-built integrations
Electronic and remote notarization
Strongest offering in eNotary
1st Party Remote Notary Solution that is embedded into the Signing Workflow
Coming: 3rd Party Notary Service later this year
Offer best way to agree to anything, anywhere
NEW
Contract Lifecycle Management
Based on SpringCMacquisition, ranked a leader by Forrester and Gartner
LEADER
Strong player in sell-side with most robust Salesforce integration
New - Enhanced buy-side capabilities & ERP integrations
AI-based agreement analytics and search
LEADER
Based on Seal Software acquisition, the pioneer in AI agreements
Rapid time to value via prebuilt and easily customized models
Large community of legal engineers at DocuSign, GSIs, and LSIs

14 | DocuSign PUBLIC
DocuSign CLM
Generate agreements, facilitate negotiation, track redlines, and ensure version control
Connect and track business processes across contributors, reviewers, approvers and more
Centralize agreements in a secure, searchable repository
Automate the contract lifecycle

15 | DocuSign PUBLIC
DocuSign Insight
Find, filter and analyze all your existing agreements with purpose-built contract analytics
Compare AI-extracted clauses and terms across agreements
Search agreements by concept, not just keyword
Understand what’s in your contracts

16 | DocuSign PUBLIC
DocuSign Analyzer
Automated clause and term analysis for incoming agreements
Risk scoring of contract content to guide faster action
Direct access to your library ofpre-approved clauses
Integrates with DocuSign CLM to automatically route work based on clause type and risk
Negotiate contracts with the power of AI

17 | DocuSign PUBLIC
DocuSign Notary
Secure videoconferencing with notary-specific tools and workflow
Multi-state compliance
Support for customer-supplied notaries
Robust audit trail
Electronic notarization from virtually anywhere

18 | DocuSign PUBLIC
Across All VerticalsTrusted by the World’s Leading Brands

19 | DocuSign PUBLIC
(1) As of fiscal quarter ended July 31, 2021.(2) In-Product Net Promoter Score for FY2021, which is measured by DocuSign for customers and users of the eSignature product(s). The NPS is an index ranging from -100 to 100 that measures the willingness to recommend a company’s products or services to others.
Comprehensive Innovative Trusted
Why DocuSign continues to win
Most applications12+ applications span the entire agreement process
Most integrations350+ prebuilt integrations with the systems where work gets done
Award-winning API1,000+ customer-built integrations
Track record of “firsts”eSignature pioneer, with 750+ product innovations delivered
World-class platform technologiesArchitected to power industry leading to nearly 99.999% uptime
Scaled Solutions Designing, delivering, and supporting technologies across agreement cloud
Security and PrivacyFedRamp, GDPR,
Net promoter score of 722
Loved like the world’s best brands
1.05M customers and hundreds of millionsof signers1
The global standard in eSignature, across 180+ countries
BCR, ISO27001

Anyone, Anywhere GTM
DigitalDirect PartnerLand | Expand | Extend Lead | Try | Buy | Upgrade
Web-Based / Self-Service Channel
Hundreds of Millions
Reseller | Software Vendor | Systems Integrator
Signers

21 | DocuSign PUBLIC
GTMCustomerEngagementExpansionModel
Deploy Typically start with initial eSignature use case(s)
Drive AdoptionExpand existing eSignature volumes & use case(s)
OptimizeUse Case(s)Expand into broader Agreement Cloud (CLM, Analytics)
Discover NewOpportunitiesDrive new use cases throughout the organization
Customer Success Drives ROI

22 | DocuSign PUBLIC
Multi-Channel Experience throughout the Customer Journey
Accelerate consumptionIncrease net retentionFuel future growthReduce churn
Across all GTM teams
Extend
Partner integrations
From single department to ELA
Expand
Signers
Accelerate our customers’ path to the Agreement Cloud
From eSignature to Agreement Cloud
Digital customer
Receiving & signing documents
Direct customer
From digital to direct
Paying web customerSigner

Robust PartnerDelivery Model Software Vendors
Systems Integrators
Resellers

24 | DocuSign PUBLIC
Financial Review

25 | DocuSign PUBLIC
Volume CapacityPre-Set # of Envelopes Provisioned
Product Functionality35%>12 months
65%≤12 months
Dollar WeightedAverage Contract
Length1
18monthseSignature
Single-user Multi-user Business Pro
Enterprise Pro Platform
(1) Rolling 4-quarter average through fiscal quarter ended April 30, 2021.
Capacity-Based Model
Pricing by FunctionalityMultiple levels of product functionality
Envelopes
How customers buy from usPrepaid Model

26 | DocuSign PUBLIC
(1) Fiscal years ended January 31 and fiscal quarters ended July 31. $ in millions.(2) Fiscal quarter ended July 31, 2021.
$324
$493
47%
52%
Q2 FY21 Q2 FY22
$664
$918
$1,381
37%38%
50%
FY19 FY20 FY21
35%
39%
49%
FY19 FY20 FY21
$342
$512
45%
50%
Q2 FY21 Q2 FY22
Y/Y Growth
Total Revenue1 Subscription Revenue1 Revenue Contribution2
$1,453
$974
$701
Subscription
Professional Services & Other
96%
4%
Web & Mobile (Digital)
Ent & commercial (Direct)
88%
12%
Y/Y Growth
Strong and consistent revenue growth at scale
27 | DocuSign PUBLIC27
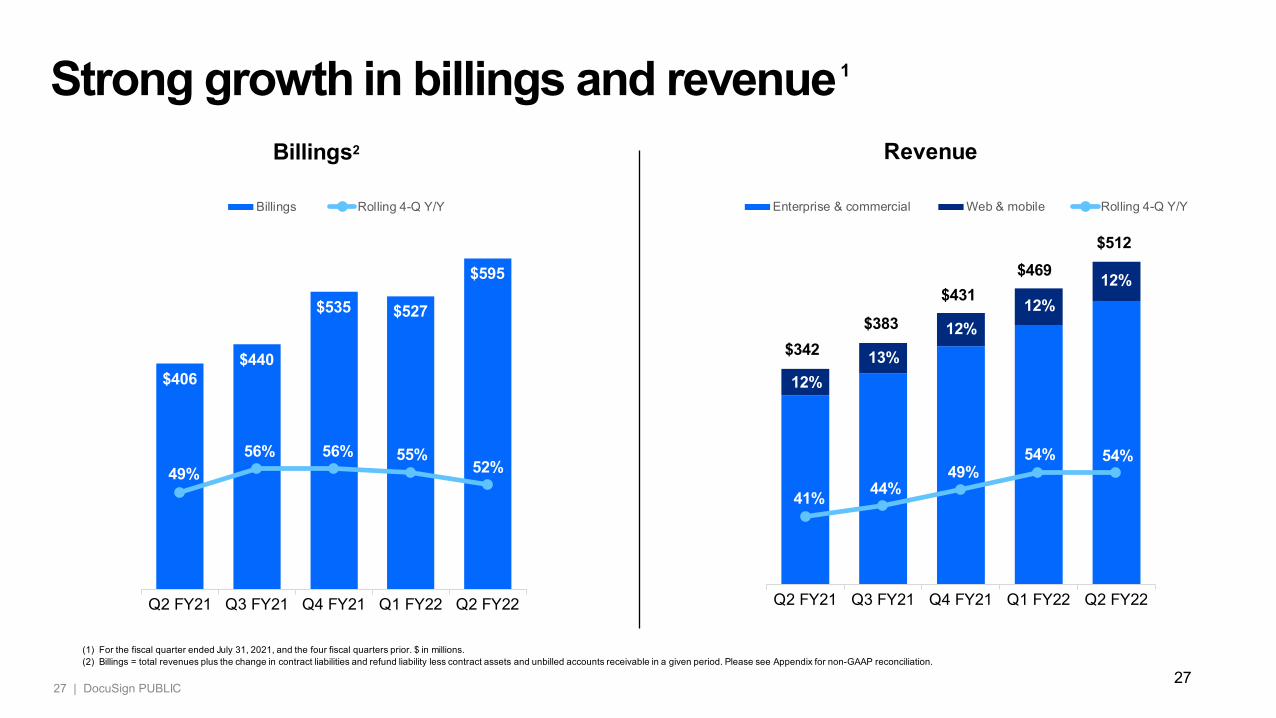
(1) For the fiscal quarter ended July 31, 2021, and the four fiscal quarters prior. $ in millions.(2) Billings = total revenues plus the change in contract liabilities and refund liability less contract assets and unbilled accounts receivable in a given period. Please see Appendix for non-GAAP reconciliation.
$406 $440
$535 $527
$595
49%56% 56% 55%
52%
20%
30%
40%
50%
60%
70%
80%
90%
100%
110%
120%
$0
$50
$100
$150
$200
$250
$300
$350
$400
$450
$500
$550
$600
Q2 FY21 Q3 FY21 Q4 FY21 Q1 FY22 Q2 FY22
Billings Rolling 4-Q Y/Y
Strong growth in billings and revenue1
Billings2 Revenue
41% 44%49%
54% 54%
20%
30%
40%
50%
60%
70%
80%
90%
100%
110%
120%
$0
$50
$100
$150
$200
$250
$300
$350
$400
$450
$500
Q2 FY21 Q3 FY21 Q4 FY21 Q1 FY22 Q2 FY22
Enterprise & commercial Web & mobile Rolling 4-Q Y/Y
12%13%
12%12%
12%
$512$469
$431$383
$342

28 | DocuSign PUBLIC
4K
43K
56K
75K
125K
FY13 FY18 FY19 FY20 FY21
53%CAGR
54K
373K
477K
589K
892K
FY13 FY18 FY19 FY20 FY21
42%CAGR
(1) For the fiscal years ended January 31 and the fiscal quarter ended July 31, 2021.(2) Comprised of customers who were not acquired through our self-service channel.
Q2 FY22
148KTotal Customers
Q2 FY22
1.05MEnterprise & Commercial Customers2
Large and growing customer base1

29 | DocuSign PUBLIC29
FY13 FY14 FY15 FY16 FY17 FY18 FY19 FY20 FY21 Q2 FY22
30
599
714
FY13 FY19 FY20 FY21 Q2 FY22
45%CAGR
Cohort and large customer expansionCohort analysis Customers with >$300K in ACV 2
Net RetentionRate as of July 31, 20211
124%
(1) Compares the ACV for subscription contracts from a set of enterprise and commercial customers at two period end dates. To calculate our dollar-based net retention rate at the end of a base year (e.g., January 31, 2021), we first identify the set of customers that were customers at the end of the prior year (e.g., January 31, 2020) and then divide the ACV attributed to that set of customers at the end of the base year by the ACV attributed to that same set at the end of the prior year. The quotient obtained from this calculation is the dollar-based net retention rate.(2) Average Contract Value.

30 | DocuSign PUBLIC30
Strength in customer demand driving growth at scale
(1) Compares the ACV for subscription contracts from a set of enterprise and commercial customers at two period end dates. To calculate our dollar-based net retention rate at the end of a base year (e.g., January 31, 2021), we first identify the set of customers that were customers at the end of the prior year (e.g., January 31, 2020) and then divide the ACV attributed to that set of customers at the end of the base year by the ACV attributed to that same set at the end of the prior year. The quotient obtained from this calculation is the dollar-based net retention rate.
124% Net Dollar Retention1
113%
117% 117%
119%120%
122%123%
125%124%
110%
115%
120%
125%
Q2 FY20 Q3 FY20 Q4 FY20 Q1 FY21 Q2 FY21 Q3 FY21 Q4 FY21 Q1 FY22 Q2 FY22
31 | DocuSign PUBLIC
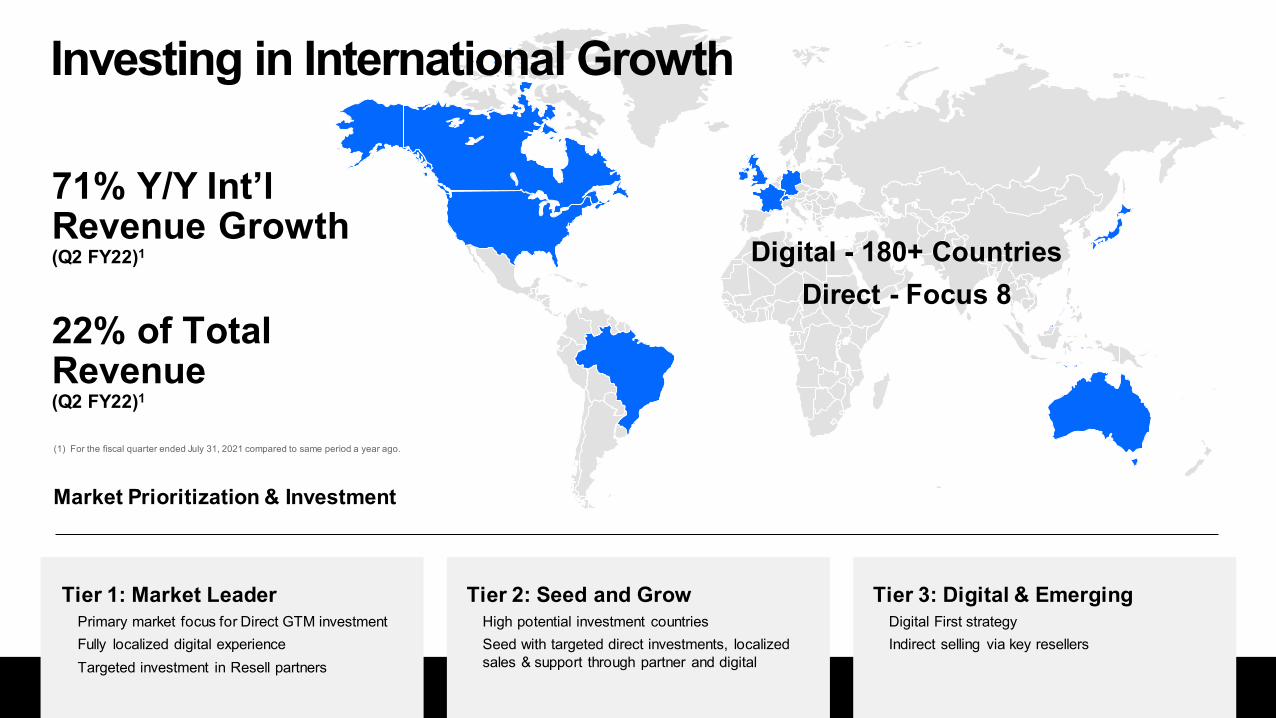
Tier 1: Market LeaderPrimary market focus for Direct GTM investmentFully localized digital experienceTargeted investment in Resell partners
Tier 2: Seed and GrowHigh potential investment countriesSeed with targeted direct investments, localized sales & support through partner and digital
Tier 3: Digital & EmergingDigital First strategyIndirect selling via key resellers
Market Prioritization & Investment
Digital - 180+ CountriesDirect - Focus 8
Investing in International Growth
22% of Total Revenue(Q2 FY22)1
71% Y/Y Int’l Revenue Growth(Q2 FY22)1
(1) For the fiscal quarter ended July 31, 2021 compared to same period a year ago.

32 | DocuSign PUBLIC
79% 79%78%
82%
FY20 FY21 Q2 FY21 Q2 FY22
Achieving increased leverage
Non-GAAP gross margin1
Subscription Gross Margin
(1) For the fiscal years ended January 31, 2020, 2021 and the fiscal quarters ended July 31, 2020, 2021.Margins are as % of revenue.Please see Appendix for GAAP to non-GAAP reconciliation. (2) As of July 31, 2020 and 2021.
84% 84%
83%
85%
FY20 FY21 Q2 FY21 Q2 FY22 Q2 FY21
5,008
Q2 FY22
6,551
Headcount 2
Total Gross Margin

33 | DocuSign PUBLIC33
$352
$477
$639
FY19 FY20 FY21$0
$100
$200
$300
$400
$500
$600
$700
Non-GAAP R&D1
Achieving increased leverage
Non-GAAP G&A1Non-GAAP S&M1
(1) For the fiscal years ended January 31, 2019, 2020, 2021 and the fiscal quarters ended July 31, 2020, 2021. $ in millions. Margins are as % of revenue.Please see Appendix slides for non-GAAP reconciliation.
$154
$206
Q2 FY21 Q2 FY22
50% 49% 44% 45% 40%
$109$139
$198
FY19 FY20 FY21$0
$50
$100
$150
$200
$250
$47
$66
Q2 FY21 Q2 FY22
16% 14% 14% 14% 13%
$82$104
$131
FY19 FY20 FY21$0$20$40$60$80$100$120$140$160$180$200
$32
$46
Q2 FY21 Q2 FY22
12% 11% 9% 9% 9%

34 | DocuSign PUBLIC34
Improving profitability and cash flow
2% 5% 12% 19%
$76$116
$297
FY19 FY20 FY21
$118
$178
Q2 FY21 Q2 FY22
11% 12% 20% 35% 35%
$46 $44
$215
FY19 FY20 FY21$0
$50
$100
$150
$200
$250
$300
$100
$162
Q2 FY21 Q2 FY22
7% 4% 15% 29% 32%
Non-GAAP Operating Income1 Free Cash Flow 2Operating Cash Flow
(1) For the fiscal years ended January 31, 2019, 2020, 2021 and the fiscal quarters ended July 31, 2020, 2021. $ in millions. Margins are as % of revenue.(2) FCF calculated as Operating Cash Flow – CapEx. Please see Appendix for calculation.Please see Appendix slides for non-GAAP reconciliation.
$15$47
$181
FY19 FY20 FY21
$34
$100
Q2 FY21 Q2 FY22
10%

35 | DocuSign PUBLIC
Appendix
36 | DocuSign PUBLIC
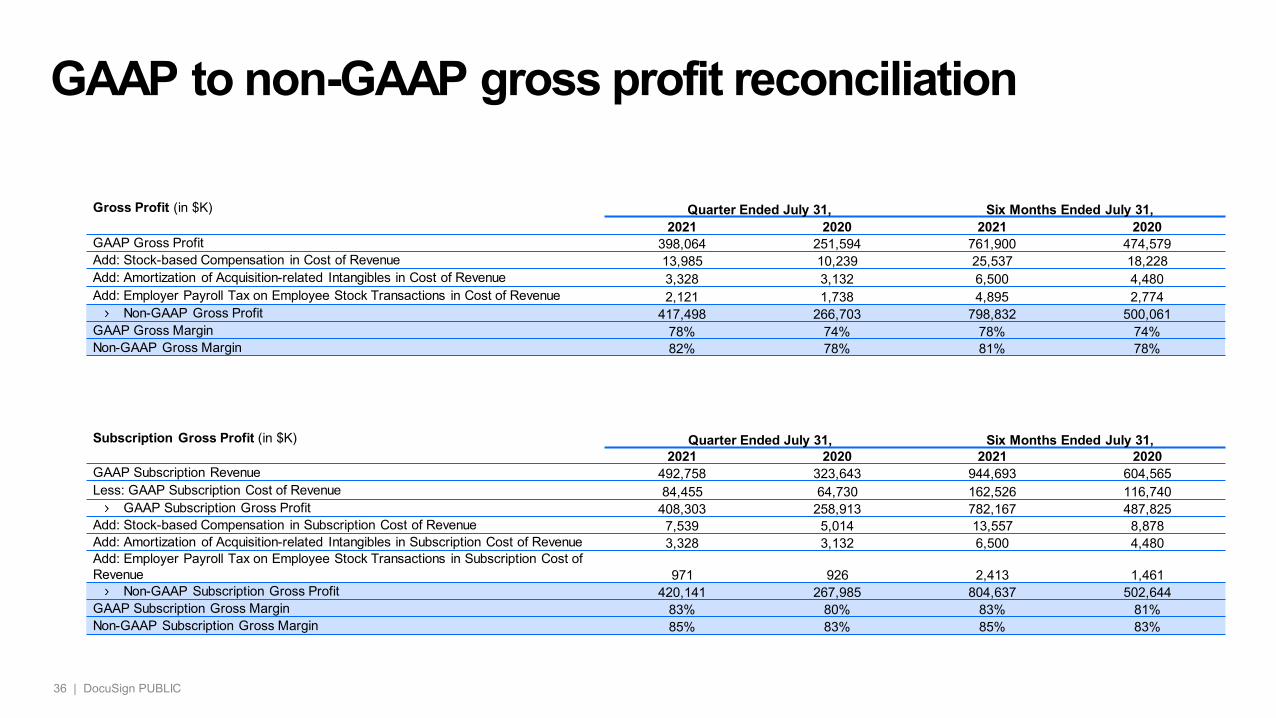
GAAP to non-GAAP gross profit reconciliation
Gross Profit (in $K) Quarter Ended July 31, Six Months Ended July 31,2021 2020 2021 2020
GAAP Gross Profit 398,064 251,594 761,900 474,579Add: Stock-based Compensation in Cost of Revenue 13,985 10,239 25,537 18,228Add: Amortization of Acquisition-related Intangibles in Cost of Revenue 3,328 3,132 6,500 4,480Add: Employer Payroll Tax on Employee Stock Transactions in Cost of Revenue 2,121 1,738 4,895 2,774
Non-GAAP Gross Profit 417,498 266,703 798,832 500,061GAAP Gross Margin 78% 74% 78% 74%Non-GAAP Gross Margin 82% 78% 81% 78%
Subscription Gross Profit (in $K) Quarter Ended July 31, Six Months Ended July 31,2021 2020 2021 2020
GAAP Subscription Revenue 492,758 323,643 944,693 604,565Less: GAAP Subscription Cost of Revenue 84,455 64,730 162,526 116,740
GAAP Subscription Gross Profit 408,303 258,913 782,167 487,825Add: Stock-based Compensation in Subscription Cost of Revenue 7,539 5,014 13,557 8,878Add: Amortization of Acquisition-related Intangibles in Subscription Cost of Revenue 3,328 3,132 6,500 4,480Add: Employer Payroll Tax on Employee Stock Transactions in Subscription Cost of Revenue 971 926 2,413 1,461
Non-GAAP Subscription Gross Profit 420,141 267,985 804,637 502,644GAAP Subscription Gross Margin 83% 80% 83% 81%Non-GAAP Subscription Gross Margin 85% 83% 85% 83%
37 | DocuSign PUBLIC
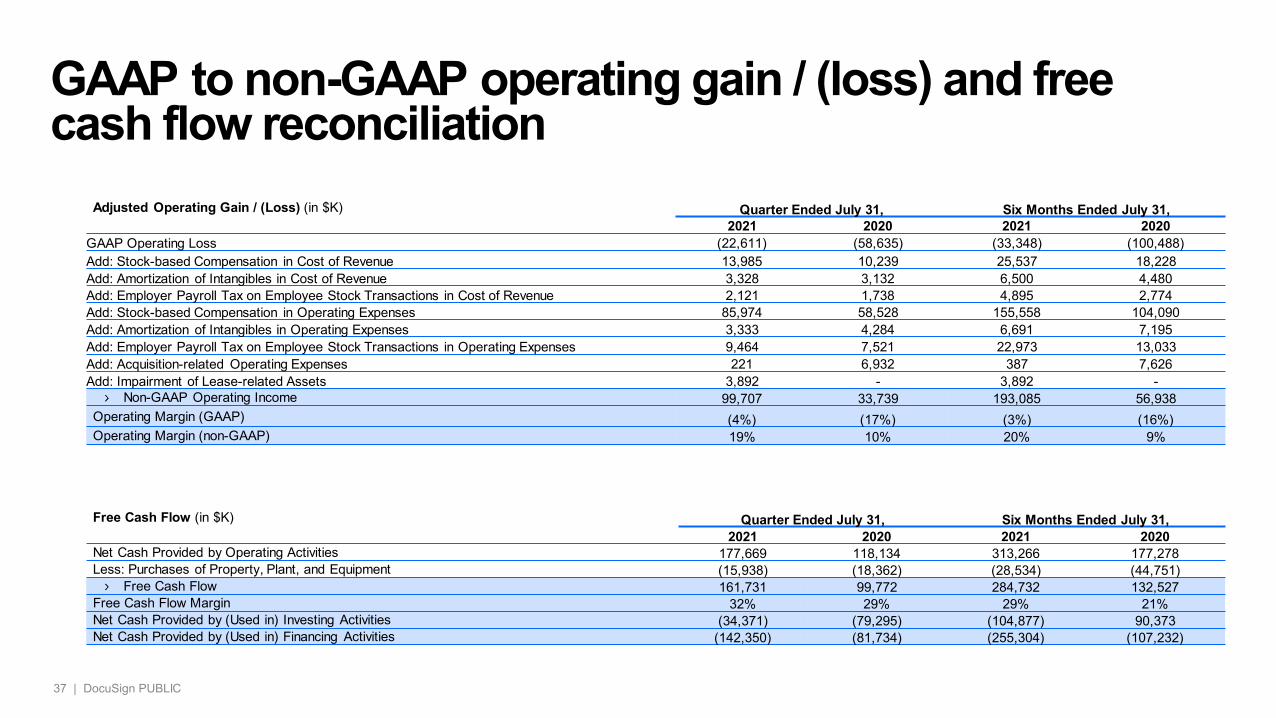
GAAP to non-GAAP operating gain / (loss) and free cash flow reconciliation
Adjusted Operating Gain / (Loss) (in $K) Quarter Ended July 31, Six Months Ended July 31,2021 2020 2021 2020
GAAP Operating Loss (22,611) (58,635) (33,348) (100,488)Add: Stock-based Compensation in Cost of Revenue 13,985 10,239 25,537 18,228 Add: Amortization of Intangibles in Cost of Revenue 3,328 3,132 6,500 4,480 Add: Employer Payroll Tax on Employee Stock Transactions in Cost of Revenue 2,121 1,738 4,895 2,774 Add: Stock-based Compensation in Operating Expenses 85,974 58,528 155,558 104,090 Add: Amortization of Intangibles in Operating Expenses 3,333 4,284 6,691 7,195 Add: Employer Payroll Tax on Employee Stock Transactions in Operating Expenses 9,464 7,521 22,973 13,033 Add: Acquisition-related Operating Expenses 221 6,932 387 7,626 Add: Impairment of Lease-related Assets 3,892 - 3,892 -
Non-GAAP Operating Income 99,707 33,739 193,085 56,938 Operating Margin (GAAP) (4%) (17%) (3%) (16%)Operating Margin (non-GAAP) 19% 10% 20% 9%
Free Cash Flow (in $K) Quarter Ended July 31, Six Months Ended July 31,2021 2020 2021 2020
Net Cash Provided by Operating Activities 177,669 118,134 313,266 177,278Less: Purchases of Property, Plant, and Equipment (15,938) (18,362) (28,534) (44,751)
Free Cash Flow 161,731 99,772 284,732 132,527Free Cash Flow Margin 32% 29% 29% 21%Net Cash Provided by (Used in) Investing Activities (34,371) (79,295) (104,877) 90,373Net Cash Provided by (Used in) Financing Activities (142,350) (81,734) (255,304) (107,232)

38 | DocuSign PUBLIC
GAAP to non-GAAP operating expenses reconciliationSales & Marketing (in $K) Quarter Ended July 31, Six Months Ended July 31,
2021 2020 2021 2020GAAP Sales & Marketing 262,372 194,992 501,491 366,785Less: Stock-based Compensation in Sales & Marketing (46,921) (32,305) (85,057) (56,970)Less: Amortization of Acquisition-related Intangibles in Sales & Marketing (3,333) (4,284) (6,691) (7,195)Less: Acquisition-related Expenses in Sales & Marketing - (186) - (186)Less: Employer Payroll Tax on Employee Stock Transactions in Sales & Marketing (5,706) (3,958) (12,484) (6,867)
Non-GAAP Sales & Marketing 206,412 154,259 397,259 295,567Sales & Marketing as % of Revenue (GAAP) 51% 57% 51% 57%Sales & Marketing as % of Revenue (non-GAAP) 40% 45% 40% 46%
Research & Development (in $K) Quarter Ended July 31, Six Months Ended July 31,2021 2020 2021 2020
GAAP Research & Development 94,651 63,791 180,067 118,025Less: Stock-based Compensation in Research & Development (26,275) (14,781) (46,737) (26,666)Less: Employer Payroll Tax on Employee Stock Transactions in Research & Development (2,752) (2,019) (6,928) (3,565)
Non-GAAP Research & Development 65,624 46,991 126,402 87,794Research & Development as % of Revenue (GAAP) 18% 19% 18% 18%Research & Development as % of Revenue (non-GAAP) 13% 14% 13% 14%
General & Administrative (in $K) Quarter Ended July 31, Six Months Ended July 31,2021 2020 2021 2020
GAAP General & Administrative 63,652 51,446 113,690 90,257Less: Stock-based Compensation in General & Administrative (12,778) (11,442) (23,764) (20,454)Less: Acquisition-related Expenses in General & Administrative (221) (6,746) (387) (7,440)Less: Employer Payroll Tax on Employee Stock Transactions in General & Administrative (1,006) (1,544) (3,561) (2,601)Less: Impairment of Lease-related Assets (3,892) - (3,892) -
Non-GAAP General & Administrative 45,755 31,714 82,086 59,762General & Administrative as % of Revenue (GAAP) 13% 15% 12% 15%General & Administrative as % of Revenue (non-GAAP) 9% 9% 8% 9%

39 | DocuSign PUBLIC
Computation of billings
Computation of Billings (in $K)Quarter Ended July 31, Six Months Ended July 31,
2021 2020 2021 2020Revenue 511,844 342,209 980,923 639,226
Add: Contract Liabilities and Refund Liability, End of Period 939,826 638,790 939,826 638,790Less: Contract Liabilities and Refund Liability, Beginning of Period (857,969) (568,544) (800,940) (522,201)Add: Contract Assets and Unbilled Accounts Receivable, Beginning of Period 19,737 16,390 21,021 15,082Less: Contract Assets and Unbilled Accounts Receivable, End of Period (18,067) (20,395) (18,067) (20,395)Add: Contract Assets and Unbilled Accounts Receivable by Acquisitions - 6,589 - 6,589Less: Contract Liabilities and Refund Liability Contributed by Acquisitions - (9,344) - (9,344)
Billings 595,371 405,695 1,122,763 747,747