Embed Size (px)
Citation preview

AIR WAR COLLEGE
AIR UNIVERSITY
TRANSFORMING THE AIRCRAFT INSPECTION PROCESS
by
Donald A. Van Patten, Lt Col, USAF
A Research Report Submitted to the Faculty
In Partial Fulfillment of the Graduation Requirements
23 February 2007
[Cleared for public release 5/4/2007, AU 07-271]

ii
DISCLAIMER
The views expressed in this academic research paper are those of the author and do not reflect
the official policy or position of the US government or the Department of Defense. In accordance
with Air Force Instruction 51-303, it is not copyrighted, but is the property of the United States
government and is not to be reproduced or published without the permission of the Air War
College Resident Studies Directorate.

iii
Contents
Page
DISCLAIMER .................................................................................................................... ii
ILLUSTRATIONS ............................................................................................................ iv
CHAPTER 1 - INTRODUCTION .......................................................................................1
CHAPTER 2 - IMPETUS FOR CHANGE .........................................................................3
CHAPTER 3 - ANALYSIS CRITERIA AND INSPECTION TYPES ..............................6 The MSG-3 Inspection Construct ..................................................................................9
CHAPTER 4 - ANALYSIS OF THREE OPTIONS .........................................................13 Option 1 - “Stay the Course” .......................................................................................16 Option 2 - “Fully Employ PBD 716 Initiatives...Regionalize Inspections” ................17 Option 3 - “Hybrid Solution” ......................................................................................22 Summary and Implementation Considerations ............................................................27
CHAPTER 5 - CONCLUSION .........................................................................................31
APPENDIX A - F-15 CALCULATIONS .........................................................................33
APPENDIX B - KC-135 CALCULATIONS ....................................................................37
BIBLIOGRAPHY ..............................................................................................................41

iv
Illustrations
Page
Figure 1. Total Air Force Maintenance Man-hours Per Flying Hours, FY91-FY05 ..........4
Figure 2. MSG-1 & MSG-2 Savings ..................................................................................9
Figure 3. Predetermined Levels of System Performance and Degradation ......................10
Figure 4. F-15 Undergoing Phase Inspection ...................................................................14
Figure 5. KC-135R Undergoing Isochronal Inspection ....................................................14
Figure 6. Option 2 Regional Inspection Concept (Combat Air Forces) ...........................17
Figure 7. Option 2 Regional Inspection Concept (Mobility Air Forces) ..........................17
Figure 8. Option 2 Notional Implementation Costs ..........................................................19
Figure 9. Southwest Airlines Boeing 737 .........................................................................22
Figure 10. Summary of Options and Benefits ..................................................................29

1
Chapter 1
Introduction
To everything there is a season, a time for every purpose under heaven;...a time to break down, and a time to build up;...a time to keep, and a time to throw away;...a time to keep silence, and a time to speak;...a time of war, and a time of peace.1
Ecclesiastes 3:1-8
The next five years promise to bring significant changes to the Air Force’s current operating
environment. This change is prompted by several budget initiatives to provide funds for vital
programs that include recapitalizing the growing inventory of aging aircraft. Some of these
initiatives target manpower billets in specific areas across the Active, Reserve, and Guard forces
with a projected goal of reducing full-time equivalent positions by approximately 40,000.2 One
initiative, released as Programmed Budget Decision (PBD) 716 in December 2005, directs the
offsets to be fully executed by the end of FY11 across most Air Force Specialty Codes (AFSCs)
to minimize huge losses in a few areas. Within the past year, the period to complete the offsets
has been accelerated to end of FY09. PBD 716’s impact on aircraft maintenance is to reduce
aircraft inspection manpower by 402 billets--a significant decrease in maintenance capability.3
The Air Force’s plan to reduce the inspection manpower focuses on regionalizing inspection
centers for select aircraft types. Although the depot-level overhaul locations would remain
unchanged, this plan would eliminate the base-level inspection docks by flying the aircraft to
1 Ecclesiastes 3:1-8, The Holy Bible, New King James Version, Thomas Nelson Bibles. 2 Department of Defense, Program Budget Decision (PBD) 720: Air Force Transformation Flight Plan (Washington, DC: Office of the Under Secretary of Defense [Comptroller], 28 December 2005), 11. 3 Department of Defense, Program Budget Decision (PBD) 716: Directed Offsets - Air Force (Washington, DC: Office of the Under Secretary of Defense [Comptroller], 20 December 2005), 9.

2
regional sites for their incremental hourly and periodic maintenance inspections.4
In addition to the manpower reductions, the Air Force has begun efforts to improve aircraft
availability and decrease cost. Faced with decreasing budgets, Air Force leadership established
goals to increase aircraft availability by 20 percent and reduce costs by 10 percent.
5 Known as
the Aircraft Availability Improvement Program (AAIP), all levels of aircraft sustainment have
been directed to develop efficiency initiatives to achieve the PBD goals.6
In order to achieve the projected PBD 716 manpower savings of $23.4 million over the
Future Year Defense Plan (FYDP), there appear to be three viable options. The first option
would be to yield the manpower positions while retaining the phase and isochronal inspection
docks at their current base-level locations.
7
This paper analyzes these three options against the goals to increase aircraft availability by
20 percent while decreasing cost by 10 percent. Additionally, it examines a third impact of these
options on a unit’s ability to control its success or destiny with respect to mission requirements.
As part of the analysis, this study also investigates the theory of reliability-centered maintenance
and analyzes its applicability to the inspection options.
A second option would be to fully comply with the
PBD and regionalize select inspection activities. The last option would be to develop a hybrid
alternative--sending aircraft to the regional facilities for heavy inspections, but performing the
light checks or minor inspections at the base.
4 Aircraft initially proposed by Headquarters USAF/A4MY in Fall 2005 as potential candidates for regionalized inspections were the active duty A-10, F-15, F-16, F-22, B-1, B-52, C-130, and KC-135 fleets. 5 Lt Gen Donald Wetekam, DCS/Installations & Logistics, HQ USAF/A4, and Lt Gen Richard Reynolds, Vice Commander, HQ AFMC to directors of logistics at HQs AMC, AFMC, ACC, and AFSOC, letter, 8 April 2005. This letter directed the 20 percent aircraft availability by FY11. Later, HQ USAF/A4M and HQ AFMC/A4 included the 10 percent cost reduction effort in the August 2006 AAIP. 6 Briefing, Col John Stankowski, Chief, Weapons System Division, HQ USAF/A4MY, subject: eLog21 - AAIP, 1 December 2006, slides 3-25. The AAIP was formed in April 2005 to improve depot overhaul efficiency and parts processes for 20 aircraft fleets. 7 DOD, PBD 716: Directed Offsets - Air Force, 2.
3
Chapter 2
Impetus for Change
The Air Force cannot increase aircraft availability and decrease operating costs without
revamping the current inspection process. The first of several reasons for change is that the
average age of our aircraft today is almost a quarter of a century--23.5 years--and has grown
steadily over the past three decades. Compared to 1967, the entire fleet’s average age was only
8.5 years.8 This equates to a 276 percent increase in fleet age over the 40 year period. Although
the Air Force has started receiving the F-22, the average age of the Air Force’s main fighter fleet
is still over 20 years. This fact is not insignificant. Because the fleet has become geriatric, it is
now susceptible to the normal problems that begin to surface with older airframes. For example,
wiring has become a top driver for the F-15C/D. The insulation on the Kapton wiring used
widely throughout the fighter aircraft has become brittle and cracked, resulting in an increasing
number of electrical shorts and fires. The KC-135 has experienced peeling with its internal fuel
tank coatings, leading to contaminated fuel systems and filters.9
8 Briefing, Lt Gen Steve Wood, Director of Requirements, Headquarters USAF/A8, subject: Blue Horizons, 3 August 2006, slide 22.
These age-related problems will
continue to drive additional aircraft inspections, which in turn will increase the amount of time
the aircraft will not be available for flying.
9 Briefing, Headquarters USAF/A4MY, subject: What are the Effects of Aging?, 2 February 2006, slide 1.

4
Figure 1. Total Air Force Maintenance Man-hours Per Flying Hours, FY91-FY05
The second drive for change is increased downtime for the aircraft fleets due to the
increased inspections and other maintenance-related aging factors. Over the past 15 years, the
amount of aircraft downtime per flying hour has increased and is reflected in the Air Force’s
maintenance man-hour per flying hour (MMH/FH) ratio metric. For the entire Air Force fleet,
this ratio increased 61 percent between FY91 and FY05 (see Figure 1).10
Additionally, the size of Air Force budgets has continued to slow at a disconcerting pace
over the past several years. Based on current projected budget programs, the FY11 budget will
be only 16% larger than the FY06 budget--a significant spending departure compared to the
previous six year period of FY01 to FY06, when the budget grew nearly 44%.
This is significant
because the Air Force retired some of its oldest fleets of F-4 and F-111 aircraft during this same
period without any major impact on the
MMH/FH metric. For the aircraft
maintenance community, this increase in
workload, even with a newer total fleet, is
monumental.
11
A fourth impetus for change is due to the increase in operating costs. Given the volatility of
fuel prices, personnel pay and benefit expenditures, and other operating factors that comprise the
Air Force Total Ownership Costs (AFTOC), this important sustainment factor promises to rise
Due to
decreasing budget dollars, the Air Force will be forced to stretch recapitalization plans for
replacement aircraft and need to retain older aircraft longer than originally planned to provide the
required combat capability.
10 Air Force Portal, Applications: Multi-Echelon Resource and Logistics Information Network (MERLIN), Mission Performance, MMH per FH for total Air Force inventory, FY91-FY05, 18 February 2007. 11 Briefing, Lt Gen Wood, subject: Blue Horizons, slide 23.

5
faster than planned for in the budget requests through FY11.12 The cost to operate an average
aircraft in FY96 was just over $3 million. In FY05, the same cost reached nearly $5.5 million--
an 83 percent increase.13
The last reason for change is the track record of legislative involvement. During the last
four fiscal years (FY03-FY06), Congress prevented the Air Force from retiring aircraft deemed
too costly to operate from the B-52, C-5, C-130E/H, F-117, and KC-135 fleets. As of October
2005, the number of aircraft Congressionally restricted from retirement had grown to a total of
104, creating a burden on critical budget dollars.
This makes the stated AAIP goals even more challenging to achieve.
14
This well intentioned legislation has forced
the Air Force to divert shrinking funds from other vital programs to sustain these geriatric
weapons systems.
12 Department of Defense, Operating and Support Cost-Estimating Guide (Washington, DC: Office of the Secretary of Defense [Cost Analysis Improvement Group (CAIG)], May 1992), 4-1 to 4-8. The CAIG is an OSD body that analyzes merged data from the AFTOC, Reliability and Maintainability Information System (REMIS), Multi-Echelon Resource and Logistics Information Network (MERLIN), and Personnel Data System (PDS) systems. There are seven main CAIG-element categories of cost data contained in the AFTOC: mission personnel pay and allowances, unit-level consumption, intermediate maintenance, depot maintenance, contractor support, sustaining support, and indirect support. 13 Briefing, Lt Gen Wood, subject: Blue Horizons, slide 21. 14 Briefing, Maj Gen Frank Faykes, Deputy Assistant Secretary for Budget (Financial Management and Comptroller), Headquarters SAF/FMB, subject: FY07 USAF Posture & Acquisition Hearing (HAC-D), 8 March 2006, slide 10.
6
Chapter 3
Analysis Criteria and Inspection Types
The types of inspections discussed in this paper are limited to the phase and isochronal
inspections. The phase-type inspection is determined strictly by the number of operating or
flying hours. If an inspection is due at 200 hour intervals, then the aircraft must be inspected at
this point before it can be flown further. Aircraft that begin and end their sorties at the same
location--such as fighter aircraft--normally operate on the hourly phase inspection concept.
Isochronal inspections are based on a specified number of calendar days. Isochronal is a Greek
word that means to occur in regular intervals of time.15
To sufficiently analyze the data, two aircraft will be examined. Due to their significant
numbers and the availability of research data, the phase-interval type F-15C/D fighter aircraft
and the isochronal-interval type KC-135 tanker aircraft were selected for this study.
The isochronal intervals are derived
from an average number of flying hours that would be accumulated in the interval without
degrading safety. The isochronal inspection concept is ideal for aircraft like tankers or airlifters
that may fly multiple sorties away from home station. In conjunction with military
representatives, the original equipment manufacturers (OEMs) determine the inspection type and
intervals during the aircraft’s initial operational test and evaluation stage. These types and
intervals normally serve the aircraft with minimal change up to retirement.
15 Webster’s Third New International Dictionary of the English Language, Unabridged, s.v. “isochronal.”

7
The three proposed options will be evaluated against three criteria--aircraft availability,
maintenance operating costs, and unit control. Because having aircraft available for combat and
training is naturally a vital prerequisite to enable a unit to accomplish its wartime mission, the
Air Force constantly evaluates the aircraft availability of its fleets to identify causes in negative
trends. Aircraft availability measures the ratio of time a unit possessed aircraft is mission
capable (MC) or mission-ready against the total time of possession by all organizations.16
In light of PBD 716’s emphasis on cost reduction, the second criterion analyzes the
maintenance operating costs across the three options. As stated previously, the AFTOC data
base captures the operating expenditures of unit-level consumption, intermediate maintenance,
depot maintenance, contractor support, sustaining support, indirect support, and aircraft
modifications from program element code (PEC) 3400 - Operations and Maintenance (O&M), as
The
formula used to calculate it is: Availability Rate = (MC Hours/Total Possessed Hours) x 100.
An aircraft is considered in possession when it is under its assigned unit’s control. For example,
if the Air Force had a fleet of 100 aircraft and in one day 20 aircraft were not MC and 10 aircraft
were possessed by depot maintenance, the number of aircraft mission-ready or MC for this 24-
hour period would be 70 percent—calculated as (70 MC unit possessed aircraft x 24 hours/100
unit and depot possessed aircraft x 24 hours) x 100. Of course, actual aircraft availability
calculations are much more complex, as aircraft cycle through only a couple of minutes or hours
per day of not-mission-capable status before returning to MC status. As stated previously, the
Air Force is striving to achieve a 20% improvement across all its fleets of aircraft. A major
means to impact availability rates would be to decrease the amount of time an aircraft is not
mission capable and increase the amount of time an aircraft is unit possessed and mission
capable.
16 Air Force Instruction (AFI) 21-101, Aircraft and Equipment Maintenance Management, 29 June 2006, 24-25.

8
well as military and civilian pay from PEC 3500 - Pay and Allowances. The aircraft total
operating cost is the total annual system costs of the two PECs divided by the total aircraft
inventory (TAI).17
The last criterion for judging the effectiveness of the three options is the degree of control a
unit retains over its phase and isochronal inspection program. Unit control has always been a
foundational building block for maintaining a healthy fleet of aircraft. A flying organization
plans and executes its flying hour program with respect to its home station and deployment
requirements, exercise and evaluation cycles, contingency rotations, and other local factors,
including weather. The integral factor to achieving a successful flying hour program is being
able to control the flow and rate at which aircraft are inspected. The inspection process is the
banking mechanism for building a savings account of flying hour capability. It is commonplace
for a unit to surge its inspection program periodically to respond to an externally-driven mission
requirement that necessitates phase or isochronal inspection flexibility in order to accomplish the
mission. The CSAF recognized the importance of conjoined authority and responsibility when
searching for a replacement to the Objective Wing structure that divided maintenance authority
and responsibility between two groups. Under organizational structures where the maintenance
group commander exercises both authority and responsibility for fleet health, aircraft
performance has flourished.
The AFTOC costs most easily influenced at the unit, intermediate (regional),
and depot levels are the maintenance and consumables expenditures. Minimizing these costs
through a reanalysis of the OEM-developed phase and isochronal inspection construct would
directly impact the inspection frequency and workforce size.
18
17 Briefing, Col Steve Schumacher, Chief, Weapons System Division, Headquarters USAF/A4MY, subject: Cost To Sustain & Operate Select Aging Aircraft, 15 November 2005, slide 5.
Separating the phase and isochronal inspection capability from
18 Briefing, Gen John Jumper, Chief of Staff (CSAF), Headquarters USAF, subject: Wing Organization Evolution, 1947-2002, 21 February 2003, slide 37.

9
the direct control of the unit, as called for under PBD 716, partitions the necessary authority and
responsibility to maintain fleet health in high tempo environments, especially combat and
contingency operations. The most recent guidance in AFI 21-101 states that “Aircraft should not
normally deploy with Phase or Isochronal Inspections or engine time changes due immediately
upon AOR [area of responsibility] arrival.”19
The MSG-3 Inspection Construct
A unit’s direct authority over its aircraft inspection
program equates to being able to determine its own destiny or success, especially in combat and
contingency operations. Pulling the phase or isochronal capability away from the unit has the
strong potential to severely limit its flexibility to match flying requirements with fleet health
maintenance.
In the 1960s, an airline industry task force known as the Maintenance Steering Group
(MSG) developed a new inspection program, known as MSG-1 (the first report published by the
MSG), that produced substantial savings
for the Boeing 747 (B747) over the DC-
8.20 Figure 2 reflects the savings of the
MSG approaches over the traditional
approach.21
19 AFI 21-101, Aircraft and Equipment Maintenance Management, 381.
In 1970, the Air Transport
Association (ATA) led the airline industry
20 Dave Nakata, “Why Transition to a MSG-3 Based Maintenance Schedule?,” EmpowerMX White Paper, 6 October 2005, 1, http://www.empowermx.com/whitepapers/MSG3.pdf (accessed 12 December 2006). 21 F. Stanley Nowlan and Howard F. Heap, Reliability-Centered Maintenance (San Jose, CA: Dolby Access Press, 1978), 5-6.
On-condition (cut DC-8 shop maintenance costs 50%)
ScheduledTurbine Engine Overhaul
7 items for DC-10339 items for DC-8Overhaul
66K man-hours for B747
4M man-hours for DC-8
Structural Inspectionsfor 20K Flying Hrs
MSG-1 & MSG-2 Approach
Traditional Approach
Type of Preventive Maintenance
Figure 2. MSG-1 & MSG-2 Savings

10
Figure 3. Predetermined Levels of System Performance and Degradation
in developing a second report (MSG-2).22 This revised program converted MSG-1 into an
inspection logic applicable to other aircraft besides the B747.23 Interestingly, the preponderance
of Air Force aircraft developed during this period utilized the MSG-2 preventive inspection
logic. Although these early MSG preventive inspection processes produced huge savings, they
were bottom-up approaches that focused on the failures of the individual items versus the effect
of failures on the entire system. In addition, these early MSG approaches did not factor in
operating performance data as the aircraft matured nor did they establish intervals for the
preventive tasks.24
To overcome the MSG-1 and MSG-2 shortcomings, the reliability-centered maintenance
(RCM) methodology was developed by United Airlines for the Department of Defense in 1978.
The ATA incorporated this new preventive maintenance program into the revised MSG-3
decision logic published in 1980.
25 The
heart of RCM is the Failure Mode,
Effects, and Criticality Analysis
(FMECA) which targets components
and structures from a top-down systems
approach.26
22 Airline Transport Association (ATA) of America MSG-3, Operator/Manufacturer Scheduled Maintenance Development, Revision 2003.1, 5. The ATA is the principle trade organization of major US airlines, OEMs, and other airline-related businesses.
The effectiveness of RCM
is achieved through an “iterative”
application of the FMECA throughout
23 Dave Nakata, “Why Transition to a MSG-3 Based Maintenance Schedule?,” 1-2. 24 F. Stanley Nowlan and Howard F. Heap, Reliability-Centered Maintenance, vii. 25 ATA of America MSG-3, Operator/Manufacturer Scheduled Maintenance Development, 4. 26 DOD MIL-STD 1629A, Procedures for Performing a Failure Mode, Effects and Criticality Analysis, 24 November 1980, iii.

11
the weapons life cycle.27 Additionally, a predetermined level of system performance and
acceptable degradation are established during the analysis, as shown in Figure 3.28 The
importance of reaccomplishing the FMECA analysis at appropriate intervals cannot be
overstated; the cost efficiencies are realized by analyzing performance data on a recurring or
iterative basis. Although the terms MSG-3 and RCM are often used synonymously, RCM is the
methodology to determine failures and preventive maintenance actions. MSG-3 is the
governmental- and industry-sanctioned application of RCM by way of a strong, integrated
network of Federal Aviation Agency (FAA), airline operators, and Original Equipment
Manufacturer members. The MSG-3 construct allows the operator to adapt and change the
inspection program to its particular operating requirements once reviewed and approved by the
FAA.29 The preference to use the MSG-3 term in this paper is intentional; MSG-3 connotes
responsiveness and receptiveness to change. This is evident in the seven revisions made to
MSG-3 from 1987 to 2005 to improve safety and preventive maintenance activities.30
Unfortunately, when the Secretary of Defense initiated sweeping reforms to the defense
acquisition process in 1994, he also rescinded DOD’s mandate to use RCM as well as the
numerous Military Standards (MIL-STDs) that provided the methodology to accomplish the
analysis. In its place, he mandated the services to rely on industry standards and best practices.
31
27 Ibid.
This action essentially orphaned legacy equipment, whose extended life cycles need the iterative
engineering and operating analysis provided by RCM and the MIL-STDs. This statement is not
28 Briefing, Scott Vandersall, Chief Engineer (C-5), 730th Aircraft Sustainment Group (AFMC), subject: Maintenance Steering Group 3 (MSG-3), 17 January 2006, slide 6. 29 ATA of America MSG-3, Operator/Manufacturer Scheduled Maintenance Development, 12. 30 Ibid., 7-8. 31 Dr Edward Rogers and COL Robert P. Birmingham, USA, “A Ten-Year Review of the Vision for Transforming the Defense Acquisition System,” Defense Acquisition Review Journal, January-April 2004, 38-40, http://www.dau.mil/pubs/arq/2004arq/Rogers.pdf.

12
intended to marginalize efforts by the weapon systems’ engineers to improve the inspection
continuum. However, constrained resources within Air Force Materiel Command (AFMC) have
limited improvements to merely administrative-type changes to the OEM’s initial inspection
framework.32
32 Col Steve Schumacher (Chief, Weapons System Division, Headquarters USAF/A4MY, Pentagon, DC), in discussion with the author, 7 April 2006.
Consequently, the Air Force’s older, legacy aircraft now operate on an infantile
preventive maintenance inspection concept primarily developed by the OEMs without having
had the benefit of an MSG-3 end-to-end reevaluation of previous decades’ systems and structural
performance history.
13
Chapter 4
Analysis of Three Options
“We must fundamentally change the culture of our AF so that all Airmen understand their individual role in improving their daily processes and eliminating things that don’t add value to the mission.” SECAF & CSAF, 7 Nov 05
To provide a meaningful analysis of the three options, it is important to examine these
alternatives against actual aircraft that are potential candidates for the PBD 716 initiatives. The
notional candidate fleets considered for regionalized inspections are the A-10, F-15, F-16, F-22,
B-1, B-52, C-130, and KC-135 aircraft.33
33 Briefing, Col Schumacher, subject: Enterprise View of Aircraft Inspections, slides 36-37.
The analysis will be conducted using one aircraft from
each inspection construct, the F-15C/D for phase inspections and the KC-135 for the isochronal
construct.

14
Figure 4. 33d Fighter Wing F-15 Undergoing Phase Inspection
The F-15 inspection construct combines a series of light and medium hourly post flight
(HPO) inspections and a major periodic
inspection (PE) in a series of 200 flying-hour
intervals. For a complete phase inspection
cycle, the F-15 undergoes five HPOs and one PE
to produce a total of 1,200 flying hours.34 A
complete cycle from the first HPO-1 to the PE
entails 3,500 steps, 584 work cards, and 1,001
man-hours.35 The average time the F-15 fleet was
not mission capable (NMC) or not available for flying due to scheduled maintenance (phase
inspections) per year during FY97 to FY06 was 2,169,296 hours out of 41,281,421 unit
possessed hours, or 5.25 percent.36 This equates to an average NMC time for phase inspections
of 450.1 hours per aircraft per year. Additionally, during the same 10-year period, the
availability rate averaged 67.0 percent and the total operating costs from the AFTOC data base
averaged $3.676 million per aircraft.37
34 The complete cycle for an F-15 phase inspection requires an HPO-1, HPO-2, HPO-1, HPO-2, HPO-1, and PE to produce 1,200 phase hours. The HPO-1 contains 494 steps in 77 separate work cards, totaling 120 man-hours. The HPO-2 includes the HPO-1 inspection items and comprises 673 steps in 114 work cards and nearly 201 man-hours to complete. The PE includes both HPOs, has 705 steps in 125 work cards, and requires 239.4 man-hours to complete.
35 Technical Order (TO) 1F-15A-6WC-5, Workcards: Periodic Inspection, USAF Series F-15A/B/C/D Aircraft, Change 20, 15 August 1999, i to 3-11. 36 Scott Finley, Chief Analyst, Headquarters USAF/A4MY; data retrieved from Air Force Portal, Applications: Reliability and Maintainability Information System (REMIS - USAF), Scheduled Maintenance downtime for F-15 and KC-135 aircraft, FY1997-FY2006, 31 January 2007. 37 Air Force Portal, Applications: Multi-Echelon Resource and Logistics Information Network (MERLIN), Mission Performance, Weapon Systems Availability for KC-135, FY97-FY06, 31 January 2007, and Larry Klapper, Financial Analyst, Air Force Cost Analysis Agency (AFCAA), data retrieved from AFTOC database, CAIG elements for F-15 and KC-135 fleets, 6 February 2007.
15
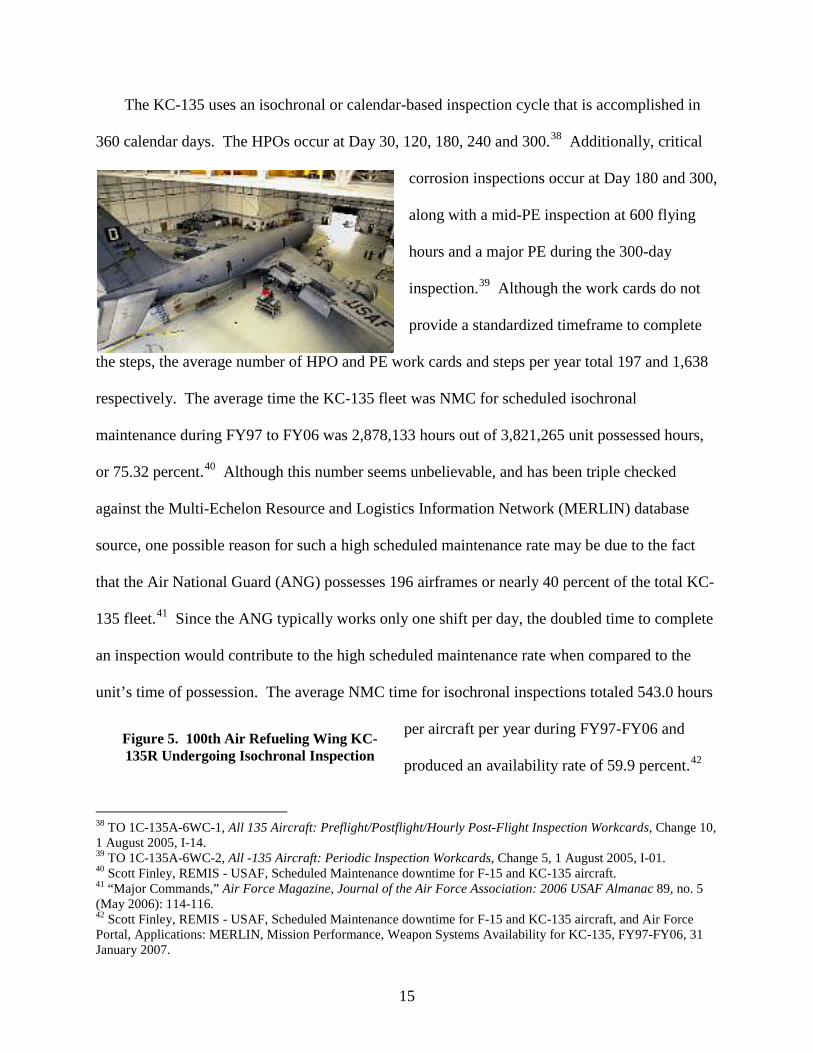
Figure 5. 100th Air Refueling Wing KC-135R Undergoing Isochronal Inspection
The KC-135 uses an isochronal or calendar-based inspection cycle that is accomplished in
360 calendar days. The HPOs occur at Day 30, 120, 180, 240 and 300.38 Additionally, critical
corrosion inspections occur at Day 180 and 300,
along with a mid-PE inspection at 600 flying
hours and a major PE during the 300-day
inspection.39 Although the work cards do not
provide a standardized timeframe to complete
the steps, the average number of HPO and PE work cards and steps per year total 197 and 1,638
respectively. The average time the KC-135 fleet was NMC for scheduled isochronal
maintenance during FY97 to FY06 was 2,878,133 hours out of 3,821,265 unit possessed hours,
or 75.32 percent.40 Although this number seems unbelievable, and has been triple checked
against the Multi-Echelon Resource and Logistics Information Network (MERLIN) database
source, one possible reason for such a high scheduled maintenance rate may be due to the fact
that the Air National Guard (ANG) possesses 196 airframes or nearly 40 percent of the total KC-
135 fleet.41 Since the ANG typically works only one shift per day, the doubled time to complete
an inspection would contribute to the high scheduled maintenance rate when compared to the
unit’s time of possession. The average NMC time for isochronal inspections totaled 543.0 hours
per aircraft per year during FY97-FY06 and
produced an availability rate of 59.9 percent.42
38 TO 1C-135A-6WC-1, All 135 Aircraft: Preflight/Postflight/Hourly Post-Flight Inspection Workcards, Change 10, 1 August 2005, I-14.
39 TO 1C-135A-6WC-2, All -135 Aircraft: Periodic Inspection Workcards, Change 5, 1 August 2005, I-01. 40 Scott Finley, REMIS - USAF, Scheduled Maintenance downtime for F-15 and KC-135 aircraft. 41 “Major Commands,” Air Force Magazine, Journal of the Air Force Association: 2006 USAF Almanac 89, no. 5 (May 2006): 114-116. 42 Scott Finley, REMIS - USAF, Scheduled Maintenance downtime for F-15 and KC-135 aircraft, and Air Force Portal, Applications: MERLIN, Mission Performance, Weapon Systems Availability for KC-135, FY97-FY06, 31 January 2007.

16
Additionally, the total operating costs from the AFTOC database averaged $4.184 million per
aircraft (refer to Appendices for calculations).43
Option 1 - “Stay the Course”
The first option is to continue accomplishing phase and isochronal inspections under the
current organizational construct but with a reduction of 402 personnel, as called for in PBD 716.
However, instead of the aircraft having its inspection performed at a regional facility, this option
calls for completing the inspections at the possessing base. Evenly distributing the 402 manning
losses across the Air Force’s 73 active duty inspection docks in operation after the projected
Base Realignment and Closure-2005 adjustments equates to a loss of 5.5, or 6 whole personnel
per dock. As a result, the average F-15 phase dock would drop from 30 personnel to 24 and the
average KC-135 isochronal dock from 35 to 29. This loss of manpower equates to an annual loss
per inspection dock of 12,096 man-hours (6 personnel x 8 hrs per day x 252 O&M work days per
yr). While it is difficult to measure the exact decrease in aircraft availability that would result
under this option, a loss of 6 inspection personnel per F-15 dock would most likely extend the
inspection of each aircraft by 1.5 days for HPO-1s, 2 days for HPO-2s, and 2.5 days for PEs. In
a one year period, a single F-15 unit with 27 assigned aircraft would fall behind the current
inspection production rate by 66 days, totaling 1,584 hours of aircraft non-availability.44
43 Larry Klapper, AFTOC database, CAIG elements for F-15 and KC-135 fleets, 6 February 2007.
For the
KC-135, the results would be similar. An annual inspection cycle with 35 personnel requires 40
days. Reducing the inspection dock down to 29 personnel would increase the time to complete
the annual cycle to 48 days, causing a 12-aircraft unit to fall 96 days behind per year and lose
44 The extra days were derived from the total time an inspection currently requires--the HPO-1 takes 6 days to complete with 30 technicians working 8 hours for 1,440 total man-hours; the HPO-2, 8 days at 1,920 total man-hours; and the PE, 10 days at 2,400 total man-hours. This was compared to the number of days required with 6 less technicians per inspection.

17
Figure 6. Option 2 Regional Inspection Concept
2,304 hours of aircraft availability. As is evident, this option would negatively impact aircraft
availability due to the unit requiring more days to complete phase or isochronal inspections with
less manpower. Consequently, the increase in aircraft non-availability would drive a
proportional decrease in possible sorties as well.
Operating costs would obviously decrease with this option due to the PBD-driven reduction
in manpower. As the PBD 716 document states, this reduction would provide an annual savings
of $58,209 per person, or $23.4 million for all 402 technicians.45
Unit control for this option, the greatest strength of the current inspection approach, remains
unchanged. Although the unit will experience a lower aircraft availability rate, it will possess its
assigned aircraft the same amount of days as compared to operations before PBD 716.
Therefore, this option is judged as having a positive impact on this criterion.
At the unit level, the loss of 6
technicians would equate to a cost reduction of $349,254, thereby positively impacting the cost
criterion. However, all other costs would remain the same.
Option 2 - “Fully Employ PBD 716 Initiatives...Regionalize Inspections”
Fully implementing PBD 716’s
initiatives, as notionally determined by
the Air Staff, would require units
within eight aircraft types--A-10, F-15,
F-16, F-22, B-1, B-52, C-130, and KC-
135--to accomplish all of their phase or
isochronal inspections at regional
45 DOD, PBD 716: Directed Offsets - Air Force, 2.
Figure 7. Option 2 Regional Inspection Concept

18
inspection facilities while reducing this work force by 402 personnel. The concept calls for 10
regional stateside inspection facilities for the Combat Air Forces and 4 such facilities for the
Mobility Air Forces, as shown in Figures 6 and 7.46
Aircraft availability stands to achieve significant increases under this option. One of the
improvements in this plan is to standardize the work cards that direct the inspection activities.
Currently, almost all aircraft technical order work cards are organized according to the AFSC-
tasked inspection and aircraft zone, but not according to the most efficient flow of the inspection.
This has led owning organizations to develop their own inspection flow sequencing based on
their own requirements and preferences. This lack of standardization across the entire aircraft
fleet causes lost time when inspection personnel are rotated among other bases and must learn
the new unit’s sequencing. Secondly, the locally-developed procedures are not updated
promptly, if at all, to incorporate changes due to systems or structural improvements which
represents lost efficiencies. Transitioning to a few regional inspection facilities affords the
opportunity to conduct an Air Force Smart Operations 21 (AFSO21) study to mitigate these
inefficiencies. AFSO21 is the Air Force’s model to harness industry process efficiencies to
improve operational support and eliminate non-value-added work using efficiency tools such as
Lean, Six-Sigma, and Theory of Constraints.
For overseas-assigned fleets, bases with
similar fleets in the same geographical areas would combine their inspections at a single regional
inspection site.
47
46 Briefing, Col Schumacher, subject: Enterprise View of Aircraft Inspections, slides 36-37.
These improvements would sequence the
inspection activities for maximum efficiency and standardize the inspections across the entire
fleet. Additionally, a robust training program would be developed to ensure maintenance
inspectors fully understood their role in the flow sequencing and the rationale behind it. Early
47 Briefing, Brig Gen S. Gilbert, Director of Air Force Smart Ops, Headquarters USAF/A3-SO, subject: AFSO21: Air Force Smart Ops for the 21st Century, 3 January 2007, slide 5.

19
estimates proposed that each aircraft fleet’s inspection flow time could be reduced by nearly 50
percent by incorporating these efficiencies.48 Such reductions would enable the F-15 fleet to
decrease scheduled maintenance downtime from a 10-year inspection average of 19 days to 12
days per year.49 This could potentially add 7 additional days of availability per aircraft per year
and up to 14 sorties annually. A similar improvement in isochronal inspections with the KC-135
fleet would decrease scheduled inspection downtime from a 10-year average of 23 days to 14
days per year, leading to 9 additional days
of availability and potentially 18 sorties
per year.50
Costs for this option would be similar
to those of the first option--reduced
For contingency operations,
four additional deployable docks, two at
each stateside regional site, would
provide the capability to perform
inspections at deployed sites. Aircraft
availability under this second option
would improve significantly. The
rationale for such a prediction is based on
the process efficiencies of restructuring
the inspection flow for each aircraft.
48 Briefing, Col Schumacher, subject: Enterprise View of Aircraft Inspections, slide 34. 49 Scott Finley, REMIS - USAF, Scheduled Maintenance downtime for F-15 and KC-135 aircraft. The 12 days of scheduled maintenance downtime includes 2 days required to deliver the aircraft to and from the regional site. 50 Ibid. The 14 days of scheduled maintenance downtime includes 2 days required to deliver the aircraft to and from the regional site.
$9.57 $0.26 $1.29 $2.66 $2.66 $2.70 Total
$0.73 $0.13 $0.60 2F-22
$0.43 $0.13 $0.30 1B-1
$0.43 $0.13 $0.30 1B-52
$1.93 $0.13 $1.80 6F-15C/E
$0.43 $0.13 $0.30 1C-5**
$1.33 $0.13 $1.20 4KC-135
$1.33 $0.13 $1.20 4A-10
$1.33 $0.13 $1.20 4C-130
$1.63 $0.13 $1.50 5F-16
TotalFY11FY10FY09FY08FY07SitesAircraft2nd FY = Regionalization/relocate assets per MDS = $0.13M1st FY = AFSO21 training/contractor & reorg per MDS site = $0.30M
COST CALCULATIONS (in $M)
1,555Total
24535/dock x 4 docksC-130 (ISO)
14035/dock x 4 docksKC-135 (ISO)
12030/dock x 4 docksB-1, B-52
1,050(30/dock x 29 docks) + (30/dock x 6 AEF docks)A-10, F-15, F-16, F-22
AfterPost-BRAC/Pre-Regional Personnel: 2,033
INSPECTION PERSONNEL CALCULATIONS
* Based on 50% inspection flow reduction; does not take credit for BRAC4473Total
710C-130
46KC-135
47B-1, B-52
2950A-10, F-15, F-16, F-22
After*BeforeINSPECTION DOCK CALCULATIONS:
AIR STAFF - PBD 716 NOTIONAL IMPLEMENTATION COSTS
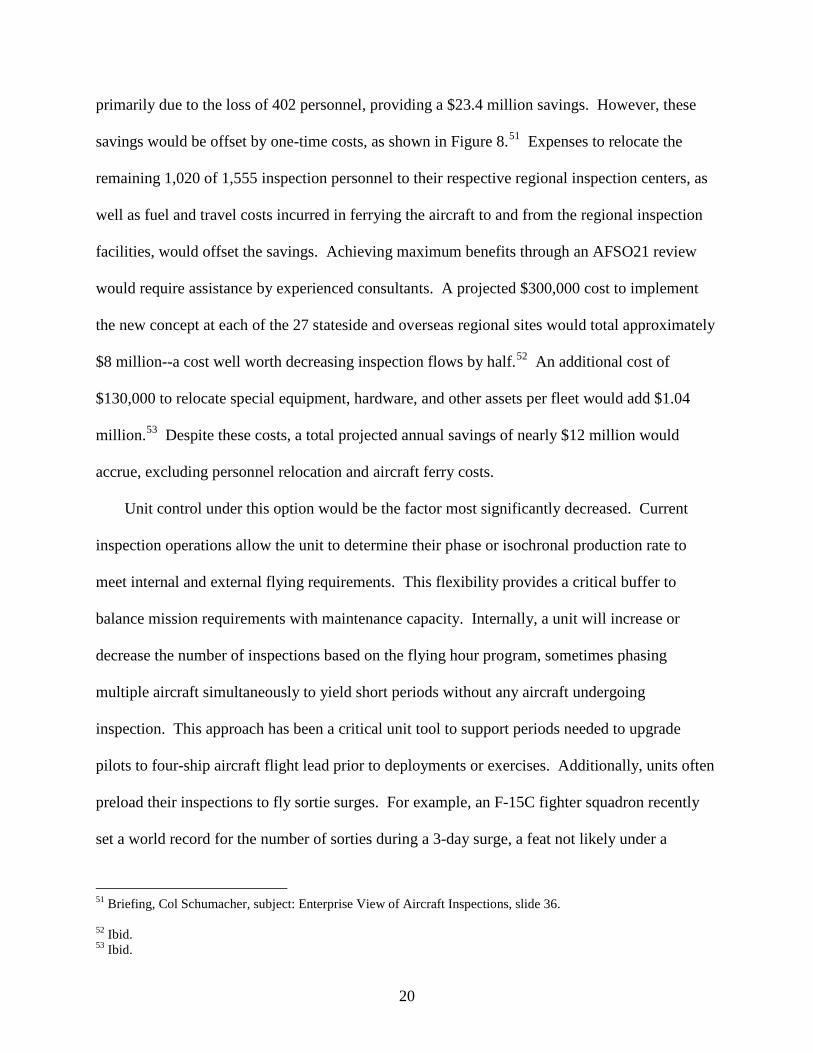
Figure 8. Option 2 Notional Implementation Costs
20
primarily due to the loss of 402 personnel, providing a $23.4 million savings. However, these
savings would be offset by one-time costs, as shown in Figure 8.51 Expenses to relocate the
remaining 1,020 of 1,555 inspection personnel to their respective regional inspection centers, as
well as fuel and travel costs incurred in ferrying the aircraft to and from the regional inspection
facilities, would offset the savings. Achieving maximum benefits through an AFSO21 review
would require assistance by experienced consultants. A projected $300,000 cost to implement
the new concept at each of the 27 stateside and overseas regional sites would total approximately
$8 million--a cost well worth decreasing inspection flows by half.52 An additional cost of
$130,000 to relocate special equipment, hardware, and other assets per fleet would add $1.04
million.53
Unit control under this option would be the factor most significantly decreased. Current
inspection operations allow the unit to determine their phase or isochronal production rate to
meet internal and external flying requirements. This flexibility provides a critical buffer to
balance mission requirements with maintenance capacity. Internally, a unit will increase or
decrease the number of inspections based on the flying hour program, sometimes phasing
multiple aircraft simultaneously to yield short periods without any aircraft undergoing
inspection. This approach has been a critical unit tool to support periods needed to upgrade
pilots to four-ship aircraft flight lead prior to deployments or exercises. Additionally, units often
preload their inspections to fly sortie surges. For example, an F-15C fighter squadron recently
set a world record for the number of sorties during a 3-day surge, a feat not likely under a
Despite these costs, a total projected annual savings of nearly $12 million would
accrue, excluding personnel relocation and aircraft ferry costs.
51 Briefing, Col Schumacher, subject: Enterprise View of Aircraft Inspections, slide 36. 52 Ibid. 53 Ibid.

21
regional inspection concept.54
Weather would also potentially impact the flow of aircraft inspections through a regional
facility. Flying units normally attempt to maximize aircraft availability during the good months
of summer flying--counterproductive to establishing a smooth fleet flow and maximizing
capacity under the regional inspection dock concept. Consequently, during months of poor
flying weather, the regional facilities would not have enough capacity to inspect the required
number of aircraft. The regional inspection construct would require a highly responsive
scheduling function in order to provide the same degree of flexibility. Finally, with inspection
docks located miles away rather than just off the flight line, opportunities to cannibalize critical
parts to generate sorties would be lost.
In addition, external real-world mission requirements, such as
short-notice contingency operations and deployments, would also be difficult to execute without
being able to change inspection priorities or production rates. Prior to an air expeditionary force
(AEF) rotation overseas, fighter units will typically increase or even surge their inspection
production rate to amass enough inspections hours so that the unit doesn’t need to accomplish
any inspections immediately upon arriving in theater. This surge enables the unit to have
sufficient spare aircraft available with adequate remaining inspection hours.
This option would improve the flow days through an efficiency study, standardized
inspection technical orders, efficiently sequenced actions, and a highly skilled and trained work
force. These positives would be offset by the other factors that would restrict flexibility at the
unit level. The unit’s ability to prepare for AEF commitments, sortie surges, and weather-driven
issues, as well as respond to no-notice contingency operations, periods of low aircraft
54 Author’s personal experience while assigned as the squadron maintenance officer, 60th Fighter Squadron (FS), 33rd Fighter Wing (ACC), Eglin AFB, FL. The 60 FS made Air Force history in 2000 by flying 130 sorties in a single day and 362 over 3 days; eclipsing the world record by 18 sorties for 1-day and 37 sorties for 3-day flying windows.

22
Figure 9. Southwest Airlines B737
availability, time compliance technical orders (TCTO), other preventive maintenance, and pilot-
training requirements would be more limited and only serve to defeat mission accomplishment.
In a perfect world, this alternative would be an optimal solution; however, equipment, weather,
and human requirements demand more flexibility not inherent in this option.
Option 3 - “Hybrid Solution”
Whereas the first and second options are merely administrative changes--improvements
within an existing construct--the third option changes the model by employing RCM and MSG-3
concepts to their maximum extent. First, the entire inspection continuum requires a top-to-
bottom reevaluation using the analysis developed under MSG-3. Drawing on the operational
systems performance data already being collected, engineers could reevaluate the FMECA for
each type of aircraft and realign the inspections into intervals based on the new failure
projections, establishing preventive tasks as required based on the analysis. The MSG-3
construct facilitates shifting the most time-consuming, major structural inspections to the heavy
PE inspections later in the phase or isochronal cycle, which allows the light-to-medium HPO
inspections to concentrate on systems reliability.55
By employing MSG-3 on their Boeing
737 (B737) fleet of 447 aircraft, Southwest
These minor inspections can be packaged
into 6-hour segments and completed during non-flying periods of the day or week at the
aircraft’s assigned base. Therefore, aircraft would only need to be flown to the regional
inspection facility for PEs requiring more rigorous repairs or refurbishment not possible at the
home station.
55 Briefing, Scott Vandersall, subject: MSG-3, slide 4.

23
Airlines has been able to sustain over 3,050 flights daily with 435 of their aircraft. This equates
to 97.3 percent of their fleet dedicated to the daily flying schedule. Southwest Airlines
accomplishes all of their light and medium inspections overnight at airports and their heavy
inspections at one of three regional locations. Using the MSG-3 model, Southwest Airlines
anticipates each B737’s 30-year lifespan will only require 82 days of downtime for scheduled
inspections, resulting in a 99.97 percent aircraft availability rate throughout the aircraft’s
lifespan.56
Analyzing this hybrid option against the aircraft availability criterion would produce the
greatest benefits by far. While no US military examples of a total conversion to an MSG-3
approach exist, the AFMC has begun an MSG-3 conversion study for the C-5 fleet. The
realignment of newly developed inspection tasks lengthened the 105-day, 420-day, and 840-day
isochronal inspections to 120, 480, and 1460 days, respectively.
Annually, this downtime averages 2.73 days, or 0.7 percent, per aircraft.
57 The net effect is to increase
C-5 fleet aircraft availability by five aircraft per year, a 4.5 percent increase in aircraft
availability.58
Applying the MSG-3 construct to the F-15 inspection continuum would allow the
preponderance of structural inspections to be accomplished during PE checks. Consequently,
HPOs could be limited to systems inspections and packaged into smaller segments that could be
accomplished across several days during non flying periods. For example, currently an F-15
averages 450 hours per year undergoing scheduled phase inspections.
59
56 Gregg Brown (Manager, Regulatory Compliance, Southwest Airlines), in discussion with the author, 23 February 2006.
The complete F-15
phase cycle takes approximately five years to complete, averaging 94 days of scheduled
57 Briefing, Scott Vandersall, subject: MSG-3, slide 12. 58 Ibid., slide 57. 59 Scott Finley, REMIS - USAF, Scheduled Maintenance downtime for F-15 and KC-135 aircraft.

24
downtime per aircraft during that period. Because PEs require 10 days out of this entire cycle,
the ability to be able to accomplish all HPOs on the ramp would add 84 days of aircraft
availability over 5 years, or nearly 17 days per year for each F-15. The total extra days of
availability across the fleet of 482 aircraft would be the equivalent of gaining 17 additional F-15s
per year and equates to a 4.6 percent increase in aircraft availability.60 For FY06, the availability
rate of 68.7 would have increased to 73.3 percent, surpassing the Air Force goal of 68.5
percent.61
The KC-135 fleet would likewise benefit from an MSG-3 analysis and inspection approach.
Over a 10-year period, each KC-135 was unavailable for an average of 23 days a year due to
scheduled isochronal inspections.
While it is unrealistic to assume that the aircraft would remain mission capable during
the HPOs, estimating a 25 percent non-mission capable time during the inspections would still
yield an additional 17 aircraft per year and a 3.5 percent increase in availability.
62 The KC-135 is required to complete an entire isochronal
cycle of six inspections within 12 months.63
60 Additional F-15s per year calculated by multiplying fleet of 482 by 17 extra days and dividing by 365 days per year to yield 22.
Assuming that five of the six light and medium
HPOs consume 13 days and the sixth heavy PE accounts for 10 days, the MSG-3 reevaluation
would repackage inspection tasks into 6-hour segments. This would allow the light and medium
HPOs to be conducted at the base, while the heavy PEs would occur at a regional inspection
facility. Consequently, each KC-135 could be available 13 additional days per year, increasing
the fleet availability rate by 3.5 percent. The total extra days of availability across the fleet of
530 aircraft would be the equivalent of gaining nearly 19 additional KC-135s per year, equating
to an increase in availability from 61.4 to 64.9 percent for FY06, surpassing the Air Force goal of
61 Air Force Portal, Applications: MERLIN, Mission Performance, Weapon Systems Availability for F-15A-D, FY97-FY06, 29 January 2007, and MERLIN, Readiness Review, 12 December 06, slide 3 (both accessed 29 January 2007). 62 Scott Finley, REMIS - USAF, Scheduled Maintenance downtime for F-15 and KC-135 aircraft. 63 TO 1C-135A-6WC-1, All 135 Aircraft: Preflight/Postflight/Hourly Post-Flight Inspection Workcards, I-14.

25
61.4 percent.64
Of course, this hybrid option is not without significant costs. Conducting the MSG-3
analysis requires a substantial investment in time, resources, and personnel. However, one
aviation maintenance expert predicts “conversion to a MSG-3 based maintenance schedule will
provide significant and tangible returns...[with] as much as a 30% reduction in scheduled
maintenance costs.”
Assuming a similar 25 percent non-mission capability during the minor
inspections would still yield 14 additional aircraft and a 2.9 percent availability rate increase.
65 For the C-5 fleet, the AFMC has invested approximately $7 million to
date to standardize historical performance data and conduct a complete FMECA evaluation of all
the aircraft’s systems.66 This effort began in 2002 with a staff that included engineers, analysts,
systems technicians, maintenance overhaul representatives, OEM representatives, flight crews,
and quality assurance personnel.67 Their strategic intent was to reduce costs and increase aircraft
availability by increasing inspection intervals without compromising safety.68 These goals have
yielded a cost avoidance of 32 percent for the C-5As and 5 percent for the C-5B fleet through the
interval changes.69 Although the finalized cost data has not been fully tabulated, the cost
avoidances are in the multi-million dollar range due to the inspection interval changes.70
Applying a similar percentage based on the C-5’s financial gains against the two test case
aircraft would most likely yield similar investment costs and cost avoidances due to the MSG-3
efforts. If a modest 10 percent cost avoidance factor were applied to the F-15 unit-level
consumable costs, the annual savings could amount to $9.46 million per year (10 percent of the
64 Air Force Portal, Applications: MERLIN, Mission Performance, Weapon Systems Availability for KC-135, FY1997-FY2006, 29 January 2007 and MERLIN, Readiness Review, 12 December 06, slide 3 (both accessed 29 January 2007). 65 Dave Nakata, “Why Transition to a MSG-3 Based Maintenance Schedule?,” 3. 66 Scott Vandersall, in discussion with the author, 22 February 2006. 67 Briefing, Scott Vandersall, subject: MSG-3, slide 21. 68 Ibid., slide 22. 69 Ibid., slide 57. 70 Ibid.
26
average costs during FY97-FY06).71
If the same modest 10 percent cost avoidance factor were applied to the KC-135 unit-level
consumable costs, the annual savings could reach $8.28 million (10 percent of the average costs
during FY97-FY06).
However, an estimated cost to conduct the MSG-3 study
for the F-15 fleet could total as much as $10 million. Amortizing the $10 million cost of the
MSG-3 study across the entire fleet of 482 aircraft would amount to a one-time investment of
$20,750 per aircraft. The net savings across the FYDP of five years would include the $10
million MSG-3 study cost and the $47.3 million cost avoidance in unit-level consumables,
yielding a net FYDP savings of $37.3 million.
72
Moreover, this hybrid option would accrue the $23.4 million savings projected from the
reduction of 402 personnel due to the PBD 716 manpower cuts. However, rather than moving all
remaining 1,555 inspection personnel to regional facilities, only a percentage would be required
at the central inspection sites, due to the MSG-3’s lengthened intervals for heavy inspections.
Therefore, a greater percentage of inspection personnel could remain within their unit to assist
with the on-site light and medium inspections. Furthermore, the inspection personnel would be
assigned to the sortie generating squadron so that they could form the inspection cadre to
accomplish the light and medium checks, train other flight line personnel in these duties, and
contribute to sortie generation activities during slack inspection periods. Due to the realignment
of inspection tasks and lengthened intervals, fewer numbers of aircraft would flow through the
As with the F-15, accounting for the $10 million investment to conduct
the MSG-3 study across the fleet of 530 KC-135s would produce a cost per aircraft of $18,870.
The net savings across the FYDP would include the $10 million MSG-3 study cost and the $41.4
million cost avoidance in unit-level consumables, yielding a net FYDP savings of $31.4 million.
71 Larry Klapper, AFTOC database, CAIG elements for F-15 and KC-135 fleets, 6 February 2007. 72 Ibid.

27
regional inspection facilities. Assuming that the heavy PE inspections would account for one-
sixth of all current base-level inspections, as is the case with both the F-15 and KC-135, then just
one-sixth of unit inspection personnel would need to be assigned to the regional facility. Even if
20 percent of the 1,555 inspection personnel were required to perform the heavy PEs, only 311
personnel would need to be relocated to the regional sites--a substantial cost savings compared to
Option 2’s requirement to move all 1,555.
Finally, unlike under Options 1 and 2, the hybrid alternative maximizes unit control of
assigned aircraft. This option enables the unit to conduct its light and medium inspections at the
base using the MSG-3 approach. Being able to break inspections into small, 6-hour blocks
enables a unit to more readily control the inspection flow to better meet unforecasted
requirements, taskings, and AEF deployment demands. Furthermore, the unit still retains the
inspection personnel who can deploy with them to the AEF location to ensure that inspections
are accomplished during the deployment. These benefits are simply not available under the
regionalized concept of Option 2.
Summary and Implementation Considerations
This chapter has examined three options for allowing the Air Force to perform phase and
isochronal inspections with 402 fewer personnel. Option 1 retains the current inspection concept
of performing the inspections at the base but with 402 fewer personnel. Unfortunately, with less
manpower to complete inspection tasks under the current construct, inspection time would
increase, causing aircraft availability to decrease. Option 2 sends all aircraft to a regional
inspection facility. As compared to Option 1, this option would improve aircraft availability but
would require implementation expenditures and significantly degrade a unit’s flexibility to
accomplish mission requirements and thereby control the health of its fleet.

28
Option 3 provides a hybrid solution that significantly improves both aircraft availability and
unit control. This option requires approximately $10 million per aircraft fleet, or $80 million
across the Air Force’s eight aircraft types, to conduct the failure analysis and to determine the
inspection task packaging for the MSG-3 approach. The initial investment is minimal when
compared to the gains. When analyzed against the F-15 and KC-135 fleets, the MSG-3 approach
offers the equivalent of gaining 31 additional aircraft per year from both fleets. This option
packages the minor inspections into 6-hour segments that can be accomplished overnight or
between sorties by personnel assigned to the sortie generating unit who can continue the
inspection rhythm at home station or deployed to a combat environment. Consequently, the unit
to which the aircraft are assigned retains both responsibility and authority for the health of their
fleet. Pride of ownership, as General Wilbur Creech demonstrated with the dedicated crew chief
program during his tenure as commander of Tactical Air Command, is not inconsequential for
maintaining and improving aircraft readiness levels. Additionally, Option 3’s plan to fly the
aircraft to a regional inspection facility for the heavy, structure-focused inspections leverages the
regional experience and industrial-type test and repair equipment not found at the base level.
Most importantly, by fully supporting the “most significant Army restructuring in the last 50
years,” Option 3 offers significant benefits for joint operations. In keeping with their emphasis
on expeditionary, brigade-sized organizations, the Army is eliminating 36 heavy field artillery
units, 10 air defense units, and 19 armor units to build military police, civil affairs,
psychological, and biological detection units.73
73 Briefing, COL Gene Kamena, Chief, US Army Advisory Group, Air War College/CCU, subject: US Army Service Employment, 21 November 2006, slide 29.
As a result, the Army will fully rely on the Air
Force and the other services to provide their artillery fire support through improved precision
attack munitions. Option 3’s opportunities for increased aircraft availability and unit control

29
Figure 10. Comparison of the Three Inspection Options
establish the foundation for the Air Force to better shoulder this joint fire support responsibility
and increase its relevancy in the joint arena. Even though the savings for Option 2 are greater in
the short term, Option 3 provides hundreds more airframes across the entire fleet every year--a
long term increase in aircraft availability that more than justifies the initial additional investment.
In today’s environment of joint interdependency and constrained aircraft recapitalization, the
low-risk, high-yield dividends demand serious consideration of Option 3. Figure 10 summarizes
the key aircraft availability, cost, and unit control data for the F-15 and KC-135 test cases.
To implement a vigorous MSG-3 reevaluation across the eight or more weapons systems
candidates, several actions need to be taken. At the Air Staff level, policy and sufficient funding
COMPARISON OF THE THREE OPTIONSCOMPARISON OF THE THREE OPTIONSOption 1Option 1
““Stay the CourseStay the Course””F-15 KC-135 F-15 KC-135
Aircraft Aircraft AvailabilityAvailability
(AA)(AA)
Operating Operating CostCost
Unit Unit ControlControl
Decreases 1,177 days*
(Equiv of4 less
F-15s/yr;-0.7%
AA)
Decreases 4,240 days*
(Equiv of12 less
KC-135s/yr;-2.2%
AA)
No Additional Savings Above $23.4M FYDP Manpower Savings
for all Air Force Fleets
Increases 3,374days*
(Equiv of9 more
F-15s/yr;+ 1.9%
AA)
Increases 6,146
days* *(Equiv of17 moreF-15s/yr; + 3.5%
AA)
Increases 5,167
days* *(Equiv of14 more
KC-135s/yr+ 2.9%
AA)
Increases 4,770days*
(Equiv of13 more
KC-135s/yr;+ 2.7%
AA)
Retained inStatus Quo Approach
SignificantlyDecreased in
Regionalization Approach
Retained inMSG-3 Approach
Additional Investment of:Additional Savings of:
$1.93M in FYDP
F-15 KC-135
Option 2Option 2““Regionalize InspectionsRegionalize Inspections””
Option 3Option 3““Hybrid MSGHybrid MSG--3 Solution3 Solution””
$31.4M* * * in FYDP;
$8.28M/FY Thereafter
$37.3M* * * in FYDP;
$9.46M/FY Thereafter
$1.33M in FYDP
* Increases/decreases are calculated across the entire fleet of 482 F-15 and 530 KC-135 aircraft.** Accounts for assumed 25% non-mission capable status during light and medium inspections.
*** FYDP savings deducts the one-time $10M investment for the MSG-3 study; annual savingsthereafter would be based on five-year savings of $47.3M (F-15) and $41.4M (KC-135).

30
must be established for conducting the MSG-3 review and analyses. The process needs to be
formalized, with standardized guidance for mandatory participants (HQ USAF, MAJCOMs,
System Program Offices [SPOs], etc.) regarding responsibilities, timelines, and funding
requirements. A decision and approval process for initiating and conducting subsequent iterative
MSG-3 reevaluations needs to be established. The lead MAJCOMs for the candidate aircraft
need to partner with the SPOs to standardize the inspections flow for the most efficient sequence,
devise user-friendly, industry-standard type work cards to improve technician efficiency, and
fund AFSO21 consultants to outline the most efficient way ahead. Additionally, the commands
must develop acceptable levels of system degradation and formalize them in a revised minimum
essential systems list (MESL) to balance mission requirements against sustainment costs. Along
with these changes, the new inspection process must be gradually phased in; allowing pilot units
to test and refine the new system before employing it across the fleet. Finally, units need to set
up training programs for their inspection personnel and employ AFSO21 consultants to assist in
transitioning to the new MSG-3 inspection construct. These recommendations would create the
type of responsive and predictive inspection environment that would produce improved aircraft
availability and reliability with decreased operating costs.

31
Chapter 5
Conclusion
As the author of the Bible verse in Ecclesiastes observed, there is a time for everything--
including change. The budgetary decreases across the next several FYDPs mandate that the Air
Force reexamine all its current processes. Driven by the manpower cuts dictated in PBD 716 and
720, the time for changing aircraft inspections is now. Increasing aircraft availability while
decreasing operating costs without sacrificing combat capability requires more than mere
administrative changes to the Air Force’s current phase and isochronal inspection processes.
Compelling reasons exist to radically change the current inspection process. The Air
Force’s inventory of aircraft has become more geriatric than ever before, leading to increased
downtime due to inspections and age-related maintenance factors. Consequently, operating costs
for these mature aircraft fleets have soared 83 percent over the last decade.74
74 Briefing, Lt Gen Wood, subject: Blue Horizons, slide 21.
Because of the
projected budget shortfalls, aircraft recapitalization programs will be severely constrained and
take 20 years or longer to fully replace their predecessors. As a result, older aircraft will be
forced to continue in service to cover the combat capability gaps until the replacement aircraft
achieve full strength. Additionally, the cost of replacement weapons systems has become so
great that Congress has enacted legislation to prevent the Air Force from retiring aircraft, forcing

32
older aircraft to be flown and be maintained for longer periods to maximize their return on
investment.
Overlaid on these factors is the fact that the Air Force has been engaged in combat
operations since 1991 and will likely continue to be for the foreseeable future. The combination
of high operations tempo, an aging total fleet, and continual personnel reductions makes it
imperative for the Air Force to apply AFSO21 concepts to the aircraft inspection process. The
threat of terrorism and asymmetric warfare has forced the Air Force to be continually ready to
deploy and fight. The Army’s transformation and increasingly joint nature of military operations
make it imperative for the Air Force to achieve and sustain the highest levels of aircraft
availability possible. With the PBD-driven manpower reductions, the Air Force cannot continue
to carry out the current manpower-intensive inspection requirements and still sustain today’s
levels of combat capability. The MSG-3 approach offers the Air Force an opportunity to fully
exploit AFSO21 efficiencies to produce combat-ready aircraft with increased availability,
reduced cost, and improved unit control through an iterative and responsive inspection construct.
Transforming the aircraft inspection process is one approach to produce the efficiencies required
to better defend the United States and her allies in the global war against terrorism.

33
Appendix A
F-15 Calculations
Averaged data from FY97-FY06 Baseline Data:
Aircraft Unit
Possessed Hrs
TNMCM Hrs
Scheduled Maintenance
Hrs
Annual FH
Utilization Per Aircraft
MMH Per FH
TAI AFTOC
Consumable Costs
F-15A/D 41,281,421.0 6,897,390.7 2,169,296.0 256.5 27.7 482 $945,589,387
- Time to complete F-15 phase inspection: Option 1 - “Stay the Course”
Before PBD 716: 30 inspectors
HPO-1
(30 inspectors) (6 inspection days) (8 hrs) = 1,440 man-hours After PBD 716: 24 inspectors (evenly distributed loss of 6 inspectors per dock) (24 inspectors) (X days) (8 hrs) = 1,440 man-hours X days = _ 1,440 man-hours__ (24 inspectors) (8 hrs)
= 7.5 inspection days
Extra Time to complete HPO-1: (7.5 days - 6 days) = 1.5 days Before PBD 716: 30 inspectors
HPO-2
(30 inspectors) (8 inspection days) (8 hrs) = 1,920 man-hours After PBD 716: 24 inspectors (evenly distributed loss of 6 inspectors per dock) (24 inspectors) (X days) (8 hrs) = 1,920 man-hours X days = _ 1,920 man-hours__ (24 inspectors) (8 hrs)
= 10 inspection days
Extra Time to complete HPO-2: (10 days - 8 days) = 2 days Before PBD 716: 30 inspectors
PE
(30 inspectors) (10 inspection days) (8 hrs) = 2,400 man-hours After PBD 716: 24 inspectors (evenly distributed loss of 6 inspectors per dock)

34
(24 inspectors) (X days) (8 hrs) = 2,400 man-hours X days = _ 2,400 man-hours__ (24 inspectors) (8 hrs)
= 12.5 inspection days
Extra Time to complete PE: (12.5 days - 10 days) = 2.5 days - To calculate the 66 additional days required for a 27 TAI-unit in 1 year: The 10-yr average of flying hrs utilization (FH-UTE) per each F-15 is 256.5 hrs per year: (a complete phase cycle--HPO-1 / HPO 2 / HPO-1 / HPO-2 / HPO-1 / PE--of 1,200 hrs would take 4.7 yrs) X hrs = (256 FH-UTE) (27 TAI) = 6,912 hrs = ___(6,912 hrs) . 200 hrs per phase
= 35 phases per yr (round to 36 for calculation ease)
Assume even distribution of aircraft due phases across the complete cycle in 1 yr: Phase Type: # of Phases: 6 6 6 6 6 6
1 2 1 2 1 PE
HPO-1: 18 phases x 1.5 days behind = 27 HPO-2: 12 phases x 2.0 days behind = 24 PE: 6 phases x 2.5 days behind = Total days behind in 1 yr period: 66 days x 24 hrs = 1,584 hrs
15
Hrs behind per aircraft: (1,584 hrs) (27 TAI)
= 58.6 hrs per aircraft
- Annual impact on entire F-15 fleet (as depicted in Figure 10, Option 1): -- Fleetwide availability decrease = (58.6 hrs/acft) (24 hrs/day)
x 482 aircraft = 1,177 days
-- Equivalent F-15s = ___1,177 days (365.25 days/yr)
= 4 less aircraft per yr
-- Aircraft Availability (AA) = _____MC hrs Total possessed hrs
_____
= [(365.25 days/yr)(24 hrs/day)(482 acft)] - [(58.6 hrs)(482 acft)] (365.25 days/yr)(24 hrs/day)(482 acft)
x 100 =
= (4,225,212 - 28,245.2) 4,225,212
x 100 = 99.3%

35
AA decrease = (100% baseline AA) - (99.3% Option 1 AA) = 0.7%
- Time to complete F-15 phase inspection: Option 2 - “Regionalize”
Flow time reduction of 50%: Pre-PBD 716 average annual flow time per F-15 (FY97-FY06): X days = _2,169,296.0 hrs_ = 450.06 acft hrs/yr (482 TAI)(10 yrs) 24 hrs/day
= 19 days/yr
Post-PBD 716 flow time per F-15: X days = [(19 days/yr) (0.5 reduction)] + 2 days transit = 12 days Post-PBD 716 flow time savings: 19 days - 12 days = 7 days Post-PBD 716 additional sorties: (7 days) (2 sorties/day) = 14 sorties - Annual impact on entire F-15 fleet (as depicted in Figure 10, Option 2): -- Fleetwide availability increase = 7 days x 482 acft = 3,374 acft days -- Equivalent F-15s = ___3,374 days (365.25 days/yr)
= 9 more aircraft per yr
-- Aircraft Availability (AA) = _____MC hrs Total possessed hrs
_____
= (4,225,212) + [(3,374 acft days of AA)(24 hrs/day)] 4,225,212
x 100 =
= (4,225,212 + 80,976) x 100 = 4,306,188 4,225,212 4,225,212
x 100 = 101.9%
AA increase = (101.9% Option 2 AA) - (100% Baseline AA) = +1.9% -- Cost: See Figure 8
- Time to complete F-15 phase inspection: Option 3 - “Hybrid”
Flow time reduction of 50%: Pre-PBD 716 average annual flow time per F-15 (FY97-FY06): X days = _2,169,296.0 hrs_ = 450.06 acft hrs/yr (482 TAI)(10 yrs) 24 hrs/day
= 19 days/yr

36
Post-PBD 716 flow time per F-15: X days = 10 days/PE/acft/ 5 yrs
= 2 days/yr
Post-PBD 716 flow time savings: 19 days - 2 days = 17 days Flow time savings across fleet: 17 days x 482 acft = 8,194 acft days Assume 25% NMC time during overnight HPOs: = (8,194 days) x (0.25 NMC time) = 2,048.5 NMC days = 8,194 days - 2,048.5 days = 6,146 days Post-PBD 716 additional sorties: (17 days) (2 sorties/day) = 34 sorties - Annual impact on entire F-15 fleet (as depicted in Figure 10, Option 3): -- Fleetwide availability increase = (17 days x 482 acft) - 2,048.5 days = 6,146 acft days -- Equivalent F-15s = ___6,146 days (365.25 days/yr)
= 17 more aircraft per yr
-- Aircraft Availability (AA) = _____MC hrs Total possessed hrs
_____
= (4,225,212) + [(6,146 acft days of AA)(24 hrs/day)] 4,225,212
x 100 =
= (4,225,212 + 147,504) x 100 = 4,372,716 4,225,212 4,225,212
x 100 = 103.5%
AA increase = (103.5% Option 3 AA) - (100% Baseline AA) = +3.5% -- Cost Data: Consumable expenditures FY97 - FY06 totaled $945,589,387 = $945,589,387 10 yrs
x 0.10 = $94,558,939 x 0.10 = $9,455,894 = $9.46M

37
Appendix B
KC-135 Calculations
Averaged data from FY97-FY06 Baseline Data:
Aircraft Unit
Possessed Hrs
TNMCM Hrs
Scheduled Maintenance
Hrs
Annual FH
Utilization Per Aircraft
MMH Per FH
TAI AFTOC
Consumable Costs
KC-135 3,821,265.3 6,708,457.3 2,878,132.6 51.7 10.9 530 $82,775,630.77
- Time to complete KC-135 isochronal inspection: Option 1 - “Stay the Course”
One cycle is completed in 360 days 30 HPO
Day Isochronal Event .
120 HPO 180 HPO + Minor Critical Corrosion Inspection (CCI) 240 HPO 300 HPO 360 HPO + PE + 1 of 3 Special Inspections + Major CCI Before PBD 716: 35 inspectors (35 inspectors) (40 inspection days) (8 hrs) = 11,200 man-hours After PBD 716: 29 inspectors (evenly distributed loss of 6 inspectors per dock) (29 inspectors) (X days) (8 hrs) = 11,200 man-hours X days = _ 11,200 man-hours_ (29 inspectors) (8 hrs)
= 48 inspection days
Extra Time to complete 1 cycle: (48 days - 40 days) = 8 days or 192 hrs - To calculate the 96 additional days required for a 12 TAI-unit in 1 year: X = (8 days) (12 TAI) = 96 days or 2,304 hrs

38
- Annual impact on entire KC-135 fleet (as depicted in Figure 10, Option 1): -- Fleetwide availability decrease = (192 hrs/acft) (24 hrs/day)
x 530 aircraft = 4,240 days
-- Equivalent KC-135s = ___4,240 days (365.25 days/yr)
= 12 less aircraft per yr
-- Aircraft Availability (AA) = _____MC hrs Total possessed hrs
_____
= [(365.25 days/yr)(24 hrs/day)(530 acft)] - [(192 hrs)(530 acft)] (365.25 days/yr)(24 hrs/day)(530 acft)
x 100 =
= (4,645,980 - 101,760) 4,645,980
x 100 = 97.8%
AA decrease = (100% baseline AA) - (97.8% Option 1 AA) = 2.2%
- Time to complete KC-135 isochronal inspection: Option 2 - “Regionalize”
Flow time reduction of 50%: Pre-PBD 716 average annual flow time per KC-135 (FY97-FY06): X days = _2,878,132.6 hrs_ = 543.04 acft hrs/yr (530 TAI)(10 yrs) 24 hrs/day
= 23 days/yr
Post-PBD 716 flow time per F-15: X days = [(23 days/yr) (0.5 reduction)] + 2 days transit = 14 days Post-PBD 716 flow time savings: 23 days - 14 days = 9 days Post-PBD 716 additional sorties: (9 days) (2 sorties/day) = 18 sorties - Annual impact on entire KC-135 fleet (as depicted in Figure 10, Option 2): -- Fleetwide availability increase = 9 days x 530 acft = 4,770 acft days -- Equivalent KC-135s = ___4,770 days (365.25 days/yr)
= 13 more aircraft per yr
-- Aircraft Availability (AA) = _____MC hrs Total possessed hrs
_____
= (4,225,212) + [(4,770 acft days of AA)(24 hrs/day)] 4,225,212
x 100 =

39
= (4,225,212 + 114,480) x 100 = 4,339,692 4,225,212 4,225,212
x 100 = 102.7%
AA increase = (102.7% Option 2 AA) - (100% Baseline AA) = +2.7% -- Cost: See Figure 8
- Time to complete KC-135 isochronal inspection: Option 3 - “Hybrid”
Flow time reduction of 50%: Pre-PBD 716 average annual flow time per F-15 (FY97-FY06): X days = _2,878,132.6 hrs_ = 543.04 acft hrs/yr (530 TAI)(10 yrs) 24 hrs/day
= 23 days/yr
Post-PBD 716 flow time per KC-135 for PE: 10 days/yr Post-PBD 716 flow time savings: 23 days - 10 days = 13 days Flow time savings across fleet: 13 days x 530 acft = 6,890 acft days Assume 25% NMC time during overnight HPOs: = (6,890 days) x (0.25 NMC time) = 1,723 NMC days = 6,890 days - 1,723 days = 5,167 days Post-PBD 716 additional sorties: (13 days) (2 sorties/day) = 26 sorties - Annual impact on entire KC-135 fleet (as depicted in Figure 10, Option 3): -- Fleetwide availability increase = (13 days x 530 acft) - 1,723 days = 5,167 acft days -- Equivalent KC-135s = ___5,167 days (365.25 days/yr)
= 14 more aircraft per yr
-- Aircraft Availability (AA) = _____MC hrs Total possessed hrs
_____
= (4,225,212) + [(5,167 acft days of AA)(24 hrs/day)] 4,225,212
x 100 =
= (4,225,212 + 124,008) x 100 = 4,349,220 4,225,212 4,225,212
x 100 = 102.9%

40
AA increase = (102.9% Option 3 AA) - (100% Baseline AA) = +2.9% -- Cost Data: Consumable expenditures FY97 - FY06 totaled $827,756,308 = $827,756,308 10 yrs
x 0.10 = $82,775,631 x 0.10 = $8,277,563 = $8.28M

41
Bibliography
Air Force Instruction (AFI) 21-101. Aircraft and Equipment Maintenance Management, 29 June 2006.
Air Force Portal. Applications: Multi-Echelon Resource and Logistics Information Network (MERLIN), “Mission Performance, MMH per FH for Total Air Force Inventory, FY91-FY05.” https://www.my.af.mil/merlinprod/Menu/index.asp (accessed 18 February 2007).
Air Force Portal. Applications: Multi-Echelon Resource and Logistics Information Network (MERLIN), “Mission Performance, Weapon Systems Availability for F-15A-D, FY97-FY06.” https://www.my.af.mil/merlinprod/Menu/index.asp (accessed 29 January 2007).
Air Force Portal. Applications: Multi-Echelon Resource and Logistics Information Network (MERLIN), “Mission Performance, Weapon Systems Availability for KC-135, FY97-FY06.” https://www.my.af.mil/merlinprod/Menu/index.asp (accessed 29 January 2007).
Air Force Portal. Applications: Multi-Echelon Resource and Logistics Information Network (MERLIN), “Readiness Review, 12 December 06.” https://www.my.af.mil/merlinprod/Menu/index.asp (accessed 29 January 2007).
Airline Transport Association (ATA) of America, MSG-3. Operator/Manufacturer Scheduled Maintenance Development, Revision 2003.1.
Briefing. Headquarters USAF/A4MY. Subject: What are the Effects of Aging?, 2 February 2006.
Department of Defense (DOD) Military Standard (MIL-STD) 1629A. Procedures for Performing a Failure Mode, Effects and Criticality Analysis, 24 November 1980.
Ecclesiastes 3:1-8. The Holy Bible, New King James Version. Thomas Nelson Bibles.
Faykes, Maj Gen Frank, Deputy Assistant Secretary for Budget (Financial Management and Comptroller), Headquarters SAF/FMB. Briefing. Subject: FY07 USAF Posture & Acquisition Hearing (HAC-D), 8 March 2006.
Finley, Scott, Chief Analyst, Headquarters USAF/A4MY. Data retrieved from Air Force Portal, Applications: Reliability and Maintainability Information System (REMIS - USAF), “Scheduled Maintenance downtime for F-15 and KC-135 aircraft, FY1997-FY2006,” 31 January 2007.
Gilbert, Brig Gen S., Director of Air Force Smart Ops, Headquarters USAF/A3-SO. Briefing. Subject: AFSO21: Air Force Smart Ops for the 21st Century, 3 January 2007.

42
Jumper, Gen John, Chief of Staff, Headquarters USAF. Briefing. Subject: Wing Organization Evolution, 1947-2002, 21 February 2003.
Kamena, COL Gene, Chief, US Army Advisory Group, Air War College/CCU. Briefing. Subject: US Army Service Employment, 21 November 2006.
Klapper, Larry, Financial Analyst, Air Force Cost Analysis Agency (AFCAA). Data retrieved from Air Force Total Ownership Costs (AFTOC) database, Cost Analysis Improvement Group (CAIG) elements for F-15 and KC-135 fleets, 6 February 2007.
“Major Commands.” Air Force Magazine 89, no. 5 (May 2006): 114-116.
Nakata, Dave. “Why Transition to a MSG-3 Based Maintenance Schedule?” EmpowerMX White Paper, 6 October 2005. http://www.empowermx.com/whitepapers/MSG3.pdf (accessed 12 December 2006).
Nowlan, F. Stanley, and Howard F. Heap. Reliability-Centered Maintenance. San Jose, CA: Dolby Access Press, 1978.
Rogers, Dr Edward, and COL Robert P. Birmingham, USA. “A Ten-Year Review of the Vision for Transforming the Defense Acquisition System.” Defense Acquisition Review Journal, January-April 2004. http://www.dau.mil/pubs/arq/2004arq/Rogers.pdf (accessed 13 December 2006).
Schumacher, Col Steve, Chief, Weapons System Division, Headquarters USAF/A4MY. Briefing. Subject: Cost To Sustain & Operate Select Aging Aircraft, 15 November 2005.
Stankowski, Col John F., Chief, Weapons System Division, HQ USAF/A4MY. Briefing. Subject: eLog21 - AAIP, 1 December 2006.
Technical Order (TO) 1C-135A-6WC-1. All 135 Aircraft: Preflight/Postflight/Hourly Post-Flight Inspection Workcards, Change 10, 1 August 2005.
Technical Order (TO) 1C-135A-6WC-2. All -135 Aircraft: Periodic Inspection Workcards, Change 5, 1 August 2005.
Technical Order (TO) 1F-15A-6WC-5. Workcards: Periodic Inspection, USAF Series F-15A/B/C/D Aircraft, Change 20, 15 August 1999.
US Department of Defense. Operating and Support Cost-Estimating Guide. Washington, DC: Office of the Secretary of Defense [Cost Analysis Improvement Group (CAIG)], May 1992.
US Department of Defense. Program Budget Decision (PBD) 716: Directed Offsets - Air Force. Washington, DC: Office of the Under Secretary of Defense [Comptroller], 20 December 2005.
US Department of Defense. Program Budget Decision (PBD) 720: Air Force Transformation Flight Plan. Washington, DC: Office of the Under Secretary of Defense [Comptroller], 28 December 2005.
43
Vandersall, Scott, Chief Engineer (C-5), 730th Aircraft Sustainment Group (AFMC). Briefing. Subject: Maintenance Steering Group 3 (MSG-3), 17 January 2006.
Webster’s Third New International Dictionary of the English Language, Unabridged. Springfield, MA: Merriam-Webster, Inc., 1971.
Wetekam, Lt Gen Donald, DCS/Installations & Logistics, HQ USAF/A4, and Lt Gen Richard Reynolds, Vice Commander, HQ AFMC. To Directors of Logistics at HQs AMC, AFMC, ACC, and AFSOC. Letter, 8 April 2005.
Wood, Lt Gen Steve, Director of Requirements, Headquarters USAF/A8. Briefing. Subject: Blue Horizons, 3 August 2006.


![pBd ljsf; ;xhstf{ - CTEVTctevt.org.np/files/curriculum/short term/Enterprise... · 3 kl/kkll//kl/ro rrooro of] "pBd ljsf; ;xhstfpBd ljsf; ;xhstf{{{{" laifosf] kf7\oqmd pBd ljsf;sf]](https://img.pdfslide.us/doc/110x75/5f021c667e708231d4029ff4/pbd-ljsf-xhstf-termenterprise-3-klkkllklro-rrooro-of-pbd-ljsf.jpg)