Embed Size (px)
Citation preview
Transforming Software Delivery: An IBM Rational Case StudyStephanie Trunzo Krista Meyer
2
Transforming Software Delivery: An IBM Rational Case Study
Contents
Preface 3
I. We Needed To Change 4
The challenges – Rational’s, the industry’s, and our customers’ 4
Our approach 5
What is Measured Improvement? 5
1. Improve team collaboration 6
2. Embrace agile practices 6
3. Gain development intelligence 7
II. Lessons Learned 13
Start with Measured Improvement (MI) assessment and objective definition 13
Complete a portfolio analysis to determine where changes are of value 14
Work with an end-goal in mind 15
Refine organizing principals 15
Manage the culture change intentionally and persistently 16
Manage expectations and scope 16
Build a parallel walk process for all changes 17
III. Our Measurable Results 18
To Table of Contents
3
Transforming Software Delivery: An IBM Rational Case Study
PrefaceThe IBM Rational® software development organization consists of more than 2000 analysts, architects, project managers, developers, and quality professionals distributed over 15 locations on six continents. Our mission is to ensure the success of our customers through the development of a robust portfolio of software and systems delivery products. We create and maintain 57 product families that span distributed, System z®, and Power® operating environments.
For both years 2009 and 2010, IBM was the onlyvendor ranked “Strong Positive” by Gartner in its biannual ALM MarketScope report. Earning this distinction hasn’t always been easy. In fact, in January 2007, the Rational development organization was forced to undertake a journey of self-reflection and improvement, an odyssey that resulted in a fundamental transformation of our teams and development processes over a two-year period. This is the story of that journey.
To Table of Contents
4
Transforming Software Delivery: An IBM Rational Case Study
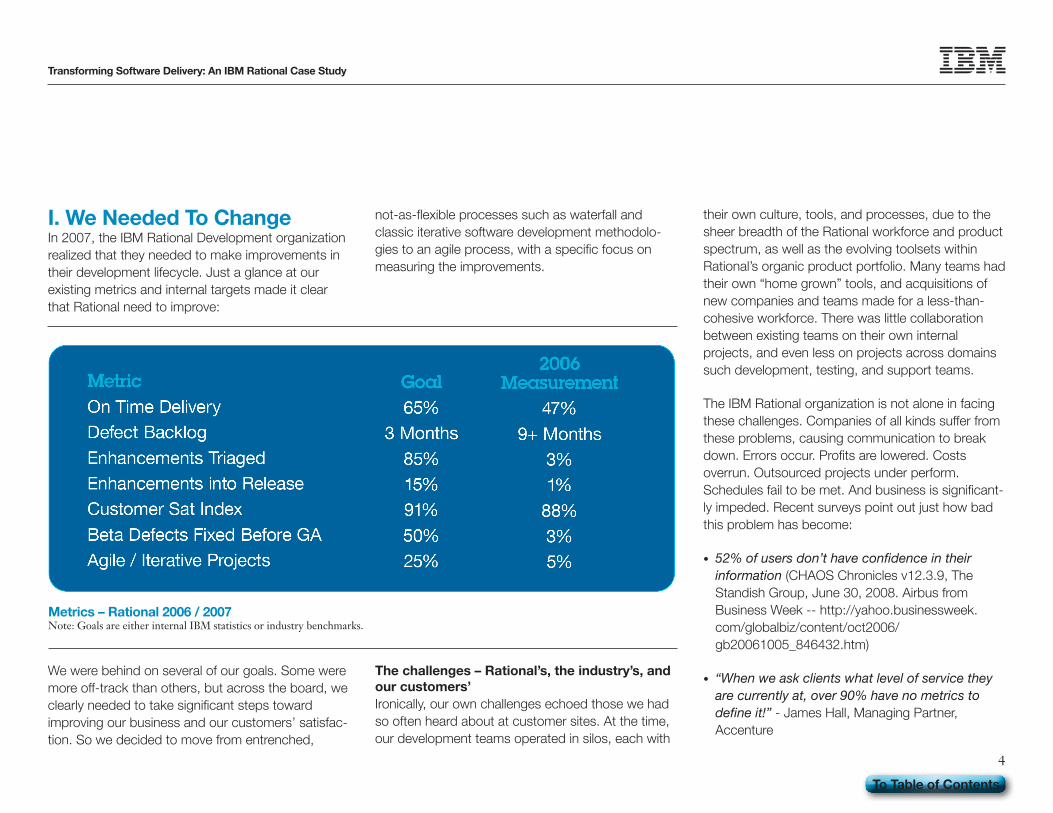
I. We Needed To Change In 2007, the IBM Rational Development organization realized that they needed to make improvements in their development lifecycle. Just a glance at our existing metrics and internal targets made it clear that Rational need to improve:
not-as-flexible processes such as waterfall and classic iterative software development methodolo-gies to an agile process, with a specific focus on measuring the improvements.
We were behind on several of our goals. Some were more off-track than others, but across the board, we clearly needed to take significant steps toward improving our business and our customers’ satisfac-tion. So we decided to move from entrenched,
The challenges – Rational’s, the industry’s, and our customers’Ironically, our own challenges echoed those we had so often heard about at customer sites. At the time, our development teams operated in silos, each with
their own culture, tools, and processes, due to the sheer breadth of the Rational workforce and product spectrum, as well as the evolving toolsets within Rational’s organic product portfolio. Many teams had their own “home grown” tools, and acquisitions of new companies and teams made for a less-than-cohesive workforce. There was little collaboration between existing teams on their own internal projects, and even less on projects across domains such development, testing, and support teams.
The IBM Rational organization is not alone in facing these challenges. Companies of all kinds suffer from these problems, causing communication to break down. Errors occur. Profits are lowered. Costs overrun. Outsourced projects under perform. Schedules fail to be met. And business is significant-ly impeded. Recent surveys point out just how bad this problem has become:
• 52% of users don’t have confidence in their information (CHAOS Chronicles v12.3.9, The Standish Group, June 30, 2008. Airbus from Business Week -- http://yahoo.businessweek.com/globalbiz/content/oct2006/gb20061005_846432.htm)
• “When we ask clients what level of service they are currently at, over 90% have no metrics to define it!” - James Hall, Managing Partner, Accenture
Metrics – Rational 2006 / 2007Note: Goals are either internal IBM statistics or industry benchmarks.
To Table of Contents
5
Transforming Software Delivery: An IBM Rational Case Study
• “90% of employees are looking to make improve-ments through increased metrics, but almost all of them lack clear metrics and become confused, frustrated and emotionally disengaged.” - Towers Perrin Study 2008
Our approachGiven these challenges, we approached the transfor-mation from two coordinated fronts: agility and measurement.
The first focus was to drive a comprehensive analysis and shift in the development process to what Rational calls “agility@scale.” It’s an approach to scaling agile practices to larger, more distributed development teams in order to improve software development efficiency, lower development costs, and, ultimately, improve customer satisfaction.
The second focus was to determine our business goals and very intentionally measure improvement toward those goals. Not only did we need to drive our organization toward a more agile approach, we had to measure the effectiveness of the effort. We needed to get to a higher level of development intelligence, driving top-down views of overall project health across the portfolio based on bottom-up, on-demand data.
To support our measured improvement objectives, we embarked upon a project called the Executive Dashboard, built on Rational Insight. This project encompassed both the technical aspect of develop-
ing the dashboard as well as the cultural changes that necessarily accompany any adoption of mea-surement in the work environment.
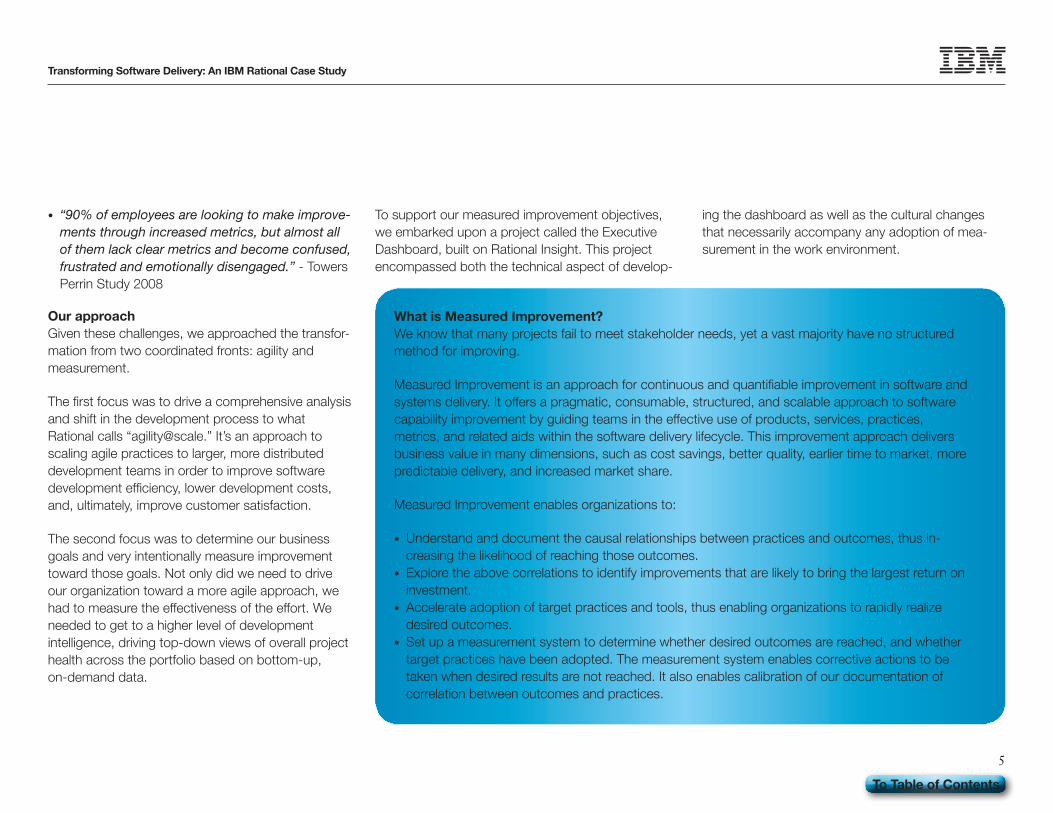
What is Measured Improvement?We know that many projects fail to meet stakeholder needs, yet a vast majority have no structured method for improving.
Measured Improvement is an approach for continuous and quantifiable improvement in software and systems delivery. It offers a pragmatic, consumable, structured, and scalable approach to software capability improvement by guiding teams in the effective use of products, services, practices, metrics, and related aids within the software delivery lifecycle. This improvement approach delivers business value in many dimensions, such as cost savings, better quality, earlier time to market, more predictable delivery, and increased market share.
Measured Improvement enables organizations to:
• Understand and document the causal relationships between practices and outcomes, thus in-creasing the likelihood of reaching those outcomes.
• Explore the above correlations to identify improvements that are likely to bring the largest return on investment.
• Accelerate adoption of target practices and tools, thus enabling organizations to rapidly realize desired outcomes.
• Set up a measurement system to determine whether desired outcomes are reached, and whether target practices have been adopted. The measurement system enables corrective actions to be taken when desired results are not reached. It also enables calibration of our documentation of correlation between outcomes and practices.
To Table of Contents
6
Transforming Software Delivery: An IBM Rational Case Study
The IBM Rational team embarked on its Measured Improvement initiative by identifying business goals and setting priorities using our own software portfolio. At first glance, we already had an overwhelming mass of data; however, we needed to step back from the data and assess our business objectives as a way to define the proper measurements. What should be tracked and why? What did we need to improve? We started with a few key business objectives:
• Increase revenue• Improve profit margin• Increase market share
These led to four tentative operational objectives (we would revise them later) to support the above:
• Improving productivity / reduce cost• Improving quality (business alignment,
consumability, as well as code quality)• Improve predictability• Operate transparently across multiple software
development disciplines
Taking these operational objectives into consideration, we agreed on three major areas for improvement where we could 1) measure results and 2) assess the impact of those results against the defined objectives.
These were:
– Improve team collaboration – Embrace agile practices – Gain development intelligence
1. Improve team collaborationBringing together dispersed global teams working on any software delivery project is always a significant challenge. It all boils down to collaboration. This transformation wasn’t going to happen if we main-tained our distant silos and poor communication habits. We already had tools to bring large teams together, whether that meant team members sharing our immediate office space, or sitting on the other side of the globe. With Rational Requirements Composer, Rational Team Concert, and Rational Quality Manager – our turnkey collaborative lifecycle management solution -- we aligned our business, development, and test teams to form a truly collab-orative lifecycle management environment.
RSS feeds from Rational Requirements Composer, Rational Team Concert™, and Rational Quality Manager informed individual users, teams and teams of teams of project changes as they happened, allowing a constant and consistent method for working toward end goals. This helped to drive better collaboration across domains while assisting the internal adoption of Rational Requirements Composer, Rational Team Concert, and Rational
Quality Manager. Our own solutions were used to enable streamlined access to assets, notifications, reporting and tracking.
We focused on scenario development, and cross-functional teams to provide more holistic views of our efforts. This made transformation more continuous, made it clear what was important to us, increased awareness, and helped us improve best practices. Collaborative lifecycle management stakeholders, product managers, developers, and testers were all able to work as an integrated team while enhancing the transformation to agile.
2. Embrace agile practicesAs we examined the challenges of transforming from a waterfall methodology to an agile development methodology, we realized that agility@scale was not something we would accomplish overnight.
Realistically speaking, we knew that not all of our teams needed to move to an agile approach. Water-fall, iterative, and agile development techniques all have different driving engines at their core. With 60+ products in the IBM Rational portfolio and with the many projects associated with them currently using a variety of development methodologies, the first task was to identify which projects needed to become agile through specific analysis of the portfolio. Several projects and teams were doing quite well using water-fall and iterative development methodologies, based on the needs of their project.
To Table of Contents
7
Transforming Software Delivery: An IBM Rational Case Study
For the projects we determined would move toward agile transformation, we identified three major areas of focus:
• Collaboration -- One of our major goals, and a key benefit of agile methods
• Automation -- A major tenet of the Rational proposi-tion to the world, we needed to embrace this ourselves.
• Reporting -- The essential, objective capability if we were to measure success.
3. Gain development intelligence“Development intelligence” is what you gain by taking reporting to the next level. After we shifted the portfolio to the development model that best fit methodology, we were ready for this step. We knew we had many different kinds of projects, and they needed to be measured differently. There are different criteria used to measure success in waterfall, iterative and agile development methods. For example, where waterfall looks at functional, build, and integration verification testing, agile teams do iterations, retro-spectives, defect burndown charts, and look at velocity. Although the projects had different measures for success, we needed to be able to normalize them to assess our portfolio of projects.
The first step in that process was to revise our original set of business and operational objectives we needed to measure. From the original key business objec-tives, we created four new supporting operational objectives:
• Business Health – focuses on financial, sales, and enablement measurements
• Perceived Quality – provides scores highlighting the customer view
• Development Health – includes software develop-ment project metrics
• Development Quality – scores indicating code and product quality
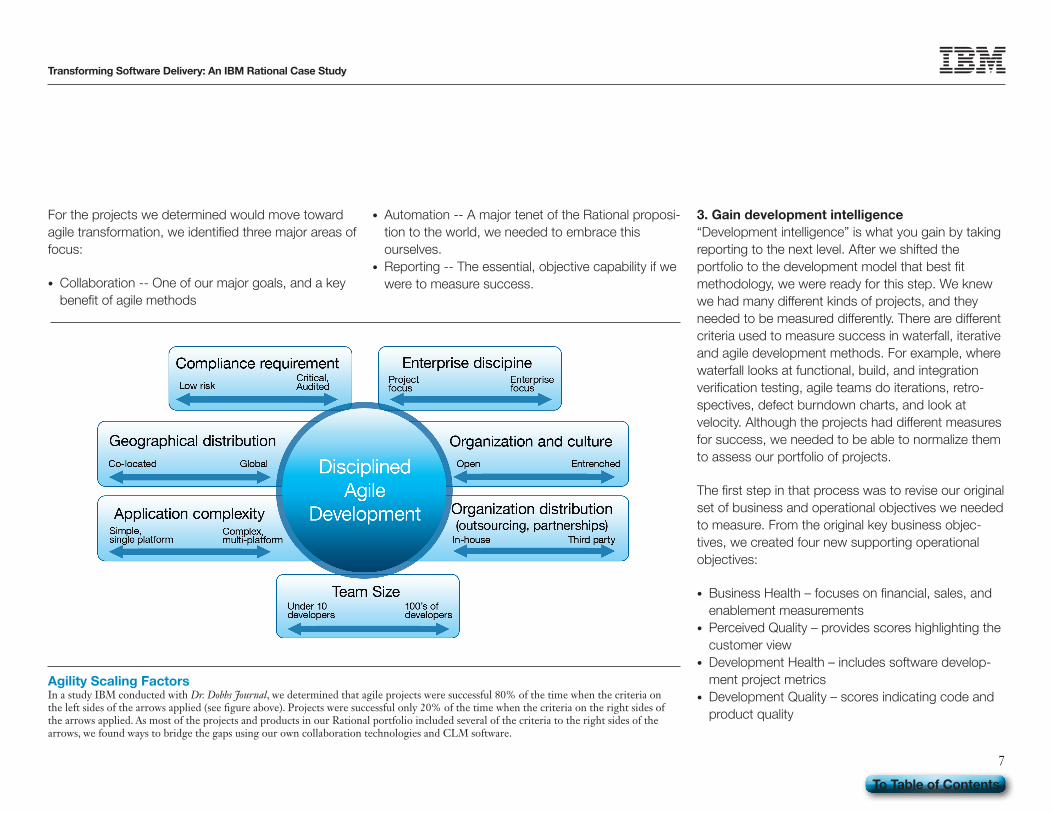
Agility Scaling FactorsIn a study IBM conducted with Dr. Dobbs Journal, we determined that agile projects were successful 80% of the time when the criteria on the left sides of the arrows applied (see figure above). Projects were successful only 20% of the time when the criteria on the right sides of the arrows applied. As most of the projects and products in our Rational portfolio included several of the criteria to the right sides of the arrows, we found ways to bridge the gaps using our own collaboration technologies and CLM software.
To Table of Contents
8
Transforming Software Delivery: An IBM Rational Case Study
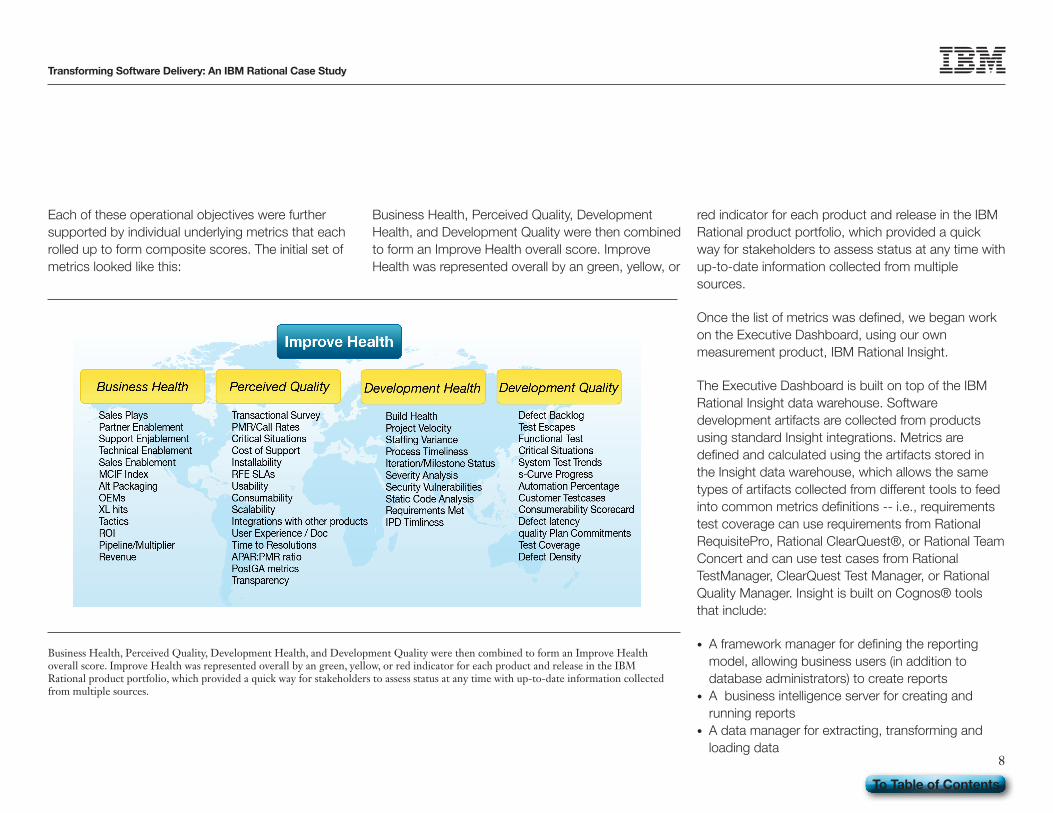
Each of these operational objectives were further supported by individual underlying metrics that each rolled up to form composite scores. The initial set of metrics looked like this:
Business Health, Perceived Quality, Development Health, and Development Quality were then combined to form an Improve Health overall score. Improve Health was represented overall by an green, yellow, or
red indicator for each product and release in the IBM Rational product portfolio, which provided a quick way for stakeholders to assess status at any time with up-to-date information collected from multiple sources.
Once the list of metrics was defined, we began work on the Executive Dashboard, using our own measurement product, IBM Rational Insight.
The Executive Dashboard is built on top of the IBM Rational Insight data warehouse. Software development artifacts are collected from products using standard Insight integrations. Metrics are defined and calculated using the artifacts stored in the Insight data warehouse, which allows the same types of artifacts collected from different tools to feed into common metrics definitions -- i.e., requirements test coverage can use requirements from Rational RequisitePro, Rational ClearQuest®, or Rational Team Concert and can use test cases from Rational TestManager, ClearQuest Test Manager, or Rational Quality Manager. Insight is built on Cognos® tools that include:
• A framework manager for defining the reporting model, allowing business users (in addition to database administrators) to create reports
• A business intelligence server for creating and running reports
• A data manager for extracting, transforming and loading data
Business Health, Perceived Quality, Development Health, and Development Quality were then combined to form an Improve Health overall score. Improve Health was represented overall by an green, yellow, or red indicator for each product and release in the IBM Rational product portfolio, which provided a quick way for stakeholders to assess status at any time with up-to-date information collected from multiple sources.
To Table of Contents
9
Transforming Software Delivery: An IBM Rational Case Study
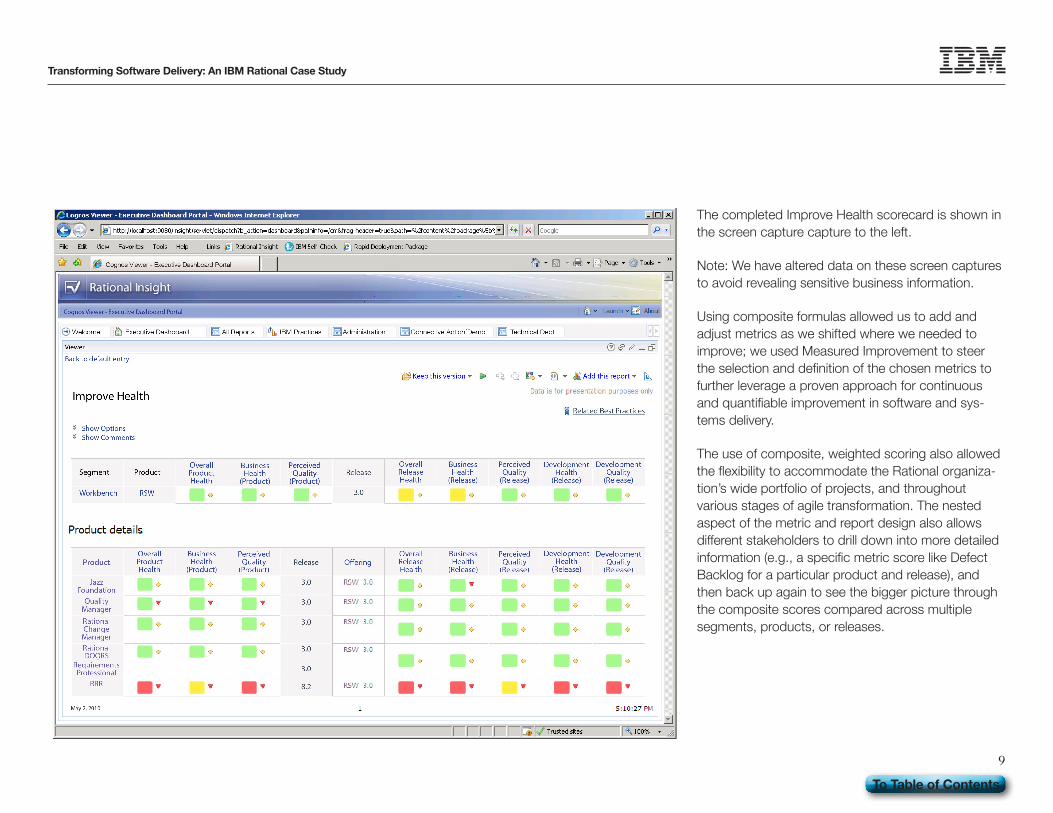
The completed Improve Health scorecard is shown in the screen capture capture to the left.
Note: We have altered data on these screen captures to avoid revealing sensitive business information.
Using composite formulas allowed us to add and adjust metrics as we shifted where we needed to improve; we used Measured Improvement to steer the selection and definition of the chosen metrics to further leverage a proven approach for continuous and quantifiable improvement in software and sys-tems delivery.
The use of composite, weighted scoring also allowed the flexibility to accommodate the Rational organiza-tion’s wide portfolio of projects, and throughout various stages of agile transformation. The nested aspect of the metric and report design also allows different stakeholders to drill down into more detailed information (e.g., a specific metric score like Defect Backlog for a particular product and release), and then back up again to see the bigger picture through the composite scores compared across multiple segments, products, or releases.
To Table of Contents
10
Transforming Software Delivery: An IBM Rational Case Study
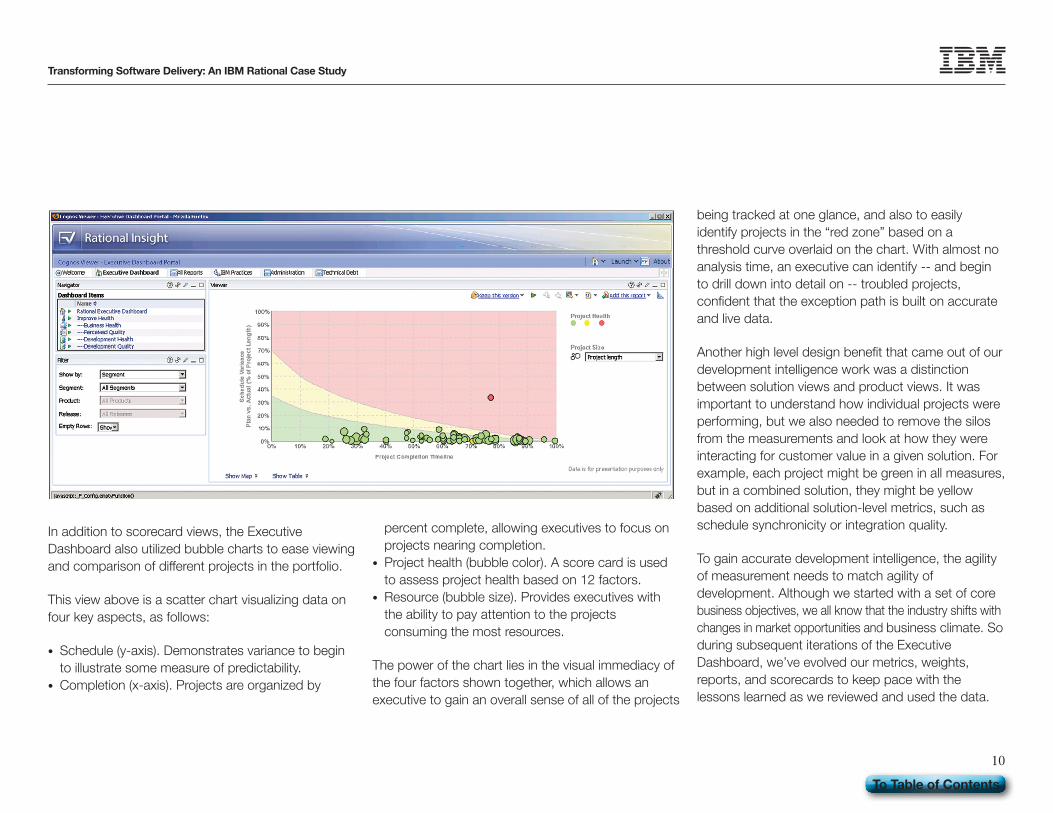
In addition to scorecard views, the Executive Dashboard also utilized bubble charts to ease viewing and comparison of different projects in the portfolio.
This view above is a scatter chart visualizing data on four key aspects, as follows:
• Schedule (y-axis). Demonstrates variance to begin to illustrate some measure of predictability.
• Completion (x-axis). Projects are organized by
percent complete, allowing executives to focus on projects nearing completion.
• Project health (bubble color). A score card is used to assess project health based on 12 factors.
• Resource (bubble size). Provides executives with the ability to pay attention to the projects consuming the most resources.
The power of the chart lies in the visual immediacy of the four factors shown together, which allows an executive to gain an overall sense of all of the projects
being tracked at one glance, and also to easily identify projects in the “red zone” based on a threshold curve overlaid on the chart. With almost no analysis time, an executive can identify -- and begin to drill down into detail on -- troubled projects, confident that the exception path is built on accurate and live data.
Another high level design benefit that came out of our development intelligence work was a distinction between solution views and product views. It was important to understand how individual projects were performing, but we also needed to remove the silos from the measurements and look at how they were interacting for customer value in a given solution. For example, each project might be green in all measures, but in a combined solution, they might be yellow based on additional solution-level metrics, such as schedule synchronicity or integration quality.
To gain accurate development intelligence, the agility of measurement needs to match agility of development. Although we started with a set of core business objectives, we all know that the industry shifts with changes in market opportunities and business climate. So during subsequent iterations of the Executive Dashboard, we’ve evolved our metrics, weights, reports, and scorecards to keep pace with the lessons learned as we reviewed and used the data.
To Table of Contents
Transforming Software Delivery: An IBM Rational Case Study
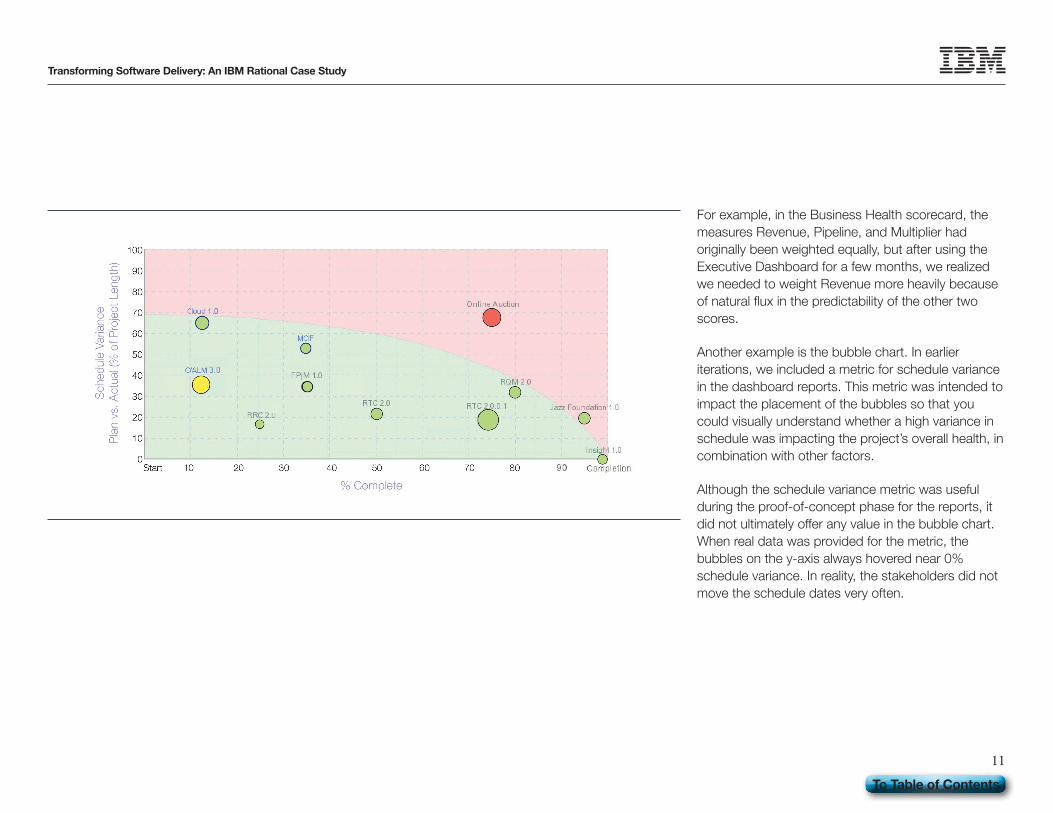
For example, in the Business Health scorecard, the measures Revenue, Pipeline, and Multiplier had originally been weighted equally, but after using the Executive Dashboard for a few months, we realized we needed to weight Revenue more heavily because of natural flux in the predictability of the other two scores.
Another example is the bubble chart. In earlier iterations, we included a metric for schedule variance in the dashboard reports. This metric was intended to impact the placement of the bubbles so that you could visually understand whether a high variance in schedule was impacting the project’s overall health, in combination with other factors.
Although the schedule variance metric was useful during the proof-of-concept phase for the reports, it did not ultimately offer any value in the bubble chart. When real data was provided for the metric, the bubbles on the y-axis always hovered near 0% schedule variance. In reality, the stakeholders did not move the schedule dates very often.
11
To Table of Contents
12
Transforming Software Delivery: An IBM Rational Case Study
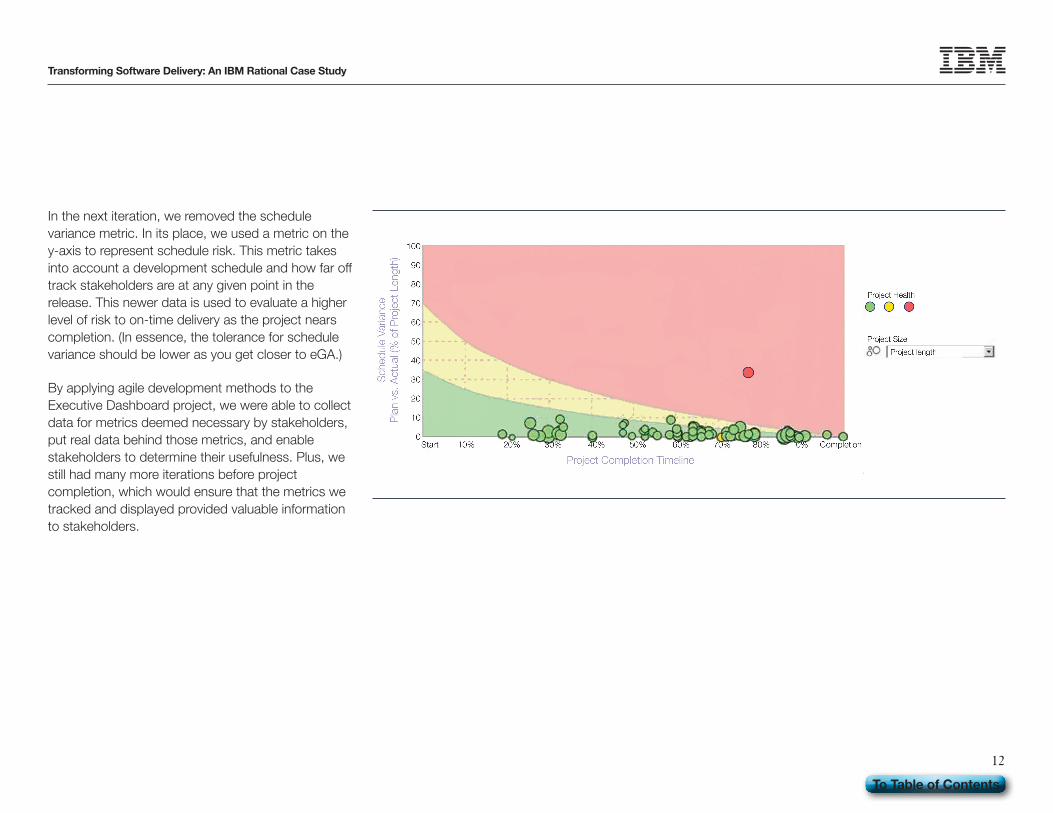
In the next iteration, we removed the schedule variance metric. In its place, we used a metric on the y-axis to represent schedule risk. This metric takes into account a development schedule and how far off track stakeholders are at any given point in the release. This newer data is used to evaluate a higher level of risk to on-time delivery as the project nears completion. (In essence, the tolerance for schedule variance should be lower as you get closer to eGA.)
By applying agile development methods to the Executive Dashboard project, we were able to collect data for metrics deemed necessary by stakeholders, put real data behind those metrics, and enable stakeholders to determine their usefulness. Plus, we still had many more iterations before project completion, which would ensure that the metrics we tracked and displayed provided valuable information to stakeholders.
To Table of Contents
13
Transforming Software Delivery: An IBM Rational Case Study
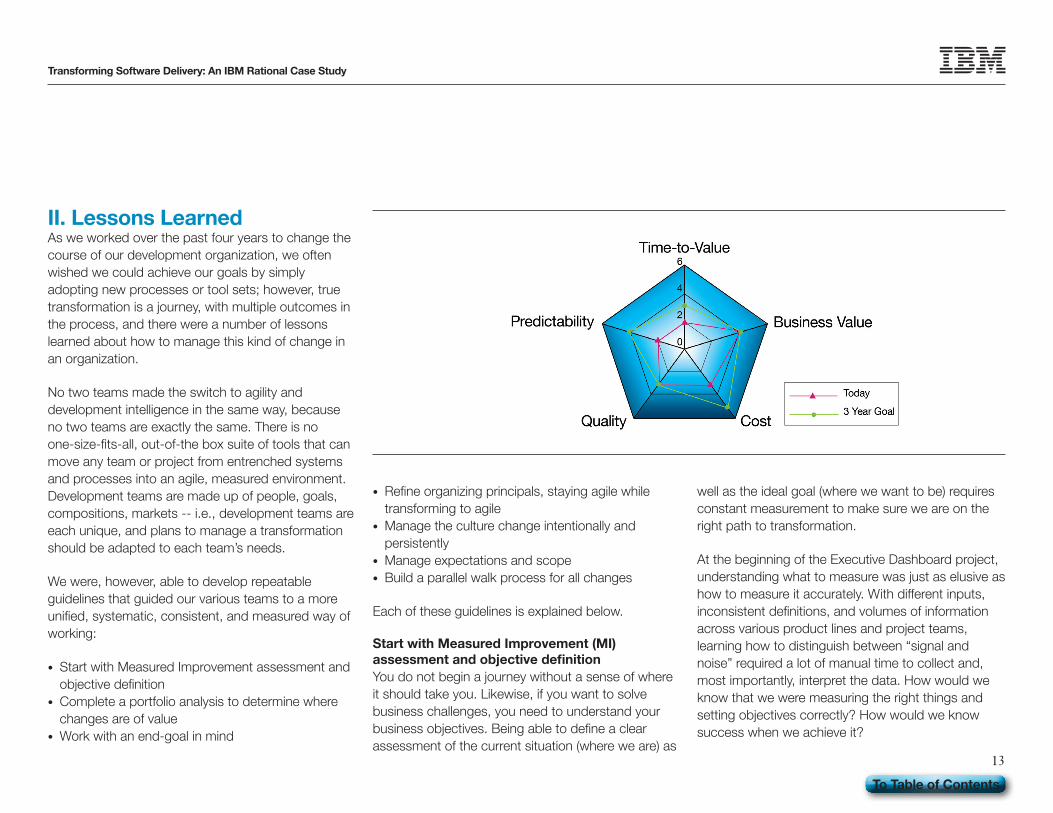
II. Lessons Learned As we worked over the past four years to change the course of our development organization, we often wished we could achieve our goals by simply adopting new processes or tool sets; however, true transformation is a journey, with multiple outcomes in the process, and there were a number of lessons learned about how to manage this kind of change in an organization.
No two teams made the switch to agility and development intelligence in the same way, because no two teams are exactly the same. There is no one-size-fits-all, out-of-the box suite of tools that can move any team or project from entrenched systems and processes into an agile, measured environment. Development teams are made up of people, goals, compositions, markets -- i.e., development teams are each unique, and plans to manage a transformation should be adapted to each team’s needs.
We were, however, able to develop repeatable guidelines that guided our various teams to a more unified, systematic, consistent, and measured way of working:
• Start with Measured Improvement assessment and objective definition
• Complete a portfolio analysis to determine where changes are of value
• Work with an end-goal in mind
• Refine organizing principals, staying agile while transforming to agile
• Manage the culture change intentionally and persistently
• Manage expectations and scope• Build a parallel walk process for all changes
Each of these guidelines is explained below.
Start with Measured Improvement (MI) assessmentandobjectivedefinitionYou do not begin a journey without a sense of where it should take you. Likewise, if you want to solve business challenges, you need to understand your business objectives. Being able to define a clear assessment of the current situation (where we are) as
well as the ideal goal (where we want to be) requires constant measurement to make sure we are on the right path to transformation.
At the beginning of the Executive Dashboard project, understanding what to measure was just as elusive as how to measure it accurately. With different inputs, inconsistent definitions, and volumes of information across various product lines and project teams, learning how to distinguish between “signal and noise” required a lot of manual time to collect and, most importantly, interpret the data. How would we know that we were measuring the right things and setting objectives correctly? How would we know success when we achieve it?
To Table of Contents
14
Transforming Software Delivery: An IBM Rational Case Study
We looked at several criteria over our own portfolio while pushing for the agile transformation, and we allowed those criteria to evolve based on the business objectives, not historical precedents. All of the measurements were then tested and visualized based on data reporting from our own software. The Measured Improvement approach allowed us to act, then assess, and finally steer projects and teams to an agile transformation. We were able to validate that the data being collected was giving us the intelligence we needed to succeed.
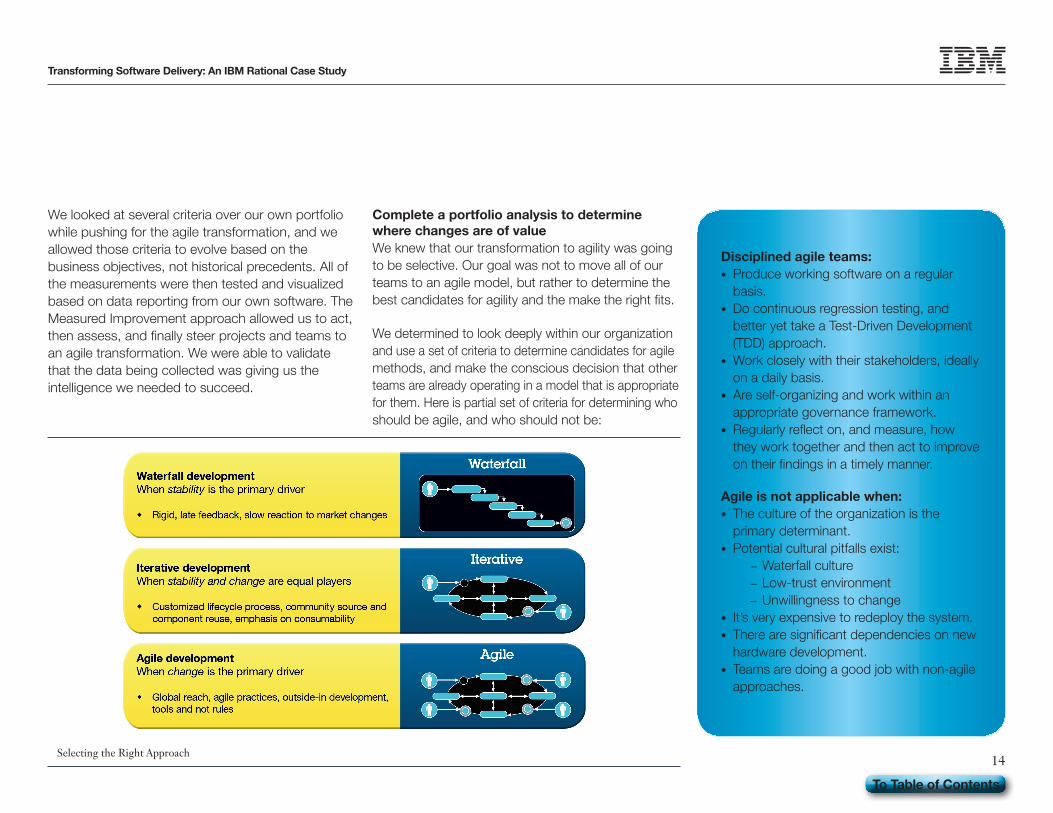
Complete a portfolio analysis to determine where changes are of valueWe knew that our transformation to agility was going to be selective. Our goal was not to move all of our teams to an agile model, but rather to determine the best candidates for agility and the make the right fits.
We determined to look deeply within our organization and use a set of criteria to determine candidates for agile methods, and make the conscious decision that other teams are already operating in a model that is appropriate for them. Here is partial set of criteria for determining who should be agile, and who should not be:
Disciplined agile teams:• Produce working software on a regular
basis.• Do continuous regression testing, and
better yet take a Test-Driven Development (TDD) approach.
• Work closely with their stakeholders, ideally on a daily basis.
• Are self-organizing and work within an appropriate governance framework.
• Regularly reflect on, and measure, how they work together and then act to improve on their findings in a timely manner.
Agile is not applicable when:• The culture of the organization is the
primary determinant.• Potential cultural pitfalls exist:
– Waterfall culture – Low-trust environment – Unwillingness to change
• It’s very expensive to redeploy the system.• There are significant dependencies on new
hardware development.• Teams are doing a good job with non-agile
approaches.
Selecting the Right Approach
To Table of Contents
15
Transforming Software Delivery: An IBM Rational Case Study
To Table of Contents
We determined there was a set of products and projects that agile methods were not likely to improve. For example, doing iterative development when a product was in maintenance mode and required very little stakeholder feedback would not be worth the cost of change. Although trying to create usable, incremental code is always a good thing, going all the way to agile did not apply globally throughout our portfolio.
Work with an end-goal in mindThe fact that a full development intelligence dashboard was the end goal did not mean it should be the last step. Our workloads and the complexity of the transformation meant that planning one change at a time, in a linear path, may have seemed wise. However, identifying the eventual business outcomes we wanted to achieve had to inform all of our choices. Otherwise, we would risk making isolated choices along the way and eventually being forced to retrofit processes and tool usage to be able to measure properly. From the beginning, we set goals to provide traceability from business objectives in our transformation to specific practices and metrics. We layered our approaches and tools with specific development intelligence goals in mind. Our measurements could then tell us if we were on the right track as we moved forward in our transformation.
We set end goal targets to improve the business using our own agile transformation practices and IBM Rational software. With real, standardized measurements across a carefully chosen set of reporting metrics, we were able to see substantial improvement toward our end-goals.
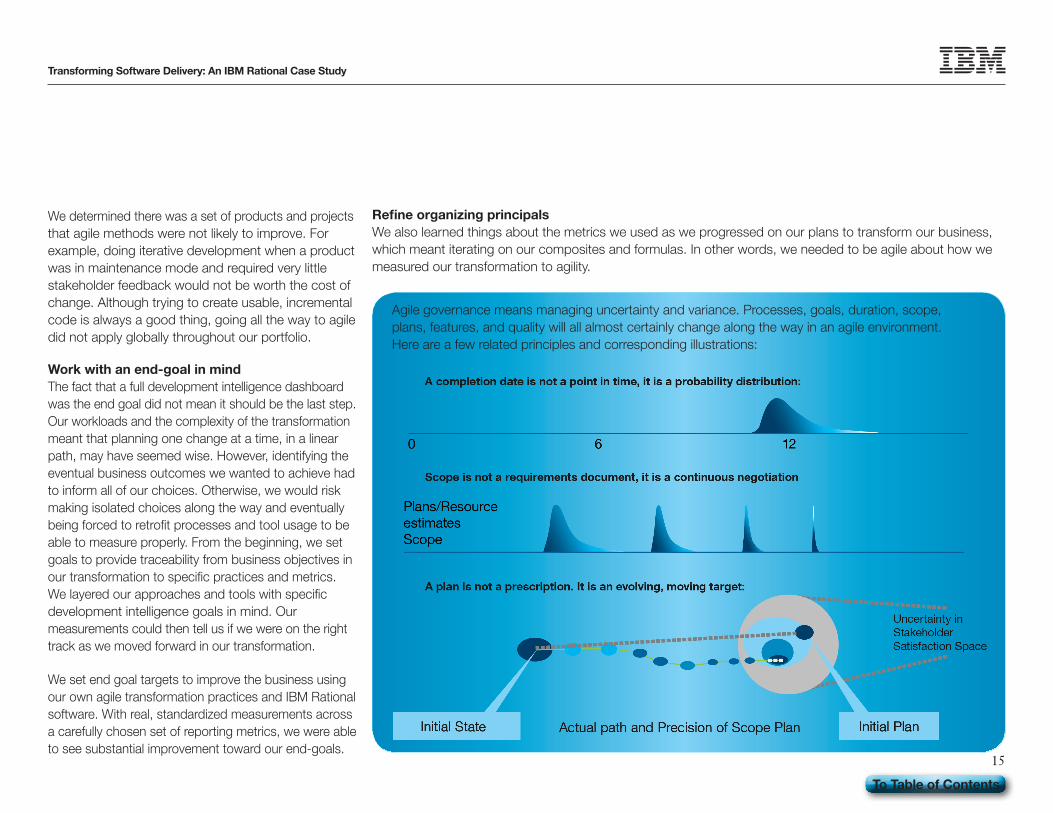
RefineorganizingprincipalsWe also learned things about the metrics we used as we progressed on our plans to transform our business, which meant iterating on our composites and formulas. In other words, we needed to be agile about how we measured our transformation to agility.
Agile governance means managing uncertainty and variance. Processes, goals, duration, scope, plans, features, and quality will all almost certainly change along the way in an agile environment. Here are a few related principles and corresponding illustrations:
16
Transforming Software Delivery: An IBM Rational Case Study
To Table of Contents
As we worked toward our end goals, we learned that our ways of interpreting and understanding our data was evolving. Insights grew keener. We were able to glean from our measurements a deeper insight to better understand what was cause and what was effect, and where we should focus our time refining processes and measurements.
Our Executive Dashboard model alerted process and project owners to issues, helping them set acceptable performance levels and manage by exception when attention was required. We drilled into the root causes of issues, so we could put mitigations into place, as well as analyze those root causes to drive the next round of continuous process improvement.
Manage the culture change intentionally and persistently Across a team as large as the Rational organization, changing entrenched methods of working and combating the familiarity of old processes and tools is a tough challenge. The reporting mechanisms we put in place became a forcing function of the culture change. It is important to remember that this kind of change will not just happen on its own; you need to force the change, but gently. We weren’t just deploy-ing a new system; we were transforming the way we do business.
Adjusting how you measure success can be a source of anxiety for people on multiple levels. The people involved may feel their value is attached to current
process. Are they being replaced by a dashboard? We had to manage this culture change by underscor-ing all of the new ways people would be able to demonstrate value.
We addressed this in two ways. First, we added the ability for leaders to use a more subjective expert assessment of health. By allowing an intuitive, gut-feel score to be manually entered into the overall health composite, we gave the experts a voice that was needed to ease the transition, aid us in testing our evolving metrics, and also capture the qualitative, softer aspects of running the business that data alone will not provide. Second, we realized that the intro-duction of data-driven reporting can initially feel harsh to those used to subjective reporting. Being exposed to the truth can hurt, and we spent a lot of time explaining thresholds and red statuses to the project owners. The most important lesson here is to change the culture to see that red is not necessarily a bad thing; a red item might mean that you effectively shifted resourced to turn something else green based on priorities, for example. We worked to subtly shift the “Why am I red?” reaction. The response to a red item on a dashboard is not to immediately wonder how to turn it green by tricking the metrics, but rather to understand the underlying data and what actions need to be taken at a business or development level to effectively improve. There is a subtle but critical distinction between statically reporting status, and dynamically analyzing project health data.
Manage expectations and scopeAt the start of any big transformation, people get excited. They want to see everything happen at once, so we had to learn to manage expectations and scope. We started by selecting the teams who would make the transition to an agile approach, and we worked with them directly to build appropriate plans and timelines. We also learned in our Executive Dashboard project that what works in a proof of concept will not necessarily work in production. Sample data is not real data, and you must allow ample time to bring your concept to reality. When you demonstrate proof of concepts, something that appears to work will lead people to expect that it does; so setting clear expectations from the start is critical to the overall perceptions of your progress.
It is difficult to become more flexible overall, especially in transforming to a more agile culture. Development communities often expect up-front plans and designs and work toward a set schedule, or firm vision. However, iterative development and Measured Improvement are both based on continued monitoring and adjustment. You should manage the scope of change by picking a few key metrics to represent each key functional area to start. Get those working completely and validly first, and avoid boiling the ocean. Then, iterate and evolve your measurement agilely, to match the agility of your development teams. Understanding that change is simply part of the expected process can help ease some of the initial anxiety and tension.
17
Transforming Software Delivery: An IBM Rational Case Study
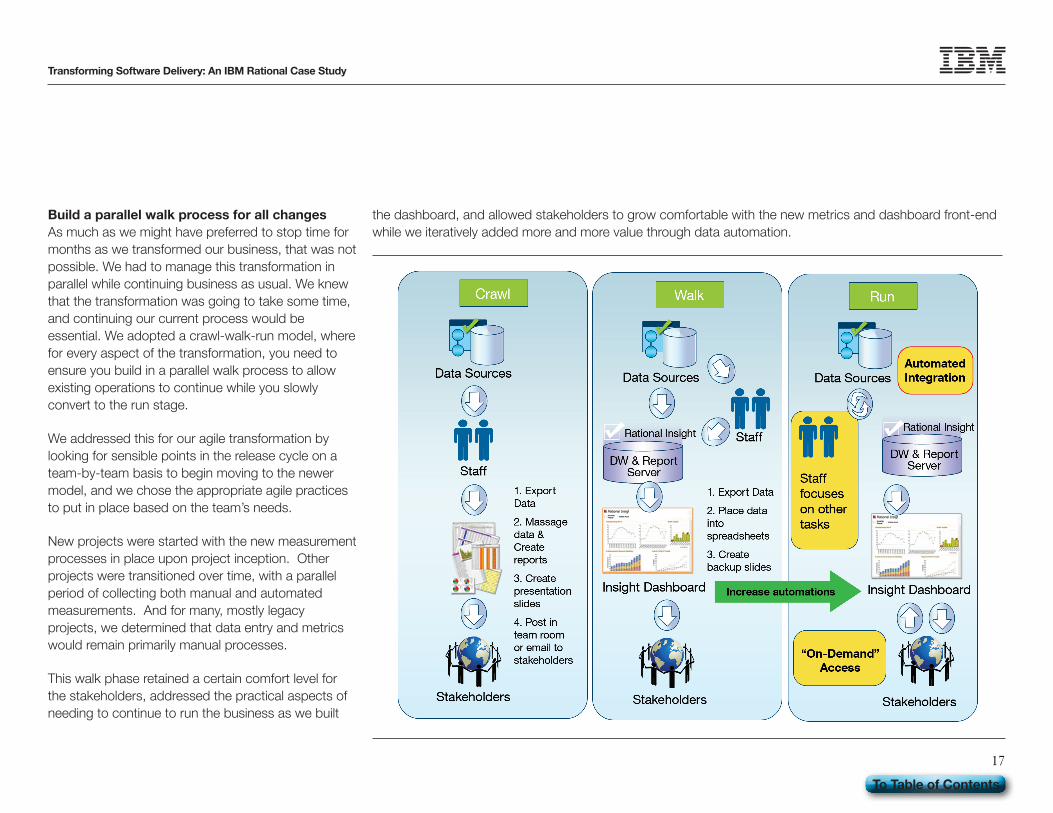
Build a parallel walk process for all changesAs much as we might have preferred to stop time for months as we transformed our business, that was not possible. We had to manage this transformation in parallel while continuing business as usual. We knew that the transformation was going to take some time, and continuing our current process would be essential. We adopted a crawl-walk-run model, where for every aspect of the transformation, you need to ensure you build in a parallel walk process to allow existing operations to continue while you slowly convert to the run stage.
We addressed this for our agile transformation by looking for sensible points in the release cycle on a team-by-team basis to begin moving to the newer model, and we chose the appropriate agile practices to put in place based on the team’s needs.
New projects were started with the new measurement processes in place upon project inception. Other projects were transitioned over time, with a parallel period of collecting both manual and automated measurements. And for many, mostly legacy projects, we determined that data entry and metrics would remain primarily manual processes.
This walk phase retained a certain comfort level for the stakeholders, addressed the practical aspects of needing to continue to run the business as we built
the dashboard, and allowed stakeholders to grow comfortable with the new metrics and dashboard front-end while we iteratively added more and more value through data automation.
To Table of Contents
18
Transforming Software Delivery: An IBM Rational Case Study
To Table of Contents
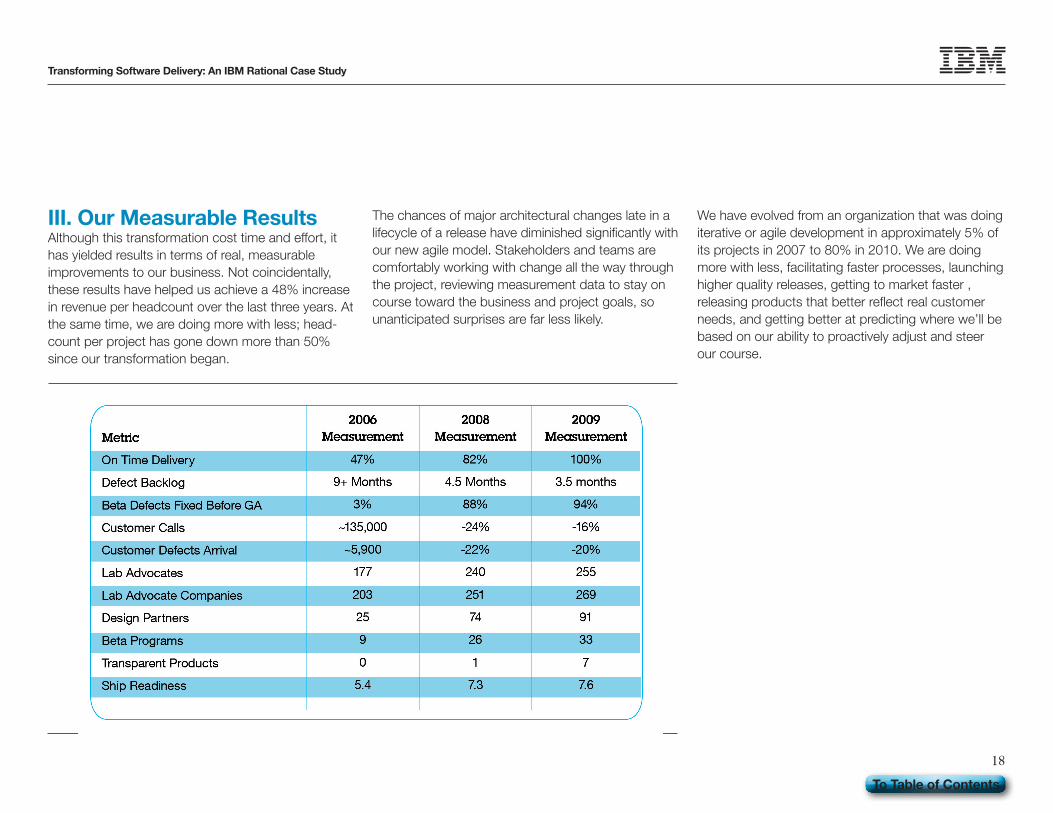
III. Our Measurable ResultsAlthough this transformation cost time and effort, it has yielded results in terms of real, measurable improvements to our business. Not coincidentally, these results have helped us achieve a 48% increase in revenue per headcount over the last three years. At the same time, we are doing more with less; head-count per project has gone down more than 50% since our transformation began.
The chances of major architectural changes late in a lifecycle of a release have diminished significantly with our new agile model. Stakeholders and teams are comfortably working with change all the way through the project, reviewing measurement data to stay on course toward the business and project goals, so unanticipated surprises are far less likely.
We have evolved from an organization that was doing iterative or agile development in approximately 5% of its projects in 2007 to 80% in 2010. We are doing more with less, facilitating faster processes, launching higher quality releases, getting to market faster , releasing products that better reflect real customer needs, and getting better at predicting where we’ll be based on our ability to proactively adjust and steer our course.
19
Transforming Software Delivery: An IBM Rational Case Study
© Copyright IBM Corporation 2011
IBM Global Services Route 100 Somers, NY 10589 U.S.A.
Produced in the United States of America January 2011 All Rights Reserved
IBM, the IBM logo, ibm.com, Smarter Planet, the Smarter Planet logo, ClearQuest, Cognos, Power, Rational, Rational Team Concert, and System z are trademarks or registered trademarks of International Business Machines Corporation in the United States, other countries, or both. If these and other IBM trademarked terms are marked on their first occurrence in this information with a trademark symbol (® or ™), these symbols indicate U.S. registered or common law trademarks owned by IBM at the time this information was published. Such trademarks may also be registered or common law trademarks in other countries. A current list of IBM trademarks is available on the Web at “Copyright and trademark information” at ibm.com/legal/copytrade.shtml
Other product and service names might be trademarks of IBM or other companies.