Embed Size (px)
Citation preview
Seediscussions,stats,andauthorprofilesforthispublicationat:https://www.researchgate.net/publication/288933429
TransformingLSAspacedimensionsintoarubricforanautomaticassessmentandfeedbacksystem
ARTICLE·DECEMBER2015
DOI:10.1016/j.ipm.2015.12.002
READS
24
5AUTHORS,INCLUDING:
RicardoOlmos
UniversidadAutónomadeMadrid
31PUBLICATIONS92CITATIONS
SEEPROFILE
GuillermoJorge-Botana
NationalDistanceEducationUniversity
20PUBLICATIONS57CITATIONS
SEEPROFILE
MartinCordero
NationalDistanceEducationUniversity
7PUBLICATIONS9CITATIONS
SEEPROFILE
JoséAntonioLeón
UniversidadAutónomadeMadrid
75PUBLICATIONS262CITATIONS
SEEPROFILE
Allin-textreferencesunderlinedinbluearelinkedtopublicationsonResearchGate,
lettingyouaccessandreadthemimmediately.
Availablefrom:GuillermoJorge-Botana
Retrievedon:18January2016

This is a preprint of an article accepted for publication in Information Processing and Management. Please cite this article as:
R. Olmos et al., Transforming LSA space dimensions into a rubric for an automatic assessment and feedback system, Information
Processing and Management (2015), http://dx.doi.org/10.1016/j.ipm.2015.12.002
The source is: http://www.sciencedirect.com/science/article/pii/S0306457315001375
TITLE PAGE
Transforming LSA space dimensions into a rubric for an automatic
assessment and feedback system
Corresponding author. Author 1. Ricardo Olmos Affiliation 1: Universidad Autónoma de Madrid Affiliation 2: Semantia Lab (www.semantialab.es) Ciudad Universitaria de Cantoblanco. C/Iván Pavlov, s/n., 28049 Madrid TF: +34 91 497 85 86
[email protected] Author 2. Guillermo Jorge-Botana Affiliation 1: Universidad Nacional de Educación a Distancia Affiliation 2: Semantia Lab (www.semantialab.es) Juan del Rosal, nº 10. 28023 TF: +34 91 398 60 95
[email protected] Author 3. José M. Luzón. Affiliation 1: Universidad Nacional de Educación a Distancia Affiliation 2: Semantia Lab (www.semantialab.es) Juan del Rosal, nº 10. 28023 TF: +34 91 398 60 95
[email protected] Author 4. Jesús I. Martín-Cordero. Affiliation: Universidad Nacional de Educación a Distancia Juan del Rosal, nº 10. 28023 TF: +34 91 398 60 95
[email protected] Author 5. José Antonio León Affiliation: Universidad Autónoma de Madrid Ciudad Universitaria de Cantoblanco. C/Iván Pavlov, s/n., 28049 Madrid TF: +34 91 497 52 26
Transforming LSA space dimensions into a rubric for an automatic assessment
and feedback system
Abstract
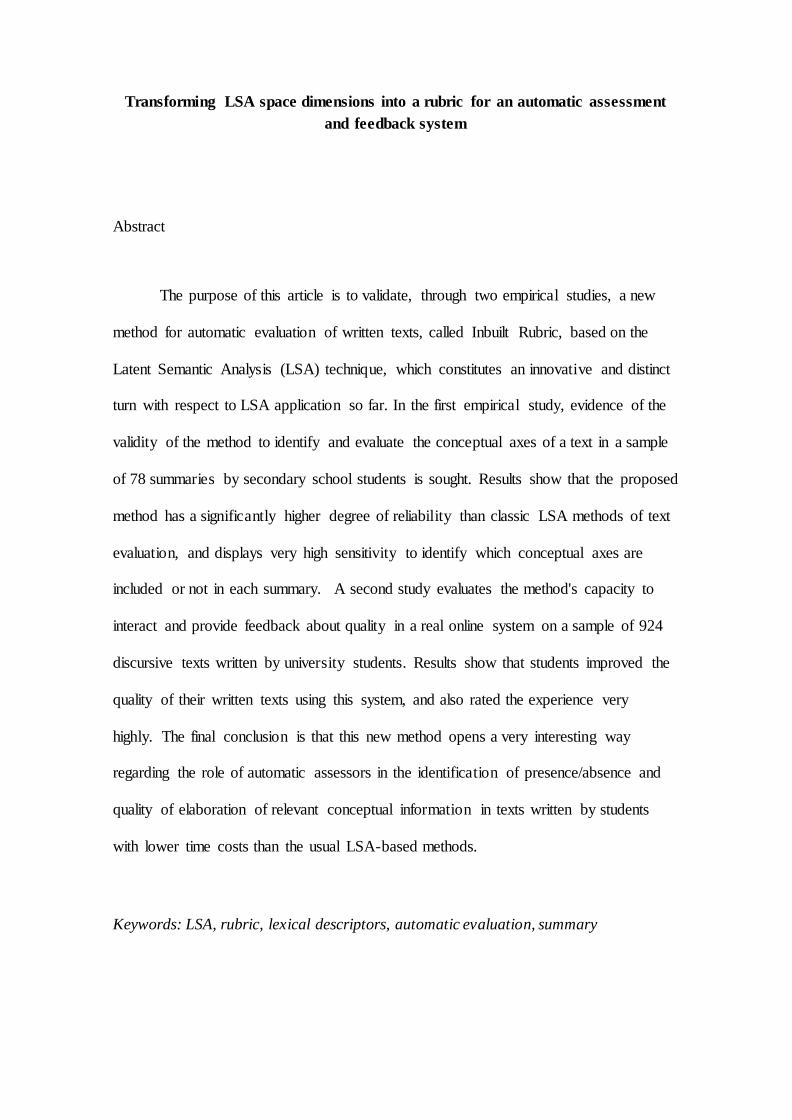
The purpose of this article is to validate, through two empirical studies, a new
method for automatic evaluation of written texts, called Inbuilt Rubric, based on the
Latent Semantic Analysis (LSA) technique, which constitutes an innovative and distinct
turn with respect to LSA application so far. In the first empirical study, evidence of the
validity of the method to identify and evaluate the conceptual axes of a text in a sample
of 78 summaries by secondary school students is sought. Results show that the proposed
method has a significantly higher degree of reliability than classic LSA methods of text
evaluation, and displays very high sensitivity to identify which conceptual axes are
included or not in each summary. A second study evaluates the method's capacity to
interact and provide feedback about quality in a real online system on a sample of 924
discursive texts written by university students. Results show that students improved the
quality of their written texts using this system, and also rated the experience very
highly. The final conclusion is that this new method opens a very interesting way
regarding the role of automatic assessors in the identification of presence/absence and
quality of elaboration of relevant conceptual information in texts written by students
with lower time costs than the usual LSA-based methods.
Keywords: LSA, rubric, lexical descriptors, automatic evaluation, summary
1. Introduction
It is a well-known fact that novice writers pay little attention to revision
processes. It is also well known that even when revisions are made these are often
superficial or mechanic (Graham, 2006; Fitzgerald, 1987). There is also evidence that
even university students spend little time on revision processes (Pianko, 1979); in fact,
it can be stated that one of the characteristics of more competent writers is spending
more time on revision and applying it to a conceptual and structural level (Hayes and
Flower, 1986) instead than to superficial text traits (spelling, errors, etc.) which is the
common strategy in novice writers. The importance of improving the quality of
students' writing cannot be overstated, and the same can be said about the relevance of
revision processes to this purpose. Precisely in order to aid and motivate writers in the
process of revision of academic texts, special emphasis has been placed in recent years
on the creation of automatic assessors and tutors that provide help in instruction tasks
(Foltz, Laham & Landauer, 1999b; Magliano & Graeser, 2012; Foltz, Streeter,
Lochbaum, & Landauer, 2013; Shermis, Koch, Page, Keith, & Harrington, 2002). Some
of these automated assessors have made use of engines based on Latent Semantic
Analysis (LSA) and its ability to identify concepts (Foltz, Gilliam, and Kendall, 2000;
Graesser, Wiemer-Hastings, Wiemer-Hastings, Harter, Person, & the Tutoring Research
Group, 2000; Kintsch, Caccamise, Franzke, Johnson, & Dooley, 2007). Part of the
assessors in this group are aimed at offering ongoing online conceptual feedback when a
student delivers a text or changes part of a text already delivered (Franzke, Kintsch,
Caccamise, Johnson, & Dooley, 2005). The aim of these assessors is to provide support
to the cyclical process by which students enter the summary of a previously-read text.
The system provides information about the concepts that are included or not with
respect to those which should be included, and the student re-revises his text (reviewing

even the basic text to obtain information). Then the student enters another summary that
will usually be based on the first one.
As was previously stated, Latent Semantic Analysis (LSA) is one of the
techniques that can identify conceptual information and is widely used for this reason.
There is no need to specify the basics and details of this technique, which is thoroughly
documented (Deerwester, Dumais, Landauer, Furnas & Harshman, 1990; Landauer &
Dumais, 1997). There is extensive documentation too about the educational aspect of
this technique (Kakkonen, Sutinen, Timonen, 2005; Haley, Thomas, Petre & De Roeck,
2007; Millis, Magliano, Wiemer-Hastings, Todaro, & McNamara, 2007). However,
some essential LSA concepts should be described to understand the logic underlying the
methodology proposed in this paper. LSA starts by analyzing an extensive set of
documents (the linguistic corpus), where, to begin with, a matrix X of occurrences is
generated, with n rows and m columns. The number n of rows corresponds to the
number of different terms analyzed in this first step and the number m of columns refers
to the number of documents used to train the LSA system. Each cell in X contains the
frequency of the term in each document. It is known that this LSA based X matrix does
not contain a useful representation of the semantics because, among other things, it has
a huge dimensionality, and contains the subjective use made by the authors of the terms.
After softening the X matrix by means of a function such as entropy (i.e. Nakov,
Popova, & Mateev, 2001) the algebraic technique known as singular value
decomposition, which defines the essence of LSA, is applied. This technique yields a
US matrix with n x k dimensions, where k is now a small number of dimensions, usually
ranging between 250 and 350. This US matrix is known as a latent semantic space
because it contains an efficient representation of the terms in the corpus (i.e. Landauer
& Dumais, 1997). The term "latent" is due to the fact that the semantic space has an

eminently abstract nature. The k dimensions that represent terms and texts do not
correspond to discernible concepts or specific episodes with which to label the
dimensions. The k dimensions do not have thus psychological verisimilitude, yet they
have proven very useful to simulate semantic judgments and many tasks involving text
meaning (i.e. evaluation, predication, diagnosis, telephone call routing, etc.) The
concept of semantic space is thus very important, as it is the basis onto which the texts
to be semantically interpreted are projected, and thus is also very important for
educational assessment applications.
Limitations of the current LSA based assessment systems
The way in which texts written by students have been usually assessed and rated
has been to compare the vector representation of those texts in the semantic space with
the vector representation of one or more texts that serve as the standard criterion and
have been written by experts in the discipline (usually teachers). There are various
techniques in this regard, from the simplest ones, based on a single standard summary
(golden summary, see Landauer, Foltz, & Laham, 1998 or more recently Klein, Kyrilov,
& Tokman, 2011), to more complex ones, such as the technique that makes use of a
sample of previously rated standard summaries so that the scale is more plausible from
the point of view of a human judge (grading techniques, see Dronen, Foltz, &
Habermehl, 2014; Kakkonen & Sutinen, 2004; Burstein, Kukich, Wolff, Lu, &
Chodorow, 1998). To the extent that the student's summary approaches a pre-rated
standard summary, it will get the same grade as the standard summary. In any case, in
both techniques and some intermediate ones, a single grade is obtained, which is a
function of the semantic distance between the student's text and those standard criteria.
Dronen et al. (2014) describe the high costs of this type of study and propose methods
for pre-grading to be as efficient as possible.

One of the ways in which these techniques have been implemented to assess
student texts has implied providing not only a single grade, but the information of what
contents are missing in a summary to reach an acceptable standard as well. This is
basically a rubric-based content detection task (see, for instance, Summary Street by
Franzke, et al., 2005). This is done in the same way as when giving a single grade, that
is, by taking text samples (or partial golden summaries) from the concepts to inform
about (e.g. sentences extracted from the book to be read), project them onto the
semantic space as a vector, and compare them to the vector that represents the student's
text. The feedback for each concept will depend on whether the distance between
vectors (those of the students and those of the partial golden summaries) is large or
small. Another example is Apex (Dessus & Lemaire, 1999), an interactive learning
environment, in which the teacher must identify short passages of the instructional text
that contains a key concept and the topic or topics to which each concept belongs. In
Magliano and Graesser (2012) it is shown that automatic systems involve the creation of
a number of answers (which they call expectations) that represent either the different
levels of students, or else concepts, inferences, or usual misconceptions among students.
These answers are real language samples. Obviously, the preparation of these
instruments (golden summaries, graded summaries or partial golden summaries) is time
consuming and requires effort. In particular the elaboration of partial golden summaries
involves a more time and complexity, besides problems regarding the quantity and
sampling of the text to be collected in order to represent each concept. Moreover,
golden summaries, graded summaries and partial golden summaries are all based on
what may be considered to be a blind or meaningless vector space, so we will name
them a “latent space instruments”, in contrast with the meaning “loaded” vector space
instrument we present in this paper, the Inbuilt Rubric.

New challenges around identifying contents with LSA
Along these lines, developing new procedures to go beyond mere measurements
of similarity between texts and refine the techniques to capture the basic conceptual
axes in a written essay in a nuanced and efficient way is certainly a challenge (see
Dronen et al, 2014; Kontostathis & Pottenger, 2006; McNamara, 2011; Magliano &
Graesser, 2012 for possible LSA developments).
Facing this challenge, in this paper we propose the use of a new strategy to
identify contents by means of a rubric. This is a strategy that has already been described
as a general application to provide some of the k dimensions in the semantic space with
a meaning imposed a priori (Olmos, Jorge-Botana, León & Escudero, 2014). Briefly
put, the strategy of this study is based on choosing descriptors (words) for each of the
concepts to be established as a criterion. Once each defined concept has its descriptors,
each concept becomes a vector in the semantic space and a change of basis is applied so
that words are expressed in a new space with those vector-concepts that are part of the
new basis. In order to avoid distorting the distances and positions in the former semantic
space, a mathematical technique is used to force orthogonalization once again in a
controlled and monitored manner. The final product of this strategy is a new semantic
space in which the p first dimensions have the meaning of the concepts that were
imposed on them a priori. More specifically, in this paper we propose that those p first
dimensions be structured as the main concepts of a rubric aimed at assessment and
feedback. This can make the design processes for LSA-based evaluation objects more
agile. This method will be called Inbuilt Rubric, by contrast to the classic “latent space
instruments” mentioned above. In this paper we will provide a detailed description of
the Inbuilt Rubric method, as well as two empirical studies. In the first study, evidence
of the validity of the methodology proposed in a controlled context of evaluation on a
sample of 78 summaries by secondary school students is sought. In the second we
present a pilot study where the method has been used in a distance education online
system, which was accessed by 864 university students taking a third-year course in the
Degree in Psychology. Participants use profiles of the automated assessment and
feedback in this pilot study will be described, as well as routes for improvement in the
quality of written answers.
2. The Inbuilt Rubric assessment method
The general procedure to transform the latent semantic space into a new,
meaningful space can be found, together with all the technical details, in Olmos et al.
(2014). The description of the Inbuilt Rubric provided here is shorter and simplified,
and is accompanied by a specific application: a study of rubric-based evaluation of an
expository text, The strangler tree, 500 words long, conceived for secondary school
students. The method has three distinct steps.
(1) Rubric: This is the first step. It involves establishing the evaluation rubric by
extracting the basic conceptual axes in the text. The text used describes a type of jungle
trees that survive by being parasites on other trees. In order to survive, many plants
compete to reach sunlight in an area of thick vegetation. These trees use their roots to
first surround their host trees, until they create a thick web around them, and finally
strangle them and remain as an independent tree. In a previous paper, six experts (León
& Grupo de Investigación Santillana, 2004) discussed the essential conceptual axes of
this text. These conceptual axes were four: (1) Suitable contextualization of the text.
This involves presenting strangler trees and locating them (jungle areas, tropical areas,
etc.) (2) Secondly, it was regarded as essential to describe the process of strangulation

by means of the roots as a gradual process with a lethal ending for the host tree, which
is clearly a parasitism strategy. (3) Another conceptual axis of the text is the immediate
goal of this parasitism process, namely the struggle and competition to reach sunlight.
(4) Finally, the fourth conceptual axis of the text is the ultimate goal described in it: a
general strategy of survival in difficult adaptation conditions. So the conceptual axes
were four: contextualization of the strangling tree, the process of strangulation and
asphyxiation, the immediate goal of the struggle to reach sunlight, and the ultimate goal
which is a survival strategy.
(2) Lexical descriptors: The second step required by the method is the insertion
of the rubric into the LSA. This is done by choosing lexical descriptors that capture the
four conceptual axes described in the rubric in the best way possible. Because the next
step is transforming the latent semantic space in such a way that the first dimension
captures the meaning of the first conceptual axis (strangler trees, humid jungle areas,
etc.), the lexical descriptors that best express these ideas must be chosen. The procedure
is the same for the second conceptual axis. The lexical descriptors that best describe the
conceptual axes must be found. The second step ends when lexical descriptors are
chosen for all the conceptual axes imposed in the rubric.
The lexical descriptors chosen for the four conceptual axes were the following:
for the first dimension, strangle, tree, rain-forest, jungle and tropical were chosen. For
the second dimension, to kill, to asphyxiate, to strangle and roots were chosen. For the
third dimension, competition, sun and light were chosen. Finally, for the fourth
dimension adaptation, survival and survive were used.
(3) Change of basis: Finally, the third step, once the rubric and its conceptual
axes have been completed and once the lexical descriptors that best represent them have
been chosen, consists in transforming the meaningless latent semantic space into a new

one whose first p dimensions signify the conceptual axes of the rubric. Employing the
usual LSA notation (Deerwester, et al., 1990) and, as presented in the introduction to
the paper, we will call the non-transformed meaningless semantic space, US, a matrix
with n x k dimensions, where n is the number of terms and k the number of latent
dimensions. In our study, the number of dimensions k with which LSA was trained was
250 and the number of terms n was 13,389. The term vectors in US are referenced in the
canonical (standard) basis. The k dimensions are actually the vectors in the canonical
basis, and every n vector is represented by means of the mentioned basis.
Let us call this new basis β ={VAXIS1, VAXIS2, VAXIS3, VAXIS4 , VAXIS5, …,
VAXISK}, where Vk is a vector in the new basis. The first p vectors in β will represent
the conceptual axes created in the rubric. In addition, each vector representing each
conceptual axis is the vector sum of all its descriptors. For example, VAXIS1 = VSTRANGLE
+ VTREE + VRAIN-FOREST + VJUNGLE + VTROPICAL, that is to say, the sum of the vectors that
represent the descriptor terms in the original semantic space US. The new basis must
have the same number of vectors, k, as the original canonical basis. To this end, in
addition to having the p vectors in the rubric axes, the remaining vectors in the new
basis {Vp+1, …, Vk} are created using vectors from the canonical basis, until a basis of k
vectors is completed. The only requirement is that all vectors must be linearly
independent.
Following this procedure, we can express the terms of the matrix US in the new
basis β, obtaining a new term matrix C whose p first dimensions are “meaning loaded”
(as meaningful as the vectors of the axes VAXIS1, VAXIS2, VAXIS3, VAXIS4 in the new basis
β) . Each term vector ci in the new term matrix C can be calculated by multiplying each

vector usi in US by β– 1. This possibility was originally suggested by Hu, Cai, Wiemer-
Hastings, Graesser, and McNamara (2007):
[1]
This method is direct and has no mathematical complexity. However, it should
be pointed out that the other matrix β which serves as the basis will in all likelihood not
be orthogonal. For β to constitute a new basis, it must meet the requirement that the k
vectors which it contains must be linearly independent. This is guaranteed, unless the
words chosen to form two concepts are exactly the same. The problem is that in β
vectors can be (and will probably be) correlated, as a null correlation is a very particular
case. So β lacks orthogonality, or, put otherwise, β is an oblique basis. Generating a
new C matrix with β being a non-orthogonal matrix makes later interpretation of the
coordinates difficult. In fact, a non-orthogonal basis often creates a space that is hardly
usable, as the original distances between the term vectors are not preserved (Olmos et
al., 2014; Visinescu & Evangelopoulos, in press). To ensure the orthogonality of the
basis, we applied Gram-Schmidt before using Formula 1 (see for example, Schneider,
Steeg, & Young, 1987). Gram-Schmidt ensures that the vectors in β are orthogonal.
Basically, what it does is transform the vectors in β into similar ones (which constitute
the β’ basis) while preserving orthogonality. The requirement imposed is that the β
vectors must be similar to the β’ vectors, so that correlation between a vector and its
orthogonalized version must be greater than or equal to .70. The reason is that .702 ≈
.50, so both vectors must share at least 50% of variance (see details in Olmos et al.,
2014). In the study performed, it was found that the correlation between the vector in
the first conceptual axis in β and its orthogonalized correction in β’ was: rβ1β’1 = 1; the
second correlation between the vector in the second conceptual axis in β with that in β’
))(( 1 βUSC

was rβ2β’2 = .987. In turn, rβ3β’3 = .962 y rβ4β’4 = .890, so in all cases the requirement rβiβi’
> .70 was met. Experience tells us that by choosing words that are not really redundant
and when the number of meaningful dimensions (i.e. conceptual axes) is not high, there
will be no reliability problems preserving the orthogonal basis. In the specific example
of the expository text, the vectors that constitute basis β’ are very similar to those in β
before orthogonalization was forced. Thus, in order to obtain the new semantic space C’
the following was used:
[2]
At this point we have a new meaningful semantic space in C’. The first four
dimensions now bear the meanings that we have given to them, in such a way that a
term whose coordinate is high in the first dimension will be related to the first
conceptual axis (strangler trees in humid, tropical, jungle areas, etc.), a word whose
coordinate is high in the second dimension will convey abundant information about the
second conceptual axis (the asphyxiation and strangulation process), etc. The benefits of
having a meaningful semantic space are obvious: in C' we can interpret the coordinates
of the terms or summaries (at least in the p meaningful dimensions), and yet this is not
the case in the original space US, given that the k dimensions are meaningless.
Projection of the summaries onto C'. The rest of the method is simple. Because
the four first dimensions reflect the conceptual axes of the text (although then it is
necessary to verify a posteriori whether those new dimensions really capture well the
intended meaning), by projecting a summary onto the new semantic space C' we will
have what that summary saturates in each of the four dimensions (note that the
projection of the summaries is in the k-dimensions of C', so the first four dimensions
are meaningful and the remaining k – p are abstract/meaningless dimensions). Thus we
will be able to see how much each summary bears of each conceptual axis of the rubric.
))(( 1 β'USC'
The global score of a summary is a linear combination of the mentioned dimensions. In
the specific case of this study, the same weight was given to each of the four conceptual
axes, so the total score of the quality of the summary is the sum of all four dimensions.
There is the possibility of previously standardizing the dimensions, turning them into
standardized scores for those coordinates.
3. Study I: Validation of the Inbuilt Rubric method
3.1 Material and methods
3.1.1 Summaries
To perform the study, the text was given to 78 students, 43 from the second year
of ESO (8th grade; average age 13.86) and 35 from the fourth year of ESO (10th grade;
average age 15.94). They were allowed to read the explanatory text on strangler trees,
which was 500 words long, for 10 minutes. They were then given a multiple-answer
comprehension test. They were finally asked to write a short summary of the text they
had read (a maximum of approximately 100 words). 35 of the 78 students were boys
and 43 were girls.
3.1.2 Judges' evaluations
Two judges independently assessed each of the 78 summaries written by the
students. The assessments were performed as follows. Every judge had to assign 0 to 2
points to each of the four conceptual axes created when establishing the rubric (not
necessarily integer values). The correlation between both judges was .89, and the two
judges' scores were averaged.
3.1.3 Linguistic corpus
A developmental linguistic corpus compiled between 2012 and 2013 was used to
train the LSA. It compiled paragraphs from texts suitable for different ages: 4 to 6 years

old, 7 to 9 years old, 10 to 12 years old, 13 to 16 years old, and over 16. The corpus
included transcriptions, textbooks, and novels. The latent semantic space included
words that appeared at least 7 times. The weighting method for the occurrence matrix
was entropy (see Nakov et al., 2001 for a review). The terms were lemmatized to avoid
the large number of verb forms in Spanish. The final latent semantic space had 13,389
different terms and 29,905 documents. Both the training and the ensuing change of basis
and re-orthogonalization of the space were carried out using Gallito 2.0 (Jorge-Botana,
Olmos & Barroso, 2013), a piece of software that makes it possible to perform the entire
Inbuilt Rubric method process.
3.1.4 Data analysis
Several statistical analyses were performed to validate the Inbuilt Rubric
method. To begin with, the judges' assessments were used as an external criterion to
verify the reliability of the Inbuilt Rubric method in summary assessment. Reliability
was rated using the Pearson correlation coefficient. Secondly, as further evidence of
validity, the reliability of the Inbuilt Rubric method proposed was compared with that
obtained using a well-known method which has worked well in LSA automatic
assessment, the Golden Summary (a method which consists in using one or several
golden summaries with which students summaries are compared; see, e.g. Foltz, Laham
& Landauer, 1999a).
Thirdly, to validate each of the four dimensions that represent the conceptual
axes, four linear regression models were created using the coordinates (scores) in the
four dimensions bearing the conceptual axes in C' as independent variables (i.e., only
the p meaningful dimensions from the summaries are taken into account). The variables
that depend on each of the four models were the scores given by the judges to the
summaries in the four conceptual axes respectively. What is expected is for the beta

coefficient of the dimension that expresses a specific conceptual axis to be higher than
the coefficients of the other three dimensions, thus establishing a converging validity
argument. Thus the beta coefficients of the other conceptual axes are low
(discriminating validity). Put otherwise, the C' coordinates that reflect the conceptual
axis j can be expected to contribute more than the coordinates of any of the other three
dimensions when it comes to predicting the scores given by the judges in the summaries
of conceptual axis j.
Fourthly and lastly, the point to which the method is able to detect lack of contents in
the summaries of the secondary education students was established. This is due to the
desire to give a more widespread use to the method, and for it to be able to provide
feedback to students to instruct them about the strong and weak points in their
summaries (Graesser et al., 2000; Kintsch, Steinhart, Stahl, & LSA research group,
2000). For this reason, the judges' scores were dichotomized in the four conceptual axes
in such a way that both scores reflected whether the summary sufficiently covered the
required concept or not. Likewise, the LSA scores were dichotomized in such a way that
the method establishes whether the summary sufficiently contained the conceptual axis
required or not. Finally, a double-entry table was created by crossing the judges' criteria
with those of the method to find the degree of equivalence in these dichotomized scores
and the reliability of content detection was analyzed by means of the Kappa index.
3.2 Results of study 1
3.2.1 Reliabilities
Firstly, the reliability of the new method proposed was examined by means of
the judges' assessment and this reliability was compared with the best classic methods:
the Golden Summary method. Results are shown in Table 1. The reliability found
between the Inbuilt Rubric and the expert judges was .82. The reliability between the

classic LSA method, the Golden Summary, and the expert judges was .66. Finally, the
correlation between both LSA methods was .66.
Table 1. Reliability of the LSA methods and expert judges
LSA assessment methods
Inbuilt Rubric Golden Summary
Expert judges .82** .66**
Inbuilt Rubric .66** Note: ** p < .01. N = 78
Statistically, the Inbuilt Rubric standardized regression coefficient was found to
be significantly higher than that of the Golden Summary when it comes to explaining
the judges' scores (χ2(1) = 8.435, p = .0037), so it is a significantly more reliable
method. The differences between both methods can be graphically seen. Figure 1 shows
the scatter plot between the global scores granted by the LSA and the new method
proposed and the judges' assessments. Figure 2 displays the same relationship between
the Golden Summary method and human judgments. The first scatter plot shows that
the relationships is closer, that there is a higher degree of linearity, and that there is less
dispersion around a regression line than when these aspects are compared in the scatter
plot that compares the Golden Summary method and the experts' judgments.
Figure 1. Scatter plot linking the LSA method, Inbuilt Rubric, to the experts' judgments

Figure 2. Scatter plot linking the LSA method, Golden Summary, to the experts' judgments

3.2.2 Tests of the method's validity
To show that the Inbuilt Rubric assessment method is valid, we studied whether
each of the respective dimensions chosen for the change of basis predicted the contents
of the conceptual axes of the summaries. For example, the conceptual axis survival
generated by means of the words adaptation, survival, and survive should predict better
than any of the other three dimensions the scores given by the expert judges to that
specific conceptual axis in the summaries. In turn, the sun light dimension generated by
the lexical descriptors competition, sun, light is expected to predict better than the other
three dimensions the scores given by the judges to the summaries on the specific
conceptual axis. The same idea applies to the other two conceptual axes.
To this end, four multiple regressions were carried out where the predictor
variables were the LSA coordinates in those four dimensions. The variables depending
on each of the regressions were the judges' scores in the four contents assessed in the
summaries. Results are shown in Table 2.
Table 2. Beta standardized regression coefficients of the LSA conceptual axes on the
judges' evaluations
Beta coefficients of linear regression Survival
conceptual axis
Sun light conceptual
axis
Strangle tree conceptual
axis Asphyxia
conceptual axis LSA survival dimension
.782** .245** .353** .257*
LSA sun light dimension
.089 .727** .028 .283**
LSA strangle tree dimension
.191* .067 .436** .269**
LSA asphyxia dimension
-.157 -.022 .153 .376**
Note: ** p < .01, * p < .05; the highest standardized regression coefficient is given in bold type
The highest beta standardized regression coefficient in each of the four
regressions is given in bold type in Table 2. The results show that the highest coefficient
in each of the regressions coincides with the predictor that theoretically contributes

most to account for the expert judge's score. The results are particularly clear in the
survival conceptual axis, where it can be seen that the LSA dimension that mentions
that concept is clearly a higher predictor than any of the other three dimensions. The
results are also clear for the sun light competition conceptual axis, where its respective
LSA dimension also captures and contributes to predicting those human judgments
better than any other one. As regards the third conceptual axis, its respective dimens ion
has the highest beta standardized regression coefficient. Where this association between
LSA dimension and its respective concept is least clear is in the last regression. In it, the
highest regression coefficient is also that of its conceptual axis, although the other three
conceptual axes are also statistically significant and there is not such a large difference
in the magnitude of the regression coefficients as in the other three regressions. It seems
thus that each LSA conceptual axis is sensitive to each conceptual axis in the experts'
judgment.
3.2.3 Capacity to discern whether it contains a specific content or not
Can the method detect which summaries contain a given conceptual axis and
which ones do not? Finally, we tried to find whether the new method implemented has
the capacity not only to globally assess a summary's quality in a reliable way, but also
the extent to which it detects the conceptual axes missing in a summary and those which
it does contain. This aspect is more related to the method's capacity to correctly instruct
a student who has not provided all the contents required in a summary. So the strength
of the method can also focus on its capacity to instruct and give feedback to students, in
addition to its capacity to provide a global score of a summary's quality that correctly
matches human judgments.
To this end, the regression models previously described were used, introducing
also a new predictor: the module or length of the summary's vector, as it is a predictor

that has always proven to be effective in summary assessment. In this case, the goal of
these regression was, rather than find, as before, the relative contribution of each
predictor to human judgments, to predict whether the student's summary contained the
content assessed or not. The goal, for example, for the first regression is to decide, using
the method proposed, whether a student's summary contains the survival strategy
conceptual axis, suitably described. To this end, the two judges dichotomized the scores
given in each content. Given that the scores in each of the four contents ranged from 0
to 2 points, it was decided that the summary would lack content if the score did not
reach 1.00. The prediction made by the linear regression was dichotomized in exactly
the same way. It was decided that if the predicted score did not exceed 1.00 points the
summary would lack the content assessed. The opposite would apply if the predicted
score exceeded 1.00 points.
Table 3. Predictions of the Inbuilt Rubric model with the correct predicted percentage and Kappa of Cohen reliability
Experts' classification
Survival
conceptual axis Sun light
conceptual axis Strangle tree
conceptual axis Asphyxia
conceptual axis
No Yes No Yes No Yes No Yes Inbuilt Rubric predicted
No 55 2 21 6 5 9 19 11
Yes 9 12 7 44 2 62 4 44 % correctly predicted by the model
85.9%
83.3%
85.9%
80.8%
Kappa .60** .64** .41** .58**
Note: ** p < .01, * p < .05
Results are shown in Table 3. Given the correct rating percentages, the results
are frankly good. Correct rating percentages exceed 80% in all cases. The Kappa indices
are close to 0.60, which is regarded as good by experts (Pardo & San Martín, 2010).
These results show that the Inbuilt Rubric method can be sound to provide feedback to
students pertaining to the gaps in their written answers. Other possibilities can also be

examined. For example, as well as deciding to find whether a summary contains a
specific content or not, a classification that is binary and too closed, the quality of a
specific content can be rated on a continuum, and decide on the basis of less strict
criteria, such as whether the content is included or not. It is easier to move along this
continuum than to make yes/no decisions, as students can be told to contemplate the
possibility that their summaries do not contain certain ideas in the conceptual axes
proposed in the rubric.
4. Study II: Application of the Inbuilt Rubric method to a method for automatic
assessment of discursive texts in a university sample
4.1 Objectives of study 2
In study 2, the techniques used in the controlled situation in study two were
applied in a virtual course in a distance learning environment at the Spanish National
Distance Education University (UNED). The purpose of this second study was to verify
whether the methodology proposed could be employed in an environment in a stable
manner, both technically and functionally. It was examined whether some type of
recognizable trajectory could be identified in the quality of the written answers
reviewed by the participants in a writing task in successive essays. To this end, an
online system was created to facilitate mass use of content feedback based on the
transformations described in study 1. To this end, a scenario of real use of the method
described in study 1 was generated. In addition, the degree of assistance which this
experience would have provided in the learning process was measured by means of a
final survey.
4.2 Material and methods
4.2.1 Participants
As part of the learning activities of the Educational Psychology course included
in the Psychology degree, students were asked to take part in a summarization task
based on some of the contents which they were to learn. 924 out of 2,530 students
decided to take part in this online activity. Of these, we considered for analysis the
results of 864 participants – those who completed a full task cycle comprising: (1)
drafting of the answer, (2) automatic assessment; (3) immediate feedback, (4) rewriting
the answer, (5) new automatic assessment, and (6) new immediate feedback. The 60
participants who failed to complete a full task cycle where excluded as outliers.
4.2.2 Material
The instructional text that served as the reading to conduct this study was
chapter 8 of the Spanish version of the book Cognitive Psychology and Instruction
(Bruning, Schraw & Norby, 2012), called "Problem-solving and critical thought".
4.2.3 Task
Because the application is implemented on the web, students only needed to
have their own computer, an Internet connection, and a browser. In this practice,
students were asked to carefully read the book chapter and told that they would be asked
a question about its content in a week (in this case, a summary with a limited number of
words). They were also told that they would have to use a feedback system to review
their answer (summary) and improve it; finally, they would have to submit the summary
that best fit the information received in the various feedbacks. The "acceptance area" for
a summary was determined by an area that had 10% of the values or elaboration levels
in the Conceptual Axes defined (see Study 1) for the task as its upper and lower levels.

The central point of this ideal elaboration level was defined as the score reached by the
Golden Summary prepared by three specialists in the subject (all three of whom held
PhDs in Educational Psychology) on said Conceptual Axes. In this case the proposed
subject for the summary was “Expertise in problem-solving”. The various aspects of
the selected subject (the text that students had to examine to write their summaries)
were scattered through the target text. This subject was intentionally chosen so that no
specific definition of it was to be found in the target text, although it was possible to
build one based on different sections of it. The summary’s ideal length ranged between
110 and 130 words, and the students were advised to keep their summaries within this
word range. Students were told that submission would be official and evaluated, thus
promoting motivation for good use. The following week they were told the question
which they would have to answer (make a summary) and the link to use to access the
feedback system to start the training. The application link was provided in the common-
use virtual course. It was available for three days. The minimum or maximum number
of text summaries which students could submit was not restricted. Because this was a
pilot study, the application conditions were not restricted so as not to harm performance
in answer quality. Thus, conditions of use were very variable and spontaneous as
regards an initial assessment of the method proposed.
4.3 Procedure
As was mentioned, the idea was to create a system that used the aforementioned
techniques (the transformation of some dimensions into concepts) and made it possible
to provide online feedback on the basis of the conceptual axes that constitute a rubric.
The components to build said system were the following:
4.3.1 Linguistic corpus
An Educational Psychology corpus composed of digitalized text books was used
as the training corpus. In order to enrich the corpus and with the purpose of covering
more generic topics we also included the Diagnostic and Statistical Manual of Mental
Disorders-IV (1994), and some psychological texts from International the Statistical
Classification of Diseases and Related Health Problems 10th Revision (CIE-10 in
Spanish, 2008), and other expository texts in the field of Psychology. This corpus was
processed by Gallito 2.0 (Jorge-Botana et al, 2013), which generated the latent semantic
space, US. This corpus was lemmatized in Spanish, and a minimum number of 7 term
occurrences was also required for representation in US. Occurrence matrix X was
softened by means of the Log-Entropy function (Nakov et al, 2001). The final
occurrence matrix was reduced to 250 dimensions. The final number of terms was
5,210, and that of documents 8,786.
4.3.2 Inbuilt Rubric Method
Four experts agreed on the rubric for the evaluation of the text proposed. This
Inbuilt Rubric was elaborated through an iterative procedure. Human experts
participated in the definition of the Conceptual Axes (four conceptual axes were also
selected a priori). Lexical descriptors for each axis were selected. These descriptors
were then validated taking into account their representation in LSA. Thus, if the
semantic representation of the descriptors was in the expected relation to the conceptual
axis, they were retained. However, if these descriptors were polysemic or if their
semantic representation did not correspond to the conceptual axis, they were discarded
and more suitable ones were sought. The way to validate descriptors consists in
extracting from the semantic space a list of the 100 terms most closely related to them
(i.e., the descriptors initially selected for each axis). Some descriptors in that list are
discarded and a few are included as terms in the axes. The process continues until the

selected descriptors make the axis correctly represent the expert’s idea in the semantic
space (the way to check this is to also extract lists of semantic neighbors).
For example, terms such as “cognitive” were discarded due to their ambiguity,
while more specific terms in relation to scaffolding, such as “social interaction” were
retained. So the process of Inbuilt Rubric construction can be seen as a result of
human/LSA collaboration (see Brew & Leacock, 2013). Using the lexical descriptor
chosen, the latent semantic space US was transformed into the new space C'. The entire
process of transformation of the latent semantic space was also carried out using Gallito
2.0 (Jorge-Botana et al, 2013).
4.3.3 Process of projection onto the transformed space
An online process inside Gallito 2.0 transforms the text enter by a student into a
vector first and then to project the vector onto the transformed space C' (so that the first
four dimensions in C' were meaningful and the remaining ones up to k were abstract).
After doing this, the feedback simply consisted in making visually explicitly the
summary scores in each of the four conceptual axes (see Figure 3 below). The
distribution of the scores of these four dimensions constitutes the pattern of the student's
summary.
4.3.4 Golden summary
The scores of an ideal summary drafted by an expert and agreed with by the
other three experts to establish an ideal area in which a student's text that correctly
covers each of the conceptual axes is expected to fall were used. The confidence area
was established by adding to and subtracting 10% of the ideal summary scores from
those scores (see Figure 3). The magnitude of the scores for the four conceptual axes
was not the same. Their importance depends on the space devoted to each conceptual
axis in the ideal summary and in any case was agreed by the four experts.
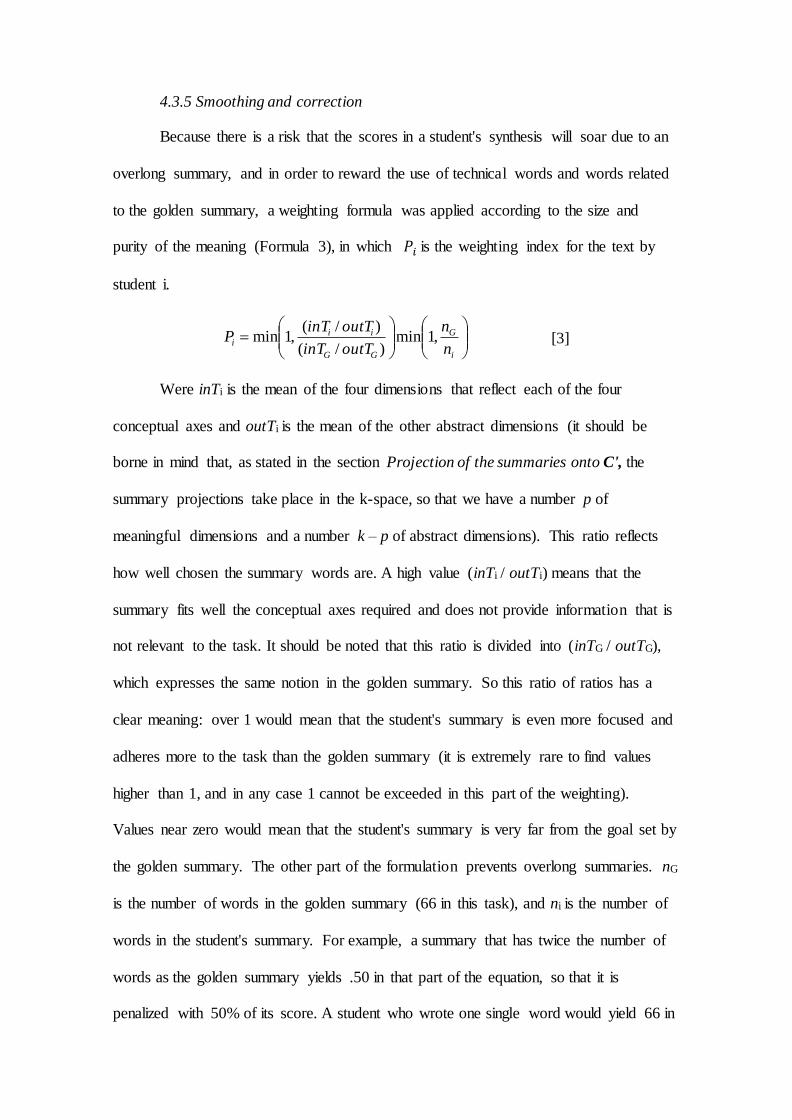
4.3.5 Smoothing and correction
Because there is a risk that the scores in a student's synthesis will soar due to an
overlong summary, and in order to reward the use of technical words and words related
to the golden summary, a weighting formula was applied according to the size and
purity of the meaning (Formula 3), in which 𝑃𝑖 is the weighting index for the text by
student i.
[3]
Were inTi is the mean of the four dimensions that reflect each of the four
conceptual axes and outTi is the mean of the other abstract dimensions (it should be
borne in mind that, as stated in the section Projection of the summaries onto C', the
summary projections take place in the k-space, so that we have a number p of
meaningful dimensions and a number k – p of abstract dimensions). This ratio reflects
how well chosen the summary words are. A high value (inTi / outTi) means that the
summary fits well the conceptual axes required and does not provide information that is
not relevant to the task. It should be noted that this ratio is divided into (inTG / outTG),
which expresses the same notion in the golden summary. So this ratio of ratios has a
clear meaning: over 1 would mean that the student's summary is even more focused and
adheres more to the task than the golden summary (it is extremely rare to find values
higher than 1, and in any case 1 cannot be exceeded in this part of the weighting).
Values near zero would mean that the student's summary is very far from the goal set by
the golden summary. The other part of the formulation prevents overlong summaries. nG
is the number of words in the golden summary (66 in this task), and ni is the number of
words in the student's summary. For example, a summary that has twice the number of
words as the golden summary yields .50 in that part of the equation, so that it is
penalized with 50% of its score. A student who wrote one single word would yield 66 in
i
G
GG
iii
n
n
outTinT
outTinTP ,1min
)/(
)/(,1min

the formula, as it would fall within the minimum of 1 and 66, and no penalty would be
applied (a one-word summary would have, however, a very low ratio (inTi / outTi), so it
would be penalized by this other part).
4.3.6 Memorization of the previous pattern
A process that memorizes that pattern of the previously entered text was also
implemented in the system. This is standard in analogous feedback systems (Kintsch et
al, 2007). In this way, a reference is provided for change, and the consequences of
changes in the text can be made visually explicit.
4.3.7 Scenario for use
The sequence for use was the following; students enter their summaries into a
text box provided in an online interface (see Figure 3 once again). This interface sends
the text to an application hosted in a server that projects the text onto a vector in the
transformed semantic space. In addition, the weighting formula is also calculated (see
Formula 3 below) on the basis of the size and topic. The golden summary vector is
preloaded in the server, in such a way that the scores in the space are not calculated with
every request to this server. Finally, the server returns to the interface application
(Figure 3) a list (in XML format) of the four coordinates or scores in the student's
summary and in the golden summary (represented as acceptance area), together with the
weighting index. In this way, the interface application displays a graph showing two
patterns, one for the student's text (continuous red line) and another one for the golden
summary. A third pattern is also displayed, showing the previous pattern of the student's
text (if the student has made a previous attempt, a dotted red line).

Figure 3. Feedback interface Text box where the summary is entered, pattern of the
student's text, acceptance area, and previous pattern entered by the student
4.4 Results of study 2
4.4.1 General descriptors and some outstanding results
Table 4 shows the main descriptive values of the total summaries, the number of
meaningful words in the answer given, that is, the number of open words (nouns, verbs,
adverbs, and adjectives) (it should be pointed out that that value of this variable for the
golden summary is 66 words). The cosine or semantic similarity between the summary
written in the first attempt and the ideal summary is also shown (a value ranging between

0 - no similarity - and 1 - maximum similarity). The cosine for the best attempt is also
shown, as well as the first attempt-best gain, which is the result of subtracting the cosine
of the best attempt from the value of the cosine in the first attempt.
Table 4. Descriptive values per student
Variables
Mean n
open
words
S.D.
Total number of essays 21.5 39.4
Number of words in the first essay* 63.5 34.9
Number of words in the best essay* 82.2 30.5
Cosine for the first essay .8606 .1123
Cosine for the best essay .9232 .0228
Initial essay – Best essay gain .6256 .1099
Note: N = 864 students; SD = standard deviation; * not including stop words
In order to analyze the apparent heterogeneity of the way in which participants
work, the 864 participants were divided into equal percentiles based on the cases
explored, with two cut-off points (33.3%) in the total number of attempts. The result was
that 313 made between 2 and 6 attempts (the feedback from the first attempt is given once
a second attempt is made), a second group of 275 subjects made between 7 and 17
attempts, and a third, more heterogeneous group, made between 18 and 53 attempts. It
was found that there were significant differences between the average number of words
in the three groups in the first attempt (F(2, 861) = 5,096; p < .001; partial ƞ2 = .01). In
turn, the first group (2 to 6 attempts) produced a significantly higher number of words in
the first attempt than the other two groups (first group mean 69.1 and third group mean
58.7, p < .05, and second group mean 65.3 and third group mean 58.7, p < .05). However,
the results for the Number of words in the best attempt variable, (F(2, 861) = .481; p =
n.s.), did not show differences between the three groups, that is, regardless of the init ia l
strategy, all three groups adjust their best answer to the length described in the instruct ions
for the task.

As regards the Cosine for the First attempt variable [Bonferroni post-hoc test
(F(2, 861) = 6.953; p < .001; partial ƞ2 = .02)], a significant difference was found between
group 1 (.8791) and 2 (.8532) (p < .05), in favor of the first one; another one between
group 1 (.8791) and 3 (.8469) (p < .005), also in favor of 1; and none between groups 2
(.8532) and 3 (.8469) (p = 1); which seems to highlight that the subjects that make a
smaller number of attempts (very possibly working in a more planned way) start their
series of assessments with a more elaborate initial answer, which is likely the result of
spending more time on effort on it, reflecting an offline intellectual work procedure. This
result underlines the importance of considering that planning is, from an instructiona l
point of view, also an important component of revision, as stressed in some recent models
of the writing process (MacArthur, 2007). These differences between work patters inside
or outside the system ecology have been informally observed in some studies (Van
Labeke, Whitelock, Field, Pulman, & Richardson, 2013).
As regards the Cosine for the best attempt variable [Bonferroni post-hoc test
(F(2, 861) = 29,199; p < .001; partial ƞ2 = .07)], the existence of a significant difference
in favor of group 2 (.9221) as opposed to 1 (.9171) (p < .05) should be pointed out; another
difference in favor of group 3 (.9310) also as opposed to group 1 (.9171) (p < .001); and
a third difference in favor of group 3 (.9310) as opposed to group 2 (.9221) (p < .001).
These data seem to show that the answer-building strategies based on massive use of the
automatic assessment tool achieve high semantic approaches to the golden summary.
However, the underlying work strategy seems to be closer to the trial-error heurist ics,
although oriented by the feedback received after every automatic assessment - this might
be called a work method based on successive online approaches.

As regards the Initial-Best Gain value or absolute increase in semantic similar ity
[Bonferroni post-hoc test (F(2, 861) = 13,906; p < .001; partial ƞ2 = .03)], the analysis
shows a significant difference between the average value of group 1 (.0380) and 2 (.0688)
(p < .005), in favor of the latter; another difference between group 1 (.0380) and 3 (.0840)
(p < .001), in favor of the latter; but not between groups 2 (.0688) and 3 (.0840) (p = .3).
These data seem to show again the differences between two work methods: one based on
a higher degree of reflection and initial elaboration of the answer; and another one, more
persevering and perfectionist, based on small gradual improvements, although perhaps
less reflexive as a whole, but with higher absolute gains.
Two important matters should be highlighted here: (1) the work methods freely
developed by the participating subjects, who, it should be remembered, were real
university students (in distance education) when faced with an equally real task, were
clearly productive, although due to their approach they significantly differ in terms of the
"effort made" / "result achieved" ratio; (2) the lack of differences found between groups
2 and 3, both in the Cosine for the first attempt variable and in the Initial-Best gain
value, can indicate the existence of a critical number of attempts that would define the
work strategy followed, above which some of the effects on the correctness of the answer
given disappear, however much the subject continues to persevere in the task in order to
improve.
Despite the existence of the work methods described, given the size of the
effects found, the effects, even if significantly different, must be seen as moderate.
4.4.2 Task adherence
One of the important factors to validate the functioning of an application is that
its use complies with what is required. In the case of feedback application, when several

attempts are made, in order to infer that use of those attempts is natural and productive,
each of the attempts must be somehow better than the previous ones. Put otherwise, the
fact that relatively stable learning curves can be modeled and that they express
adherence increases (understood as higher pattern similarity and lower gradual
penalization indexes) indicates that the feedback system (the instructions given by the
system, the expression of the conceptual axes, the expression of the change in score on
the basis of the previous pattern, the acceptance zone) has served as a guideline. These
curves would indirectly show that students understand the task and perform it in a
natural way, with no incidents. It is also obvious that task adherence and the
improvement in the summaries given by students due to the feedback received are
indicators of the effect of this task on the processes of non-superficial review of the text.
On the basis of this reasoning, two latent curve models (Bollen & Curran, 2006)
were adjusted to see if the task yielded a specific and recognizable trajectory in terms of
summary quality indicators in the successive attempts made by the subjects. This is a
crucial measurement to estimate its effectiveness in student review processes. Two
quality variables were used: Weighting and Cosine. Weighting (see formula 3)
measures the extent to which a student's summary is similar to the golden summary in
terms of its concision, use of suitable lexicon, and suitable number of words. It is
therefore an index that also reflects many qualities in the student's answers. It is an
index that ranges between 0 (extremely poor quality) and 1 (quality similar to that of the
golden summary). The cosine measures the semantic similarity between the student's
summary and the golden summary, so that it also ranges between 0 (poor quality) and 1
(good quality). Every additional attempt made by a student in this kind of task is
expected to be accompanied by an increase in summary quality.

Two growth models, a linear and a quadratic one, were adjusted for the first seven
attempts (57% of the sample - 525 subjects - made at least seven attempts). Full
maximum likelihood was used as an estimation method to handle the lost values. No
asymmetry or kurtosis values with an absolute value higher than 1 were found, which
justifies the use of this estimation method.
Attempts were made to adjust a linear growth model for both quality indicators, but the
goodness of fit indexes showed that trajectories did not fit linear growth. A quadratic
model was then tested, which displayed acceptable goodness of fit indexes for the
weighting quality indicator (χ2WEIGHTING(19) = 119.70, p < .001; CFI = .977, TLI = .975,
RMSEA = .076, SRMR = .061) and slightly less for the cosine (χ2COSINE (19) = 210.79,
p < .001; CFI = .949, TLI = .943, RMSEA = .104, SRMR = .172).
So as not to go on for too long and given that the cosine and the weighting are very
similar, we will now describe the quadratic trajectory model for the weighting quality
index. This was:
where PT is the weighting measurement expected of an average student in time t. It
should be noted that the latent curve models by agreement assign value 0 to the first
time (attempt), that is λT=0 = 0 (in such a way that according to the model a measure Pi =
.671 is expected in the first attempt), value 1 to the second time (attempt), λT=1 = 1, and
so on until value t – 1, λT=t = t – 1. In the model, α is the average intersection (the
average weighting in the first attempt), β1 is the average gradient associated with the
linear term, and β2 the average gradient associated with the quadratic term. The
trajectory is graphically displayed in Figure 4, together with the observed student
averages. The degree of overlap between the empirical curve and the modeled curve can
be seen:
)003.(029.671. 2
2
2
1 tttttP

Figure 4. Trajectory of the latent growth curve model (TR model) and empirical
trajectory (TR observed)
Note: number of attempts on the horizontal axis
The coefficients in the Weighting model were:
Table 5. Coefficients of the latent growth curve model
Est. E.T. Critical Ratio
α .671 .006 118.38 β1 .029 .003 10.40 β2 -.003 .000 -7.60 S2
α .021 .001 15.12 S2
β .003 .000 8.83 S2
γ .000 .000 6.94
The variances in the model parameters were statistically significant, as can be
seen in Table 5. So, even though the type of trajectory is stable (in task adherence,
which is quadratic), variances show that there are individual differences in terms of
intersection α (differences in the quality of the first attempt) and in gradients β
(differences in the speed of adherence). This confirms what was previously described in
the descriptive results, which suggested different ways to approach the task.
4.4.3 Rating of the degree of assistance in personal study

All participants were asked the same question: “To what extent did you find the
activity helpful when studying the subject?” The question was posed on a 0 (minimum)
to 5 (maximum) scale. Graph 5 displays the results. The results were highly positive.
85% of students gave scores of 3, 4, and 5, taken as indicators of a high degree of
helpfulness; and 64% of all answers gave the two maximum values. This means that
students perceive the task, and consequently the feedback received, as correct and
useful, which leads us to think that the method helps them to write their answers and
ultimately to orient their study and learn, although the method must still be tested on
more controlled texts and contexts.
Figure 5. Ratings satisfaction percentages
5. Conclusions
We have presented a brief description and some promising results on the use of a
new method called Inbuilt Rubric, based on LSA, for assessing students' summaries and
giving feedback about them. This method involves a transformation (via a change of basis
and reorthogonalization) of the original latent semantic space into a new one that is non-

latent in nature. This new space is non-latent because its first dimensions are meaningful.
In particular, such dimensions represent the conceptual axis of an academic rubric.
Inbuilt Rubric has been shown to probably be a more reliable (more comparative studies
in addition to this one are required) and an economic assessment method for the kind of
summarization task used in our studies than the traditional Latent Space Instruments (e.g.,
golden summary, partial golden summaries methods or pregraded summaries as an
external measure of the summary quality). Its relationship to human judges’ scores of
student produced summaries is higher (.82 as compared to .66); this is also shown by our
regression equations. This has been further proved through the results of the scatter plots
comparing human judges, Golden Summary and Inbuilt Rubric. As for the ability to
provide feedback about the conceptual axes in a summary, this method displays
significant equivalence with the experts' judgments.
One of the main implications of the method process is that it makes it much easier
to identify contents. Classic procedures, such as Summary Street (Kintsch et al., 2007),
require comparing the student's summary to partial golden summaries or statements that
express those conceptual axes. May be, this involves longer writing times and problems
regarding the quantity and sampling of the text to be collected in order to represent each
concept. In Inbuilt Rubric this task is much simplified, as those axes are captured in the
semantic space coordinates, given that the new semantic space contains a rubric in some
of its dimensions. In this way, deciding whether the summary has sufficiently covered a
conceptual axis or not is a simple task. Because every axis in the rubric is represented in
a dimension in the summary vector, it suffices to compare that vector to another one
representing a golden summary. This golden summary in turn contains the ideal rubric in
its dimensions.
This idea was implemented in the second study by means of an online system in
which 864 university students summarized a textbook chapter. The system offered visual
feedback in which students can see whether their summary correctly captures each
conceptual axis in the rubric with respect to an ideal range imposed by a golden summary.
In this second study, students had the possibility of rewriting their summary as many
times as they wished, and the visual feedback was provided again in each attempt. When
they believed that the summary they had written was good enough, they would submit it.
The results regarding use showed that students naturally performed the task, as their
performance displayed an upward trajectory, which was expected if the feedback system
helped to improve students' summaries. Finally, when asked about the degree in which
this task had helped them to learn about the subject, 85% of students answered that it had
helped in a high or very high degree. This is a valuable result given that at univers ity,
high school or in massive open online courses there exists a strong demand by teachers
for automatic scoring or giving feedback on student essays (Balfour, 2013).
As a final conclusion, it should be pointed out that both the Inbuilt Rubric system
and the system applied to a real situation are easy to implement, as the procedure does
not require time to extract partial text samples to provide feedback, and has proven
reliable to identify content quality. However, two things should be taken into account: a)
firstly, the descriptor selection task for each axes requires practice; b) secondly, because
the rubric is included in the space dimensions, every object of assessment must have its
own semantic space, and thus take up more RAM memory in the computer equipment. In
any case, current computer equipment has sufficient capacity to host many spaces
coexisting simultaneously. Generally, automatic assessment methods work in expository

texts. Inbuilt Rubric method would be especially sensible to narrative texts. Building a
rubric in narrative text and implementing it in LSA model is undoubtedly a challenge. In
the future, it may be necessary to consider two main aspects: firstly, it is important to
standardize the parameters to create the rubric into the LSA model (e.g., number of
descriptors per conceptual axe, take into account the length of the summaries or essays,
or to relate the rubric with golden summaries as in the study 2). Secondly, it is also
important to incorporate psychometric properties in automatic open-ended assessment
(i.e., reliability, content validity or, fundamentally, study the factor structure via
confirmatory factor analysis to validate measurement models).
References
American Psychiatric Association (1994). Diagnostic and Statistical Manual of
Mental Disorders (4th ed) Washington, DC: American Psychiatric Association.
Balfour, S. P. (2013). Assessing writing in MOOCs: Automated Essay Scoring
and Calibrated Peer Review. Research & Practice in Assessment, 8, 40–48.
Brew, C., & Leacock, C. (2013). Automated short answer scoring. In Shermis, M.
& Burnstein, J. (Eds.), Handbook of automated essay evaluation: Current applications
and new directions (pp. 136-153). New York, Routledge.
Bollen, K.A., & Curran, P.J. (2006). Latent curve models: A structural equation
approach. Hoboken, NJ: Wiley.
Bruning, R.H., Schraw, G.J. & Norby, M.N. (2012). Psicología Cognitiva y de la
Instrucción (5th Ed.). Madrid: Pearson.
Burstein, J., Kukich, K., Wolff, S., Lu, C., & Chodorow, M. (1998). Enriching automated scoring using discourse marking. In Proceedings of the Workshop on
Discourse Relations and Discourse Marking, 36th Annual Meeting of the Association for Computational Linguistics, (pp. 15–21). Montreal, Canada.
Dessus, P., & Lemaire, B. (1999). Apex, un système d’aide à la prèparation
d’examens [Apex, a system to assist in the preparation of exams]. Sciences et
Techniques Èducatives, 6(2), 409-415.
Deerwester, S., Dumais, S., Landauer, T.K., Furnas, G., Harshman, R. (1990).
Indexing by Latent Semantic Analysis. JASIS, 41, 6, 391-407.

Dronen, N., Foltz, P. W., & Habermehl, K. (2014). Effective sampling for large-
scale automated writing evaluation systems. arXiv preprint arXiv:1412.5659
Fitzgerald, J. (1987). Research on revision in writing. Review of Educational
Research, 57, 481-506.
Foltz, P., Streeter, L., Lochbaum, K. & Landauer, T. (2013). Implementation and
Applications of the Intelligent Essay Assesor. In M.D. Shermis & J. Burstein (Eds.),
Handbook of Automated Essay Evaluation. NY: Routledge.
Foltz, W., Gilliam, S., & Kendall, S. (2000). Supporting content-based feedback
in on-line writing evaluation with LSA. Interactive Learning Environments, 8, 111-128.
Foltz, P., Laham, D. & Landauer, T. (1999a). Automated Essay Scoring:
Applications to Educational Technology. Proc. ED-MEDIA '99. Seattle.
Foltz, P., Laham, D. & Landauer, T. (1999b). The intelligent essay assessor:
Applications to educational technology. Interactive Multimedia Electronic Journal of
Computer-Enhanced Learning, 1 (2).
Franzke, M., Kinstch, E., Caccamise, D., Johnson, N. & Dooley, S. (2005).
Summary Street: Computer support for comprehension and writing. Journal of
Educational Computing Research, 33, 53-80.
Graesser, A., Wiemer-Hastings, P., Wiemer-Hastings, K., Harter, D., Person, N., &
the Tutoring Research Group (2000). Using Latent Semantic Analysis to evaluate the contributions of students in AutoTutor. Interactive Learning Environments, 8(2), 129–
147. Graham, S. (2006). Writing. In P.A. Alexander and P.H. Winne (Eds.), Handbook
of Educational Psychology. Mahwah, NJ: Erlbaum.
Haley, D., Thomas, P., Petre, P., & De Roeck, A. (2007). Seeing the whole picture: Comparing computer assisted assessment systems using LSA-based systems as an example. (Technical Report Number 2007/07). United Kingdom: Open University.
Hayes, J.R. & Flower, L.S. (1986). Writing research and the writer. American
Psychologist, 41, 1106-1113. Hu, X., Cai, Z., Wiemer-Hastings, P., Graesser, A. C., & McNamara, D. S. (2007).
Strengths, limitations, and extensions of LSA. In T. K. Landauer, D. S. McNamara, S. Dennis, & W. Kintsch (Eds.), The handbook of latent semantic analysis (pp. 401-426).
Mahwah, NJ: Erlbaum. Kakkonen, T. & Sutinen, E. (2004). Automatic Assessment of the Content of Essays
Based on Course Materials. In Proceeding on the International Conference on Information Technology: Research and Educations (pp. 126–130). London. UK.

Kakkonen, T., Sutinen, E., & Timonen, J. (2005). Applying Validation Methods for
Noise Reduction in LSA-based Essay Grading. WSEAS Transactions on Information Science and Applications, 9(2), 1334-1342, 2005.
Kintsch, E., Caccamise, D., Franzke, M., Johnson, N. & Dooley, S. (2007).
Summary Street: Computer-Guided Summary Writing. In T. K. Landauer, D. McNamara,
S. Dennis & W. Kintsch (Eds.) The handbook of Latent Semantic Analysis. Mahwah, NJ: Erlbaum, pp. 263-277.
Kintsch, E., Steinhart, D., Stahl, G. & LSA research group. (2000). Developing
Summarization Skills through the Use of LSA-Based Feedback. Interactive Learning
Environments, 8(2), 87-109.
Klein, R., Kyrilov, A., & Tokman, M. (2011, June). Automated assessment of short free-text responses in computer science using latent semantic analysis. In Proceedings of the 16th annual joint conference on innovation and technology in computer science
education (pp. 158-162). ACM
Kontostathis, A., & Pottenger, W.M. (2006). A framework for understanding Latent Semantic Indexing (LSI) performance. Information Processing & Management, 42, 56–73.
Jorge-Botana, G., Olmos, R., & Barroso, A., I. (2013, July). Gallito 2.0: a Natural
Language Processing tool to support Research on Discourse. In Proceeding Twenty-third Annual Meeting of the Society for Text and Discourse, Valencia.
Landauer, T. K. & Dumais, S. (1997). A solution to Plato’s problem: the latent semantic analysis theory of the acquisition, induction, and representation of knowledge.
Psychological Review, 104: 211–40. Landauer, T. K., Foltz, P. W., & Laham, D. (1998). An introduction to latent
semantic analysis. Discourse processes, 25(2-3), 259–284.
León, J. A. & Santillana Reseach Group, (2004). La competencia lectora y los procesos de comprensión. Un proyecto de investigación basado en la evaluación de los tipos de comprensión. Memoria de investigación.
MacArthur, C.A. (2007). Best Practices in Teaching Evaluation and Revision. In S.
Graham, C.A. MacArthur & J. Fitzgerald (Eds.) Best Practices in Writing Instruction (pp. 141–162). New York: The Guilford Press.
Magliano, J. P., & Graesser, A. C. (2012). Computer-based assessment of student-constructed responses. Behavior Research Methods, 44(3), 608–621.
McNamara D. (2011). Computational methods to extract meaning from text and
advance theories of human cognition. Topics in Cognitive Science, 3(1), 3–17.
Millis, K., Magliano, J., Wiemer-Hastings, K., Todaro, S., & McNamara, D. S.
(2007). Assessing and Improving Comprehension with Latent Semantic Analysis. In Landauer, T. K., McNamara, D., Dennis, S., and Kintsch, W. (eds), The Handbook of Latent Semantic Analysis. Mahwah, NJ: Erlbaum, pp. 207–25.

Nakov, P., Popova, A., & Mateev, P. (2001, September). Weight functions impact
on LSA performance. In Proceedings of the EuroConference Recent Advances in Natural Language Processing (RANLP’01) (pp. 187–193). Tsigov Chark, Bulgaria:
Bulgarian Academy of Sciences (BAS) and The Bulgarian Association for Computational Linguistics.
Olmos, R., Jorge-Botana, G., León, J. A., & Escudero, I. (2014). Transforming Selected Concepts Into Dimensions in Latent Semantic Analysis. Discourse Processes,
51:5-6, 494–510. Pan American Health Organization (2008). International Classification of Diseases
and Related Health Problems - 10th Ed. (ICD-10). World Health Organizat ion, Washington D.C. (USA).
Pardo, A., & San Martín, R. (2010). Análisis de datos en ciencias sociales y de la
salud II. Madrid. Síntesis.
Pianko, S. (1979). A description of the composing process of college freshman
writers. Research in the Teaching of English, 13, 5-22. Schneider, D.M., Steeg, M., & Young, F.H. (1987). Linear Algebra: A Concrete
Introduction. 2nd ed.). New York, NY: Simon and Schuster Books.
Shermis, M. D., Koch, C. M., Page, E. B., Keith, T. Z., & Harrington, S. (2002). Trait ratings for automated essay grading. Educational and Psychological Measurement, 62(1), 5-18.
Van Labeke, N., Whitelock, D., Field, D., Pulman, S. & Richardson, J. T. (2013,
Jul). What is my essay really saying? Using extractive summarization to motivate reflection and redrafting. In Proceedings of the AIED Workshop on Formative Feedback in Interactive Learning Environments. Memphis, TN.
Visinescu, L., L. & Evangelopoulos, N. (in press). Orthogonal rotations in latent
semantic analysis: An empirical study. Decisions Support Systems.