Embed Size (px)
Citation preview
CONNECTING SOUTHAMPTON CITY REGION TRANSFORMING CITIES FUND STRATEGIC OUTLINE BUSINESS CASE
a
CONNECTING SOUTHAMPTON CITY REGION TRANSFORMING CITIES FUND STRATEGIC OUTLINE BUSINESS CASE
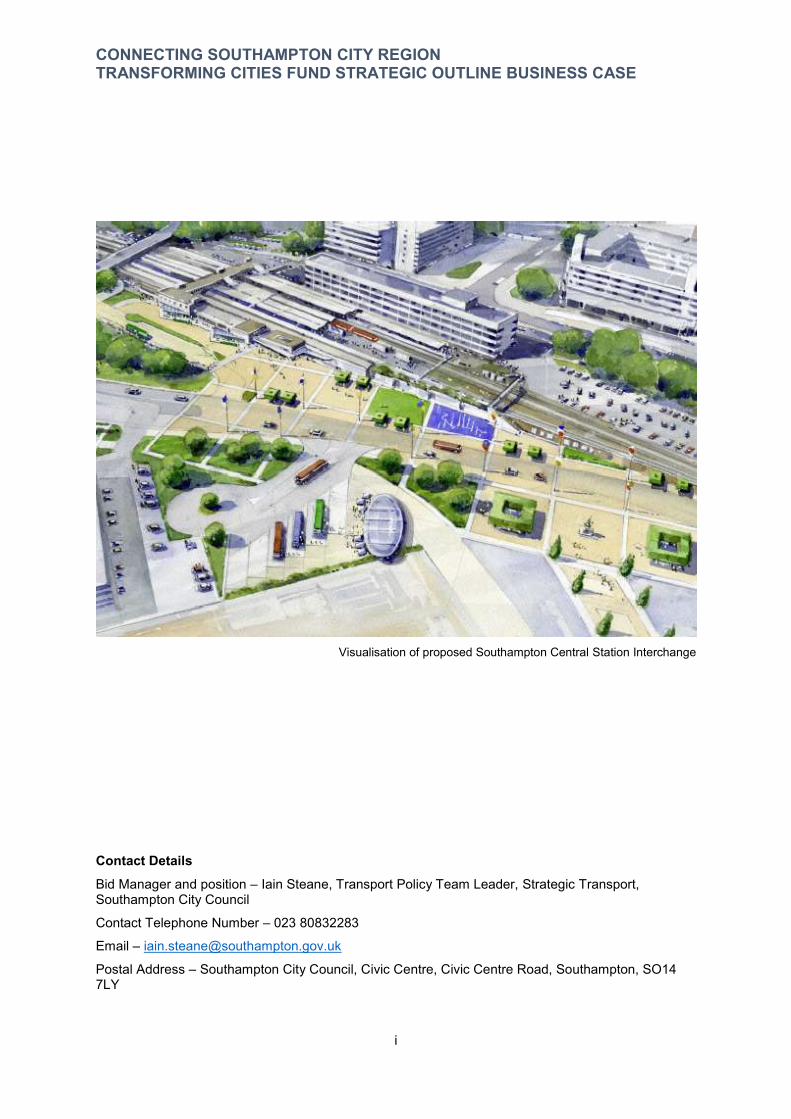
Visualisation of proposed Southampton Central Station Interchange
Contact Details Bid Manager and position – Iain Steane, Transport Policy Team Leader, Strategic Transport, Southampton City Council
Contact Telephone Number – 023 80832283
Email – [email protected]
Postal Address – Southampton City Council, Civic Centre, Civic Centre Road, Southampton, SO14 7LY
i
CONNECTING SOUTHAMPTON CITY REGION TRANSFORMING CITIES FUND STRATEGIC OUTLINE BUSINESS CASE
Foreword We have bold ambitions to deliver sustainable growth and better connectivity across the Southampton City Region. The Transforming Cities Fund (TCF) will play a vital part in supporting this vision.
This investment will be a catalyst for change in people’s everyday commuting habits and is strategically aligned to the goals set out in the City Council’s Green City Charter, the Hampshire 2050 vision and the Climate Emergency recently declared by the County Council.
Our planned programme of major investment will transform transport infrastructure in a focussed way, rethinking how we use road space ensuring it works for everyone and ensuring the City Region is fit for the future.
Our key plans include an enhanced bus travel experience, a high-quality network of cycle routes and liveable neighbourhoods where active travel is a safe and attractive choice. Together, these will contribute to our long term aims of reducing congestion, improving air quality, enhancing health and wellbeing and boosting economic growth.
We have made excellent progress on delivering a number of our TCF Tranche 1 schemes and these are already improving how people connect to places of employment and local facilities in Southampton and Hampshire.
We have been working closely with key stakeholders to finalise our bid for TCF and we are pleased to advise we have their full backing and support.
Together we jointly commend this bid to the Department for Transport, confident that the investment through TCF will make a real difference to the quality of people’s lives, how they travel to work and the environment they live and work in.
Cllr Jacqui Rayment Cllr Rob Humby Cabinet Member for Transport & Place Executive Member for Environment &
Transport Southampton City Council Hampshire County Council
ii

CONNECTING SOUTHAMPTON CITY REGION TRANSFORMING CITIES FUND STRATEGIC OUTLINE BUSINESS CASE
Executive Summary Cities across England require a transformation to their transport networks to support major changes in how people get around. This is needed to boost productivity, reduce inequalities and reduce road transport emissions, and the Southampton City Region is no exception. Southampton City Council (SCC) and Hampshire County Council (HCC) have made steps towards this change through partnership working with bus operators, delivery of strategic cycle corridors, co-design of residential streets, and behaviour change work over a number of years to promote sustainable travel. However, additional investment is required to deliver the transformational vision developed by SCC and HCC.
The TCF Programme of investment in sustainable transport outlined in the Strategic Outline Business Case (SOBC) is scalable and will support sustainable economic growth in the Southampton City Region.
The aims of the programme are to transform people’s mobility by offering them better alternatives to the car. This re-imagining of travel will see a clear shift to more multi-modal journeys with the bus and cycle placed centre stage, connecting the places where people live with the main employment areas.
By focusing on enhancing connectivity along the five most critical radial corridors, people’s journeys will be improved, and congestion reduced. This will reduce dependence on the private car, thereby
iii
CONNECTING SOUTHAMPTON CITY REGION TRANSFORMING CITIES FUND STRATEGIC OUTLINE BUSINESS CASE
enabling transformational change in the City Centre, other key towns and across residential neighbourhoods.
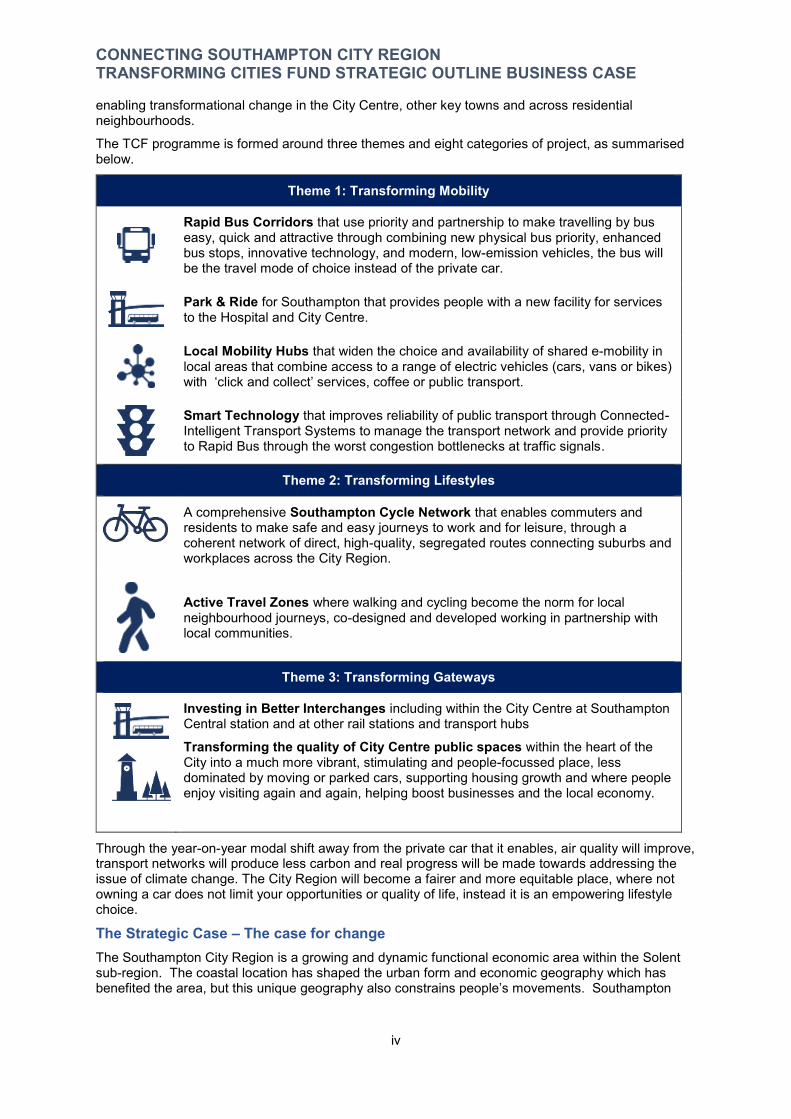
The TCF programme is formed around three themes and eight categories of project, as summarised below.
Theme 1: Transforming Mobility
Rapid Bus Corridors that use priority and partnership to make travelling by bus easy, quick and attractive through combining new physical bus priority, enhanced bus stops, innovative technology, and modern, low-emission vehicles, the bus will be the travel mode of choice instead of the private car.
Park & Ride for Southampton that provides people with a new facility for services to the Hospital and City Centre.
Local Mobility Hubs that widen the choice and availability of shared e-mobility in local areas that combine access to a range of electric vehicles (cars, vans or bikes) with ‘click and collect’ services, coffee or public transport.
Smart Technology that improves reliability of public transport through Connected-Intelligent Transport Systems to manage the transport network and provide priority to Rapid Bus through the worst congestion bottlenecks at traffic signals.
Theme 2: Transforming Lifestyles
A comprehensive Southampton Cycle Network that enables commuters and residents to make safe and easy journeys to work and for leisure, through a coherent network of direct, high-quality, segregated routes connecting suburbs and workplaces across the City Region.
Active Travel Zones where walking and cycling become the norm for local neighbourhood journeys, co-designed and developed working in partnership with local communities.
Theme 3: Transforming Gateways
Investing in Better Interchanges including within the City Centre at Southampton Central station and at other rail stations and transport hubs
Transforming the quality of City Centre public spaces within the heart of the City into a much more vibrant, stimulating and people-focussed place, less dominated by moving or parked cars, supporting housing growth and where people enjoy visiting again and again, helping boost businesses and the local economy.
Through the year-on-year modal shift away from the private car that it enables, air quality will improve, transport networks will produce less carbon and real progress will be made towards addressing the issue of climate change. The City Region will become a fairer and more equitable place, where not owning a car does not limit your opportunities or quality of life, instead it is an empowering lifestyle choice.
The Strategic Case – The case for change The Southampton City Region is a growing and dynamic functional economic area within the Solent sub-region. The coastal location has shaped the urban form and economic geography which has benefited the area, but this unique geography also constrains people’s movements. Southampton
iv

CONNECTING SOUTHAMPTON CITY REGION TRANSFORMING CITIES FUND STRATEGIC OUTLINE BUSINESS CASE
doesn’t have 360° access meaning people coming into the City Centre are funnelled along a limited number of corridors and bridges.
There is a current workday population of 445,000 and is focused on the City of Southampton and extends into Hampshire incorporating Totton, the Waterside (area of New Forest along Southampton Water), Chandler’s Ford, Eastleigh, Hedge End and Hamble.
A Growing City Region is being constrained by congestion and delays Significant growth in homes and employment space is planned and overcoming constraints within the transport network is essential for that to succeed. An additional 42,000 dwellings and 472,000m2 of employment space are planned across the Region. This is projected to create an additional 159,000 extra trips per day across the network, potentially leading to further journey time unreliability and congestion on the network if improvements are not made. Traffic congestion could result in 21% fewer jobs created if no investment is made.
The Port of Southampton is currently the UK’s third busiest port, with plans to double throughput by 2036. It is the largest for exports to non-EU markets, worth £71bn and employs 5,000 people. Annually, 34.4m tonnes of cargo passes through it, including over 900,000 vehicles and 1.9m containers (TEUs) in a 365 day 24 hour operation. It is also the UK’s premier cruise port handling over 85% of UK cruise patronage with 1.64m passengers on 450 vessel calls per annum. Southampton is also a gateway to the Isle of Wight with 5m ferry passenger movements a year.
Securing the growth of the Port, and supporting its contribution to the wider UK economy, is reliant on reducing pressure on the strategic road network.
Weak connections between residential areas and workplaces add to congestion levels and lower productivity The biggest employer in the city and a regionally important teaching hospital is the University Hospital Southampton, based in the North West of the city employing 11,500 staff. The Port and port-related industries are also a major employer. Universities in the North and Central parts of the city have a combined student population of over 40,000, and a number of UK and international companies are headquartered or have major operations throughout the Region - including ABP, Ageas, Aviva, B&Q, Carnival, Garmin, GE Aviation, IBM and Quilter plc (formerly Old Mutual Wealth). A number of these larger employers are in less accessible non-City Centre locations including Chandlers Ford, Hounsdown and Hamble, resulting in very car-centric, de-agglomerated commuting patterns.
The urban spread and economic differences between Southampton and the rest of the City Region have resulted in complex travel patterns, high proportions of car based trips, and lower self-containment within local authorities. Over two-thirds of all journeys to work are by car. In Southampton, self-containment has decreased since 2001 with almost 54% of workers living and working in Southampton and many people commute out of the city for work, as commute in each day. The largest two-way flow is between Southampton and Eastleigh Borough with 23,931 trips each day – the highest cross-boundary commuting flow in the wider Solent area. There is great potential to improve the level of containment in each area – the level of self-containment within the City Region is 77%. Growing accessible central hubs with excellent access by sustainable modes is crucial to improving containment.
The distance between employment sites is linked to the productivity gap. Difficulties accessing employment opportunities and increasing congestion have been cited as barriers to growth by businesses. There is considerable difference between GVA per head for a resident in Southampton compared to rest of the City Region and the wider South East. Parts of the City Region are among the top decile of deprived areas in England, with 30% of households not owning vehicles. The City Region’s productivity is 4.6% lower than the South East average and Southampton’s productivity is 16.6% lower. The Solent LEP has made increasing productivity levels a priority for their emerging Local Industrial Strategy.
To address inhibited connectivity, bus journey times and reliability must be improved Bus use is growing year on year within Southampton, with over 21m journeys annually, but commuting by public transport remains relatively low at 9%. Growth in bus use is aided by a successful voluntary bus partnership delivering fleet investment, innovation, and interchange improvements. Most corridors enjoy high bus frequencies, however, worsening congestion has
v

CONNECTING SOUTHAMPTON CITY REGION TRANSFORMING CITIES FUND STRATEGIC OUTLINE BUSINESS CASE
resulted in journey times getting longer, jeopardising this growth. In addition, bus journey times can be long when compared to car – from Fair Oak to the City Centre takes over an hour and a quarter by bus compared to around 40 minutes by car. Journeys can also be variable with peak time congestion adding almost 9 minutes to one service’s running time.
Future growth is projected to see 159,000 more highway trips made each day across the network by 2036, which could result in increased patronage on public transport, or the road network put under further pressure from more vehicles. Although predictions indicate that public transport trips will rise, continued congestion, delay, and increased journey times could mean that bus patronage decreases.
Better access to employment by bus and safe cycle routes would improve quality of life Access to employment is critical to everyone, but especially to people who are currently unemployed or lower socio-economic status. Pockets of deprivation in the outskirts of Southampton City or Blackfield in the Waterside are also associated with lower rates of access to a car, and higher rates of obesity and poor health outcomes. Reliable journey times for buses are critical for those in precarious employment who cannot be late to work, and safe cycle routes are essential for those doing shift-work at a logistics hub that doesn’t have late-night or early-morning bus services.
There are financial costs associated with the greater levels of ill health of people living near roads with poor air quality, increased social care costs from increased loneliness within older populations, economic hardship for people who can’t afford to travel to work, but there are additionally costs to people’s quality of life. The TCF Programme aims to address these costs to quality of life, as well as to boost productivity.
The four strategic challenges that the City Region is facing, and needs to address through transforming transport in TCF in order to realise its full economic potential are summarised below:
The proposed Southampton City Region TCF Programme of investment would address all these strategic challenges. Transformational transport investment would:
Unlock a wide range of connectivity benefits to support new development growth, Improve access to the main areas of employment and training, Provide opportunities for all residents, and Create a better quality of life.
Creating transformational change to secure sustainable economic growth for all The Programme is focused on five corridors and the City Centre. The corridors link from the City Centre to the surrounding employment areas, towns and villages that make up the wider City Region.
vi
CONNECTING SOUTHAMPTON CITY REGION TRANSFORMING CITIES FUND STRATEGIC OUTLINE BUSINESS CASE
These key corridors for people travelling between home and work have been selected as they meet multiple criteria. They carry significant amounts of traffic, and as a result, suffer from congestion, unreliability and poor air quality. In addition, they are major public transport and active travel corridors with potential for growth. The City Centre acts as the hub for all these corridors connecting them together as the economic, cultural and leisure focus for the City Region.
This corridor and City Centre approach will address access to employment opportunities, reduce congestion and transport emissions, support healthier lifestyles, deliver the sustainable growth ambitions of the City Region, and improve quality of life.
The Southampton TCF Programme The Programme will seek to deliver 45 individual but complementary schemes, falling within one of the three TCF themes outlined on page iv, and geographically focused on the five corridors and within the City Centre.
Our TCF programme has been developed with three funding scenarios of High, Medium and Low. These scalable variants aim to dramatically transform and improve the quality and availability of transport connections by incrementally delivering holistic corridors along them and in the City Centre.
The corridors were identified based on the scale of future growth envisaged, current traffic conditions, connectivity potential, environmental considerations, potential for modal shift, and future proofing. A consideration was also how the completeness of schemes in the preceding scenario or if schemes are being delivered as part of Tranche 1 or other works. This would ensure that holistic schemes can be delivered to achieve the maximum benefit. The geographical extent of the corridors were considered, with corridors potentially not extending to their full extent.
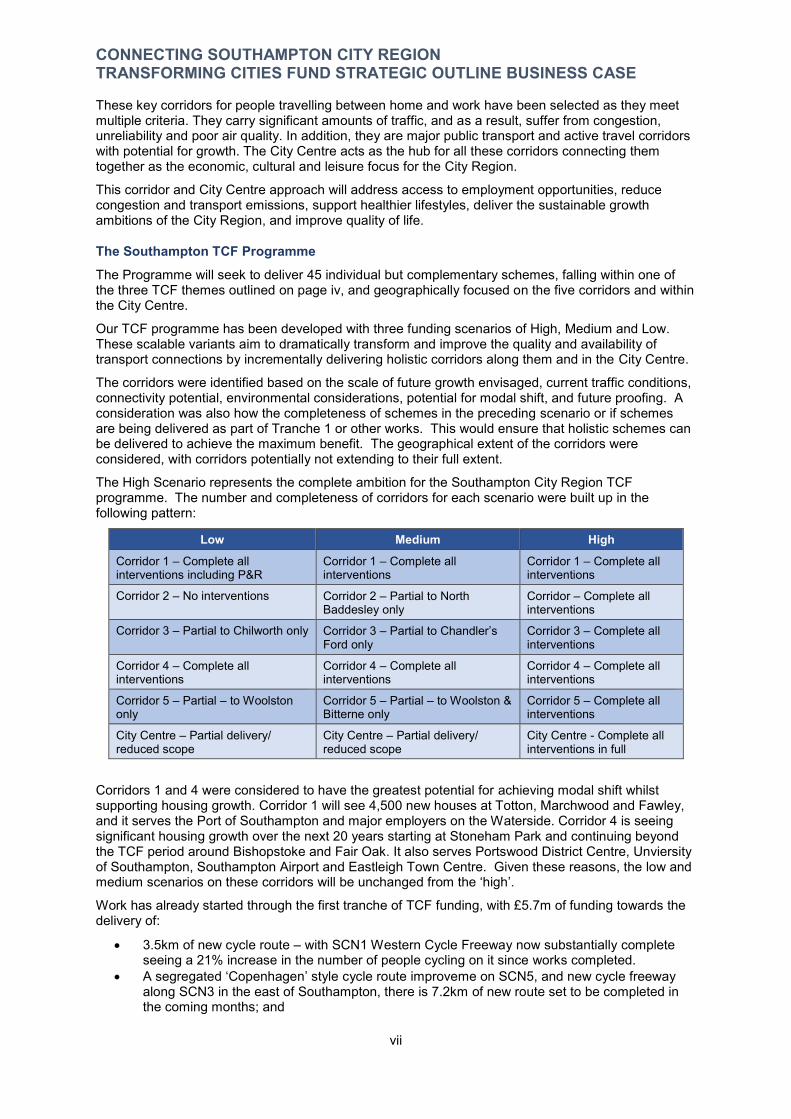
The High Scenario represents the complete ambition for the Southampton City Region TCF programme. The number and completeness of corridors for each scenario were built up in the following pattern:
Low Medium High
Corridor 1 – Complete all interventions including P&R
Corridor 1 – Complete all interventions
Corridor 1 – Complete all interventions
Corridor 2 – No interventions Corridor 2 – Partial to North Baddesley only
Corridor – Complete all interventions
Corridor 3 – Partial to Chilworth only Corridor 3 – Partial to Chandler’s Ford only
Corridor 3 – Complete all interventions
Corridor 4 – Complete all interventions
Corridor 4 – Complete all interventions
Corridor 4 – Complete all interventions
Corridor 5 – Partial – to Woolston only
Corridor 5 – Partial – to Woolston & Bitterne only
Corridor 5 – Complete all interventions
City Centre – Partial delivery/ reduced scope
City Centre – Partial delivery/ reduced scope
City Centre - Complete all interventions in full
Corridors 1 and 4 were considered to have the greatest potential for achieving modal shift whilst supporting housing growth. Corridor 1 will see 4,500 new houses at Totton, Marchwood and Fawley, and it serves the Port of Southampton and major employers on the Waterside. Corridor 4 is seeing significant housing growth over the next 20 years starting at Stoneham Park and continuing beyond the TCF period around Bishopstoke and Fair Oak. It also serves Portswood District Centre, Unviersity of Southampton, Southampton Airport and Eastleigh Town Centre. Given these reasons, the low and medium scenarios on these corridors will be unchanged from the ‘high’.
Work has already started through the first tranche of TCF funding, with £5.7m of funding towards the delivery of:
3.5km of new cycle route – with SCN1 Western Cycle Freeway now substantially complete seeing a 21% increase in the number of people cycling on it since works completed.
A segregated ‘Copenhagen’ style cycle route improveme on SCN5, and new cycle freeway along SCN3 in the east of Southampton, there is 7.2km of new route set to be completed in the coming months; and
vii
CONNECTING SOUTHAMPTON CITY REGION TRANSFORMING CITIES FUND STRATEGIC OUTLINE BUSINESS CASE
Upgrades to traffic signals to improve journeys for people travelling by bus on A3024 Bursledon Road and around A335 Stoneham Way.
The Economic Case – Value for Money To demonstrate value for money (VfM) of the Southampton TCF Programme, modelling and appraisal has been carried out to assess the transport user benefits and some wider economic impacts where this was deemed appropriate and proportionate to do so.
The transport impacts of each of the three TCF scenarios (High, Medium and Low) were monetised across a 60-year appraisal period. The Solent Sub-Regional Transport Model (SRTM) – a multi-modal transport model covering the whole Solent area has been utilised.
The transport impacts were monetised in accordance with DfT’s Transport Analysis Guidance (TAG) and informed by discussions with DfT Economists and Modellers throughout the co-development process.
We have iteratively refined our economic appraisal outputs and the schemes included in each of the three scenarios. Transport modelling has been used to pinpoint junctions where significant highway disbenefits were forecast to occur. This in turn has enabled revised junction layouts to be developed with signal phasing that optimises traffic flows, ensuring that the highway disbenefits forecast by the SRTM have reduced.
Since June, Level 2 impacts have been monetised and included within the calculation of the adjusted BCRs presented above. The levels of benefits forecast to be realised have increased.
The main findings from the economic appraisal work carried out are:
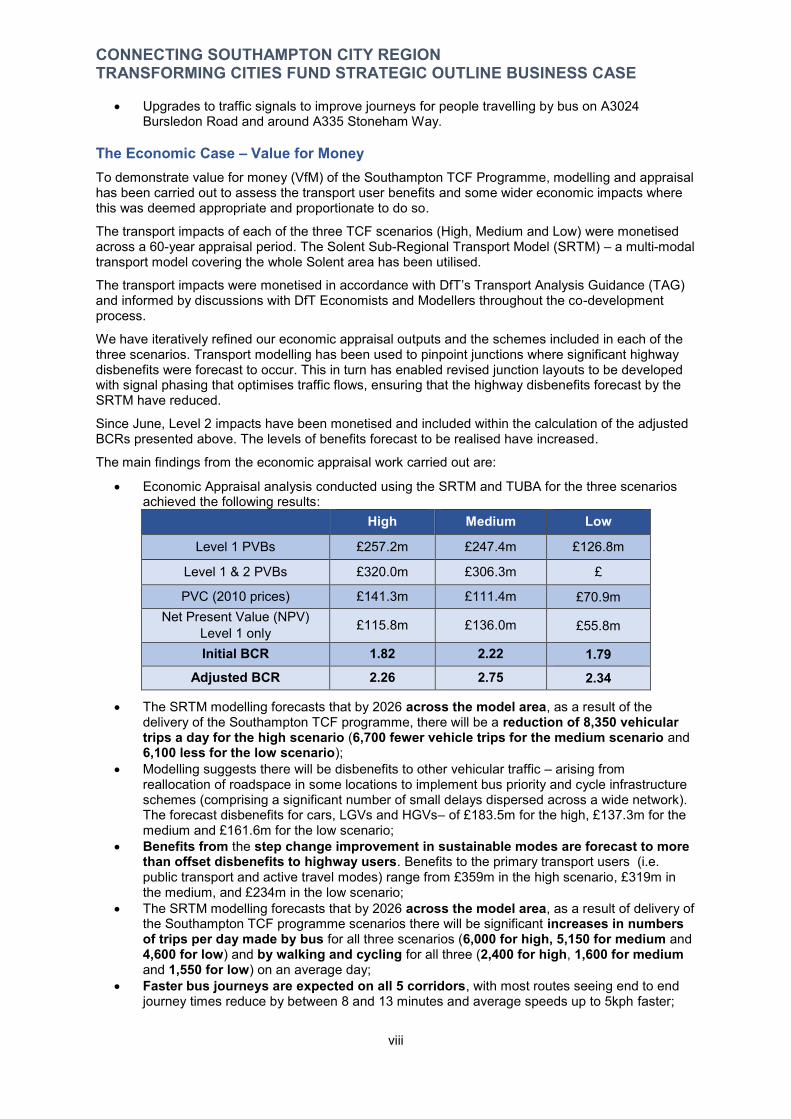
Economic Appraisal analysis conducted using the SRTM and TUBA for the three scenarios achieved the following results:
High Medium Low
Level 1 PVBs £257.2m £247.4m £126.8m
Level 1 & 2 PVBs £320.0m £306.3m £
PVC (2010 prices) £141.3m £111.4m £70.9m Net Present Value (NPV)
Level 1 only £115.8m £136.0m £55.8m
Initial BCR 1.82 2.22 1.79 Adjusted BCR 2.26 2.75 2.34
The SRTM modelling forecasts that by 2026 across the model area, as a result of the delivery of the Southampton TCF programme, there will be a reduction of 8,350 vehicular trips a day for the high scenario (6,700 fewer vehicle trips for the medium scenario and 6,100 less for the low scenario);
Modelling suggests there will be disbenefits to other vehicular traffic – arising from reallocation of roadspace in some locations to implement bus priority and cycle infrastructure schemes (comprising a significant number of small delays dispersed across a wide network). The forecast disbenefits for cars, LGVs and HGVs– of £183.5m for the high, £137.3m for the medium and £161.6m for the low scenario;
Benefits from the step change improvement in sustainable modes are forecast to more than offset disbenefits to highway users. Benefits to the primary transport users (i.e. public transport and active travel modes) range from £359m in the high scenario, £319m in the medium, and £234m in the low scenario;
The SRTM modelling forecasts that by 2026 across the model area, as a result of delivery of the Southampton TCF programme scenarios there will be significant increases in numbers of trips per day made by bus for all three scenarios (6,000 for high, 5,150 for medium and 4,600 for low) and by walking and cycling for all three (2,400 for high, 1,600 for medium and 1,550 for low) on an average day;
Faster bus journeys are expected on all 5 corridors, with most routes seeing end to end journey times reduce by between 8 and 13 minutes and average speeds up to 5kph faster;
viii
CONNECTING SOUTHAMPTON CITY REGION TRANSFORMING CITIES FUND STRATEGIC OUTLINE BUSINESS CASE
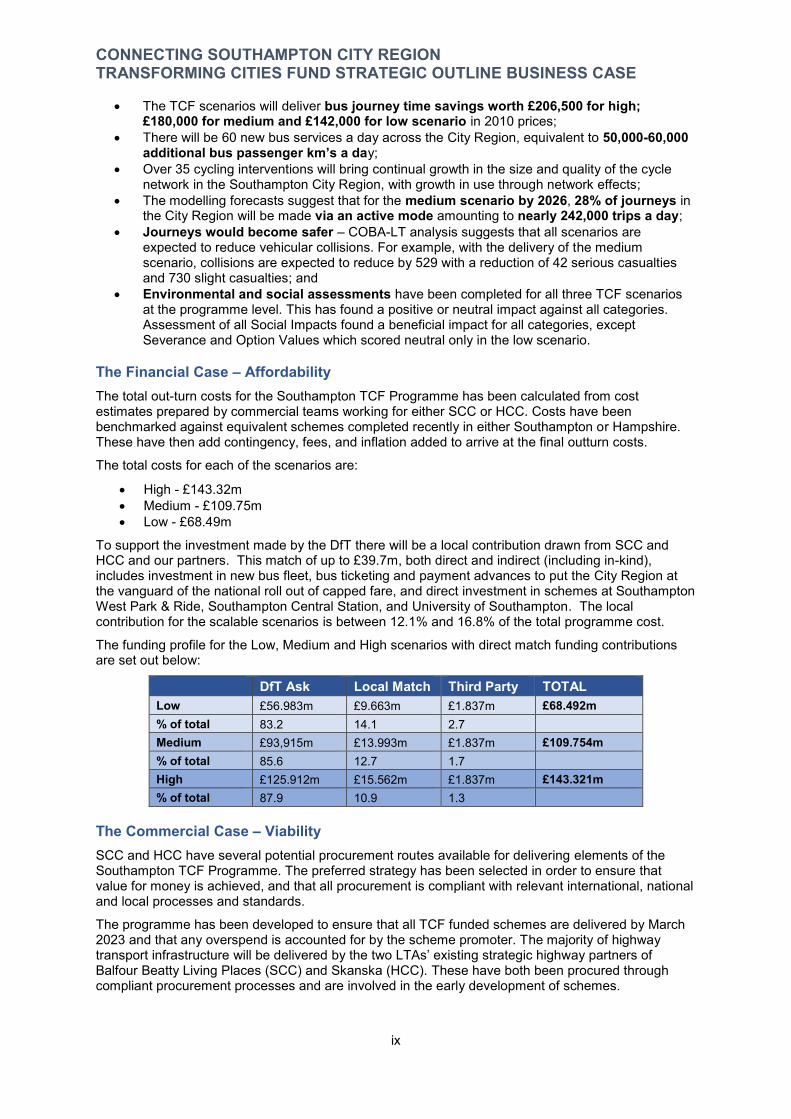
The TCF scenarios will deliver bus journey time savings worth £206,500 for high; £180,000 for medium and £142,000 for low scenario in 2010 prices;
There will be 60 new bus services a day across the City Region, equivalent to 50,000-60,000 additional bus passenger km’s a day;
Over 35 cycling interventions will bring continual growth in the size and quality of the cycle network in the Southampton City Region, with growth in use through network effects;
The modelling forecasts suggest that for the medium scenario by 2026, 28% of journeys in the City Region will be made via an active mode amounting to nearly 242,000 trips a day;
Journeys would become safer – COBA-LT analysis suggests that all scenarios are expected to reduce vehicular collisions. For example, with the delivery of the medium scenario, collisions are expected to reduce by 529 with a reduction of 42 serious casualties and 730 slight casualties; and
Environmental and social assessments have been completed for all three TCF scenarios at the programme level. This has found a positive or neutral impact against all categories. Assessment of all Social Impacts found a beneficial impact for all categories, except Severance and Option Values which scored neutral only in the low scenario.
The Financial Case – Affordability The total out-turn costs for the Southampton TCF Programme has been calculated from cost estimates prepared by commercial teams working for either SCC or HCC. Costs have been benchmarked against equivalent schemes completed recently in either Southampton or Hampshire. These have then add contingency, fees, and inflation added to arrive at the final outturn costs.
The total costs for each of the scenarios are:
High - £143.32m Medium - £109.75m Low - £68.49m
To support the investment made by the DfT there will be a local contribution drawn from SCC and HCC and our partners. This match of up to £39.7m, both direct and indirect (including in-kind), includes investment in new bus fleet, bus ticketing and payment advances to put the City Region at the vanguard of the national roll out of capped fare, and direct investment in schemes at Southampton West Park & Ride, Southampton Central Station, and University of Southampton. The local contribution for the scalable scenarios is between 12.1% and 16.8% of the total programme cost.
The funding profile for the Low, Medium and High scenarios with direct match funding contributions are set out below:
DfT Ask Local Match Third Party TOTAL Low £56.983m £9.663m £1.837m £68.492m % of total 83.2 14.1 2.7 Medium £93,915m £13.993m £1.837m £109.754m % of total 85.6 12.7 1.7 High £125.912m £15.562m £1.837m £143.321m % of total 87.9 10.9 1.3
The Commercial Case – Viability SCC and HCC have several potential procurement routes available for delivering elements of the Southampton TCF Programme. The preferred strategy has been selected in order to ensure that value for money is achieved, and that all procurement is compliant with relevant international, national and local processes and standards.
The programme has been developed to ensure that all TCF funded schemes are delivered by March 2023 and that any overspend is accounted for by the scheme promoter. The majority of highway transport infrastructure will be delivered by the two LTAs’ existing strategic highway partners of Balfour Beatty Living Places (SCC) and Skanska (HCC). These have both been procured through compliant procurement processes and are involved in the early development of schemes.
ix
CONNECTING SOUTHAMPTON CITY REGION TRANSFORMING CITIES FUND STRATEGIC OUTLINE BUSINESS CASE
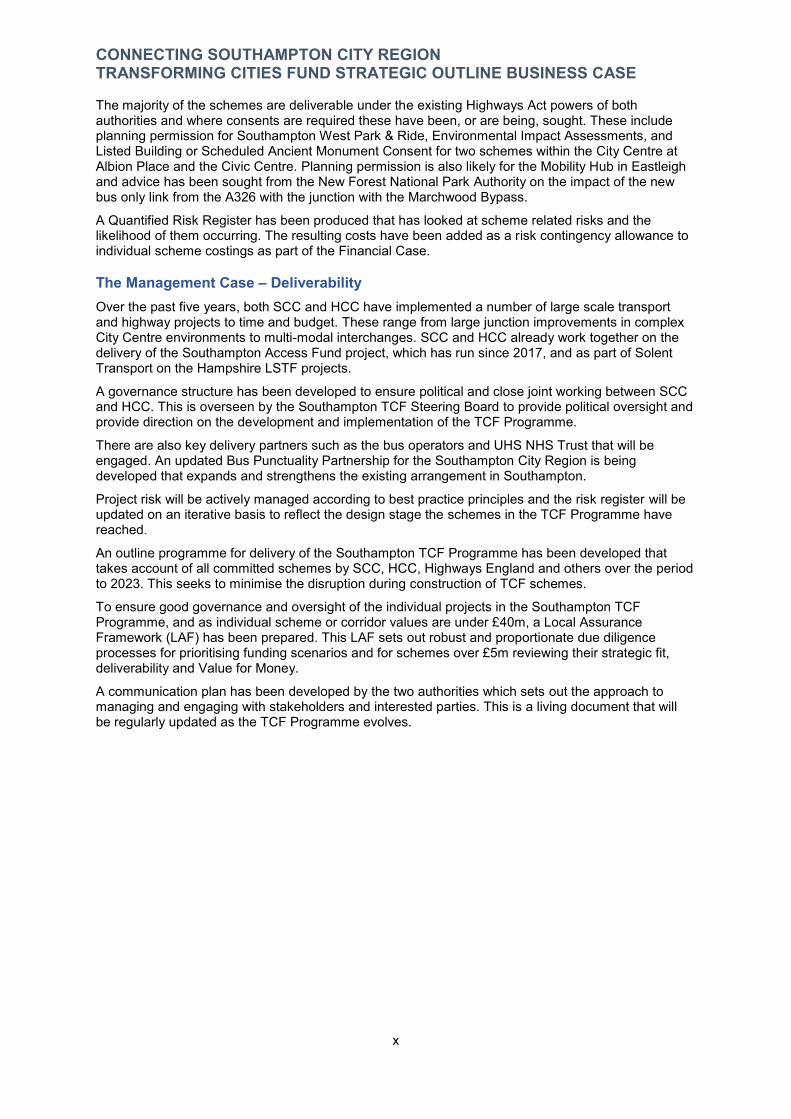
The majority of the schemes are deliverable under the existing Highways Act powers of both authorities and where consents are required these have been, or are being, sought. These include planning permission for Southampton West Park & Ride, Environmental Impact Assessments, and Listed Building or Scheduled Ancient Monument Consent for two schemes within the City Centre at Albion Place and the Civic Centre. Planning permission is also likely for the Mobility Hub in Eastleigh and advice has been sought from the New Forest National Park Authority on the impact of the new bus only link from the A326 with the junction with the Marchwood Bypass.
A Quantified Risk Register has been produced that has looked at scheme related risks and the likelihood of them occurring. The resulting costs have been added as a risk contingency allowance to individual scheme costings as part of the Financial Case.
The Management Case – Deliverability Over the past five years, both SCC and HCC have implemented a number of large scale transport and highway projects to time and budget. These range from large junction improvements in complex City Centre environments to multi-modal interchanges. SCC and HCC already work together on the delivery of the Southampton Access Fund project, which has run since 2017, and as part of Solent Transport on the Hampshire LSTF projects.
A governance structure has been developed to ensure political and close joint working between SCC and HCC. This is overseen by the Southampton TCF Steering Board to provide political oversight and provide direction on the development and implementation of the TCF Programme.
There are also key delivery partners such as the bus operators and UHS NHS Trust that will be engaged. An updated Bus Punctuality Partnership for the Southampton City Region is being developed that expands and strengthens the existing arrangement in Southampton.
Project risk will be actively managed according to best practice principles and the risk register will be updated on an iterative basis to reflect the design stage the schemes in the TCF Programme have reached.
An outline programme for delivery of the Southampton TCF Programme has been developed that takes account of all committed schemes by SCC, HCC, Highways England and others over the period to 2023. This seeks to minimise the disruption during construction of TCF schemes.
To ensure good governance and oversight of the individual projects in the Southampton TCF Programme, and as individual scheme or corridor values are under £40m, a Local Assurance Framework (LAF) has been prepared. This LAF sets out robust and proportionate due diligence processes for prioritising funding scenarios and for schemes over £5m reviewing their strategic fit, deliverability and Value for Money.
A communication plan has been developed by the two authorities which sets out the approach to managing and engaging with stakeholders and interested parties. This is a living document that will be regularly updated as the TCF Programme evolves.
x
CONNECTING SOUTHAMPTON CITY REGION TRANSFORMING CITIES FUND STRATEGIC OUTLINE BUSINESS CASE
Contents Foreword ................................................................................................................................................. ii
Executive Summary ................................................................................................................................iii
1. Introduction......................................................................................................................................1
1.1. Our aim for the Southampton TCF Programme......................................................................1
1.1.1. A focus on transforming people’s mobility and lifestyles ................................................2
1.1.2. The focus for investment .................................................................................................3
2. The Approach to the Business Case ..............................................................................................1
2.1. Introduction..............................................................................................................................1
2.2. The Five Case Model ..............................................................................................................1
2.3. Business Case Process ..........................................................................................................1
3. The Strategic Case .........................................................................................................................2
3.1. Developing the Strategic Case................................................................................................2
3.2. Overview of the Southampton City Region .............................................................................3
3.2.1. Southampton City Region’s Geography..........................................................................3
3.2.2. Demographics .................................................................................................................5
3.2.3. Overview of the City Region’s Transport Networks ........................................................5
3.2.4. How the local economy has influenced spatial distribution of housing and employment over the last 40 years ......................................................................................................................8
3.2.5. Trends in Location of Employment Development .........................................................10
3.2.6. Main Employment Locations .........................................................................................11
3.2.7. Current Travel Patterns .................................................................................................15
3.3. Strategic Policy Context ........................................................................................................23
3.4. The Case for Change – Strategic Challenges ......................................................................24
3.4.1. Challenge 1: A Clear Productivity Gap Exists ...............................................................27
3.4.2. Challenge 2: Congestion is Increasing and with Planned Growth Delays Are Set to Worsen 37
3.4.3. Challenge 3: Reducing Bus Journey Times to make the bus attractive to car drivers .50
3.4.4. Challenge 4: Addressing Rising Inequalities.................................................................64
3.5. The Opportunity – A Well Connected City Region................................................................73
3.6. Objectives for Southampton City Region TCF Programme ..................................................75
3.6.1. TCF Programme Objectives..........................................................................................75
3.6.2. Measures for Success...................................................................................................76
4. The Strategic Case – Developing the Southampton TCF scenario ..............................................77
4.1. Introduction............................................................................................................................77
4.2. TCF Corridors........................................................................................................................77
4.3. Developing Themes ..............................................................................................................86
4.4. Option Generation.................................................................................................................87
4.5. Arriving at a Long List ...........................................................................................................87
4.6. Scheme Option Sifting ..........................................................................................................88
xi
CONNECTING SOUTHAMPTON CITY REGION TRANSFORMING CITIES FUND STRATEGIC OUTLINE BUSINESS CASE
4.6.1. Stage 1 - Strategic fit.....................................................................................................89
4.6.2. Stages 2 & 3 – Assessing Value for Money & Affordability and Deliverability ..............89
4.7. The Preferred Option: The Southampton TCF Programme..................................................92
4.7.1. Applying the Schemes to the Corridors ........................................................................92
4.7.2. Transforming Mobility ....................................................................................................93
4.7.3. Transforming Lifestyles ...............................................................................................103
4.7.4. Transforming Gateways ..............................................................................................109
4.7.5. Formulating Three Scalable TCF Programme Options...............................................115
4.8. Links with Other Funding ....................................................................................................128
4.8.1. Solent Future Mobility Zone ........................................................................................129
4.8.2. Future High Streets Fund............................................................................................129
4.8.3. Southampton and Hampshire Access Fund ...............................................................129
4.9. Stakeholder Engagement ...................................................................................................130
4.9.1. Stakeholder Comments...............................................................................................131
4.10. Constraints and Inter-Dependencies ..........................................................................133
4.10.1. Alignment with other Planned Transport Schemes.....................................................133
4.10.2. External Dependencies ...............................................................................................136
4.10.3. Complementary Measures ..........................................................................................136
4.10.4. Constraints ..................................................................................................................137
5. The Economic Case....................................................................................................................139
5.1. Summary of Economic Appraisal Results ...........................................................................139
5.2. Options appraised ...............................................................................................................140
5.3. Summary Economic Narrative – defining the scope of the analysis...................................145
5.3.1. How the Challenges covered in the Strategic Case translate into impacts on the economy of Southampton City Region .......................................................................................146
5.3.2. Economic Impact Logic Mapping ................................................................................148
5.3.3. Reallocating Roadspace .............................................................................................149
5.3.4. Improving Bus Provision ............................................................................................150
5.3.5. Smart & Active Travel .................................................................................................151
5.3.6. Place Making...............................................................................................................152
5.4. Overview of Appraisal Tools Used......................................................................................153
5.4.1. Appraisal Methodology General Principles .................................................................153
5.5. Methodology used to undertake economic appraisal and monetise impacts .....................155
5.5.1. Appraisal Period ..........................................................................................................155
5.5.2. TCF Scenario Costs ....................................................................................................155
5.5.3. Modelling Strategy.......................................................................................................157
5.5.4. Methodology used to monetise economic impacts .....................................................157
5.5.5. Transport Impacts from the proposed scenario ..........................................................160
5.5.6. Scenario Costs – PVC ................................................................................................164
5.5.7. Summary of Level 1 & 2 Impacts ................................................................................166
xii
CONNECTING SOUTHAMPTON CITY REGION TRANSFORMING CITIES FUND STRATEGIC OUTLINE BUSINESS CASE
5.5.8. Non-monetised Impacts ..............................................................................................168
5.5.9. Sensitivity Tests ..........................................................................................................170
5.6. Social and Distributional Impacts ........................................................................................171
5.6.1. Adding Social Value to Southampton..........................................................................171
5.6.2. Social Impacts Assessment ........................................................................................173
5.6.3. Distributional Impacts – screening ..............................................................................174
5.7. Environmental Impacts........................................................................................................174
5.8. Value for Money Statement.................................................................................................177
6. The Financial Case .....................................................................................................................179
6.1. Introduction..........................................................................................................................179
6.2. Project costs........................................................................................................................179
6.2.1. Cost Calculation ..........................................................................................................179
6.2.2. Whole Life Costs .........................................................................................................180
6.2.3. Risk Management .......................................................................................................180
6.2.4. State Aid Statement ....................................................................................................181
6.3. Budgets and Spend Profile .................................................................................................182
6.4. Leverage and Additionality..................................................................................................182
6.5. Accounting Implications ......................................................................................................183
7. The Commercial Case ................................................................................................................184
7.1. Introduction..........................................................................................................................184
7.2. Output Based Specification.................................................................................................184
7.3. Procurement Strategy .........................................................................................................186
7.4. Consents, land and powers required ..................................................................................187
7.4.1. Consents Required......................................................................................................187
7.4.2. Land Required.............................................................................................................187
7.4.3. Powers Required.........................................................................................................188
7.5. Sourcing Options.................................................................................................................188
7.6. Payment Mechanisms.........................................................................................................188
7.7. Risk Allocation and Transfer ...............................................................................................189
7.7.1. TCF Risk Register Development Methodology...........................................................189
7.7.2. Identified Risks & Mitigation ........................................................................................190
7.8. Contract Length...................................................................................................................192
8. The Management Case...............................................................................................................193
8.1. Introduction..........................................................................................................................193
8.2. Delivery Plan .......................................................................................................................193
8.3. Governance Structure .........................................................................................................195
8.3.1. Southampton TCF Strategic Governance Overview...................................................195
8.4. Risk Management Strategy.................................................................................................198
8.5. Approach to Scheme Design and Construction ..................................................................200
8.6. Evidence of Experience of Delivering Similar Projects .......................................................201
xiii
CONNECTING SOUTHAMPTON CITY REGION TRANSFORMING CITIES FUND STRATEGIC OUTLINE BUSINESS CASE
8.7. Spend approvals process....................................................................................................202
8.8. Local Assurance Framework...............................................................................................202
8.9. Communications and Stakeholder Management ................................................................203
8.10. Programme Dependencies .........................................................................................204
8.11. Monitoring and evaluation ...........................................................................................205
8.12. Benefits realisation plan ..............................................................................................209
List of Figures Figure 2.1 – Three Phase Business Case Process 1 Figure 3.1 – Housing growth delivered in the Solent both inside and outside of Portsmouth and Southampton 1981-2017 9 Figure 3.2 – Mode share of each travel mode for commuter journeys within City Region (2011 Census) 16 Figure 3.3 - Total Number of Cycle Journeys (main corridors) Southampton 2010-2018 19 Figure 3.4 - Out and In Commuting Trips from Southampton by LA 20 Figure 3.5 - Out and In Commuting Trips from Eastleigh by LA 20 Figure 3.6 - Mode Split for Travel to Selected Employment Locations 21 Figure 3.7 - Composition of employment in Southampton & Eastleigh relative to the South East Region Average 2019 28 Figure 3.8 – GVA per head comparison Southampton, South Hampshire and South East 29 Figure 3.9 –Sectoral Contributions to GVA for Southampton City, Eastleigh Borough and the Totton and Waterside Area of New Forest District 29 Figure 3.10 – The persistent wage gap between residents and workers in Southampton (2008-2017)
30 Figure 3.11 - Forecast Sectoral share of job growth in Solent LEP relative to South East, 2015-2036
32 Figure 3.12 –Potential impact of limited investment in transport infrastructure in job creation for the Solent 36 Figure 3.13 – Change in Average Vehicle speed for main radial roads 2017-2018 38 Figure 3.14 – VIP sites in Southampton City Centre 42 Figure 3.15 – Growth in bus passenger journeys per year in Southampton City Region in millions 54 Figure 3.16 - Average Excess Waiting Time for ‘frequent’ bus services 2012/13-2016/17 58 Figure 3.17 – Number of most deprived areas and total population* in the South East of England for all Shire Counties and the four most deprived unitary authorities. * Total population based on 2012 mid-year population estimates (Source: South East England Councils) 66 Figure 3.18 – Contribution of different sources to NOx Emissions at Redbridge Roundabout 70 Figure 3.19 – Flow for developing the TCF Challenges, Objectives, Approach and Outcomes 75 Figure 4.1– Split of Long-listed schemes by TCF Corridor and by Theme 88 Figure 4.2 – Distribution of average scores for schemes 90 Figure 4.3 – How number of schemes were sifted by corridor at each stage 91 Figure 4.4 – Number of schemes within the three overarching themes at each of three sifting stages
91 Figure 4.5 – The Elements of the SMTS including Rapid Bus Corridors 93 Figure 4.6 - How Rapid Bus fits within the SMTS 94 Figure 4.7 – Bus Routes where frequencies will increase (blue) and where lightly used stops will be skipped (green) 96
xiv
CONNECTING SOUTHAMPTON CITY REGION TRANSFORMING CITIES FUND STRATEGIC OUTLINE BUSINESS CASE
Figure 4.8 – Concept of a Future Mobility Zone and fit with existing mobility services 101 Figure 4.9 – Example of Smart Technology Corridor Architecture 102 Figure 4.10– Segregated cycle facilities at a junction on a SCN Cycle Freeway (SCN9) 104 Figure 4.11- Network Map of the planned Southampton Cycle Network (SCN) 104 Figure 4.12 – Example of streetscape changes made within an ATZ in Waltham Forest 107 Figure 4.13 –Southampton Central Station Interchange Masterplan 110 Figure 4.14 – Artist Impression of Civic Centre Place public realm improvements 112 Figure 4.15 – Summary of decision-making process followed in formulating scalable schemes116 Figure 4.16 – My Journey Access Fund Successes 130 Figure 5.1 – Summary of Methodology followed to appraise the three TCF Scenarios 145 Figure 5.2 – Logic Map showing how the three categories of physical changes TCF interventions will bring about translate into economic impacts to be monetised 148 Figure 5.3 – Districts and Sectors used in TCF Programme SRTM Modelling 154 Figure 5.4 – Summary of value of Level 1 and Level 2 impacts (benefits and disbenefits) for the High, Medium and Low scenarios (2010 Prices) 160 Figure 5.5 – 2026 AM peak inbound bus end-to-end bus service journey times for DM, and DS (Low, Medium & High) 162 Figure 5.6 - Change in 24 Hour Change in Trip Modes from Do Minimum – Southampton City Region 2026 162 Figure 5.7 - Absolute change in 24 Hour Trip Modes from Do Minimum – Medium 2026 163 Figure 5.8 - Percentage change in 24 Hour Trip Modes from Do Minimum – Medium 2026 163 Figure 5.9 – Split of Public Transport User Benefits for the Medium Programme by Corridor 164 Figure 5.10 - Distribution of time benefits across by time saving band (Medium scenario) 164 Figure 5.11 – Breakdown of TCF Medium Programme investment costs by project type 165 Figure 5.12 – Medium scenario Urban Realm, Mobility Hub and Active Travel Zone proposals with IMD 172 Figure 7.1- Southampton City Region TCF Programme Logic Map 185 Figure 8.1 –Southampton TCF Delivery Plan for High Scenario 194 Figure 8.2 – Southampton City Region TCF Project Governance Structure 195 Figure 8.3 – Overview of Local Assurance Framework Process 203
List of Maps Map 1.1 - The Southampton City Region 1 Map 1.2 – Southampton City Region – the five TCF Corridors 3 Map 3.1 - The Southampton City Region 3 Map 3.2 - Southampton City Region’s Strategic highway and rail connections 6 Map 3.3 - Southampton City Region transport networks 6 Map 3.4 - Southampton City Region Employment Sectors and Locations 13 Map 3.5 - Map showing number of employee jobs per hectare for all wards within the City Region, 2017 14 Map 3.6 – Total Employee Jobs by MSOA for Southampton and Eastleigh Borough 15 Map 3.7 – Annual Average Daily Flow 2018 17 Map 3.8 - Percentage of the working age population with an NVQ Level 4 (degree level) qualification (left) and Percentage of the working age population employed in elementary occupations (right) -2011 Census 31
xv
CONNECTING SOUTHAMPTON CITY REGION TRANSFORMING CITIES FUND STRATEGIC OUTLINE BUSINESS CASE
Map 3.9 – Average Vehicle Delays in AM (0700-0900) and PM (1600-1800) peaks 2013/14 from Trafficmaster data 39 Map 3.10 - Planned Quantum of Growth within City Region by 2036 41 Map 3.11- Forecast Change in traffic volumes 2014-2036 AM Peak (red represents growth, green indicates reductions) 44 Map 3.12 – Forecast Delay Difference 2014-2036 AM Peak (red represents increases, green indicates reductions) 45 Map 3.13 – Propensity to Cycle Toolkit Outputs, Government Target (near market) 46 Map 3.14 – AM Peak Link Delay Southampton City Centre 2026, SCC 47 Map 3.15 – Southampton City Region Bus service frequencies (line thickness indicates number of buses/hr) 52 Map 3.16 – Sections of the Southampton City Region Network where bus speeds are less than 10kph (2010) 57 Map 3.17 – General Traffic Speeds in AM Peak on A3024 Northam Road/ Bitterne Road W/ Bursledon Rd corridor 60 Map 3.18 – Public Transport Flow difference 2010-2026 62 Map 3.19 – Number of Households in Southampton City Region without access to a car by MSOA
65 Map 3.20 – Southampton City Region Index of Multiple Deprivation (2019) score by LSOA 67 Map 3.21 - Locations of the 15 designated AQMAs in Southampton City Region 70 Map 4.1 - Eleven Radial Corridors initially identified for potential selection as part of City Region TCF scenarios 78 Map 4.2– The Five Southampton City Region Prioritised TCF Corridors 82 Map 4.3 – Southampton West P&R – to University Hospital Southampton Campus 98 Map 4.4 – Southampton West P&R – to City Centre 100 Map 4.5 – Proposed City Centre Transformation Schemes 113 Map 4.6 – Southampton TCF Programme High Scenario 120 Map 4.7 – Southampton TCF Programme Medium Funding Scenario 123 Map 4.8 – Southampton TCF Programme Low Funding Scenario 126 Map 4.9 – Southampton City Region – Schemes with Interdependencies which will complement TCF Scenario Investment 133 Map 5.1 – Proposals for road space re-allocation in the Medium Scenario to speed up bus journey times, improve public realm and support active and sustainable travel 149
List of Tables Table 3-1 – Key Steps in Development of the SOBC 3 Table 3-2 - Workday population by Local Authority 5 Table 3-3 – Overview of function of the main parts of the Southampton City Region transport network
8 Table 3-4 – Number of Businesses and Employees by Local Authority 11 Table 3-5 – Summary of Total Travel Demand Starting and/or Finishing in City Region – 24hrs15 Table 3-6 – Mode share of each mode for commuter journeys by Local Authority and for City Region (2011 Census) 16 Table 3-7 – AM Commuting Patterns All Mode between Districts 21 Table 3-8 - Summary of Key Policy Context to TCF 23 Table 3-9 – Wage differential by Authority 30 Table 3-10 – Challenge 1 Summary 36
xvi
CONNECTING SOUTHAMPTON CITY REGION TRANSFORMING CITIES FUND STRATEGIC OUTLINE BUSINESS CASE
Table 3-11 – Forecast Southampton City Region Growth 2011-2036, PfSH Spatial Strategy 40 Table 3-12 - Challenge 2 Summary 49 Table 3-13– Accessibility to City Centre, Airport, University and Hospital by Bus 51 Table 3-14 – Bus Corridors, Frequency and Destinations 51 Table 3-15 – Summary of main strengths and weaknesses of the City Region’s Bus Network and opportunities and threats 56 Table 3-16 – Journey Times from suburban locations within the City Region to Southampton City Centre (Portland Terrace for bus/Southampton Central for rail) 58 Table 3-17 – Journey Times from City Region to Southampton City Centre (Portland Terrace) 60 Table 3-18 - Challenge 3 Summary 63 Table 3-19 - Challenge 4 Summary 72 Table 3-20 – Measures for Success if ‘High’ scenario was funded and delivered 76 Table 4-1 - Summary of Guidance used to prioritise and sift corridors and schemes 77 Table 4-2 - Level of Strategic Fit with TCF objectives for the eleven corridors 79 Table 4-3– Summary of sub-themes within the three scenario themes 86 Table 4-4 - TCF Objectives used to assess the strategic fit 89 Table 4-5 – Seven Point Scale Assessment Criteria Used 90 Table 4-6– Rationale for schemes that were sifted out at Stage 2 due to showstopper issue(s)90 Table 4-7 – Application of the eight TCF project areas to the Corridors and City Centre 92 Table 4-8 – Current bus lane lengths and proposed new lengths under High, Medium and Low scenarios 95 Table 4-9 - Current and proposed bus service AM frequencies (based on SRTM) 96 Table 4-10 – Rapid Bus Corridors – A Partnership Approach to Investment 97 Table 4-11- Calculated Journey Time Savings per bus journey 97 Table 4-12 – Local Mobility Hubs – Summary of Proposed Approach to Investment (* – subject to FMZ funding) 102 Table 4-13 - Summary of Proposed Approach to Investment in Smart Technology 103 Table 4-14 – Summary of lengths of new cycle infrastructure planned through TCF compared to existing 105 Table 4-15 – How TCF Cycling Investment will be complemented by Local Investment 105 Table 4-16 – Infrastructure options for inclusion within an ATZ 107 Table 4-17 – ATZ connections with other TCF schemes 108 Table 4-18 – Summary of investment for ATZs 108 Table 4-19 – Summary of investment for Gateways & Interchanges 111 Table 4-20 – Elements of the City Centre Transformation 115 Table 4-21 - Summary of investment for City Centre Transformation 115 Table 4-22 – Corridors in Low and Medium Scenarios 116 Table 4-23– Examples of Scheme Scalability 118 Table 4-24 - Number of Schemes the Low/ Med/ High Funding Scenarios 118 Table 4-25 – Summary of how individual interventions have been grouped together along the corridors 119 Table 4-26 – Southampton TCF Programme High Scenario 122 Table 4-27 – Southampton TCF Programme Medium Funding Scenario 125 Table 4-28- Southampton TCF Programme Low Scenario 128 Table 4-29 – Synergies between Southampton and Solent FMZ, TCF, Access Fund and FHSF bids
129
xvii

CONNECTING SOUTHAMPTON CITY REGION TRANSFORMING CITIES FUND STRATEGIC OUTLINE BUSINESS CASE
Table 4-30 – Summary of Roles and Responsibilities of Primary TCF Delivery Partners 131 Table 4-31– Recurring themes raised by respondents of most relevance to TCF 132 Table 4-32 – Summary of main constraints relating to TCF scheme delivery 138 Table 5-1 – Summary of Economic Appraisal Results 139 Table 5-2– Summary of Scope of High, Medium and Low scenarios for each TCF corridor 143 Table 5-3 – Summary of Bus Service Changes enabled by the High, Medium and Low Scenarios 144 Table 5-4 – Summary of Overall approach to Monetising Economic Impacts 146 Table 5-5 – Summary of Planned Cycle Interventions and ATZs under High, Medium and Low Scenarios 151 Table 5-6 – SRTM Modelling Sectors used for each TCF corridor 154 Table 5-7 – Summary of levels of OB applied to interventions and commentary on rationale behind it
156 Table 5-8– Summary of expected transport user benefits, disbenefits and other economic impacts forecast from modelling of TCF low, medium and high programmes 161 Table 5-9– Breakdown of costs per scenario & corridor 165 Table 5-10 – Private Sector Contributions by scenario (part of PVC) in factor cost 165 Table 5-11 - Operational costs to the LA’s per scenario (part of PVC) in factor cost 166 Table 5-12 – Operational revenues to the LAs for each scenario (part of PVC) in factor cost 166 Table 5-13 - PVC in market price (2010 prices and values in £’000s) 166 Table 5-14 – Summary of Monetised Impacts (Level 1) and Calculation of Initial BCR for the three TCF Programmes 167 Table 5-15 - Calculation of Adjusted BCR (Level 1+2) for the three funding scenarios 167 Table 5-16 - Qualitative analysis of non-monetised impacts 169 Table 5-17 - Assessment of social impacts 174 Table 5-18 - Assessment of environmental impacts 176 Table 5-19– Value for money scoring 177 Table 6-1 – Top Programme Levels Risks 181 Table 6-2 –Spend Profile for the High, Medium & Low Southampton TCF Programme Scenarios182 Table 7-1 - Examples of payment mechanisms 189 Table 7-2 - Risk Types and Numbers 190 Table 7-3 – Top 10 Risk to Southampton TCF Programme and rating before mitigation 191 Table 7-4 – Initial Risk Assessment 191 Table 7-5 – Post-Mitigation Top Risks 192 Table 7-6 – Post Mitigation Risk Assessment 192 Table 8-1- Risk Management – main risks identified at a programme level 199 Table 8-2 – Southampton TCF Stakeholders 204 Table 8-3– Summary of key milestones for TCF Programme and other inter-dependent schemes 205 Table 8-4 – Outcomes for Theme 1 (Transforming Mobility) 208 Table 8-5 - Outcomes for Theme 2 (Transforming Lifestyles) 209 Table 8-6 – Outcomes for Theme 3 (Transforming Gateways) 209
xviii

CONNECTING SOUTHAMPTON CITY REGION TRANSFORMING CITIES FUND STRATEGIC OUTLINE BUSINESS CASE
1. Introduction This Transforming Cities Fund (TCF) Programme has been prepared jointly by Southampton City Council (SCC) and Hampshire County Council (HCC). It sets out a programme of integrated and complementary transport schemes to transform connectivity and boost productivity across the Southampton City Region. This Strategic Outline Business Case (SOBC) will set out the case for change and why the investment is required to transform transport so it can support growth, boost productivity, reduce inequalities, and reduce road-based emissions in the Southampton City Region.
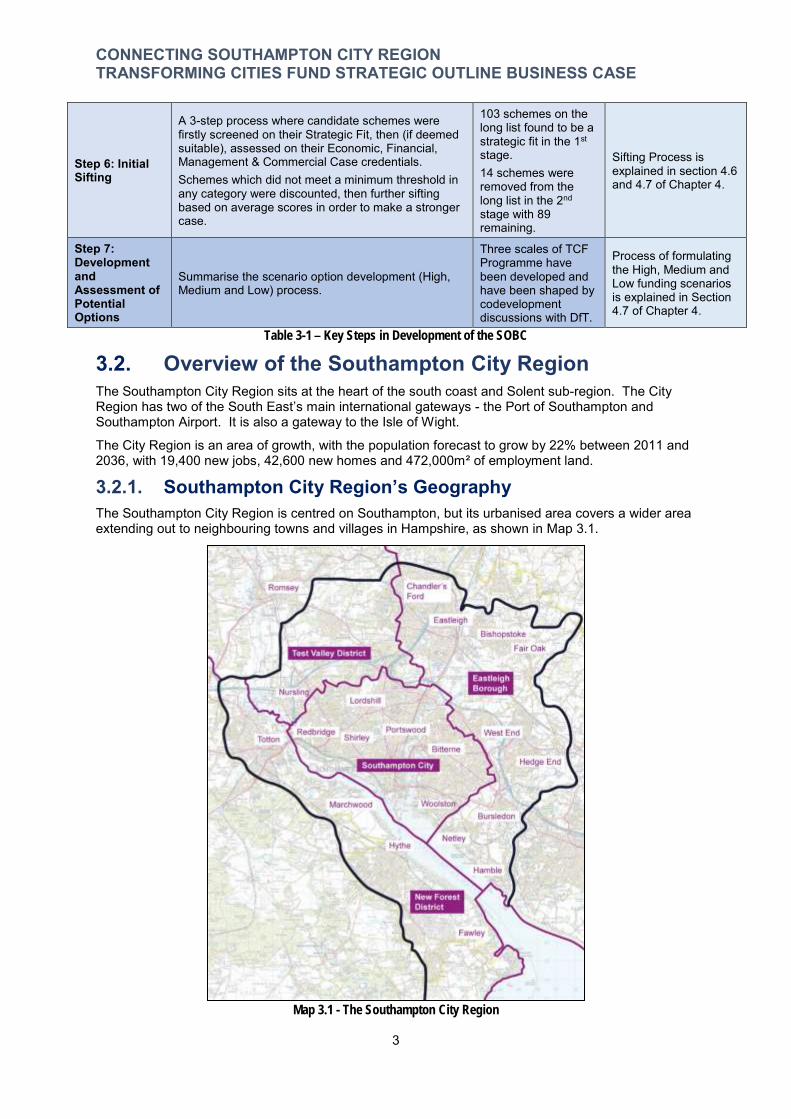
As shown in Map 1.1 below, the main urban area within the Southampton City Region is Southampton, and also includes towns, suburbs, and villages in Hampshire that together have a workday population of 445,000. In Hampshire, the City Region encompasses all of Eastleigh Borough, part of New Forest District (Totton and the Waterside), and part of Test Valley Borough (North Baddesley, Nursling, Rownhams, Chilworth & Valley Park) Council areas.
Map 1.1 - The Southampton City Region
The City Region’s economic and urban geography is shaped by its physical geography. Southampton does not have 360° access, meaning journeys such as from Hythe to the City Centre taking almost 45 minutes by land whereas as the crow flies, the two are only 2 miles apart. People travelling in from eastern parts of the City Region must pass through a limited number of crossings of the River Itchen, which at peak times are significantly congested.
1.1. Our aims for the Southampton TCF Programme Our aims for the Southampton TCF Programme is to make a Southampton City Region that:
Is better connected with more reliable journey times and easier access to employment by non-car modes;
Has a significantly reduced productivity gap compared to reginal and national average, and where the economy is rebalanced;
1

CONNECTING SOUTHAMPTON CITY REGION TRANSFORMING CITIES FUND STRATEGIC OUTLINE BUSINESS CASE
Is easy to get around on a Rapid Bus System that builds on partnerships, to move people around quickly and reliably linking suburbs with main employment hubs, and easier interchanges so public transport becomes a mode of first choice;
Is healthier and more active, with many more journeys to work, education and leisure made by bike, enabled by a high quality cycle network;
Has higher resident quality of life and health, driven by improved physical activity levels and reduced emissions providing quality liveable places;
Is at the forefront of innovation, embracing new technology and mobility options; and Supports clean and sustainable growth that benefits all residents, businesses and visitors,
including a City Centre that is reconfigured to put the needs of people ahead of movement of vehicles and parking.
Our TCF Programme will connect the economic drivers of the City Region with where people live. One such driver is the international gateway of the Port of Southampton, the UK’s third busiest Port, largest for exports to non-EU markets, and busiest for cruise passengers. The port plays a key part in the economy of the City Region, requiring excellent and efficient strategic and local transport access to thrive, as the last-mile access to the Port is on local roads these need to work for all users. The main focus of the TCF programme is on improving connectivity to and through Southampton City Centre for people walking, cycling and on public transport.
1.1.1. A focus on transforming people’s mobility and lifestyles Transforming people’s mobility, lifestyles, and the gateways to our City Region are the key themes of the Southampton TCF Programme. There are eight types of investment that the TCF programme is structured around as shown below:
Theme 1: Transforming Mobility Rapid Bus Corridors that use priority and partnership to make travelling by bus easy, quick and attractive through combining new physical bus priority, enhanced bus stops, innovative technology, and modern, low-emission vehicles, the bus will be the travel mode of choice instead of the private car.
Park & Ride for Southampton that provides people with a new facility for services to the Hospital and City Centre.
Local Mobility Hubs that widen the choice and availability of shared e-mobility in local areas that combine access to a range of electric vehicles (cars, vans or bikes) with ‘click and collect’ services, coffee or public transport.
Smart Technology that improves reliability of public transport through Connected-Intelligent Transport Systems to manage the transport network and provide priority to Rapid Bus through the worst congestion bottlenecks at traffic signals.
Theme 2: Transforming Lifestyles
A comprehensive Southampton Cycle Network that enables commuters and residents to make safe and easy journeys to work and for leisure, through a coherent network of direct, high-quality, segregated routes connecting suburbs and workplaces across the City Region.
Active Travel Zones where walking and cycling become the norm for local neighbourhood journeys, co-designed and developed working in partnership with local communities.
Theme 3: Transforming Gateways Investing in Better Interchanges including within the City Centre at Southampton Central station and at other rail stations and transport hubs Transforming the quality of City Centre public spaces within the heart of the City into a much more vibrant, stimulating and people-focussed place, less dominated by moving or parked cars, supporting housing growth and where people enjoy visiting again and again, helping boost businesses and the local economy.
2

CONNECTING SOUTHAMPTON CITY REGION TRANSFORMING CITIES FUND STRATEGIC OUTLINE BUSINESS CASE
This will be achieved by transforming the connections along these corridors so that travel by cycling and public transport become preferred modes of choice.
1.1.2. The focus for investment Our focus for the Southampton TCF Programme will be along five radial corridors that connect to the central hub focused on Southampton City Centre. These corridors provide key links for the local economy, connecting many parts of the City Region to the commercial and employment focus of the City Centre. The five corridors are shown in Map 1.2
The corridors are: Corridor 1 – Southampton to Totton and Fawley; Corridor 2 – Southampton to Shirley and Romsey; Corridor 3 – Southampton to Chandler’s Ford and Winchester; Corridor 4 – Southampton to Portswood/St Denys, Eastleigh, and Fair Oak; Corridor 5 – Southampton to Bitterne & Hedge End and Woolston, Bursledon & Hamble; and City Centre Hub – Transformation as an integrated transport hub and liveable place.
Map 1.2 – Map showing the five TCF corridors for the Southampton City Region
This reflects the economic, retail and service linkages between Southampton and Totton, Chandlers Ford, Romsey, Eastleigh, Hythe, Fair Oak, North Baddesley, Hedge End, Botley, Bursledon and Hamble. There are also strong links to Romsey and Winchester which are just outside the extent of the City Region but have strong economic and transport connections to Southampton.
3

CONNECTING SOUTHAMPTON CITY REGION TRANSFORMING CITIES FUND STRATEGIC OUTLINE BUSINESS CASE
1.1.3. Links between challenges, our aims for TCF and the types of investment proposed Figure 1.1 summarises some of the transport and connectivity challenges facing the Southampton City Region (which will be explained in detail in Chapter 3), shows how these issues can affect transport users, and the resulting impacts on opportunity, quality of life, the environment and the economy. It sets out the main aims for the TCF Programme in the Southampton City Region introduced in the first part of 1.1 and how these relate to the eight types of investment described in 1.1.1.
TCF Projects
Southampton City Region
becoming increasingly
decentralised & polycentric
Vandalism & theft deters cycling
Development in outlying
areas eg "M27 corridor"
designed around driving
Significant current/ future
development in city centre
& on edge
Low Physical Activity Levels and
Poor Public Health
Southampton Cycle
Network
High/increasing levels of car
travel creates significant traffic
congestion
Deterrents to CyclingTCF proposals will improve access
to city centre, District centres,
town/ village centres
Park & Ride
Economic Impacts from
traffic Congestion
Traffic congestion
undermines bus services
TCF will enable faster more
reliable journeys by busRapid Bus Corridors
Low Productivity Air Quality issuesTCF improves access to
employment areasSmart Technology
Many local car trips use the
up capacity on M27 and
other strategic roads
TCF will support modal shift Local Mobility Hubs
Growing levels of economic
deprivation
TCF will help connect deprived
communities to employment &
services
Active Travel Zones
Heavy two way commuting
flows into and out of
Southampton
City centre is easy to
drive through and has
plentiful parking
TCF funding will create new public
space at Local Mobility Hubs &
Interchanges
City Centre Public
Realm Improvements
Coastal/ estuarine coasts &
harbours hinders access to city
centre / key employers
TCF will support lower car
dependency from new
development
Interchange
Improvements
Interchange with rail not easy
in places
TCF will improve ease and
quality of interchange
TCF will change the City Centre
to make it more Liveable/
people focussed
Context , issues & strategic challenges
Figure 1-1 – How Challenges (grey) relate to TCF aims (blue) and the eight TCF intervention types (green)
1
CONNECTING SOUTHAMPTON CITY REGION TRANSFORMING CITIES FUND STRATEGIC OUTLINE BUSINESS CASE
2. The Approach to the Business Case 2.1. Introduction This document sets out the programme level Strategic Outline Business Case (SOBC) for the Southampton City Region (SCR) Transforming Cities Fund (TCF) Bid to the Department for Transport (DfT).
2.2. The Five Case Model The purpose of this Strategic Outline Business Case is to provide evidence-based information in relation to the Southampton City Region TCF investment programme. It follows DfT’s guidance for the preparation of Business Cases for Transport Schemes based on HM Treasury advice on evidence-based decision making as set out in the Green Book.
It follows the best practice five case model approach to assess whether schemes:
Are supported by a robust case for change that fits with wider public policy objectives – the ‘strategic case’;
Demonstrate value for money – the ‘economic case’; Are financially affordable – the ‘financial case’; Are commercially viable – the ‘commercial case’, and Are achievable – the ‘management case’.
The evidence gathered as part of this business case preparation process has been prepared using the tools and guidance provided by the DfT, notably WebTAG. This approach ensures that the evidence produced is robust and consistent for all the potential Southampton TCF schemes examined in detail. This applies equally to those options proposed for investment and those, which following sifting, will not be further developed.
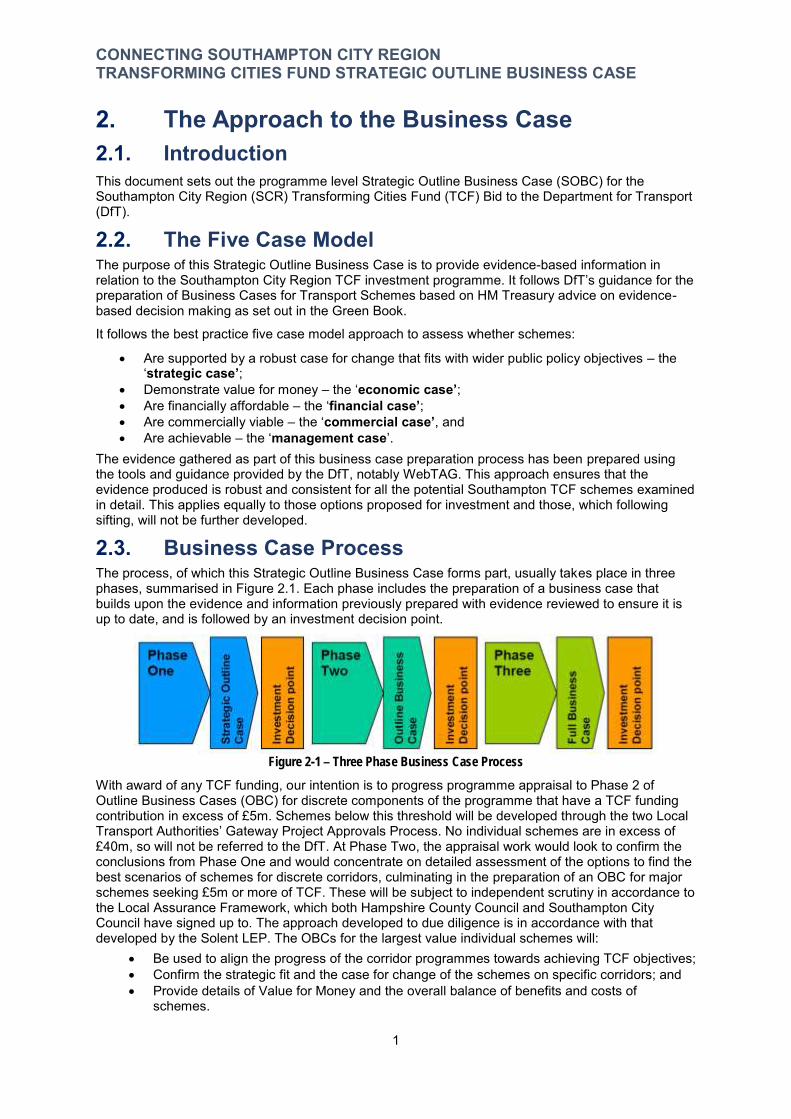
2.3. Business Case Process The process, of which this Strategic Outline Business Case forms part, usually takes place in three phases, summarised in Figure 2.1. Each phase includes the preparation of a business case that builds upon the evidence and information previously prepared with evidence reviewed to ensure it is up to date, and is followed by an investment decision point.
Figure 2-1 – Three Phase Business Case Process
With award of any TCF funding, our intention is to progress programme appraisal to Phase 2 of Outline Business Cases (OBC) for discrete components of the programme that have a TCF funding contribution in excess of £5m. Schemes below this threshold will be developed through the two Local Transport Authorities’ Gateway Project Approvals Process. No individual schemes are in excess of £40m, so will not be referred to the DfT. At Phase Two, the appraisal work would look to confirm the conclusions from Phase One and would concentrate on detailed assessment of the options to find the best scenarios of schemes for discrete corridors, culminating in the preparation of an OBC for major schemes seeking £5m or more of TCF. These will be subject to independent scrutiny in accordance to the Local Assurance Framework, which both Hampshire County Council and Southampton City Council have signed up to. The approach developed to due diligence is in accordance with that developed by the Solent LEP. The OBCs for the largest value individual schemes will:
Be used to align the progress of the corridor programmes towards achieving TCF objectives; Confirm the strategic fit and the case for change of the schemes on specific corridors; and Provide details of Value for Money and the overall balance of benefits and costs of
schemes.
1
CONNECTING SOUTHAMPTON CITY REGION TRANSFORMING CITIES FUND STRATEGIC OUTLINE BUSINESS CASE
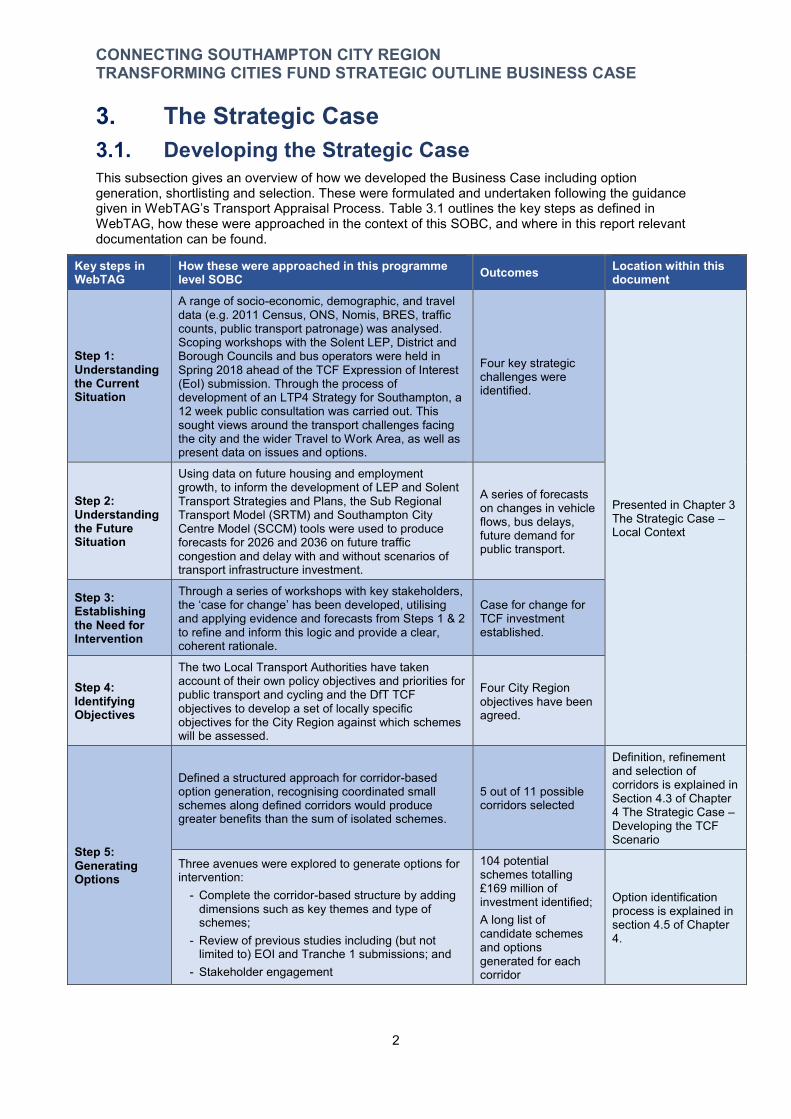
3. The Strategic Case 3.1. Developing the Strategic Case This subsection gives an overview of how we developed the Business Case including option generation, shortlisting and selection. These were formulated and undertaken following the guidance given in WebTAG’s Transport Appraisal Process. Table 3.1 outlines the key steps as defined in WebTAG, how these were approached in the context of this SOBC, and where in this report relevant documentation can be found.
Key steps in WebTAG
How these were approached in this programme level SOBC Outcomes Location within this
document
Step 1: Understanding the Current Situation
A range of socio-economic, demographic, and travel
Four key strategic challenges were identified.
Presented in Chapter 3 The Strategic Case – Local Context
data (e.g. 2011 Census, ONS, Nomis, BRES, traffic counts, public transport patronage) was analysed. Scoping workshops with the Solent LEP, District and Borough Councils and bus operators were held in Spring 2018 ahead of the TCF Expression of Interest (EoI) submission. Through the process of development of an LTP4 Strategy for Southampton, a 12 week public consultation was carried out. This sought views around the transport challenges facing the city and the wider Travel to Work Area, as well as present data on issues and options.
Step 2: Understanding the Future Situation
Using data on future housing and employment
A series of forecasts on changes in vehicle flows, bus delays, future demand for public transport.
growth, to inform the development of LEP and Solent Transport Strategies and Plans, the Sub Regional Transport Model (SRTM) and Southampton City Centre Model (SCCM) tools were used to produce forecasts for 2026 and 2036 on future traffic congestion and delay with and without scenarios of transport infrastructure investment.
Step 3: Establishing the Need for Intervention
Through a series of workshops with key stakeholders, Case for change for TCF investment established.
the ‘case for change’ has been developed, utilising and applying evidence and forecasts from Steps 1 & 2 to refine and inform this logic and provide a clear, coherent rationale.
Step 4: Identifying Objectives
The two Local Transport Authorities have taken
Four City Region objectives have been agreed.
account of their own policy objectives and priorities for public transport and cycling and the DfT TCF objectives to develop a set of locally specific objectives for the City Region against which schemes will be assessed.
Step 5: Generating Options
Defined a structured approach for corridor-based option generation, recognising coordinated small schemes along defined corridors would produce greater benefits than the sum of isolated schemes.
5 out of 11 possible corridors selected
Definition, refinement and selection of corridors is explained in Section 4.3 of Chapter 4 The Strategic Case – Developing the TCF Scenario
Three avenues were explored to generate options for intervention:
- Complete the corridor-based structure by adding dimensions such as key themes and type of schemes;
- Review of previous studies including (but not limited to) EOI and Tranche 1 submissions; and
- Stakeholder engagement
104 potential
Option identification process is explained in section 4.5 of Chapter 4.
schemes totalling £169 million of investment identified; A long list of candidate schemes and options generated for each corridor
2
CONNECTING SOUTHAMPTON CITY REGION TRANSFORMING CITIES FUND STRATEGIC OUTLINE BUSINESS CASE
Step 6: Initial Sifting
103 schemes on the
Sifting Process is explained in section 4.6 and 4.7 of Chapter 4.
A 3-step process where candidate schemes were long list found to be a firstly screened on their Strategic Fit, then (if deemed strategic fit in the 1st suitable), assessed on their Economic, Financial, stage. Management & Commercial Case credentials.
14 schemes were Schemes which did not meet a minimum threshold in removed from the any category were discounted, then further sifting long list in the 2nd based on average scores in order to make a stronger stage with 89 case. remaining.
Step 7: Development and Assessment of Potential Options
Summarise the scenario option development (High, Medium and Low) process.
Three scales of TCF Programme have been developed and have been shaped by codevelopment discussions with DfT.
Process of formulating the High, Medium and Low funding scenarios is explained in Section 4.7 of Chapter 4.
Table 3-1 – Key Steps in Development of the SOBC
3.2. Overview of the Southampton City Region The Southampton City Region sits at the heart of the south coast and Solent sub-region. The City Region has two of the South East’s main international gateways - the Port of Southampton and Southampton Airport. It is also a gateway to the Isle of Wight.
The City Region is an area of growth, with the population forecast to grow by 22% between 2011 and 2036, with 19,400 new jobs, 42,600 new homes and 472,000m² of employment land.
3.2.1. Southampton City Region’s Geography The Southampton City Region is centred on Southampton, but its urbanised area covers a wider area extending out to neighbouring towns and villages in Hampshire, as shown in Map 3.1.
Map 3.1 - The Southampton City Region
3
CONNECTING SOUTHAMPTON CITY REGION TRANSFORMING CITIES FUND STRATEGIC OUTLINE BUSINESS CASE
The City Region has an extended hinterland with the economies and local connectivity in Romsey and Winchester also significantly orientated towards Southampton. Local Government across the City Region is split across two Local Transport Authorities – Southampton and Hampshire, and it consists of four Local Planning Authorities:
• all of the Southampton City Council unitary area; • all of Eastleigh Borough; • part of New Forest District; and • part of Test Valley Borough.
Most of the 83 square miles within the City Region are predominately urban and residential in nature. Employment and commercial activities are focussed in several well-defined specific locations. Southampton is a large, regionally important centre for commerce and employment. It extends to include the surrounding towns of Totton, Chandlers Ford, Eastleigh and Hedge End. These towns (and associated suburban areas) also function as important centres for employment and service and have significant residential populations. Beyond these four main towns are the mainly residential medium-sized communities of on the Waterside (Marchwood, Hythe & Fawley), Bishopstoke & Fair Oak, Botley, and Hamble.
Within the City Region, there are defined local centres that provide a good range of retail, healthcare and other community services for people. These include Bitterne, Lordshill, Portswood, Shirley, and Woolston District Centres in Southampton and Eastleigh Town Centre, Hedge Village and West End in surrounding Hampshire.
Economic geography – The area’s economic geography is constrained and shaped by its coastal location - which is also its strongest asset. The Rivers Test and Itchen, which flow into Southampton Water, form barriers to people making common journeys. This results in there not being 360° access to the City Centre. It means that transport corridors are radial and any route that avoids the centre is popular – such as the M27. The River Itchen between Southampton Water and Eastleigh is only crossed by seven road bridges, of which one carries the M27 motorway. The limited number of bridge crossings means that the river acts as a restrictive barrier to travel between the eastern and western parts of the City Region.
Southampton Water taken together with the River Test estuary form a significant barrier to accessing Southampton from the New Forest. The width of Southampton Water and its’ use as major shipping lane precludes any crossing points. There are only two road bridges that cross the southern part of the River Test within New Forest District. These are the A35 Redbridge Causeway and the M27. There is also a passenger ferry service that links Hythe to Southampton.
Development of the City Region - Over time the pattern of development moving out from the City Centre has gone through the dense inner city terraced housing around centres of Southampton and Eastleigh, to pre-and post-war suburbs surrounding them. Post-war local authority housing estates were created close to the City Centre or on the edge of Southampton. With further suburban development accelerated from the 1960s with development in Totton, Marchwood, Chandlers Ford, Eastleigh, Fair Oak, Netley and Hedge End. Development of the M271, M27 and M3 motorways opened up access to large tracts of new developable and car-accessible land. This resulted in newer employment centres being built from the 1980s onwards for a range of commercial sectors including manufacturing, service, logistics and offices.
Following the de-industrialisation of central Southampton, there has been regeneration of brownfield sites in Southampton City Centre with concentrations of new mixed use development sites at places such as Ocean Village and West Quay. This housing pattern has grown across the local authority boundaries and its layout and density has affected people’s travel behaviour. Areas outside of Southampton have a lower housing density which in turn has led to higher levels of car ownership and usage.
National Parks - To the west and north-east of the City Region are two National Parks – the New Forest and the South Downs. There are other environmental designations on both rivers for ecology and habitat, and Country Parks in Netley and Hedge End alongside numerous Local Nature Reserves. These locations are mapped in Appendix 2a, b & c. This constrains the development of the City Region and any further highway related transport infrastructure to by-pass the City Region.
4
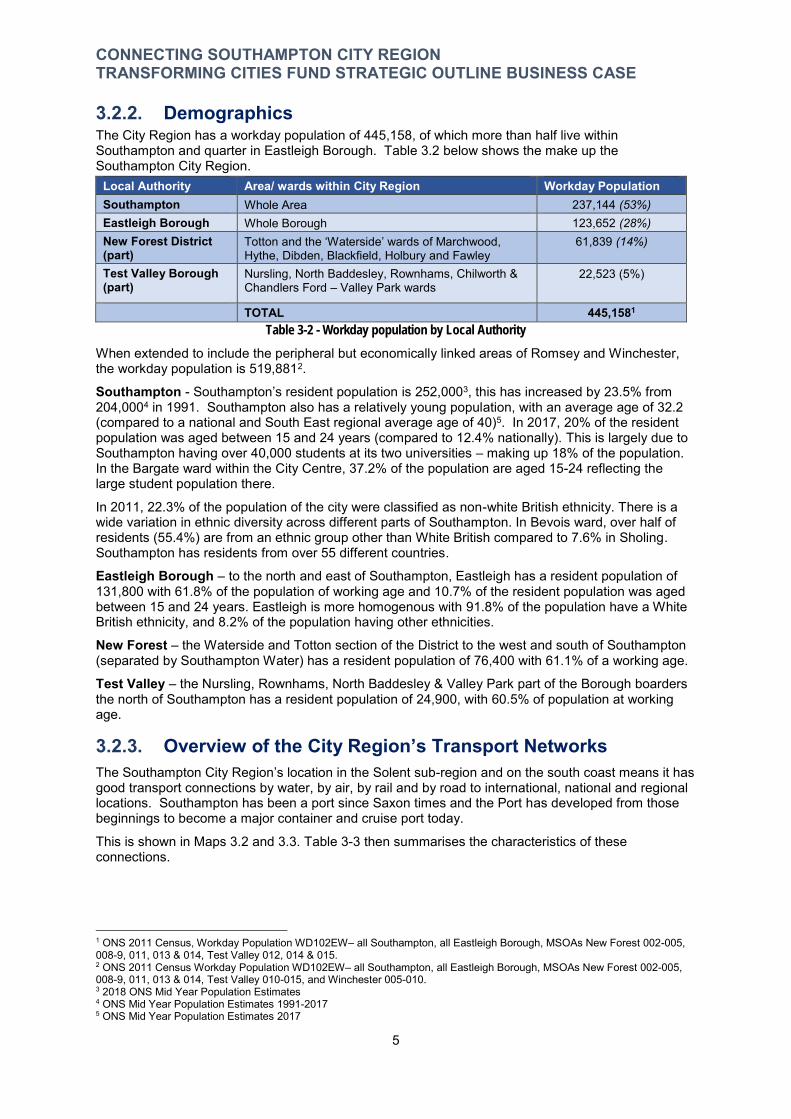
CONNECTING SOUTHAMPTON CITY REGION TRANSFORMING CITIES FUND STRATEGIC OUTLINE BUSINESS CASE
3.2.2. Demographics The City Region has a workday population of 445,158, of which more than half live within Southampton and quarter in Eastleigh Borough. Table 3.2 below shows the make up the Southampton City Region.
Local Authority Area/ wards within City Region Workday Population Southampton Whole Area 237,144 (53%) Eastleigh Borough Whole Borough 123,652 (28%) New Forest District (part)
Totton and the ‘Waterside’ wards of Marchwood, Hythe, Dibden, Blackfield, Holbury and Fawley
61,839 (14%)
Test Valley Borough (part)
Nursling, North Baddesley, Rownhams, Chilworth & Chandlers Ford – Valley Park wards
22,523 (5%)
TOTAL 445,1581
Table 3-2 - Workday population by Local Authority
When extended to include the peripheral but economically linked areas of Romsey and Winchester, the workday population is 519,8812.
Southampton - Southampton’s resident population is 252,0003, this has increased by 23.5% from 204,0004 in 1991. Southampton also has a relatively young population, with an average age of 32.2 (compared to a national and South East regional average age of 40)5. In 2017, 20% of the resident population was aged between 15 and 24 years (compared to 12.4% nationally). This is largely due to Southampton having over 40,000 students at its two universities – making up 18% of the population. In the Bargate ward within the City Centre, 37.2% of the population are aged 15-24 reflecting the large student population there.
In 2011, 22.3% of the population of the city were classified as non-white British ethnicity. There is a wide variation in ethnic diversity across different parts of Southampton. In Bevois ward, over half of residents (55.4%) are from an ethnic group other than White British compared to 7.6% in Sholing. Southampton has residents from over 55 different countries.
Eastleigh Borough – to the north and east of Southampton, Eastleigh has a resident population of 131,800 with 61.8% of the population of working age and 10.7% of the resident population was aged between 15 and 24 years. Eastleigh is more homogenous with 91.8% of the population have a White British ethnicity, and 8.2% of the population having other ethnicities.
New Forest – the Waterside and Totton section of the District to the west and south of Southampton (separated by Southampton Water) has a resident population of 76,400 with 61.1% of a working age.
Test Valley – the Nursling, Rownhams, North Baddesley & Valley Park part of the Borough boarders the north of Southampton has a resident population of 24,900, with 60.5% of population at working age.
3.2.3. Overview of the City Region’s Transport Networks The Southampton City Region’s location in the Solent sub-region and on the south coast means it has good transport connections by water, by air, by rail and by road to international, national and regional locations. Southampton has been a port since Saxon times and the Port has developed from those beginnings to become a major container and cruise port today.
This is shown in Maps 3.2 and 3.3. Table 3-3 then summarises the characteristics of these connections.
1 ONS 2011 Census, Workday Population WD102EW– all Southampton, all Eastleigh Borough, MSOAs New Forest 002-005, 008-9, 011, 013 & 014, Test Valley 012, 014 & 015. 2 ONS 2011 Census Workday Population WD102EW– all Southampton, all Eastleigh Borough, MSOAs New Forest 002-005, 008-9, 011, 013 & 014, Test Valley 010-015, and Winchester 005-010. 3 2018 ONS Mid Year Population Estimates 4 ONS Mid Year Population Estimates 1991-2017 5 ONS Mid Year Population Estimates 2017
5
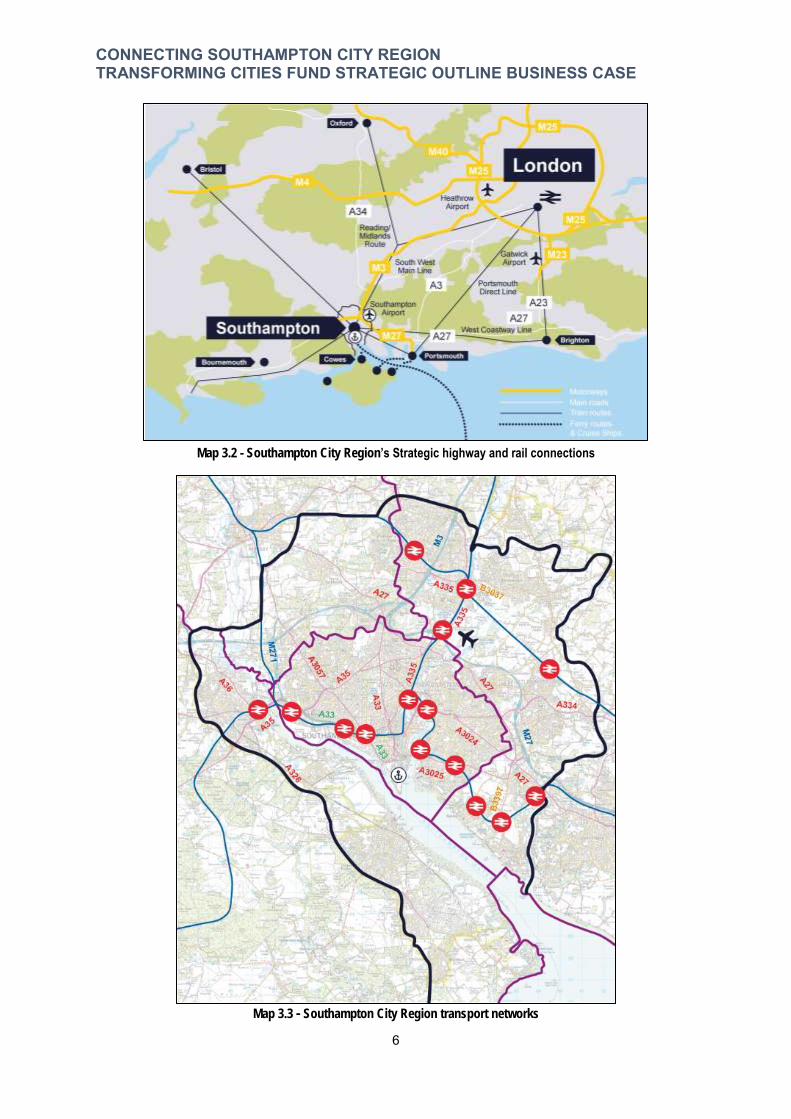
CONNECTING SOUTHAMPTON CITY REGION TRANSFORMING CITIES FUND STRATEGIC OUTLINE BUSINESS CASE
Map 3.2 - Southampton City Region’s Strategic highway and rail connections
Map 3.3 - Southampton City Region transport networks
6
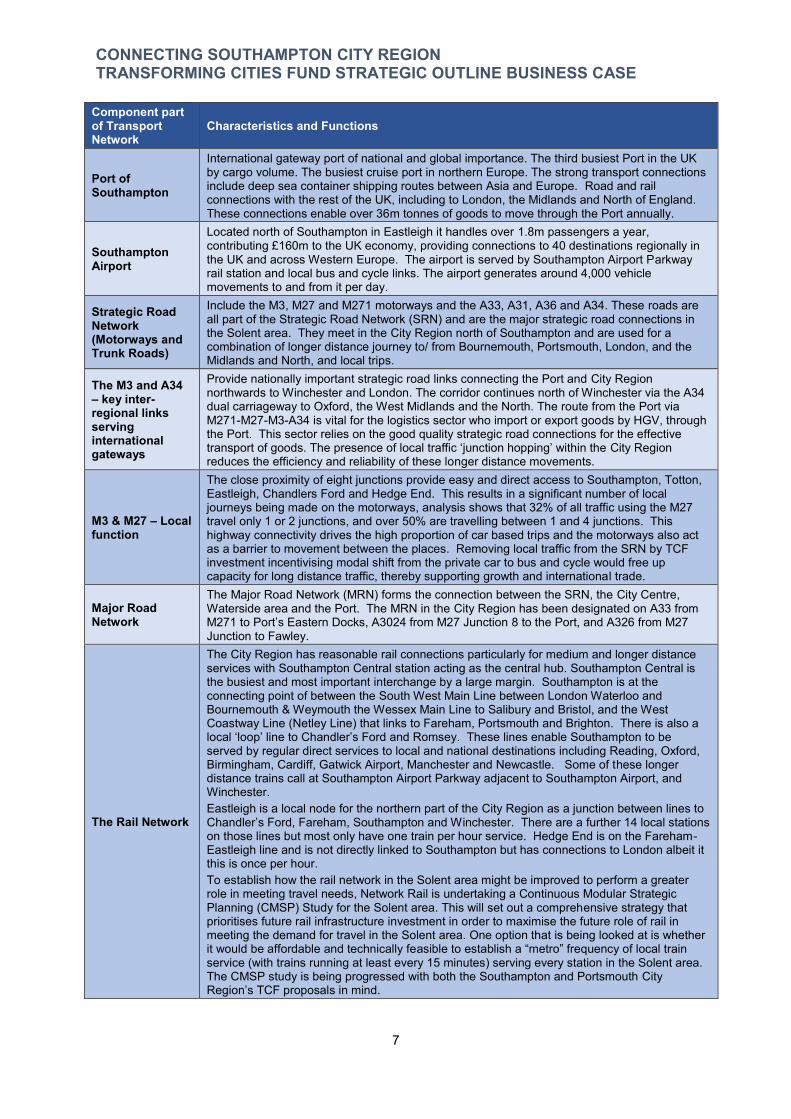
CONNECTING SOUTHAMPTON CITY REGION TRANSFORMING CITIES FUND STRATEGIC OUTLINE BUSINESS CASE
Component part of Transport Characteristics and Functions Network
International gateway port of national and global importance. The third busiest Port in the UK Port of Southampton
by cargo volume. The busiest cruise port in northern Europe. The strong transport connections include deep sea container shipping routes between Asia and Europe. Road and rail connections with the rest of the UK, including to London, the Midlands and North of England. These connections enable over 36m tonnes of goods to move through the Port annually. Located north of Southampton in Eastleigh it handles over 1.8m passengers a year,
Southampton Airport
contributing £160m to the UK economy, providing connections to 40 destinations regionally in the UK and across Western Europe. The airport is served by Southampton Airport Parkway rail station and local bus and cycle links. The airport generates around 4,000 vehicle movements to and from it per day.
Strategic Road Network (Motorways and Trunk Roads)
Include the M3, M27 and M271 motorways and the A33, A31, A36 and A34. These roads are all part of the Strategic Road Network (SRN) and are the major strategic road connections in the Solent area. They meet in the City Region north of Southampton and are used for a combination of longer distance journey to/ from Bournemouth, Portsmouth, London, and the Midlands and North, and local trips.
The M3 and A34 – key inter-regional links serving international gateways
Provide nationally important strategic road links connecting the Port and City Region northwards to Winchester and London. The corridor continues north of Winchester via the A34 dual carriageway to Oxford, the West Midlands and the North. The route from the Port via M271-M27-M3-A34 is vital for the logistics sector who import or export goods by HGV, through the Port. This sector relies on the good quality strategic road connections for the effective transport of goods. The presence of local traffic ‘junction hopping’ within the City Region reduces the efficiency and reliability of these longer distance movements. The close proximity of eight junctions provide easy and direct access to Southampton, Totton, Eastleigh, Chandlers Ford and Hedge End. This results in a significant number of local journeys being made on the motorways, analysis shows that 32% of all traffic using the M27
M3 & M27 – Local travel only 1 or 2 junctions, and over 50% are travelling between 1 and 4 junctions. This function highway connectivity drives the high proportion of car based trips and the motorways also act
as a barrier to movement between the places. Removing local traffic from the SRN by TCF investment incentivising modal shift from the private car to bus and cycle would free up capacity for long distance traffic, thereby supporting growth and international trade. The Major Road Network (MRN) forms the connection between the SRN, the City Centre,
Major Road Waterside area and the Port. The MRN in the City Region has been designated on A33 from Network M271 to Port’s Eastern Docks, A3024 from M27 Junction 8 to the Port, and A326 from M27
Junction to Fawley. The City Region has reasonable rail connections particularly for medium and longer distance services with Southampton Central station acting as the central hub. Southampton Central is the busiest and most important interchange by a large margin. Southampton is at the connecting point of between the South West Main Line between London Waterloo and Bournemouth & Weymouth the Wessex Main Line to Salibury and Bristol, and the West Coastway Line (Netley Line) that links to Fareham, Portsmouth and Brighton. There is also a local ‘loop’ line to Chandler’s Ford and Romsey. These lines enable Southampton to be served by regular direct services to local and national destinations including Reading, Oxford, Birmingham, Cardiff, Gatwick Airport, Manchester and Newcastle. Some of these longer distance trains call at Southampton Airport Parkway adjacent to Southampton Airport, and Winchester. Eastleigh is a local node for the northern part of the City Region as a junction between lines to
The Rail Network Chandler’s Ford, Fareham, Southampton and Winchester. There are a further 14 local stations on those lines but most only have one train per hour service. Hedge End is on the Fareham-Eastleigh line and is not directly linked to Southampton but has connections to London albeit it this is once per hour. To establish how the rail network in the Solent area might be improved to perform a greater role in meeting travel needs, Network Rail is undertaking a Continuous Modular Strategic Planning (CMSP) Study for the Solent area. This will set out a comprehensive strategy that prioritises future rail infrastructure investment in order to maximise the future role of rail in meeting the demand for travel in the Solent area. One option that is being looked at is whether it would be affordable and technically feasible to establish a “metro” frequency of local train service (with trains running at least every 15 minutes) serving every station in the Solent area. The CMSP study is being progressed with both the Southampton and Portsmouth City Region’s TCF proposals in mind.
7
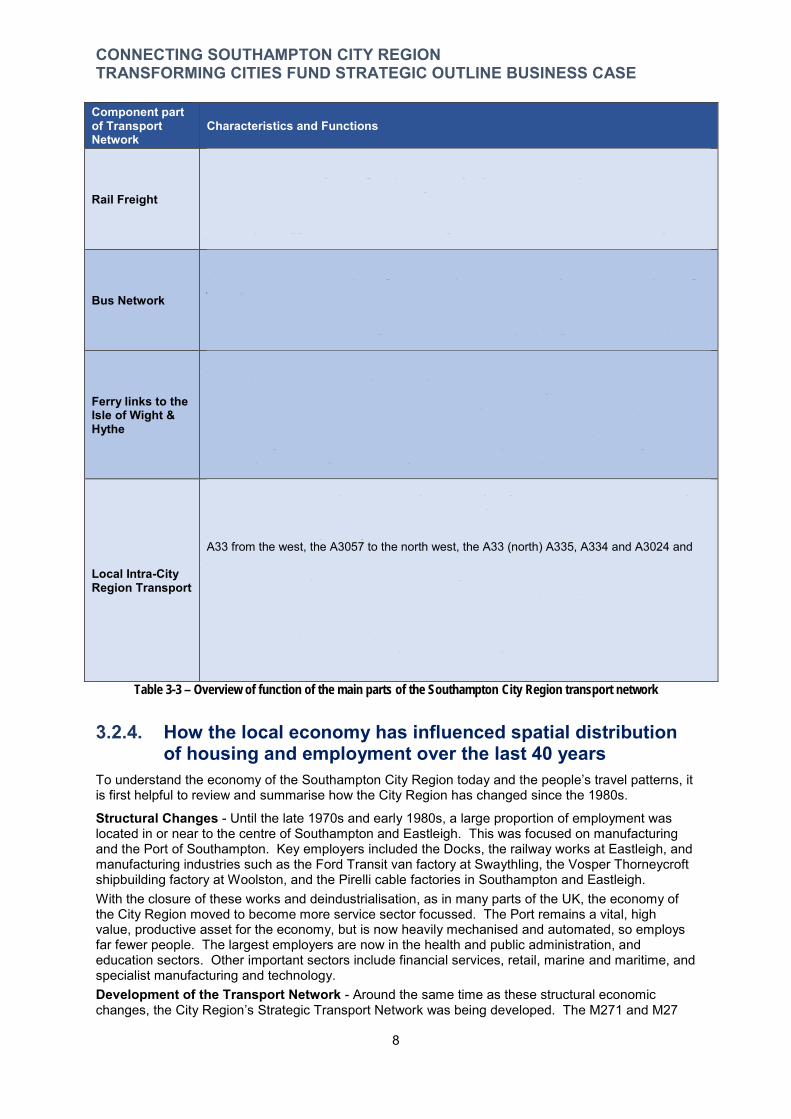
CONNECTING SOUTHAMPTON CITY REGION TRANSFORMING CITIES FUND STRATEGIC OUTLINE BUSINESS CASE
Component part of Transport Network
Characteristics and Functions
Rail Freight
The Port of Southampton is a significant generator of rail freight, with around 20 freight services each weekday serving the port. The majority of these are deep sea intermodal container services to and from inland freight terminals in the Midlands and the North West of England. There is also a smaller number of automotive freight trains to and from car manufacturing plants in the West Midlands and Oxford, for export to Asian markets. Network Rail analysis suggests that the number of freight paths required to serve forecast port growth will need to increase to around 51 freight paths per weekday and on Saturdays
Bus Network
The City Region has a network of intra and inter urban bus services operated by two main providers – GoSouthCoast (trading as Bluestar) and First Southampton. 21.2m bus passenger journeys were made in 2017/18. In Southampton suburban services connect suburbs with main corridors to link with the City Centre. Inter urban bus services connect Southampton with Totton, Hythe, Romsey, Chandler’s Ford, Eastleigh, Bishopstoke, Hedge End, Bursledon and Hamble. There are also inter-regional services to Salisbury, Lymington, Fareham, Gosport and Portsmouth.
Ferry links to the Isle of Wight & Hythe
Southampton functions as a key gateway to the Isle of Wight. Frequent passenger and vehicle ferries operate from Town Quay in the City Centre to East and West Cowes. This is a vital connection for the 5m people that travel across the Solent each year, and for businesses, healthcare services and education on the Isle of Wight. There is also a local ferry connection across Southampton Water from Town Quay to Hythe. Town Quay is connected to Southampton Central station via a shuttle bus service which enables people to transfer between ferry and London bound trains. However, compared to other modern ferry terminals the quality of interchange and passenger facilities at Town Quay and at the rail station are poor.
Local Intra-City Region Transport
The excellent connectivity to markets beyond the City Region is not reflected in the capacity and reliability of the transport links within the City Region itself particularly the last mile to the Port and other economic drivers. Access into Southampton City Centre is via seven main road corridors shown in Map 3.3: the A33 from the west, the A3057 to the north west, the A33 (north) A335, A334 and A3024 and A3025 that run from the SRN. The A33 (west) from the southern end of the M271 also provides the primary access to the Port. Eastleigh town centre has access from both the M3 and M27 via the A335, which also provides access to Southampton Airport. Totton is accessed from M271 via A35 and M27 via A326 which also provides the main access route to the Waterside area. Hedge End is served by A334 from M27. These local transport networks provide the vital transport connections between the SRN and the centres of Southampton, Eastleigh, Totton and Hedge End, where people live and where they work. These routes also serve District Centres and are multi-modal routes providing routes for cars, HGVs, buses, cycles and pedestrians.
Table 3-3 – Overview of function of the main parts of the Southampton City Region transport network
3.2.4. How the local economy has influenced spatial distribution of housing and employment over the last 40 years
To understand the economy of the Southampton City Region today and the people’s travel patterns, it is first helpful to review and summarise how the City Region has changed since the 1980s.
Structural Changes - Until the late 1970s and early 1980s, a large proportion of employment was located in or near to the centre of Southampton and Eastleigh. This was focused on manufacturing and the Port of Southampton. Key employers included the Docks, the railway works at Eastleigh, and manufacturing industries such as the Ford Transit van factory at Swaythling, the Vosper Thorneycroft shipbuilding factory at Woolston, and the Pirelli cable factories in Southampton and Eastleigh. With the closure of these works and deindustrialisation, as in many parts of the UK, the economy of the City Region moved to become more service sector focussed. The Port remains a vital, high value, productive asset for the economy, but is now heavily mechanised and automated, so employs far fewer people. The largest employers are now in the health and public administration, and education sectors. Other important sectors include financial services, retail, marine and maritime, and specialist manufacturing and technology. Development of the Transport Network - Around the same time as these structural economic changes, the City Region’s Strategic Transport Network was being developed. The M271 and M27
8

CONNECTING SOUTHAMPTON CITY REGION TRANSFORMING CITIES FUND STRATEGIC OUTLINE BUSINESS CASE
motorways were fully completed by 1983 and provided a strategic link between Southampton and Portsmouth. The subsequent extension of the M3 motorway in the early 1990s from Winchester to Southampton connected with the M27. This radically changed connectivity locally and to the Midlands and London. These new and improved motorway links unlocked new developable land at the edge of the City Region. It dramatically improved car-based mobility - triggering major changes to the social and economic geography of the City Region (and, indeed, the entire Solent area). Journey times to destinations outside of the City Region were cut and those areas close to motorway junctions became prime sites for new housing and commercial development. Housing & Employment - Demand for housing, newly accessible land and easy journeys to London fostered new low-density suburban housing developments. There were often in areas not well connected to Southampton City Centre or Town Centres of Eastleigh or Totton. Areas like Hedge End, Chandlers Ford and Totton expanded rapidly – the population of the City Region grew by 15% between 1971 and 2011. As well as housing, cheaper land encouraged the decentralisation of employment out of Southampton City Centre. Many employers relocated to modern, purpose built business parks and industrial estates at or close to junctions along the M27 corridor. One example is Ordnance Survey, which moved from central Southampton to a purpose built office close to M271 Junction 1. This in turn has led to increasingly car-centric patterns of travel to work to these locations outside of the City Centre. They are generally poorly connected by public transport, are outside of easy walking or cycling distances from many residential areas and were designed from the ground up around car usage. While this dispersal of employment has benefited employers by providing improved access to wider labour markets and national transport connections, it has massively driven up car-dependency and car usage. In turn, local journeys for commuting to access these sites has filled up capacity on many parts of the SRN in the City Region, resulting in congestion on these strategic links. The inability of SRN links to offer reliable journey times for economically critical journeys (such as freight movement to/from the Port) has been identified as a significant factor behind below-average productivity (and stalled growth in productivity) in the City Region. The overall result is that the City Region has become an increasingly polycentric area over the last four decades. With a 17%6 decline in the proportion of population in the urban centre of Southampton and much greater levels of housing development outside the most accessible parts of the City Region (see below).
Distribution of Housing Development As shown by Figure 3.1, between 1981 and 2017, more than twice the amount of housing growth in the Solent has occurred outside the two main cities (Southampton and Portsmouth), as has occurred within them.
Figure 3-1 – Housing growth delivered in the Solent both inside and outside of Portsmouth and Southampton 1981-
20177
Housing development - Enabled by the development of the SRN starting with the M27, the majority of housing development in the City Region over the past 40 years has taken place in greenfield sites.
6 Population change between 1981 and 2011 in Southampton, ONS and AECOM 7 Analysis by Solent Transport
9
CONNECTING SOUTHAMPTON CITY REGION TRANSFORMING CITIES FUND STRATEGIC OUTLINE BUSINESS CASE
This is largely on the edges of existing urban areas and villages around Eastleigh, Totton, Chandler’s Ford and Hedge End. These estates were designed so that car access is easy. The consequence has been higher car ownership and ‘car dependency’, and lower levels of bus usage and active travel. Additionally, their location close to the M3 and M27 mean that the motorways themselves act as barriers to movement into the centres of Eastleigh and Southampton with only a limited number of crossing points.
Car Ownership - The majority of these locations have higher than average levels of car ownership with 45% of households owning two or more cars – compared to only 25.8% of households in Southampton. Over 80% of commuter trips from these areas are made by car, in Southampton it is 61%.
Car dependent development mean bus services in some recently developed areas have struggled to remain viable. Much of Hedge End is served by just one hourly bus to Southampton (two hourly services in a limited part of the town), which take almost 60 minutes to make a journey that can often be driven in half that time. Rail travel from these areas into Southampton is low – less than 3% of trips from Eastleigh are by rail (primarly due to a low frequency train service). The location of these recent developments has made them popular for commuting out of the City Region to Winchester, Basingstoke and outer London.
Conversely over the same period, the scale of development within Southampton has been lower. Large scale regeneration started in the late 1990s with Ocean Village and West Quay. Since 2010 several new housing developments in Southampton City Centre have come forward. Ocean Village was built on part of the Port’s Eastern Docks and has become an attractive residential quarter with waterside leisure areas. Disused factory or office sites have been redeveloped, from Ordnance Survey on Romsey Road to Meridian Waterside on the former Meridian TV Studios. There has been a high proportion of purpose built student flat developments to serve the two Universities, including Mayflower Halls. As a consequence of the refocus on the City Centre, the Bargate ward has seen a population increase of 94% since 20118, and levels of car ownership are much lower with 43% of households not having a car.
The City Centre will continue to be the focus for future development to 2026 and beyond. The City Centre Masterplan envisaged that between 2012 and 2026 5,500 new homes would be provided in the City Centre. This would continue to increase the population and provide new mixed use developments. However, there is still a significant amount of development planned outside of Southampton on greenfield sites to 2036. These sites will require high quality public transport and active travel connections to interchanges and into Southampton to mitigate the level of predicted car based trips.
3.2.5. Trends in Location of Employment Development The decentralisation of employment over the past 40 years has seen a belt of development along the M27 & M3. This investment in new office and light industrial space has seen new business parks and industrial estates built on the edge of the urban area. These are shown in Map 3.5 and include Nursling Industrial Estate, Hampshire Corporate Park, offices around Southampton Airport, Hedge End, Segensworth and at Solent Business Park, Whiteley. The modern out-of-town business parks at the motorway junctions have attracted businesses, some of which have relocated from central locations. For example, HSBC in 2015 relocated their regional office from adjacent to Southampton Central station to Solent Business Park. However, HSBC run a shuttle bus service from Southampton Central and Southampton Airport Parkway to Whiteley. This loss of more productive jobs out of the city has had an impact on overall GVA.
Within Southampton, there has been recent purpose built commercial development with the UK headquarters of Carnival Cruise. Other employment areas such as the Port have expanded and intensified with the types of jobs changing. However, despite this the total amount of office floorspace has fallen by 36% from 424,000m2 in 2000 to 310,000m2 in 20199. Conversely, over the same period Eastleigh Borough saw the total amount of office floorspace grow by 41% from 124,000m2 to 175,000m2.
8 Centre for Cities, 2018 9 Non-Domestic Rating office sector total floorspace by administrative area 2000-2019, ONS, 2019
10
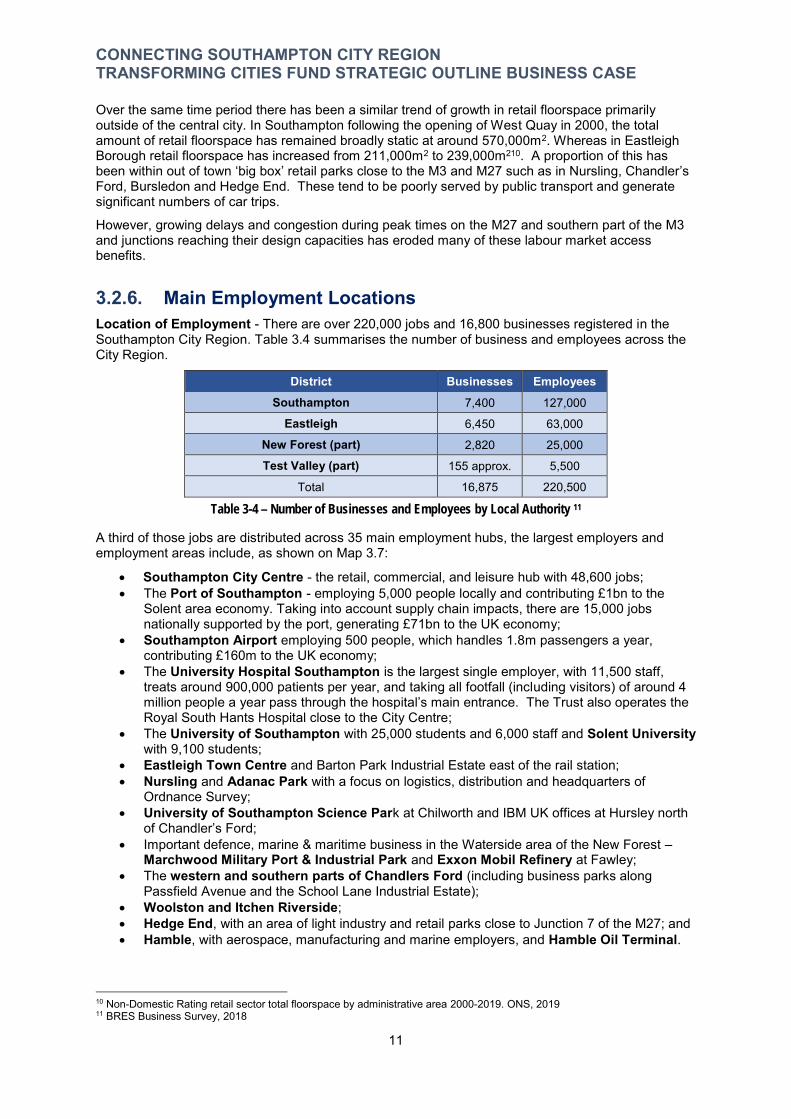
CONNECTING SOUTHAMPTON CITY REGION TRANSFORMING CITIES FUND STRATEGIC OUTLINE BUSINESS CASE
Over the same time period there has been a similar trend of growth in retail floorspace primarily outside of the central city. In Southampton following the opening of West Quay in 2000, the total amount of retail floorspace has remained broadly static at around 570,000m2. Whereas in Eastleigh Borough retail floorspace has increased from 211,000m2 to 239,000m210. A proportion of this has been within out of town ‘big box’ retail parks close to the M3 and M27 such as in Nursling, Chandler’s Ford, Bursledon and Hedge End. These tend to be poorly served by public transport and generate significant numbers of car trips.
However, growing delays and congestion during peak times on the M27 and southern part of the M3 and junctions reaching their design capacities has eroded many of these labour market access benefits.
3.2.6. Main Employment Locations Location of Employment - There are over 220,000 jobs and 16,800 businesses registered in the Southampton City Region. Table 3.4 summarises the number of business and employees across the City Region.
District Businesses Employees Southampton 7,400 127,000
Eastleigh 6,450 63,000
New Forest (part) 2,820 25,000
Test Valley (part) 155 approx. 5,500
Total 16,875 220,500
Table 3-4 – Number of Businesses and Employees by Local Authority 11
A third of those jobs are distributed across 35 main employment hubs, the largest employers and employment areas include, as shown on Map 3.7:
Southampton City Centre - the retail, commercial, and leisure hub with 48,600 jobs; The Port of Southampton - employing 5,000 people locally and contributing £1bn to the
Solent area economy. Taking into account supply chain impacts, there are 15,000 jobs nationally supported by the port, generating £71bn to the UK economy;
Southampton Airport employing 500 people, which handles 1.8m passengers a year, contributing £160m to the UK economy;
The University Hospital Southampton is the largest single employer, with 11,500 staff, treats around 900,000 patients per year, and taking all footfall (including visitors) of around 4 million people a year pass through the hospital’s main entrance. The Trust also operates the Royal South Hants Hospital close to the City Centre;
The University of Southampton with 25,000 students and 6,000 staff and Solent University with 9,100 students;
Eastleigh Town Centre and Barton Park Industrial Estate east of the rail station; Nursling and Adanac Park with a focus on logistics, distribution and headquarters of
Ordnance Survey; University of Southampton Science Park at Chilworth and IBM UK offices at Hursley north
of Chandler’s Ford; Important defence, marine & maritime business in the Waterside area of the New Forest –
Marchwood Military Port & Industrial Park and Exxon Mobil Refinery at Fawley; The western and southern parts of Chandlers Ford (including business parks along
Passfield Avenue and the School Lane Industrial Estate); Woolston and Itchen Riverside; Hedge End, with an area of light industry and retail parks close to Junction 7 of the M27; and Hamble, with aerospace, manufacturing and marine employers, and Hamble Oil Terminal.
10 Non-Domestic Rating retail sector total floorspace by administrative area 2000-2019. ONS, 2019 11 BRES Business Survey, 2018
11
CONNECTING SOUTHAMPTON CITY REGION TRANSFORMING CITIES FUND STRATEGIC OUTLINE BUSINESS CASE
Across the City Region there are a number of national and international brands and companies with a significant presence or headquarters.
Southampton - UK headquarters of Carnival Cruises (operator of the P&O and Princess brands), the home of the Ordnance Survey and Port of Southampton, and has several companies employing over 1,000 people including Babock (formly Vosper Thornycroft), Southampton Marine & Maritime Institute, Newsquest, Skandia Life, South Western Railway, and Tesco and Lidl Distribution Centres.
Eastleigh - the headquarters of B&Q, Prysmian Cables, and in Hamble a major BP Oil Terminal and UK base for GE Aviation design.
The Waterside area of New Forest District - Garmin UK, Esso at Fawley Oil Refinery, and the Royal Navy Fleet Auxiliary at Marchwood Military Port.
Test Valley Borough - contains Southampton Science Park as a hub of digital development, the international headquarters of Ordnance Survey, and offices of Ageas and Aviva.
The largest employment sectors are manufacturing and logistics with 28,750 jobs, health with 11,000, higher & further education with 9,100 and maritime and defence with 6,870. This leads to a large reliance on the administrative sector which can be lower paid, a different level of productivity, and also businesses with close links to the Port such as the logistics and maritime sectors.
The main employment locations and industry sectors (with breakdown of numbers of jobs) are shown on Map 3.4.
12
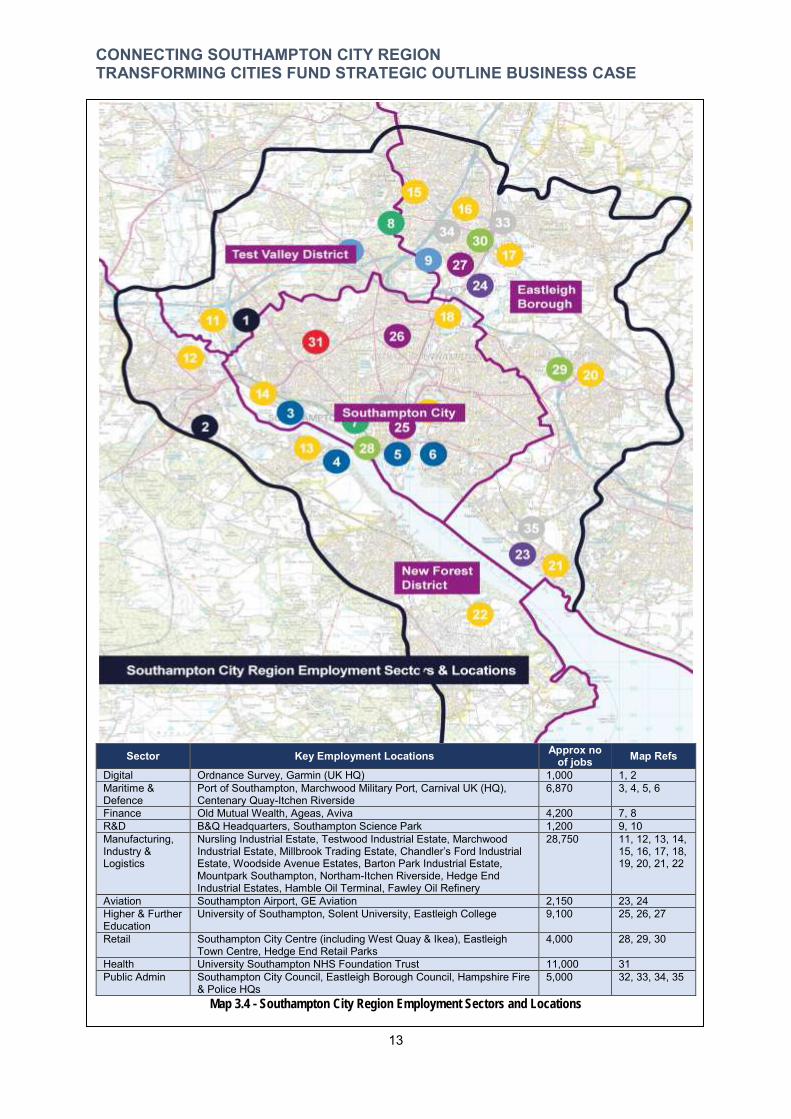
CONNECTING SOUTHAMPTON CITY REGION TRANSFORMING CITIES FUND STRATEGIC OUTLINE BUSINESS CASE
Sector Key Employment Locations Approx no of jobs Map Refs
Digital Ordnance Survey, Garmin (UK HQ) 1,000 1, 2 Maritime & Defence
Port of Southampton, Marchwood Military Port, Carnival UK (HQ), Centenary Quay-Itchen Riverside
6,870 3, 4, 5, 6
Finance Old Mutual Wealth, Ageas, Aviva 4,200 7, 8 R&D B&Q Headquarters, Southampton Science Park 1,200 9, 10 Manufacturing, Industry & Logistics
Nursling Industrial Estate, Testwood Industrial Estate, Marchwood Industrial Estate, Millbrook Trading Estate, Chandler’s Ford Industrial Estate, Woodside Avenue Estates, Barton Park Industrial Estate, Mountpark Southampton, Northam-Itchen Riverside, Hedge End Industrial Estates, Hamble Oil Terminal, Fawley Oil Refinery
28,750 11, 12, 13, 14, 15, 16, 17, 18, 19, 20, 21, 22
Aviation Southampton Airport, GE Aviation 2,150 23, 24 Higher & Further Education
University of Southampton, Solent University, Eastleigh College 9,100 25, 26, 27
Retail Southampton City Centre (including West Quay & Ikea), Eastleigh Town Centre, Hedge End Retail Parks
4,000 28, 29, 30
Health University Southampton NHS Foundation Trust 11,000 31 Public Admin Southampton City Council, Eastleigh Borough Council, Hampshire Fire
& Police HQs 5,000 32, 33, 34, 35
Map 3.4 - Southampton City Region Employment Sectors and Locations
13

CONNECTING SOUTHAMPTON CITY REGION TRANSFORMING CITIES FUND STRATEGIC OUTLINE BUSINESS CASE
Density of Employment - The distribution of this employment density is indicated on Map 3.5. The City Region has a jobs density per hectare is 12.65. Southampton has a job density of 27 jobs per hectare. In the other areas job density is lower with Eastleigh at 9.78, New Forest 5.83 and Test Valley 2.86. The clustered nature of employment distribution contributes to the differences in density and in turn productivity. Map 3.5 also shows the dense employment cluster at Solent Business Park, Whiteley, (dark blue 31) east of the City Region boundary. This which is located next to M27 Junction 9 and has grown significantly since the mid-1990s, and today has a high concentration of office and retail employment, as well as suburban residential development. There are a further 3,500 homes planned over the next 15 years.
Map 3.5 - Map showing number of employee jobs per hectare for all wards within the City Region, 2017
Despite the trend of decentralisation to out of town sites, the City Centre remains the densest location for employment with almost 35,000 jobs. The number of jobs in the City Centre will increase with further development. There are a number of projects proposed as part of the City Centre Master Plan, including at Nelson Gate and Mayflower Quarter around Southampton Central Station. These are planned to include substantial office space, but are awaiting market opportunities to progress.
Map 3.6 highlights the significant concentrations of jobs in a ‘ring’ around the edge of Southampton and immediately north around M27/M3 interchange in Eastleigh. There is further growth planned at Adanac Park which has permission for 100,000m² of B1 & B8, at the Port and Airport, and at several sites in Eastleigh Borough. To asset in bringing these developments forward, and to maximise its economic and productivity benefits, suitable and efficient sustainable transport connections are required.
14
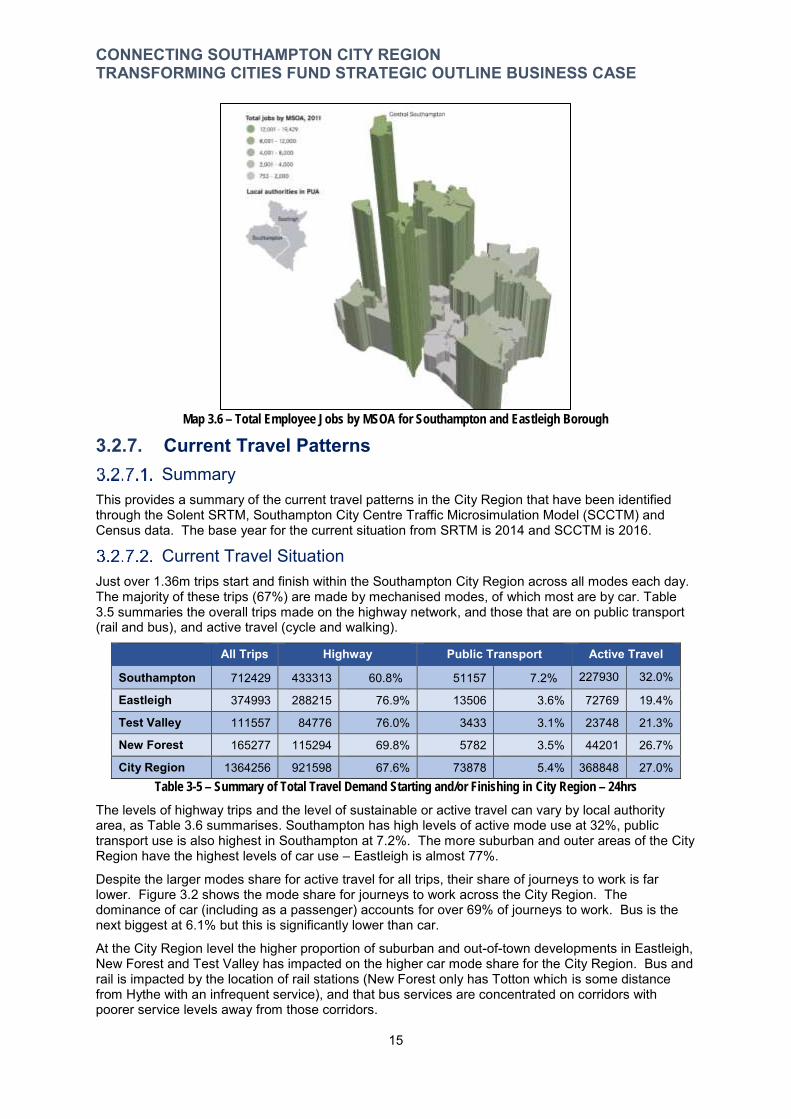
CONNECTING SOUTHAMPTON CITY REGION TRANSFORMING CITIES FUND STRATEGIC OUTLINE BUSINESS CASE
Map 3.6 – Total Employee Jobs by MSOA for Southampton and Eastleigh Borough
3.2.7. Current Travel Patterns Summary
This provides a summary of the current travel patterns in the City Region that have been identified through the Solent SRTM, Southampton City Centre Traffic Microsimulation Model (SCCTM) and Census data. The base year for the current situation from SRTM is 2014 and SCCTM is 2016.
Current Travel Situation Just over 1.36m trips start and finish within the Southampton City Region across all modes each day. The majority of these trips (67%) are made by mechanised modes, of which most are by car. Table 3.5 summaries the overall trips made on the highway network, and those that are on public transport (rail and bus), and active travel (cycle and walking).
All Trips Highway Public Transport Active Travel
Southampton 712429 433313 60.8% 51157 7.2% 227930 32.0%
Eastleigh 374993 288215 76.9% 13506 3.6% 72769 19.4%
Test Valley 111557 84776 76.0% 3433 3.1% 23748 21.3%
New Forest 165277 115294 69.8% 5782 3.5% 44201 26.7%
City Region 1364256 921598 67.6% 73878 5.4% 368848 27.0% Table 3-5 – Summary of Total Travel Demand Starting and/or Finishing in City Region – 24hrs
The levels of highway trips and the level of sustainable or active travel can vary by local authority area, as Table 3.6 summarises. Southampton has high levels of active mode use at 32%, public transport use is also highest in Southampton at 7.2%. The more suburban and outer areas of the City Region have the highest levels of car use – Eastleigh is almost 77%.
Despite the larger modes share for active travel for all trips, their share of journeys to work is far lower. Figure 3.2 shows the mode share for journeys to work across the City Region. The dominance of car (including as a passenger) accounts for over 69% of journeys to work. Bus is the next biggest at 6.1% but this is significantly lower than car.
At the City Region level the higher proportion of suburban and out-of-town developments in Eastleigh, New Forest and Test Valley has impacted on the higher car mode share for the City Region. Bus and rail is impacted by the location of rail stations (New Forest only has Totton which is some distance from Hythe with an infrequent service), and that bus services are concentrated on corridors with poorer service levels away from those corridors.
15
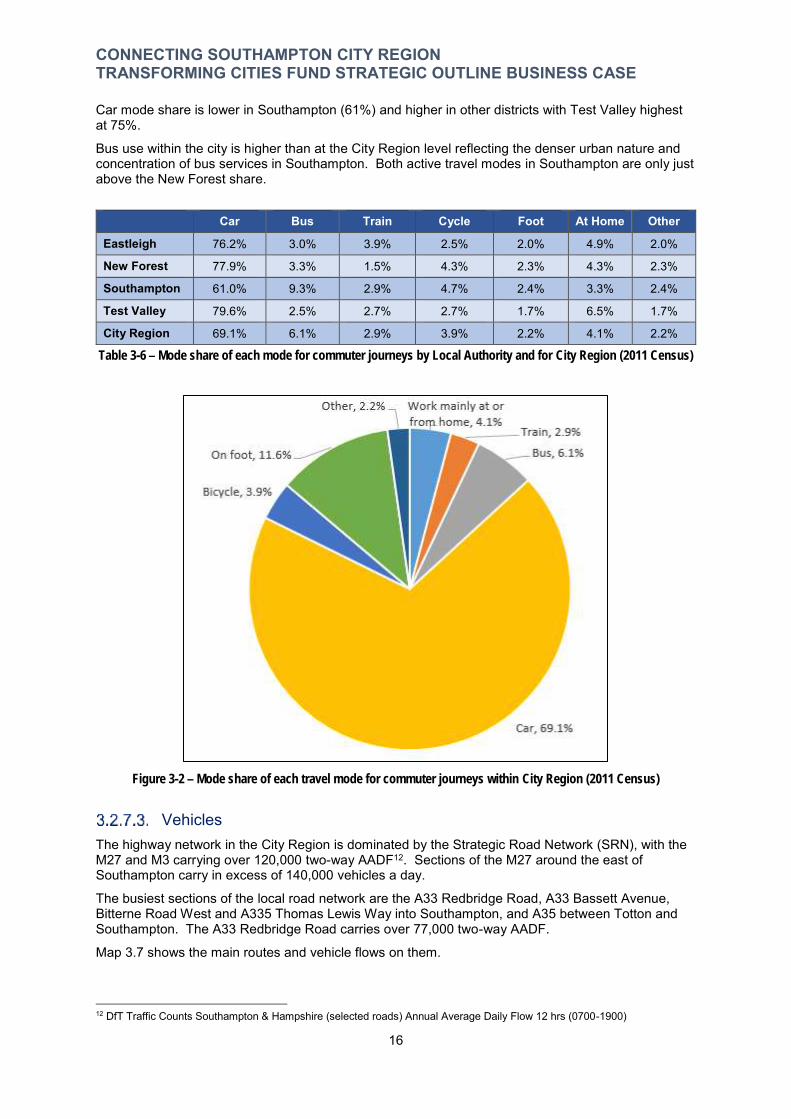
CONNECTING SOUTHAMPTON CITY REGION TRANSFORMING CITIES FUND STRATEGIC OUTLINE BUSINESS CASE
Car mode share is lower in Southampton (61%) and higher in other districts with Test Valley highest at 75%.
Bus use within the city is higher than at the City Region level reflecting the denser urban nature and concentration of bus services in Southampton. Both active travel modes in Southampton are only just above the New Forest share.
Car Bus Train Cycle Foot At Home Other
Eastleigh 76.2% 3.0% 3.9% 2.5% 2.0% 4.9% 2.0%
New Forest 77.9% 3.3% 1.5% 4.3% 2.3% 4.3% 2.3%
Southampton 61.0% 9.3% 2.9% 4.7% 2.4% 3.3% 2.4%
Test Valley 79.6% 2.5% 2.7% 2.7% 1.7% 6.5% 1.7%
City Region 69.1% 6.1% 2.9% 3.9% 2.2% 4.1% 2.2%
Table 3-6 – Mode share of each mode for commuter journeys by Local Authority and for City Region (2011 Census)
Figure 3-2 – Mode share of each travel mode for commuter journeys within City Region (2011 Census)
Vehicles The highway network in the City Region is dominated by the Strategic Road Network (SRN), with the M27 and M3 carrying over 120,000 two-way AADF12. Sections of the M27 around the east of Southampton carry in excess of 140,000 vehicles a day.
The busiest sections of the local road network are the A33 Redbridge Road, A33 Bassett Avenue, Bitterne Road West and A335 Thomas Lewis Way into Southampton, and A35 between Totton and Southampton. The A33 Redbridge Road carries over 77,000 two-way AADF.
Map 3.7 shows the main routes and vehicle flows on them.
12 DfT Traffic Counts Southampton & Hampshire (selected roads) Annual Average Daily Flow 12 hrs (0700-1900)
16
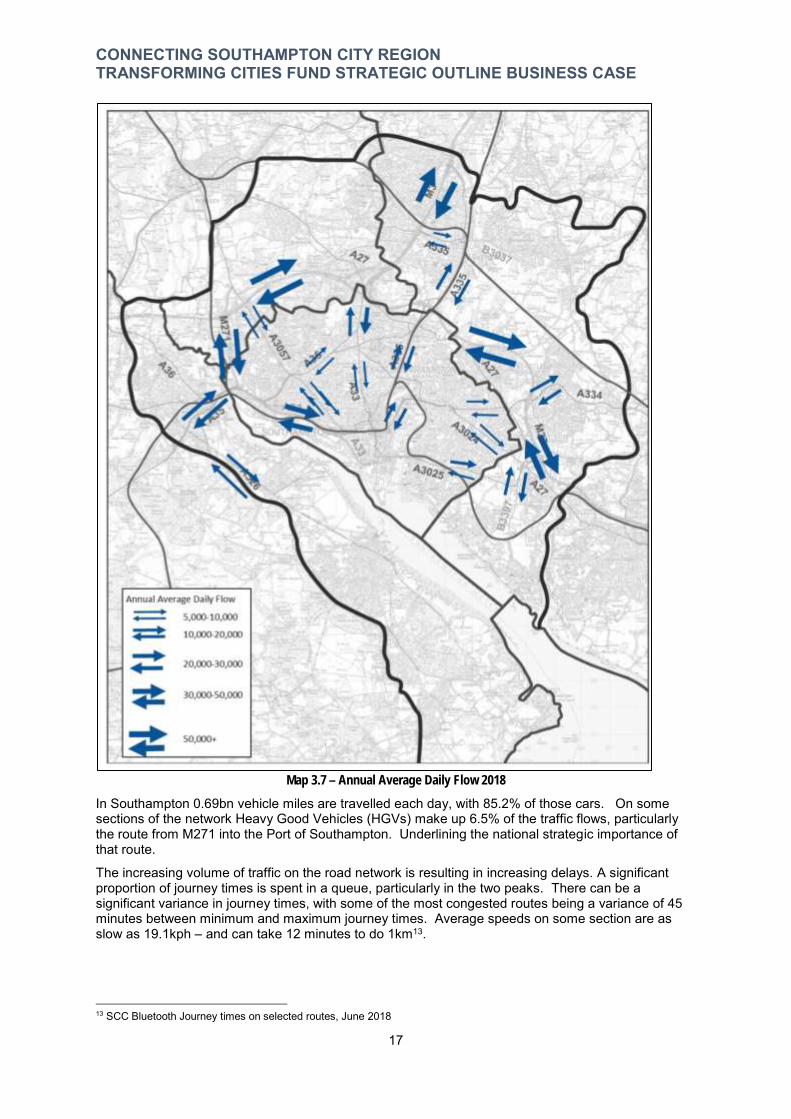
CONNECTING SOUTHAMPTON CITY REGION TRANSFORMING CITIES FUND STRATEGIC OUTLINE BUSINESS CASE
Map 3.7 – Annual Average Daily Flow 2018
In Southampton 0.69bn vehicle miles are travelled each day, with 85.2% of those cars. On some sections of the network Heavy Good Vehicles (HGVs) make up 6.5% of the traffic flows, particularly the route from M271 into the Port of Southampton. Underlining the national strategic importance of that route.
The increasing volume of traffic on the road network is resulting in increasing delays. A significant proportion of journey times is spent in a queue, particularly in the two peaks. There can be a significant variance in journey times, with some of the most congested routes being a variance of 45 minutes between minimum and maximum journey times. Average speeds on some section are as slow as 19.1kph – and can take 12 minutes to do 1km13.
13 SCC Bluetooth Journey times on selected routes, June 2018
17
CONNECTING SOUTHAMPTON CITY REGION TRANSFORMING CITIES FUND STRATEGIC OUTLINE BUSINESS CASE
Trip lengths vary depending on location, short trips make up the majority of the highway network demand, with 38% of Solent trips being under 5km (3 miles), and this rises to 56% in the denser urban areas.
Continuing to use valuable road space for short vehicle based trips is a major barrier to sustainable economic growth in the City Region. As this will adversely affect all trips using the network, including strategically important movements to the Port and economic centres like the City Centre. There is an opportunity to move to public transport and active modes, retaining the function of the network for those who require it.
Public Transport On average 580,000 bus trips are made each day in Southampton. The majority of bus trips are made in the peaks, primarily for journeys to work or education. There are sections of the bus network in the City Region where bus speeds are less than 10kph. These correlate to some of the sections where all vehicle speeds are slow, such as Shirley Road in Southampton and Bishopstoke Road in Eastleigh.
Public transport usage varies by area according to network provision. Network is densest on routes between Bitterne, Shirley and Woolston and the City Centre.
Although rail only makes up 2.9% of trips to work, usage through the City Region’s stations totals 12.4m entries and exits in 2017/18 – 11% higher than in 2011/12. Southampton Central is by far the busiest station with 6.5m journeys, and is an important interchange point. It experiences almost as many passenger movements as all other station in the City Region combined. The next busiest are Southampton Airport Parkway, Winchester and Eastleigh.
Rail accessibility and frequency varies, with some suburban stations having one train per hour frequency. Having better connections between modes expands the reach of rail.
To make public transport viable as an alternative to the car there needs to be greater reliability of journey times. Achieving this would require change in how road space is allocated – moving from greatest number of vehicles to moving the greater number of people. Buses can move up to 72 more people per vehicle than a car (based on average car occupancy). On certain corridors, such as Shirley Road, people travelling by bus already make up 65% of people trips.
Active Modes Active travel modes of walking and cycling account for 27% of all daily trips within the City Region. The use of active modes varies by location, with Southampton a third of trips are made this way. They are also growing form of transport in the City Region. Southampton has double the national average levels of cycling to work, with 4.8% of all commuter trips to work made by bike. This increased by 24% between 2001 and 2011 but cycling remains a small number of trips in absolute terms. Within Eastleigh Borough 3% of commuter trips were made by bike.
As Figure 3-3 shows, the flows of people cycling travelling on the main road corridors within Southampton had increased by 11% between 2010 and 2016, with just under 7,000 cycle trips across the day (around 1.4% of all traffic). However, recently this has fallen to 2010 levels on those corridors.
In the morning peak (7-9am) over 1,200 cycles a day enter the City Centre - approximately 3.0% of people and 5.5% of vehicles. The busiest routes for the number of people cycling into the City Centre are Hill Lane (10%), Shirley Road (9.3%), Itchen Bridge (7.4%), and The Avenue (7.4%).
Within Eastleigh Borough, the busiest cycle corridor is Wide Lane (with an average of 270 cycle movements per day), followed by Hamble Lane, (used by 180 cyclists a day).
As expected the vast majority of trips by active modes are short in length. With active mode trip length being broadly similar irrespective of area density type.
18

CONNECTING SOUTHAMPTON CITY REGION TRANSFORMING CITIES FUND STRATEGIC OUTLINE BUSINESS CASE
Total Number of Cycle Journeys - Southampton
5600
5800
6000
6200
6400
6600
6800
7000
7200
7400
7600
2010 2011 2012 2013 2014 2015 2016 2017 2018
Figure 3-3 - Total Number of Cycle Journeys (main corridors) Southampton 2010-2018
Commuting Patterns and Containment Across the entire Solent area (which also includes the Portsmouth City Region), 85% of commuter trips start and end within the sub-region. At the Southampton City Region level, self-containment reduces to 77%, with the largest flows out of the City Region going to Winchester and Fareham Districts (14% of residents) and the large employment areas at Whiteley and in Winchester City Centre. In Southampton self-containment commuting has fallen from 66% in 2001 to 54% in 201114
where a total of 53,600 residents work in the city. The level of self-containment in the areas experiencing the strongest growth has been low. In Eastleigh Borough, just 37% of residents work within the Borough.
Distribution of the local work-force - The nature of the urban area where authority boundaries do not align with self-contained settlements or function areas. The high levels of people who live in one area but work in another, has influenced a pattern of inter-authority movements. The type and grade of jobs available also vary significantly by location. Lower cost land outside of Southampton has allowed a mix of low-wage distribution and retail and higher-wage office based employment to develop. Southampton has a combination of higher paid professional employment in the City Centre, the University and Hospitals, and a large retail and leisure sector. Data suggests that some lower skilled residents are being displaced into lower paid employment outside of the city by skilled workers commuting into the city. There is a net in-commute for professional (+7,400) and associate professional and technical (+3,300) occupations, whilst elementary (-500) and process, plant and machine operatives (-1,200) occupations show a net out-commute. There also appears to be significant out-commuting of workers in skilled trade occupations (-5,800) who live in the city15.
Southampton’s travel patterns - The distribution of housing types and values also reflect the development and affordability. Higher value detached housing has mostly been built outside of Southampton, leading to higher paid workers living outside of Southampton and commuting in. More affordable and local authority housing remains within the city but the largest supply of lower-wage (often shift based) work occurs in the industrial and distribution parks close to the M27. This results in out-commuting from Southampton to these sites – often by car due to inaccessibility of these sites by other modes.
14 NOMIS 2011 Census WF01BEW Location of usual residence and place of work 15 ONS Annual Population Survey 2018
19

CONNECTING SOUTHAMPTON CITY REGION TRANSFORMING CITIES FUND STRATEGIC OUTLINE BUSINESS CASE
Figure 3-4 - Out and In Commuting Trips from Southampton by LA16
This distribution of jobs is a further factor explaining the very complex travel patterns seen today. As Figure 3.4 above shows, over half of Southampton’s population live and work in the city. The remaining half commute out of Southampton for work. As many people commute into Southampton for work as commute out. This results in strong commuting flows between Southampton and the surrounding Districts. The strongest bi-directional flows between Southampton and Eastleigh (see Figure 3.2). This is the highest in the Solent area with almost 24,000 movements across a day.
Eastleigh’s Travel Patterns – As Figure 3.5 below shows, Eastleigh Borough is a net exporter of labour with 5% more out commuting trips compared to in commuting. These main flows are southward to Southampton (11,100+) and into the Winchester City Council district (8,800+) – which includes trips northwards to jobs in Winchester city and eastwards to Whiteley (Solent Business Park). The main source of in-commuting is from Southampton.
Figure 3-5 - Out and In Commuting Trips from Eastleigh by LA17
16 NOMIS 2011 Census Journey to Work 17 NOMIS 2011 Census Journey to Work
20

CONNECTING SOUTHAMPTON CITY REGION TRANSFORMING CITIES FUND STRATEGIC OUTLINE BUSINESS CASE
Commuting patterns within Eastleigh Borough depend on where residents live. Those in Hedge End are more likely to commute to Whiteley and Winchester, with smaller flows into Southampton from these areas. Residents of Eastleigh town have the largest flows into Southampton and Winchester city. Trip lengths between Southampton and Eastleigh are generally short given the contiguous nature of the urban area and the location of employment sites (e.g. Southampton Airport or Hedge End Business Parks) to Southampton.
District Eastleigh New Forest Test Valley Southampton Solent Rest
Eastleigh 9351 1025 1231 5414 6018 1815
New Forest 1217 10509 694 2993 2776 2421
Test Valley 1680 905 3031 1323 1482 1323
Southampton 7491 3051 1471 26138 4460 2642
Solent 4606 1582 1195 3751
Rest 1171 2072 879 3184 Table 3-7 – AM Commuting Patterns All Mode between Districts18
Table 3-7 above, shows these strong two-way commuting flows in the morning peak demonstrate that the economies of Southampton and Eastleigh are closely integrated. Away from the inter-authority flows, the next biggest are between Eastleigh and other areas in the Solent including Winchester and Fareham.
New Forest Travel Patterns - The Totton and Waterside areas of New Forest, are exporters of labour to the rest of the City Region, with 36% going to Southampton. In the other direction, 4,427 Southampton residents daily commute to work in the Totton and Waterside area.
Test Valley Travel Patterns - The portion of Test Valley in the City Region is an importer of labour with large employment areas in Nursling around Junction 1 of M271 and Hampshire Corporate Park.
How People Travel to Work in SCR
100% 90% 80% 70% 60% 50% 40% 30% 20% 10%
0%
Train Bus Car Passenger Bicycle On foot Other
Figure 3-6 - Mode Split for Travel to Selected Employment Locations
18 Solent Transport SRTM Outputs, 2015
21

CONNECTING SOUTHAMPTON CITY REGION TRANSFORMING CITIES FUND STRATEGIC OUTLINE BUSINESS CASE
As Figure 3-6 shows, the level of use of different travel modes varies across the City Region. Driving (including passenger in car) is the dominant mode for journeys to work for those working along the A33 Corridor (for Port’s Western Docks and Millbrook Industrial Estates), in Hedge End and Marchwood. 78% of trips to these locations are by car. Marchwood and Nursling have above average levels of cycle commuting but bus use is low. People living in the east of Southampton or in-commuting to the city are more likely to drive to work. This reflects where the employment locations are, what provision and support for cyclists there is, and where bus services are slow or infrequent compared to travel by car.
Investment through TCF is required to improve accessibility to these locations by sustainable and active mode. The evidence shows that there is a need for the investment to support sustainable economic growth. In the absence of transport investment, transport will act as a constraint on sustainable economic growth.
22
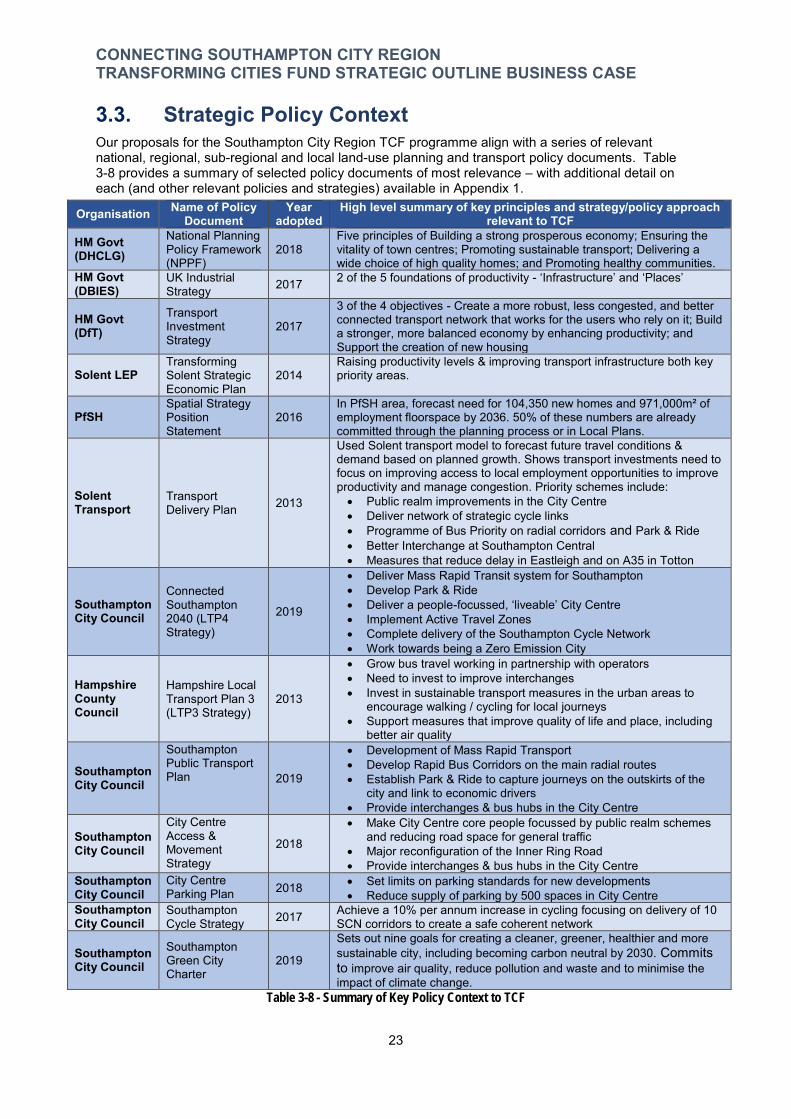
CONNECTING SOUTHAMPTON CITY REGION TRANSFORMING CITIES FUND STRATEGIC OUTLINE BUSINESS CASE
3.3. Strategic Policy Context Our proposals for the Southampton City Region TCF programme align with a series of relevant national, regional, sub-regional and local land-use planning and transport policy documents. Table 3-8 provides a summary of selected policy documents of most relevance – with additional detail on each (and other relevant policies and strategies) available in Appendix 1.
Organisation Name of Policy Document
Year adopted
High level summary of key principles and strategy/policy approach relevant to TCF
HM Govt (DHCLG)
National Planning Policy Framework (NPPF)
2018 Five principles of Building a strong prosperous economy; Ensuring the vitality of town centres; Promoting sustainable transport; Delivering a wide choice of high quality homes; and Promoting healthy communities.
HM Govt (DBIES)
UK Industrial Strategy 2017 2 of the 5 foundations of productivity - ‘Infrastructure’ and ‘Places’
HM Govt (DfT)
Transport Investment Strategy
2017
3 of the 4 objectives - Create a more robust, less congested, and better connected transport network that works for the users who rely on it; Build a stronger, more balanced economy by enhancing productivity; and Support the creation of new housing
Solent LEP Transforming Solent Strategic Economic Plan
2014 Raising productivity levels & improving transport infrastructure both key priority areas.
PfSH Spatial Strategy Position Statement
2016 In PfSH area, forecast need for 104,350 new homes and 971,000m² of employment floorspace by 2036. 50% of these numbers are already committed through the planning process or in Local Plans.
Solent Transport
Transport Delivery Plan 2013
Used Solent transport model to forecast future travel conditions & demand based on planned growth. Shows transport investments need to focus on improving access to local employment opportunities to improve productivity and manage congestion. Priority schemes include: Public realm improvements in the City Centre Deliver network of strategic cycle links Programme of Bus Priority on radial corridors and Park & Ride Better Interchange at Southampton Central Measures that reduce delay in Eastleigh and on A35 in Totton
Southampton City Council
Connected Southampton 2040 (LTP4 Strategy)
2019
Deliver Mass Rapid Transit system for Southampton Develop Park & Ride Deliver a people-focussed, ‘liveable’ City Centre Implement Active Travel Zones Complete delivery of the Southampton Cycle Network Work towards being a Zero Emission City
Hampshire County Council
Hampshire Local Transport Plan 3 (LTP3 Strategy)
2013
Grow bus travel working in partnership with operators Need to invest to improve interchanges Invest in sustainable transport measures in the urban areas to
encourage walking / cycling for local journeys Support measures that improve quality of life and place, including
better air quality
Southampton City Council
Southampton Public Transport Plan 2019
Development of Mass Rapid Transport Develop Rapid Bus Corridors on the main radial routes Establish Park & Ride to capture journeys on the outskirts of the
city and link to economic drivers Provide interchanges & bus hubs in the City Centre
Southampton City Council
City Centre Access & Movement Strategy
2018
Make City Centre core people focussed by public realm schemes and reducing road space for general traffic
Major reconfiguration of the Inner Ring Road Provide interchanges & bus hubs in the City Centre
Southampton City Council
City Centre Parking Plan 2018 Set limits on parking standards for new developments
Reduce supply of parking by 500 spaces in City Centre Southampton City Council
Southampton Cycle Strategy 2017 Achieve a 10% per annum increase in cycling focusing on delivery of 10
SCN corridors to create a safe coherent network
Southampton City Council
Southampton Green City Charter
2019
Sets out nine goals for creating a cleaner, greener, healthier and more sustainable city, including becoming carbon neutral by 2030. Commits to improve air quality, reduce pollution and waste and to minimise the impact of climate change.
Table 3-8 - Summary of Key Policy Context to TCF
23

CONNECTING SOUTHAMPTON CITY REGION TRANSFORMING CITIES FUND STRATEGIC OUTLINE BUSINESS CASE
3.4. The Case for Change – Strategic Challenges This chapter summarises the four strategic transport-related challenges Southampton City Region faces in realising its economic growth aspirations.
They are:
1. A clear productivity gap exists; 2. Congestion is increasing and planned growth means delays are set to worsen;
3. A need to improve bus journey times in order to improve attractiveness to car drivers; and
4. Addressing rising inequalities.
These challenges have been identified through discussions with stakeholders and consideration of the available evidence sources include:
The feedback from the public consultation on the Connected Southampton 2040 Transport Strategy and from analysis produced for the Waterside and Eastleigh (Draft) Transport Strategies;
National data sets including 2011 Census, BRES, DEFRA, Index of Multiple Deprivation, Public Health England to provide data on productivity and employment, environment, physical activity, socio-economic, and Travel to Work data;
Data on traffic volumes, average speeds, vehicle delays and data on car and bus journey times; Accessibility data that considers how easy it is to get to and from different parts of the City
Region; Outputs from the existing Solent Sub-Regional Transport Model (including the barriers identified
in the Solent Transport’s Transport Delivery Plan (2014), Southampton City Centre Transport Model, Solent LEP’s Transport Investment Plan and TfSE’s Economic Connectivity Review; and
Data from operators on the use of cycle, bus and rail across the City Region area
Below is a brief overview of the data and evidence available on each of these four strategic challenges:
24

CONNECTING SOUTHAMPTON CITY REGION TRANSFORMING CITIES FUND STRATEGIC OUTLINE BUSINESS CASE
1. A clear productivity gap exists • The City Region’s economy is worth £12.5bn and there are bold and ambitious plans for
economic growth with the Solent LEP aspiring to 2% annual growth in GVA
• Productivity in Southampton lags behind the national and South East average for GVA per head – it is 16% lower than the South East;
• There is a wage gap between people living and working in Southampton and those commuting into the city for employment of £63 per week. This suggests that the city itself is less attractive or is perceived by higher earners as offering a poorer quality of life than suburban areas beyond the City;
• Transport investment which reduces car dependency and improves the city's "place" status will help to address this wage gap and support a narrowing in the future.
2. Congestion is increasing and planned growth means delays set to worsen • Due to its’ coastal location and severance caused by its’ two river estuaries, Southampton
doesn’t have 360° access from its’ travel to work area. This geography has the effect of concentrating commuter travel movements into the city onto a small number of corridors;
• The main corridors carry over 157,000 vehicles a day and experience peak hour congestion and unreliable journey times. Congestion currently costs the Southampton economy £100m a year;
• A significant number of commuting trips to and within the City Region use the heavily congested M3 and M27 for short junction-to-junction trips. Journey times on the M27 are 32% slower than national average for the motorway network. These delays impeded more economically important trips and cost businesses £534,000 a year in value of time lost per kilometre of major road route -predicted to increase to £1.24m by 2041.
• Forecasts suggest that economic growth will see at least 18,000 new jobs created in the Southampton City Region by 2036.
• The population is forecast to grow by 53,500 requiring the delivery of 42,600 new homes and 472,000m² of employment space in the period up to 2036;
• Some of this housing delivery has taken place with a focus on Southampton City Centre and in Eastleigh Borough. There are further strategic housing sites planned in Southampton – particularly the City Centre with further allocations in Boorley Green (1,400), Horton Heath (1,400), and Hedge End and Botley (>1,000) under construction. A new Strategic Growth Option of 5,500 homes at North / North east of Bishopstoke and Fair Oak is proposed (with 3,350 delivered over the period to 2036 – and the balance beyond the proposed Local Plan period);
• The University Hospital Southampton in Shirley is the largest employer in the city, employing over 11,500 staff, and seeing approximately 900,000 patients a year. These trips generate significant traffic volumes. In terms of footfall approximately 4 million people pass through the main entrance of the hospital each year, which includes visitors.
• As part of the Port Economic Partnership and Port Masterplan, large growth of the Port is forecast - with a doubling of cruise passenger throughput and deep sea container traffic by 2036;
• The Southampton Airport Masterplan proposes to more than double the passenger throughput by 2037. A runway extension is proposed alongside a terminal extension and additional apron space. This would support significant growth in passengers through the use of larger aircraft;
• By 2026, journey times on A33 Millbrook Road West are forecast to increase by 127% compared to current levels; and
• Traffic congestion is a constraint on the realisation of this growth and could result 21% fewer jobs created if no investment is made.
25
CONNECTING SOUTHAMPTON CITY REGION TRANSFORMING CITIES FUND STRATEGIC OUTLINE BUSINESS CASE
3. A need to improve public transport journey times, in order to improve attractiveness • 12.1m rail passengers use the 17 stations in the City Region, but 13 suburban stations have a
rural level of service (one train per hour across the majority of the day). Multi-modal interchange at the busiest station Southampton Central is not user friendly with many bus services not calling directly at the station. The lack of car parking or bus/ taxi/ passenger drop off-area at Hamble station contributes to low usages of this station;
• The sector benefits from proximity to the Port and Airport but cruise and freight movements add demand to the network, adding to congestion;
• There has been sustained bus operator investment in the fleet and strong competition between operators on price, frequency, and quality - contributing to growing bus patronage in Southampton with 21.4m passengers a year making 84.1 journeys per head (growth of 17% since 2009);
• Bus journeys are adversely affected by congestion with some services taking 30mins longer in peak times compared to off peak. Journey times on some services now take longer, with one increasing by 9 mins over 8 years. While there are frequent bus services within many parts of Southampton, frequency of services to surrounding areas are often low and journey times can be lengthy (over 60mins) compared to the car; and
• There are gaps in service provision, such as limited bus links to some urban edge employment sites. Some residential areas are not well served, resulting in reliance on car travel.
4. Addressing Rising Inequalities • There are pockets of deprivation in the City Region. Parts of Redbridge, Millbrook, Sholing,
Bargate and Bevois wards in Southampton and Blackfield near Fawley are among the top 10% most deprived areas in England. While these are served by the public transport network the cost and service patterns may affect a person’s ability to get, and retain, a job;
• 22% of City Region households have no access to a car, rising to 51% in parts of Southampton;
• Levels of physical activity are low – 65% of Southampton residents are classed as obese/overweight and only a little over half of Eastleigh adults partake in the recommended 150 mins of physical activity a week; and
• Air pollution is a significant problem within the City Region, with a Ministerial Direction to implement measures to reduce air pollution, and there are currently 15 Air Quality Management Areas.
26

CONNECTING SOUTHAMPTON CITY REGION TRANSFORMING CITIES FUND STRATEGIC OUTLINE BUSINESS CASE
3.4.1. Challenge 1: A Clear Productivity Gap Exists The City Region suffers from two productivity-related problems: 1. The Solent area and Southampton City Region have poorer skill levels, lower wages
and weaker productivity than the South East England average. 2. Businesses have cited poor transport connectivity and congestion as a contributory
factor acting as a brake on attracting higher value employment.
Challenge 1 will be explained across four sections: Section 3.4.1.1 identifies the current levels of productivity within the City Region and the wider
Solent LEP area and the GVA skills and wage gap relative to the rest of the South East and the contributions of different employment sectors to GVA;
Section 3.4.1.2 identifies what steps the Solent LEP is taking to address the productivity gap; Section 3.4.1.3 explains how congestion and transport connectivity is impeding connectivity
and contributes to lower GVA (3.4.1.3); and Section 3.4.1.4 sets out the likely impact of doing nothing to address congestion and inhibited
connectivity.
Productivity, wages and skill levels The Solent economy, including the Southampton City Region, Portsmouth City Region and the Isle of Wight is worth £30.6bn a year19. Classified as a gateway economy it is centred around the three international gateways of the Ports of Southampton and Portsmouth, and Southampton Airport.
The economy of Southampton City, Eastleigh Borough and the Totton and Waterside part of New Forest District combined (the bulk of the City Region) is worth £12.5bn of GVA a year20. Of this, Southampton City accounts for almost £7bn worth of GVA with a strong focus on the maritime and marine sector, with the Port of Southampton at its’ heart. There has been strong growth with the Southampton economy increasing by 9.5% and Eastleigh’s by 15.5% between 2009 and 2017. However, this increase is below that of the increase for the South East (15.6%) and for England (17.1%) over this same period.
Southampton City Region is a regional economic engine for growth as already described in section 3.2.5 and has a jobs density per hectare is 12.65. Southampton has a job density of 27 jobs per hectare. In the other areas job density is lower with Eastleigh at 9.78, New Forest 5.83 and Test Valley 2.86. The cluster nature of employment distribution contributes to the differences in density and in turn productivity.
The largest employment sectors are manufacturing and logistics with 28,750 jobs, health with 11,000, higher & further education with 9,100 and maritime and defence with 6,870. This is leading to a large reliance on the administrative sector which can be lower paid and businesses with close links to the Port such as the logistics and maritime sectors.
A significant contributory factor to this productivity gap is the higher concentration of lower productivity jobs than in the South East as a whole. The gateway nature of the Port means that there are clusters of sectors and economic activity relating to it – such as transport & logistics, marine and maritime sector, along with tourism – in the City Region.
As Figure 3-7 - Composition of employment in Southampton & Eastleigh relative to the South East Region Average 2019Figure 3-7 shows, employment in the higher GVA sectors of Professional, Scientific and Technical, and Information and Communication is underrepresented in the City Region compared to wider the South East. The City Region has a reliance on certain sectors including public administration, education, transport, and manufacturing – which are traditionally lower productivity and lower wage earning sectors.
19 Solent LEP draft Local Industrial Strategy, 2019 20 ONS Regional GVA by LA 2016 (£6.8bn for Southampton City and £4.18bn Eastleigh Borough 2017); NFDC Economic Profile 2018 (£1.5bn GVA in 2015 for Totton & Waterside part of New Forest District)
27
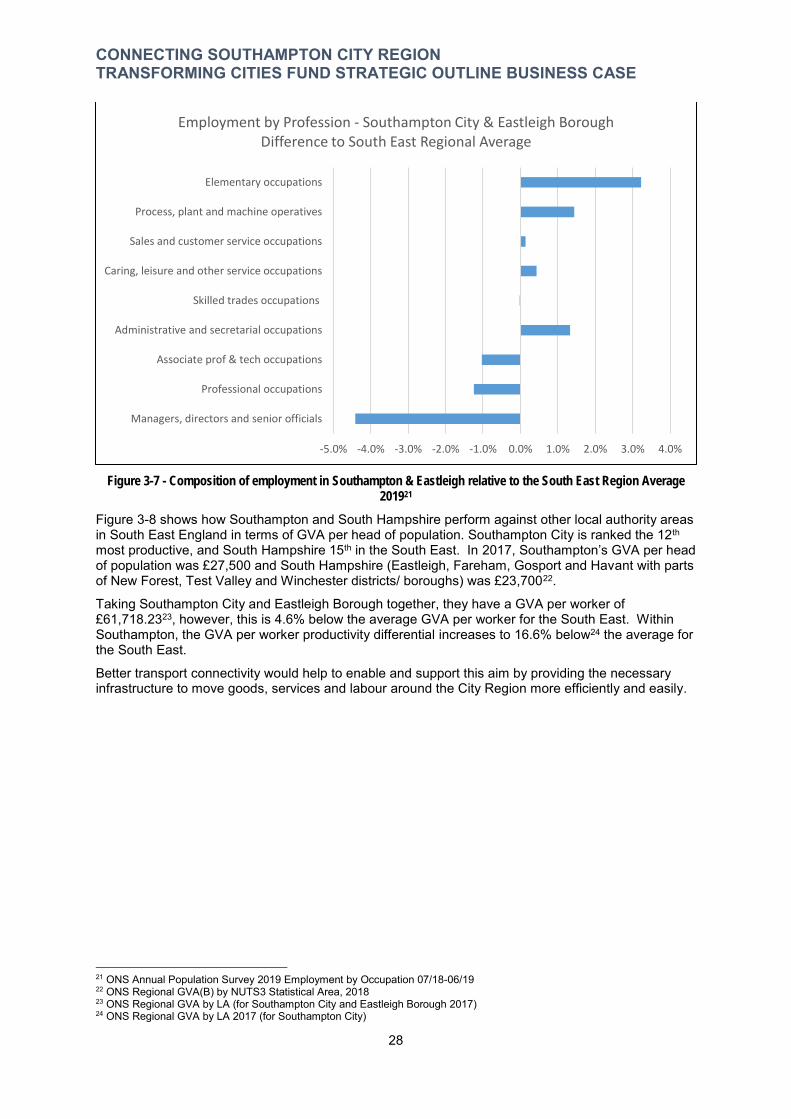
CONNECTING SOUTHAMPTON CITY REGION TRANSFORMING CITIES FUND STRATEGIC OUTLINE BUSINESS CASE
Employment by Profession - Southampton City & Eastleigh Borough Difference to South East Regional Average
Elementary occupations
Process, plant and machine operatives
Sales and customer service occupations
Caring, leisure and other service occupations
Skilled trades occupations
Administrative and secretarial occupations
Associate prof & tech occupations
Professional occupations
Managers, directors and senior officials
-5.0% -4.0% -3.0% -2.0% -1.0% 0.0% 1.0% 2.0% 3.0% 4.0%
Figure 3-7 - Composition of employment in Southampton & Eastleigh relative to the South East Region Average 201921
Figure 3-8 shows how Southampton and South Hampshire perform against other local authority areas in South East England in terms of GVA per head of population. Southampton City is ranked the 12th
most productive, and South Hampshire 15th in the South East. In 2017, Southampton’s GVA per head of population was £27,500 and South Hampshire (Eastleigh, Fareham, Gosport and Havant with parts of New Forest, Test Valley and Winchester districts/ boroughs) was £23,70022.
Taking Southampton City and Eastleigh Borough together, they have a GVA per worker of £61,718.2323, however, this is 4.6% below the average GVA per worker for the South East. Within Southampton, the GVA per worker productivity differential increases to 16.6% below24 the average for the South East.
Better transport connectivity would help to enable and support this aim by providing the necessary infrastructure to move goods, services and labour around the City Region more efficiently and easily.
21 ONS Annual Population Survey 2019 Employment by Occupation 07/18-06/19 22 ONS Regional GVA(B) by NUTS3 Statistical Area, 2018 23 ONS Regional GVA by LA (for Southampton City and Eastleigh Borough 2017) 24 ONS Regional GVA by LA 2017 (for Southampton City)
28

CONNECTING SOUTHAMPTON CITY REGION TRANSFORMING CITIES FUND STRATEGIC OUTLINE BUSINESS CASE
Figure 3-8 – GVA per head comparison Southampton, South Hampshire and South East25
The contributions made by different industrial sectors to percentage share of GVA vary between Southampton City26, Eastleigh Borough27 , and the Totton and Waterside part of New Forest District28
are shown in Figure 3-9. Over half of Southampton City’s GVA was generated from the two sectors of Administration, Education & Health, and Distribution & Transport. This means that Southampton’s economy is focused around two relatively low productivity sectors and vulnerable to economic changes due to being less diversified. The equivalent contribution of these two sectors was 39% in Totton & Waterside and 31% in Eastleigh Borough.
49,516 41,727
35,685 34,016
31,167 31,105 30,834
30,131 29,415 29,057 29,053
27,539 27,502
26,689 24,296
23,693 22,793 22,552
21,955 20,136
19,348 19,205
- 10,000 20,000 30,000 40,000 50,000 60,000
Milton Keynes
West Surrey
North Hampshire
West Sussex (North East)
South East
Central Hampshire
Southampton
Mid Kent
West Sussex (South West)
Kent Thames Gateway
East Sussex CC
Comparison of GVA per Head
0% 10% 20% 30% 40% 50% 60% 70% 80% 90% 100%
Southampton
Eastleigh
New Forest
Percentage Sector Share of GVA
Production Construction Retail Transport & Distribution ICT Real Estate Business Services Administration, Health & Education Other Services
Figure 3-9 –Sectoral Contributions to GVA for Southampton City, Eastleigh Borough and the Totton and Waterside Area of New Forest District29
25 ONS Regional GVA(B) per head of population by LA, 2018 26 Southampton City Council Economic data compendium - March 2018 – data from 2017 27 Eastleigh Economy Review Report January 2017 – data from 2014 28 New Forest Economic Profile 2018 – Source 2017 estimates by Hampshire County Council 29 ONS Gross Value Added (balanced) by LA, 2018
29

CONNECTING SOUTHAMPTON CITY REGION TRANSFORMING CITIES FUND STRATEGIC OUTLINE BUSINESS CASE
Median weekly wages for Southampton residents working in the city are £63 lower than for non-residents working there. In the other parts of the City Region workplace earnings are lower than resident earnings, shown in Table 3-9.
Local Authority Resident Workplace Difference Southampton £552.60 £615.90 £63.30
Eastleigh £613.30 £587.30 -£26.00 New Forest £615.20 £572.20 -£43.00 Test Valley £613.70 £574.80 -£38.90 City Region £598.70 £587.68 -£11.02
Table 3-9 – Wage differential by Authority
This reflects the difference in types of employment in those parts of the City Region. Although lower than in 2008, this gap has remained at around 8% to 12.5% for the past 5 years, as shown in Figure 3-10. Across the City Region, average weekly wages are £545.8030. Within Eastleigh Borough, weekly wages are £593.5031 compared to £529 for Southampton City32. Both are below the median weekly wage for the South East Region of £614.50.
Figure 3-10 – The persistent wage gap between residents and workers in Southampton (2008-2017)
As well as a wage differential, there is a variation in skill levels across the City Region, as shown in Map 3.8.
As the map on the left illustrates, there are 65,800 working age residents in Southampton City with an NVQ Level 4 (equivalent to degree level) and 27,600 residents with either no qualifications or Level 1 qualifications33. As a proportion of the working age population, this equates to 38.1% for Southampton City34, 36.8% in Eastleigh Borough35 and 25.3% in the Totton and Waterside area of New Forest District36.These are lower than for the South East England region average (42.2%)37.
The percentage of the workforce in occupations classed by ONS as elementary varies – as shown on the right hand side of Map 3.8 - from around 21-28% in the Bevois Ward and parts of Millbrook, Redbridge, Thornhill and Weston in Southampton. In areas south of Eastleigh town centre to less than 1.4% in the Valley Park area of Chandlers Ford, Chilworth and part of Bassett.
30 ONS Average Weekly Wages by LA (for Southampton City and Eastleigh Borough 2017) 31 ONS annual survey of hours and earnings Jan-Dec 2018 - resident analysis 32 ONS annual survey of hours and earnings Jan-Dec 2018 - resident analysis 33 ONS 2019 34 ONS 2018 annual population survey (% is a proportion of resident population of area aged 16-64) 35 ONS 2016 36 2011 Census 37 ONS 2018 annual population survey (% is a proportion of resident population of area aged 16-64)
30
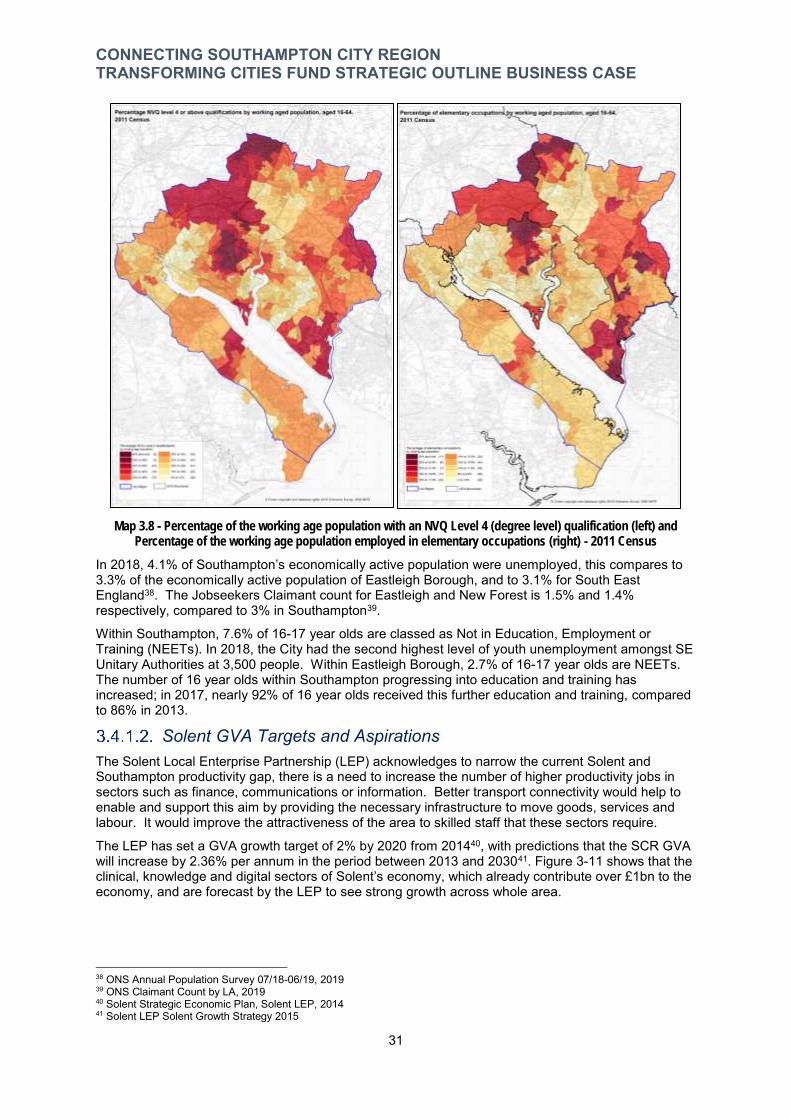
CONNECTING SOUTHAMPTON CITY REGION TRANSFORMING CITIES FUND STRATEGIC OUTLINE BUSINESS CASE
Map 3.8 - Percentage of the working age population with an NVQ Level 4 (degree level) qualification (left) and Percentage of the working age population employed in elementary occupations (right) - 2011 Census
In 2018, 4.1% of Southampton’s economically active population were unemployed, this compares to 3.3% of the economically active population of Eastleigh Borough, and to 3.1% for South East England38. The Jobseekers Claimant count for Eastleigh and New Forest is 1.5% and 1.4% respectively, compared to 3% in Southampton39.
Within Southampton, 7.6% of 16-17 year olds are classed as Not in Education, Employment or Training (NEETs). In 2018, the City had the second highest level of youth unemployment amongst SE Unitary Authorities at 3,500 people. Within Eastleigh Borough, 2.7% of 16-17 year olds are NEETs. The number of 16 year olds within Southampton progressing into education and training has increased; in 2017, nearly 92% of 16 year olds received this further education and training, compared to 86% in 2013.
Solent GVA Targets and Aspirations The Solent Local Enterprise Partnership (LEP) acknowledges to narrow the current Solent and Southampton productivity gap, there is a need to increase the number of higher productivity jobs in sectors such as finance, communications or information. Better transport connectivity would help to enable and support this aim by providing the necessary infrastructure to move goods, services and labour. It would improve the attractiveness of the area to skilled staff that these sectors require.
The LEP has set a GVA growth target of 2% by 2020 from 201440, with predictions that the SCR GVA will increase by 2.36% per annum in the period between 2013 and 203041. Figure 3-11 shows that the clinical, knowledge and digital sectors of Solent’s economy, which already contribute over £1bn to the economy, and are forecast by the LEP to see strong growth across whole area.
38 ONS Annual Population Survey 07/18-06/19, 2019 39 ONS Claimant Count by LA, 2019 40 Solent Strategic Economic Plan, Solent LEP, 2014 41 Solent LEP Solent Growth Strategy 2015
31
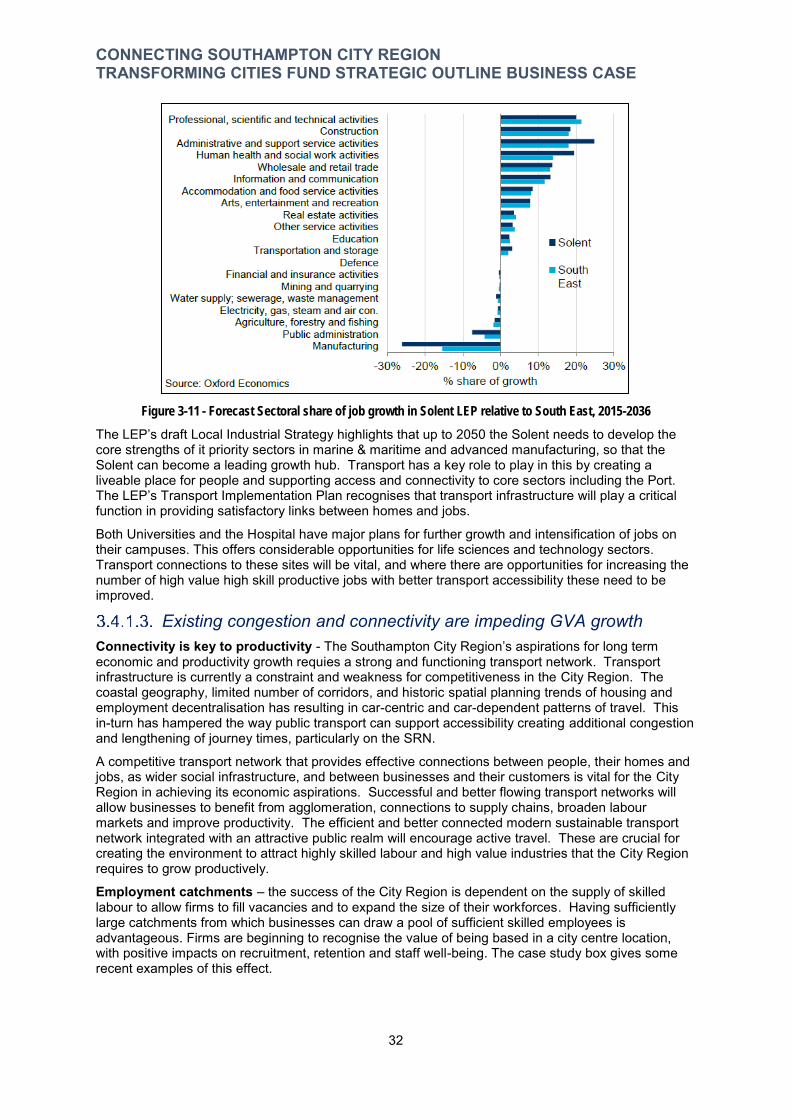
CONNECTING SOUTHAMPTON CITY REGION TRANSFORMING CITIES FUND STRATEGIC OUTLINE BUSINESS CASE
Figure 3-11 - Forecast Sectoral share of job growth in Solent LEP relative to South East, 2015-2036
The LEP’s draft Local Industrial Strategy highlights that up to 2050 the Solent needs to develop the core strengths of it priority sectors in marine & maritime and advanced manufacturing, so that the Solent can become a leading growth hub. Transport has a key role to play in this by creating a liveable place for people and supporting access and connectivity to core sectors including the Port. The LEP’s Transport Implementation Plan recognises that transport infrastructure will play a critical function in providing satisfactory links between homes and jobs.
Both Universities and the Hospital have major plans for further growth and intensification of jobs on their campuses. This offers considerable opportunities for life sciences and technology sectors. Transport connections to these sites will be vital, and where there are opportunities for increasing the number of high value high skill productive jobs with better transport accessibility these need to be improved.
Existing congestion and connectivity are impeding GVA growth Connectivity is key to productivity - The Southampton City Region’s aspirations for long term economic and productivity growth requies a strong and functioning transport network. Transport infrastructure is currently a constraint and weakness for competitiveness in the City Region. The coastal geography, limited number of corridors, and historic spatial planning trends of housing and employment decentralisation has resulting in car-centric and car-dependent patterns of travel. This in-turn has hampered the way public transport can support accessibility creating additional congestion and lengthening of journey times, particularly on the SRN.
A competitive transport network that provides effective connections between people, their homes and jobs, as wider social infrastructure, and between businesses and their customers is vital for the City Region in achieving its economic aspirations. Successful and better flowing transport networks will allow businesses to benefit from agglomeration, connections to supply chains, broaden labour markets and improve productivity. The efficient and better connected modern sustainable transport network integrated with an attractive public realm will encourage active travel. These are crucial for creating the environment to attract highly skilled labour and high value industries that the City Region requires to grow productively.
Employment catchments – the success of the City Region is dependent on the supply of skilled labour to allow firms to fill vacancies and to expand the size of their workforces. Having sufficiently large catchments from which businesses can draw a pool of sufficient skilled employees is advantageous. Firms are beginning to recognise the value of being based in a city centre location, with positive impacts on recruitment, retention and staff well-being. The case study box gives some recent examples of this effect.
32

CONNECTING SOUTHAMPTON CITY REGION TRANSFORMING CITIES FUND STRATEGIC OUTLINE BUSINESS CASE
Case Study – Productivity, Connectivity and Transport Having reliable connections as part of a functioning transport network is vital for the City Region to grow and become more productive. There are examples of where congestion and poor connectivity is hindering business growth, operation and influencing decisions on where to locate.
Locational Importance - There has been a gradual trend of businesses employing high-skilled workers relocating away from Southampton city centre to locations on the M27. One example is HSBC, who relocated around 2000 staff in 2016 to Solent Business Park in Whiteley. Their previous location had been next to Southampton Central Station. For some staff the location is inaccessible by public transport, as a result HSBC have to run shuttle buses from Southampton Central and Southampton Airport Parkway to Whiteley. This adds costs and lengthens journey times for their business operation.
More recently, there has been reversal in this trend with businesses wanting to be in the City Centre. An example is, WSP relocated their offices from close to M27 Junction 5 to Southampton City Centre. At previous location car parking was free and plentiful, but in the City Centre there is no on-site parking but having the alternative accesses by rail, bus and cycle means that the site is accessible. This brings them closer to their clients and other professional businesses clustering in the City Centre, as well being closer to a wider pool of potential employees.
Alex Thompson, Director at WSP remarked that relocating into Southampton has been a huge benefit to the company. “In 2019 we decided to consolidate two offices into one and chose to relocate to Southampton City Centre as it ticks many boxes for us. WSP as a company is working hard to reduce its environmental footprint, a key strategy to achieving this is locating in city centres, within 1 mile of a station, where there is better access to public transport and cycling networks, giving staff and clients more sustainable transport choices to get to our office. Being in the city centre also allows us to be around the corner from many of our clients and co-professionals, giving us greater opportunities to meet face to face at short notice, which ultimately helps us work more closely together. Furthermore, our location allows us to appeal to a wider talent pool than previously, with many of our younger team members, who don’t have access to a car, already living in the city centre. Another consideration is the wellbeing of our teams, the marvellous central location provides us with a great opportunity to enjoy more social events with colleagues and clients, as we are only a short walk from the City Centre restaurants and venues. We have been in the city centre for just over four months and the team has already grown in numbers by just over 10%, with further growth planned in 2020!”
Congestion impacting on operations - Logistics firms require good access on the SRN and on local roads to move goods to customers. To ensure that the SRN can perform its strategic function for businesses local journeys that are junction hopping need to shift to sustainable and active travel. Meachers Logistics are located at M271 Junction 1 and provide services nationally and into Southampton. They are the location of the Southampton Sustainable Distribution Centre which consolidates deliveries for businesses in the city.
Operations require good 24hr access and congestion is a major cause of outlay for the company. Meachers estimate their fleet of HGVs spends around 20-30 hours per day in congested traffic conditions, which on average, costs the business between £1,200-£1,800 a day. Improving options for sustainable travel in Southampton can help reduce congestion for port-bound HGVs and other logistics movements, helping to ensure that Meachers can operate more efficiently and productively. Gary Whittle, MD of Meachers, said that “congestion is a major cause of costs for us, and having reliable access onto and along the motorway mean that my company’s operations would be more cost-effective, and support the Sustainable Distribution Centre’.
A Major International Gateway – The Port of Southampton a major international deep sea port with significant local, national and global economic importance. It operates 24/7 and is one of the most efficient in the UK. It handles over 36m tonnes of cargo each year – 30% of this is moved on by rail with the remainder travelling by road. Using the SRN to connect with the Midlands and North. Delays caused by congestion on the SRN and on the last mile to the Port gates on the A33 impact on this efficiency and competitiveness. Due to the way the Port operates with a ‘just in time’ delivery system for vehicles and container traffic it is estimated that poor access and congestion costs the Port several million £ per year in lost terminal productivity.
Further growth of the Port is contingent on good and reliable strategic access locally and regionally. ABP have already invested over £200m in quayside infrastructure to maximise efficiency and accommodate larger vessels. Ensuring that the land-side transport networks are adequate and support this growth and investment is crucial. Without better use of the local highway network on the A33 and A326 the growth will be limited. Re-moding these local trips with investment in bus and cycle networks will help to shift people to non-car modes, ensuring that those roads are able to support the Port. SCN1 between Southampton and Totton is an example of this, it provides access for people travelling between the two destinations, and for people working at the Port itself.
33
CONNECTING SOUTHAMPTON CITY REGION TRANSFORMING CITIES FUND STRATEGIC OUTLINE BUSINESS CASE
Analysis by Solent Transport of generalised journey times for the non-monetary costs of making a journey (access, wait, in-vehicle and interchange times) helps to illustrate the relative size of different employment locations catchments[1]. Here we compare the travel catchments for both Southampton City Centre and Solent Business Park in Whiteley (accessed via Junction 9 of the M27).
The employment catchments for highway travel of central and peripheral employment centres are broadly similar. Employment locations within Southampton City Centre are accessible to most of the City Region’s population within a 60 minute travel time. The geography of the area means that travel times between 40 and 60 minutes the increase in catchment size is than for commuter travel times of up to 40 minutes. Compared to Whiteley, which is predominately accessed by car, Southampton City Centre has a wider catchment area as it is accessible from all suburban parts of Southampton alongside Eastleigh, Hedge End, and urban areas further east towards Portsmouth such as Locks Heath, Whiteley and Fareham within 60 minutes.
The catchments for public transport differ significantly, Southampton City Centre as the main hub for the public transport network, has a large catchment by bus, train and ferry. Solent Business Park in Whiteley is a much less accessible employment location in terms of access by public transport.
Looking at maximising employment connections, there are competitive advantages for businesses locating in Southampton compared to out of town locations. By basing themselves in the City Centre, their workforce is able to make full use of both public transport and highway catchment areas. However, to ensure that this connectivity can be maximised the public transport connections need to be high quality to improve the public transport offer, and the ‘liveability’ of the city improved. This will need to be done alongside quality office space to encourage high wage employers from out of town sites. This has started with some companies relocating into the City Centr. If the offer is not improved further residents will be left with fewer employment options, and the City Centre development aspirations will be undermined
Without this transformation in sustainable and active travel the continuation of congestion will impede growth and see 2,000 less jobs created.
Existing Congestion is a Constraint - The M27 through the Solent area experiences peak times speeds 32% lower than average, because the demand approaches or exceeds capacity on many sections of the route42 . 30% of the trips on the M27 and M3 are ‘short hop’, going one or two junctions, with 50% travelling between one and four junctions43. Vehicle speeds in Southampton in the morning peaks are significantly lower than in other urban areas.
This peak hour congestion is estimated to cost the Southampton economy £100m per annum44. Businesses already incur costs of £500,000 per km at peak times on the A27-M27, by 2030 this congestion delay cost could double45. Business responses to surveys by Solent LEP and Hampshire Chamber of Commerce regular cite SRN and local network congestion and lack of resilience as major constraints in growing their businesses. See the Meachers Case study above for more about the adverse impact congestion has on a local HGV logistics firm.
How easy or difficult a person’s commute is, and the quality of the transport infrastructure, is frequently highlighted as a key factor in economic competitiveness. It is also an important factor on decisions that businesses and individuals make about where to locate. Without tackling congestion GVA growth will be constrained, meaning that the economic competitiveness of the City Region could fall further behind.
Other than in the centre of Southampton and Eastleigh the main employment areas are close to the SRN and not well served by rail and bus networks. This means many of these employment locations experience problems of congestion in the peak times between their sites and the SRN. This impacts on the working of the SRN. Although the M3 and M27 Smart Motorways Programme and at junctions (e.g. Junction 9 for Whiteley) will provide short-term capacity improvements, it is expected that the capacity provided will induce currently suppressed demand. In combination with growth, most modelling suggests that M27 journey times and congestion will return to current levels by early 2030s.
[1] Solent Transport, Case and Options for Intervention, Report R6 - https://documents.hants.gov.uk/transport-for-south-hampshire/tfsh-case-for-intervention-options-r6.pdf - Figs 3.19 & 3.20 42 Highways England Solent to Midlands Route Study, 2015 43 Solent LEP Transport Investment Plan, 2017 44 Oxford Economics, 2014 45 TfSE Connectivity Review, 2018
34

CONNECTING SOUTHAMPTON CITY REGION TRANSFORMING CITIES FUND STRATEGIC OUTLINE BUSINESS CASE
However, while this provides short-term gains they are for highway users only and not future-proofing the long-term vision. In the City Centre, where there are variety of sectors, a multi-modal approach to tackling congestion will see growth in productivity, job density and accessibility.
There is an oversupply of parking in the City Centre which is encouraging people to drive in. There is insufficient space to build more highway capacity both on the SRN and routes in to accommodate those driving in. By removing and constraining parking in the City Centre and providing the high quality public transport and cycle alternatives this will help to delivery choice of modes and achieve modal shift. This will ease the localised congestion enabling the SRN to perform its strategic role, benefiting the Port and businesses.
Due to their locations access to new and growing developments on the edge of the City Region, such as Adanac Park, by car could intensify existing congestion on the SRN. The location of the Health Campus will attract other health & research related industries to become a cluster. Having good public transport and cycling connections to this location from the main Hospital campus and the University can encourage non-car based trips.
Targeted investment in public transport and cycling to both improve intra-City Region connectivity, and reduce congestion to improve attractiveness for businesses, will strongly assist wider efforts to raise GVA and narrow the productivity gap. Efficient transport networks are vital for the City Region to remain competitive and attractive for investment and growth, investment in the network will strengthen the resilience of the economy and important economic sectors.
Investment to support a more liveable urban environment through cycling and public transport provides an opportunity to improve people’s access to education and employment opportunities. Creating an attractive place is important given that many young people are through choice or necessity choosing not to own a car. Supporting less car-dependent, lifestyles will and improve the perception of Southampton as a place to live. Improving connectivity, from locations currently not well-served by bus or to employment areas not-well served by bus, is expected to support efforts to reduce levels of unemployment and increase skill levels. This can increase the number and density of jobs in high skill high wage sectors.
Impact of Doing Nothing There is evidence to suggest that congestion and lack of resilience of transport infrastructure within the City Region is already acting as a constraint on job growth. Inefficient and unreliable connections will make the area increasingly unattractive for people to come to and live or businesses to locate in.
In surveys, businesses have reported difficulties in recruiting and retaining highly mobile skilled labour as a direct result of poor connectivity. This reduces the pool of applicants who are willing to apply for higher paid jobs in the City Region and reduces the ability to support larger numbers of these jobs. Also, poor air quality and an urban environment that is designed primarily to cater for the movement of vehicles detracts from quality of place. This is also a factor in businesses and individuals’ choices about where to locate and where to seek out job opportunities. The ease of access by different travel modes and the commuting time will be a factor in their decision Suitably skilled people without access to a car are often unable to consider job opportunities in these less accessible employment areas.
This will have an impact on the number of jobs created in the City Region and Solent. Analysis by Solent Transport shown in Figure 3-12 below, indicates that if congestion on the SRN and local networks is left unchecked it could have potential to supress job growth. Businesses will find it difficult attracting or retaining the skilled staff they need to perform well and deliver profits. This will impact on the contribution the local economy can make to the UK economy, and implications for competitiveness and quality of life.
35

CONNECTING SOUTHAMPTON CITY REGION TRANSFORMING CITIES FUND STRATEGIC OUTLINE BUSINESS CASE
Figure 3-12 –Potential impact of limited investment in transport infrastructure in job creation for the Solent46
This dampening of labour market mobility acts as a brake on productivity, meaning that the City Region is less likely to achieve its GVA targets in the emerging Local Industrial Strategy.
Challenge 1 Summary The main points of Challenge 1 are summarised in Table 3-10 along with how TCF investment would address the challenge.
Challenge How TCF Investment would address this
Lower levels of productivity – 16% lower than average and not yet back to pre-2008 levels
Investment in sustainable and active travel to reduce congestion and create attractive urban environment
A wage gap between Southampton and rest of City Region
Readdress wage imbalance by improving the efficiency of the local transport enabling businesses to recruit locally
The polycentric population and clustering of economic activity influenced by SRN
Reducing congestion on SRN by re-moding short trips to public transport and active travel
Peripheral areas reliant on car for access to jobs Provide alternative clean modes of transport locally for those who don’t have access to a car
Poor public transport connectivity away from corridors and congestion worsening acting as a brake on economic competitiveness
Improve public transport journey times, interchange and connections
Table 3-10 – Challenge 1 Summary
46 Solent Transport Transport Delivery Plan, 2012
36
CONNECTING SOUTHAMPTON CITY REGION TRANSFORMING CITIES FUND STRATEGIC OUTLINE BUSINESS CASE
3.4.2. Challenge 2: Congestion is Increasing and with Planned Growth Delays Are Set to Worsen
Within the City Region, there are three interlinked spatial problems relating to congestion and planned development: 1. It is difficult for public transport to serve dispersed patterns of housing and economic
growth in greenfield locations; 2. Commuting patterns within the City Region have become more complex and dispersed and
are characterised by high levels of car dependency; and 3. A high proportion of new growth planned for the Southampton City Region will also be in
greenfield locations. If no ‘transformative’ investment is forthcoming in public transport and cycling, vehicular trips will continue to grow, further increasing car dependence and worsening traffic congestion.
Challenge 2 will be explained across seven sections: Section 3.4.2.1 identifies the locations on the network where congestion and delay is worst; Section 3.4.2.2 identifies the scale of new housing and employment growth planned; Section 3.4.2.3. sets out the impacts of planned growth on congestion across the wider City
Region and how this would impede intra-City Regional connectivity; Section 3.4.2.4 sets out how TCF Investment can address congestion in the wider City Region; Section 3.4.2.5 sets out the impacts of planned growth on congestion within Southampton City
Centre; Section 3.4.2.6 covers how TCF Investment can help address congestion on routes into the City
Centre; and Section 3.4.2.7 sets out the impact of doing nothing on congestion and the aspirations for growth.
Current Locations of Worst Traffic Delay The geography of the City Region means that people’s journeys are focused on certain corridors and funnel across a limited number of bridges. Trips from the mostly suburban residential eastern part of the City Region (Bursledon, Botley, Hedge End, Netley and Hamble area, and eastern Southampton) can only use seven possible routes to get across the River Itchen into the City Centre. One of these is the M27 and another is the Itchen Toll Bridge (see Map 3.3). Coming from the Totton and Waterside area there are only two crossings of the River Test at Redbridge and the M27, and the use of these routes requires a significant diversion away from the ‘straight line’ route. In Southampton the highway network radiates out from the City Centre and is focused on these routes and constrained by the geography to the south.
The performance of the SRN in the Solent is weak, and it is frequently congested and experiences journey time unreliability. There are pinch points and hotspots for delay on the M3 and M27 at peak times around M27 Junction 3, section of M3 approaching the M27 and M27 between Junctions 5 and 8. The latter being the section most likely to experience congestion with up to 70% chance of congestion at peak times47. Delays on the M27 frequently results in delays on other parts of SRN and local networks, adding to costs for businesses based in the Solent area.
As well as speeds on the SRN being lower than average, speeds on the local network in Southampton are significantly lower and slowing down. Average vehicle speeds have been falling since 2015, from 17.4mph to 16.9mph, in Hampshire, data is at a county-wide level, where speeds have broadly remained consistent48. The average delay per vehicle per mile (compared to free flow conditions) within Southampton is getting worse, with delay increasing from 85.5 seconds in 2015 to 91.8 seconds in 201849.
47 Highways England, Route Based Strategy Evidence Report, 2014 48 DfT Road Congestion Statistics (Feb 2019) - Table CGN0501b 49 DfT Road Congestion Statistics (Feb 2019) - Table CGN0502b
37

CONNECTING SOUTHAMPTON CITY REGION TRANSFORMING CITIES FUND STRATEGIC OUTLINE BUSINESS CASE
On the main radial corridors into Southampton and Eastleigh shows that average vehicle speeds have also reduced over recent years on most of the corridors, as shown in Figure 3-1350. The largest reduction in vehicle speed has been on the A3025 Portsmouth Road (6% reduction).
Average Speed on Main Radial Routes into Southampton 2017 & 2018
0.0
5.0
10.0
15.0
20.0
25.0
30.0
35.0
40.0
45.0
Ave
rage
Veh
icle
Sp
eed
(m
ph
)
2017
2018 Radial Route
Figure 3-13 – Change in Average Vehicle speed for main radial roads 2017-2018
Delays occur on these corridors as well, with St Denys Road experiencing a delay of 125 seconds per mile and Shirley Road 98 seconds when compared to free-flow conditions. These are two important bus corridors, and the delay on St Denys Road correlates to variation in bus journey times – which can be up to 30 minutes different between peak periods.
The corridors in the north and east part of the City Region in 2013/14 with the most severe congestion during the AM and PM peak periods, are shown in Map 3.9 by black lines. The most congested sections in the AM peak include the M27 between Junctions 7 and 8, A3024 Bitterne Road West, A335 Stoneham Way in the AM, the southern end of the A335 Thomas Lewis Way, B3043 Bournemouth Road, and A3025 Portsmouth Road approaching the Itchen Toll Bridge. Many of these roads such as A3024 Northam River Bridge, A335 approaching M27 Junction 5, A33 The Avenue approaching A35 Burgess Road in the AM peak, A335 Southampton Road/ Wide Lane in Eastleigh and Hamble Lane are congested in the PM peak.
Journey times can vary, by time of day and direction. Bluetooth data indicates that on some routes in Southampton journeys can take 20 times longer at the most congested times of day. This variance can be 25 minutes between the quickest and longest times. This has an impact on average speeds, with St Denys Road corridor having speeds of 19kph on a 1km length of road.
50 DfT Road Congestion Statistics (Feb 2019) - Table CGN0501c
38

CONNECTING SOUTHAMPTON CITY REGION TRANSFORMING CITIES FUND STRATEGIC OUTLINE BUSINESS CASE
Map 3.9 – Average Vehicle Delays in AM (0700-0900) and PM (1600-1800) peaks 2013/14 from Trafficmaster data
The non-City Centre locations of major employers such as the University of Southampton and the University Hospital Southampton, USSP, around M27 Junction 5, Nursling and Hedge End generate localised congestion hotspots.
The suburban location of the UHS Hospital puts considerable pressure on the local road network in the north western part of the city as its’ 11,500 staff largely commute to work by private car (see the case study box). A response to this is the operation of a staff Park & Ride service.
Other sites see major congestion on routes to the SRN such as around M271 Junction 1, Redbridge Roundabout, M27 Junctions 5 and 7, and along Hamble Lane. Sites such as the Hospital and Universities, have varying working patterns and staff/customer/student needs, making it difficult to serve some user groups’ journey effectively by public transport.
39

CONNECTING SOUTHAMPTON CITY REGION TRANSFORMING CITIES FUND STRATEGIC OUTLINE BUSINESS CASE
Case Study: University Hospital Southampton NHS Foundation Trust (UHS) The University Hospital Southampton is the main hospital within the City Region. The UHS is located on a constrained suburban site 4km north-west of Southampton City Centre in Shirley, north of A35 Winchester Road. The site is constrained physically as it is surrounded by residential uses and is intensifying its clinical operations.
The UHS is a regionally important teaching hospital employing over 11,500 staff – clinical, research and administrative. It is one of 12 regional cancer centres and one of the largest University Hospitals in the UK. The hospital offers specialist cancer services and treatment to a population of over 3.7 million people from a wide geographical area, including Dorset, the Channel Islands, Hampshire, the Isle of Wight, southern Wiltshire and West Sussex. A new £22m Centre for Cancer Immunology research opened in 2018 and construction work has started on a new Maggies cancer patient support centre to provide emotional and practical support. When open it is expected to have around 20,000 visits a year.
The hospital’s location and the lack of affordable housing means that some staff commute from areas in the City Region such as Totton-Waterside and Eastleigh and from further afield to the site by car. Although a number of frequent bus routes serve the site, its location, parking provision, and the lack of cross-city bus routes from eastern Southampton or the wider City Region means that many patients and visitors drive. The combination of restricted on-site parking and poor connectivity means that many of those commuting by car park in surrounding residential roads causing congestion. This impacts on bus services and on people’s ability to get to their health apportionments on time – it is estimated that missed appointments costs the NHS £160 per missed appointment in lost productivity.
Traffic modelling forecasts suggest that a number of key junctions and roads in the vicinity of the Hospital site will see an increase in total delay, with hotspots in the PM peak on Coxford Road, Lordswood Road and Dale Road approaching A35 Winchester Road.
To support future growth, development of research, intensification of site activity, an improve patient and visitor experience, and improved productivity of those employed at the Hospital campus, investment in different ways of getting staff and visitors to travel to the Hospital.
Planned Growth There are some bold and ambitious plans for growth in the City Region over the next two decades. Between 2011 and 2036, the Southampton City Region will have a need to accommodate an additional 42,000 new homes and 472,000m² of employment space. This forms part of the PfSH plans for 104,000 new homes and 1,000,000m² of employment across the whole Solent area51. The spatial distribution of these new homes and additional employment space in the City Region is shown in Table 3-11 and on Map 3.10.
Location Additional Dwellings by
2036
Planned New Employment floorspace (m²) by 2036
Total number of Jobs by 2036 (existing and
new) Southampton 19,450 184,000 112,746 Eastleigh 14,950 114,000 60,370 New Forest 3,600 32,000 26,242 Test Valley 4,640 142,000 22,456 Total 42,640 472,000 221,814
Table 3-11 – Forecast Southampton City Region Growth 2011-2036, PfSH Spatial Strategy
This new employment space will see 18,000 new jobs created and see the population of the City Region increase by 22% over that time. Whilst just under half of new homes planned will be in or around the City Centre, the remainder are in ‘greenfield’ locations as extensions to existing built up areas. More detail on planned population, housing and employment growth is in Appendix 2.
51 PfSH – Partnership for South Hampshire, Spatial Statement, 2016
40

CONNECTING SOUTHAMPTON CITY REGION TRANSFORMING CITIES FUND STRATEGIC OUTLINE BUSINESS CASE
Map 3.10 - Planned Quantum of Growth within City Region by 2036
Southampton’s Growth - The majority of the housing and employment growth will be in the City Centre as set out in the City Centre Action Plan. Through to 2026 5,450 new homes are planned along with employment development providing 4,700 new jobs.52 Further sites will continue to intensify land use and grow population in the City Centre. The Bargate ward is already the fastest growing ward in the city (with population 20% since 2011), and by 2024, its population is expected to increase by 20% again. Several major development sites have been identified as ‘Very Important Projects’ by SCC the locations of which are shown in Figure 3.14, and are promoted as vital to the economic growth aspirations of Southampton and the wider City Region.
52 City Centre Action Plan, SCC, 2015 & Core Strategy, SCC, 2015
41
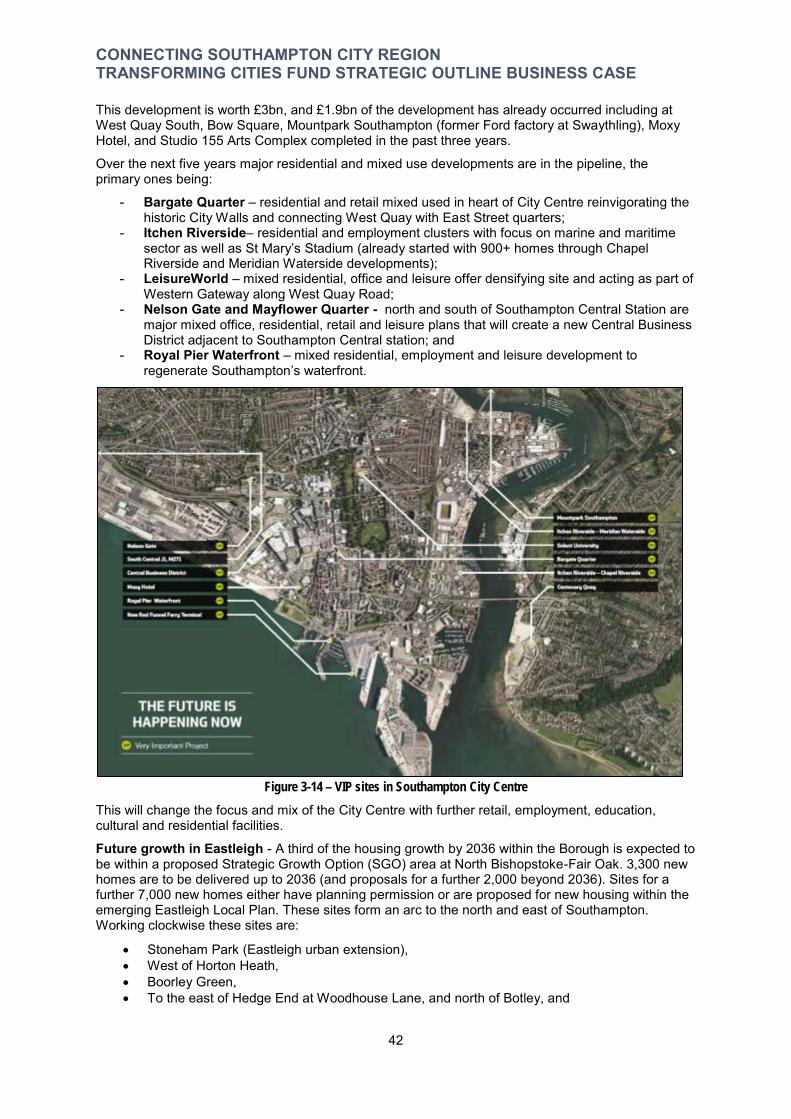
CONNECTING SOUTHAMPTON CITY REGION TRANSFORMING CITIES FUND STRATEGIC OUTLINE BUSINESS CASE
This development is worth £3bn, and £1.9bn of the development has already occurred including at West Quay South, Bow Square, Mountpark Southampton (former Ford factory at Swaythling), Moxy Hotel, and Studio 155 Arts Complex completed in the past three years.
Over the next five years major residential and mixed use developments are in the pipeline, the primary ones being:
- Bargate Quarter – residential and retail mixed used in heart of City Centre reinvigorating the historic City Walls and connecting West Quay with East Street quarters;
- Itchen Riverside– residential and employment clusters with focus on marine and maritime sector as well as St Mary’s Stadium (already started with 900+ homes through Chapel Riverside and Meridian Waterside developments);
- LeisureWorld – mixed residential, office and leisure offer densifying site and acting as part of Western Gateway along West Quay Road;
- Nelson Gate and Mayflower Quarter - north and south of Southampton Central Station are major mixed office, residential, retail and leisure plans that will create a new Central Business District adjacent to Southampton Central station; and
- Royal Pier Waterfront – mixed residential, employment and leisure development to regenerate Southampton’s waterfront.
Figure 3-14 – VIP sites in Southampton City Centre
This will change the focus and mix of the City Centre with further retail, employment, education, cultural and residential facilities.
Future growth in Eastleigh - A third of the housing growth by 2036 within the Borough is expected to be within a proposed Strategic Growth Option (SGO) area at North Bishopstoke-Fair Oak. 3,300 new homes are to be delivered up to 2036 (and proposals for a further 2,000 beyond 2036). Sites for a further 7,000 new homes either have planning permission or are proposed for new housing within the emerging Eastleigh Local Plan. These sites form an arc to the north and east of Southampton. Working clockwise these sites are:
Stoneham Park (Eastleigh urban extension), West of Horton Heath, Boorley Green, To the east of Hedge End at Woodhouse Lane, and north of Botley, and
42
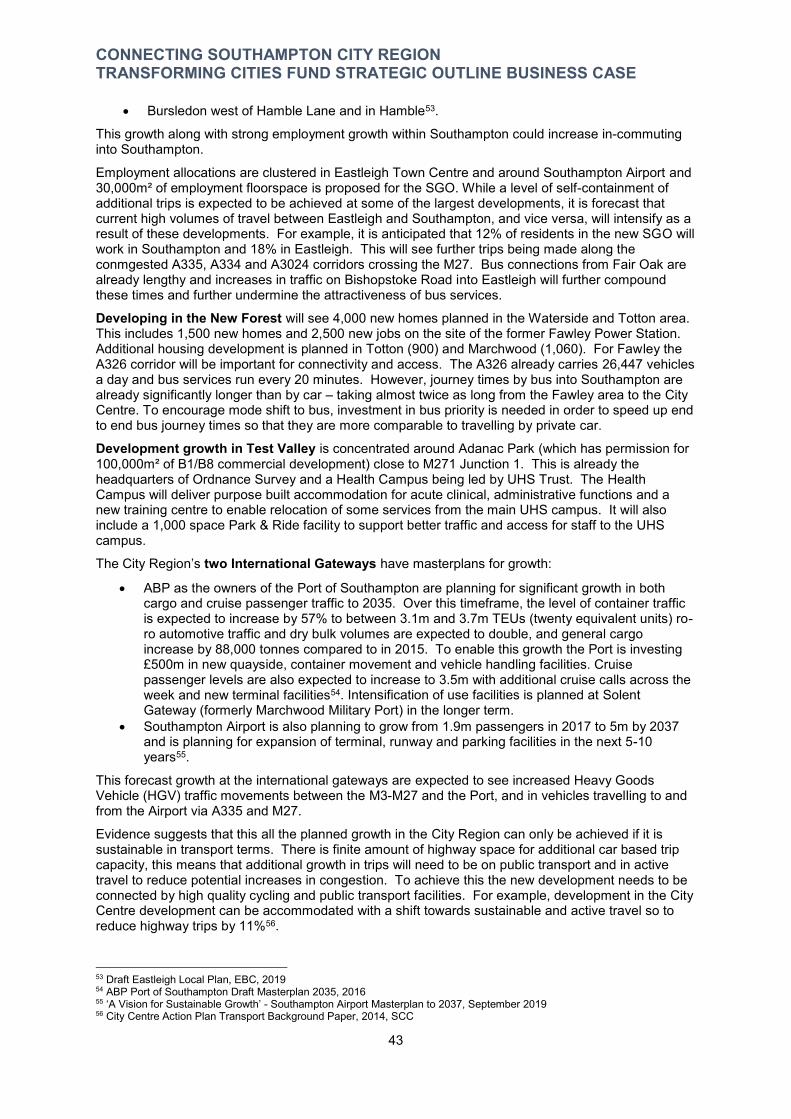
CONNECTING SOUTHAMPTON CITY REGION TRANSFORMING CITIES FUND STRATEGIC OUTLINE BUSINESS CASE
Bursledon west of Hamble Lane and in Hamble53.
This growth along with strong employment growth within Southampton could increase in-commuting into Southampton.
Employment allocations are clustered in Eastleigh Town Centre and around Southampton Airport and 30,000m² of employment floorspace is proposed for the SGO. While a level of self-containment of additional trips is expected to be achieved at some of the largest developments, it is forecast that current high volumes of travel between Eastleigh and Southampton, and vice versa, will intensify as a result of these developments. For example, it is anticipated that 12% of residents in the new SGO will work in Southampton and 18% in Eastleigh. This will see further trips being made along the conmgested A335, A334 and A3024 corridors crossing the M27. Bus connections from Fair Oak are already lengthy and increases in traffic on Bishopstoke Road into Eastleigh will further compound these times and further undermine the attractiveness of bus services.
Developing in the New Forest will see 4,000 new homes planned in the Waterside and Totton area. This includes 1,500 new homes and 2,500 new jobs on the site of the former Fawley Power Station. Additional housing development is planned in Totton (900) and Marchwood (1,060). For Fawley the A326 corridor will be important for connectivity and access. The A326 already carries 26,447 vehicles a day and bus services run every 20 minutes. However, journey times by bus into Southampton are already significantly longer than by car – taking almost twice as long from the Fawley area to the City Centre. To encourage mode shift to bus, investment in bus priority is needed in order to speed up end to end bus journey times so that they are more comparable to travelling by private car.
Development growth in Test Valley is concentrated around Adanac Park (which has permission for 100,000m² of B1/B8 commercial development) close to M271 Junction 1. This is already the headquarters of Ordnance Survey and a Health Campus being led by UHS Trust. The Health Campus will deliver purpose built accommodation for acute clinical, administrative functions and a new training centre to enable relocation of some services from the main UHS campus. It will also include a 1,000 space Park & Ride facility to support better traffic and access for staff to the UHS campus.
The City Region’s two International Gateways have masterplans for growth:
ABP as the owners of the Port of Southampton are planning for significant growth in both cargo and cruise passenger traffic to 2035. Over this timeframe, the level of container traffic is expected to increase by 57% to between 3.1m and 3.7m TEUs (twenty equivalent units) ro-ro automotive traffic and dry bulk volumes are expected to double, and general cargo increase by 88,000 tonnes compared to in 2015. To enable this growth the Port is investing £500m in new quayside, container movement and vehicle handling facilities. Cruise passenger levels are also expected to increase to 3.5m with additional cruise calls across the week and new terminal facilities54. Intensification of use facilities is planned at Solent Gateway (formerly Marchwood Military Port) in the longer term.
Southampton Airport is also planning to grow from 1.9m passengers in 2017 to 5m by 2037 and is planning for expansion of terminal, runway and parking facilities in the next 5-10 years55.
This forecast growth at the international gateways are expected to see increased Heavy Goods Vehicle (HGV) traffic movements between the M3-M27 and the Port, and in vehicles travelling to and from the Airport via A335 and M27.
Evidence suggests that this all the planned growth in the City Region can only be achieved if it is sustainable in transport terms. There is finite amount of highway space for additional car based trip capacity, this means that additional growth in trips will need to be on public transport and in active travel to reduce potential increases in congestion. To achieve this the new development needs to be connected by high quality cycling and public transport facilities. For example, development in the City Centre development can be accommodated with a shift towards sustainable and active travel so to reduce highway trips by 11%56.
53 Draft Eastleigh Local Plan, EBC, 2019 54 ABP Port of Southampton Draft Masterplan 2035, 2016 55 ‘A Vision for Sustainable Growth’ - Southampton Airport Masterplan to 2037, September 2019 56 City Centre Action Plan Transport Background Paper, 2014, SCC
43

CONNECTING SOUTHAMPTON CITY REGION TRANSFORMING CITIES FUND STRATEGIC OUTLINE BUSINESS CASE
Forecast Impacts of Growth on Congestion and Delay – City Region As a result of this development in a Do-Nothing scenario it is expect that there will be 159,000 additional trips across the day on the City Region’s transport network – 11.7% more than now57. The majority of these are forecast to be highway trips (12% growth) but active travel and public transport will see additional trips – a 25.8% growth in public transport trips forecast. The growth in trips are focused in Southampton, but Eastleigh is forecast to have the greatest increase in trips. The biggest increase in demand for public transport in the City Region is forecast to be on corridors coming into Southampton City Centre and into Eastleigh Town Centre.
Modelling carried out for PfSH using the Solent SRTM has forecast the growth in travel demand as a result of planned growth (housing, employment and port), and the impact of the resulting additional trips on the network. Map 3.11 shows that there are significant increases in traffic flows on most corridors in the City Region in the AM peak. A small number of links experience decreases in flows (shown in green). These are as a result of schemes being implemented from 2015-2020, including HE RIS1 M27 Smart Motorways and M27 Southampton Junctions improvement scheme at M27 J8 and Windhover Roundabout. The greatest increases in flows are on the SRN rather than the local road network or where new highways schemes such as Botley By-pass are proposed. The largest increase on the M27 is between Junctions 8 and 10, and M3 between Junctions 10 and 14. During the AM peak flows on these sections increase by 2,000, and in the PM there is a similar increase.
Away from the SRN, the greatest increases in flows are entering or in the densely populated centres and where significant growth in proposed. In the AM peak these largest increases in 2036 are on:
A326 Marchwood By-pass northbound – up to 350 PCUs, A33 Mountbatten Way approaching the City Centre – up to 430, and A3024 Bitterne Road West northbound with increases over 300 PCUs.
The A3024 Bitterne Road West is also affected in the PM peak (with 450 PCU growth in this time period) and there are increases around UHS in Shirley.
Map 3.11- Forecast Change in traffic volumes 2014-2036 AM Peak (red represents growth, green indicates reductions)58
57 Solent Transport SRTM Report for PfSH, 2016 58 Solent Transport SRTM Results for PfSH Spatial Strategy, 2016
44

CONNECTING SOUTHAMPTON CITY REGION TRANSFORMING CITIES FUND STRATEGIC OUTLINE BUSINESS CASE
As well as significant increases on links, at certain locations the increases in flows will see junction delays increase as result of additional traffic. Map 3.12 identifies the locations where the greatest delay will be experienced in the 2036 AM peak. Red circles signify the greatest increase.
Junctions where delays are forecast to increase include:
Junctions on the SRN at M271 Redbridge Roundabout, M27 J3, around M27 J5, and M3 J13 (the largest delay increases are forecast at these junctions)
Junctions around Southampton General Hospital and Southampton Airport, On the northern section of the Inner Ring Road around Southampton City Centre, On the M27 between J3 and J7, and A33 Redbridge Road, and The junction of Bassett Avenue and Winchester Road which is expected to see a 117%
increase in PCU delay.
Journey times into the City Centre are also predicted to increase, with A33 Millbrook Road West anticipated to see a 127% increase in journey time by 2026.
These increases in trips, delay and journey times will have negative impacts on congestion, the reliability of bus journeys, and air quality.
Map 3.12 – Forecast Delay Difference 2014-2036 AM Peak (red represents increases, green indicates reductions)59
How Transformational Investment can tackle congestion - City Region
This forecast increase in trips and subsequent decrease in the efficiency of the road network creates an opportunity – and a requirement - to increase the mode share of sustainable transport modes for travel in the City Region. Public transport offers a clear route for achieving this, and to do so it needs to be a viable alternative to the car. The complex patterns of journey origins and destinations as shown in Table 3-7 will however make this challenging. Bus has a vital role to play in connecting perphiperial communities and new developments to the employment locations City and Town Centres, and across the City Region.
59 Solent Transport SRTM Results for PfSH Spatial Strategy, 2016
45
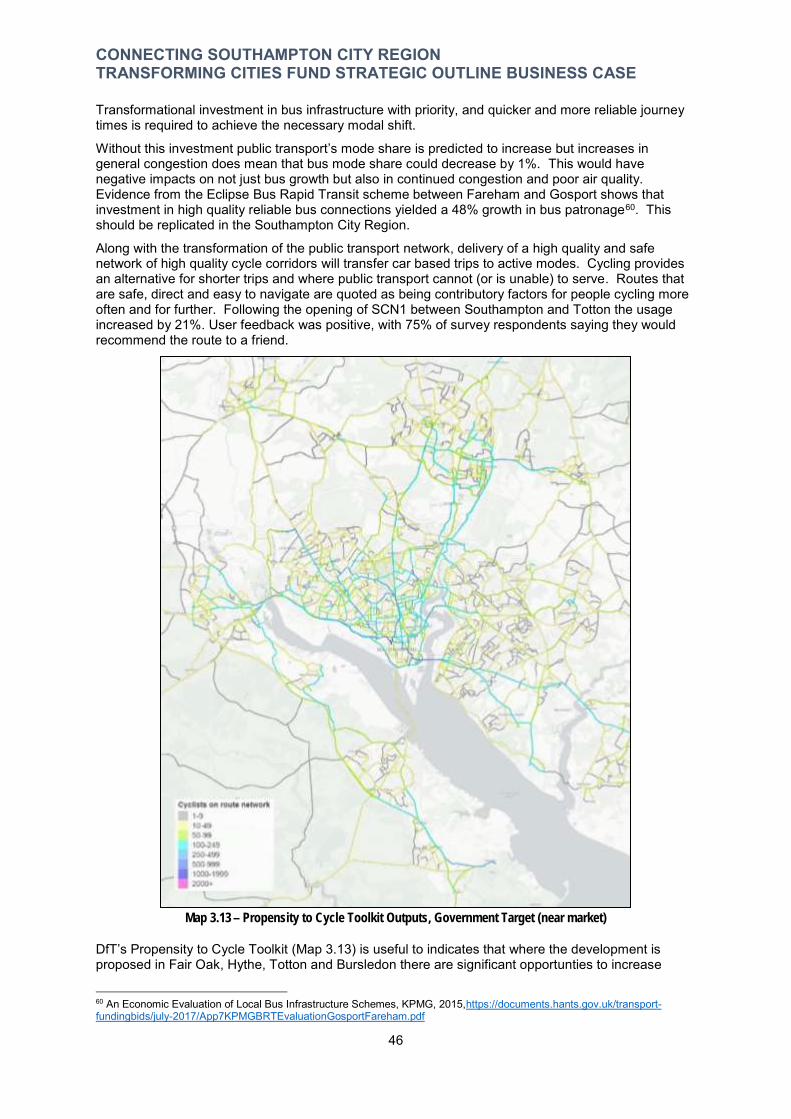
CONNECTING SOUTHAMPTON CITY REGION TRANSFORMING CITIES FUND STRATEGIC OUTLINE BUSINESS CASE
Transformational investment in bus infrastructure with priority, and quicker and more reliable journey times is required to achieve the necessary modal shift.
Without this investment public transport’s mode share is predicted to increase but increases in general congestion does mean that bus mode share could decrease by 1%. This would have negative impacts on not just bus growth but also in continued congestion and poor air quality. Evidence from the Eclipse Bus Rapid Transit scheme between Fareham and Gosport shows that investment in high quality reliable bus connections yielded a 48% growth in bus patronage60. This should be replicated in the Southampton City Region.
Along with the transformation of the public transport network, delivery of a high quality and safe network of high quality cycle corridors will transfer car based trips to active modes. Cycling provides an alternative for shorter trips and where public transport cannot (or is unable) to serve. Routes that are safe, direct and easy to navigate are quoted as being contributory factors for people cycling more often and for further. Following the opening of SCN1 between Southampton and Totton the usage increased by 21%. User feedback was positive, with 75% of survey respondents saying they would recommend the route to a friend.
Map 3.13 – Propensity to Cycle Toolkit Outputs, Government Target (near market)
DfT’s Propensity to Cycle Toolkit (Map 3.13) is useful to indicates that where the development is proposed in Fair Oak, Hythe, Totton and Bursledon there are significant opportunties to increase
60 An Economic Evaluation of Local Bus Infrastructure Schemes, KPMG, 2015,https://documents.hants.gov.uk/transport-fundingbids/july-2017/App7KPMGBRTEvaluationGosportFareham.pdf
46
CONNECTING SOUTHAMPTON CITY REGION TRANSFORMING CITIES FUND STRATEGIC OUTLINE BUSINESS CASE
levels of cycling. Implementing high quality cycle infrastructure linking to public transport interchanges or, employment location will help achieve mode shift.
Transformational investment in public transport and active travel for intra-urban journeys, good interchanges with the rail network, and widening avaliabiliyt of alternative types of mobility will tackle congestion. This will support the improved operation of the SRN, make the ubran areas more attractive for businesses to locate, support the necessary sustainable economic growth, and improve the quality of life for people living in the City Region.
Forecast Impacts of Growth on Congestion and Delay for Access to Southampton City Centre
Currently 30,800 people travel into Southampton City Centre each morning; 56% in cars, 20% by bus, 13% on foot, 2% by bike, and 8% by either rail or ferry61. Taking account of the growth envisaged in the City Cente Action Plan, the Port and other planned growth across Southampton, there is predicted to be an additional 18.5% trips being made into the City Centre each morning by 2026. This could result in 36,500 people travelling into the City Centre. If the current mode shares remain unchanged this would mean over 20,400 trips by car, almost 7,000 will be travelling by bus and over 700 by bike.
Analysis from the Southampton City Centre Microsimulation Model shown in Map 3.14 reveals that on the main routes into Southampton City Centre, the biggest traffic increases in 2026 would be:
along the A33 Mountbatten Way from Totton and Waterside (10%), and A33 The Avenue from Chandlers Ford (14%).
. Map 3.14 – AM Peak Link Delay Southampton City Centre 2026, SCC
61 2018 SCC Inner Cordon Modal Split Surveys
47
CONNECTING SOUTHAMPTON CITY REGION TRANSFORMING CITIES FUND STRATEGIC OUTLINE BUSINESS CASE
Both of these radial routes connect in from the development growth areas in Eastleigh and the Waterside as well as serving the growing Port. As the City Centre grows as a place to live as well as work, an increase in trips leaving the City Centre is forecast. The corridor from Town Quay-West Quay Road-Mountbatten Way is forecast to experience increases in traffic volumes of 37% to 51%. Some of this growth will arise from people accessing employment sites out of the City Centre.
Unmitigated, by 2026 traffic flow growth will also see increases in delays on these approaches and at key junctions in the City Centre, particularly where the arterial routes intercept the Inner Ring Road. Delays are predicted to increase on A335 Onslow Road and A33 Dorset Street approaching Charlotte Place and on A3024 Northam Road between Princes and Britannia Roads. These will impact on the high number of bus services on these routes into the City Centre, and on people walking trying to cross the Inner Ring Road
Journey times along corridors coming into the City Centre are also predicted to increase, with the A33 route in from Totton taking 106% longer in the AM peak in 2026 compared to 2016.
How Transformational Investment can tackle congestion - City Centre The increases in number of people wanting to access the City Centre mean that a transformational approach is required. It is needed to make it a place where more people will want to live, secure its’ future as a successful and attractive employment hub location, and as the hub of the transport network. Doing so through high quality walking and cycling routes, direct bus access, changing how traffic accesses and circulates around, and creation of attractive new public spaces will ensure the City Centre remains vibrant.
It is essential that this transformation can take place so that the gains made on corridors entering the City Centre are not lost. On those corridors into the City Centre and within it, new bus lanes and priority at signals will allow buses to avoid congested sections supporting significant reductions in journey times. Bus priority measures delivered on Shirley Road have helped achieve a 14% decrease in journey times with the combination of bus lanes and in-signal technology62. Through the City Streets 2 Movement & Access Plan, road space within the Inner Ring Road is proposed to be reallocated to pedestrians, bike users and public transport. People driving into the city will be directed towards multi-storey car parks located around the Inner Ring Road.
The reduction and removal of traffic in the the City Centre provides opportunities to create the new places and public spaces that will support the vitality and vibrancy of the City Centre and create healthy communities. The City Centre will see increased street life and activity, improved safety, greater inclusivity, and reduced pollution and traffic. This would be a transformation with the main developments, transport hubs and new spaces connected together.
Impact of Doing Nothing Without targeted investment on main corridors and in the City Region, congestion and delays affecting public transport, severance and conditions which impede sustainable and active travel will persist. The less pleasant and people-friendly environment would persist and may result in negative perceptions of Southampton which may deter people from wanting to invest and live in the City Region. Development would remain car-based leading to increased congestion and lower productivity. With businesses unable to make best use of the transport network or attract the required calibre of employee.
There would remain no additional space to create more highway capacity. Congestion, poor public realm and disconnectivity would weaken the case for City Centre investment in the required new Grade A office developments such as at Nelson Gate or the Mayflower Quarter. Redevelopment could be based around low density, car-based land uses meaning key sites such as the Royal Pier would unlikely to be viable. With developers being expected to respond by proposing higher levels of parking provision and needing highway interventions. This could mean that the growth in more productivity City Centre jobs is stalled or curtailed.
Conversely, without a step-change in the quality and capability of non-car transport networks, it will be difficult to persuade developers not to take this car-oriented aprpoach to development.
62 SCC Trial on Bus Priority on A3057 Shirley Road, 2019
48
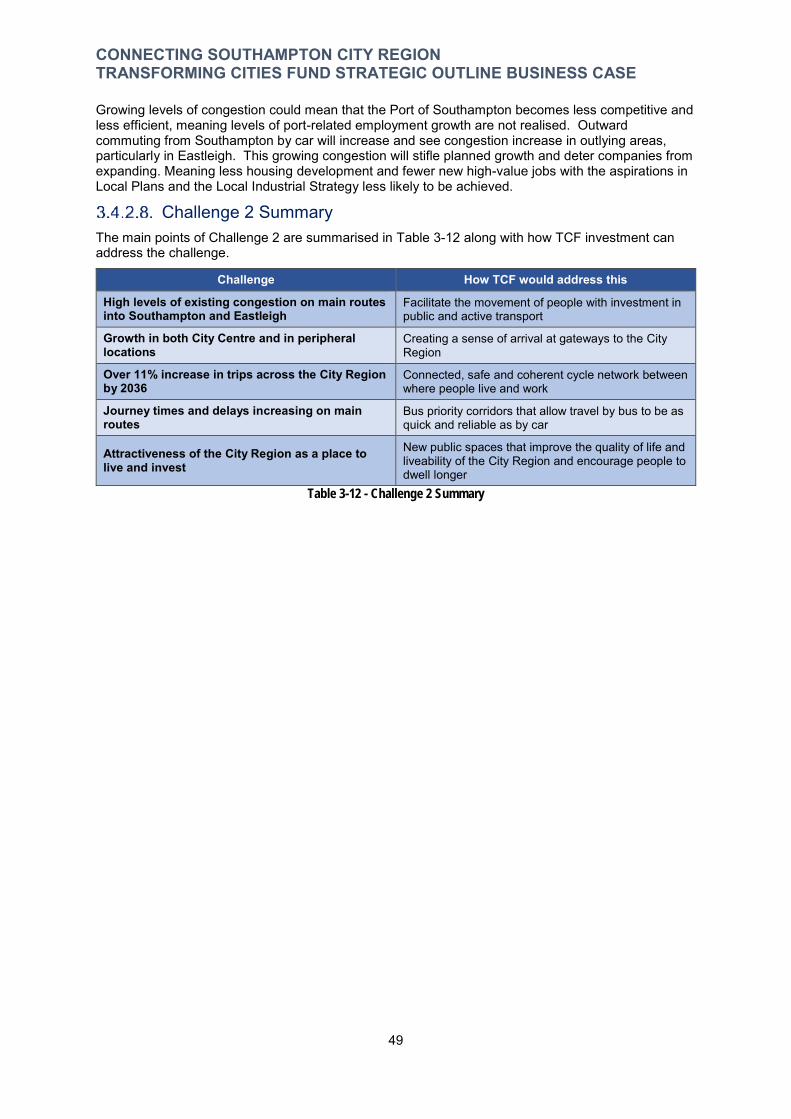
CONNECTING SOUTHAMPTON CITY REGION TRANSFORMING CITIES FUND STRATEGIC OUTLINE BUSINESS CASE
Growing levels of congestion could mean that the Port of Southampton becomes less competitive and less efficient, meaning levels of port-related employment growth are not realised. Outward commuting from Southampton by car will increase and see congestion increase in outlying areas, particularly in Eastleigh. This growing congestion will stifle planned growth and deter companies from expanding. Meaning less housing development and fewer new high-value jobs with the aspirations in Local Plans and the Local Industrial Strategy less likely to be achieved.
Challenge 2 Summary The main points of Challenge 2 are summarised in Table 3-12 along with how TCF investment can address the challenge.
Challenge How TCF would address this
High levels of existing congestion on main routes into Southampton and Eastleigh
Facilitate the movement of people with investment in public and active transport
Growth in both City Centre and in peripheral locations
Creating a sense of arrival at gateways to the City Region
Over 11% increase in trips across the City Region by 2036
Connected, safe and coherent cycle network between where people live and work
Journey times and delays increasing on main routes
Bus priority corridors that allow travel by bus to be as quick and reliable as by car
Attractiveness of the City Region as a place to live and invest
New public spaces that improve the quality of life and liveability of the City Region and encourage people to dwell longer
Table 3-12 - Challenge 2 Summary
49

CONNECTING SOUTHAMPTON CITY REGION TRANSFORMING CITIES FUND STRATEGIC OUTLINE BUSINESS CASE
3.4.3. Challenge 3: Reducing Bus Journey Times to make the bus attractive to car drivers
Bus travel in the City Region has been growing, backed by partnership and investment, but there are four areas where maintaining this positive trend is threatened: 1. By increased congestion on the main corridors and river crossings; 2. By a need to improve public transport connectivity and journey time reliability particularly
between employment locations and residential areas; 3. Inter modal connectivity from the railway to employment sites not within easy access of a
rail station; and 4. If buses remain slow and unreliable the strong growth, and future growth, in bus usage
and achieving modal shift are likely to be eroded.
Challenge 3 will be explained across five sections:
Section 3.4.3.1 gives a description of the current bus network, level of mode share and role that buses have in the current ‘transport mix’ within the City Region;
Section 3.4.3.2 provides an explanation of recent trends in bus usage; Section 3.4.3.3 identifies the strengths and weaknesses of the local bus network; Section 3.4.3.4 offers a description of the impact of growing congestion on bus service
punctuality; and Section 3.4.3.5 sets out what a ‘do nothing’/business as usual approach would mean for bus
use in the City Region if such an approach was adopted.
The City Region Bus Network The bus is a fundamental and significant component of a modern, integrated transport network. Buses meet the needs of people accessing work, school, college, university, hospital, GP surgeries, shops and a range of social and leisure activities. In addition to the economic benefits of the bus enabling people to access employment and generate income, the bus is an effective tool of social policy. Vulnerable and socially disadvantaged groups in society are often the most reliant on bus networks. Bus services are fundamental to providing the jobless with access to work; young people to education and training; and providing a way out of social isolation for older and disabled people.
The Southampton City Region has a comprehensive network of intra and inter-urban bus services. Frequencies range from hourly to some routes operating ‘turn-up-and go’. The two main operators within the City Region are First and Go South Coast, which compete directly with each other on most radial corridors within Southampton. Most local bus services in Eastleigh Borough are focused on Eastleigh Town Centre and are operated by Xelabus or Go South Coast, with two routes (Hedge End-Southampton and Hamble-Netley-Southampton) operated by First.
The bus network operates on a hub and spoke radial pattern. All routes in Southampton serve the City Centre with most terminating there. This largely radial pattern means there is little linkage between corridors meaning people are funnelled to the City Centre to interchange with other bus services, or rail.
There are four cross-city routes that connect eastern and western Southampton – all serving or passing close to the Hospital site. None of the cross-city routes extend into Hampshire, and the number of cross-city routes used to be higher. However, several previous cross city routes suffered particularly badly from congestion owing to needing to cross the City Centre on every journey, these were removed. Map 3.15 demonstrates how the network and bus frequencies fan out across the City Region.
In the City Centre, terminating services cluster in certain locations and take different routes to enter and leave the City Centre. The quality of these gateways can be poor and interchange between services inconvenient. Some of the district centres act as focuses for bus services. Shirley is a focus for the west as routes converge there to run into Southampton along Shirley Road, and Bitterne and Woolston are focal points for the east with routes converging at these centres to enter the City Centre either via Bitterne Road West or the Itchen Bridge. Through the UniLink network the University of Southampton’s Highfield Campus is a hub for a network for the UniLink network serving the Hospital, City Centre, and Airport.
50
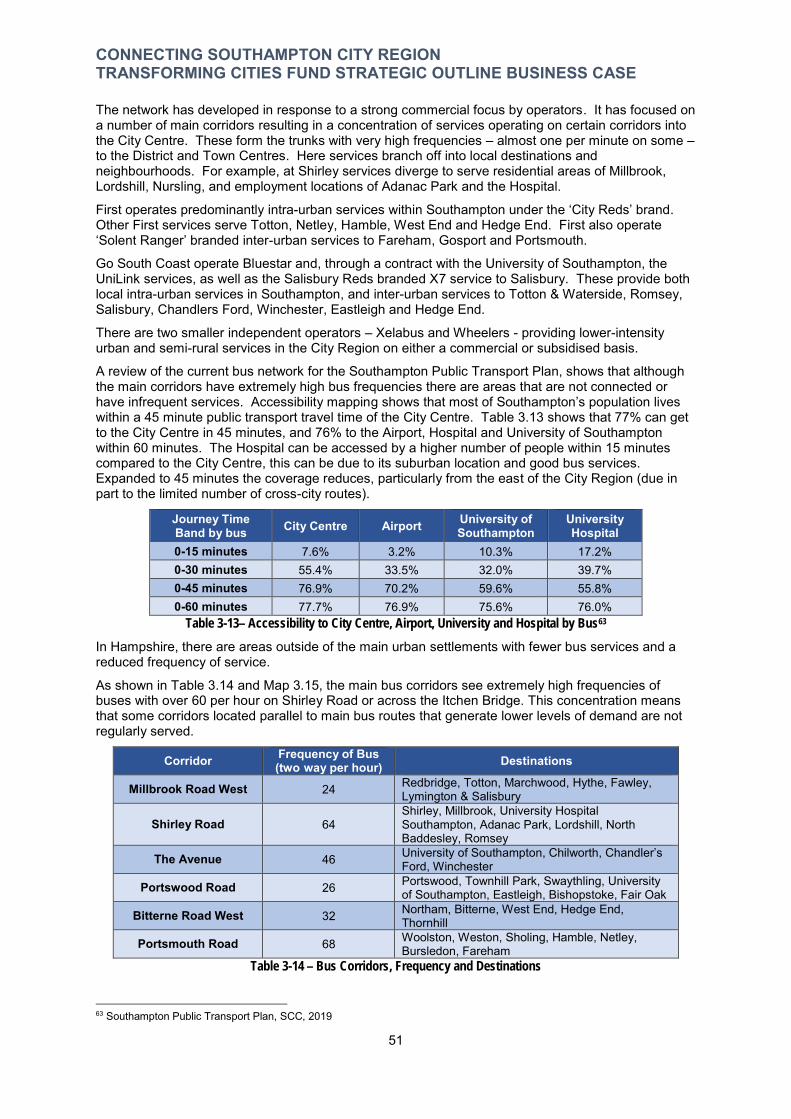
-
CONNECTING SOUTHAMPTON CITY REGION TRANSFORMING CITIES FUND STRATEGIC OUTLINE BUSINESS CASE
The network has developed in response to a strong commercial focus by operators. It has focused on a number of main corridors resulting in a concentration of services operating on certain corridors into the City Centre. These form the trunks with very high frequencies – almost one per minute on some – to the District and Town Centres. Here services branch off into local destinations and neighbourhoods. For example, at Shirley services diverge to serve residential areas of Millbrook, Lordshill, Nursling, and employment locations of Adanac Park and the Hospital.
First operates predominantly intra-urban services within Southampton under the ‘City Reds’ brand. Other First services serve Totton, Netley, Hamble, West End and Hedge End. First also operate ‘Solent Ranger’ branded inter-urban services to Fareham, Gosport and Portsmouth.
Go South Coast operate Bluestar and, through a contract with the University of Southampton, the UniLink services, as well as the Salisbury Reds branded X7 service to Salisbury. These provide both local intra-urban services in Southampton, and inter-urban services to Totton & Waterside, Romsey, Salisbury, Chandlers Ford, Winchester, Eastleigh and Hedge End.
There are two smaller independent operators – Xelabus and Wheelers - providing lower-intensity urban and semi-rural services in the City Region on either a commercial or subsidised basis.
A review of the current bus network for the Southampton Public Transport Plan, shows that although the main corridors have extremely high bus frequencies there are areas that are not connected or have infrequent services. Accessibility mapping shows that most of Southampton’s population lives within a 45 minute public transport travel time of the City Centre. Table 3.13 shows that 77% can get to the City Centre in 45 minutes, and 76% to the Airport, Hospital and University of Southampton within 60 minutes. The Hospital can be accessed by a higher number of people within 15 minutes compared to the City Centre, this can be due to its suburban location and good bus services. Expanded to 45 minutes the coverage reduces, particularly from the east of the City Region (due in part to the limited number of cross-city routes).
Journey Time Band by bus City Centre Airport University of
Southampton University Hospital
0-15 minutes 7.6% 3.2% 10.3% 17.2% 0-30 minutes 55.4% 33.5% 32.0% 39.7% 0-45 minutes 76.9% 70.2% 59.6% 55.8% 0-60 minutes 77.7% 76.9% 75.6% 76.0%
Table 3-13– Accessibility to City Centre, Airport, University and Hospital by Bus63
In Hampshire, there are areas outside of the main urban settlements with fewer bus services and a reduced frequency of service.
As shown in Table 3.14 and Map 3.15, the main bus corridors see extremely high frequencies of buses with over 60 per hour on Shirley Road or across the Itchen Bridge. This concentration means that some corridors located parallel to main bus routes that generate lower levels of demand are not regularly served.
Corridor Frequency of Bus (two way per hour) Destinations
Millbrook Road West 24 Redbridge, Totton, Marchwood, Hythe, Fawley, Lymington & Salisbury
Shirley Road 64 Shirley, Millbrook, University Hospital Southampton, Adanac Park, Lordshill, North Baddesley, Romsey
The Avenue 46 University of Southampton, Chilworth, Chandler’s Ford, Winchester
Portswood Road 26 Portswood, Townhill Park, Swaythling, University of Southampton, Eastleigh, Bishopstoke, Fair Oak
Bitterne Road West 32 Northam, Bitterne, West End, Hedge End, Thornhill
Portsmouth Road 68 Woolston, Weston, Sholing, Hamble, Netley, Bursledon, Fareham
Table 3-14 – Bus Corridors, Frequency and Destinations
63 Southampton Public Transport Plan, SCC, 2019
51
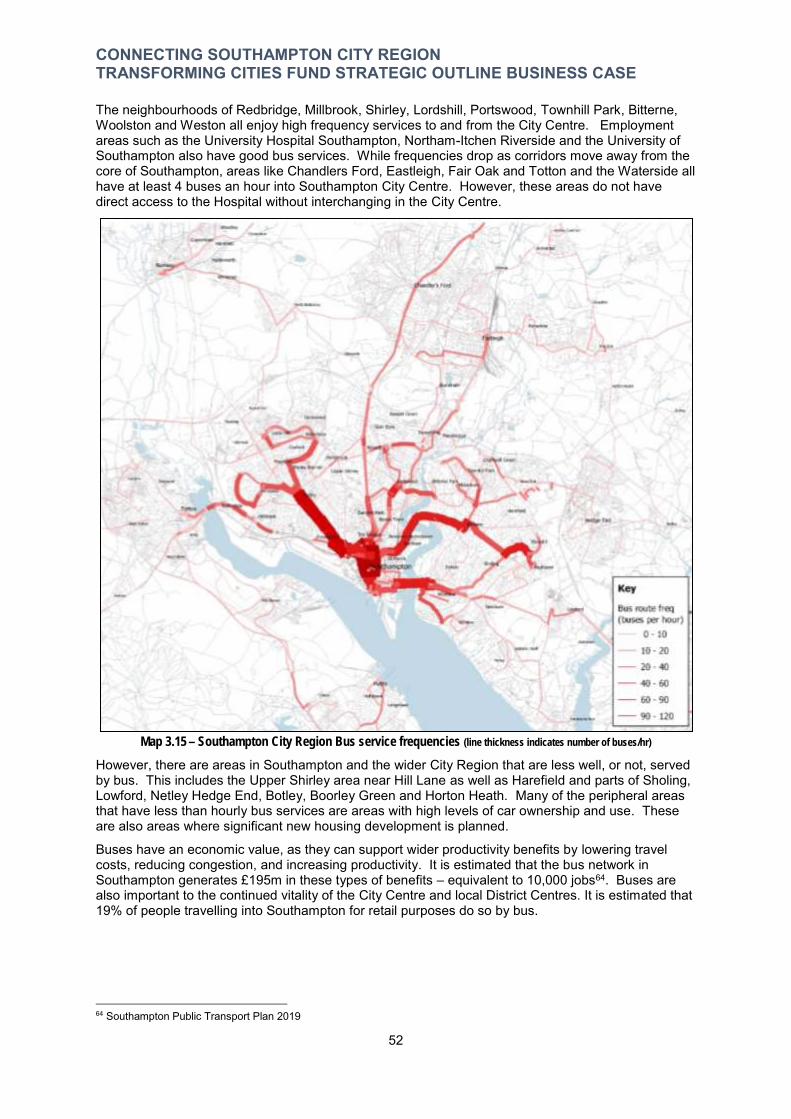
CONNECTING SOUTHAMPTON CITY REGION TRANSFORMING CITIES FUND STRATEGIC OUTLINE BUSINESS CASE
The neighbourhoods of Redbridge, Millbrook, Shirley, Lordshill, Portswood, Townhill Park, Bitterne, Woolston and Weston all enjoy high frequency services to and from the City Centre. Employment areas such as the University Hospital Southampton, Northam-Itchen Riverside and the University of Southampton also have good bus services. While frequencies drop as corridors move away from the core of Southampton, areas like Chandlers Ford, Eastleigh, Fair Oak and Totton and the Waterside all have at least 4 buses an hour into Southampton City Centre. However, these areas do not have direct access to the Hospital without interchanging in the City Centre.
Map 3.15 – Southampton City Region Bus service frequencies (line thickness indicates number of buses/hr)
However, there are areas in Southampton and the wider City Region that are less well, or not, served by bus. This includes the Upper Shirley area near Hill Lane as well as Harefield and parts of Sholing, Lowford, Netley Hedge End, Botley, Boorley Green and Horton Heath. Many of the peripheral areas that have less than hourly bus services are areas with high levels of car ownership and use. These are also areas where significant new housing development is planned.
Buses have an economic value, as they can support wider productivity benefits by lowering travel costs, reducing congestion, and increasing productivity. It is estimated that the bus network in Southampton generates £195m in these types of benefits – equivalent to 10,000 jobs64. Buses are also important to the continued vitality of the City Centre and local District Centres. It is estimated that 19% of people travelling into Southampton for retail purposes do so by bus.
64 Southampton Public Transport Plan 2019
52

CONNECTING SOUTHAMPTON CITY REGION TRANSFORMING CITIES FUND STRATEGIC OUTLINE BUSINESS CASE
Case Study: Effective and Successful Voluntary Partnership Working Since 2012, there has been a voluntary Bus Punctuality Partnership in operation in Southampton. This has assisted in driving investment in promoting greater bus patronage and improving the passenger experience. Frequencies on a number of inter-urban and intra-urban corridors have increased along with a range of ticket pricing options. This commenced through LSTF and Better Bus Area funding enabling upgrades and early adoption of technology such as audio-visual next stop announcements and on-board Wi-Fi and USB charging. Through LSTF SolentGo was launched as the first multi-operator multi-modal smartcard outside of a PTE. Through SHBOA65, there has been continued investment in clean technology, latest vehicles and ticketing including contactless and m-tickets, and as a result the majority of buses in the City Region are less than 5 years old. At bus stops, the gateways to the bus network, a Legible Bus brand was developed for consistency of bus stop flags, timetables, information and maps. Currently, 230 bus stops of Southampton’s bus stops have real-time information (23% of the over 965 in the city), 75% of bus stops have raised kerb, and 43% of Southampton’s traffic signal junctions have bus priority detection activated. In Hampshire, 3 junctions in Eastleigh have tagged based bus priority which is old and in need of replacement. Trials of upgrades to bus priority on Shirley Road saw a 14% decreased in bus journey times. Bus lane enforcement was implemented in Southampton in 2017 as part of the partnership to keep bus lanes available for buses. This has placed Southampton at the forefront of bus patronage growth. The Partnership is governed by a Steering Group of SCC, HCC, SHBOA, all the bus operators and Solent Transport. These innovations have made it easier for people to access buses, provided coherent and clear information on timetables, savings for users through new ticketing offers, reduced bus stop dwell times, and improved security and safety for drivers. The partnership could be undermined without further investment in the highway network to deliver further bus priority and continued excellence in innovation that puts Southampton at the vanguard of patronage growth.
Bus Patronage Trends Over the past decade bus use within the City Region has been steadily increasing, as Figure 3.15 shows. In 2017/18 buses carried 21.6m passenger journeys in Southampton and 33.5m in Hampshire66. This is 12.6% higher than 2009 – which is against the national trend of declining bus patronage over that period. The recent growth has been driven by fare paying passengers. Car ownership in Southampton is lower than the national average, with 1.03 cars per household and 30% not having access to a vehicle. This has an impact on bus patronage.
In 2017/18, Southampton residents made 85.5 bus journeys per head, and Hampshire residents made 24.5 bus journeys per head67. Levels of bus use per head are the 9th highest in England, (which increases to the sixth highest if London and Integrated Transport Authority areas are excluded). Within Southampton, the number of bus journeys made by elderly and disabled concessionary passengers has remained the same since 2015/16 at around 5 million a year (24% of the total)68. .
65 SHBOA – South Hampshire Bus Operators Association 66 DfT Bus Statistics table BUS0103 (March 2019), note Hampshire covers the whole county as statistics are not available at a lower level 67 DfT Bus Statistics Table BUS0110a (March 2019) – Hampshire is whole county 68 DfT Bus Statistics Table BUS0113 (Jan 2019)
53
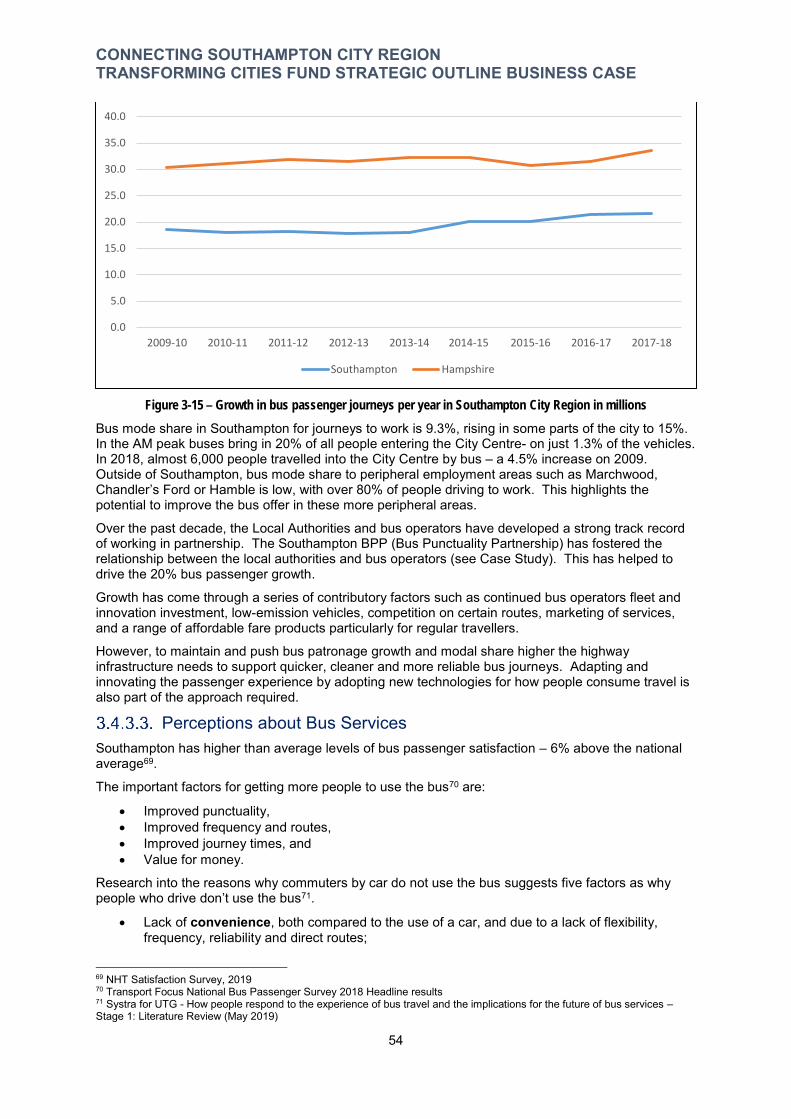
40.0
CONNECTING SOUTHAMPTON CITY REGION TRANSFORMING CITIES FUND STRATEGIC OUTLINE BUSINESS CASE
15.0
20.0
25.0
30.0
35.0
10.0
5.0
0.0
2009-10 2010-11 2011-12 2012-13 2013-14 2014-15 2015-16 2016-17 2017-18
Southampton Hampshire
Figure 3-15 – Growth in bus passenger journeys per year in Southampton City Region in millions
Bus mode share in Southampton for journeys to work is 9.3%, rising in some parts of the city to 15%. In the AM peak buses bring in 20% of all people entering the City Centre- on just 1.3% of the vehicles. In 2018, almost 6,000 people travelled into the City Centre by bus – a 4.5% increase on 2009. Outside of Southampton, bus mode share to peripheral employment areas such as Marchwood, Chandler’s Ford or Hamble is low, with over 80% of people driving to work. This highlights the potential to improve the bus offer in these more peripheral areas.
Over the past decade, the Local Authorities and bus operators have developed a strong track record of working in partnership. The Southampton BPP (Bus Punctuality Partnership) has fostered the relationship between the local authorities and bus operators (see Case Study). This has helped to drive the 20% bus passenger growth.
Growth has come through a series of contributory factors such as continued bus operators fleet and innovation investment, low-emission vehicles, competition on certain routes, marketing of services, and a range of affordable fare products particularly for regular travellers.
However, to maintain and push bus patronage growth and modal share higher the highway infrastructure needs to support quicker, cleaner and more reliable bus journeys. Adapting and innovating the passenger experience by adopting new technologies for how people consume travel is also part of the approach required.
Perceptions about Bus Services Southampton has higher than average levels of bus passenger satisfaction – 6% above the national
69average .
The important factors for getting more people to use the bus70 are:
Improved punctuality, Improved frequency and routes, Improved journey times, and Value for money.
Research into the reasons why commuters by car do not use the bus suggests five factors as why people who drive don’t use the bus71.
Lack of convenience, both compared to the use of a car, and due to a lack of flexibility, frequency, reliability and direct routes;
69 NHT Satisfaction Survey, 2019 70 Transport Focus National Bus Passenger Survey 2018 Headline results 71 Systra for UTG - How people respond to the experience of bus travel and the implications for the future of bus services – Stage 1: Literature Review (May 2019)
54
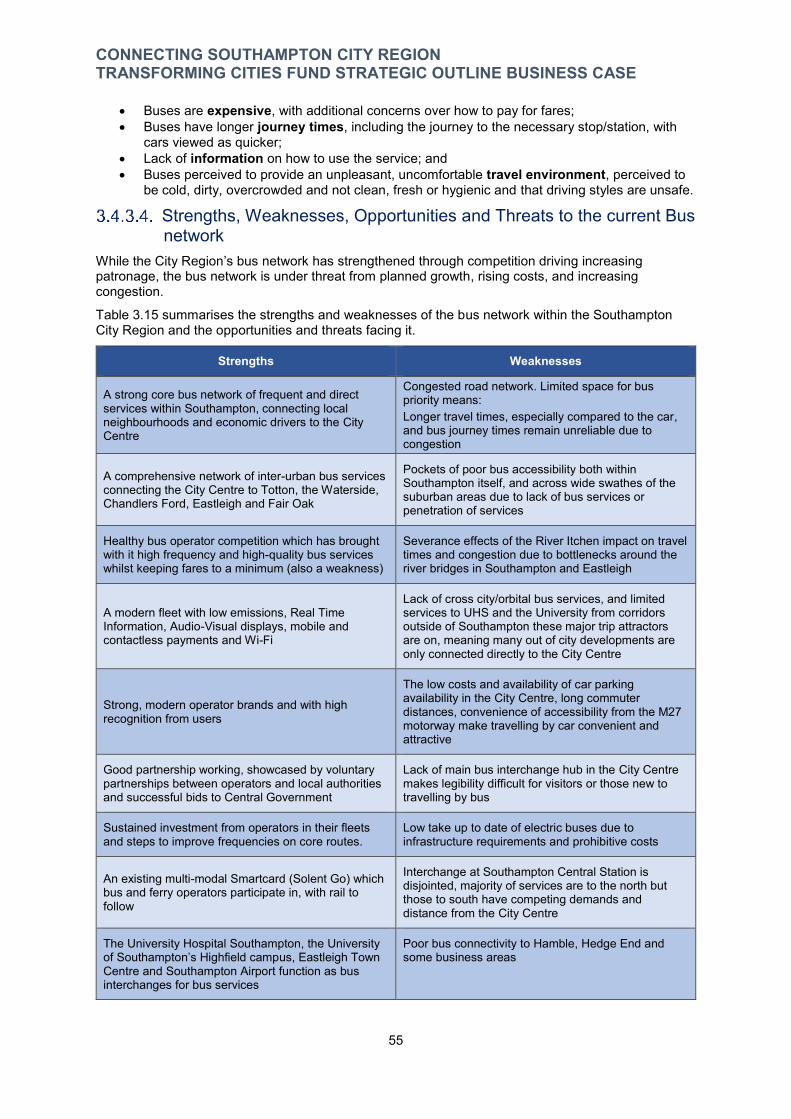
CONNECTING SOUTHAMPTON CITY REGION TRANSFORMING CITIES FUND STRATEGIC OUTLINE BUSINESS CASE
Buses are expensive, with additional concerns over how to pay for fares; Buses have longer journey times, including the journey to the necessary stop/station, with
cars viewed as quicker; Lack of information on how to use the service; and Buses perceived to provide an unpleasant, uncomfortable travel environment, perceived to
be cold, dirty, overcrowded and not clean, fresh or hygienic and that driving styles are unsafe.
Strengths, Weaknesses, Opportunities and Threats to the current Bus network
While the City Region’s bus network has strengthened through competition driving increasing patronage, the bus network is under threat from planned growth, rising costs, and increasing congestion.
Table 3.15 summarises the strengths and weaknesses of the bus network within the Southampton City Region and the opportunities and threats facing it.
Strengths Weaknesses
A strong core bus network of frequent and direct Congested road network. Limited space for bus priority means:
services within Southampton, connecting local Longer travel times, especially compared to the car,neighbourhoods and economic drivers to the City and bus journey times remain unreliable due to Centre congestion
A comprehensive network of inter-urban bus services Pockets of poor bus accessibility both within Southampton itself, and across wide swathes of the connecting the City Centre to Totton, the Waterside, suburban areas due to lack of bus services or Chandlers Ford, Eastleigh and Fair Oak penetration of services
Healthy bus operator competition which has brought Severance effects of the River Itchen impact on travel with it high frequency and high-quality bus services times and congestion due to bottlenecks around the whilst keeping fares to a minimum (also a weakness) river bridges in Southampton and Eastleigh
A modern fleet with low emissions, Real Time Information, Audio-Visual displays, mobile and contactless payments and Wi-Fi
Lack of cross city/orbital bus services, and limited services to UHS and the University from corridors outside of Southampton these major trip attractors are on, meaning many out of city developments are only connected directly to the City Centre
Strong, modern operator brands and with high recognition from users
The low costs and availability of car parking availability in the City Centre, long commuter distances, convenience of accessibility from the M27 motorway make travelling by car convenient and attractive
Good partnership working, showcased by voluntary partnerships between operators and local authorities and successful bids to Central Government
Lack of main bus interchange hub in the City Centre makes legibility difficult for visitors or those new to travelling by bus
Sustained investment from operators in their fleets and steps to improve frequencies on core routes.
Low take up to date of electric buses due to infrastructure requirements and prohibitive costs
An existing multi-modal Smartcard (Solent Go) which bus and ferry operators participate in, with rail to follow
Interchange at Southampton Central Station is disjointed, majority of services are to the north but those to south have competing demands and distance from the City Centre
The University Hospital Southampton, the University Poor bus connectivity to Hamble, Hedge End and some business areas of Southampton’s Highfield campus, Eastleigh Town
Centre and Southampton Airport function as bus interchanges for bus services
55
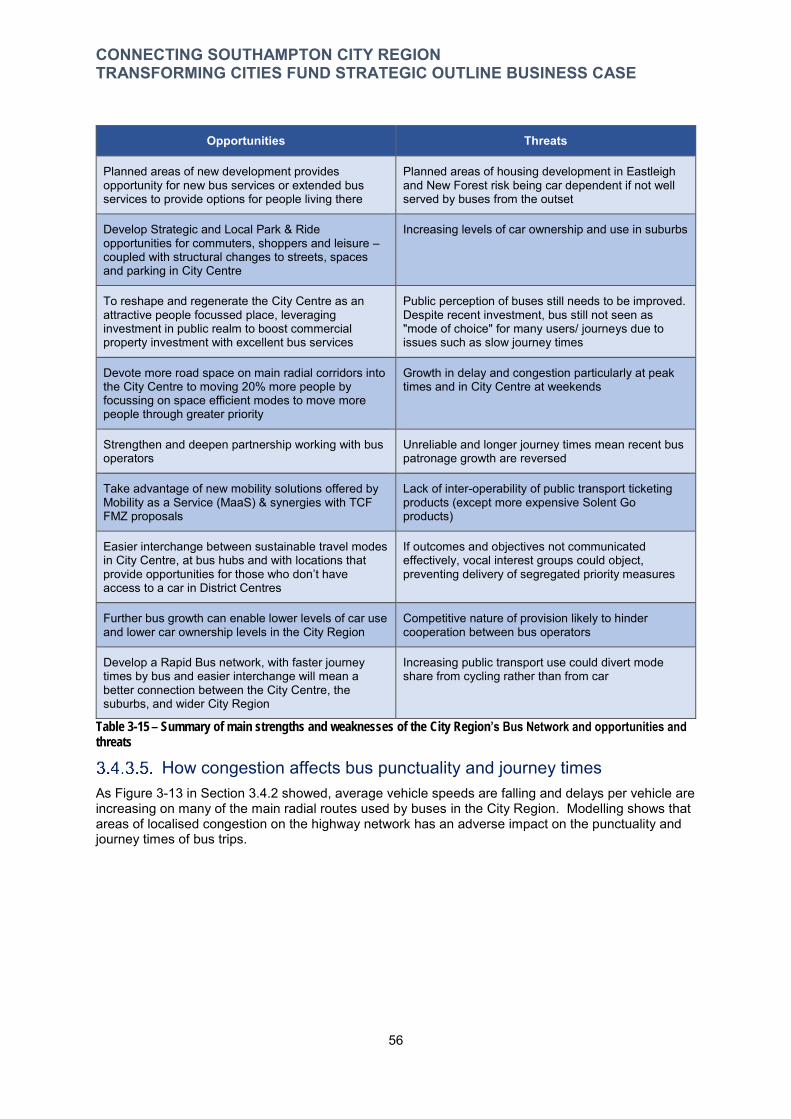
CONNECTING SOUTHAMPTON CITY REGION TRANSFORMING CITIES FUND STRATEGIC OUTLINE BUSINESS CASE
Opportunities Threats
Planned areas of new development provides Planned areas of housing development in Eastleigh opportunity for new bus services or extended bus and New Forest risk being car dependent if not well services to provide options for people living there served by buses from the outset
Develop Strategic and Local Park & Ride Increasing levels of car ownership and use in suburbs opportunities for commuters, shoppers and leisure – coupled with structural changes to streets, spaces and parking in City Centre
To reshape and regenerate the City Centre as an Public perception of buses still needs to be improved. attractive people focussed place, leveraging Despite recent investment, bus still not seen as investment in public realm to boost commercial "mode of choice" for many users/ journeys due to property investment with excellent bus services issues such as slow journey times
Devote more road space on main radial corridors into Growth in delay and congestion particularly at peak times and in City Centre at weekends the City Centre to moving 20% more people by
focussing on space efficient modes to move more people through greater priority
Strengthen and deepen partnership working with bus operators
Unreliable and longer journey times mean recent bus patronage growth are reversed
Take advantage of new mobility solutions offered by Mobility as a Service (MaaS) & synergies with TCF FMZ proposals
Lack of inter-operability of public transport ticketing products (except more expensive Solent Go products)
Easier interchange between sustainable travel modes If outcomes and objectives not communicated effectively, vocal interest groups could object, preventing delivery of segregated priority measures
in City Centre, at bus hubs and with locations that provide opportunities for those who don’t have access to a car in District Centres
Further bus growth can enable lower levels of car use Competitive nature of provision likely to hinder cooperation between bus operators and lower car ownership levels in the City Region
Develop a Rapid Bus network, with faster journey Increasing public transport use could divert mode share from cycling rather than from car times by bus and easier interchange will mean a
better connection between the City Centre, the suburbs, and wider City Region
Table 3-15 – Summary of main strengths and weaknesses of the City Region’s Bus Network and opportunities and threats
How congestion affects bus punctuality and journey times As Figure 3-13 in Section 3.4.2 showed, average vehicle speeds are falling and delays per vehicle are increasing on many of the main radial routes used by buses in the City Region. Modelling shows that areas of localised congestion on the highway network has an adverse impact on the punctuality and journey times of bus trips.
56

CONNECTING SOUTHAMPTON CITY REGION TRANSFORMING CITIES FUND STRATEGIC OUTLINE BUSINESS CASE
Map 3.16 – Sections of the Southampton City Region Network where bus speeds are less than 10kph (2010)72
Map 3.16 hows the sections of the City Region’s road network where bus speeds are are currently slow. These include:
A326 between Marchwood and Totton, A35 Redbridge Causeway approaching M271 Redbridge Roundabout, A3057 Shirley High Street A33 Bassett Avenue Approaching University Hospital Southampton from A35 Winchester Road, and on Bishopstoke Road approaching Eastleigh Town Centre.
These correspond with some of the main sections of general traffic congestion and slow vehicle speeds described in Challenge 2.
Figure 3.16 below summarises the average excess waiting time for frequent services within Southampton and Hampshire. This shows a trend of increasing excess wait time in Southampton – which has increased from 1.8 minutes in 2012/13 to 2.6 minutes in 2016/17 - a 44% increase73.
The proportion of non-frequent bus services running on time in 2016/17 for Southampton was 77%. This compares to 82% in the South East and 83% across England for the same year74.
72 Solent Transport, Transport Delivery Plan, 2013 73 DfT Bus Statistics Table BUS0903 – Jan 2019 74 DfT Bus Statistics Table BUS0902 – Jan 2019
57
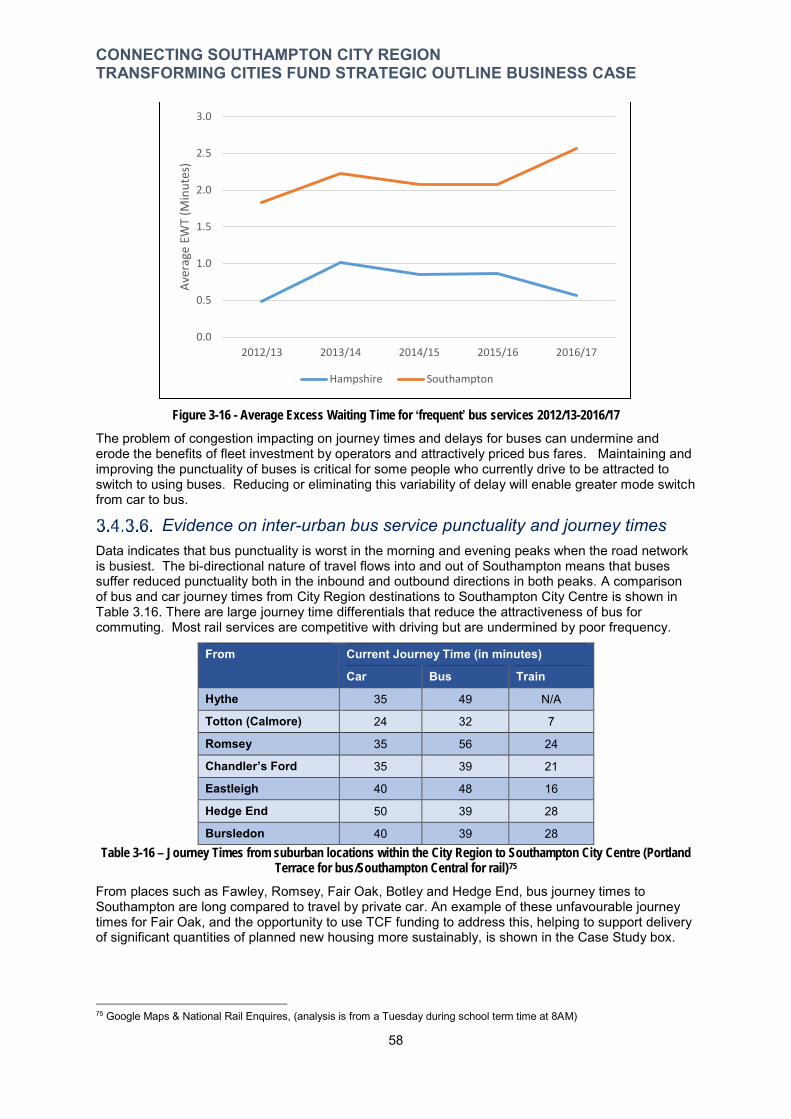
CONNECTING SOUTHAMPTON CITY REGION TRANSFORMING CITIES FUND STRATEGIC OUTLINE BUSINESS CASE
3.0
0.5
1.0
1.5
2.0
2.5
Ave
rage
EW
T (M
inu
tes)
0.0
2012/13 2013/14
Hampshire
2014/15 2015/16 2016/17
Southampton
Figure 3-16 - Average Excess Waiting Time for ‘frequent’ bus services 2012/13-2016/17
The problem of congestion impacting on journey times and delays for buses can undermine and erode the benefits of fleet investment by operators and attractively priced bus fares. Maintaining and improving the punctuality of buses is critical for some people who currently drive to be attracted to switch to using buses. Reducing or eliminating this variability of delay will enable greater mode switch from car to bus.
Evidence on inter-urban bus service punctuality and journey times Data indicates that bus punctuality is worst in the morning and evening peaks when the road network is busiest. The bi-directional nature of travel flows into and out of Southampton means that buses suffer reduced punctuality both in the inbound and outbound directions in both peaks. A comparison of bus and car journey times from City Region destinations to Southampton City Centre is shown in Table 3.16. There are large journey time differentials that reduce the attractiveness of bus for commuting. Most rail services are competitive with driving but are undermined by poor frequency.
From Current Journey Time (in minutes)
Car Bus Train
Hythe 35 49 N/A
Totton (Calmore) 24 32 7
Romsey 35 56 24
Chandler’s Ford 35 39 21
Eastleigh 40 48 16
Hedge End 50 39 28
Bursledon 40 39 28 Table 3-16 – Journey Times from suburban locations within the City Region to Southampton City Centre (Portland
Terrace for bus/Southampton Central for rail)75
From places such as Fawley, Romsey, Fair Oak, Botley and Hedge End, bus journey times to Southampton are long compared to travel by private car. An example of these unfavourable journey times for Fair Oak, and the opportunity to use TCF funding to address this, helping to support delivery of significant quantities of planned new housing more sustainably, is shown in the Case Study box.
75 Google Maps & National Rail Enquires, (analysis is from a Tuesday during school term time at 8AM)
58
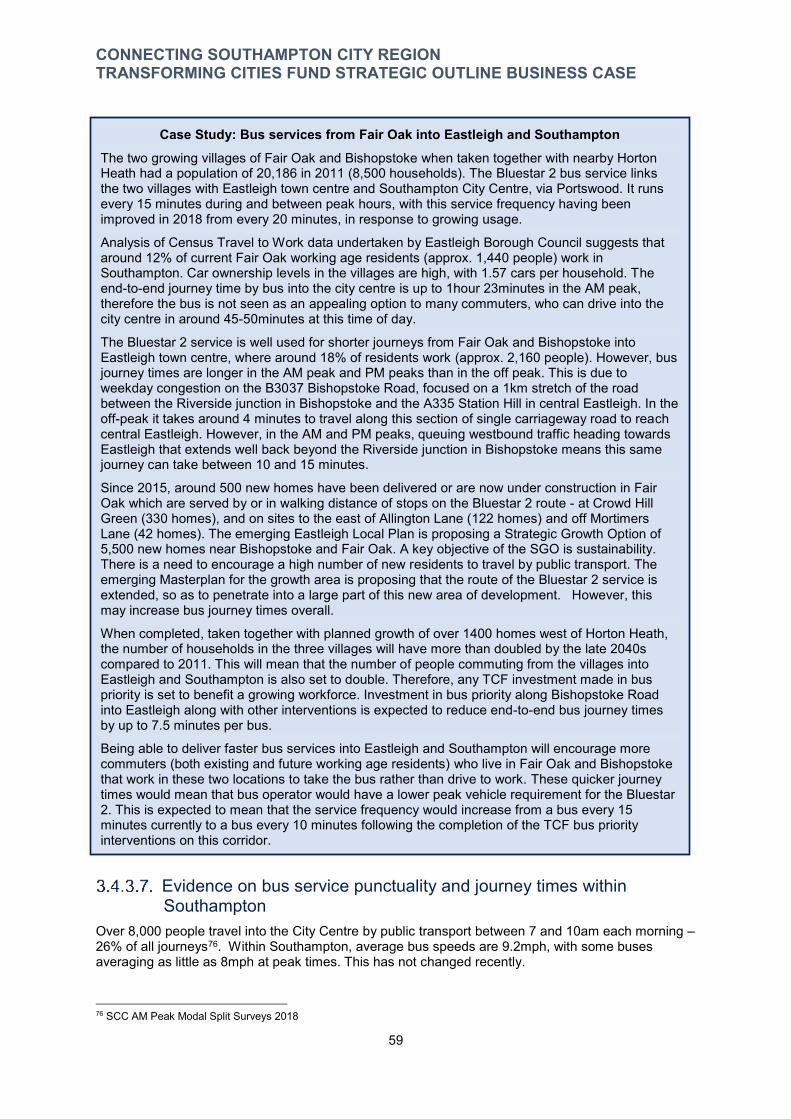
CONNECTING SOUTHAMPTON CITY REGION TRANSFORMING CITIES FUND STRATEGIC OUTLINE BUSINESS CASE
Case Study: Bus services from Fair Oak into Eastleigh and Southampton The two growing villages of Fair Oak and Bishopstoke when taken together with nearby Horton Heath had a population of 20,186 in 2011 (8,500 households). The Bluestar 2 bus service links the two villages with Eastleigh town centre and Southampton City Centre, via Portswood. It runs every 15 minutes during and between peak hours, with this service frequency having been improved in 2018 from every 20 minutes, in response to growing usage.
Analysis of Census Travel to Work data undertaken by Eastleigh Borough Council suggests that around 12% of current Fair Oak working age residents (approx. 1,440 people) work in Southampton. Car ownership levels in the villages are high, with 1.57 cars per household. The end-to-end journey time by bus into the city centre is up to 1hour 23minutes in the AM peak, therefore the bus is not seen as an appealing option to many commuters, who can drive into the city centre in around 45-50minutes at this time of day.
The Bluestar 2 service is well used for shorter journeys from Fair Oak and Bishopstoke into Eastleigh town centre, where around 18% of residents work (approx. 2,160 people). However, bus journey times are longer in the AM peak and PM peaks than in the off peak. This is due to weekday congestion on the B3037 Bishopstoke Road, focused on a 1km stretch of the road between the Riverside junction in Bishopstoke and the A335 Station Hill in central Eastleigh. In the off-peak it takes around 4 minutes to travel along this section of single carriageway road to reach central Eastleigh. However, in the AM and PM peaks, queuing westbound traffic heading towards Eastleigh that extends well back beyond the Riverside junction in Bishopstoke means this same journey can take between 10 and 15 minutes.
Since 2015, around 500 new homes have been delivered or are now under construction in Fair Oak which are served by or in walking distance of stops on the Bluestar 2 route - at Crowd Hill Green (330 homes), and on sites to the east of Allington Lane (122 homes) and off Mortimers Lane (42 homes). The emerging Eastleigh Local Plan is proposing a Strategic Growth Option of 5,500 new homes near Bishopstoke and Fair Oak. A key objective of the SGO is sustainability. There is a need to encourage a high number of new residents to travel by public transport. The emerging Masterplan for the growth area is proposing that the route of the Bluestar 2 service is extended, so as to penetrate into a large part of this new area of development. However, this may increase bus journey times overall.
When completed, taken together with planned growth of over 1400 homes west of Horton Heath, the number of households in the three villages will have more than doubled by the late 2040s compared to 2011. This will mean that the number of people commuting from the villages into Eastleigh and Southampton is also set to double. Therefore, any TCF investment made in bus priority is set to benefit a growing workforce. Investment in bus priority along Bishopstoke Road into Eastleigh along with other interventions is expected to reduce end-to-end bus journey times by up to 7.5 minutes per bus.
Being able to deliver faster bus services into Eastleigh and Southampton will encourage more commuters (both existing and future working age residents) who live in Fair Oak and Bishopstoke that work in these two locations to take the bus rather than drive to work. These quicker journey times would mean that bus operator would have a lower peak vehicle requirement for the Bluestar 2. This is expected to mean that the service frequency would increase from a bus every 15 minutes currently to a bus every 10 minutes following the completion of the TCF bus priority interventions on this corridor.
Evidence on bus service punctuality and journey times within Southampton
Over 8,000 people travel into the City Centre by public transport between 7 and 10am each morning – 26% of all journeys76. Within Southampton, average bus speeds are 9.2mph, with some buses averaging as little as 8mph at peak times. This has not changed recently.
76 SCC AM Peak Modal Split Surveys 2018
59
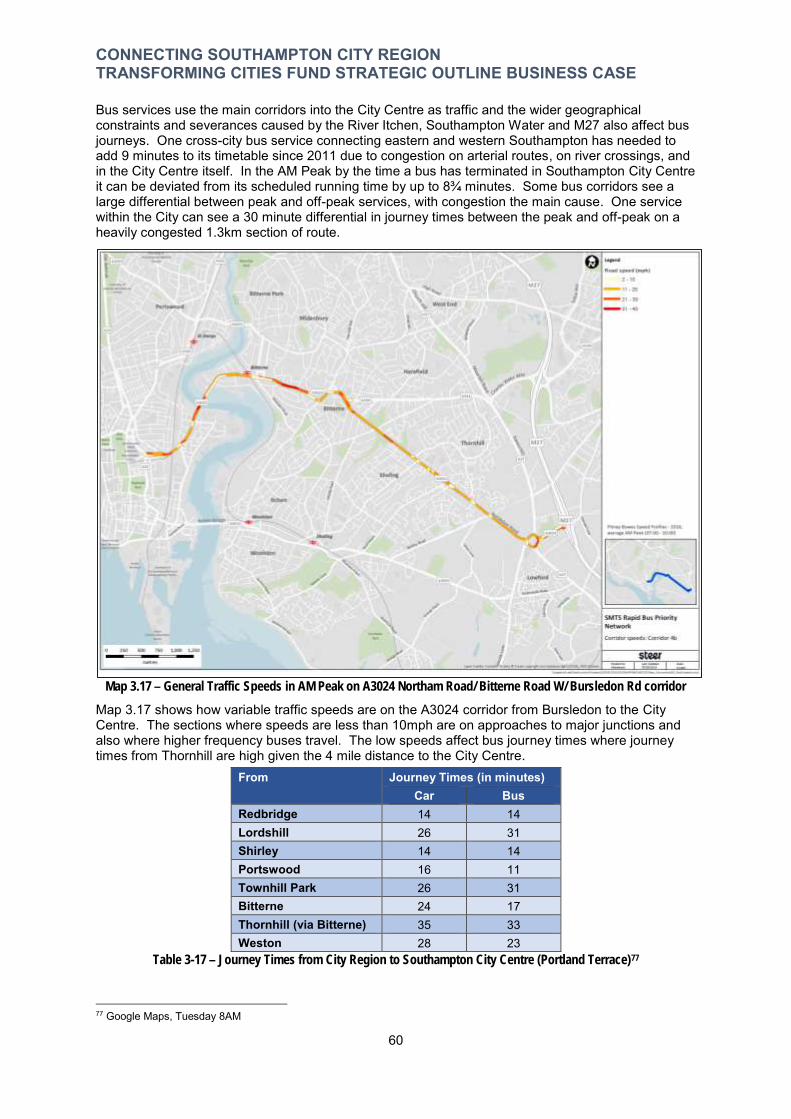
CONNECTING SOUTHAMPTON CITY REGION TRANSFORMING CITIES FUND STRATEGIC OUTLINE BUSINESS CASE
Bus services use the main corridors into the City Centre as traffic and the wider geographical constraints and severances caused by the River Itchen, Southampton Water and M27 also affect bus journeys. One cross-city bus service connecting eastern and western Southampton has needed to add 9 minutes to its timetable since 2011 due to congestion on arterial routes, on river crossings, and in the City Centre itself. In the AM Peak by the time a bus has terminated in Southampton City Centre it can be deviated from its scheduled running time by up to 8¾ minutes. Some bus corridors see a large differential between peak and off-peak services, with congestion the main cause. One service within the City can see a 30 minute differential in journey times between the peak and off-peak on a heavily congested 1.3km section of route.
Map 3.17 – General Traffic Speeds in AM Peak on A3024 Northam Road/ Bitterne Road W/ Bursledon Rd corridor
Map 3.17 shows how variable traffic speeds are on the A3024 corridor from Bursledon to the City Centre. The sections where speeds are less than 10mph are on approaches to major junctions and also where higher frequency buses travel. The low speeds affect bus journey times where journey times from Thornhill are high given the 4 mile distance to the City Centre.
From Journey Times (in minutes) Car Bus
Redbridge 14 14 Lordshill 26 31 Shirley 14 14 Portswood 16 11 Townhill Park 26 31 Bitterne 24 17 Thornhill (via Bitterne) 35 33 Weston 28 23
Table 3-17 – Journey Times from City Region to Southampton City Centre (Portland Terrace)77
77 Google Maps, Tuesday 8AM
60
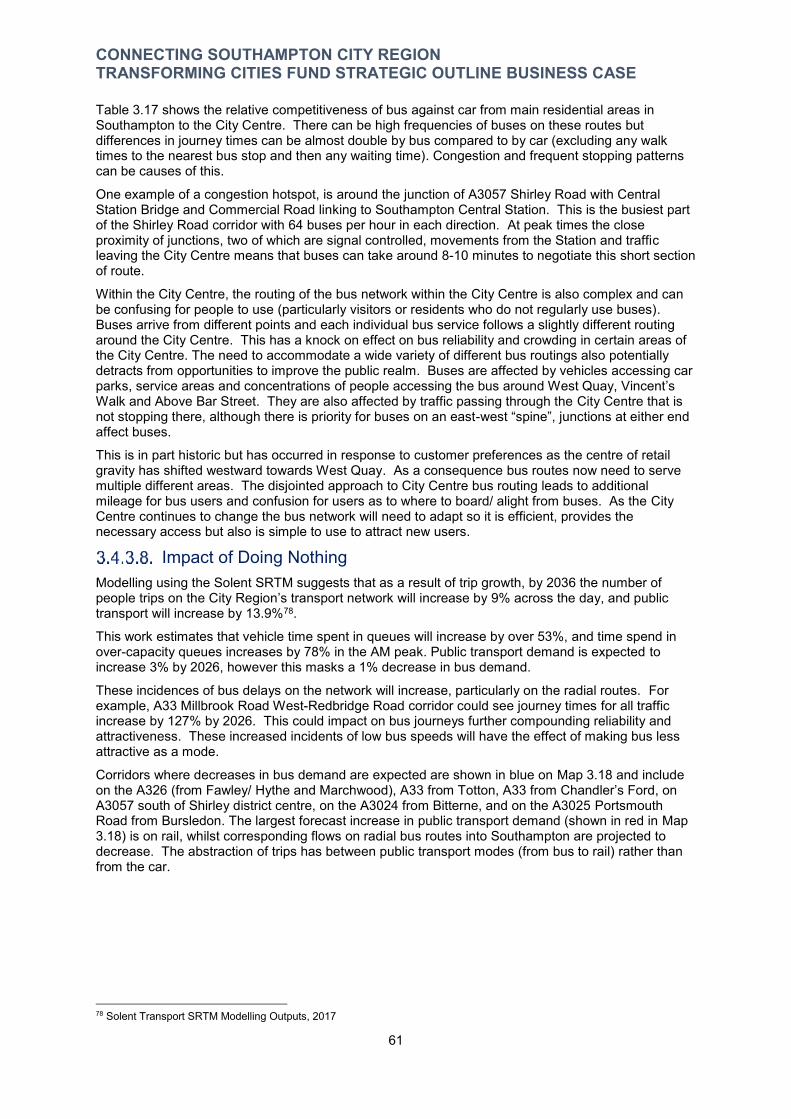
CONNECTING SOUTHAMPTON CITY REGION TRANSFORMING CITIES FUND STRATEGIC OUTLINE BUSINESS CASE
Table 3.17 shows the relative competitiveness of bus against car from main residential areas in Southampton to the City Centre. There can be high frequencies of buses on these routes but differences in journey times can be almost double by bus compared to by car (excluding any walk times to the nearest bus stop and then any waiting time). Congestion and frequent stopping patterns can be causes of this.
One example of a congestion hotspot, is around the junction of A3057 Shirley Road with Central Station Bridge and Commercial Road linking to Southampton Central Station. This is the busiest part of the Shirley Road corridor with 64 buses per hour in each direction. At peak times the close proximity of junctions, two of which are signal controlled, movements from the Station and traffic leaving the City Centre means that buses can take around 8-10 minutes to negotiate this short section of route.
Within the City Centre, the routing of the bus network within the City Centre is also complex and can be confusing for people to use (particularly visitors or residents who do not regularly use buses). Buses arrive from different points and each individual bus service follows a slightly different routing around the City Centre. This has a knock on effect on bus reliability and crowding in certain areas of the City Centre. The need to accommodate a wide variety of different bus routings also potentially detracts from opportunities to improve the public realm. Buses are affected by vehicles accessing car parks, service areas and concentrations of people accessing the bus around West Quay, Vincent’s Walk and Above Bar Street. They are also affected by traffic passing through the City Centre that is not stopping there, although there is priority for buses on an east-west “spine”, junctions at either end affect buses.
This is in part historic but has occurred in response to customer preferences as the centre of retail gravity has shifted westward towards West Quay. As a consequence bus routes now need to serve multiple different areas. The disjointed approach to City Centre bus routing leads to additional mileage for bus users and confusion for users as to where to board/ alight from buses. As the City Centre continues to change the bus network will need to adapt so it is efficient, provides the necessary access but also is simple to use to attract new users.
Impact of Doing Nothing Modelling using the Solent SRTM suggests that as a result of trip growth, by 2036 the number of people trips on the City Region’s transport network will increase by 9% across the day, and public transport will increase by 13.9%78.
This work estimates that vehicle time spent in queues will increase by over 53%, and time spend in over-capacity queues increases by 78% in the AM peak. Public transport demand is expected to increase 3% by 2026, however this masks a 1% decrease in bus demand.
These incidences of bus delays on the network will increase, particularly on the radial routes. For example, A33 Millbrook Road West-Redbridge Road corridor could see journey times for all traffic increase by 127% by 2026. This could impact on bus journeys further compounding reliability and attractiveness. These increased incidents of low bus speeds will have the effect of making bus less attractive as a mode.
Corridors where decreases in bus demand are expected are shown in blue on Map 3.18 and include on the A326 (from Fawley/ Hythe and Marchwood), A33 from Totton, A33 from Chandler’s Ford, on A3057 south of Shirley district centre, on the A3024 from Bitterne, and on the A3025 Portsmouth Road from Bursledon. The largest forecast increase in public transport demand (shown in red in Map 3.18) is on rail, whilst corresponding flows on radial bus routes into Southampton are projected to decrease. The abstraction of trips has between public transport modes (from bus to rail) rather than from the car.
78 Solent Transport SRTM Modelling Outputs, 2017
61
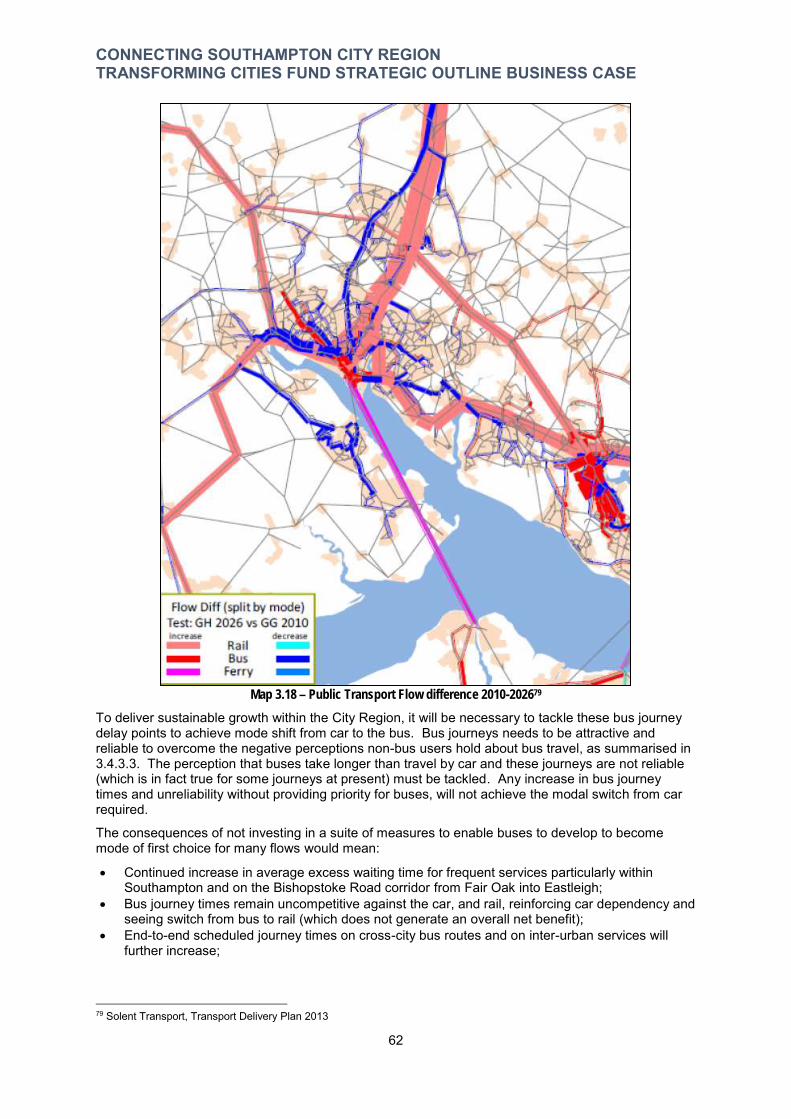
CONNECTING SOUTHAMPTON CITY REGION TRANSFORMING CITIES FUND STRATEGIC OUTLINE BUSINESS CASE
Map 3.18 – Public Transport Flow difference 2010-202679
To deliver sustainable growth within the City Region, it will be necessary to tackle these bus journey delay points to achieve mode shift from car to the bus. Bus journeys needs to be attractive and reliable to overcome the negative perceptions non-bus users hold about bus travel, as summarised in 3.4.3.3. The perception that buses take longer than travel by car and these journeys are not reliable (which is in fact true for some journeys at present) must be tackled. Any increase in bus journey times and unreliability without providing priority for buses, will not achieve the modal switch from car required.
The consequences of not investing in a suite of measures to enable buses to develop to become mode of first choice for many flows would mean:
Continued increase in average excess waiting time for frequent services particularly within Southampton and on the Bishopstoke Road corridor from Fair Oak into Eastleigh;
Bus journey times remain uncompetitive against the car, and rail, reinforcing car dependency and seeing switch from bus to rail (which does not generate an overall net benefit);
End-to-end scheduled journey times on cross-city bus routes and on inter-urban services will further increase;
79 Solent Transport, Transport Delivery Plan 2013
62
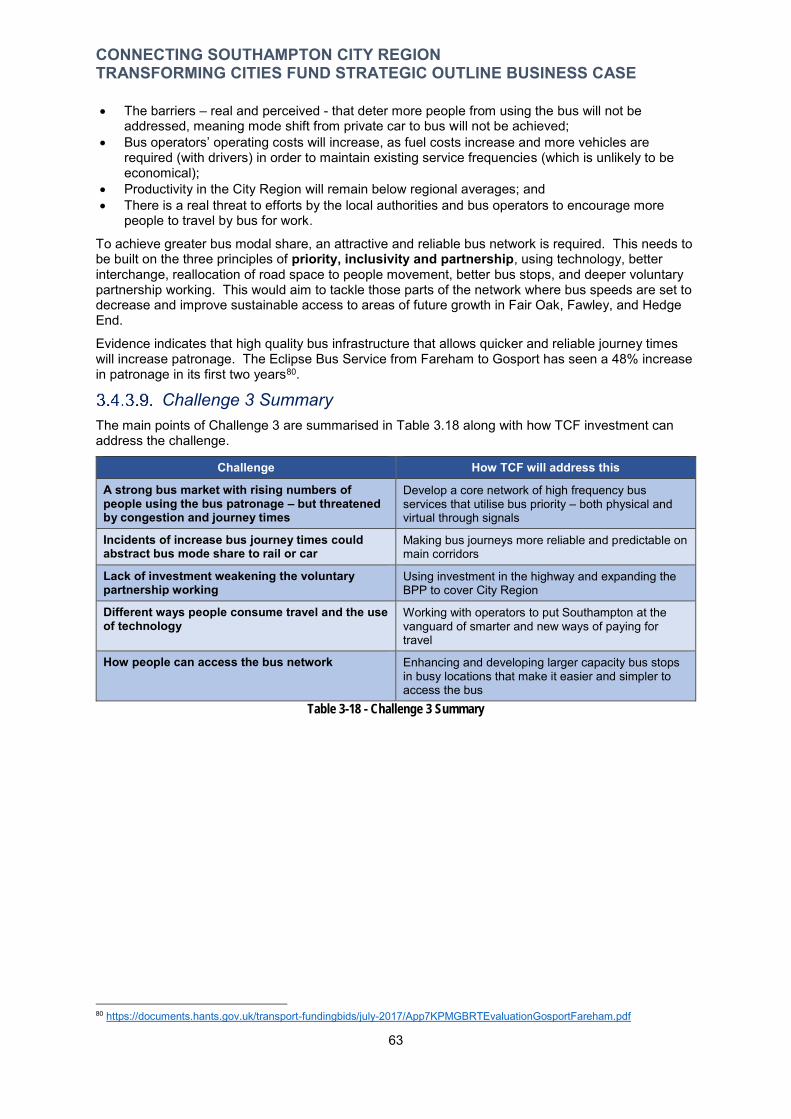
CONNECTING SOUTHAMPTON CITY REGION TRANSFORMING CITIES FUND STRATEGIC OUTLINE BUSINESS CASE
The barriers – real and perceived - that deter more people from using the bus will not be addressed, meaning mode shift from private car to bus will not be achieved;
Bus operators’ operating costs will increase, as fuel costs increase and more vehicles are required (with drivers) in order to maintain existing service frequencies (which is unlikely to be economical);
Productivity in the City Region will remain below regional averages; and There is a real threat to efforts by the local authorities and bus operators to encourage more
people to travel by bus for work.
To achieve greater bus modal share, an attractive and reliable bus network is required. This needs to be built on the three principles of priority, inclusivity and partnership, using technology, better interchange, reallocation of road space to people movement, better bus stops, and deeper voluntary partnership working. This would aim to tackle those parts of the network where bus speeds are set to decrease and improve sustainable access to areas of future growth in Fair Oak, Fawley, and Hedge End.
Evidence indicates that high quality bus infrastructure that allows quicker and reliable journey times will increase patronage. The Eclipse Bus Service from Fareham to Gosport has seen a 48% increase in patronage in its first two years80.
Challenge 3 Summary The main points of Challenge 3 are summarised in Table 3.18 along with how TCF investment can address the challenge.
Challenge How TCF will address this
A strong bus market with rising numbers of Develop a core network of high frequency bus people using the bus patronage – but threatened services that utilise bus priority – both physical and by congestion and journey times virtual through signals
Incidents of increase bus journey times could abstract bus mode share to rail or car
Making bus journeys more reliable and predictable on main corridors
Lack of investment weakening the voluntary partnership working
Using investment in the highway and expanding the BPP to cover City Region
Different ways people consume travel and the use of technology
Working with operators to put Southampton at the vanguard of smarter and new ways of paying for travel
How people can access the bus network Enhancing and developing larger capacity bus stops in busy locations that make it easier and simpler to access the bus
Table 3-18 - Challenge 3 Summary
80 https://documents.hants.gov.uk/transport-fundingbids/july-2017/App7KPMGBRTEvaluationGosportFareham.pdf
63

CONNECTING SOUTHAMPTON CITY REGION TRANSFORMING CITIES FUND STRATEGIC OUTLINE BUSINESS CASE
3.4.4. Challenge 4: Addressing Rising Inequalities The City Region faces a number of inequalities within in and nationally, and these inequalities are rising; Air quality and health are major issues affecting the quality of life for residents; There is a need to respond to an changing demographic who have different transport demands; and Transport investment needs to tackle these in a way that is inclusive and supports productivity.
Challenge 4 will be explained across four sections:
Section 3.4.4.1 illustrates the differentials in the City Region for car ownership and deprivation can affect access to employment opportunities and productivity;
Section 3.4.4.2 summarises the extent to which demographic changes and health will be a challenge for the City Region;
Section 3.4.4.3 summarises and assesses the scale of problems relating to levels of physical activity and poor air quality; and
Section 3.4.4.4 sets out what might happen if a ‘do nothing’/business as usual approach was adopted.
Households without access to a car Across the City Region there are 1.24 cars per households, but this masks variances in different locations. In Southampton there are 1.02 cars per household whereas in Test Valley it is 1.69. This is reflected in the number of households without access to a car or van – in Southampton it is 29.5% of households are without access to a car/van.
Within Eastleigh and New Forest only 13% and 7.4% of households in Test Valley of households do not have access to a car, although those residents currently have less access to public transport, narrowing access to employment opportunities.
Map 3.19 shows the variation across the City Region in car ownership by MSOAs. Areas of low car ownership are mainly around the City Centre but there are areas in western Southampton and towards the eastern edges.
Lower levels of car ownership in the City Centre may be seen as a sign of economic success—for example younger demographic living in centrally located apartments, working as professionals in offices nearby. In the Southampton City Region, because of the dispersed locations of high value employment and the higher availability of more modern high quality office space within peripherally located business parks near the motorway network, this may add to the productivity gap.
People living in low-car ownership areas are more reliant on public transport or taxis – in Redbridge 12% of people use the bus to get to work. These areas of low car ownership have a much higher than average likelihood of using the bus, and lower socio-economic groups spend a higher proportion of their income on taxis and minibuses81. There is a need for targeted investment to improve the quality and reliability of public transport, and active travel connections from these areas to employment areas, health care and education.
The variation also highlights the link between the car dependent development outside the city, cross-boundary movements and wage differences.
81 Department for Transport (2010), National Travel Survey Table NTS0705:Travel by household income quintile and main mode/mode: Great Britain, 2009
64
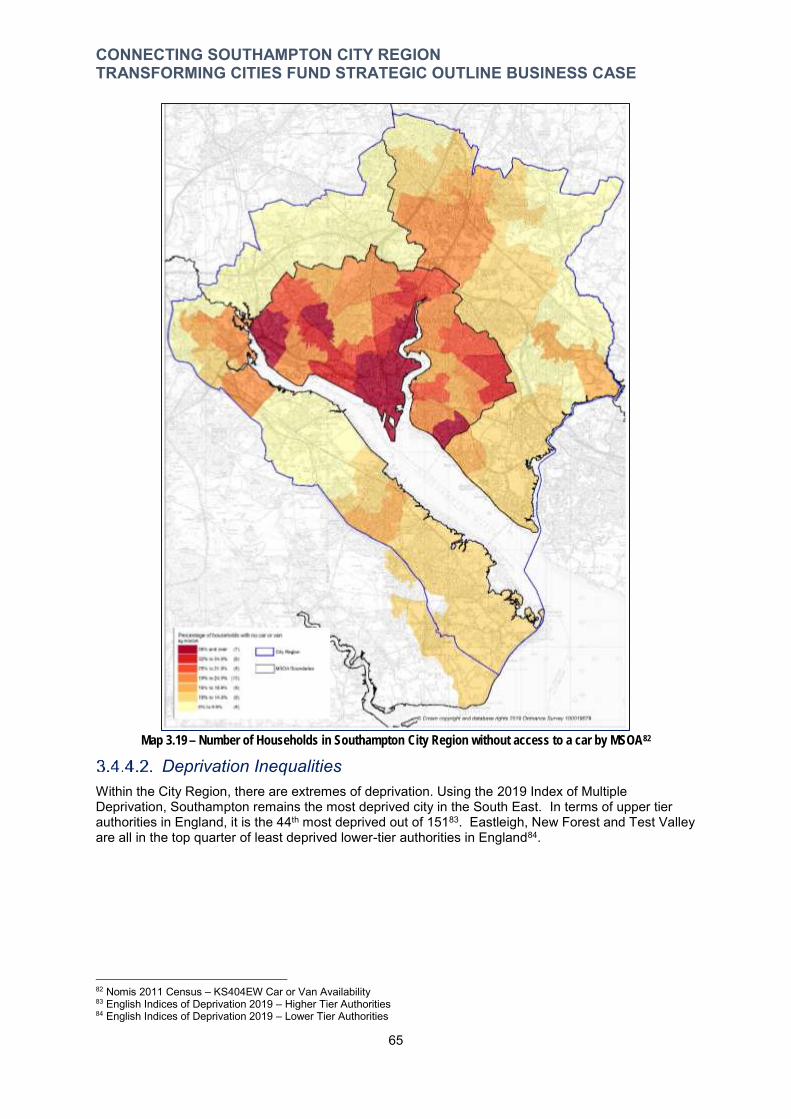
CONNECTING SOUTHAMPTON CITY REGION TRANSFORMING CITIES FUND STRATEGIC OUTLINE BUSINESS CASE
Map 3.19 – Number of Households in Southampton City Region without access to a car by MSOA82
Deprivation Inequalities Within the City Region, there are extremes of deprivation. Using the 2019 Index of Multiple Deprivation, Southampton remains the most deprived city in the South East. In terms of upper tier authorities in England, it is the 44th most deprived out of 15183. Eastleigh, New Forest and Test Valley are all in the top quarter of least deprived lower-tier authorities in England84.
82 Nomis 2011 Census – KS404EW Car or Van Availability 83 English Indices of Deprivation 2019 – Higher Tier Authorities 84 English Indices of Deprivation 2019 – Lower Tier Authorities
65
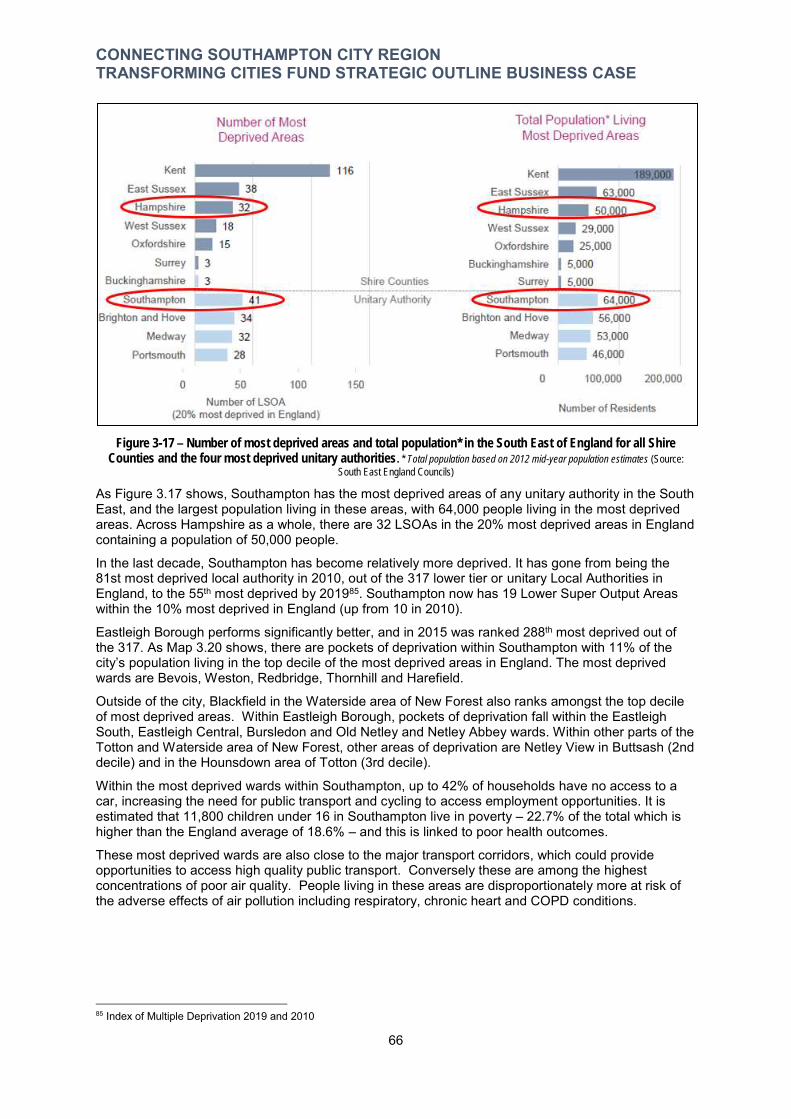
CONNECTING SOUTHAMPTON CITY REGION TRANSFORMING CITIES FUND STRATEGIC OUTLINE BUSINESS CASE
Figure 3-17 – Number of most deprived areas and total population* in the South East of England for all Shire Counties and the four most deprived unitary authorities. * Total population based on 2012 mid-year population estimates (Source:
South East England Councils)
As Figure 3.17 shows, Southampton has the most deprived areas of any unitary authority in the South East, and the largest population living in these areas, with 64,000 people living in the most deprived areas. Across Hampshire as a whole, there are 32 LSOAs in the 20% most deprived areas in England containing a population of 50,000 people.
In the last decade, Southampton has become relatively more deprived. It has gone from being the 81st most deprived local authority in 2010, out of the 317 lower tier or unitary Local Authorities in England, to the 55th most deprived by 201985. Southampton now has 19 Lower Super Output Areas within the 10% most deprived in England (up from 10 in 2010).
Eastleigh Borough performs significantly better, and in 2015 was ranked 288th most deprived out of the 317. As Map 3.20 shows, there are pockets of deprivation within Southampton with 11% of the city’s population living in the top decile of the most deprived areas in England. The most deprived wards are Bevois, Weston, Redbridge, Thornhill and Harefield.
Outside of the city, Blackfield in the Waterside area of New Forest also ranks amongst the top decile of most deprived areas. Within Eastleigh Borough, pockets of deprivation fall within the Eastleigh South, Eastleigh Central, Bursledon and Old Netley and Netley Abbey wards. Within other parts of the Totton and Waterside area of New Forest, other areas of deprivation are Netley View in Buttsash (2nd decile) and in the Hounsdown area of Totton (3rd decile).
Within the most deprived wards within Southampton, up to 42% of households have no access to a car, increasing the need for public transport and cycling to access employment opportunities. It is estimated that 11,800 children under 16 in Southampton live in poverty – 22.7% of the total which is higher than the England average of 18.6% – and this is linked to poor health outcomes.
These most deprived wards are also close to the major transport corridors, which could provide opportunities to access high quality public transport. Conversely these are among the highest concentrations of poor air quality. People living in these areas are disproportionately more at risk of the adverse effects of air pollution including respiratory, chronic heart and COPD conditions.
85 Index of Multiple Deprivation 2019 and 2010
66

CONNECTING SOUTHAMPTON CITY REGION TRANSFORMING CITIES FUND STRATEGIC OUTLINE BUSINESS CASE
Map 3.20 – Southampton City Region Index of Multiple Deprivation (2019) score by LSOA
Changing Demographics The forecast changes to the demographics of the City Region over the next twenty years are expected to affect different parts of the area in different ways. In 2014, 13% of the population of
67

CONNECTING SOUTHAMPTON CITY REGION TRANSFORMING CITIES FUND STRATEGIC OUTLINE BUSINESS CASE
Southampton was aged 65 or over and 2% of the population was aged 75 or over. Forecasts suggest that by 2037, these figures will increase to 18% and 9.3% respectively.
Eastleigh Borough has a higher proportion of older people compared to Southampton with 18% of the population aged 65 or over and 2.4% of the population was aged 75 or over. Forecasts suggest that by 2037, these figures will increase to 26% and 14% respectively.
This increase in the proportion of older people, in particular of those aged over 75, will have implications for travel patterns within the City Region. These residents are less likely to be making journeys during the AM and PM peak but may raise demand at other times. The older a person gets, the fewer trips per person per year they make – with a person aged 65 making around 1,000 trips per year, reducing to 600-700 trips a year by 8086. From age 60, shopping trips increase and account for around a third of trips for older age groups. Trips for meeting friends, leisure, entertainment or accessing healthcare are also important for older age groups, and most take place during the inter-peak.
Those aged over 75 are more likely to have conditions that will restrict their level of physical mobility. Apart from short trips, active travel modes of walking and cycling are less likely to be suitable for the entirety of a trip. Access to e-mobility can help older people to cycle and breakdown some of the accessibility barriers. Owning personal e-mobility may be difficult, but if there are options for access to shared e-mobility this widens the opportunity and distance range. Changes to the street environment to improve perceptions about safety also enables older people to stay active.
Bus services are likely to play an increasingly important role in supporting the quality of life of older people. Measures may be needed that help make it easier and safer for older people to reach their nearest bus corridor. The bus will need to be as inclusive as possible – a vehicle that is easy to use, clean, safe, and with clear announcements. Routes to the bus stops need to be safe and need to ensure that advances in ticketing and payment technology doesn’t leave older people behind. Technology has a role to play in guiding people to a stop by making sense of the environment and provide inclusivity.
We can expect increased levels of demand for travel by bus to access town centres, local services, or health facilities (hospitals and GP surgeries). Additionally, there will be more trips made by a larger number of people working in the social care sector which are likely to be largely in the inter-peak period.
Health Inequalities Health inequalities and healthy life expectancy are major challenges in Southampton City Region. In some wards, there are relatively high percentages of residents that have a long-term health problem or disability which limits their day to day activities a lot. A number of these wards are also areas of higher deprivation. These health problems are in part linked to air pollution but also to inactivity.
Over the past decade there has been an increase in life expectancy for both male and females, in keeping with national trends. However, men living in the least deprived areas of the city live 5.6 years longer than in the most deprived; for women the difference is 5.3 years. When comparing those living in the most deprived areas of the City Region to the least deprived, life expectancy is almost 6 years difference for men and 5.4 for women. Although people are living longer, increases in healthy life expectancy are not keeping pace with gains in overall life expectancy.
This can be seen with the difference between areas of deprivation for long-term illnesses, with the worst areas having over double the population with these conditions.
Currently, 6,050 people within Southampton are claiming health related employment benefits (ESA and Incapacity Benefit) – 3.5% of the working population.
Over the period 2011/12-2013/14, 22.8% of Year 6 children in the most deprived areas of Southampton were classified as obese, compared to only 14.9% of Year 6 children from the least deprived areas; a gap of 7.9%87. This inequality gap has remained constant throughout the period, with no evidence of any narrowing.
86 National Travel Survey 2018, DfT 87 Public Health Southampton report - Health Inequalities in Southampton November 2014
68
CONNECTING SOUTHAMPTON CITY REGION TRANSFORMING CITIES FUND STRATEGIC OUTLINE BUSINESS CASE
Levels of Physical Activity People living in the City Region have increasingly sedentary lifestyles and have low levels of physical activity. This is a serious public health challenge - in 2018 64.2% of Southampton residents and 62.3% of Eastleigh residents were classified as having excess weight88. 22% of Southampton’s adults are considered physically inactive by failing to meet recommended weekly amounts of exercise – the 12th highest level in the south east89. The levels of physical activity vary by employment status-nationally those unemployed are almost half as likely to be inactive.
Adults in Southampton are more likely to walk for travel three times a week compared to cycle – 19% against 4.3% and are a higher percentage than those in Eastleigh where 4.3% of adults cycle90.
The Southampton City Region is participating in the Sustrans Bike Life cycling research project. Survey work for this was undertaken in spring 2019 with residents asked for their views on cycling. 75% of those surveyed in the City Region would either like to start cycling or to cycle more than they currently do. 78% of residents would find it useful to cycle more often or to start cycling using protected segregated cycle tracks91.
Air Quality issues Southampton is the eighth most polluted UK city with high concentrations of air pollution, particularly for Nitrogen Dioxide (NO²/NOx) and Particulate Matter (both 2.5 and 10). Southampton and part of the New Forest were identified by DEFRA in 2015 as one of the first tranche of cities unlikely to achieve NOx limit values by 2020. DEFRA had directed both authorities to make Clean Air Plans to achieve compliance within the quickest time possible.
Investment has started in making the bus fleet low-emission with new vehicles or retro-fitting engines, investing in cycle infrastructure on SCN1 and SCN5, developing a Clean Air Network, macro-consolidation, and incentivise electric vehicle uptake (parking charges, reduce Itchen Bridge tolls). The EV charging network is being rolled out in car parks but will expand to on and off-street charging local areas to help increase EV take up.
In Southampton, exposure to particulate matter contributes to an estimated 110 early deaths a year – or 5.6% of all deaths, compared to the national average of 5.3%. As Figure 3.18 shows, road transport is identified as a major contributor to poor air quality, with emissions from road transport at hotspots such as M271 Redbridge Roundabout accounting for 76% of all emissions92.
There are fifteen Air Quality Management Areas (AQMAs) across the City Region shown in Map 3.21, ten within Southampton, one within New Forest District, and four within Eastleigh Borough. There is scope to improve air quality in these areas, through the delivery of TCF schemes, and additional investment in green technology, active travel and low carbon transport. Reduced emissions will help reduce the incidence of respiratory disease. This will support the clean sustainable growth and improved productivity required in the City Region.
However, while air quality within the city is improving there is a threat to long-term air quality from the additional 159,000 trips. Technical assessments carried out by Southampton City Council forecast that by 2020 NOx levels will have been reduced by 24% in the most polluted areas. This will deliver compliance with the EU limit for NOx. This forecasting work takes into account continued investment in new low emission buses, electric taxis, supporting greater EV take up, and ship-to-shore power equipment at the Port (allowing ships to run on electrical energy, instead of leaving their engines running while docked).
However, if there is not further investment in clean public transport and active travel the decreases could be reversed. To support public transport journeys and reliability smart technology in traffic signals and using live data can help hotspot junctions to operate more efficiently reducing queuing and emissions. This can also be used to provide journey time information for all modes and manage the network more efficiently.
88 PHE Data – Percentage of adults classified as overweight or obese, 2017/18 89 PHE Physical Activity Data – Percentage of physically active and inactive adults, 2019 90 PHE Physical Activity Data – Percentage of adults walking or cycling for travel, 2019 91 Southampton City Region BikeLife Report, Draft, 2019 92 Southampton Clean Air Strategy 2016
69
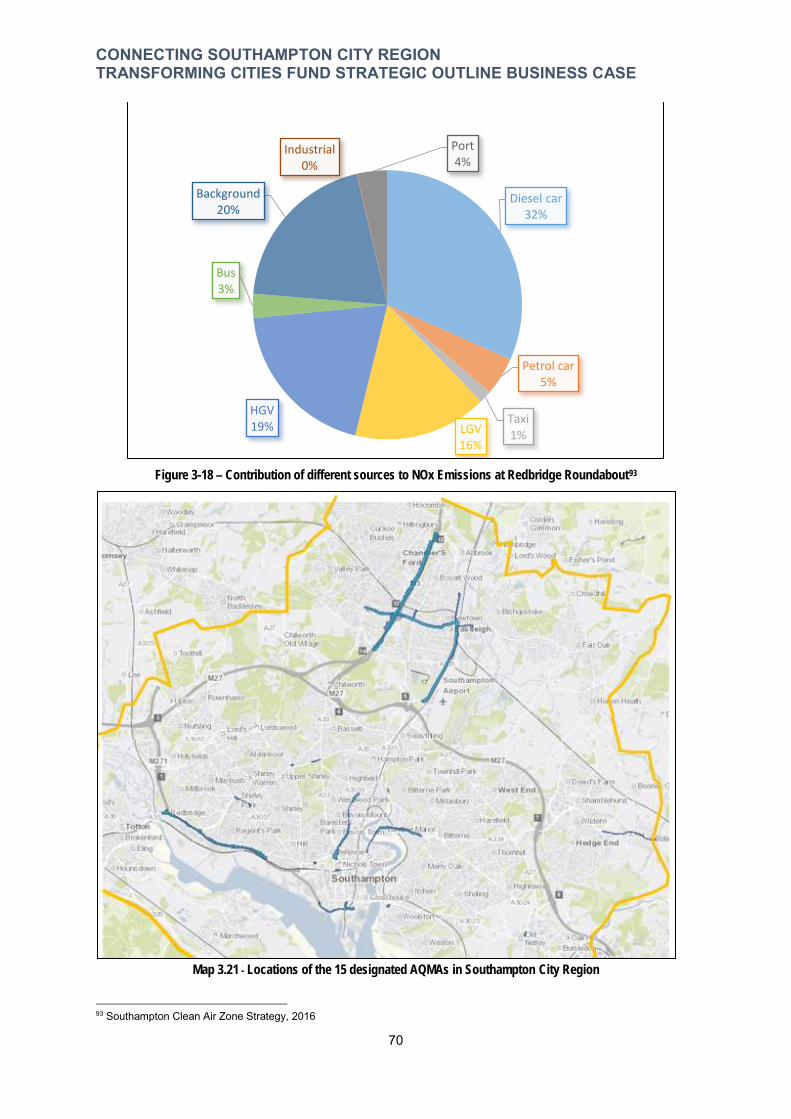
CONNECTING SOUTHAMPTON CITY REGION TRANSFORMING CITIES FUND STRATEGIC OUTLINE BUSINESS CASE
Diesel car 32%
Petrol car 5%
Taxi 1%LGV
16%
HGV 19%
Bus 3%
Background 20%
Industrial 0%
Port 4%
Figure 3-18 – Contribution of different sources to NOx Emissions at Redbridge Roundabout93
Map 3.21 - Locations of the 15 designated AQMAs in Southampton City Region
93 Southampton Clean Air Zone Strategy, 2016
70
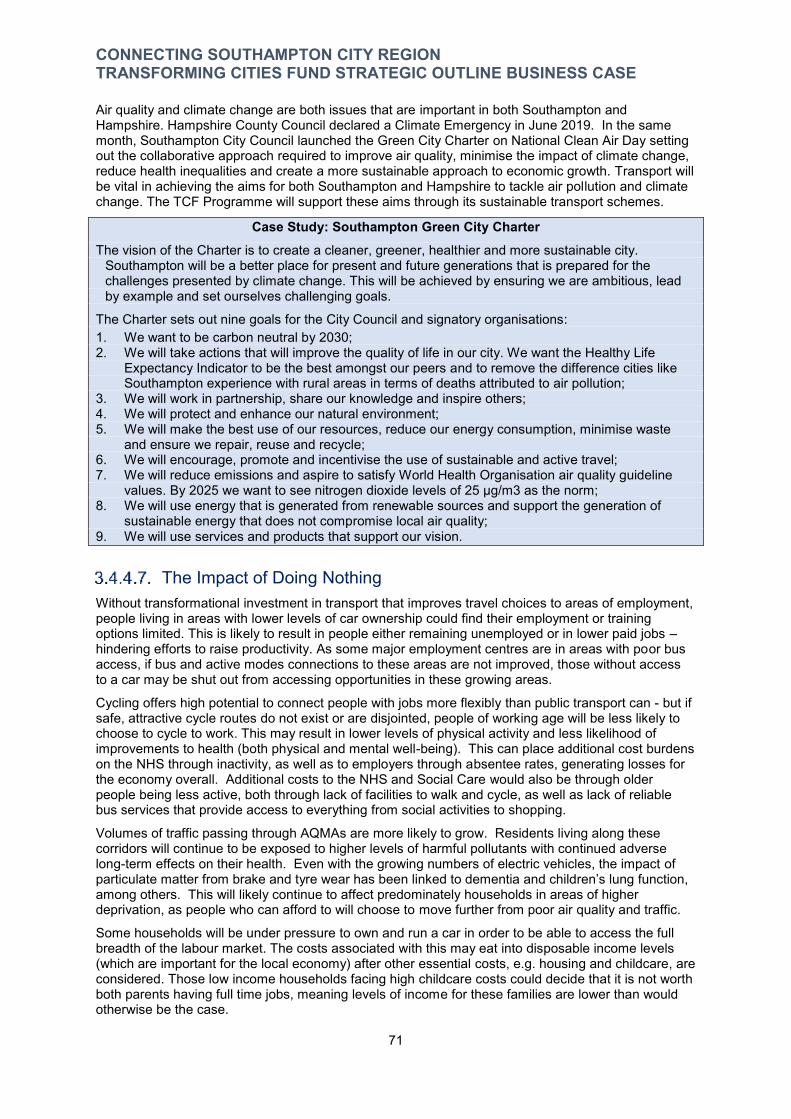
CONNECTING SOUTHAMPTON CITY REGION TRANSFORMING CITIES FUND STRATEGIC OUTLINE BUSINESS CASE
Air quality and climate change are both issues that are important in both Southampton and Hampshire. Hampshire County Council declared a Climate Emergency in June 2019. In the same month, Southampton City Council launched the Green City Charter on National Clean Air Day setting out the collaborative approach required to improve air quality, minimise the impact of climate change, reduce health inequalities and create a more sustainable approach to economic growth. Transport will be vital in achieving the aims for both Southampton and Hampshire to tackle air pollution and climate change. The TCF Programme will support these aims through its sustainable transport schemes.
Case Study: Southampton Green City Charter The vision of the Charter is to create a cleaner, greener, healthier and more sustainable city.
Southampton will be a better place for present and future generations that is prepared for the challenges presented by climate change. This will be achieved by ensuring we are ambitious, lead by example and set ourselves challenging goals.
The Charter sets out nine goals for the City Council and signatory organisations: 1. We want to be carbon neutral by 2030; 2. We will take actions that will improve the quality of life in our city. We want the Healthy Life
Expectancy Indicator to be the best amongst our peers and to remove the difference cities like Southampton experience with rural areas in terms of deaths attributed to air pollution;
3. We will work in partnership, share our knowledge and inspire others; 4. We will protect and enhance our natural environment; 5. We will make the best use of our resources, reduce our energy consumption, minimise waste
and ensure we repair, reuse and recycle; 6. We will encourage, promote and incentivise the use of sustainable and active travel; 7. We will reduce emissions and aspire to satisfy World Health Organisation air quality guideline
values. By 2025 we want to see nitrogen dioxide levels of 25 μg/m3 as the norm; 8. We will use energy that is generated from renewable sources and support the generation of
sustainable energy that does not compromise local air quality; 9. We will use services and products that support our vision.
The Impact of Doing Nothing Without transformational investment in transport that improves travel choices to areas of employment, people living in areas with lower levels of car ownership could find their employment or training options limited. This is likely to result in people either remaining unemployed or in lower paid jobs – hindering efforts to raise productivity. As some major employment centres are in areas with poor bus access, if bus and active modes connections to these areas are not improved, those without access to a car may be shut out from accessing opportunities in these growing areas.
Cycling offers high potential to connect people with jobs more flexibly than public transport can - but if safe, attractive cycle routes do not exist or are disjointed, people of working age will be less likely to choose to cycle to work. This may result in lower levels of physical activity and less likelihood of improvements to health (both physical and mental well-being). This can place additional cost burdens on the NHS through inactivity, as well as to employers through absentee rates, generating losses for the economy overall. Additional costs to the NHS and Social Care would also be through older people being less active, both through lack of facilities to walk and cycle, as well as lack of reliable bus services that provide access to everything from social activities to shopping.
Volumes of traffic passing through AQMAs are more likely to grow. Residents living along these corridors will continue to be exposed to higher levels of harmful pollutants with continued adverse long-term effects on their health. Even with the growing numbers of electric vehicles, the impact of particulate matter from brake and tyre wear has been linked to dementia and children’s lung function, among others. This will likely continue to affect predominately households in areas of higher deprivation, as people who can afford to will choose to move further from poor air quality and traffic.
Some households will be under pressure to own and run a car in order to be able to access the full breadth of the labour market. The costs associated with this may eat into disposable income levels (which are important for the local economy) after other essential costs, e.g. housing and childcare, are considered. Those low income households facing high childcare costs could decide that it is not worth both parents having full time jobs, meaning levels of income for these families are lower than would otherwise be the case.
71
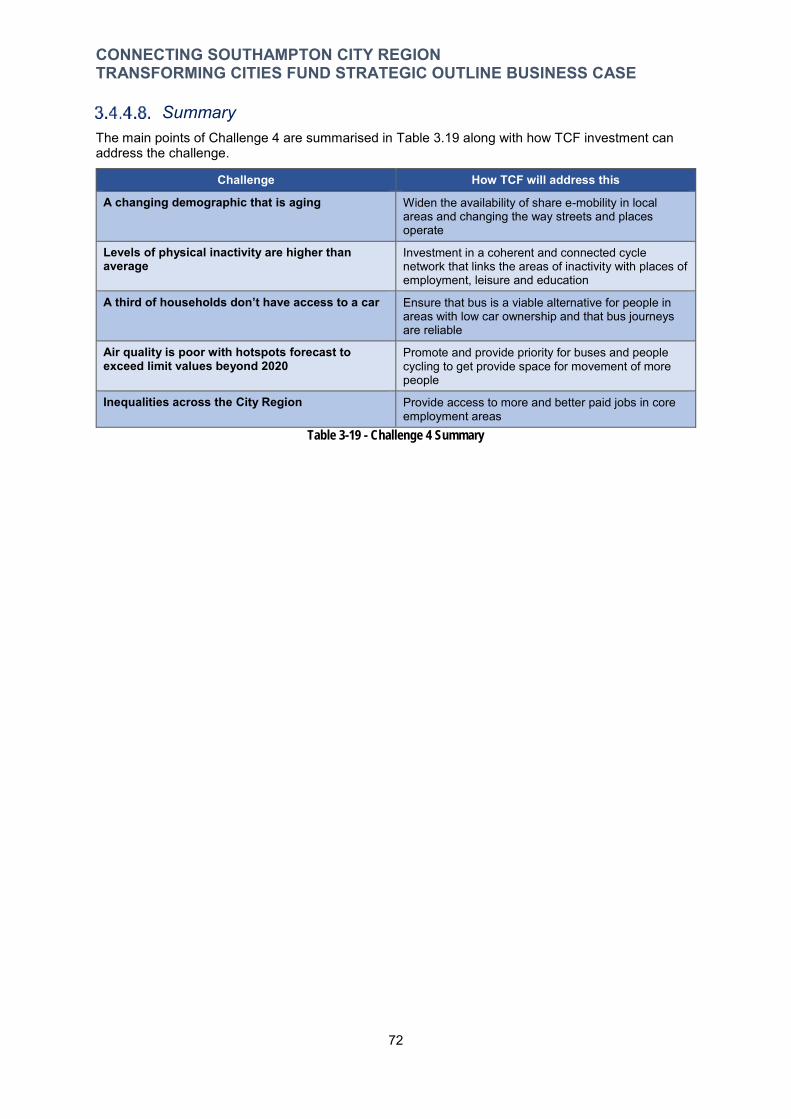
CONNECTING SOUTHAMPTON CITY REGION TRANSFORMING CITIES FUND STRATEGIC OUTLINE BUSINESS CASE
Summary The main points of Challenge 4 are summarised in Table 3.19 along with how TCF investment can address the challenge.
Challenge How TCF will address this
A changing demographic that is aging Widen the availability of share e-mobility in local areas and changing the way streets and places operate
Levels of physical inactivity are higher than Investment in a coherent and connected cycle average network that links the areas of inactivity with places of
employment, leisure and education
A third of households don’t have access to a car Ensure that bus is a viable alternative for people in areas with low car ownership and that bus journeys are reliable
Air quality is poor with hotspots forecast to exceed limit values beyond 2020
Promote and provide priority for buses and people cycling to get provide space for movement of more people
Inequalities across the City Region Provide access to more and better paid jobs in core employment areas
Table 3-19 - Challenge 4 Summary
72
CONNECTING SOUTHAMPTON CITY REGION TRANSFORMING CITIES FUND STRATEGIC OUTLINE BUSINESS CASE
3.5. The Opportunity – A Well Connected City Region Having an efficient and well-functioning modern transport network that provides reliable and effective connections for people and businesses is critical for creating an environment for boosting productivity, reducing emissions, and improving people’s quality of life.
Doing nothing is not an option. There is not enough current capacity on the transport networks to accommodate growth. Congestion if unchecked will constrain productivity. Without modal shift emissions and physical inactivity will persist. The aspirations for realising the potential of the City Region will not occur. And we would fail to address the very real need to take steps to reduce carbon emissions from transport as part of efforts to limit the impacts of climate change.
If we do nothing, the problems of congestion will worsen, our buses will be slower and more unreliable, and connectivity across the City Region will not improve. While some people will respond to this by travelling at another time, which will mean that congestion spreads into other times of the day. Some will respond by changing their travel patterns, but ultimately though, some people will not travel at all. Crucially, the additional costs and longer journey times will dampen economic growth and keep emissions high.
To prevent this and help the City Region flourish, investment is needed to transform the efficiency and capacity of the transport system. The solutions will need to be centred around a clear need to improve public transport journey times and reliability and expand its reach beyond its’ core base of users.
To connect the new growth with the employment hubs sustainably;
To have a safe and coherent network of cycle routes that make it easy for people to make active travel choices;
To manage the network smartly and increase the availability of clean mobility options so those without a car can make best use of opportunities; and
To continue to make the City Centre work and operate as the fulcrum of the transport network so it can continue to grow as the heart of the City Region’s economy.
The scenarios of interventions set out in the Southampton City Region TCF Programme have been carefully planned and designed to address the identified challenges and achieve transformational outcomes. These interventions will increase the levels of public transport usage on radial routes into the City Centre, increase numbers of people cycling for a range of purposes including to work, and will support SCC’s plans to create a greener city and tackle climate change.
The Southampton City Region TCF Programme that this business cases proposes a City Region that:
Building on established and successful partnerships and aims to continue to raise the number of people using public transport to help accommodate the growth in travel demand more sustainably
Reducing public transport journey times, improve punctuality and reliability, and provide people with a more effective commute;
Transforming cycle connections around the City Region through dedicated high quality infrastructure that addresses current barriers – both perceived and actual - to use this clean, healthy mode;
Actions that support creation of a cleaner and greener city that meets and exceeds minimum standards for air quality and is moving towards widespread adoption of zero-emission road transport;
Delivering a wider choice of local mobility and travel options for people who do not have easy access to a car;
Measures to enable a simple, safe and easy walk or cycle from people’s front door to the main bus and cycle routes;
A network that is managed using smart and innovative technology; and A City Centre with transformed public spaces and places, and where it is easy and efficient to
interchange between different modes at gateways to the City Region.
73
CONNECTING SOUTHAMPTON CITY REGION TRANSFORMING CITIES FUND STRATEGIC OUTLINE BUSINESS CASE
This range of solutions will vary from corridor to corridor and area to area. The TCF Programme will need to address the following aspirations:
Supporting economic growth by unlocking the transport constraints in key growth areas and across the City Region;
Aligning with the Connected Southampton (Southampton LTP4) Transport Strategy, the Hampshire LTP, Southampton Cycling, Public Transport and Parking Plans, and Waterside and Eastleigh Transport Strategies, as well as the national and Solent economic and planning growth strategies including the emerging Solent Local Industrial Strategy and PfSH Spatial Statement;
Reducing inequalities and improve health outcomes especially air quality and physical activity by providing facilities and infrastructure supporting clean mobility and more cycling; and
Complementing the existing transport infrastructure schemes being delivered through Highways England RIS1, DfT Access Fund, NPIF and Clean Air Zone Early Measures funding streams.
74
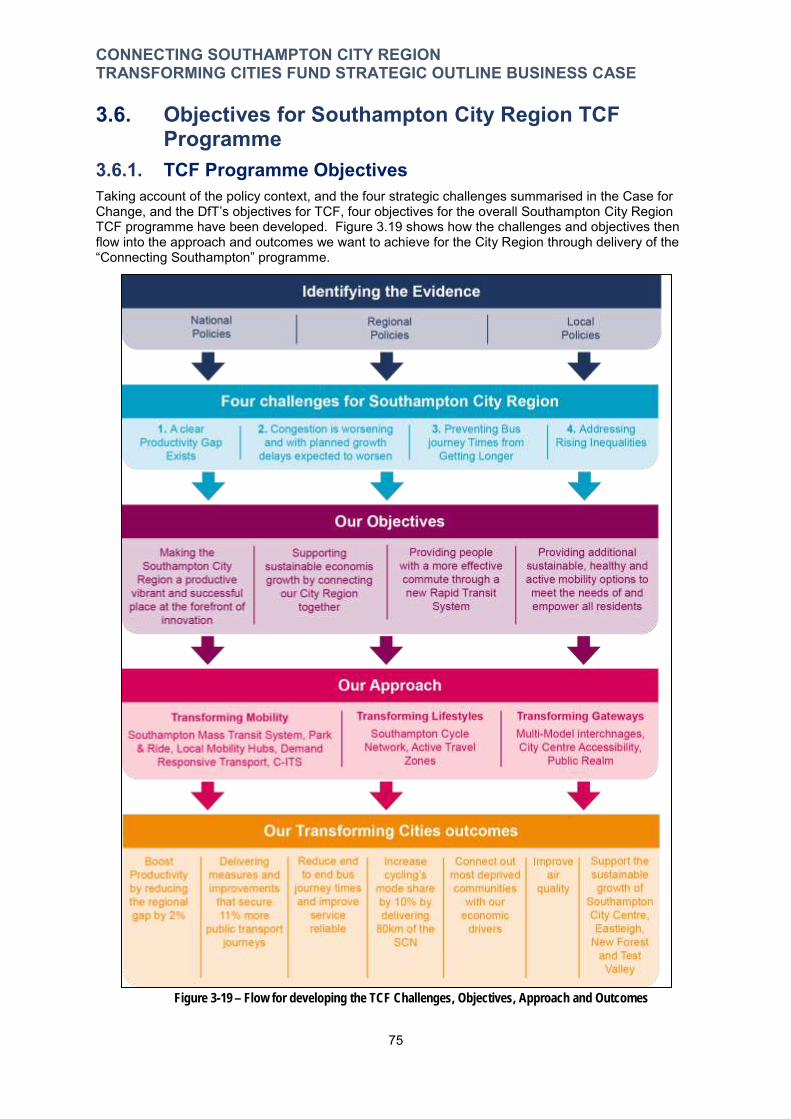
CONNECTING SOUTHAMPTON CITY REGION TRANSFORMING CITIES FUND STRATEGIC OUTLINE BUSINESS CASE
3.6. Objectives for Southampton City Region TCF Programme
3.6.1. TCF Programme Objectives Taking account of the policy context, and the four strategic challenges summarised in the Case for Change, and the DfT’s objectives for TCF, four objectives for the overall Southampton City Region TCF programme have been developed. Figure 3.19 shows how the challenges and objectives then flow into the approach and outcomes we want to achieve for the City Region through delivery of the “Connecting Southampton” programme.
Figure 3-19 – Flow for developing the TCF Challenges, Objectives, Approach and Outcomes
75
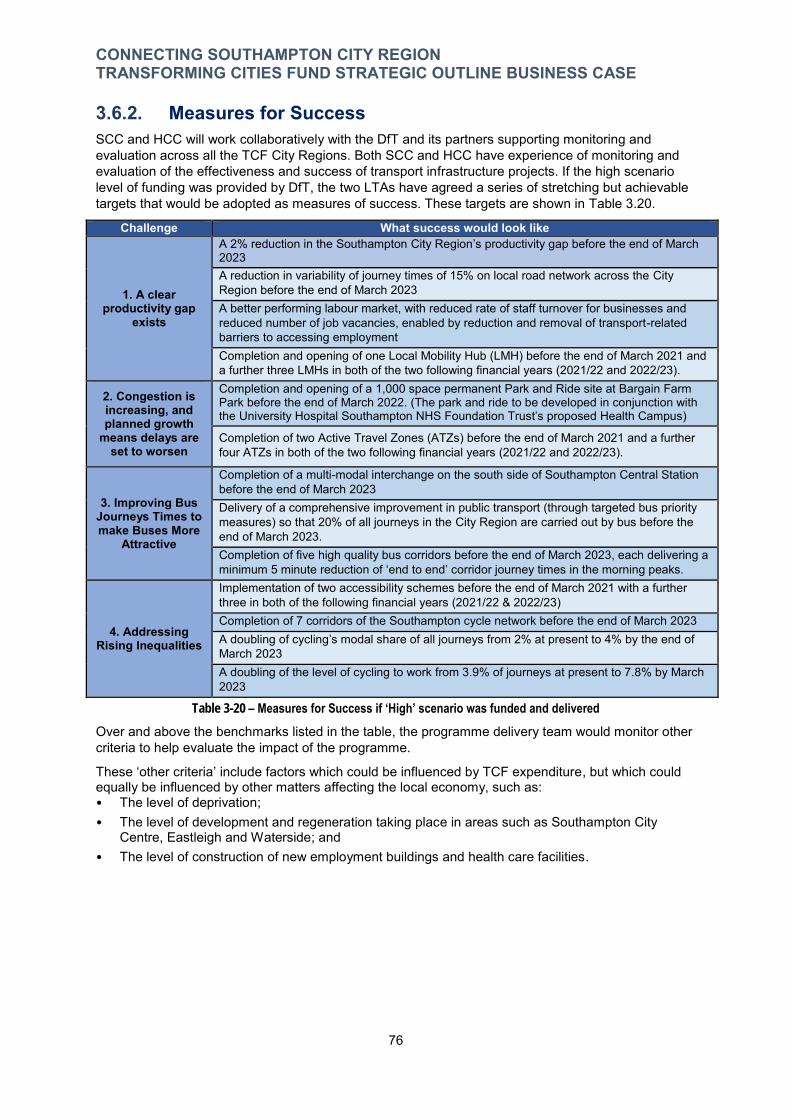
CONNECTING SOUTHAMPTON CITY REGION TRANSFORMING CITIES FUND STRATEGIC OUTLINE BUSINESS CASE
3.6.2. Measures for Success SCC and HCC will work collaboratively with the DfT and its partners supporting monitoring and evaluation across all the TCF City Regions. Both SCC and HCC have experience of monitoring and evaluation of the effectiveness and success of transport infrastructure projects. If the high scenario level of funding was provided by DfT, the two LTAs have agreed a series of stretching but achievable targets that would be adopted as measures of success. These targets are shown in Table 3.20.
Challenge What success would look like
1. A clear productivity gap
exists
A 2% reduction in the Southampton City Region’s productivity gap before the end of March 2023 A reduction in variability of journey times of 15% on local road network across the City Region before the end of March 2023 A better performing labour market, with reduced rate of staff turnover for businesses and reduced number of job vacancies, enabled by reduction and removal of transport-related barriers to accessing employment Completion and opening of one Local Mobility Hub (LMH) before the end of March 2021 and a further three LMHs in both of the two following financial years (2021/22 and 2022/23).
2. Congestion is increasing, and planned growth
means delays are set to worsen
Completion and opening of a 1,000 space permanent Park and Ride site at Bargain Farm Park before the end of March 2022. (The park and ride to be developed in conjunction with the University Hospital Southampton NHS Foundation Trust’s proposed Health Campus)
Completion of two Active Travel Zones (ATZs) before the end of March 2021 and a further four ATZs in both of the two following financial years (2021/22 and 2022/23).
3. Improving Bus Journeys Times to make Buses More
Attractive
Completion of a multi-modal interchange on the south side of Southampton Central Station before the end of March 2023 Delivery of a comprehensive improvement in public transport (through targeted bus priority measures) so that 20% of all journeys in the City Region are carried out by bus before the end of March 2023. Completion of five high quality bus corridors before the end of March 2023, each delivering a minimum 5 minute reduction of ‘end to end’ corridor journey times in the morning peaks.
4. Addressing Rising Inequalities
Implementation of two accessibility schemes before the end of March 2021 with a further three in both of the following financial years (2021/22 & 2022/23) Completion of 7 corridors of the Southampton cycle network before the end of March 2023 A doubling of cycling’s modal share of all journeys from 2% at present to 4% by the end of March 2023 A doubling of the level of cycling to work from 3.9% of journeys at present to 7.8% by March 2023
Table 3-20 – Measures for Success if ‘High’ scenario was funded and delivered
Over and above the benchmarks listed in the table, the programme delivery team would monitor other criteria to help evaluate the impact of the programme.
These ‘other criteria’ include factors which could be influenced by TCF expenditure, but which could equally be influenced by other matters affecting the local economy, such as: • The level of deprivation; • The level of development and regeneration taking place in areas such as Southampton City
Centre, Eastleigh and Waterside; and • The level of construction of new employment buildings and health care facilities.
76
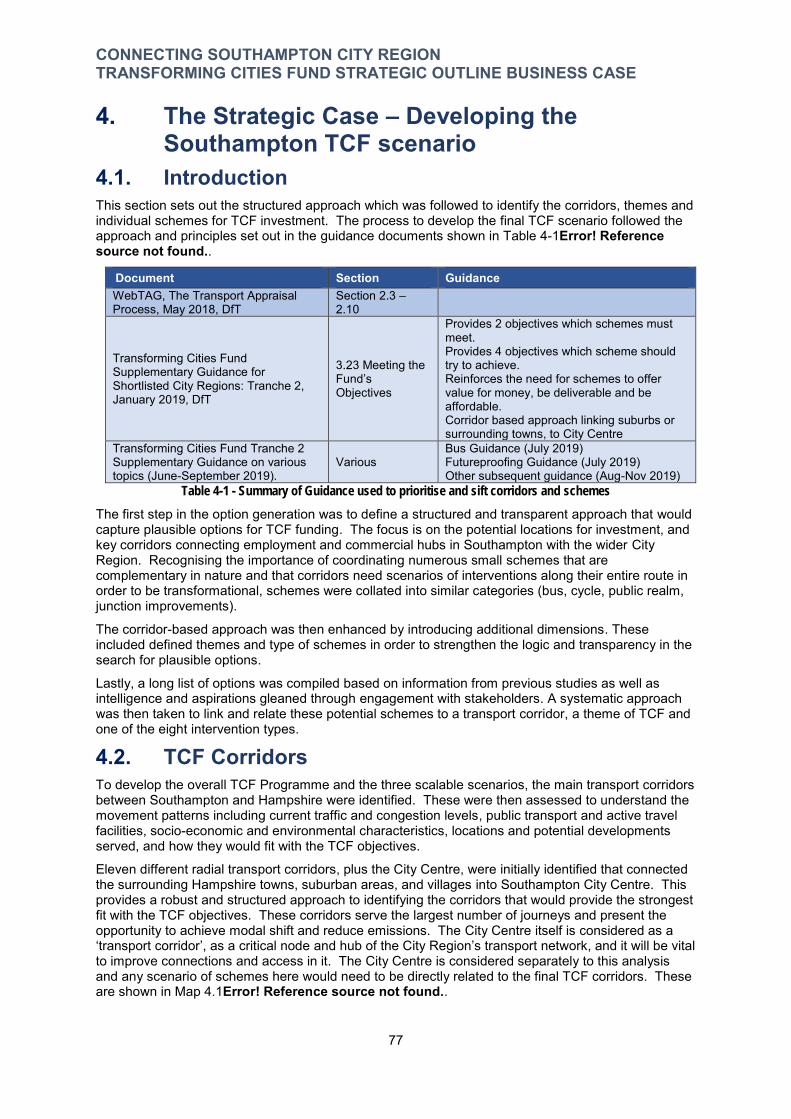
CONNECTING SOUTHAMPTON CITY REGION TRANSFORMING CITIES FUND STRATEGIC OUTLINE BUSINESS CASE
4. The Strategic Case – Developing the Southampton TCF scenario
4.1. Introduction This section sets out the structured approach which was followed to identify the corridors, themes and individual schemes for TCF investment. The process to develop the final TCF scenario followed the approach and principles set out in the guidance documents shown in Table 4-1Error! Reference source not found..
Document Section Guidance WebTAG, The Transport Appraisal Process, May 2018, DfT
Section 2.3 – 2.10
Transforming Cities Fund Supplementary Guidance for Shortlisted City Regions: Tranche 2, January 2019, DfT
3.23 Meeting the Fund’s Objectives
Provides 2 objectives which schemes must meet. Provides 4 objectives which scheme should try to achieve. Reinforces the need for schemes to offer value for money, be deliverable and be affordable. Corridor based approach linking suburbs or surrounding towns, to City Centre
Transforming Cities Fund Tranche 2 Supplementary Guidance on various topics (June-September 2019).
Various Bus Guidance (July 2019) Futureproofing Guidance (July 2019) Other subsequent guidance (Aug-Nov 2019)
Table 4-1 - Summary of Guidance used to prioritise and sift corridors and schemes
The first step in the option generation was to define a structured and transparent approach that would capture plausible options for TCF funding. The focus is on the potential locations for investment, and key corridors connecting employment and commercial hubs in Southampton with the wider City Region. Recognising the importance of coordinating numerous small schemes that are complementary in nature and that corridors need scenarios of interventions along their entire route in order to be transformational, schemes were collated into similar categories (bus, cycle, public realm, junction improvements).
The corridor-based approach was then enhanced by introducing additional dimensions. These included defined themes and type of schemes in order to strengthen the logic and transparency in the search for plausible options.
Lastly, a long list of options was compiled based on information from previous studies as well as intelligence and aspirations gleaned through engagement with stakeholders. A systematic approach was then taken to link and relate these potential schemes to a transport corridor, a theme of TCF and one of the eight intervention types.
4.2. TCF Corridors To develop the overall TCF Programme and the three scalable scenarios, the main transport corridors between Southampton and Hampshire were identified. These were then assessed to understand the movement patterns including current traffic and congestion levels, public transport and active travel facilities, socio-economic and environmental characteristics, locations and potential developments served, and how they would fit with the TCF objectives.
Eleven different radial transport corridors, plus the City Centre, were initially identified that connected the surrounding Hampshire towns, suburban areas, and villages into Southampton City Centre. This provides a robust and structured approach to identifying the corridors that would provide the strongest fit with the TCF objectives. These corridors serve the largest number of journeys and present the opportunity to achieve modal shift and reduce emissions. The City Centre itself is considered as a ‘transport corridor’, as a critical node and hub of the City Region’s transport network, and it will be vital to improve connections and access in it. The City Centre is considered separately to this analysis and any scenario of schemes here would need to be directly related to the final TCF corridors. These are shown in Map 4.1Error! Reference source not found..
77

CONNECTING SOUTHAMPTON CITY REGION TRANSFORMING CITIES FUND STRATEGIC OUTLINE BUSINESS CASE
Map 4.1 – Initial Eleven Radial Corridors identified for TCF
Through a multi-criteria high level corridor assessment, shown in Table 4.2, each of the eleven corridors were examined, assessing:
quantitative data (traffic levels, congestion, public transport and active travel facilities/corridors);
the level of strategic fit with the two core TCF Objectives; the scope to improve sustainable transport mode share and journey times; the scope to improve connectivity and economic growth (housing and jobs); and the level of fit with the social inclusion, reducing inequalities, and air quality objectives.
This produced an initial high, medium or low rating for each corridor’s level of fit with TCF Objectives.
Alongside this assessment of strategic fit with TCF objectives, a qualitative corridor assessment exercise was carried out which examined the potential for improved bus journey times, better connectivity to employment and links to housing growth.
78
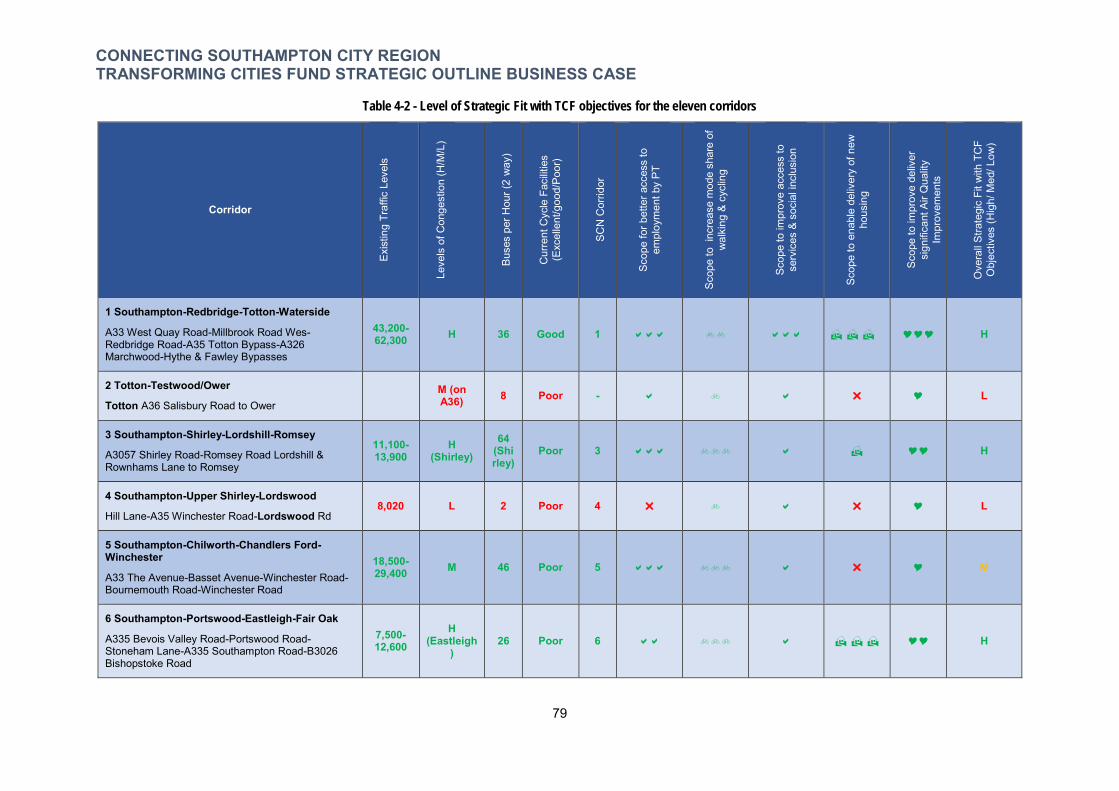
-
CONNECTING SOUTHAMPTON CITY REGION TRANSFORMING CITIES FUND STRATEGIC OUTLINE BUSINESS CASE
Table 4-2 - Level of Strategic Fit with TCF objectives for the eleven corridors
Corridor
Exis
ting
Traf
fic L
evel
s
Leve
ls o
f Con
gest
ion
(H/M
/L)
Buse
s pe
r Hou
r (2
way
)
Cur
rent
Cyc
le F
acilit
ies
(Exc
elle
nt/g
ood/
Poor
)
SCN
Cor
ridor
Scop
e fo
r bet
ter a
cces
s to
em
ploy
men
t by
PT
Scop
e to
inc
reas
e m
ode
shar
e of
w
alki
ng &
cyc
ling
Scop
e to
impr
ove
acce
ss to
se
rvic
es &
soc
ial i
nclu
sion
Scop
e to
ena
ble
deliv
ery
of n
ew
hous
ing
Scop
e to
impr
ove
deliv
er
sign
ifica
nt A
ir Q
ualit
yIm
prov
emen
ts
Ove
rall
Stra
tegi
c Fi
t with
TC
F O
bjec
tives
(Hig
h/ M
ed/ L
ow)
1 Southampton-Redbridge-Totton-Waterside
A33 West Quay Road-Millbrook Road Wes-Redbridge Road-A35 Totton Bypass-A326
43,200-62,300 H 36 Good 1 H
Marchwood-Hythe & Fawley Bypasses
2 Totton-Testwood/Ower
Totton A36 Salisbury Road to Ower M (on A36) 8 Poor - L
3 Southampton-Shirley-Lordshill-Romsey
A3057 Shirley Road-Romsey Road Lordshill & Rownhams Lane to Romsey
11,100-13,900
H (Shirley)
64 (Shi rley)
Poor 3 H
4 Southampton-Upper Shirley-Lordswood
Hill Lane-A35 Winchester Road-Lordswood Rd 8,020 L 2 Poor 4 L
5 Southampton-Chilworth-Chandlers Ford-Winchester
A33 The Avenue-Basset Avenue-Winchester Road-Bournemouth Road-Winchester Road
18,500-29,400 M 46 Poor 5 M
6 Southampton-Portswood-Eastleigh-Fair Oak
A335 Bevois Valley Road-Portswood Road-Stoneham Lane-A335 Southampton Road-B3026 Bishopstoke Road
7,500-12,600
H (Eastleigh
) 26 Poor 6 H
79
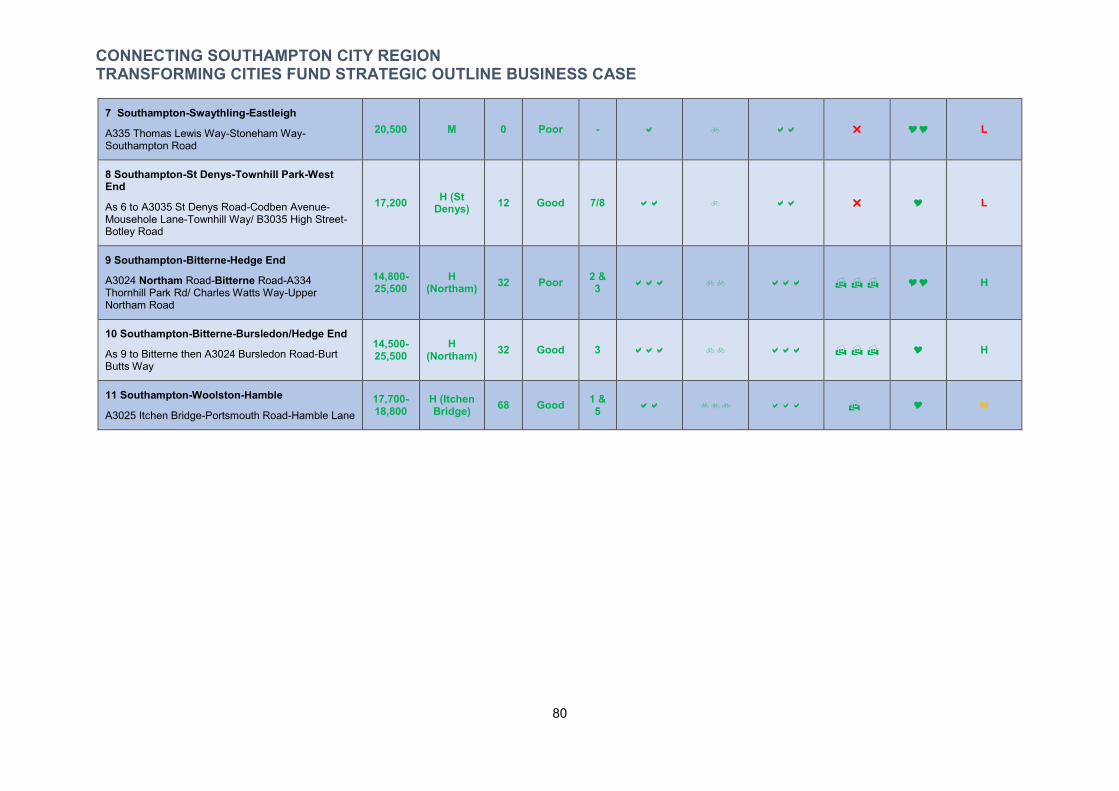
CONNECTING SOUTHAMPTON CITY REGION TRANSFORMING CITIES FUND STRATEGIC OUTLINE BUSINESS CASE
7 Southampton-Swaythling-Eastleigh
A335 Thomas Lewis Way-Stoneham Way- 20,500 M 0 Poor - L Southampton Road
8 Southampton-St Denys-Townhill Park-West End
As 6 to A3035 St Denys Road-Codben Avenue- 17,200 H (St Denys) 12 Good 7/8 L
Mousehole Lane-Townhill Way/ B3035 High Street-Botley Road
9 Southampton-Bitterne-Hedge End
A3024 Northam Road-Bitterne Road-A334 Thornhill Park Rd/ Charles Watts Way-Upper Northam Road
14,800-25,500
H (Northam) 32 Poor 2 &
3 H
10 Southampton-Bitterne-Bursledon/Hedge End
As 9 to Bitterne then A3024 Bursledon Road-Burt Butts Way
14,500-25,500
H (Northam) 32 Good 3 H
11 Southampton-Woolston-Hamble
A3025 Itchen Bridge-Portsmouth Road-Hamble Lane 17,700-18,800
H (Itchen Bridge) 68 Good 1 &
5 M
80
CONNECTING SOUTHAMPTON CITY REGION TRANSFORMING CITIES FUND STRATEGIC OUTLINE BUSINESS CASE
From the corridor sifting four corridors scored low, with poor fit or potential to deliver improvements against the criteria. A further sensitivity assessment concluded that two of the corridors should be considered as part of other corridors rather than stand alone. Nine corridors were identified for further development and potential inclusion in this business case::
1 Southampton-Redbridge-Totton-Waterside 3 Southampton-Shirley-Lordshill-Romsey 5 Southampton-Chilworth-Chandlers Ford-Winchester 6 Southampton-Portswood-Eastleigh-Fair Oak 7 Southampton-Swaythling-Eastleigh 8 Southampton-St Denys-Townhill Park 9 Southampton-Bitterne-Hedge End 10 Southampton-Bitterne-Bursledon 11 Southampton-Woolston-Hamble
Given the synergies and inter-dependencies between these corridors, three were amended and merged with other corridors. These are:
Corridors 9 and 10 were merged as they follow the same route from the City Centre to Bitterne and diverge there. This provides the most direct route from Hedge End into Southampton and is the route that the majority of car commuters from Hedge End take;
Corridors 7 and 8 were modified to form part of Corridor 6. Although initially scored as low these have close interactions or should be considered as ‘spurs’ to Corridor 6, so are included. Corridor 7 along Thomas Lewis Way provides a supporting route to Portswood Road and offers scope to enable transformational this corridor to support sustainable and active travel. Corridor 8 diverges from 6 at Portswood to serve St Denys and Townhill Park. East of this point bus services are less frequent and cycle routes indirect, the section from Portswood Road to Townhill Park is heavily congested with lengthened bus journey times. To omit this would isolate a large community from any transport benefits and erode bus journey time gains from the Portswood corridor.
Corridor 11 serves the east of Southampton via the Itchen Bridge and is the second most bussed corridor in the city as well as serving Hamble. As an alternative route into Southampton from M27 J8 and Hedge End/Bursledon there are strong linkages with corridors 9 and 10. Merged together, they form a comprehensive approach for connecting eastern Southampton with the City Centre.
Southampton City Centre is the focal point for TCF as the destination for all the identified corridors and is treated as a separate ‘corridor’ within the TCF programme. Following this consolidation five TCF corridors have been selected as the geographical basis for the Southampton TCF Scenario, shown in Map 4.2.
81
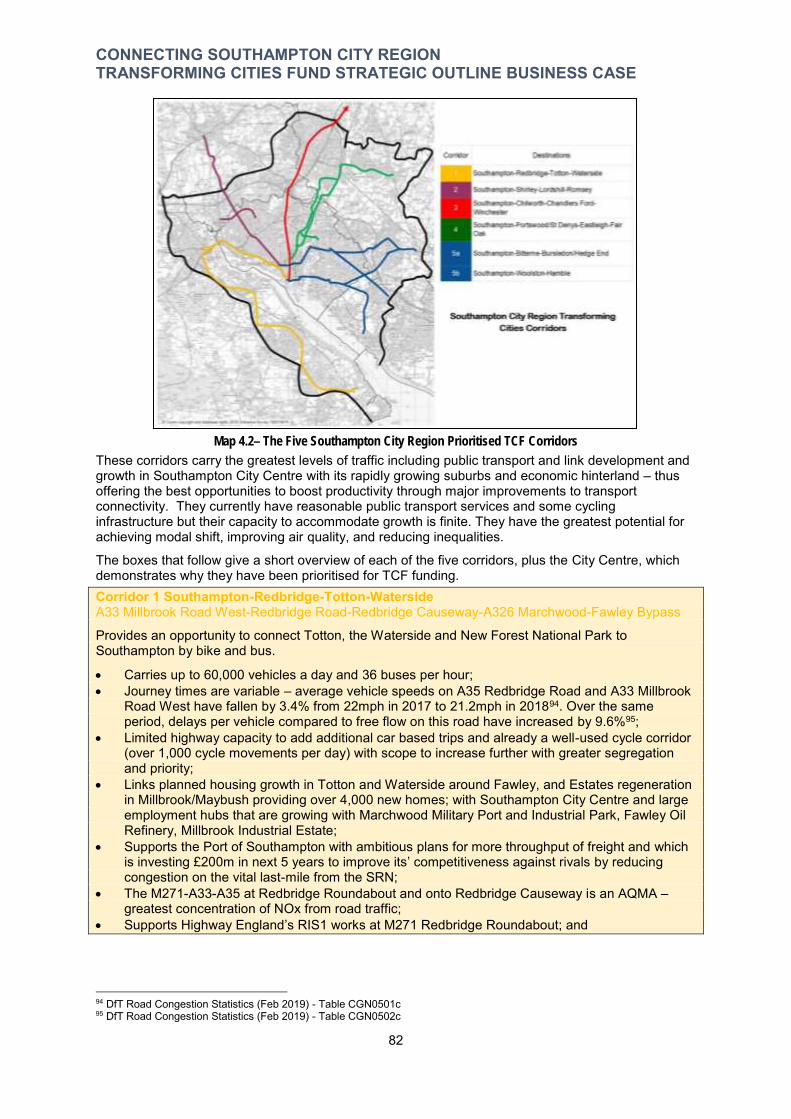
CONNECTING SOUTHAMPTON CITY REGION TRANSFORMING CITIES FUND STRATEGIC OUTLINE BUSINESS CASE
Map 4.2– The Five Southampton City Region Prioritised TCF Corridors
These corridors carry the greatest levels of traffic including public transport and link development and growth in Southampton City Centre with its rapidly growing suburbs and economic hinterland – thus offering the best opportunities to boost productivity through major improvements to transport connectivity. They currently have reasonable public transport services and some cycling infrastructure but their capacity to accommodate growth is finite. They have the greatest potential for achieving modal shift, improving air quality, and reducing inequalities.
The boxes that follow give a short overview of each of the five corridors, plus the City Centre, which demonstrates why they have been prioritised for TCF funding. Corridor 1 Southampton-Redbridge-Totton-Waterside A33 Millbrook Road West-Redbridge Road-Redbridge Causeway-A326 Marchwood-Fawley Bypass
Provides an opportunity to connect Totton, the Waterside and New Forest National Park to Southampton by bike and bus.
Carries up to 60,000 vehicles a day and 36 buses per hour; Journey times are variable – average vehicle speeds on A35 Redbridge Road and A33 Millbrook
Road West have fallen by 3.4% from 22mph in 2017 to 21.2mph in 201894. Over the same period, delays per vehicle compared to free flow on this road have increased by 9.6%95;
Limited highway capacity to add additional car based trips and already a well-used cycle corridor (over 1,000 cycle movements per day) with scope to increase further with greater segregation and priority;
Links planned housing growth in Totton and Waterside around Fawley, and Estates regeneration in Millbrook/Maybush providing over 4,000 new homes; with Southampton City Centre and large employment hubs that are growing with Marchwood Military Port and Industrial Park, Fawley Oil Refinery, Millbrook Industrial Estate;
Supports the Port of Southampton with ambitious plans for more throughput of freight and which is investing £200m in next 5 years to improve its’ competitiveness against rivals by reducing congestion on the vital last-mile from the SRN;
The M271-A33-A35 at Redbridge Roundabout and onto Redbridge Causeway is an AQMA – greatest concentration of NOx from road traffic;
Supports Highway England’s RIS1 works at M271 Redbridge Roundabout; and
94 DfT Road Congestion Statistics (Feb 2019) - Table CGN0501c 95 DfT Road Congestion Statistics (Feb 2019) - Table CGN0502c
82
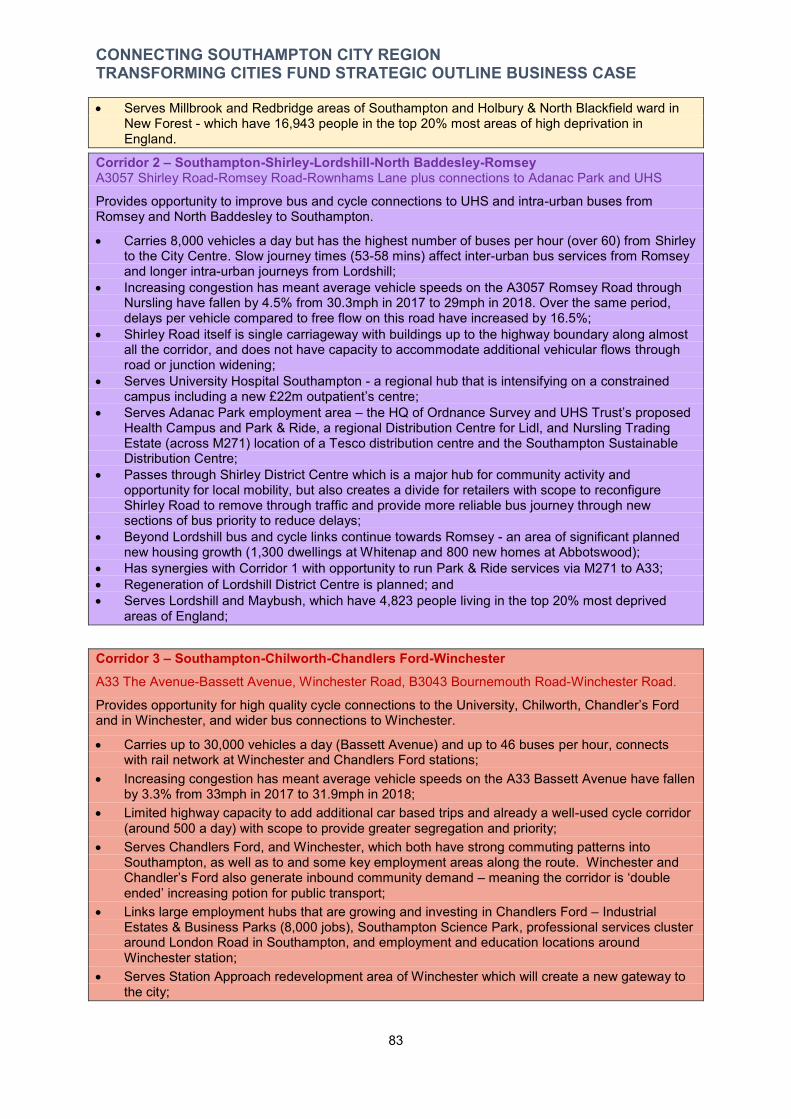
CONNECTING SOUTHAMPTON CITY REGION TRANSFORMING CITIES FUND STRATEGIC OUTLINE BUSINESS CASE
Serves Millbrook and Redbridge areas of Southampton and Holbury & North Blackfield ward in New Forest - which have 16,943 people in the top 20% most areas of high deprivation in England.
Corridor 2 – Southampton-Shirley-Lordshill-North Baddesley-Romsey A3057 Shirley Road-Romsey Road-Rownhams Lane plus connections to Adanac Park and UHS
Provides opportunity to improve bus and cycle connections to UHS and intra-urban buses from Romsey and North Baddesley to Southampton.
Carries 8,000 vehicles a day but has the highest number of buses per hour (over 60) from Shirley to the City Centre. Slow journey times (53-58 mins) affect inter-urban bus services from Romsey and longer intra-urban journeys from Lordshill;
Increasing congestion has meant average vehicle speeds on the A3057 Romsey Road through Nursling have fallen by 4.5% from 30.3mph in 2017 to 29mph in 2018. Over the same period, delays per vehicle compared to free flow on this road have increased by 16.5%;
Shirley Road itself is single carriageway with buildings up to the highway boundary along almost all the corridor, and does not have capacity to accommodate additional vehicular flows through road or junction widening;
Serves University Hospital Southampton - a regional hub that is intensifying on a constrained campus including a new £22m outpatient’s centre;
Serves Adanac Park employment area – the HQ of Ordnance Survey and UHS Trust’s proposed Health Campus and Park & Ride, a regional Distribution Centre for Lidl, and Nursling Trading Estate (across M271) location of a Tesco distribution centre and the Southampton Sustainable Distribution Centre;
Passes through Shirley District Centre which is a major hub for community activity and opportunity for local mobility, but also creates a divide for retailers with scope to reconfigure Shirley Road to remove through traffic and provide more reliable bus journey through new sections of bus priority to reduce delays;
Beyond Lordshill bus and cycle links continue towards Romsey - an area of significant planned new housing growth (1,300 dwellings at Whitenap and 800 new homes at Abbotswood);
Has synergies with Corridor 1 with opportunity to run Park & Ride services via M271 to A33; Regeneration of Lordshill District Centre is planned; and Serves Lordshill and Maybush, which have 4,823 people living in the top 20% most deprived
areas of England;
Corridor 3 – Southampton-Chilworth-Chandlers Ford-Winchester A33 The Avenue-Bassett Avenue, Winchester Road, B3043 Bournemouth Road-Winchester Road.
Provides opportunity for high quality cycle connections to the University, Chilworth, Chandler’s Ford and in Winchester, and wider bus connections to Winchester.
Carries up to 30,000 vehicles a day (Bassett Avenue) and up to 46 buses per hour, connects with rail network at Winchester and Chandlers Ford stations;
Increasing congestion has meant average vehicle speeds on the A33 Bassett Avenue have fallen by 3.3% from 33mph in 2017 to 31.9mph in 2018;
Limited highway capacity to add additional car based trips and already a well-used cycle corridor (around 500 a day) with scope to provide greater segregation and priority;
Serves Chandlers Ford, and Winchester, which both have strong commuting patterns into Southampton, as well as to and some key employment areas along the route. Winchester and Chandler’s Ford also generate inbound community demand – meaning the corridor is ‘double ended’ increasing potion for public transport;
Links large employment hubs that are growing and investing in Chandlers Ford – Industrial Estates & Business Parks (8,000 jobs), Southampton Science Park, professional services cluster around London Road in Southampton, and employment and education locations around Winchester station;
Serves Station Approach redevelopment area of Winchester which will create a new gateway to the city;
83
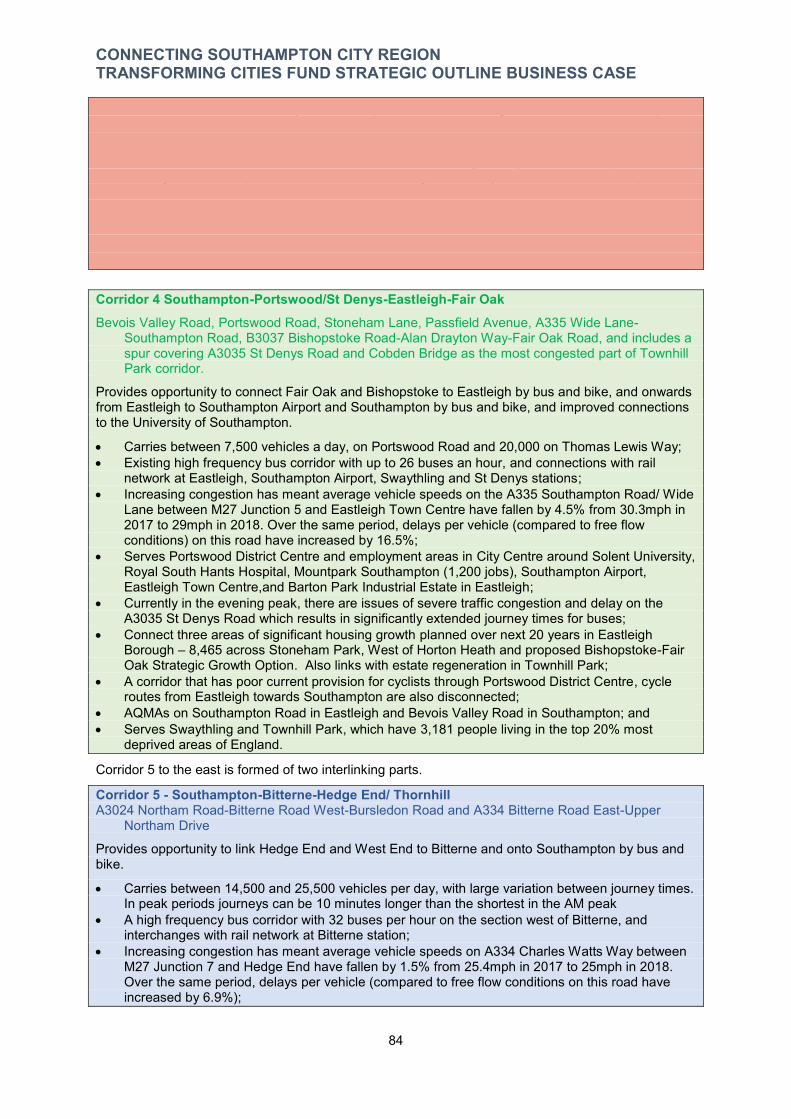
CONNECTING SOUTHAMPTON CITY REGION TRANSFORMING CITIES FUND STRATEGIC OUTLINE BUSINESS CASE
Passes close to the University of Southampton which is investing £300m in its’ estate to improve the quality of teaching spaces and student experience;
Serves Chandlers Ford and Frvern Hill shops – a main convenience retail centre for the area; Bluestar 1 route that follows the whole corridor is an existing Quality Bus Partnership corridor
with high service frequencies, but suffers from congestion delays on Bassett Avenue in peak times;
Junction of Burgess Road/The Avenue is an AQMA due to queuing traffic and parallel to AQMA on M3 providing opportunity to encourage mode shift for short-hop journeys on M3; and
Opportunity to enhance the connections from Chilworth and Chandlers Ford with Southampton by bike.
Corridor 4 Southampton-Portswood/St Denys-Eastleigh-Fair Oak Bevois Valley Road, Portswood Road, Stoneham Lane, Passfield Avenue, A335 Wide Lane-
Southampton Road, B3037 Bishopstoke Road-Alan Drayton Way-Fair Oak Road, and includes a spur covering A3035 St Denys Road and Cobden Bridge as the most congested part of Townhill Park corridor.
Provides opportunity to connect Fair Oak and Bishopstoke to Eastleigh by bus and bike, and onwards from Eastleigh to Southampton Airport and Southampton by bus and bike, and improved connections to the University of Southampton.
Carries between 7,500 vehicles a day, on Portswood Road and 20,000 on Thomas Lewis Way; Existing high frequency bus corridor with up to 26 buses an hour, and connections with rail
network at Eastleigh, Southampton Airport, Swaythling and St Denys stations; Increasing congestion has meant average vehicle speeds on the A335 Southampton Road/ Wide
Lane between M27 Junction 5 and Eastleigh Town Centre have fallen by 4.5% from 30.3mph in 2017 to 29mph in 2018. Over the same period, delays per vehicle (compared to free flow conditions) on this road have increased by 16.5%;
Serves Portswood District Centre and employment areas in City Centre around Solent University, Royal South Hants Hospital, Mountpark Southampton (1,200 jobs), Southampton Airport, Eastleigh Town Centre,and Barton Park Industrial Estate in Eastleigh;
Currently in the evening peak, there are issues of severe traffic congestion and delay on the A3035 St Denys Road which results in significantly extended journey times for buses;
Connect three areas of significant housing growth planned over next 20 years in Eastleigh Borough – 8,465 across Stoneham Park, West of Horton Heath and proposed Bishopstoke-Fair Oak Strategic Growth Option. Also links with estate regeneration in Townhill Park;
A corridor that has poor current provision for cyclists through Portswood District Centre, cycle routes from Eastleigh towards Southampton are also disconnected;
AQMAs on Southampton Road in Eastleigh and Bevois Valley Road in Southampton; and Serves Swaythling and Townhill Park, which have 3,181 people living in the top 20% most
deprived areas of England.
Corridor 5 to the east is formed of two interlinking parts.
Corridor 5 - Southampton-Bitterne-Hedge End/ Thornhill A3024 Northam Road-Bitterne Road West-Bursledon Road and A334 Bitterne Road East-Upper
Northam Drive
Provides opportunity to link Hedge End and West End to Bitterne and onto Southampton by bus and bike.
Carries between 14,500 and 25,500 vehicles per day, with large variation between journey times. In peak periods journeys can be 10 minutes longer than the shortest in the AM peak
A high frequency bus corridor with 32 buses per hour on the section west of Bitterne, and interchanges with rail network at Bitterne station;
Increasing congestion has meant average vehicle speeds on A334 Charles Watts Way between M27 Junction 7 and Hedge End have fallen by 1.5% from 25.4mph in 2017 to 25mph in 2018. Over the same period, delays per vehicle (compared to free flow conditions on this road have increased by 6.9%);
84

CONNECTING SOUTHAMPTON CITY REGION TRANSFORMING CITIES FUND STRATEGIC OUTLINE BUSINESS CASE
Connects suburban residential areas to major employment areas in the City Centre, Northam and Itchen Riverside (6,250 jobs, focus of intensification) and Hedge End;
Serves Bitterne District Centre, which is planned to have investment to develop a Local Services Hub – health care, libraries, leisure and other services on one site;
Few direct cycle connections from Hedge End to Southampton due to barriers of M27 and topography;
Joins up a number of sites of planned housing growth in Southampton and Eastleigh Borough – 5,800 across Itchen Riverside, Thornhill (estates regeneration), Bursledon, Hedge End, Botley and Boorley Green;
Large AQMA on A3024 Bitterne Road West which has high NOx concentrations from road transport; and
Complements Highways England’s RIS1 M27 Southampton Junction project to improve capacity at M27 J8 and Windhover Roundabout, and SCC’s TCF Tranche 1, NPIF and Clean Air Zone investment to deliver C-ITS and cycle infrastructure along the A3024 Bursledon Road, and SCN2 quieter route from Bursledon Road to Northam via Bitterne District Centre and Quayside Road; and
Serves Thornhill, Harefield and Sholing which have 14,489 people living in the top 20% most deprived areas of England;
Corridor 5 – Southampton-Woolston-Hamble/ Bursledon A3025 Itchen Bridge-Portsmouth Road- A27 Bridge Road/Hamble Lane
Provides opportunity to connect Bursledon and Hamble with Woolston and then into Southampton by bike and bus.
Carries up to 18,800 vehicles per day across the Itchen Bridge, one of five crossings of the River Itchen from the east but this is the only one toll bridge;
From Lowford, near Hamble Lane to the City Centre has a peak hour journey time by bus of 32 minutes to travel 4 miles;
The highest frequency bus corridor with 68 buses a hour crossing the Itchen Bridge, and interchange with rail network at Woolston and Hamble stations;
Increasing congestion has meant average vehicle speeds on the A3025 Portsmouth Road between Sholing and Bursledon have fallen by 6% from 19.5mph in 2017 to 18.3mph in 2018. Over the same period, delays per vehicle (compared to free flow conditions) on this road have increased by 11.5%;
Serves Woolston District Centre and Hamble Village Centre; Major employment areas in Centenary Quay-Itchen Riverside (Woolston side) and Hamble – GE
Aviation and Hamble Oil Terminal (950 jobs); Connects major development areas in Centenary Quay (1,600 homes and 14,000m2 of
commercial space), Hamble Lane/Bursledon (900 homes) and estates regeneration projects in Weston;
Busy cycle corridor particularly across Itchen Bridge, but hotspot of cycle accidents on approaches;
Hamble Lane and Victoria Road are AQMAs; Serves Woolston and Weston which have 6,674 people living in the top 20% most deprived
areas of England; and Opportunity to complement proposals on Hamble Lane planned by HCC and HE’s RIS1 works at
M27 Junction 8 & Windhover Roundabout.
City Centre The City Centre is where all five TCF corridors meet and is the hub of the City Region’s transport network. Significant new development is planned within the Very Important Project (VIP) sites explained in Chapter 3. There is a need to better connect Southampton Central station with the City Centre, through a high quality public realm that better meets the needs of pedestrians and cyclists, as well as improving interchange. There is also a need to improve bus interchange points and reduce the dominance of vehicular traffic, which should be using the Inner Ring Road.
85

-
CONNECTING SOUTHAMPTON CITY REGION TRANSFORMING CITIES FUND STRATEGIC OUTLINE BUSINESS CASE
4.3. Developing Themes Once the TCF corridors had been identified, three theme areas were developed.
The three themes are:
Transforming Mobility, Transforming Lifestyles, and Transforming Gateways.
These themes helped to identify and shape schemes that could be included in the TCF Scenario. Using these themes individual schemes can be categorised into a series of sub-themes ready for option assessment as shown in Table 4.3. The themes have been developed to reflect the overarching TCF objectives of boosting productivity, connecting communities, and reducing emissions.
Overarching theme Sub theme
Southampton Mass Transit System – Rapid Bus Southampton Mass Transit System - Ferry
Transforming Mobility Smart Technology Park & Ride Local Mobility Hub Mobility as a Service (MaaS)
Transforming Lifestyles Southampton Cycle Network Active Travel Zones (ATZs)
Transforming Gateways City Centre Transformation Interchanges and Gateways
Table 4-3– Summary of sub-themes within the three scenario themes
From these themes a series of scheme options were generated for appraisal.
86
CONNECTING SOUTHAMPTON CITY REGION TRANSFORMING CITIES FUND STRATEGIC OUTLINE BUSINESS CASE
4.4. Option Generation Having established a systematic framework for capturing plausible options (covering a spectrum of categories falling into defined themes along individual corridors), this was applied to generate a long list of candidate schemes and options. Specifically, this exercise incorporated numerous investigations including gathering findings from previous studies and strategies, compiling suggestions from stakeholders and identifying new ideas that deliver on the objectives of the TCF.
SCC & HCC have been progressing a number of transport strategies some of which did not have a suitable funding stream for them to be assessed. When compiling the long list of schemes for the TCF Programme, these strategies were revisited, and suitable schemes identified. When assessing if schemes were suitable the objectives set out in the previous section were used as a reference.
The earlier pieces of work which were reviewed (summarised in Appendix 1) include:
• Connected Southampton 2040 Transport Strategy – LTP4 (March 2019); • Solent LEP’s Strategic Transport Investment Plan (2016); • Solent Transport, Transport Delivery Plan (2013); • Hampshire Local Transport Plan 3 (2011); • South Hampshire Joint Transport Strategy (2011); • Southampton Public Transport Strategy (2019); • Southampton City Centre Access & Movement Strategy (City Streets 2) (2019); • Southampton Intelligent Transport Systems Strategy (2019) • Southampton Parking Plan (2019); • Southampton Cycle Strategy (2017); • Hampshire Cycling Strategy (2015); • Hampshire Walking Strategy (2016); • Interim Waterside Transport Strategy (2017); • Draft LCWIPs for southern Test Valley, Waterside, and Eastleigh; and • Emerging Eastleigh Transport Strategy (2019).
It should be noted that there are other schemes included within the above strategies and plans which were not progressed into the TCF longlist. This is not to say there is no longer an aspiration to deliver them, but these were simply not deemed to align with the TCF objectives or were not deliverable within the timescales of TCF funding.
For example, there are aspirations over the longer-term to potentially evolve a Bus Rapid Transit network into one or two new light rail or tram corridors, however this could not be delivered in the TCF time scales so is not suitable for the longlist. There is also an aspiration to rationalise and redevelop numerous City Centre car parks. Whilst the Car Parking Plan identifies timeframes and a sequence for the closure and relocation of these car parks, some of which is dependent on the timeframes within which City Centre regeneration schemes come forward. Given that the timing of delivery could not be ensured within the TCF period (although we expect it is probable that a 1,000 space reduction in parking is deliverable by March 2023 coupled with Park & Ride solutions), these schemes were not included in the long list.
Having screened out schemes, the assessment of and sifting out of options that were clearly best aligned to TCF objectives was then conducted.
4.5. Arriving at a Long List Following these engagement exercises and discussions, the Option Generation process culminated in a long list comprising 97 schemes (with a total estimated value of £172m) across the five corridors and in the City Centre. An early degree of sifting had taken place with schemes already included and funded with TCF Tranche 1 and those that could obviously not be delivered in the time scales have been excluded. Some schemes on the long list are geographically specific, and focussed on a specific transport mode, whilst others are City Region wide proposals. The process for identification of potential schemes aimed to be inclusive of all options and reflect the growth aspirations for the City Region, whilst taking full account of the political and corporate priorities and aspirations of both SCC and HCC.
The number of schemes broken down by the three themes on the five TCF corridors and City Centre schemes are summarised in Figure 4-1.
87
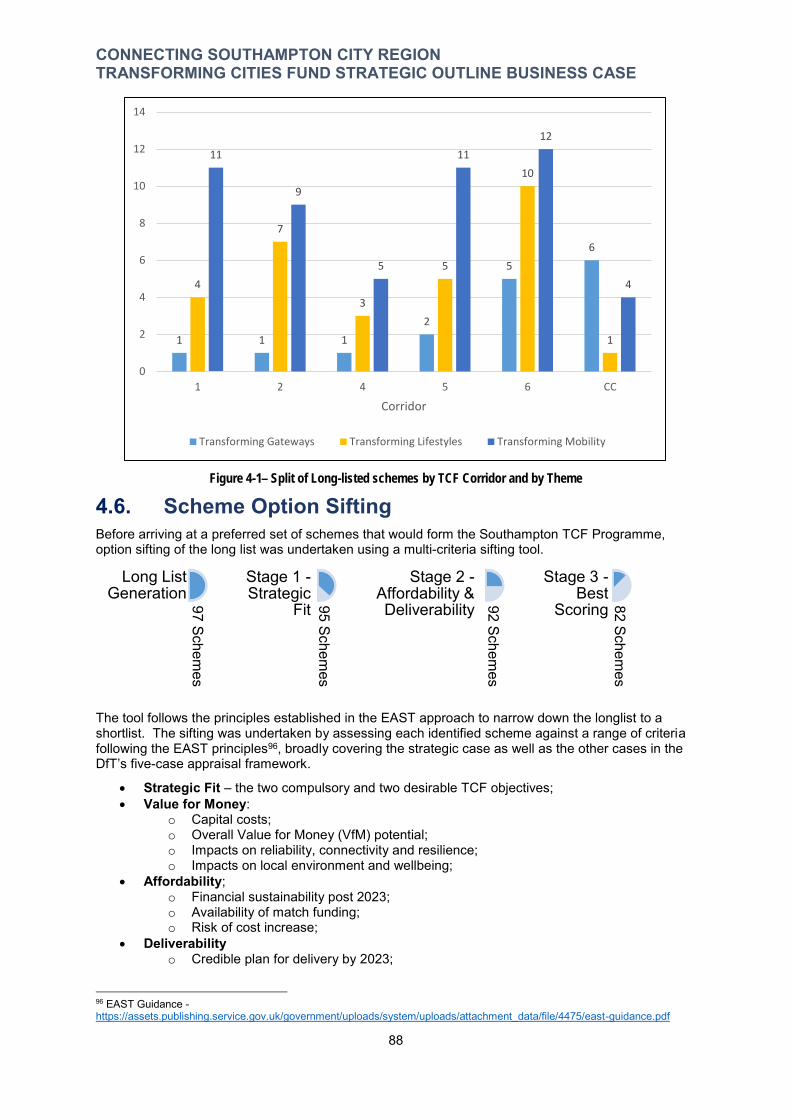
CONNECTING SOUTHAMPTON CITY REGION TRANSFORMING CITIES FUND STRATEGIC OUTLINE BUSINESS CASE
14
12 12 11 11
10 10
9
5
4
8 7
6 6 5 5
4 4 3
2 2 1 1 1 1
0
1 2 4 5 6 CC
Corridor
Transforming Gateways Transforming Lifestyles Transforming Mobility
Figure 4-1– Split of Long-listed schemes by TCF Corridor and by Theme
4.6. Scheme Option Sifting Before arriving at a preferred set of schemes that would form the Southampton TCF Programme, option sifting of the long list was undertaken using a multi-criteria sifting tool.
Long List Stage 1 - Stage 2 - Stage 3 -Generation Strategic Affordability & Best 97 Schem
es Fit 95 Schem
es
Deliverability 92 Schemes
Scoring 82 Schemes
The tool follows the principles established in the EAST approach to narrow down the longlist to a shortlist. The sifting was undertaken by assessing each identified scheme against a range of criteria following the EAST principles96, broadly covering the strategic case as well as the other cases in the DfT’s five-case appraisal framework.
Strategic Fit – the two compulsory and two desirable TCF objectives; Value for Money:
o Capital costs; o Overall Value for Money (VfM) potential; o Impacts on reliability, connectivity and resilience; o Impacts on local environment and wellbeing;
Affordability; o Financial sustainability post 2023; o Availability of match funding; o Risk of cost increase;
Deliverability o Credible plan for delivery by 2023;
96 EAST Guidance -https://assets.publishing.service.gov.uk/government/uploads/system/uploads/attachment_data/file/4475/east-guidance.pdf
88
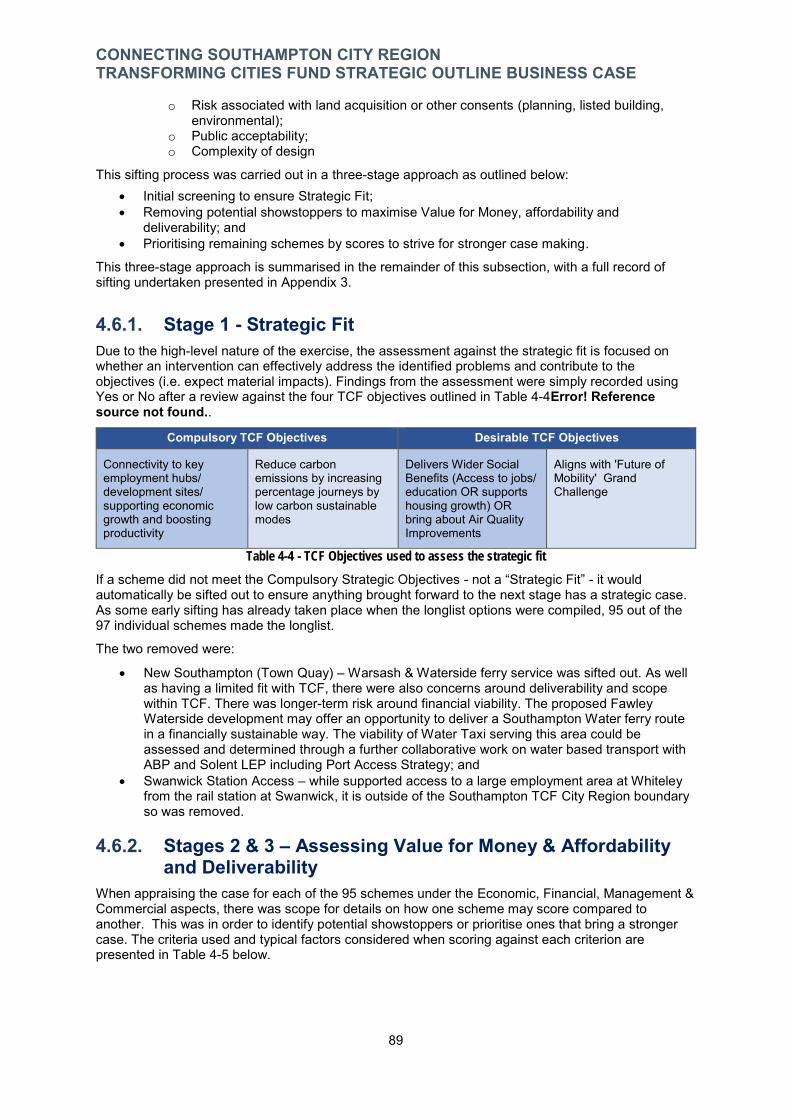
CONNECTING SOUTHAMPTON CITY REGION TRANSFORMING CITIES FUND STRATEGIC OUTLINE BUSINESS CASE
o Risk associated with land acquisition or other consents (planning, listed building, environmental);
o Public acceptability; o Complexity of design
This sifting process was carried out in a three-stage approach as outlined below: Initial screening to ensure Strategic Fit; Removing potential showstoppers to maximise Value for Money, affordability and
deliverability; and Prioritising remaining schemes by scores to strive for stronger case making.
This three-stage approach is summarised in the remainder of this subsection, with a full record of sifting undertaken presented in Appendix 3.
4.6.1. Stage 1 - Strategic Fit Due to the high-level nature of the exercise, the assessment against the strategic fit is focused on whether an intervention can effectively address the identified problems and contribute to the objectives (i.e. expect material impacts). Findings from the assessment were simply recorded using Yes or No after a review against the four TCF objectives outlined in Table 4-4Error! Reference source not found..
Compulsory TCF Objectives Desirable TCF Objectives
Connectivity to key employment hubs/ development sites/ supporting economic growth and boosting productivity
Reduce carbon emissions by increasing percentage journeys by low carbon sustainable modes
Delivers Wider Social Benefits (Access to jobs/ education OR supports housing growth) OR bring about Air Quality Improvements
Aligns with 'Future of Mobility' Grand Challenge
Table 4-4 - TCF Objectives used to assess the strategic fit
If a scheme did not meet the Compulsory Strategic Objectives - not a “Strategic Fit” - it would automatically be sifted out to ensure anything brought forward to the next stage has a strategic case. As some early sifting has already taken place when the longlist options were compiled, 95 out of the 97 individual schemes made the longlist.
The two removed were:
New Southampton (Town Quay) – Warsash & Waterside ferry service was sifted out. As well as having a limited fit with TCF, there were also concerns around deliverability and scope within TCF. There was longer-term risk around financial viability. The proposed Fawley Waterside development may offer an opportunity to deliver a Southampton Water ferry route in a financially sustainable way. The viability of Water Taxi serving this area could be assessed and determined through a further collaborative work on water based transport with ABP and Solent LEP including Port Access Strategy; and
Swanwick Station Access – while supported access to a large employment area at Whiteley from the rail station at Swanwick, it is outside of the Southampton TCF City Region boundary so was removed.
4.6.2. Stages 2 & 3 – Assessing Value for Money & Affordability and Deliverability
When appraising the case for each of the 95 schemes under the Economic, Financial, Management & Commercial aspects, there was scope for details on how one scheme may score compared to another. This was in order to identify potential showstoppers or prioritise ones that bring a stronger case. The criteria used and typical factors considered when scoring against each criterion are presented in Table 4-5 below.
89
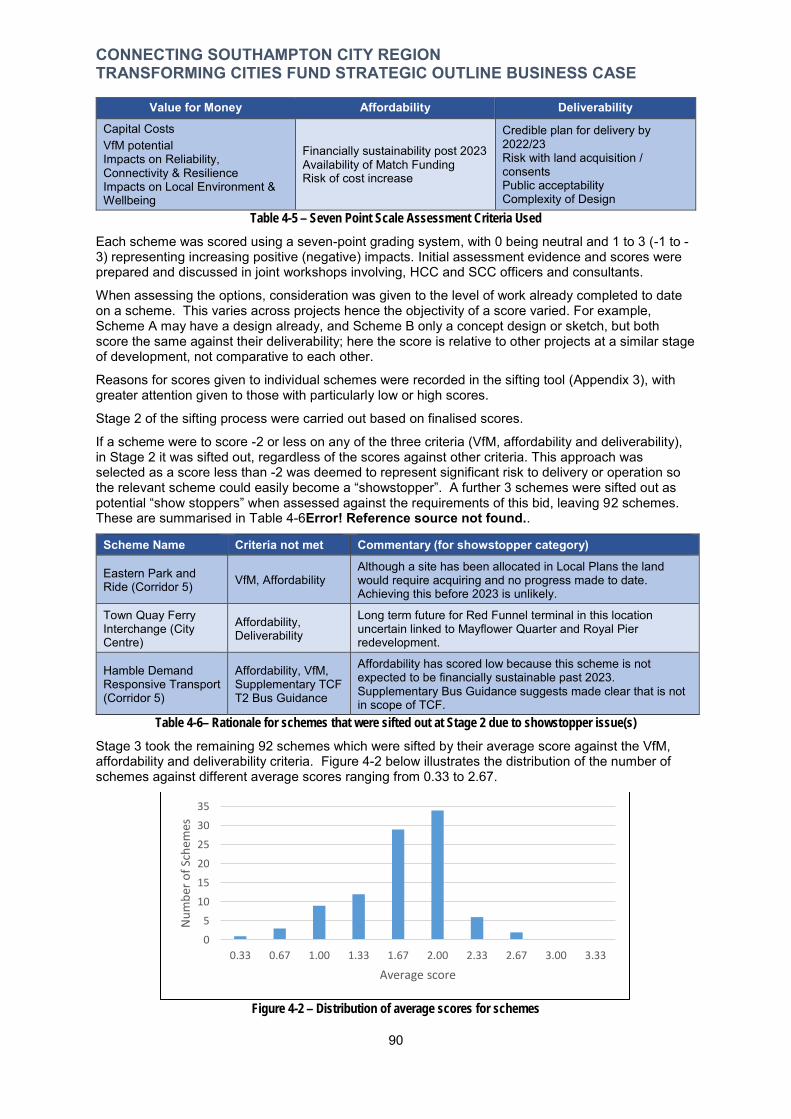
CONNECTING SOUTHAMPTON CITY REGION TRANSFORMING CITIES FUND STRATEGIC OUTLINE BUSINESS CASE
Value for Money Affordability Deliverability Capital Costs VfM potential Impacts on Reliability, Connectivity & Resilience Impacts on Local Environment & Wellbeing
Financially sustainability post 2023 Availability of Match Funding Risk of cost increase
Credible plan for delivery by 2022/23 Risk with land acquisition / consents Public acceptability Complexity of Design
Table 4-5 – Seven Point Scale Assessment Criteria Used
Each scheme was scored using a seven-point grading system, with 0 being neutral and 1 to 3 (-1 to -3) representing increasing positive (negative) impacts. Initial assessment evidence and scores were prepared and discussed in joint workshops involving, HCC and SCC officers and consultants.
When assessing the options, consideration was given to the level of work already completed to date on a scheme. This varies across projects hence the objectivity of a score varied. For example, Scheme A may have a design already, and Scheme B only a concept design or sketch, but both score the same against their deliverability; here the score is relative to other projects at a similar stage of development, not comparative to each other.
Reasons for scores given to individual schemes were recorded in the sifting tool (Appendix 3), with greater attention given to those with particularly low or high scores.
Stage 2 of the sifting process were carried out based on finalised scores.
If a scheme were to score -2 or less on any of the three criteria (VfM, affordability and deliverability), in Stage 2 it was sifted out, regardless of the scores against other criteria. This approach was selected as a score less than -2 was deemed to represent significant risk to delivery or operation so the relevant scheme could easily become a “showstopper”. A further 3 schemes were sifted out as potential “show stoppers” when assessed against the requirements of this bid, leaving 92 schemes. These are summarised in Table 4-6Error! Reference source not found..
Scheme Name Criteria not met Commentary (for showstopper category)
Eastern Park and Ride (Corridor 5) VfM, Affordability
Although a site has been allocated in Local Plans the land would require acquiring and no progress made to date. Achieving this before 2023 is unlikely.
Town Quay Ferry Long term future for Red Funnel terminal in this location Interchange (City Affordability, uncertain linked to Mayflower Quarter and Royal Pier Centre) Deliverability redevelopment.
Hamble Demand Responsive Transport (Corridor 5)
Affordability, VfM, Supplementary TCF T2 Bus Guidance
Affordability has scored low because this scheme is not expected to be financially sustainable past 2023. Supplementary Bus Guidance suggests made clear that is not in scope of TCF.
Table 4-6– Rationale for schemes that were sifted out at Stage 2 due to showstopper issue(s)
Stage 3 took the remaining 92 schemes which were sifted by their average score against the VfM, affordability and deliverability criteria. Figure 4-2 below illustrates the distribution of the number of schemes against different average scores ranging from 0.33 to 2.67.
35
30
25
20
15
10
5
0
Nu
mb
er o
f Sc
hem
es
0.33 0.67 1.00 1.33 1.67 2.00 2.33 2.67 3.00 3.33
Average score
Figure 4-2 – Distribution of average scores for schemes
90
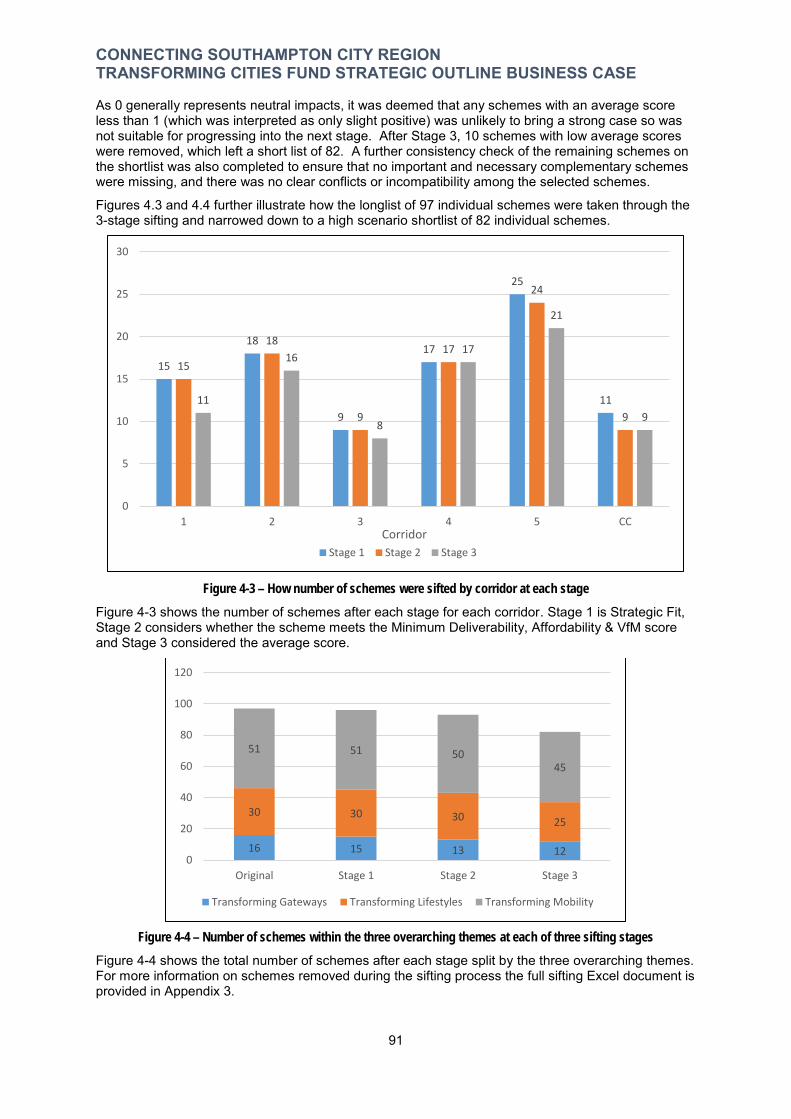
30
CONNECTING SOUTHAMPTON CITY REGION TRANSFORMING CITIES FUND STRATEGIC OUTLINE BUSINESS CASE
As 0 generally represents neutral impacts, it was deemed that any schemes with an average score less than 1 (which was interpreted as only slight positive) was unlikely to bring a strong case so was not suitable for progressing into the next stage. After Stage 3, 10 schemes with low average scores were removed, which left a short list of 82. A further consistency check of the remaining schemes on the shortlist was also completed to ensure that no important and necessary complementary schemes were missing, and there was no clear conflicts or incompatibility among the selected schemes.
Figures 4.3 and 4.4 further illustrate how the longlist of 97 individual schemes were taken through the 3-stage sifting and narrowed down to a high scenario shortlist of 82 individual schemes.
25 24
1 2 3 4 5 CC Corridor
Stage 1 Stage 2 Stage 3
15
18
9
17
11
15
18
9
17
9
11
16
8
17
21
9
0
5
10
15
20
25
Figure 4-3 – How number of schemes were sifted by corridor at each stage
Figure 4-3 shows the number of schemes after each stage for each corridor. Stage 1 is Strategic Fit, Stage 2 considers whether the scheme meets the Minimum Deliverability, Affordability & VfM score and Stage 3 considered the average score.
120
100
80
60
40
20
0 16 15 13 12
30 30 30 25
51 51 50 45
Original Stage 1 Stage 2 Stage 3
Transforming Gateways Transforming Lifestyles Transforming Mobility
Figure 4-4 – Number of schemes within the three overarching themes at each of three sifting stages
Figure 4-4 shows the total number of schemes after each stage split by the three overarching themes. For more information on schemes removed during the sifting process the full sifting Excel document is provided in Appendix 3.
91
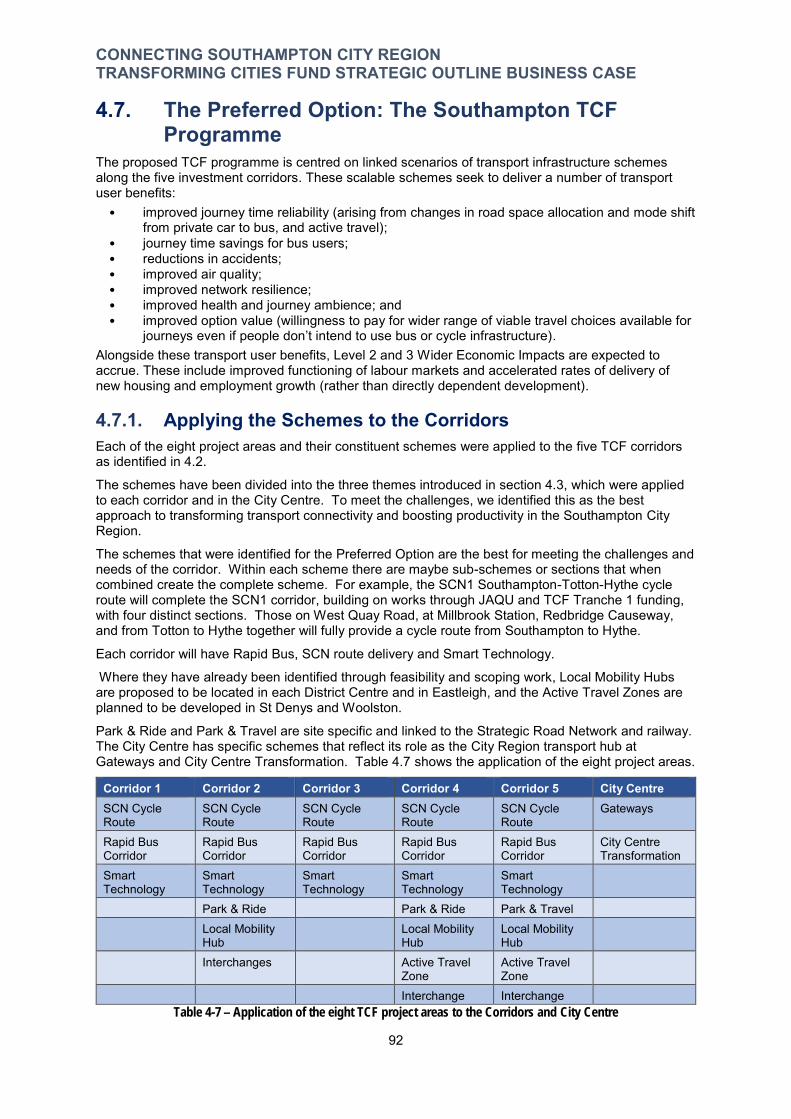
CONNECTING SOUTHAMPTON CITY REGION TRANSFORMING CITIES FUND STRATEGIC OUTLINE BUSINESS CASE
4.7. The Preferred Option: The Southampton TCF Programme
The proposed TCF programme is centred on linked scenarios of transport infrastructure schemes along the five investment corridors. These scalable schemes seek to deliver a number of transport user benefits:
• improved journey time reliability (arising from changes in road space allocation and mode shift from private car to bus, and active travel);
• journey time savings for bus users; • reductions in accidents; • improved air quality; • improved network resilience; • improved health and journey ambience; and • improved option value (willingness to pay for wider range of viable travel choices available for
journeys even if people don’t intend to use bus or cycle infrastructure). Alongside these transport user benefits, Level 2 and 3 Wider Economic Impacts are expected to accrue. These include improved functioning of labour markets and accelerated rates of delivery of new housing and employment growth (rather than directly dependent development).
4.7.1. Applying the Schemes to the Corridors Each of the eight project areas and their constituent schemes were applied to the five TCF corridors as identified in 4.2.
The schemes have been divided into the three themes introduced in section 4.3, which were applied to each corridor and in the City Centre. To meet the challenges, we identified this as the best approach to transforming transport connectivity and boosting productivity in the Southampton City Region.
The schemes that were identified for the Preferred Option are the best for meeting the challenges and needs of the corridor. Within each scheme there are maybe sub-schemes or sections that when combined create the complete scheme. For example, the SCN1 Southampton-Totton-Hythe cycle route will complete the SCN1 corridor, building on works through JAQU and TCF Tranche 1 funding, with four distinct sections. Those on West Quay Road, at Millbrook Station, Redbridge Causeway, and from Totton to Hythe together will fully provide a cycle route from Southampton to Hythe.
Each corridor will have Rapid Bus, SCN route delivery and Smart Technology.
Where they have already been identified through feasibility and scoping work, Local Mobility Hubs are proposed to be located in each District Centre and in Eastleigh, and the Active Travel Zones are planned to be developed in St Denys and Woolston.
Park & Ride and Park & Travel are site specific and linked to the Strategic Road Network and railway. The City Centre has specific schemes that reflect its role as the City Region transport hub at Gateways and City Centre Transformation. Table 4.7 shows the application of the eight project areas.
Corridor 1 Corridor 2 Corridor 3 Corridor 4 Corridor 5 City Centre SCN Cycle Route
SCN Cycle Route
SCN Cycle Route
SCN Cycle Route
SCN Cycle Route
Gateways
Rapid Bus Corridor
Rapid Bus Corridor
Rapid Bus Corridor
Rapid Bus Corridor
Rapid Bus Corridor
City Centre Transformation
Smart Technology
Smart Technology
Smart Technology
Smart Technology
Smart Technology
Park & Ride Park & Ride Park & Travel Local Mobility Hub
Local Mobility Hub
Local Mobility Hub
Interchanges Active Travel Zone
Active Travel Zone
Interchange Interchange Table 4-7 – Application of the eight TCF project areas to the Corridors and City Centre
92
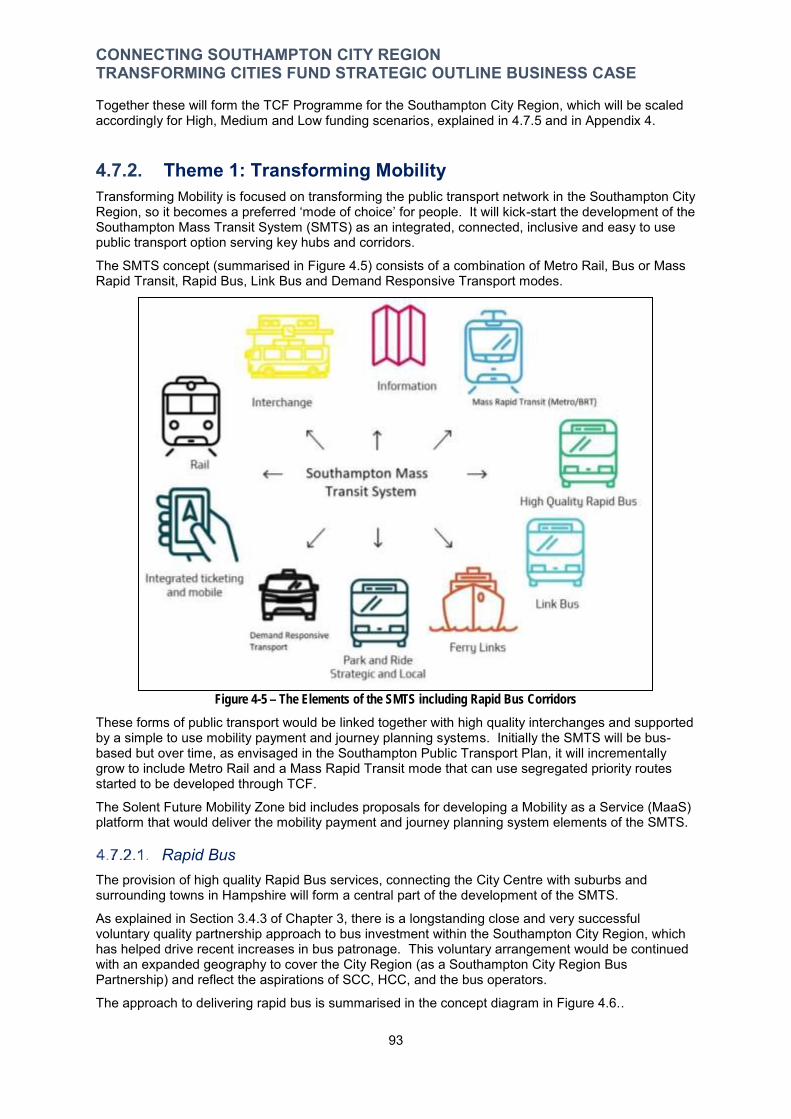
CONNECTING SOUTHAMPTON CITY REGION TRANSFORMING CITIES FUND STRATEGIC OUTLINE BUSINESS CASE
Together these will form the TCF Programme for the Southampton City Region, which will be scaled accordingly for High, Medium and Low funding scenarios, explained in 4.7.5 and in Appendix 4.
4.7.2. Theme 1: Transforming Mobility Transforming Mobility is focused on transforming the public transport network in the Southampton City Region, so it becomes a preferred ‘mode of choice’ for people. It will kick-start the development of the Southampton Mass Transit System (SMTS) as an integrated, connected, inclusive and easy to use public transport option serving key hubs and corridors.
The SMTS concept (summarised in Figure 4.5) consists of a combination of Metro Rail, Bus or Mass Rapid Transit, Rapid Bus, Link Bus and Demand Responsive Transport modes.
Figure 4-5 – The Elements of the SMTS including Rapid Bus Corridors
These forms of public transport would be linked together with high quality interchanges and supported by a simple to use mobility payment and journey planning systems. Initially the SMTS will be bus-based but over time, as envisaged in the Southampton Public Transport Plan, it will incrementally grow to include Metro Rail and a Mass Rapid Transit mode that can use segregated priority routes started to be developed through TCF.
The Solent Future Mobility Zone bid includes proposals for developing a Mobility as a Service (MaaS) platform that would deliver the mobility payment and journey planning system elements of the SMTS.
Rapid Bus The provision of high quality Rapid Bus services, connecting the City Centre with suburbs and surrounding towns in Hampshire will form a central part of the development of the SMTS.
As explained in Section 3.4.3 of Chapter 3, there is a longstanding close and very successful voluntary quality partnership approach to bus investment within the Southampton City Region, which has helped drive recent increases in bus patronage. This voluntary arrangement would be continued with an expanded geography to cover the City Region (as a Southampton City Region Bus Partnership) and reflect the aspirations of SCC, HCC, and the bus operators.
The approach to delivering rapid bus is summarised in the concept diagram in Figure 4.6..
93

CONNECTING SOUTHAMPTON CITY REGION TRANSFORMING CITIES FUND STRATEGIC OUTLINE BUSINESS CASE
Figure 4-6 - How Rapid Bus fits within the SMTS
Each Rapid Bus Corridor will see delivery of targeted road infrastructure priority measures and on-bus customer experience enhancements will both reverse the recent increases in the journey times of bus journeys and improve service reliability and punctuality.
The TCF Programme investment sought will kickstart the delivery of a series of high capacity bus corridors which follow the main arterial and radial routes from the City Centre connecting District Centres with urban centres of Totton, Hythe, North Baddesley, Chandlers Ford and Eastleigh. They will serve the growing communities of Marchwood, Fawley, Fair Oak/ Bishopstoke, Hedge End and Botley where a significant proportion of new housing is planned and proposed. The corridors will also extend to places in Hampshire beyond the City Region (such as Fareham and Winchester).
By taking a highly focussed approach to investment – introducing bus priority in locations where buses are experiencing the greatest delay and by working with operators to secure commitments to improve the quality, journey time and reliability of bus services this will improve the appeal of the bus as a viable alternative to the car. Each Rapid Bus Corridor would provide quicker, comfortable, and reliable end to end bus journey times from suburbs into the City Centre than now, offering a superior customer experience to the bus services on offer today.
There is no standard blueprint for delivery across the five TCF corridors, but they will have similar features shown in the box.
Rapid Bus Corridors – summary of common features: Each Rapid Bus Corridor as funded and delivered through the TCF Programme will include: High levels of bus priority, especially at key pinch points – either physical or virtual priority.
Physical priority will provide the bus with exclusive or priority access on sections of road. Virtual priority gives buses priority by controlling traffic flows, using traffic signals so buses are not delayed in traffic queues e.g. queue relocation (holding excess traffic at locations where it can be “stored”, and released at an appropriate time), gap generation (using signals to create gaps in traffic so buses can join a road) or bus recognition (hold lights at green when it recognises a full bus is coming);
Links with Park & Travel options such as strategic Park & Ride or at Local Interchanges; Rapid Bus (limited stop) services from the City Region that provide quicker journey times on
sections with high frequency Local Bus services;
94
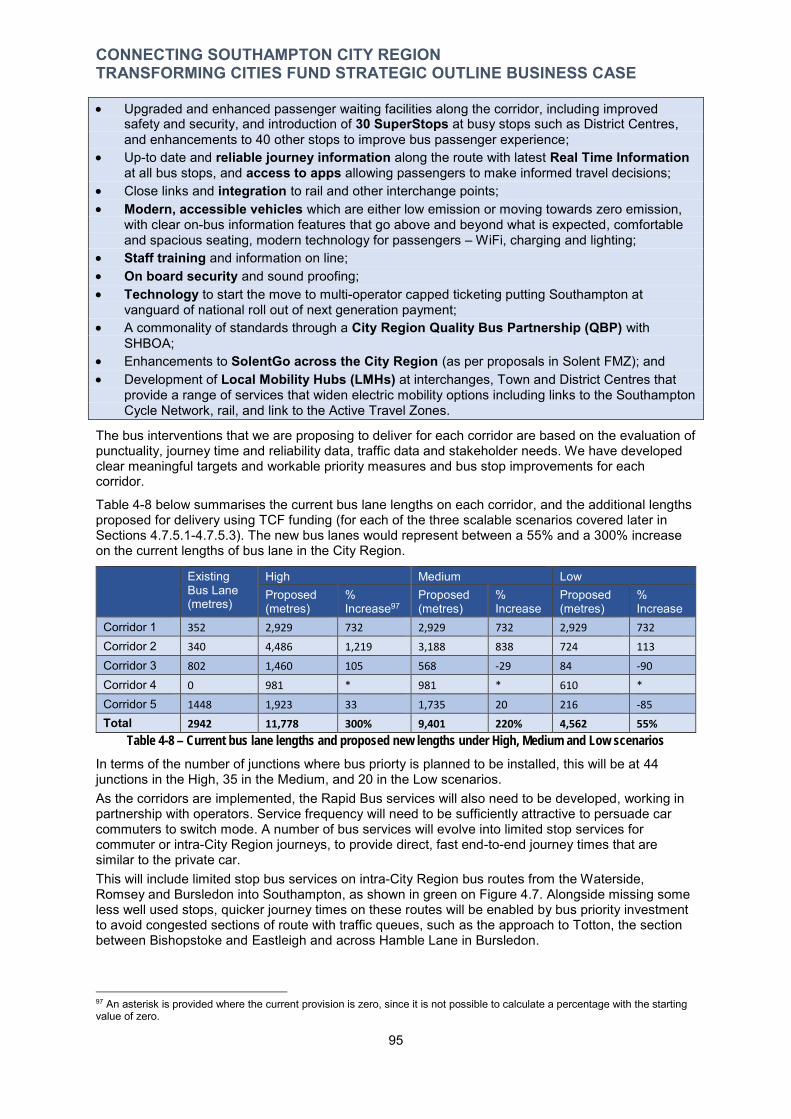
CONNECTING SOUTHAMPTON CITY REGION TRANSFORMING CITIES FUND STRATEGIC OUTLINE BUSINESS CASE
Upgraded and enhanced passenger waiting facilities along the corridor, including improved safety and security, and introduction of 30 SuperStops at busy stops such as District Centres, and enhancements to 40 other stops to improve bus passenger experience;
Up-to date and reliable journey information along the route with latest Real Time Information at all bus stops, and access to apps allowing passengers to make informed travel decisions;
Close links and integration to rail and other interchange points; Modern, accessible vehicles which are either low emission or moving towards zero emission,
with clear on-bus information features that go above and beyond what is expected, comfortable and spacious seating, modern technology for passengers – WiFi, charging and lighting;
Staff training and information on line; On board security and sound proofing; Technology to start the move to multi-operator capped ticketing putting Southampton at
vanguard of national roll out of next generation payment; A commonality of standards through a City Region Quality Bus Partnership (QBP) with
SHBOA; Enhancements to SolentGo across the City Region (as per proposals in Solent FMZ); and Development of Local Mobility Hubs (LMHs) at interchanges, Town and District Centres that
provide a range of services that widen electric mobility options including links to the Southampton Cycle Network, rail, and link to the Active Travel Zones.
The bus interventions that we are proposing to deliver for each corridor are based on the evaluation of punctuality, journey time and reliability data, traffic data and stakeholder needs. We have developed clear meaningful targets and workable priority measures and bus stop improvements for each corridor.
Table 4-8 below summarises the current bus lane lengths on each corridor, and the additional lengths proposed for delivery using TCF funding (for each of the three scalable scenarios covered later in Sections 4.7.5.1-4.7.5.3). The new bus lanes would represent between a 55% and a 300% increase on the current lengths of bus lane in the City Region.
Existing Bus Lane (metres)
High Medium Low Proposed (metres)
% Increase97
Proposed (metres)
% Increase
Proposed (metres)
% Increase
Corridor 1 352 2,929 732 2,929 732 2,929 732
Corridor 2 340 4,486 1,219 3,188 838 724 113
Corridor 3 802 1,460 105 568 -29 84 -90
Corridor 4 0 981 * 981 * 610 *
Corridor 5 1448 1,923 33 1,735 20 216 -85
Total 2942 11,778 300% 9,401 220% 4,562 55%
Table 4-8 – Current bus lane lengths and proposed new lengths under High, Medium and Low scenarios
In terms of the number of junctions where bus priorty is planned to be installed, this will be at 44 junctions in the High, 35 in the Medium, and 20 in the Low scenarios. As the corridors are implemented, the Rapid Bus services will also need to be developed, working in partnership with operators. Service frequency will need to be sufficiently attractive to persuade car commuters to switch mode. A number of bus services will evolve into limited stop services for commuter or intra-City Region journeys, to provide direct, fast end-to-end journey times that are similar to the private car. This will include limited stop bus services on intra-City Region bus routes from the Waterside, Romsey and Bursledon into Southampton, as shown in green on Figure 4.7. Alongside missing some less well used stops, quicker journey times on these routes will be enabled by bus priority investment to avoid congested sections of route with traffic queues, such as the approach to Totton, the section between Bishopstoke and Eastleigh and across Hamble Lane in Bursledon.
97 An asterisk is provided where the current provision is zero, since it is not possible to calculate a percentage with the starting value of zero.
95
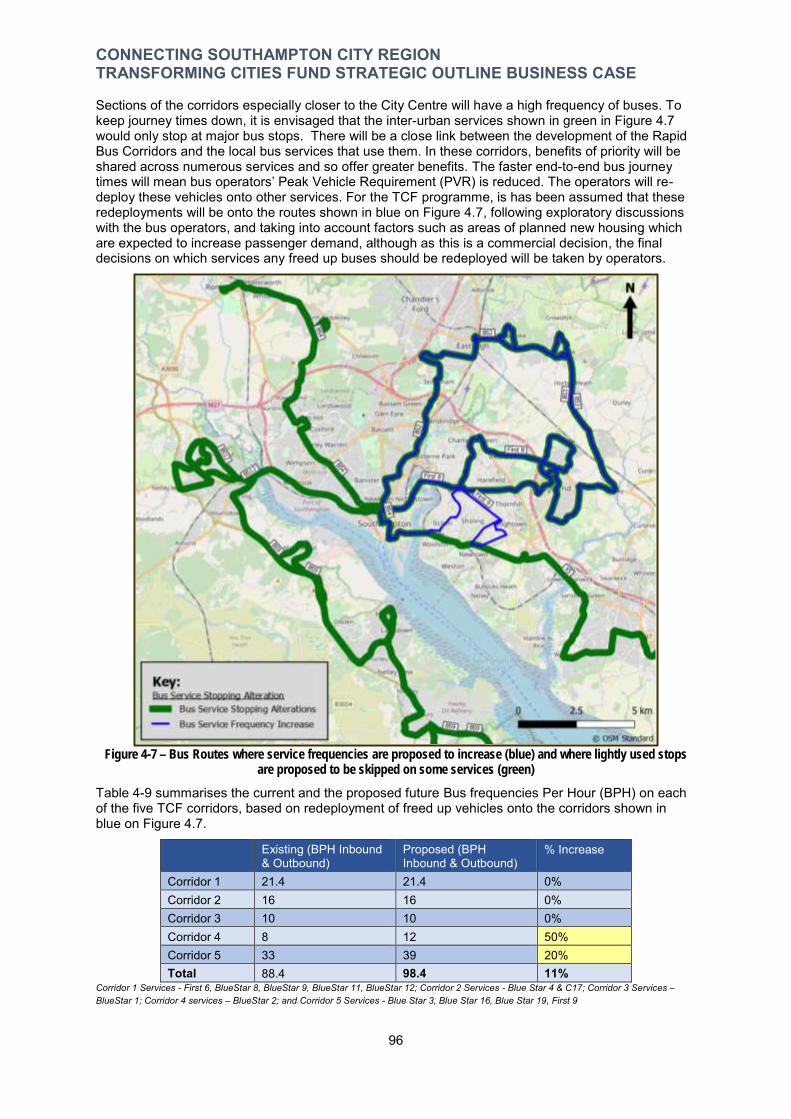
CONNECTING SOUTHAMPTON CITY REGION TRANSFORMING CITIES FUND STRATEGIC OUTLINE BUSINESS CASE
Sections of the corridors especially closer to the City Centre will have a high frequency of buses. To keep journey times down, it is envisaged that the inter-urban services shown in green in Figure 4.7 would only stop at major bus stops. There will be a close link between the development of the Rapid Bus Corridors and the local bus services that use them. In these corridors, benefits of priority will be shared across numerous services and so offer greater benefits. The faster end-to-end bus journey times will mean bus operators’ Peak Vehicle Requirement (PVR) is reduced. The operators will re-deploy these vehicles onto other services. For the TCF programme, is has been assumed that these redeployments will be onto the routes shown in blue on Figure 4.7, following exploratory discussions with the bus operators, and taking into account factors such as areas of planned new housing which are expected to increase passenger demand, although as this is a commercial decision, the final decisions on which services any freed up buses should be redeployed will be taken by operators.
Figure 4-7 – Bus Routes where service frequencies are proposed to increase (blue) and where lightly used stops are proposed to be skipped on some services (green)
Table 4-9 summarises the current and the proposed future Bus frequencies Per Hour (BPH) on each of the five TCF corridors, based on redeployment of freed up vehicles onto the corridors shown in blue on Figure 4.7.
Existing (BPH Inbound & Outbound)
Proposed (BPH Inbound & Outbound)
% Increase
Corridor 1 21.4 21.4 0% Corridor 2 16 16 0% Corridor 3 10 10 0% Corridor 4 8 12 50% Corridor 5 33 39 20% Total 88.4 98.4 11%
Corridor 1 Services - First 6, BlueStar 8, BlueStar 9, BlueStar 11, BlueStar 12; Corridor 2 Services - Blue Star 4 & C17; Corridor 3 Services – BlueStar 1; Corridor 4 services – BlueStar 2; and Corridor 5 Services - Blue Star 3, Blue Star 16, Blue Star 19, First 9
96

CONNECTING SOUTHAMPTON CITY REGION TRANSFORMING CITIES FUND STRATEGIC OUTLINE BUSINESS CASE
Table 4-9 - Current and proposed bus service AM frequencies (based on SRTM)
Table 4-10 summarises this partnership approach, setting out the investment that TCF, bus operators and LTAs would each deliver to in order to deliver an enhanced offer on Rapid Bus Corridors that will help entice commuters from the private car.
TCF Bus Operators LTAs
Bus priority lanes, bus only roads and technology
Improved service frequencies using redeployed Peak Vehicle Requirement
Bus Lane Enforcement and reduction in parking
Interchanges at Portland Terrace, Lordshill, Woolston, Bitterne, and Southampton Airport Parkway
Ongoing investment in clean and green fleet (Euro VI)
Joint marketing with Bus Operators through MyJourney
Super Stops Apprenticeships SolentGo administration
Enhanced Bus Stops Joint marketing with LAs Real Time Information back office and maintenance
Single then multi-operator capped ticketing Corridor/Service Branding Supporting administration
SolentGo Enhancements (if FMZ funding awarded)
Ticketing/Payment Enhancements - capped Bus shelter maintenance
Driver training Traffic regulation and constraint
Roles & Responsibilities set out within a new ‘Southampton City Region Bus Partnership’
Table 4-10 – Rapid Bus Corridors – A Partnership Approach to Investment
The impact of delivery of Rapid Bus Corridor investment on bus journey times have been calculated for each TCF corridor. The results for the high funding scenario are summarised in Table 4.11.
HIGH Bus Journey Time Savings (mm:ss) Corridor Per service inbound Per service outbound
Western 1 02:10 02:02 Shirley 2 06:39 04:48 Northern 3 00:55 00:54 Portswood 4 03:25 03:30 Hedge End 02:38 01:35 Thornhill 5 02:36 01:35 Bursledon 02:34 02:34
Table 4-11- Calculated Journey Time Savings per bus journey
The Rapid Bus Corridors will connect the new areas of significant planned housing growth in Fawley, Marchwood, Totton, Bishopstoke, Fair Oak, Horton Heath, Botley and Hedge End to Southampton and connect to the major employment hubs. This will ensure that there is a high quality public transport offer in place to expand the reach of business’ labour markets, support greater agglomeration and ensure that the additional highway trips the are forecast to be created are of a lower order of magnitude, helping reduce expected congestion and pollution levels.
Park & Ride The development of strategic Park & Ride has been a long-term policy ambition for Southampton City Region. Currently there are not any strategic Park & Ride services available for general public use for Southampton or Eastleigh. There are four Park & Ride sites operating in Winchester – where this provision of long-stay parking on the edge of the city helps reduce congestion in the historic core of the City Centre and serves the main hospital. There are a small number of employer operated shuttle Park & Ride schemes for staff use in Southampton and Eastleigh – that operate at peak times. There is a considerable annual cost to businesses of providing these services.
Intercepting trips at the urban fringe transferring them to public transport reduces the number of trips coming into the City Centre and needs to be supported by priority for buses and traffic and management of demand for long-stay parking in central areas. It is recognised that delivery of attractive purpose built Park & Ride facilities including car parks are expensive to implement. Once
97

CONNECTING SOUTHAMPTON CITY REGION TRANSFORMING CITIES FUND STRATEGIC OUTLINE BUSINESS CASE
such sites have been built, the bus services that connect them to town or City Centres then often require ongoing revenue support.
Currently there is a plentiful supply of affordable long-stay car parking available within Southampton City Centre. Previous feasibility studies suggested that the limited existing bus priority provision would mean any Park & Ride bus journey time into the City Centre would take between 30-35 minutes at peak times. A journey time not likely to prove attractive to commuters. This means that currently, there is little incentive for car commuters into Southampton to break their journey and utilise a Park & Ride service, even if such an option was available. The Southampton Public Transport Plan envisages that Park & Ride will form a key component of the SMTS for both bus and rail – strategically and locally.
To make Park & Ride viable for Southampton, we are proposing a different approach. We are working collaboratively with UHS Trust to promote Park & Ride as a way of reducing congestion, parking pressures and missed appointments at University Hospital Southampton. UHS Trust is encouraging staff to make use of a dedicated off-site Park & Ride facilities. The case study box and Map 4.3 explains the UHS Trust’s plans for a staff Park & Ride facility at Southampton West and summarises how TCF investment will ensure that the site is well connected to the hospital campus.
Map 4.3 – Southampton West P&R – to University Hospital Southampton Campus
98
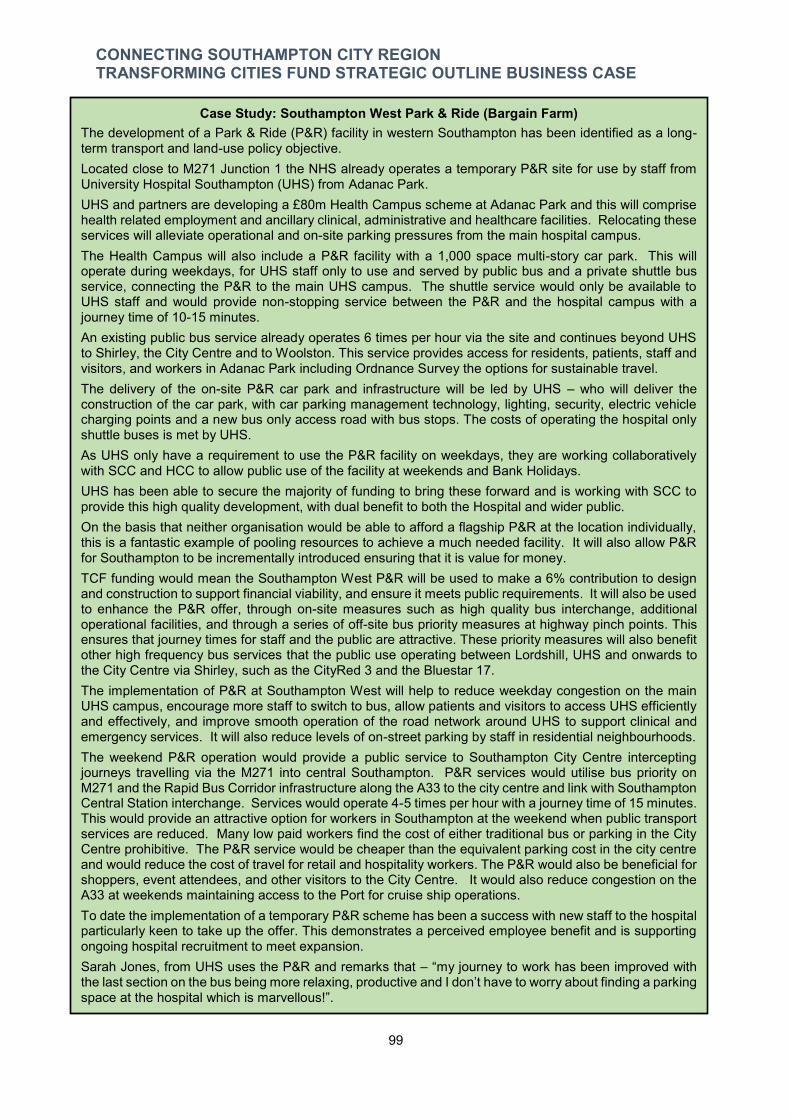
CONNECTING SOUTHAMPTON CITY REGION TRANSFORMING CITIES FUND STRATEGIC OUTLINE BUSINESS CASE
Case Study: Southampton West Park & Ride (Bargain Farm) The development of a Park & Ride (P&R) facility in western Southampton has been identified as a long-term transport and land-use policy objective. Located close to M271 Junction 1 the NHS already operates a temporary P&R site for use by staff from University Hospital Southampton (UHS) from Adanac Park. UHS and partners are developing a £80m Health Campus scheme at Adanac Park and this will comprise health related employment and ancillary clinical, administrative and healthcare facilities. Relocating these services will alleviate operational and on-site parking pressures from the main hospital campus. The Health Campus will also include a P&R facility with a 1,000 space multi-story car park. This will operate during weekdays, for UHS staff only to use and served by public bus and a private shuttle bus service, connecting the P&R to the main UHS campus. The shuttle service would only be available to UHS staff and would provide non-stopping service between the P&R and the hospital campus with a journey time of 10-15 minutes. An existing public bus service already operates 6 times per hour via the site and continues beyond UHS to Shirley, the City Centre and to Woolston. This service provides access for residents, patients, staff and visitors, and workers in Adanac Park including Ordnance Survey the options for sustainable travel. The delivery of the on-site P&R car park and infrastructure will be led by UHS – who will deliver the construction of the car park, with car parking management technology, lighting, security, electric vehicle charging points and a new bus only access road with bus stops. The costs of operating the hospital only shuttle buses is met by UHS. As UHS only have a requirement to use the P&R facility on weekdays, they are working collaboratively with SCC and HCC to allow public use of the facility at weekends and Bank Holidays. UHS has been able to secure the majority of funding to bring these forward and is working with SCC to provide this high quality development, with dual benefit to both the Hospital and wider public. On the basis that neither organisation would be able to afford a flagship P&R at the location individually, this is a fantastic example of pooling resources to achieve a much needed facility. It will also allow P&R for Southampton to be incrementally introduced ensuring that it is value for money. TCF funding would mean the Southampton West P&R will be used to make a 6% contribution to design and construction to support financial viability, and ensure it meets public requirements. It will also be used to enhance the P&R offer, through on-site measures such as high quality bus interchange, additional operational facilities, and through a series of off-site bus priority measures at highway pinch points. This ensures that journey times for staff and the public are attractive. These priority measures will also benefit other high frequency bus services that the public use operating between Lordshill, UHS and onwards to the City Centre via Shirley, such as the CityRed 3 and the Bluestar 17. The implementation of P&R at Southampton West will help to reduce weekday congestion on the main UHS campus, encourage more staff to switch to bus, allow patients and visitors to access UHS efficiently and effectively, and improve smooth operation of the road network around UHS to support clinical and emergency services. It will also reduce levels of on-street parking by staff in residential neighbourhoods. The weekend P&R operation would provide a public service to Southampton City Centre intercepting journeys travelling via the M271 into central Southampton. P&R services would utilise bus priority on M271 and the Rapid Bus Corridor infrastructure along the A33 to the city centre and link with Southampton Central Station interchange. Services would operate 4-5 times per hour with a journey time of 15 minutes. This would provide an attractive option for workers in Southampton at the weekend when public transport services are reduced. Many low paid workers find the cost of either traditional bus or parking in the City Centre prohibitive. The P&R service would be cheaper than the equivalent parking cost in the city centre and would reduce the cost of travel for retail and hospitality workers. The P&R would also be beneficial for shoppers, event attendees, and other visitors to the City Centre. It would also reduce congestion on the A33 at weekends maintaining access to the Port for cruise ship operations. To date the implementation of a temporary P&R scheme has been a success with new staff to the hospital particularly keen to take up the offer. This demonstrates a perceived employee benefit and is supporting ongoing hospital recruitment to meet expansion. Sarah Jones, from UHS uses the P&R and remarks that – “my journey to work has been improved with the last section on the bus being more relaxing, productive and I don’t have to worry about finding a parking space at the hospital which is marvellous!”.
99
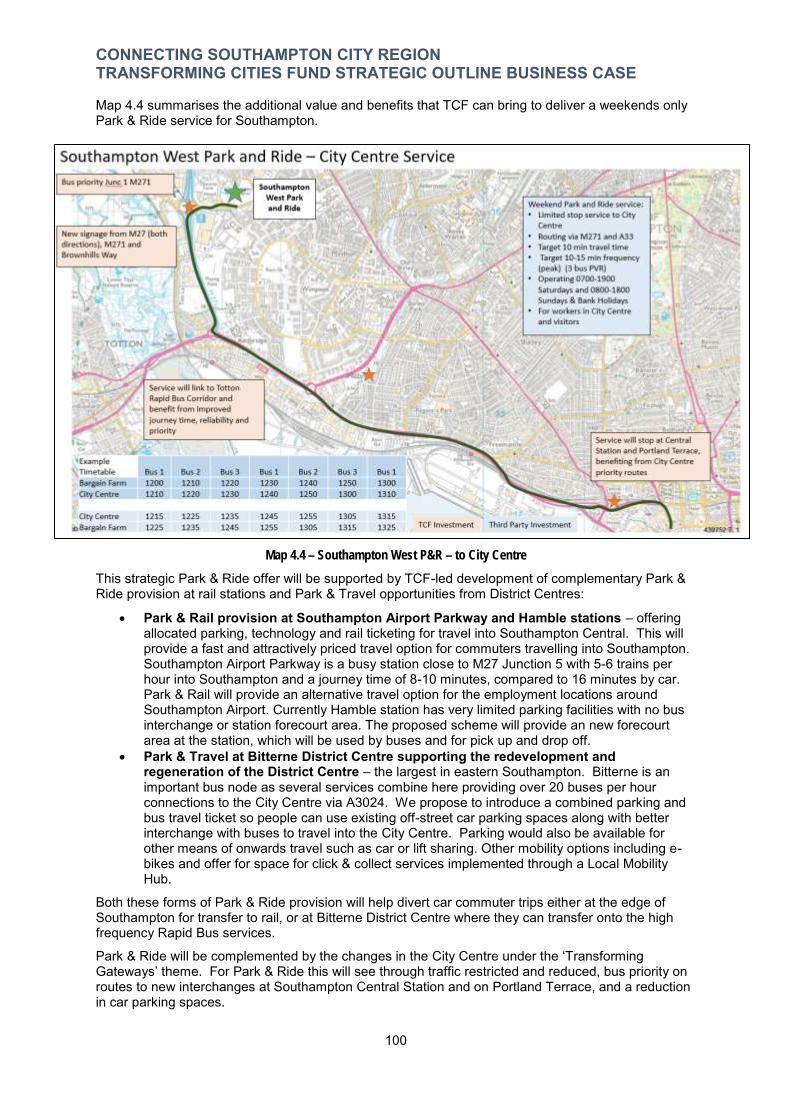
CONNECTING SOUTHAMPTON CITY REGION TRANSFORMING CITIES FUND STRATEGIC OUTLINE BUSINESS CASE
Map 4.4 summarises the additional value and benefits that TCF can bring to deliver a weekends only Park & Ride service for Southampton.
Map 4.4 – Southampton West P&R – to City Centre
This strategic Park & Ride offer will be supported by TCF-led development of complementary Park & Ride provision at rail stations and Park & Travel opportunities from District Centres:
Park & Rail provision at Southampton Airport Parkway and Hamble stations – offering allocated parking, technology and rail ticketing for travel into Southampton Central. This will provide a fast and attractively priced travel option for commuters travelling into Southampton. Southampton Airport Parkway is a busy station close to M27 Junction 5 with 5-6 trains per hour into Southampton and a journey time of 8-10 minutes, compared to 16 minutes by car. Park & Rail will provide an alternative travel option for the employment locations around Southampton Airport. Currently Hamble station has very limited parking facilities with no bus interchange or station forecourt area. The proposed scheme will provide an new forecourt area at the station, which will be used by buses and for pick up and drop off.
Park & Travel at Bitterne District Centre supporting the redevelopment and regeneration of the District Centre – the largest in eastern Southampton. Bitterne is an important bus node as several services combine here providing over 20 buses per hour connections to the City Centre via A3024. We propose to introduce a combined parking and bus travel ticket so people can use existing off-street car parking spaces along with better interchange with buses to travel into the City Centre. Parking would also be available for other means of onwards travel such as car or lift sharing. Other mobility options including e-bikes and offer for space for click & collect services implemented through a Local Mobility Hub.
Both these forms of Park & Ride provision will help divert car commuter trips either at the edge of Southampton for transfer to rail, or at Bitterne District Centre where they can transfer onto the high frequency Rapid Bus services.
Park & Ride will be complemented by the changes in the City Centre under the ‘Transforming Gateways’ theme. For Park & Ride this will see through traffic restricted and reduced, bus priority on routes to new interchanges at Southampton Central Station and on Portland Terrace, and a reduction in car parking spaces.
100

CONNECTING SOUTHAMPTON CITY REGION TRANSFORMING CITIES FUND STRATEGIC OUTLINE BUSINESS CASE
Local Mobility Hubs Located in Town or District Centres or at transport interchange hubs, a Local Mobility Hub (LMH) will be a single place where a range of mobility options, services and facilities are available in a convenient location. They provide the opportunity for people who do not have access to their own car or only have one vehicle to access a vehicle. They can also be used by those that want to make cleaner trips using an electric vehicle, bike or cargo bike for work, business or leisure. They would be located in Town or District Centres because there are a range of complementary services are already available and are destinations where people can easily get to by public transport or walk to. Those attached, or in close proximity, to one of the Rapid Bus Corridor main Super Stops or Interchanges would enable people to use them as local Park & Travel points, breaking journeys or as a convenient point where car-sharers can meet.
A LMH will offer a range of mobility options from e-vehicle hire through a Car Club (car or van), e-bike (normal and cargo), EV charging points, public transport through the Super Stops or rail stations, cycle parking, taxis, and lift/car share spaces. They will also have facilities such as cafes or ‘pop-up’ retail units, all linked together through high quality public realm and streetscape. They will also act as micro-consolidation points with ‘click & collect’ facilities for a range of services such as parcels, shopping or dry cleaning. Figure 4.8 illustrates how the concept of a Local Mobility Hub would work for different people.
Figure 4-8 – Concept of a Future Mobility Zone and fit with existing mobility services
This scenario will provide the infrastructure to set up LMHs in Eastleigh Town Centre and at each of the District Centres in Southampton (Lordshill, Shirley, Portswood, Bitterne & Woolston). The six LMHs will be adjacent to Rapid Bus and SCN corridors to maximise inter-mobility connections, with the one in Eastleigh Town Centre adjacent to the rail and bus stations.
We are also proposing to deliver Travel Hubs, that although less comprehensive, would operate along similar lines at Southampton Airport Parkway, St Denys, and Swaythling stations.
Our LMH proposals link with the Solent Mobility Zone (SMZ) proposal to the Future Mobility Zone Fund. LMHs would act as focal points and provide space and infrastructure for several projects including Bike/ e-Bike Share, Demand Responsive Transit, Last-Mile Logistics and Micro Consolidation. Whilst the SMZ programme (if funded) would considerably increase the role and activities supported by LMHs, our LMH proposals would be viable and beneficial even in absence of FMZ funding for enhancements.
101
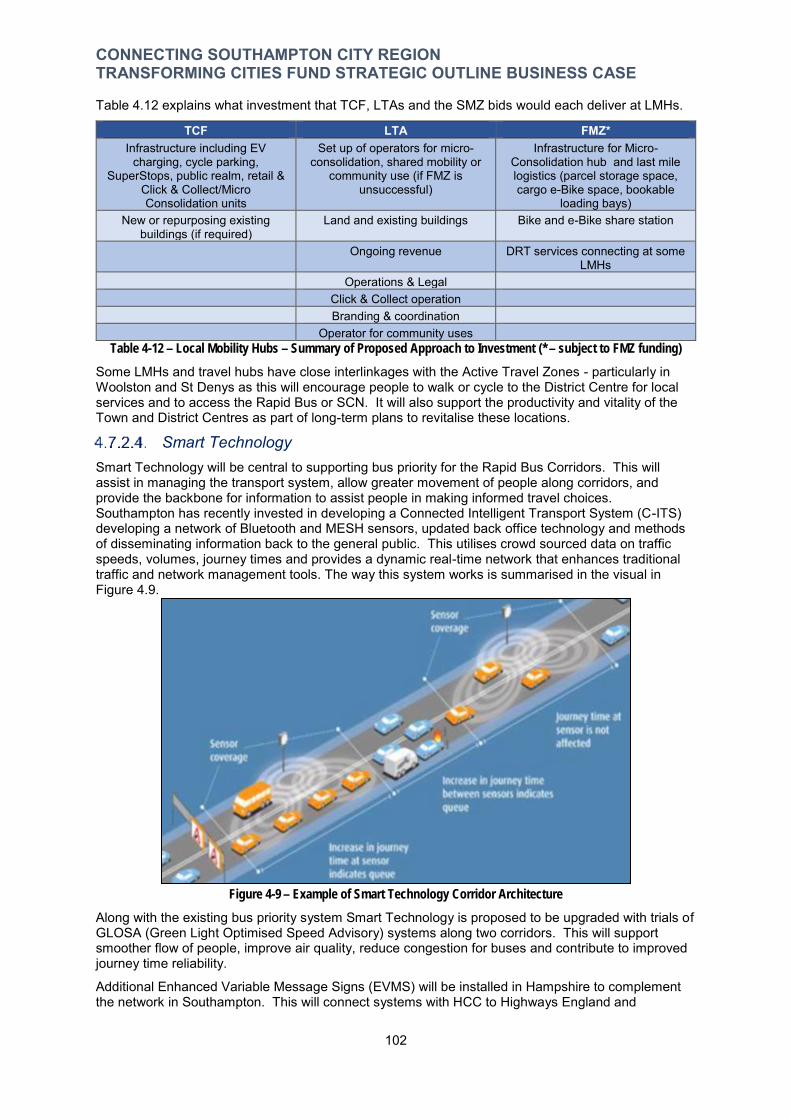
CONNECTING SOUTHAMPTON CITY REGION TRANSFORMING CITIES FUND STRATEGIC OUTLINE BUSINESS CASE
Table 4.12 explains what investment that TCF, LTAs and the SMZ bids would each deliver at LMHs.
TCF LTA FMZ* Infrastructure including EV
charging, cycle parking, SuperStops, public realm, retail &
Click & Collect/Micro Consolidation units
Set up of operators for micro-consolidation, shared mobility or
community use (if FMZ is unsuccessful)
Infrastructure for Micro-Consolidation hub and last mile logistics (parcel storage space, cargo e-Bike space, bookable
loading bays) New or repurposing existing
buildings (if required) Land and existing buildings Bike and e-Bike share station
Ongoing revenue DRT services connecting at some LMHs
Operations & Legal Click & Collect operation Branding & coordination
Operator for community uses Table 4-12 – Local Mobility Hubs – Summary of Proposed Approach to Investment (* – subject to FMZ funding)
Some LMHs and travel hubs have close interlinkages with the Active Travel Zones - particularly in Woolston and St Denys as this will encourage people to walk or cycle to the District Centre for local services and to access the Rapid Bus or SCN. It will also support the productivity and vitality of the Town and District Centres as part of long-term plans to revitalise these locations.
Smart Technology Smart Technology will be central to supporting bus priority for the Rapid Bus Corridors. This will assist in managing the transport system, allow greater movement of people along corridors, and provide the backbone for information to assist people in making informed travel choices. Southampton has recently invested in developing a Connected Intelligent Transport System (C-ITS) developing a network of Bluetooth and MESH sensors, updated back office technology and methods of disseminating information back to the general public. This utilises crowd sourced data on traffic speeds, volumes, journey times and provides a dynamic real-time network that enhances traditional traffic and network management tools. The way this system works is summarised in the visual in Figure 4.9.
Figure 4-9 – Example of Smart Technology Corridor Architecture
Along with the existing bus priority system Smart Technology is proposed to be upgraded with trials of GLOSA (Green Light Optimised Speed Advisory) systems along two corridors. This will support smoother flow of people, improve air quality, reduce congestion for buses and contribute to improved journey time reliability.
Additional Enhanced Variable Message Signs (EVMS) will be installed in Hampshire to complement the network in Southampton. This will connect systems with HCC to Highways England and
102

CONNECTING SOUTHAMPTON CITY REGION TRANSFORMING CITIES FUND STRATEGIC OUTLINE BUSINESS CASE
Portsmouth City Council systems to provide wider coverage beyond the City Region. In the City Centre EVMS will be used to direct people to the most appropriate car park to minimise unnecessary movements hindering buses.
Smart Technology will support the Rapid Bus network with targeted technology improvements at junctions, additional Bluetooth sensors for more granularity of journey times, and trialling of new sensors. These will monitor capacity of buses to provide bus priority for not just late running buses but also depending on/taking into account number of passengers on board. Table 4.13 below summarises how TCF investment will be complemented by investment by the two Local Transport Authorities in other Smart Technology measures.
TCF investment Complementary LTA investment Investment for smart technology sensors and
network Existing Bluetooth sensor network and DATAEXII links
Additional EVMS signs in Hampshire and Southampton
Common protocol for messaging and bus priority
Liaision with bus operators on bus priority and GLOSA Table 4-13 - Summary of Proposed Approach to Investment in Smart Technology
4.7.3. Theme 2: Transforming Lifestyles Transforming Lifestyles is centred on providing people with the opportunity to travel actively to work by providing improved door-to-door active travel connections. Investment in active travel – walking and cycling - has benefits in improving productivity by reducing absenteeism through a healthier and more engaged workforce, reduced air pollution and with safe, connected and attractive facilities to generate modal shift.
Transforming Lifestyles will look to accelerate the delivery of the Southampton Cycle Network (SCN) towards completing 80km of the network on radial and cross city cycle corridors. It will also develop the concept of Active Travel Zones (ATZs) where working with the local community to design and change the places they live in. They will have the aim of creating safe, direct and easy cycle and walking links from people’s front doors to the SCN and the Rapid Bus Corridors. This ensures that the connectivity is not just restricted to the corridors but will help people to access the facilities and they will become aware of them through promotion. This goes alongside the existing My Journey behaviour change programme already running in Southampton and Hampshire.
Southampton Cycle Network The Southampton Cycle Network (SCN) was proposed in the Southampton Cycle Strategy 2017-2027 as a network of strategic and local cycle routes. The Strategy has a target to increase the numbers of people cycling by 10% on each corridor each year. The SCN will consist of high quality, safe, connected and segregated corridors from Southampton City Centre out into Hampshire, connecting to Totton, North Baddesley, Chandlers Ford, Eastleigh, Hedge End, Bursledon and Hamble.
It will connect the City Centre with major employment hubs, places where people live and with schools, and will provide an orbital cycle route connecting the corridors together.
There are different tiers of the SCN, together form a complete network intended to enable a large proportion of the 49% of journeys made by car under 3 miles to switch to cycling. The tiers are:
Cycle Freeway – highest quality of cycle route with segregated facilities. Freeways are proposed for (and in some locations under construction) along the arterial routes where there are high volumes of cycling already. They are designed to be safe and continuous, with wayfinding, cycle parking, and maintenance hubs along the route;
Cycle Cityway – these support the main Freeways and provide connections through residential areas to local destinations such as schools, employment areas, and local shops. They will have some degree of segregation or use traffic reduction methods to make roads suitable for cycling along; and
Cycle Quietway – a network of routes and roads in residential areas that enable connections from people’s front doors to the City and Freeways. The roll-out of Quietways will make use of schemes to reduce through traffic and quieten streets to
103
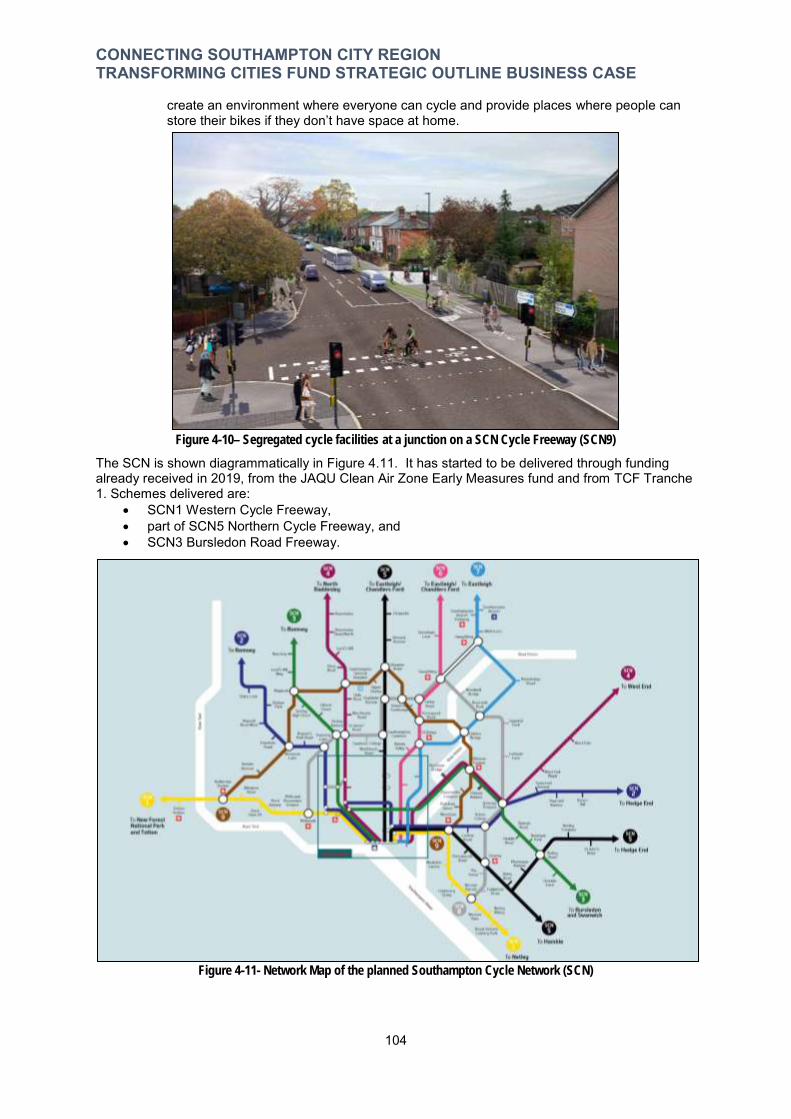
CONNECTING SOUTHAMPTON CITY REGION TRANSFORMING CITIES FUND STRATEGIC OUTLINE BUSINESS CASE
create an environment where everyone can cycle and provide places where people can store their bikes if they don’t have space at home.
Figure 4-10– Segregated cycle facilities at a junction on a SCN Cycle Freeway (SCN9)
The SCN is shown diagrammatically in Figure 4.11. It has started to be delivered through funding already received in 2019, from the JAQU Clean Air Zone Early Measures fund and from TCF Tranche 1. Schemes delivered are:
SCN1 Western Cycle Freeway, part of SCN5 Northern Cycle Freeway, and SCN3 Bursledon Road Freeway.
Figure 4-11- Network Map of the planned Southampton Cycle Network (SCN)
104

CONNECTING SOUTHAMPTON CITY REGION TRANSFORMING CITIES FUND STRATEGIC OUTLINE BUSINESS CASE
Through TCF we will look to complete 80km of the SCN with high quality safe and direct cycle facilities to make cycling a daily norm. TCF funding will accelerate the completion of the following SCN routes, which complements investment in the sections already under construction:
SCN1 from Totton to Hythe; SCN2 from Bitterne to Hedge End; SCN3 from Northam to Bitterne, and Thornhill to the River Hamble at Bursledon; SCN4 from UHS north to Lordshill and North Baddelsey; SCN5 from Chilworth to Chandler’s Ford; SCN5 from City Centre to Hamble; SCN6 from City Centre to Eastleigh, including a Quietway network around Royal South Hants
Hospital; SCN8 Orbital Cycle route from Redbridge to Southampton Airport via UHS and University of
Southampton – including sections funded by the University; and Improved cycle links between Chilworth and North Baddesley, Romsey, Hamble and
Winchester stations.
Table 4-14 shows the current and proposed new cycle lane lengths that TCF funding would help to deliver (for each of the three scalable scenarios covered later in Sections 4.7.5.1-4.7.5.3). This ranges from between a 72% and 127% increase of provision above current levels. Note that this does not include cycle infrastructure planned for the Active Travel Zones, Local Mobility Hubs or cycle-based junction improvements.
Existing cycle infrastructure (metres)
High Medium Low Proposed (metres)
% Increase
Proposed (metres)
% Increase
Proposed (metres)
% Increase
Corridor 1 8,524 12,212 143% 12,060 141% 12,060 141% Corridor 2 963 12,590 1307% 11,570 1201% 0 0% Corridor 3 8,327 4,200 50% 3,490 42% 1,430 17% Corridor 4 4,038 6,610 164% 6,610 164% 6,610 164% Corridor 5 5,066 9,200 182% 9,200 182% 5,290 104% City Centre 9,836 1,986 20% 1,444 15% 993 10% Total 36,754 46,798 127% 44,374 121% 26,383 72%
Table 4-14 – Summary of lengths of new cycle infrastructure planned through TCF compared to existing
The SCN routes are closely linked with the proposed Active Travel Zones in St Denys and Woolston, and the six proposed Local Mobility Hubs. They will also connect with rail and bus and be an integral part of the approach for transforming the City Centre. Since the completion of SCN1 earlier in 2019, this route has seen a 20% increase in the number of people cycling on it compared to the previous year. The opening of SCN5 Inner Avenue segregated scheme has seen over 1,000 cycle trips made over a 12hr period. This suggests that taking a whole corridor approach will achieve similar transformational levels of change. Along with the physical development of SCN routes, additional cycle parking, Legible Cycling wayfinding and the My Journey programme will ensure that this aspiration, and the cycling outcome for TCF is achieved. The proposed investment in cycling from TCF will be complemented by a range of planned investment locally. This is summarised in Table 4.15.
TCF Investment Local Complementary Investment SCN Cycle Freeways Legible Cycling Wayfinding SCN Quietways Improved Cycle Parking
Cycle counters Cycle training and confidence building led-rides My Journey Cycle marketing campaigns Other SCN cycle routes
Table 4-15 – How TCF Cycling Investment will be complemented by Local Investment
105
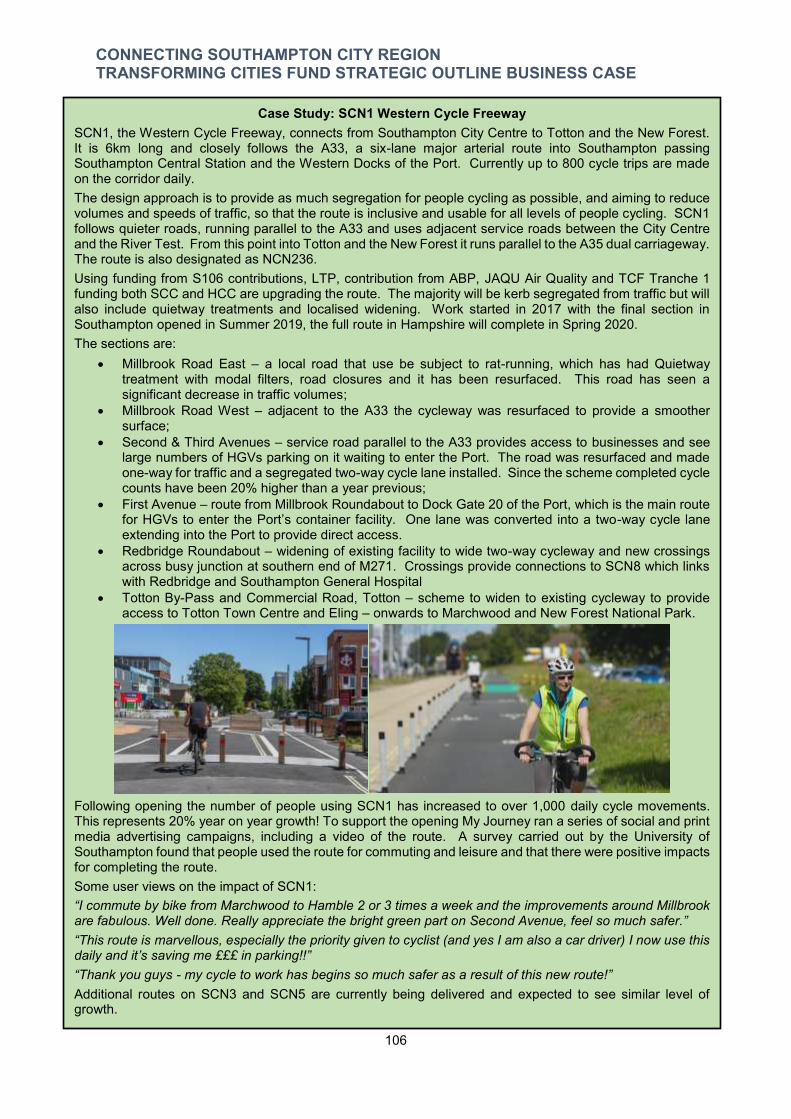
CONNECTING SOUTHAMPTON CITY REGION TRANSFORMING CITIES FUND STRATEGIC OUTLINE BUSINESS CASE
Case Study: SCN1 Western Cycle Freeway SCN1, the Western Cycle Freeway, connects from Southampton City Centre to Totton and the New Forest. It is 6km long and closely follows the A33, a six-lane major arterial route into Southampton passing Southampton Central Station and the Western Docks of the Port. Currently up to 800 cycle trips are made on the corridor daily. The design approach is to provide as much segregation for people cycling as possible, and aiming to reduce volumes and speeds of traffic, so that the route is inclusive and usable for all levels of people cycling. SCN1 follows quieter roads, running parallel to the A33 and uses adjacent service roads between the City Centre and the River Test. From this point into Totton and the New Forest it runs parallel to the A35 dual carriageway. The route is also designated as NCN236. Using funding from S106 contributions, LTP, contribution from ABP, JAQU Air Quality and TCF Tranche 1 funding both SCC and HCC are upgrading the route. The majority will be kerb segregated from traffic but will also include quietway treatments and localised widening. Work started in 2017 with the final section in Southampton opened in Summer 2019, the full route in Hampshire will complete in Spring 2020. The sections are:
Millbrook Road East – a local road that use be subject to rat-running, which has had Quietway treatment with modal filters, road closures and it has been resurfaced. This road has seen a significant decrease in traffic volumes;
Millbrook Road West – adjacent to the A33 the cycleway was resurfaced to provide a smoother surface;
Second & Third Avenues – service road parallel to the A33 provides access to businesses and see large numbers of HGVs parking on it waiting to enter the Port. The road was resurfaced and made one-way for traffic and a segregated two-way cycle lane installed. Since the scheme completed cycle counts have been 20% higher than a year previous;
First Avenue – route from Millbrook Roundabout to Dock Gate 20 of the Port, which is the main route for HGVs to enter the Port’s container facility. One lane was converted into a two-way cycle lane extending into the Port to provide direct access.
Redbridge Roundabout – widening of existing facility to wide two-way cycleway and new crossings across busy junction at southern end of M271. Crossings provide connections to SCN8 which links with Redbridge and Southampton General Hospital
Totton By-Pass and Commercial Road, Totton – scheme to widen to existing cycleway to provide access to Totton Town Centre and Eling – onwards to Marchwood and New Forest National Park.
Following opening the number of people using SCN1 has increased to over 1,000 daily cycle movements. This represents 20% year on year growth! To support the opening My Journey ran a series of social and print media advertising campaigns, including a video of the route. A survey carried out by the University of Southampton found that people used the route for commuting and leisure and that there were positive impacts for completing the route. Some user views on the impact of SCN1: “I commute by bike from Marchwood to Hamble 2 or 3 times a week and the improvements around Millbrook are fabulous. Well done. Really appreciate the bright green part on Second Avenue, feel so much safer.” “This route is marvellous, especially the priority given to cyclist (and yes I am also a car driver) I now use this daily and it’s saving me £££ in parking!!” “Thank you guys - my cycle to work has begins so much safer as a result of this new route!” Additional routes on SCN3 and SCN5 are currently being delivered and expected to see similar level of growth.
106

CONNECTING SOUTHAMPTON CITY REGION TRANSFORMING CITIES FUND STRATEGIC OUTLINE BUSINESS CASE
Active Travel Zones Active Travel Zones (ATZs) are proposed as creating an environment where people can make trips in their local neighbourhoods actively by walking and cycling, as opposed to driving. Identified in Connected Southampton 2040 the purpose of an ATZ is to work with the local community to develop the conditions to support people in choosing active travel modes. This supports increases in productivity, improves local air quality, support community cohesion, and reduce health inequalities.
Centred on a community hub such as school, shops, park or other focal point, an ATZ will seek a shift to moving people around rather than vehicles. This could be achieved by improving the range of choices for getting around, incentivising active travel by behaviour change measures, and making the neighbourhoods attractive places for people to live. ATZs are proposed to be in residential areas located adjacent to Rapid Bus and SCN corridors and near rail stations. ATZs take inspiration from the transformative changes in streets and places from London, Manchester, Edinburgh, Barcelona and the Netherlands. Community engagement will be an important part of developing a mix of interventions that has local support.
ATZs are based on area mobility management principles and are likely to involve introduction of measures which address issues associated with non-local traffic using residential streets. These will restrict or prevent the ability for people to drive through, and importantly encourage people to travel actively through more cycling and walking.
Infrastructure options that could be delivered as part of the ATZs are summarised in Table 4.16.
Modal filter One-way networks Parallel priority crossing
Raised entry treatments Cycleways
Road closure Point of no entry Continuous footways Build outs Shared paths
Cycle hangers Timed closures Banned turns Parklet Measures to lower speeds
Kerb management Cycle parking & hangers Play spaces Rain garden
Table 4-16 – Infrastructure options for inclusion within an ATZ
Figure 4-12 – Example of streetscape changes made within an ATZ in Waltham Forest
107
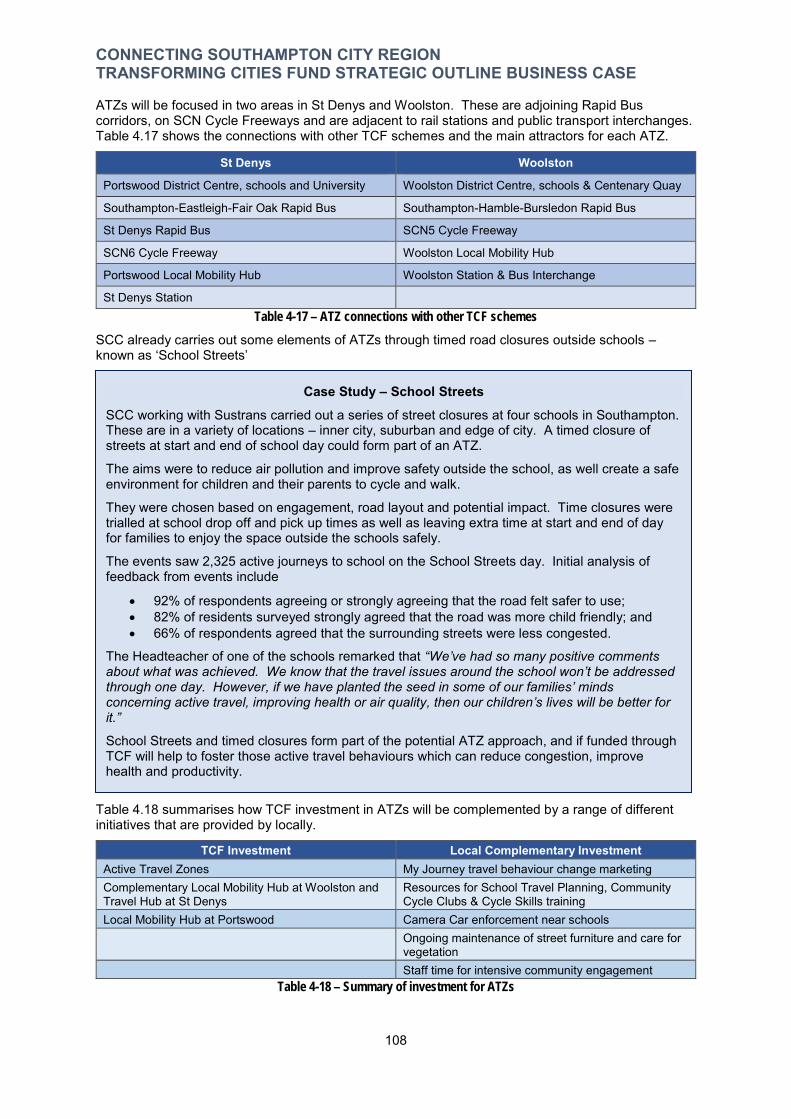
CONNECTING SOUTHAMPTON CITY REGION TRANSFORMING CITIES FUND STRATEGIC OUTLINE BUSINESS CASE
ATZs will be focused in two areas in St Denys and Woolston. These are adjoining Rapid Bus corridors, on SCN Cycle Freeways and are adjacent to rail stations and public transport interchanges. Table 4.17 shows the connections with other TCF schemes and the main attractors for each ATZ.
St Denys Woolston
Portswood District Centre, schools and University Woolston District Centre, schools & Centenary Quay
Southampton-Eastleigh-Fair Oak Rapid Bus Southampton-Hamble-Bursledon Rapid Bus
St Denys Rapid Bus SCN5 Cycle Freeway
SCN6 Cycle Freeway Woolston Local Mobility Hub
Portswood Local Mobility Hub Woolston Station & Bus Interchange
St Denys Station Table 4-17 – ATZ connections with other TCF schemes
SCC already carries out some elements of ATZs through timed road closures outside schools – known as ‘School Streets’
Case Study – School Streets SCC working with Sustrans carried out a series of street closures at four schools in Southampton. These are in a variety of locations – inner city, suburban and edge of city. A timed closure of streets at start and end of school day could form part of an ATZ.
The aims were to reduce air pollution and improve safety outside the school, as well create a safe environment for children and their parents to cycle and walk.
They were chosen based on engagement, road layout and potential impact. Time closures were trialled at school drop off and pick up times as well as leaving extra time at start and end of day for families to enjoy the space outside the schools safely.
The events saw 2,325 active journeys to school on the School Streets day. Initial analysis of feedback from events include
92% of respondents agreeing or strongly agreeing that the road felt safer to use; 82% of residents surveyed strongly agreed that the road was more child friendly; and 66% of respondents agreed that the surrounding streets were less congested.
The Headteacher of one of the schools remarked that “We’ve had so many positive comments about what was achieved. We know that the travel issues around the school won’t be addressed through one day. However, if we have planted the seed in some of our families’ minds concerning active travel, improving health or air quality, then our children’s lives will be better for it.”
School Streets and timed closures form part of the potential ATZ approach, and if funded through TCF will help to foster those active travel behaviours which can reduce congestion, improve health and productivity.
Table 4.18 summarises how TCF investment in ATZs will be complemented by a range of different initiatives that are provided by locally.
TCF Investment Local Complementary Investment Active Travel Zones My Journey travel behaviour change marketing Complementary Local Mobility Hub at Woolston and Travel Hub at St Denys
Resources for School Travel Planning, Community Cycle Clubs & Cycle Skills training
Local Mobility Hub at Portswood Camera Car enforcement near schools Ongoing maintenance of street furniture and care for vegetation Staff time for intensive community engagement
Table 4-18 – Summary of investment for ATZs
108

CONNECTING SOUTHAMPTON CITY REGION TRANSFORMING CITIES FUND STRATEGIC OUTLINE BUSINESS CASE
4.7.4. Theme 3: Transforming Gateways Gateways are important to the success of the City Region as they are the first points of contact people may have. They provide a sense of arrival and require seamless connections to destinations and other modes of transport. Having high quality public realm sets the scene for a greater emphasis on the movement of people, rather than moving vehicles. The gateways are in the City Centre or at other entry points such as Southampton Airport.
This is part of the approach set out in the City Centre Action Plan (CCAP) and Connected Southampton 2040 Transport Strategy to develop a Liveable City Centre. This means that the City Centre is the focus for major transformation and can act as a catalyst creating more productive jobs in sectors that thrive in Southampton and the Solent, and support City Centre residential development.
Southampton City Centre is the hub of the City Region’s transport network and for the TCF corridors. TCF will start the transformation of the City Centre at the main gateway of Southampton Central and routes through the heart of the City Centre along New Road and Portland Terrace. This will tie together all five TCF corridors ensuring gains are not lost once in the City Centre.
The transformation of the City Centre through TCF will complement and support SCC’s bid to the Future High Streets Fund which will continue the public realm improvements for Portland Terrace between Albion Place and Civic Centre Place, and through Bargate Street.
Gateways & Interchanges Southampton Central Station - The main gateway to the City Region is Southampton Central Station - the busiest rail station in the Solent and which 62% of buses operating in the city call. It is an important gateway for people working in the City Centre, visitors travelling to and from the Port on cruises, connections to the Isle of Wight and shoppers visiting West Quay.
As a gateway point that is highly accessible, Southampton Central is also a focus for regeneration with Nelson Gate (336 new homes, hotel and 5,100m² of commercial) to the north. To the south is the planned flagship Mayflower Quarter, with regeneration of former Toys R Us site proposed via a mixed use scheme comprising offices, a hotel and residential flats. These developments will generate new demand for rail and bus access to the area, as well as being destinations in their own right.
Southampton Central station has two entrances on the northern and southern sides of the railway. Currently connections with other modes is possible, with recent investment on the northern side of the station has created a new high quality public plaza gateway with bus stops, taxi facilities and a large cycle hub. The southern side of the station lacks the same sense of arrival, with a poorer quality look and feel with limited onwards connectivity. There are direct connections to bus and taxi but the onwards connectivity onwards into the City Centre on foot and by bike is disjointed and dominated by the dual carriageway of Western Esplanade. Focal points are hidden, and routes are indirect. A highlighted route is marked out from the station to West Quay but this currently passes the closed Toys R Us store and crosses an empty car park. Other routes require walking alongside Western Esplande to destinations such as the Port, National Express Coach Station, and the Civic Centre.
In the long-term, this quarter will change through the Mayflower Quarter development together with the redevelopment of the LeisureWorld site. As cruise patronage grows through the Port an increasing number of people will travel by train (approximately 30% of all cruise passengers arrive by public transport). These users all need to transit to/from the station via high quality routes - with the final link to the station being delivered as part of this TCF programme proposal. The ability to easily and safely transfer between rail and other modes increases the attractiveness of rail travel.
To improve this important gateway to Southampton, the forecourt area on the southern side of Southampton Central will be redeveloped. This is proposed to:
Create a new entrance to the City Centre with more public space and clear legible onward connections by bus, taxi, cycle and foot;
Create additional capacity for existing and future bus services to terminate and call, including the Southampton West Park & Ride service;
Have additional taxi facilities, cycle parking and travel hub, and information points; TCF will enable a wider masterplan for transport interchange to be delivered including
relocation of the National Express Coach Station, the downgrading of Western Esplande and wider walking and cycling connections into the Mayflower Quarter.
109
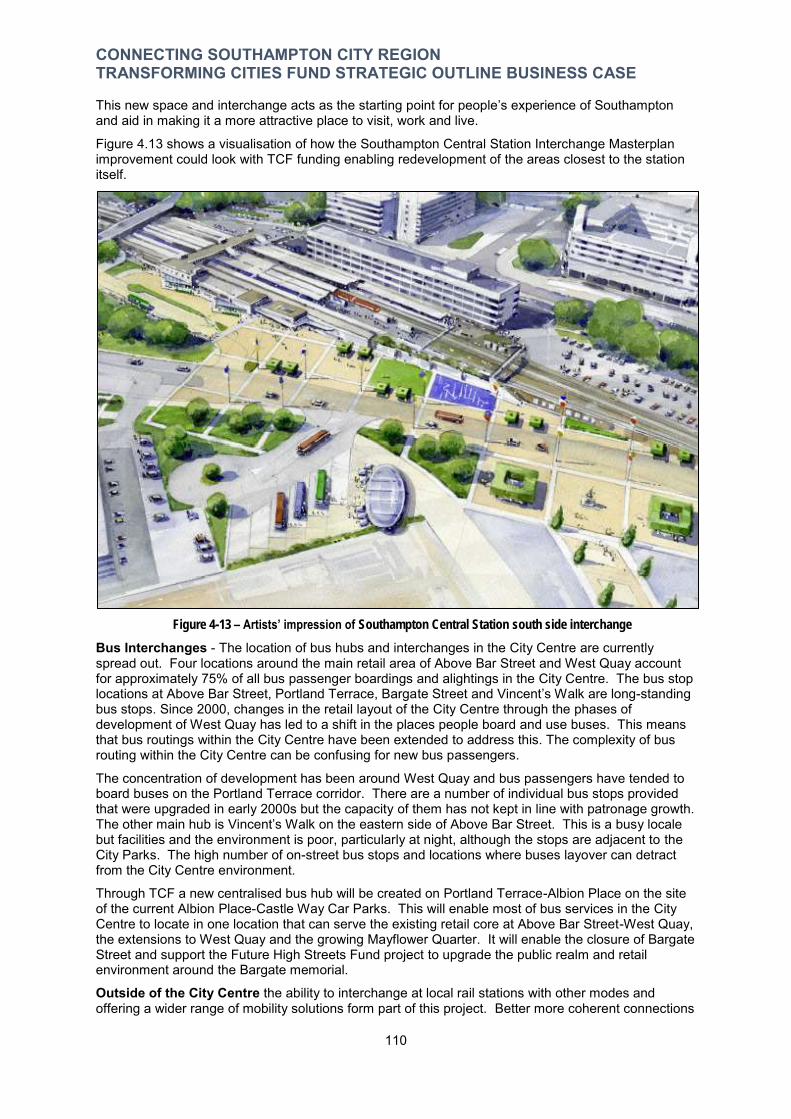
CONNECTING SOUTHAMPTON CITY REGION TRANSFORMING CITIES FUND STRATEGIC OUTLINE BUSINESS CASE
This new space and interchange acts as the starting point for people’s experience of Southampton and aid in making it a more attractive place to visit, work and live.
Figure 4.13 shows a visualisation of how the Southampton Central Station Interchange Masterplan improvement could look with TCF funding enabling redevelopment of the areas closest to the station itself.
Figure 4-13 – Artists’ impression of Southampton Central Station south side interchange
Bus Interchanges - The location of bus hubs and interchanges in the City Centre are currently spread out. Four locations around the main retail area of Above Bar Street and West Quay account for approximately 75% of all bus passenger boardings and alightings in the City Centre. The bus stop locations at Above Bar Street, Portland Terrace, Bargate Street and Vincent’s Walk are long-standing bus stops. Since 2000, changes in the retail layout of the City Centre through the phases of development of West Quay has led to a shift in the places people board and use buses. This means that bus routings within the City Centre have been extended to address this. The complexity of bus routing within the City Centre can be confusing for new bus passengers.
The concentration of development has been around West Quay and bus passengers have tended to board buses on the Portland Terrace corridor. There are a number of individual bus stops provided that were upgraded in early 2000s but the capacity of them has not kept in line with patronage growth. The other main hub is Vincent’s Walk on the eastern side of Above Bar Street. This is a busy locale but facilities and the environment is poor, particularly at night, although the stops are adjacent to the City Parks. The high number of on-street bus stops and locations where buses layover can detract from the City Centre environment.
Through TCF a new centralised bus hub will be created on Portland Terrace-Albion Place on the site of the current Albion Place-Castle Way Car Parks. This will enable most of bus services in the City Centre to locate in one location that can serve the existing retail core at Above Bar Street-West Quay, the extensions to West Quay and the growing Mayflower Quarter. It will enable the closure of Bargate Street and support the Future High Streets Fund project to upgrade the public realm and retail environment around the Bargate memorial.
Outside of the City Centre the ability to interchange at local rail stations with other modes and offering a wider range of mobility solutions form part of this project. Better more coherent connections
110
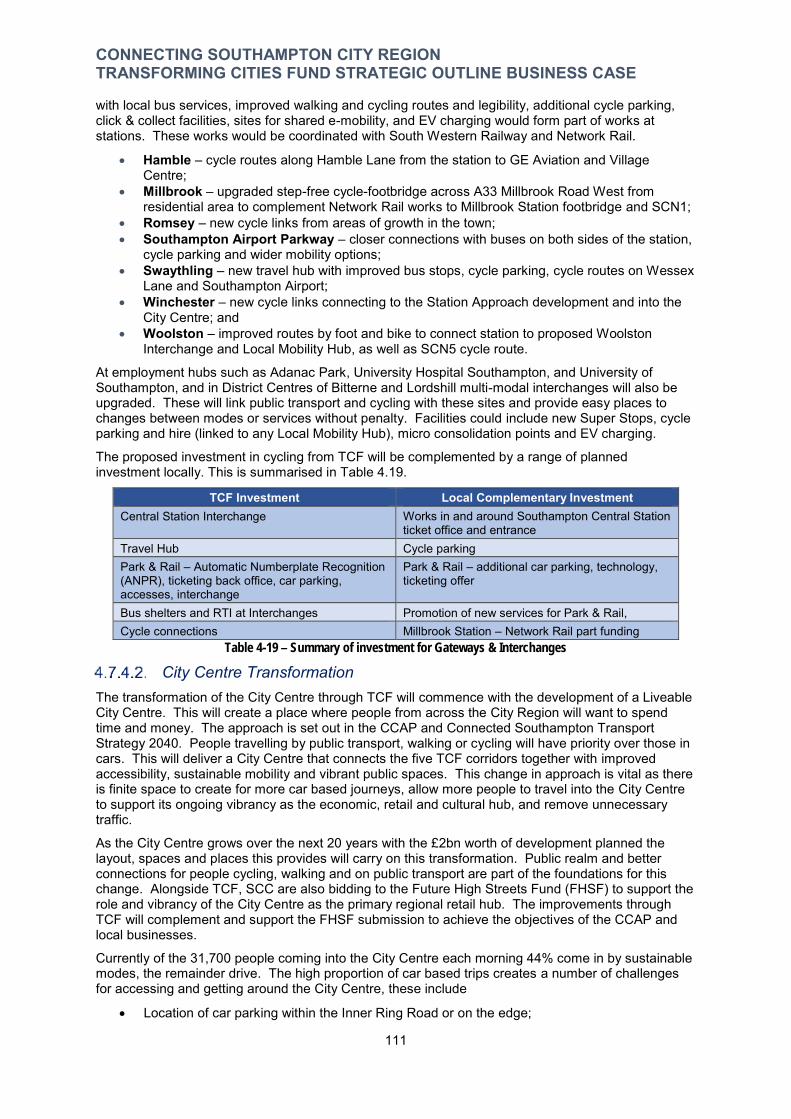
CONNECTING SOUTHAMPTON CITY REGION TRANSFORMING CITIES FUND STRATEGIC OUTLINE BUSINESS CASE
with local bus services, improved walking and cycling routes and legibility, additional cycle parking, click & collect facilities, sites for shared e-mobility, and EV charging would form part of works at stations. These works would be coordinated with South Western Railway and Network Rail.
Hamble – cycle routes along Hamble Lane from the station to GE Aviation and Village Centre;
Millbrook – upgraded step-free cycle-footbridge across A33 Millbrook Road West from residential area to complement Network Rail works to Millbrook Station footbridge and SCN1;
Romsey – new cycle links from areas of growth in the town; Southampton Airport Parkway – closer connections with buses on both sides of the station,
cycle parking and wider mobility options; Swaythling – new travel hub with improved bus stops, cycle parking, cycle routes on Wessex
Lane and Southampton Airport; Winchester – new cycle links connecting to the Station Approach development and into the
City Centre; and Woolston – improved routes by foot and bike to connect station to proposed Woolston
Interchange and Local Mobility Hub, as well as SCN5 cycle route.
At employment hubs such as Adanac Park, University Hospital Southampton, and University of Southampton, and in District Centres of Bitterne and Lordshill multi-modal interchanges will also be upgraded. These will link public transport and cycling with these sites and provide easy places to changes between modes or services without penalty. Facilities could include new Super Stops, cycle parking and hire (linked to any Local Mobility Hub), micro consolidation points and EV charging.
The proposed investment in cycling from TCF will be complemented by a range of planned investment locally. This is summarised in Table 4.19.
TCF Investment Local Complementary Investment Central Station Interchange Works in and around Southampton Central Station
ticket office and entrance Travel Hub Cycle parking Park & Rail – Automatic Numberplate Recognition (ANPR), ticketing back office, car parking, accesses, interchange
Park & Rail – additional car parking, technology, ticketing offer
Bus shelters and RTI at Interchanges Promotion of new services for Park & Rail, Cycle connections Millbrook Station – Network Rail part funding
Table 4-19 – Summary of investment for Gateways & Interchanges
City Centre Transformation The transformation of the City Centre through TCF will commence with the development of a Liveable City Centre. This will create a place where people from across the City Region will want to spend time and money. The approach is set out in the CCAP and Connected Southampton Transport Strategy 2040. People travelling by public transport, walking or cycling will have priority over those in cars. This will deliver a City Centre that connects the five TCF corridors together with improved accessibility, sustainable mobility and vibrant public spaces. This change in approach is vital as there is finite space to create for more car based journeys, allow more people to travel into the City Centre to support its ongoing vibrancy as the economic, retail and cultural hub, and remove unnecessary traffic.
As the City Centre grows over the next 20 years with the £2bn worth of development planned the layout, spaces and places this provides will carry on this transformation. Public realm and better connections for people cycling, walking and on public transport are part of the foundations for this change. Alongside TCF, SCC are also bidding to the Future High Streets Fund (FHSF) to support the role and vibrancy of the City Centre as the primary regional retail hub. The improvements through TCF will complement and support the FHSF submission to achieve the objectives of the CCAP and local businesses.
Currently of the 31,700 people coming into the City Centre each morning 44% come in by sustainable modes, the remainder drive. The high proportion of car based trips creates a number of challenges for accessing and getting around the City Centre, these include
Location of car parking within the Inner Ring Road or on the edge;
111
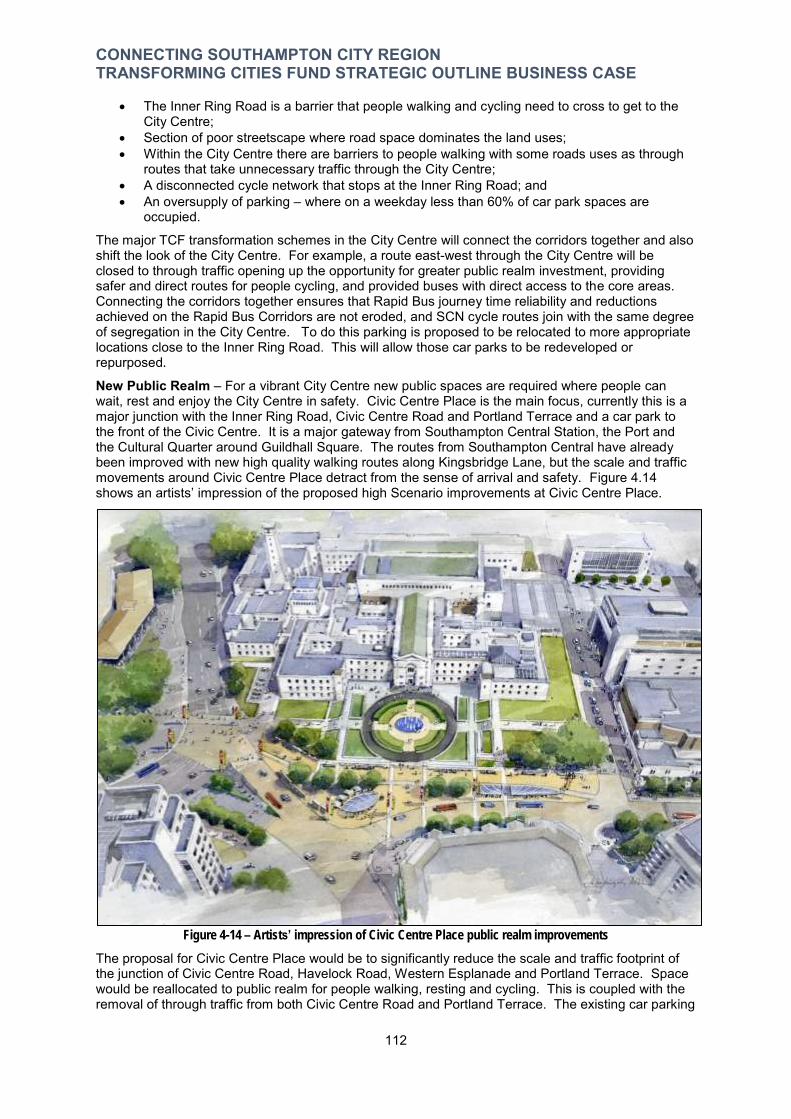
CONNECTING SOUTHAMPTON CITY REGION TRANSFORMING CITIES FUND STRATEGIC OUTLINE BUSINESS CASE
The Inner Ring Road is a barrier that people walking and cycling need to cross to get to the City Centre;
Section of poor streetscape where road space dominates the land uses; Within the City Centre there are barriers to people walking with some roads uses as through
routes that take unnecessary traffic through the City Centre; A disconnected cycle network that stops at the Inner Ring Road; and An oversupply of parking – where on a weekday less than 60% of car park spaces are
occupied.
The major TCF transformation schemes in the City Centre will connect the corridors together and also shift the look of the City Centre. For example, a route east-west through the City Centre will be closed to through traffic opening up the opportunity for greater public realm investment, providing safer and direct routes for people cycling, and provided buses with direct access to the core areas. Connecting the corridors together ensures that Rapid Bus journey time reliability and reductions achieved on the Rapid Bus Corridors are not eroded, and SCN cycle routes join with the same degree of segregation in the City Centre. To do this parking is proposed to be relocated to more appropriate locations close to the Inner Ring Road. This will allow those car parks to be redeveloped or repurposed.
New Public Realm – For a vibrant City Centre new public spaces are required where people can wait, rest and enjoy the City Centre in safety. Civic Centre Place is the main focus, currently this is a major junction with the Inner Ring Road, Civic Centre Road and Portland Terrace and a car park to the front of the Civic Centre. It is a major gateway from Southampton Central Station, the Port and the Cultural Quarter around Guildhall Square. The routes from Southampton Central have already been improved with new high quality walking routes along Kingsbridge Lane, but the scale and traffic movements around Civic Centre Place detract from the sense of arrival and safety. Figure 4.14 shows an artists’ impression of the proposed high Scenario improvements at Civic Centre Place.
Figure 4-14 – Artists’ impression of Civic Centre Place public realm improvements
The proposal for Civic Centre Place would be to significantly reduce the scale and traffic footprint of the junction of Civic Centre Road, Havelock Road, Western Esplanade and Portland Terrace. Space would be reallocated to public realm for people walking, resting and cycling. This is coupled with the removal of through traffic from both Civic Centre Road and Portland Terrace. The existing car parking
112
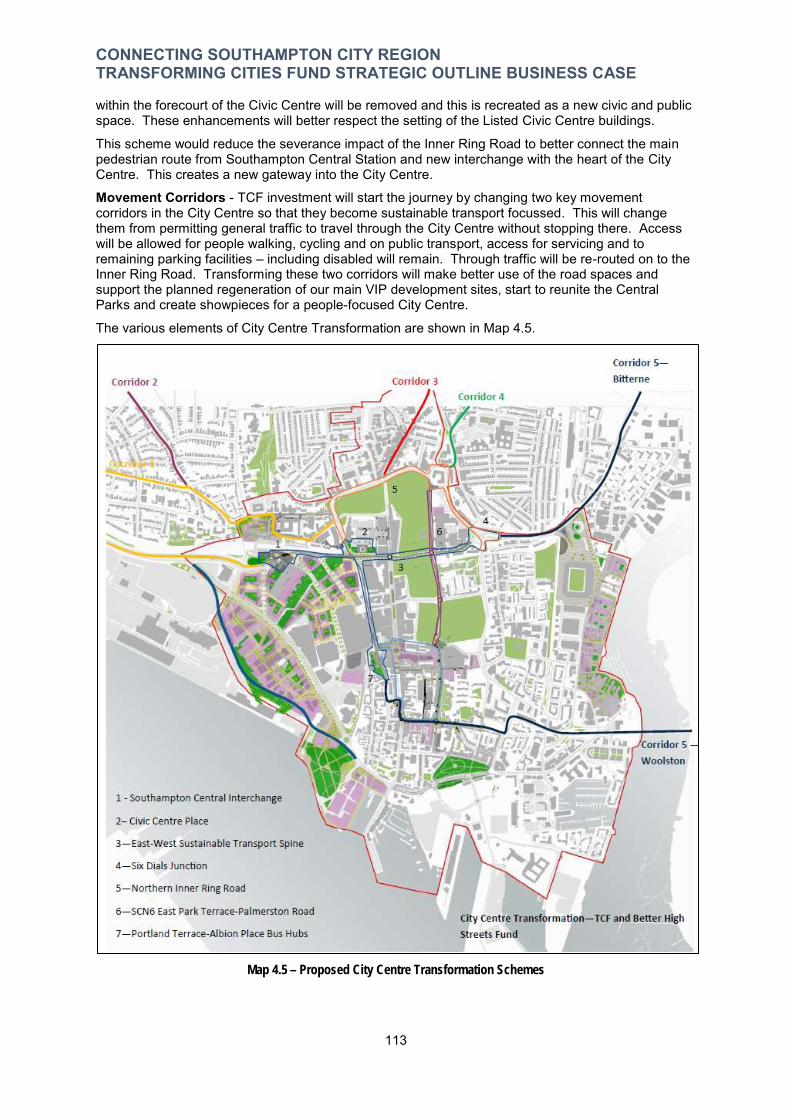
CONNECTING SOUTHAMPTON CITY REGION TRANSFORMING CITIES FUND STRATEGIC OUTLINE BUSINESS CASE
within the forecourt of the Civic Centre will be removed and this is recreated as a new civic and public space. These enhancements will better respect the setting of the Listed Civic Centre buildings.
This scheme would reduce the severance impact of the Inner Ring Road to better connect the main pedestrian route from Southampton Central Station and new interchange with the heart of the City Centre. This creates a new gateway into the City Centre.
Movement Corridors - TCF investment will start the journey by changing two key movement corridors in the City Centre so that they become sustainable transport focussed. This will change them from permitting general traffic to travel through the City Centre without stopping there. Access will be allowed for people walking, cycling and on public transport, access for servicing and to remaining parking facilities – including disabled will remain. Through traffic will be re-routed on to the Inner Ring Road. Transforming these two corridors will make better use of the road spaces and support the planned regeneration of our main VIP development sites, start to reunite the Central Parks and create showpieces for a people-focused City Centre.
The various elements of City Centre Transformation are shown in Map 4.5.
Map 4.5 – Proposed City Centre Transformation Schemes
113
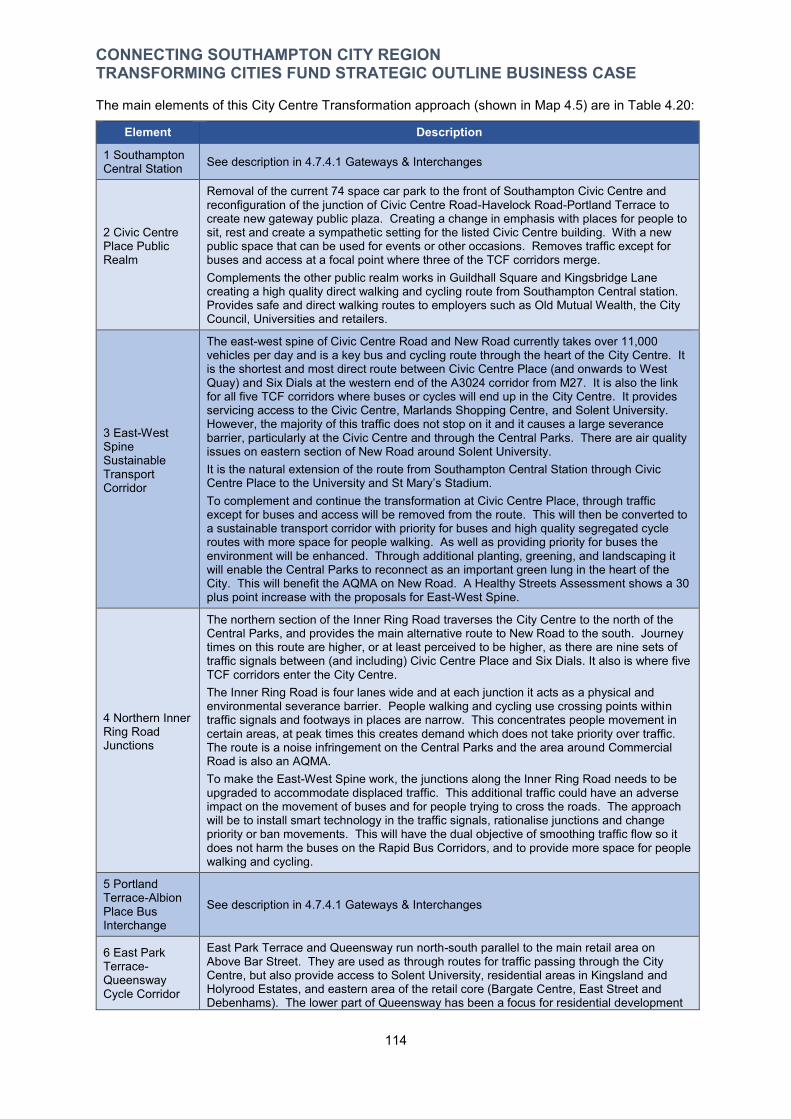
CONNECTING SOUTHAMPTON CITY REGION TRANSFORMING CITIES FUND STRATEGIC OUTLINE BUSINESS CASE
The main elements of this City Centre Transformation approach (shown in Map 4.5) are in Table 4.20:
Element Description
1 Southampton Central Station See description in 4.7.4.1 Gateways & Interchanges
2 Civic Centre Place Public Realm
Removal of the current 74 space car park to the front of Southampton Civic Centre and reconfiguration of the junction of Civic Centre Road-Havelock Road-Portland Terrace to create new gateway public plaza. Creating a change in emphasis with places for people to sit, rest and create a sympathetic setting for the listed Civic Centre building. With a new public space that can be used for events or other occasions. Removes traffic except for buses and access at a focal point where three of the TCF corridors merge. Complements the other public realm works in Guildhall Square and Kingsbridge Lane creating a high quality direct walking and cycling route from Southampton Central station. Provides safe and direct walking routes to employers such as Old Mutual Wealth, the City Council, Universities and retailers.
3 East-West Spine Sustainable Transport Corridor
The east-west spine of Civic Centre Road and New Road currently takes over 11,000 vehicles per day and is a key bus and cycling route through the heart of the City Centre. It is the shortest and most direct route between Civic Centre Place (and onwards to West Quay) and Six Dials at the western end of the A3024 corridor from M27. It is also the link for all five TCF corridors where buses or cycles will end up in the City Centre. It provides servicing access to the Civic Centre, Marlands Shopping Centre, and Solent University. However, the majority of this traffic does not stop on it and it causes a large severance barrier, particularly at the Civic Centre and through the Central Parks. There are air quality issues on eastern section of New Road around Solent University. It is the natural extension of the route from Southampton Central Station through Civic Centre Place to the University and St Mary’s Stadium. To complement and continue the transformation at Civic Centre Place, through traffic except for buses and access will be removed from the route. This will then be converted to a sustainable transport corridor with priority for buses and high quality segregated cycle routes with more space for people walking. As well as providing priority for buses the environment will be enhanced. Through additional planting, greening, and landscaping it will enable the Central Parks to reconnect as an important green lung in the heart of the City. This will benefit the AQMA on New Road. A Healthy Streets Assessment shows a 30 plus point increase with the proposals for East-West Spine.
4 Northern Inner Ring Road Junctions
The northern section of the Inner Ring Road traverses the City Centre to the north of the Central Parks, and provides the main alternative route to New Road to the south. Journey times on this route are higher, or at least perceived to be higher, as there are nine sets of traffic signals between (and including) Civic Centre Place and Six Dials. It also is where five TCF corridors enter the City Centre. The Inner Ring Road is four lanes wide and at each junction it acts as a physical and environmental severance barrier. People walking and cycling use crossing points within traffic signals and footways in places are narrow. This concentrates people movement in certain areas, at peak times this creates demand which does not take priority over traffic. The route is a noise infringement on the Central Parks and the area around Commercial Road is also an AQMA. To make the East-West Spine work, the junctions along the Inner Ring Road needs to be upgraded to accommodate displaced traffic. This additional traffic could have an adverse impact on the movement of buses and for people trying to cross the roads. The approach will be to install smart technology in the traffic signals, rationalise junctions and change priority or ban movements. This will have the dual objective of smoothing traffic flow so it does not harm the buses on the Rapid Bus Corridors, and to provide more space for people walking and cycling.
5 Portland Terrace-Albion Place Bus Interchange
See description in 4.7.4.1 Gateways & Interchanges
6 East Park Terrace-Queensway Cycle Corridor
East Park Terrace and Queensway run north-south parallel to the main retail area on Above Bar Street. They are used as through routes for traffic passing through the City Centre, but also provide access to Solent University, residential areas in Kingsland and Holyrood Estates, and eastern area of the retail core (Bargate Centre, East Street and Debenhams). The lower part of Queensway has been a focus for residential development
114
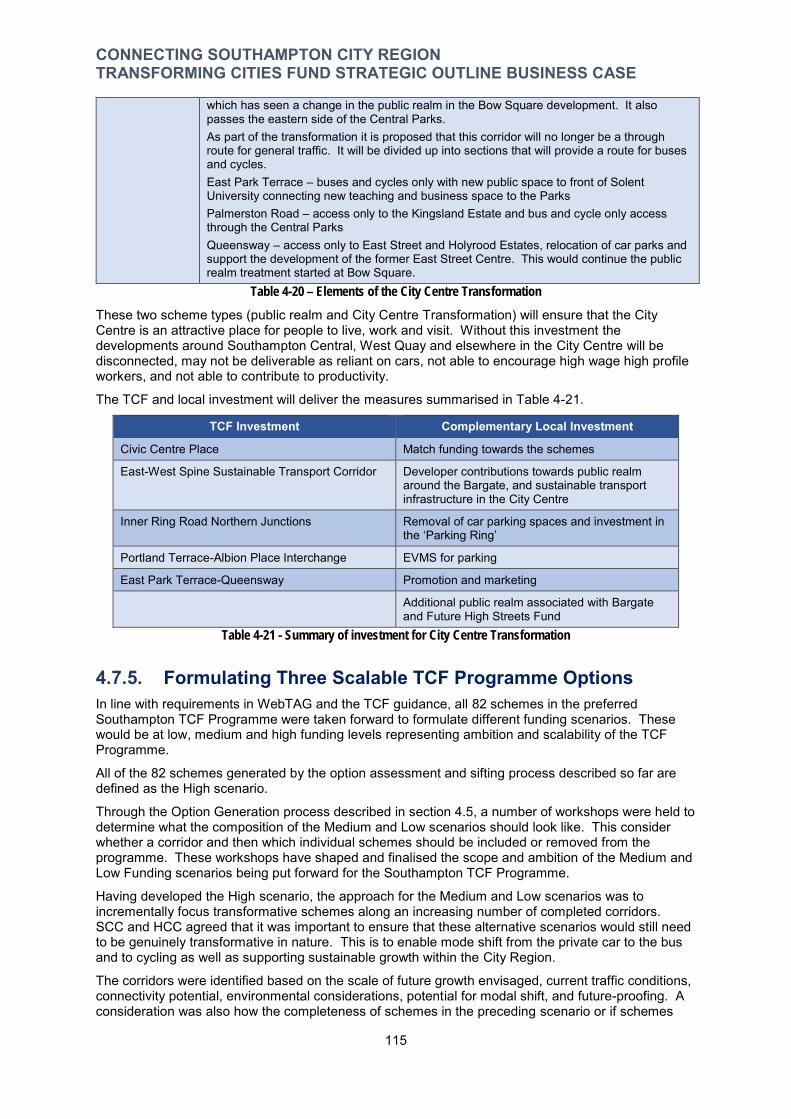
CONNECTING SOUTHAMPTON CITY REGION TRANSFORMING CITIES FUND STRATEGIC OUTLINE BUSINESS CASE
which has seen a change in the public realm in the Bow Square development. It also passes the eastern side of the Central Parks. As part of the transformation it is proposed that this corridor will no longer be a through route for general traffic. It will be divided up into sections that will provide a route for buses and cycles. East Park Terrace – buses and cycles only with new public space to front of Solent University connecting new teaching and business space to the Parks Palmerston Road – access only to the Kingsland Estate and bus and cycle only access through the Central Parks Queensway – access only to East Street and Holyrood Estates, relocation of car parks and support the development of the former East Street Centre. This would continue the public realm treatment started at Bow Square.
Table 4-20 – Elements of the City Centre Transformation
These two scheme types (public realm and City Centre Transformation) will ensure that the City Centre is an attractive place for people to live, work and visit. Without this investment the developments around Southampton Central, West Quay and elsewhere in the City Centre will be disconnected, may not be deliverable as reliant on cars, not able to encourage high wage high profile workers, and not able to contribute to productivity.
The TCF and local investment will deliver the measures summarised in Table 4-21.
TCF Investment Complementary Local Investment
Civic Centre Place Match funding towards the schemes
East-West Spine Sustainable Transport Corridor Developer contributions towards public realm around the Bargate, and sustainable transport infrastructure in the City Centre
Inner Ring Road Northern Junctions Removal of car parking spaces and investment in the ‘Parking Ring’
Portland Terrace-Albion Place Interchange EVMS for parking
East Park Terrace-Queensway Promotion and marketing
Additional public realm associated with Bargate and Future High Streets Fund
Table 4-21 - Summary of investment for City Centre Transformation
4.7.5. Formulating Three Scalable TCF Programme Options In line with requirements in WebTAG and the TCF guidance, all 82 schemes in the preferred Southampton TCF Programme were taken forward to formulate different funding scenarios. These would be at low, medium and high funding levels representing ambition and scalability of the TCF Programme.
All of the 82 schemes generated by the option assessment and sifting process described so far are defined as the High scenario.
Through the Option Generation process described in section 4.5, a number of workshops were held to determine what the composition of the Medium and Low scenarios should look like. This consider whether a corridor and then which individual schemes should be included or removed from the programme. These workshops have shaped and finalised the scope and ambition of the Medium and Low Funding scenarios being put forward for the Southampton TCF Programme.
Having developed the High scenario, the approach for the Medium and Low scenarios was to incrementally focus transformative schemes along an increasing number of completed corridors. SCC and HCC agreed that it was important to ensure that these alternative scenarios would still need to be genuinely transformative in nature. This is to enable mode shift from the private car to the bus and to cycling as well as supporting sustainable growth within the City Region.
The corridors were identified based on the scale of future growth envisaged, current traffic conditions, connectivity potential, environmental considerations, potential for modal shift, and future-proofing. A consideration was also how the completeness of schemes in the preceding scenario or if schemes
115
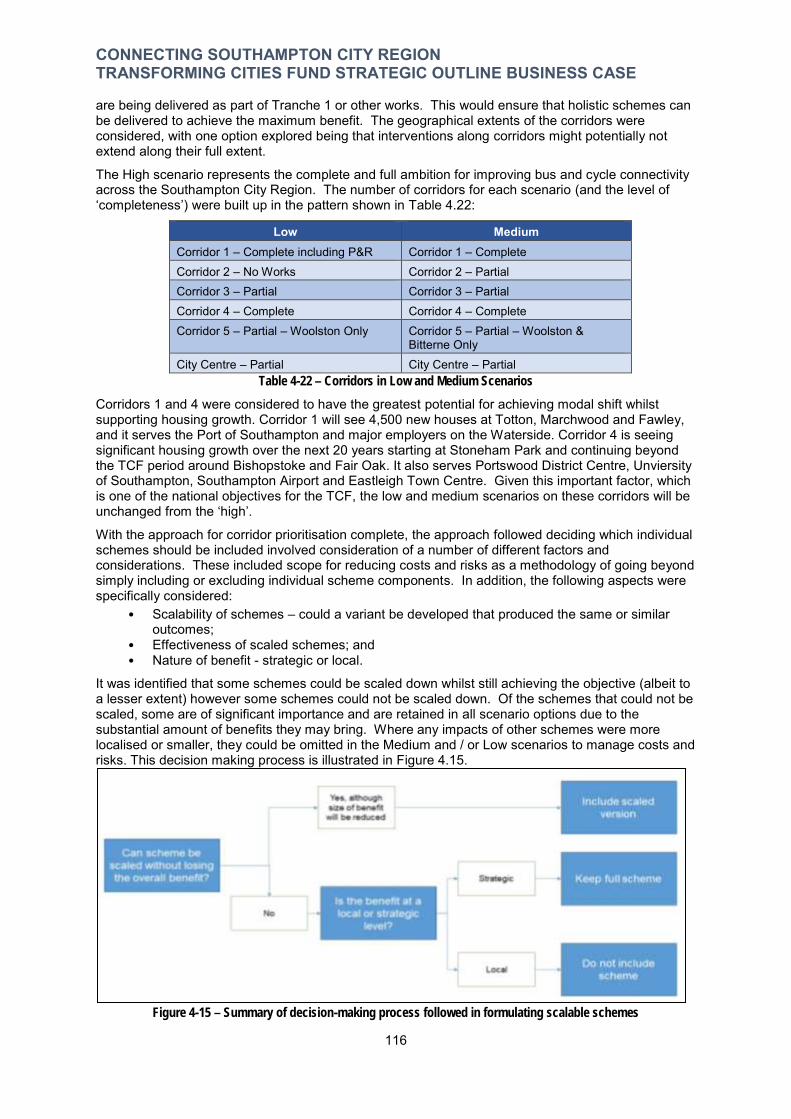
CONNECTING SOUTHAMPTON CITY REGION TRANSFORMING CITIES FUND STRATEGIC OUTLINE BUSINESS CASE
are being delivered as part of Tranche 1 or other works. This would ensure that holistic schemes can be delivered to achieve the maximum benefit. The geographical extents of the corridors were considered, with one option explored being that interventions along corridors might potentially not extend along their full extent.
The High scenario represents the complete and full ambition for improving bus and cycle connectivity across the Southampton City Region. The number of corridors for each scenario (and the level of ‘completeness’) were built up in the pattern shown in Table 4.22:
Low Medium Corridor 1 – Complete including P&R Corridor 1 – Complete Corridor 2 – No Works Corridor 2 – Partial Corridor 3 – Partial Corridor 3 – Partial Corridor 4 – Complete Corridor 4 – Complete Corridor 5 – Partial – Woolston Only Corridor 5 – Partial – Woolston &
Bitterne Only City Centre – Partial City Centre – Partial
Table 4-22 – Corridors in Low and Medium Scenarios
Corridors 1 and 4 were considered to have the greatest potential for achieving modal shift whilst supporting housing growth. Corridor 1 will see 4,500 new houses at Totton, Marchwood and Fawley, and it serves the Port of Southampton and major employers on the Waterside. Corridor 4 is seeing significant housing growth over the next 20 years starting at Stoneham Park and continuing beyond the TCF period around Bishopstoke and Fair Oak. It also serves Portswood District Centre, Unviersity of Southampton, Southampton Airport and Eastleigh Town Centre. Given this important factor, which is one of the national objectives for the TCF, the low and medium scenarios on these corridors will be unchanged from the ‘high’.
With the approach for corridor prioritisation complete, the approach followed deciding which individual schemes should be included involved consideration of a number of different factors and considerations. These included scope for reducing costs and risks as a methodology of going beyond simply including or excluding individual scheme components. In addition, the following aspects were specifically considered:
• Scalability of schemes – could a variant be developed that produced the same or similar outcomes;
• Effectiveness of scaled schemes; and • Nature of benefit - strategic or local.
It was identified that some schemes could be scaled down whilst still achieving the objective (albeit to a lesser extent) however some schemes could not be scaled down. Of the schemes that could not be scaled, some are of significant importance and are retained in all scenario options due to the substantial amount of benefits they may bring. Where any impacts of other schemes were more localised or smaller, they could be omitted in the Medium and / or Low scenarios to manage costs and risks. This decision making process is illustrated in Figure 4.15.
Figure 4-15 – Summary of decision-making process followed in formulating scalable schemes
116

- -
CONNECTING SOUTHAMPTON CITY REGION TRANSFORMING CITIES FUND STRATEGIC OUTLINE BUSINESS CASE
The criteria for scale and inclusion of individual schemes, and sub-schemes, on the corridors for each scenario included consideration of the transformational impact of the scheme if scaled down, how it meets the strategic TCF objectives and outcomes, its deliverability, affordability, whether there was any additional match funding, whether the type of scheme could be changed, whether a variant of the scheme could be delivered, and cohesiveness as part of the complete programme.
At the end of the sifting process, all the remaining schemes in each scenario were considered in combination to ensure they all complemented each other, and that no other important and necessary complementary schemes were missing.
The following approach was applied to arrive at the Medium and Low funding scenarios, but each scheme was considered on its own merits:
Rapid Bus – the scale and level of bus priority was reduced with lower scoring or lower benefit sections removed. The Medium Scenario retained the majority of bus priority and elements of the Rapid Bus Corridors but sections that had high deliverability risks were removed. The number of Super Stops were reduced on each corridor. In the Low Scenario the route to Hedge End was condensed to Hedge End station only due to lower bus frequencies to Hedge End village centre and Botley. The Woolston corridor bus schemes were reduced to core bus priority measures around the Itchen Bridge as they provided the greatest improvement in bus journey time reliability of the various potential priority measures on the corridor as a whole;
Local Mobility Hubs – those on corridors not being worked on were removed in the relevant scenario;
Cycling - schemes were retained as per the High scenario as any changes to the type of infrastructure may not generate the modal shift required if not at the same scale of segregation or priority proposed. For the Low scenario outlying higher cost cycle schemes north of Lordshill towards North Baddesley and Chilworth, Winchester, Romsey, Hamble Lane, and A27 to Burlsedon were not included. Whilst these schemes connect significant locations to Southampton the corridors were scored lower in the initial assessment, or were considered outside the core network;
Park & Ride – Park & Rail at Southampton Airport Parkway is not included in the low and medium scenarios; and
City Centre - the scale of schemes in the Low scenario was reduced with the extent and quality of public realm reduced to core areas on Portland Terrance and Civic Centre Place, and sections of bus priority away from Portland Terrace and East-West Spine were removed if bus frequencies were lower.
At the end of this process the Medium and Low scenarios consist of a mix of completed corridors and selected schemes from the High scenario that provided starting points for transformation of other corridors.
Table 4.23 below, uses the example of a rapid bus corridor and an SCN cycle infrastructure scheme, to show the approach that was taken to identify these lower cost scalable scenarios whilst ensuring that each would still deliver transformational impacts for connectivity for the City Region.
Southampton Woolston Bursledon Rapid Bus SCN5 Cycle Route
Hig
h
All elements on full extent between City Centre and Bursledon via Portsmouth Road. Including: Bus priority lanes on Saltmarsh Road and
Portsmouth Road; Junction improvements at Itchen Bridge and Butts
Road, Bus bypass at Hamble Lane; Junction improvement along A27 at Portsmouth
Road and Lower Swanwick Lane; Upgrade to Woolston to Super Stops as part of
Interchange and linked to Local Mobility Hub; and Enhanced Bus Stops at all stops requiring lay-by
fill in, shelters, real-time information and raised kerbs.
Fully segregated cycle corridor extending from City Centre to Chandler’s Ford with: kerb separation, continuous priority at side road junctions, cycle advance traffic signals, real time cycle information, traffic volume reduction, floating bus stops, wayfinding information, cycle parking, maintenance hubs, and marketing and promotion.
117
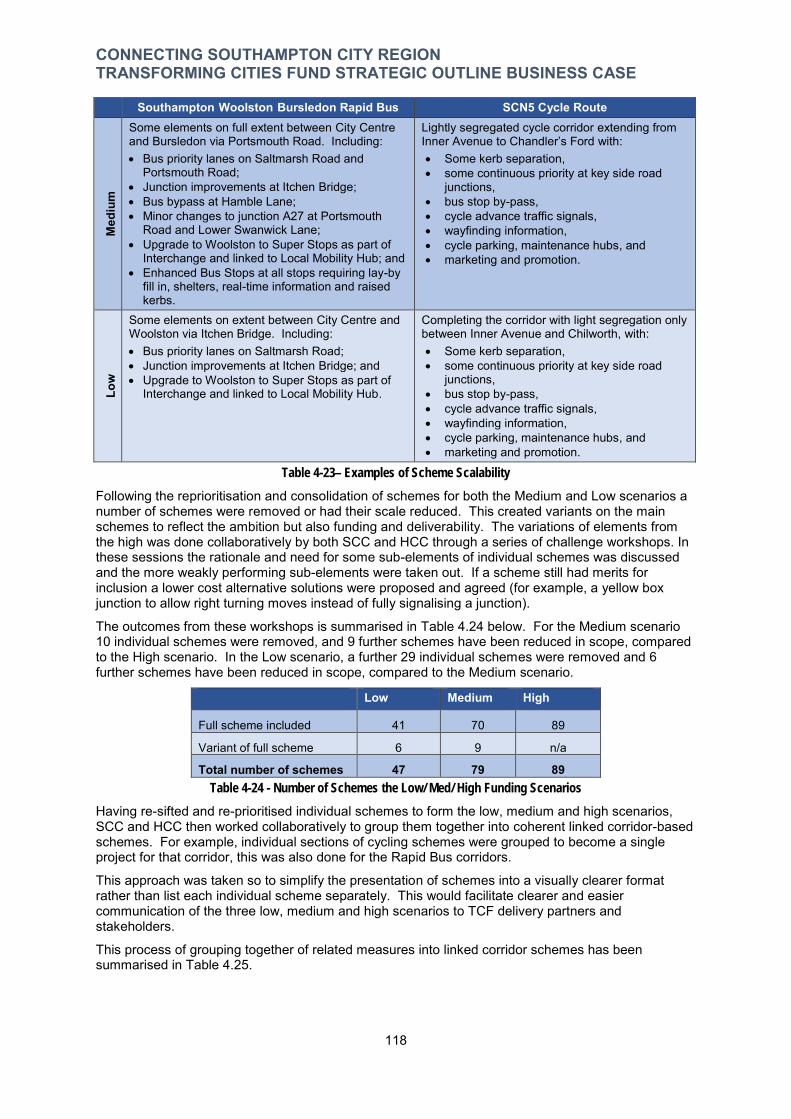
- -
CONNECTING SOUTHAMPTON CITY REGION TRANSFORMING CITIES FUND STRATEGIC OUTLINE BUSINESS CASE
Southampton Woolston Bursledon Rapid Bus SCN5 Cycle Route M
ediu
m
Some elements on full extent between City Centre and Bursledon via Portsmouth Road. Including: Bus priority lanes on Saltmarsh Road and
Portsmouth Road; Junction improvements at Itchen Bridge; Bus bypass at Hamble Lane; Minor changes to junction A27 at Portsmouth
Road and Lower Swanwick Lane; Upgrade to Woolston to Super Stops as part of
Interchange and linked to Local Mobility Hub; and Enhanced Bus Stops at all stops requiring lay-by
fill in, shelters, real-time information and raised kerbs.
Lightly segregated cycle corridor extending from Inner Avenue to Chandler’s Ford with: Some kerb separation, some continuous priority at key side road
junctions, bus stop by-pass, cycle advance traffic signals, wayfinding information, cycle parking, maintenance hubs, and marketing and promotion.
Low
Some elements on extent between City Centre and Woolston via Itchen Bridge. Including: Bus priority lanes on Saltmarsh Road; Junction improvements at Itchen Bridge; and Upgrade to Woolston to Super Stops as part of
Interchange and linked to Local Mobility Hub.
Completing the corridor with light segregation only between Inner Avenue and Chilworth, with: Some kerb separation, some continuous priority at key side road
junctions, bus stop by-pass, cycle advance traffic signals, wayfinding information, cycle parking, maintenance hubs, and marketing and promotion.
Table 4-23– Examples of Scheme Scalability
Following the reprioritisation and consolidation of schemes for both the Medium and Low scenarios a number of schemes were removed or had their scale reduced. This created variants on the main schemes to reflect the ambition but also funding and deliverability. The variations of elements from the high was done collaboratively by both SCC and HCC through a series of challenge workshops. In these sessions the rationale and need for some sub-elements of individual schemes was discussed and the more weakly performing sub-elements were taken out. If a scheme still had merits for inclusion a lower cost alternative solutions were proposed and agreed (for example, a yellow box junction to allow right turning moves instead of fully signalising a junction).
The outcomes from these workshops is summarised in Table 4.24 below. For the Medium scenario 10 individual schemes were removed, and 9 further schemes have been reduced in scope, compared to the High scenario. In the Low scenario, a further 29 individual schemes were removed and 6 further schemes have been reduced in scope, compared to the Medium scenario.
Low Medium High
Full scheme included 41 70 89
Variant of full scheme 6 9 n/a
Total number of schemes 47 79 89 Table 4-24 - Number of Schemes the Low/ Med/ High Funding Scenarios
Having re-sifted and re-prioritised individual schemes to form the low, medium and high scenarios, SCC and HCC then worked collaboratively to group them together into coherent linked corridor-based schemes. For example, individual sections of cycling schemes were grouped to become a single project for that corridor, this was also done for the Rapid Bus corridors.
This approach was taken so to simplify the presentation of schemes into a visually clearer format rather than list each individual scheme separately. This would facilitate clearer and easier communication of the three low, medium and high scenarios to TCF delivery partners and stakeholders.
This process of grouping together of related measures into linked corridor schemes has been summarised in Table 4.25.
118
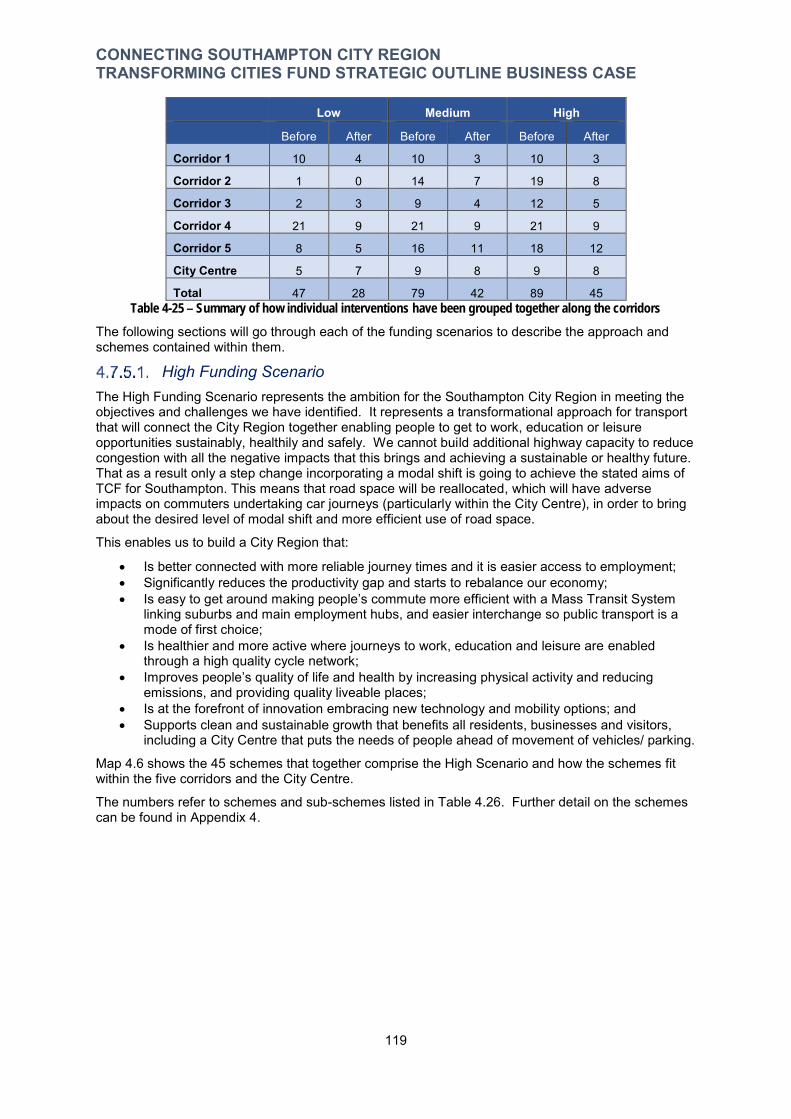
CONNECTING SOUTHAMPTON CITY REGION TRANSFORMING CITIES FUND STRATEGIC OUTLINE BUSINESS CASE
Low Medium High
Before After Before After Before After
Corridor 1 10 4 10 3 10 3
Corridor 2 1 0 14 7 19 8
Corridor 3 2 3 9 4 12 5
Corridor 4 21 9 21 9 21 9
Corridor 5 8 5 16 11 18 12
City Centre 5 7 9 8 9 8
Total 47 28 79 42 89 45 Table 4-25 – Summary of how individual interventions have been grouped together along the corridors
The following sections will go through each of the funding scenarios to describe the approach and schemes contained within them.
High Funding Scenario The High Funding Scenario represents the ambition for the Southampton City Region in meeting the objectives and challenges we have identified. It represents a transformational approach for transport that will connect the City Region together enabling people to get to work, education or leisure opportunities sustainably, healthily and safely. We cannot build additional highway capacity to reduce congestion with all the negative impacts that this brings and achieving a sustainable or healthy future. That as a result only a step change incorporating a modal shift is going to achieve the stated aims of TCF for Southampton. This means that road space will be reallocated, which will have adverse impacts on commuters undertaking car journeys (particularly within the City Centre), in order to bring about the desired level of modal shift and more efficient use of road space.
This enables us to build a City Region that:
Is better connected with more reliable journey times and it is easier access to employment; Significantly reduces the productivity gap and starts to rebalance our economy; Is easy to get around making people’s commute more efficient with a Mass Transit System
linking suburbs and main employment hubs, and easier interchange so public transport is a mode of first choice;
Is healthier and more active where journeys to work, education and leisure are enabled through a high quality cycle network;
Improves people’s quality of life and health by increasing physical activity and reducing emissions, and providing quality liveable places;
Is at the forefront of innovation embracing new technology and mobility options; and Supports clean and sustainable growth that benefits all residents, businesses and visitors,
including a City Centre that puts the needs of people ahead of movement of vehicles/ parking.
Map 4.6 shows the 45 schemes that together comprise the High Scenario and how the schemes fit within the five corridors and the City Centre.
The numbers refer to schemes and sub-schemes listed in Table 4.26. Further detail on the schemes can be found in Appendix 4.
119

CONNECTING SOUTHAMPTON CITY REGION TRANSFORMING CITIES FUND STRATEGIC OUTLINE BUSINESS CASE
Map 4.6 – Southampton TCF Programme High Scenario
120
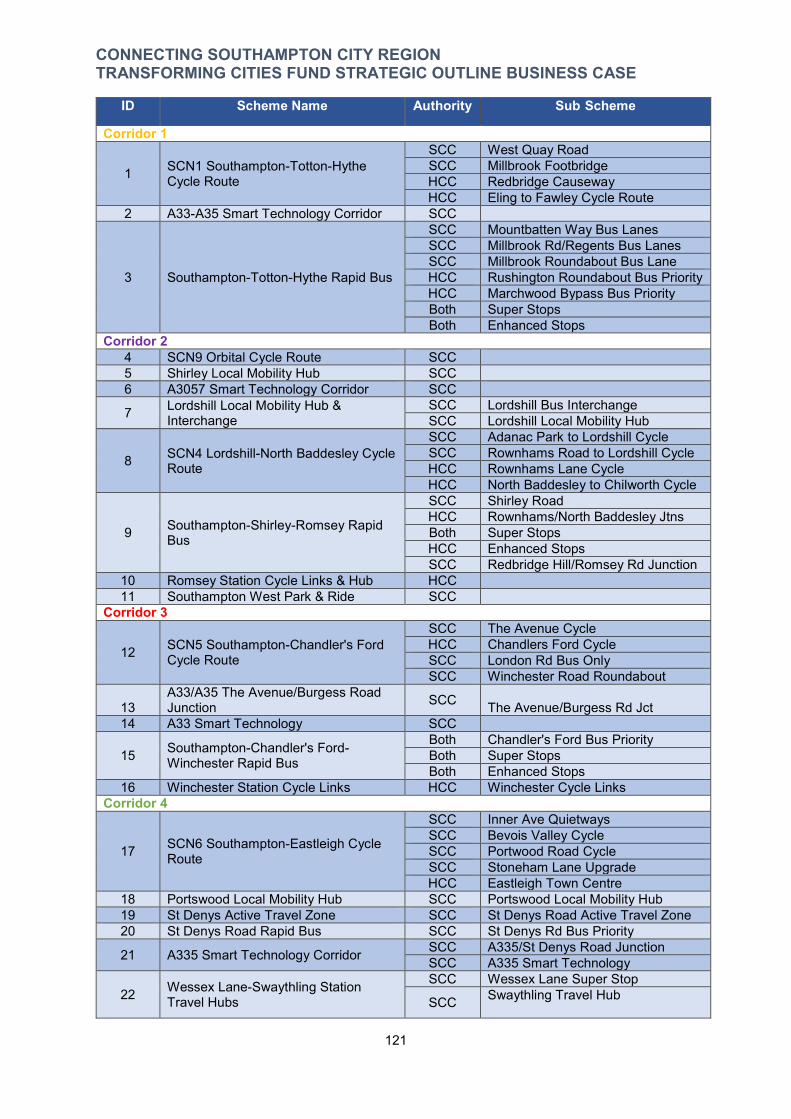
-
CONNECTING SOUTHAMPTON CITY REGION TRANSFORMING CITIES FUND STRATEGIC OUTLINE BUSINESS CASE
ID Scheme Name Authority Sub Scheme
Corridor 1
1 SCN1 Southampton-Totton-Hythe Cycle Route
SCC West Quay Road SCC Millbrook Footbridge HCC Redbridge Causeway HCC Eling to Fawley Cycle Route
2 A33-A35 Smart Technology Corridor SCC
3 Southampton-Totton-Hythe Rapid Bus
SCC Mountbatten Way Bus Lanes SCC Millbrook Rd/Regents Bus Lanes SCC Millbrook Roundabout Bus Lane HCC Rushington Roundabout Bus Priority HCC Marchwood Bypass Bus Priority Both Super Stops Both Enhanced Stops
Corridor 2 4 SCN9 Orbital Cycle Route SCC 5 Shirley Local Mobility Hub SCC 6 A3057 Smart Technology Corridor SCC
7 Lordshill Local Mobility Hub & Interchange
SCC Lordshill Bus Interchange SCC Lordshill Local Mobility Hub
8 SCN4 Lordshill-North Baddesley Cycle Route
SCC Adanac Park to Lordshill Cycle SCC Rownhams Road to Lordshill Cycle HCC Rownhams Lane Cycle HCC North Baddesley to Chilworth Cycle
9 Southampton-Shirley-Romsey Rapid Bus
SCC Shirley Road HCC Rownhams/North Baddesley Jtns Both Super Stops HCC Enhanced Stops SCC Redbridge Hill/Romsey Rd Junction
10 Romsey Station Cycle Links & Hub HCC 11 Southampton West Park & Ride SCC
Corridor 3
12 SCN5 Southampton-Chandler's Ford Cycle Route
SCC The Avenue Cycle HCC Chandlers Ford Cycle SCC London Rd Bus Only SCC Winchester Road Roundabout
13 A33/A35 The Avenue/Burgess Road Junction SCC The Avenue/Burgess Rd Jct
14 A33 Smart Technology SCC
15 Southampton-Chandler's Ford-Winchester Rapid Bus
Both Chandler's Ford Bus Priority Both Super Stops Both Enhanced Stops
16 Winchester Station Cycle Links HCC Winchester Cycle Links Corridor 4
17 SCN6 Southampton-Eastleigh Cycle Route
SCC Inner Ave Quietways SCC Bevois Valley Cycle SCC Portwood Road Cycle SCC Stoneham Lane Upgrade HCC Eastleigh Town Centre
18 Portswood Local Mobility Hub SCC Portswood Local Mobility Hub 19 St Denys Active Travel Zone SCC St Denys Road Active Travel Zone 20 St Denys Road Rapid Bus SCC St Denys Rd Bus Priority
21 A335 Smart Technology Corridor SCC A335/St Denys Road Junction SCC A335 Smart Technology
22 Wessex Lane-Swaythling Station Travel Hubs
SCC Wessex Lane Super Stop
SCC Swaythling Travel Hub
121
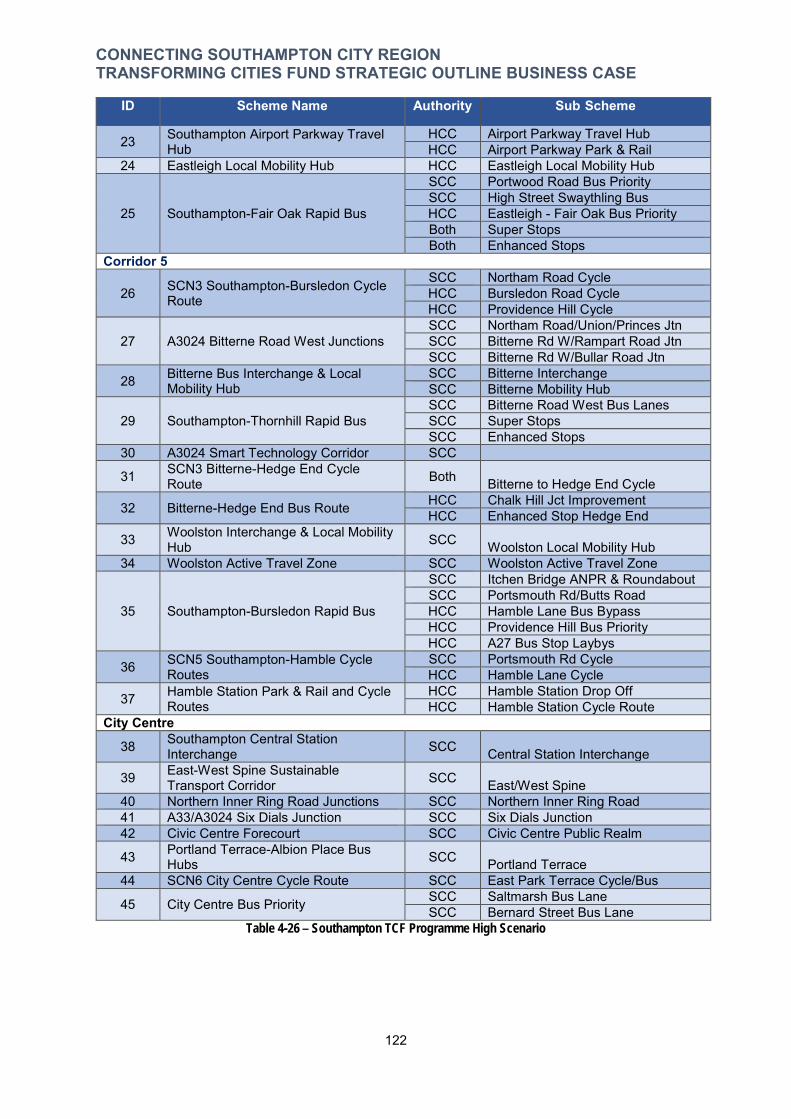
-
CONNECTING SOUTHAMPTON CITY REGION TRANSFORMING CITIES FUND STRATEGIC OUTLINE BUSINESS CASE
ID Scheme Name Authority Sub Scheme
23 Southampton Airport Parkway Travel Hub
HCC Airport Parkway Travel Hub HCC Airport Parkway Park & Rail
24 Eastleigh Local Mobility Hub HCC Eastleigh Local Mobility Hub
25 Southampton-Fair Oak Rapid Bus
SCC Portwood Road Bus Priority SCC High Street Swaythling Bus HCC Eastleigh - Fair Oak Bus Priority Both Super Stops Both Enhanced Stops
Corridor 5
26 SCN3 Southampton-Bursledon Cycle Route
SCC Northam Road Cycle HCC Bursledon Road Cycle HCC Providence Hill Cycle
27 A3024 Bitterne Road West Junctions SCC Northam Road/Union/Princes Jtn SCC Bitterne Rd W/Rampart Road Jtn SCC Bitterne Rd W/Bullar Road Jtn
28 Bitterne Bus Interchange & Local Mobility Hub
SCC Bitterne Interchange SCC Bitterne Mobility Hub
29 Southampton-Thornhill Rapid Bus SCC Bitterne Road West Bus Lanes SCC Super Stops SCC Enhanced Stops
30 A3024 Smart Technology Corridor SCC
31 SCN3 Bitterne-Hedge End Cycle Route Both Bitterne to Hedge End Cycle
32 Bitterne-Hedge End Bus Route HCC Chalk Hill Jct Improvement HCC Enhanced Stop Hedge End
33 Woolston Interchange & Local Mobility Hub SCC Woolston Local Mobility Hub
34 Woolston Active Travel Zone SCC Woolston Active Travel Zone
35 Southampton-Bursledon Rapid Bus
SCC Itchen Bridge ANPR & Roundabout SCC Portsmouth Rd/Butts Road HCC Hamble Lane Bus Bypass HCC Providence Hill Bus Priority HCC A27 Bus Stop Laybys
36 SCN5 Southampton-Hamble Cycle Routes
SCC Portsmouth Rd Cycle HCC Hamble Lane Cycle
37 Hamble Station Park & Rail and Cycle Routes
HCC Hamble Station Drop Off HCC Hamble Station Cycle Route
City Centre
38 Southampton Central Station Interchange SCC Central Station Interchange
39 East-West Spine Sustainable Transport Corridor SCC East/West Spine
40 Northern Inner Ring Road Junctions SCC Northern Inner Ring Road 41 A33/A3024 Six Dials Junction SCC Six Dials Junction 42 Civic Centre Forecourt SCC Civic Centre Public Realm
43 Portland Terrace-Albion Place Bus Hubs SCC Portland Terrace
44 SCN6 City Centre Cycle Route SCC East Park Terrace Cycle/Bus
45 City Centre Bus Priority SCC Saltmarsh Bus Lane SCC Bernard Street Bus Lane
Table 4-26 – Southampton TCF Programme High Scenario
122
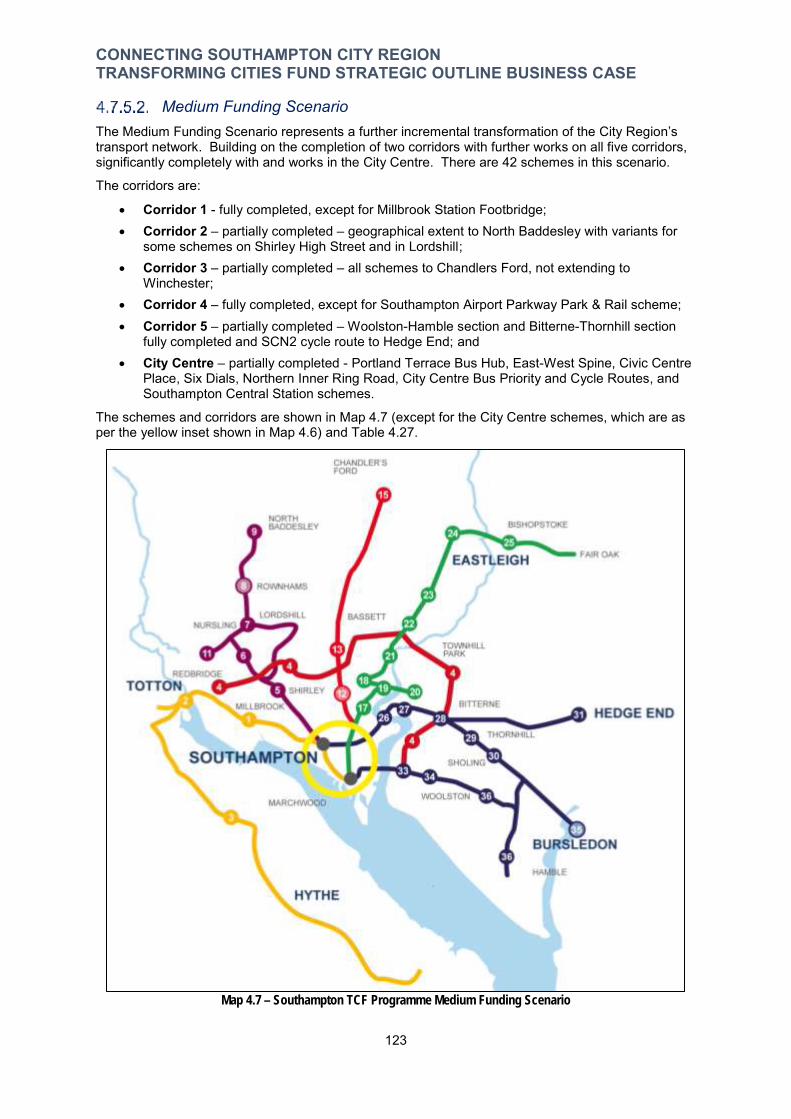
CONNECTING SOUTHAMPTON CITY REGION TRANSFORMING CITIES FUND STRATEGIC OUTLINE BUSINESS CASE
Medium Funding Scenario The Medium Funding Scenario represents a further incremental transformation of the City Region’s transport network. Building on the completion of two corridors with further works on all five corridors, significantly completely with and works in the City Centre. There are 42 schemes in this scenario.
The corridors are:
Corridor 1 - fully completed, except for Millbrook Station Footbridge; Corridor 2 – partially completed – geographical extent to North Baddesley with variants for
some schemes on Shirley High Street and in Lordshill; Corridor 3 – partially completed – all schemes to Chandlers Ford, not extending to
Winchester; Corridor 4 – fully completed, except for Southampton Airport Parkway Park & Rail scheme; Corridor 5 – partially completed – Woolston-Hamble section and Bitterne-Thornhill section
fully completed and SCN2 cycle route to Hedge End; and City Centre – partially completed - Portland Terrace Bus Hub, East-West Spine, Civic Centre
Place, Six Dials, Northern Inner Ring Road, City Centre Bus Priority and Cycle Routes, and Southampton Central Station schemes.
The schemes and corridors are shown in Map 4.7 (except for the City Centre schemes, which are as per the yellow inset shown in Map 4.6) and Table 4.27.
Map 4.7 – Southampton TCF Programme Medium Funding Scenario
123
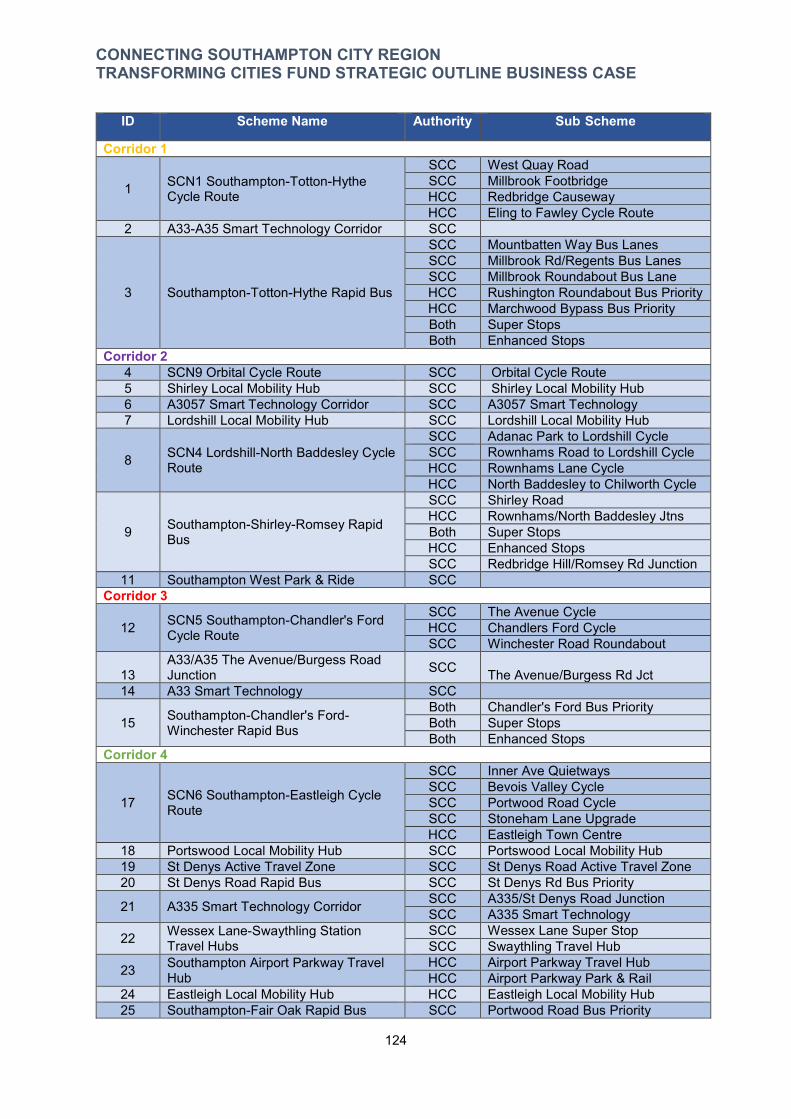
-
CONNECTING SOUTHAMPTON CITY REGION TRANSFORMING CITIES FUND STRATEGIC OUTLINE BUSINESS CASE
ID Scheme Name Authority Sub Scheme
Corridor 1
1 SCN1 Southampton-Totton-Hythe Cycle Route
SCC West Quay Road SCC Millbrook Footbridge HCC Redbridge Causeway HCC Eling to Fawley Cycle Route
2 A33-A35 Smart Technology Corridor SCC
3 Southampton-Totton-Hythe Rapid Bus
SCC Mountbatten Way Bus Lanes SCC Millbrook Rd/Regents Bus Lanes SCC Millbrook Roundabout Bus Lane HCC Rushington Roundabout Bus Priority HCC Marchwood Bypass Bus Priority Both Super Stops Both Enhanced Stops
Corridor 2 4 SCN9 Orbital Cycle Route SCC Orbital Cycle Route 5 Shirley Local Mobility Hub SCC Shirley Local Mobility Hub 6 A3057 Smart Technology Corridor SCC A3057 Smart Technology 7 Lordshill Local Mobility Hub SCC Lordshill Local Mobility Hub
8 SCN4 Lordshill-North Baddesley Cycle Route
SCC Adanac Park to Lordshill Cycle SCC Rownhams Road to Lordshill Cycle HCC Rownhams Lane Cycle HCC North Baddesley to Chilworth Cycle
9 Southampton-Shirley-Romsey Rapid Bus
SCC Shirley Road HCC Rownhams/North Baddesley Jtns Both Super Stops HCC Enhanced Stops SCC Redbridge Hill/Romsey Rd Junction
11 Southampton West Park & Ride SCC Corridor 3
12 SCN5 Southampton-Chandler's Ford Cycle Route
SCC The Avenue Cycle HCC Chandlers Ford Cycle SCC Winchester Road Roundabout
13 A33/A35 The Avenue/Burgess Road Junction SCC The Avenue/Burgess Rd Jct
14 A33 Smart Technology SCC
15 Southampton-Chandler's Ford-Winchester Rapid Bus
Both Chandler's Ford Bus Priority Both Super Stops Both Enhanced Stops
Corridor 4
17 SCN6 Southampton-Eastleigh Cycle Route
SCC Inner Ave Quietways SCC Bevois Valley Cycle SCC Portwood Road Cycle SCC Stoneham Lane Upgrade HCC Eastleigh Town Centre
18 Portswood Local Mobility Hub SCC Portswood Local Mobility Hub 19 St Denys Active Travel Zone SCC St Denys Road Active Travel Zone 20 St Denys Road Rapid Bus SCC St Denys Rd Bus Priority
21 A335 Smart Technology Corridor SCC A335/St Denys Road Junction SCC A335 Smart Technology
22 Wessex Lane-Swaythling Station Travel Hubs
SCC Wessex Lane Super Stop SCC Swaythling Travel Hub
23 Southampton Airport Parkway Travel Hub
HCC Airport Parkway Travel Hub HCC Airport Parkway Park & Rail
24 Eastleigh Local Mobility Hub HCC Eastleigh Local Mobility Hub 25 Southampton-Fair Oak Rapid Bus SCC Portwood Road Bus Priority
124

-
CONNECTING SOUTHAMPTON CITY REGION TRANSFORMING CITIES FUND STRATEGIC OUTLINE BUSINESS CASE
ID Scheme Name Authority Sub Scheme
SCC High Street Swaythling Bus HCC Eastleigh - Fair Oak Bus Priority Both Super Stops Both Enhanced Stops
Corridor 5
26 SCN3 Southampton-Bursledon Cycle Route
SCC Northam Road Cycle HCC Bursledon Road Cycle HCC Providence Hill Cycle
27 A3024 Bitterne Road West Junctions SCC Northam Road/Union/Princes Jtn SCC Bitterne Rd W/Rampart Road Jtn SCC Bitterne Rd W/Bullar Road Jtn
28 Bitterne Bus Interchange & Local Mobility Hub
SCC Bitterne Interchange SCC Bitterne Mobility Hub
29 Southampton-Thornhill Rapid Bus SCC Bitterne Road West Bus Lanes SCC Super Stops SCC Enhanced Stops
30 A3024 Smart Technology Corridor SCC
31 SCN3 Bitterne-Hedge End Cycle Route Both Bitterne to Hedge End Cycle
33 Woolston Interchange & Local Mobility Hub
SCC Woolston Local Mobility Hub SCC Woolston Interchange
34 Woolston Active Travel Zone SCC Woolston Active Travel Zone
35 Southampton-Bursledon Rapid Bus
SCC Itchen Bridge ANPR & Roundabout HCC Hamble Lane Bus Bypass HCC Providence Hill Bus Priority HCC A27 Bus Stop Laybys
36 SCN5 Southampton-Hamble Cycle Routes
SCC Portsmouth Rd Cycle HCC Hamble Lane Cycle
37 Hamble Station Park & Rail and Cycle Routes
HCC Hamble Station Drop Off HCC Hamble Station Cycle Route
City Centre
38 Southampton Central Station Interchange SCC Central Station Interchange
39 East-West Spine Sustainable Transport Corridor SCC East/West Spine
40 Northern Inner Ring Road Junctions SCC Northern Inner Ring Road 41 A33/A3024 Six Dials Junction SCC Six Dials Junction 42 Civic Centre Forecourt SCC Civic Centre Public Realm
43 Portland Terrace-Albion Place Bus Hubs SCC Portland Terrace
44 SCN6 City Centre Cycle Route SCC East Park Terrace Cycle/Bus
45 City Centre Bus Priority SCC Saltmarsh Bus Lane SCC Bernard Street Bus Lane
Table 4-27 – Southampton TCF Programme Medium Funding Scenario
Low Funding Scenario The Low Funding Scenario represents completion of two corridors completely with two other partially completed corridors and works in the City Centre. There are 28 schemes in this scenario.
The corridors are:
Corridor 1 - fully completed, except for Millbrook Station Footbridge. The Southampton West Park & Ride is included within this corridor as it serves the City Centre via A33, as well as the Hospital. The Park & Ride scheme is the full scheme;
Corridor 2 – not included;
125
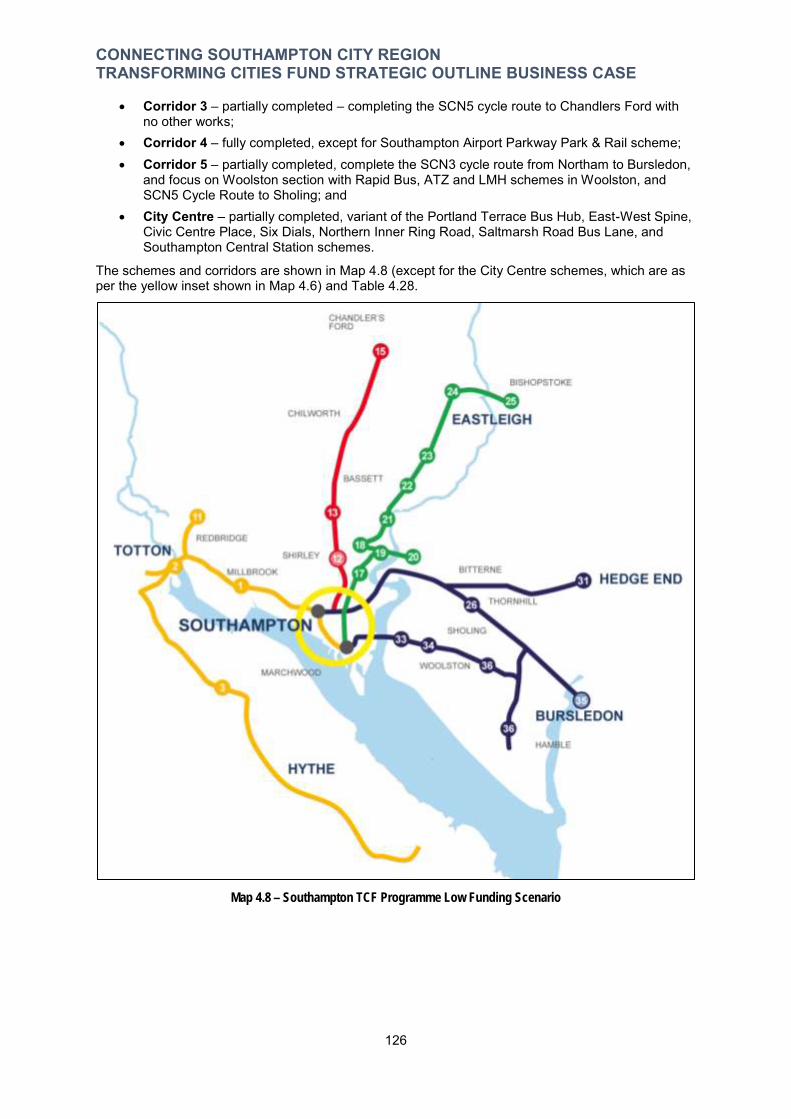
CONNECTING SOUTHAMPTON CITY REGION TRANSFORMING CITIES FUND STRATEGIC OUTLINE BUSINESS CASE
Corridor 3 – partially completed – completing the SCN5 cycle route to Chandlers Ford with no other works;
Corridor 4 – fully completed, except for Southampton Airport Parkway Park & Rail scheme; Corridor 5 – partially completed, complete the SCN3 cycle route from Northam to Bursledon,
and focus on Woolston section with Rapid Bus, ATZ and LMH schemes in Woolston, and SCN5 Cycle Route to Sholing; and
City Centre – partially completed, variant of the Portland Terrace Bus Hub, East-West Spine, Civic Centre Place, Six Dials, Northern Inner Ring Road, Saltmarsh Road Bus Lane, and Southampton Central Station schemes.
The schemes and corridors are shown in Map 4.8 (except for the City Centre schemes, which are as per the yellow inset shown in Map 4.6) and Table 4.28.
Map 4.8 – Southampton TCF Programme Low Funding Scenario
126
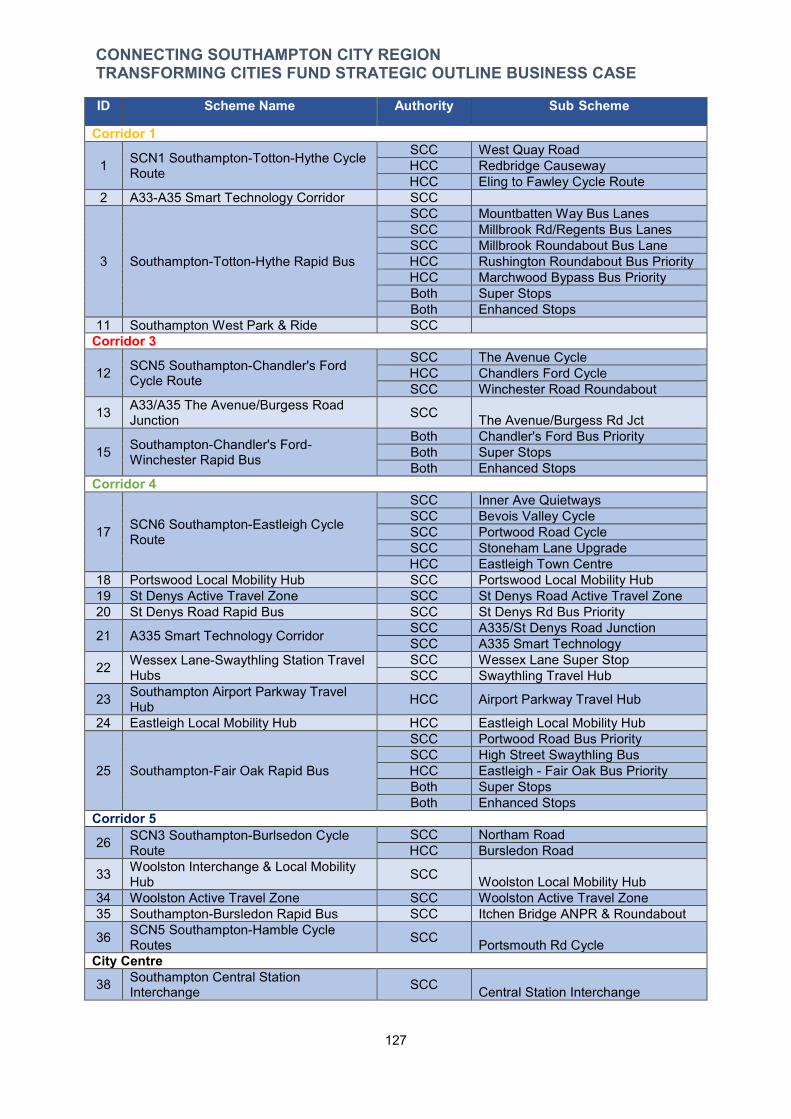
-
CONNECTING SOUTHAMPTON CITY REGION TRANSFORMING CITIES FUND STRATEGIC OUTLINE BUSINESS CASE
ID Scheme Name Authority Sub Scheme
Corridor 1
1 SCN1 Southampton-Totton-Hythe Cycle Route
SCC West Quay Road HCC Redbridge Causeway HCC Eling to Fawley Cycle Route
2 A33-A35 Smart Technology Corridor SCC
3 Southampton-Totton-Hythe Rapid Bus
SCC Mountbatten Way Bus Lanes SCC Millbrook Rd/Regents Bus Lanes SCC Millbrook Roundabout Bus Lane HCC Rushington Roundabout Bus Priority HCC Marchwood Bypass Bus Priority Both Super Stops Both Enhanced Stops
11 Southampton West Park & Ride SCC Corridor 3
12 SCN5 Southampton-Chandler's Ford Cycle Route
SCC The Avenue Cycle HCC Chandlers Ford Cycle SCC Winchester Road Roundabout
13 A33/A35 The Avenue/Burgess Road Junction SCC The Avenue/Burgess Rd Jct
15 Southampton-Chandler's Ford-Winchester Rapid Bus
Both Chandler's Ford Bus Priority Both Super Stops Both Enhanced Stops
Corridor 4
17 SCN6 Southampton-Eastleigh Cycle Route
SCC Inner Ave Quietways SCC Bevois Valley Cycle SCC Portwood Road Cycle SCC Stoneham Lane Upgrade HCC Eastleigh Town Centre
18 Portswood Local Mobility Hub SCC Portswood Local Mobility Hub 19 St Denys Active Travel Zone SCC St Denys Road Active Travel Zone 20 St Denys Road Rapid Bus SCC St Denys Rd Bus Priority
21 A335 Smart Technology Corridor SCC A335/St Denys Road Junction SCC A335 Smart Technology
22 Wessex Lane-Swaythling Station Travel Hubs
SCC Wessex Lane Super Stop SCC Swaythling Travel Hub
23 Southampton Airport Parkway Travel Hub HCC Airport Parkway Travel Hub
24 Eastleigh Local Mobility Hub HCC Eastleigh Local Mobility Hub
25 Southampton-Fair Oak Rapid Bus
SCC Portwood Road Bus Priority SCC High Street Swaythling Bus HCC Eastleigh - Fair Oak Bus Priority Both Super Stops Both Enhanced Stops
Corridor 5
26 SCN3 Southampton-Burlsedon Cycle Route
SCC Northam Road HCC Bursledon Road
33 Woolston Interchange & Local Mobility Hub SCC Woolston Local Mobility Hub
34 Woolston Active Travel Zone SCC Woolston Active Travel Zone 35 Southampton-Bursledon Rapid Bus SCC Itchen Bridge ANPR & Roundabout
36 SCN5 Southampton-Hamble Cycle Routes SCC Portsmouth Rd Cycle
City Centre 38 Southampton Central Station
Interchange SCC Central Station Interchange
127
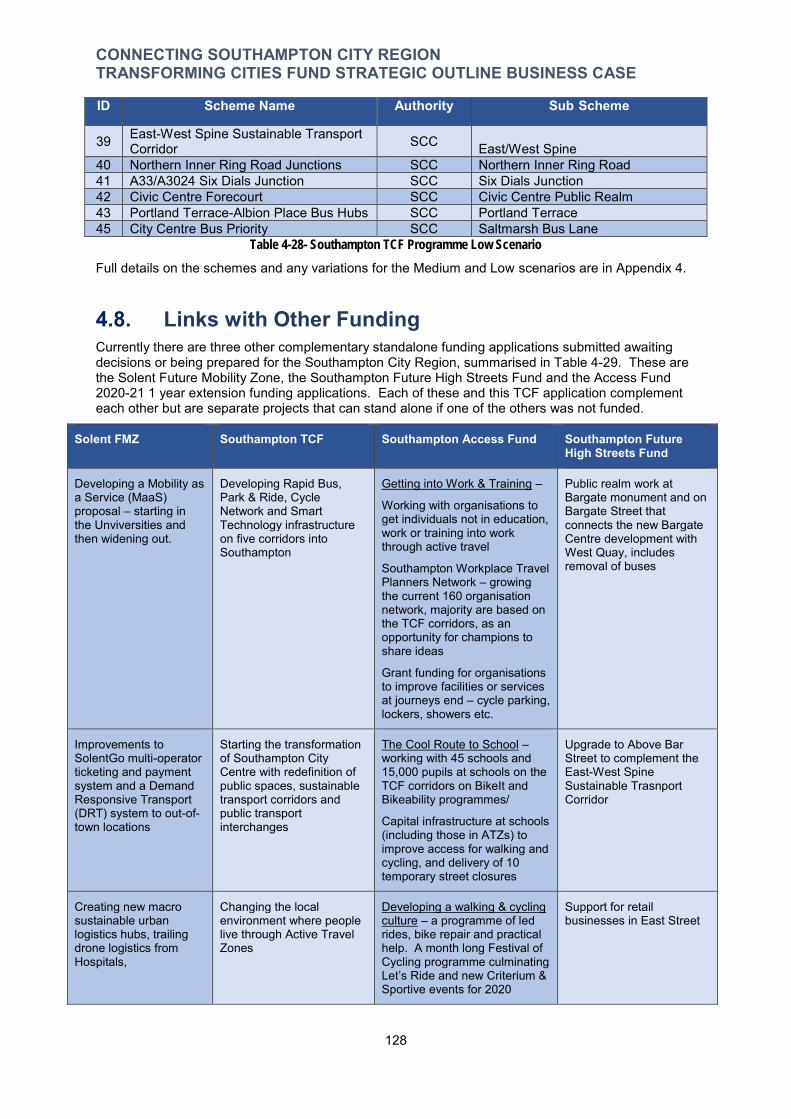
-
CONNECTING SOUTHAMPTON CITY REGION TRANSFORMING CITIES FUND STRATEGIC OUTLINE BUSINESS CASE
ID Scheme Name Authority Sub Scheme
39 East-West Spine Sustainable Transport Corridor SCC East/West Spine
40 Northern Inner Ring Road Junctions SCC Northern Inner Ring Road 41 A33/A3024 Six Dials Junction SCC Six Dials Junction 42 Civic Centre Forecourt SCC Civic Centre Public Realm 43 Portland Terrace-Albion Place Bus Hubs SCC Portland Terrace 45 City Centre Bus Priority SCC Saltmarsh Bus Lane
Table 4-28- Southampton TCF Programme Low Scenario
Full details on the schemes and any variations for the Medium and Low scenarios are in Appendix 4.
4.8. Links with Other Funding Currently there are three other complementary standalone funding applications submitted awaiting decisions or being prepared for the Southampton City Region, summarised in Table 4-29. These are the Solent Future Mobility Zone, the Southampton Future High Streets Fund and the Access Fund 2020-21 1 year extension funding applications. Each of these and this TCF application complement each other but are separate projects that can stand alone if one of the others was not funded.
Solent FMZ Southampton TCF Southampton Access Fund Southampton Future High Streets Fund
Developing a Mobility as a Service (MaaS) proposal – starting in the Unviversities and then widening out.
Developing Rapid Bus, Park & Ride, Cycle Network and Smart Technology infrastructure on five corridors into Southampton
Getting into Work & Training –
Working with organisations to get individuals not in education, work or training into work through active travel
Southampton Workplace Travel Planners Network – growing the current 160 organisation network, majority are based on the TCF corridors, as an opportunity for champions to share ideas
Grant funding for organisations to improve facilities or services at journeys end – cycle parking, lockers, showers etc.
Public realm work at Bargate monument and on Bargate Street that connects the new Bargate Centre development with West Quay, includes removal of buses
Improvements to SolentGo multi-operator ticketing and payment system and a Demand Responsive Transport (DRT) system to out-of-town locations
Starting the transformation of Southampton City Centre with redefinition of public spaces, sustainable transport corridors and public transport interchanges
The Cool Route to School – working with 45 schools and 15,000 pupils at schools on the TCF corridors on BikeIt and Bikeability programmes/
Capital infrastructure at schools (including those in ATZs) to improve access for walking and cycling, and delivery of 10 temporary street closures
Upgrade to Above Bar Street to complement the East-West Spine Sustainable Trasnport Corridor
Creating new macro sustainable urban logistics hubs, trailing drone logistics from Hospitals,
Changing the local environment where people live through Active Travel Zones
Developing a walking & cycling culture – a programme of led rides, bike repair and practical help. A month long Festival of Cycling programme culminating Let’s Ride and new Criterium & Sportive events for 2020
Support for retail businesses in East Street
128
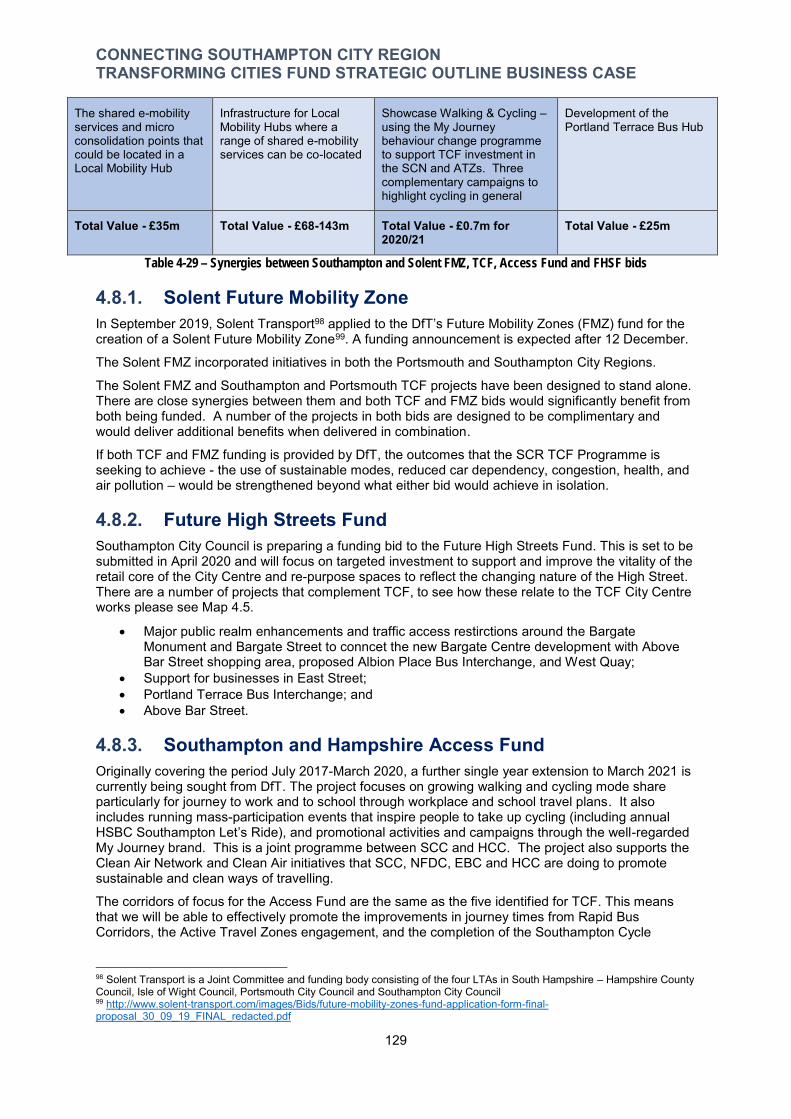
CONNECTING SOUTHAMPTON CITY REGION TRANSFORMING CITIES FUND STRATEGIC OUTLINE BUSINESS CASE
The shared e-mobility services and micro consolidation points that could be located in a Local Mobility Hub
Infrastructure for Local Mobility Hubs where a range of shared e-mobility services can be co-located
Showcase Walking & Cycling – Development of the Portland Terrace Bus Hub using the My Journey
behaviour change programme to support TCF investment in the SCN and ATZs. Three complementary campaigns to highlight cycling in general
Total Value - £35m Total Value - £68-143m Total Value - £0.7m for 2020/21
Total Value - £25m
Table 4-29 – Synergies between Southampton and Solent FMZ, TCF, Access Fund and FHSF bids
4.8.1. Solent Future Mobility Zone In September 2019, Solent Transport98 applied to the DfT’s Future Mobility Zones (FMZ) fund for the creation of a Solent Future Mobility Zone99. A funding announcement is expected after 12 December.
The Solent FMZ incorporated initiatives in both the Portsmouth and Southampton City Regions.
The Solent FMZ and Southampton and Portsmouth TCF projects have been designed to stand alone. There are close synergies between them and both TCF and FMZ bids would significantly benefit from both being funded. A number of the projects in both bids are designed to be complimentary and would deliver additional benefits when delivered in combination.
If both TCF and FMZ funding is provided by DfT, the outcomes that the SCR TCF Programme is seeking to achieve - the use of sustainable modes, reduced car dependency, congestion, health, and air pollution – would be strengthened beyond what either bid would achieve in isolation.
4.8.2. Future High Streets Fund Southampton City Council is preparing a funding bid to the Future High Streets Fund. This is set to be submitted in April 2020 and will focus on targeted investment to support and improve the vitality of the retail core of the City Centre and re-purpose spaces to reflect the changing nature of the High Street. There are a number of projects that complement TCF, to see how these relate to the TCF City Centre works please see Map 4.5.
Major public realm enhancements and traffic access restirctions around the Bargate Monument and Bargate Street to conncet the new Bargate Centre development with Above Bar Street shopping area, proposed Albion Place Bus Interchange, and West Quay;
Support for businesses in East Street; Portland Terrace Bus Interchange; and Above Bar Street.
4.8.3. Southampton and Hampshire Access Fund Originally covering the period July 2017-March 2020, a further single year extension to March 2021 is currently being sought from DfT. The project focuses on growing walking and cycling mode share particularly for journey to work and to school through workplace and school travel plans. It also includes running mass-participation events that inspire people to take up cycling (including annual HSBC Southampton Let’s Ride), and promotional activities and campaigns through the well-regarded My Journey brand. This is a joint programme between SCC and HCC. The project also supports the Clean Air Network and Clean Air initiatives that SCC, NFDC, EBC and HCC are doing to promote sustainable and clean ways of travelling.
The corridors of focus for the Access Fund are the same as the five identified for TCF. This means that we will be able to effectively promote the improvements in journey times from Rapid Bus Corridors, the Active Travel Zones engagement, and the completion of the Southampton Cycle
98 Solent Transport is a Joint Committee and funding body consisting of the four LTAs in South Hampshire – Hampshire County Council, Isle of Wight Council, Portsmouth City Council and Southampton City Council 99 http://www.solent-transport.com/images/Bids/future-mobility-zones-fund-application-form-final-proposal_30_09_19_FINAL_redacted.pdf
129

CONNECTING SOUTHAMPTON CITY REGION TRANSFORMING CITIES FUND STRATEGIC OUTLINE BUSINESS CASE
corridors to local residents, businesses, employers and schools to their staff. This will use both area wide My Journey marketing and more intensive, targeted local initiatives.
We expect this to result in faster increases in bus patronage and in cycle trips than if these complementary revenue activities were not underway or if there was no infrastructure investment. The Access Fund team has already been used to promote the early investment in the Southampton Cycle Network with bespoke campaigns for SCNs1, 3 & SCN5.
We can also use our My Journey and existing BBLP or HCC Communication platforms to communicate details of roadworks and temporary disruption resulting from TCF infrastructure construction activities, allowing commuters to better plan and adjust their journeys.
The Access Fund initiatives that have been delivered in 2018/19 are summarised in Figure 4.16.
Figure 4-16 – My Journey Access Fund Successes
My Journey, through campaigns and social media, will continue to be used as the basis for promoting the investment that TCF could make in the Southampton City Region. This is vital for the continued success of sustainable and active travel and will continue. SCC, HCC and Solent Transport will look to bid for any future Access Fund rounds (or successor funds) for beyond March 2021, to continue these important revenue funded activities to meet shared objectives between TCF and Access Fund;
4.9. Stakeholder Engagement For the Southampton TCF Programme there are two levels of stakeholders – Delivery Partners and Stakeholder Group - who we have engaged and developed schemes with.
Delivery Partners – identified as vital to deliver specific schemes or activities – Go South Coast (Bluestar and UniLink), First Southampton, Network Rail, South Western Railway, UHS Trust, University of Southampton, National Express, Highways England and Solent Transport.
Table 4-30 below identifies the roles and responsibilities of the primary delivery partners for the project and what each will contribute to the successful delivery of this proposed TCF programme.
Primary Delivery Partners Contribution and Responsibilities Southampton City Council
and Hampshire County Council
Local Highway Authorities for the Southampton City Region. Responsible for commissioning the works required to deliver the schemes in this programme.
Balfour Beatty Living Places and Atkins/Skanska
Term delivery partners for the two Highway Authorities. These consultancies will be heavily involved in the design and implementation of highway improvement and transport planning schemes included in the TCF bid.
Bus Operators - First Southampton and Go South
Coast (operating the Bluestar and UniLink bus services)
The two main bus operators in the Southampton City Region. Both will invest in complementary measures (including ticketing and priority systems) to complement TCF-funded corridor improvements.
130

CONNECTING SOUTHAMPTON CITY REGION TRANSFORMING CITIES FUND STRATEGIC OUTLINE BUSINESS CASE
Helping to facilitate the delivery of interchange improvements at the south side of Southampton Central Station and the construction of a drop-off area nad
Network Rail parking at Hamble Rail Station. Network Rail is also joint promoter of the Northam Rail bridge project, an important complementary infrastructure project.
Involved with the delivery of interchange improvements at the south side of Southampton Central Station, Park & Rail facilities at Southampton Airport Parkway, and the construction of a drop-off area and parking at Hamble Rail Station.
Co-ordination of key highway infrastructure projects and where TCF Schemes interaction with the SRN, delivery of the Redbridge Roundabout and M27 Southampton Junctions schemes which link to SCN1, SCN3 & SCN5. Funder of Travel Demand Management to act as a promotion route to businesses.
Major employer at University Hospital Southampton and promoters of Park & Ride facilities at Bargain Farm and development of the Health Campus.
Infrastructure for Wessex Lane-Swaythling Station Travel Hub and through Transport Research Group provide a level of academic and research support to Monitoring and Evaluation.
Supporting governance of the project, Local Assurance Framework, and oversees access to Solent SRTM. Will lead implementation of complimentary Solent FMZ programme if DfT funding awarded.
South Western Railway
Highways England
University Hospital Southampton NHS Foundation Trust
University of Southampton
Solent Transport
Table 4-30 – Summary of Roles and Responsibilities of Primary TCF Delivery Partners
TCF Stakeholder Group – This is a wider group of stakeholders who have a stake in TCF delivery and outputs – Eastleigh Borough Council, Test Valley District Council, New Forest District Council, Winchester City Council, Solent LEP, Go! Southampton (Business Improvement District), Solent University, West Quay, Southampton FC, South Hampshire Bus Operators Association (SHBOA representing all bus operators), taxi operators, Sustrans, Eastleigh College, and ABP Southampton.
4.9.1. Stakeholder Comments As part of the development of the Southampton TCF Programme and of the policy documents and plan that provided the long-list of options, SCC and HCC have carried out engagement with the two stakeholder groups (concurrently). Some of the comments made during engagement sessions and meetings are summarised in Table 4-31.
Theme Recurring comments
Broad agreement with policy approach
Strategy is constructive, promising, ambitious and well thought out. The proposals are positive and encouraging Support a shift towards public transport, walking, cycling and a reallocation/ reprioritisation of road space
Agree with direction for proposed strategy of a move away from the car
Agree with need to improve connections to areas surrounding city, beyond Southampton border and other local authorities
Strategy needs to show more ambition
The plans are not bold enough - take a stronger stance and be more visionary.
Do not just tinker and try to fix previous mistakes; have a local transport plan that transforms the city
Do more by standing up to businesses etc. that oppose this change
Do more to achieve goal of a healthy and active city, current proposals are not enough
The zero emission activities are not enough to improve air quality. e.g. Not enough is being done to help electric vehicles take off
Insufficient proposals to improve and encourage cycling
This does not go far enough in making the city equitable for those with reduced mobility
131

CONNECTING SOUTHAMPTON CITY REGION TRANSFORMING CITIES FUND STRATEGIC OUTLINE BUSINESS CASE
Theme Recurring comments
Will need more resource to implement and enforce some of these proposals
Policy needs to be bolder in managing car parking provision
Learn from and research other progressive cities (e.g. Rotterdam)
Something needs to be done sooner - get going on this now
Public Transport Improvements
More priority for buses on roads needed (more bus lanes and bus only routes, traffic lights set to let buses go through) to get bus journey times down or close to that of the car Invest in buses as they take cars off the road to improve air quality, congestion and are better for the environment than cars. A Park and Ride has been needed for 10 years, it needs to be put in ASAP to lower air pollution now Create mass transit system that connects outlying areas with each other not just to the City Centre. Improving public transport infrastructure should be priority. Should cover Southampton and the wider area which transforms the travel experience of users Run a more frequent bus service (every 10 minutes on all routes), some places only have one an hour.
Need to improve the reliability of public transport - buses are too slow and never on time
Interchanges
Current bus 'interchanges/hubs' at Central Station South, Vincent's Walk, Above Bar Street and the National Express Coach Station are too small, dispersed, and inadequate with low quality waiting facilities and ability to change between modes or services
Need an integrated transport hub near the railway station for coaches, buses and taxis
Cycle Improvements
Need to build a cycle network going in and out of the city to the suburbs
The city should focus on creating transport systems that improve public health
Delivering mode shift
Make the journey by car longer than the journey by public transport or bike
Putting the needs of people – not cars – at the heart of your plans is the right thing to do
The Council must actively work with surrounding local authorities to mitigate and plan for improved public transport/cycling
Table 4-31– Recurring themes raised by respondents of most relevance to TCF
Other Stakeholders have been engaged with as part of the TCF option generation process. Workshops involving officers from a range of disciplines internal within SCC and HCC and with key stakeholders including both hospitals and universities, businesses, transport operators. Specifically, these include:
• Public Transport Strategy Stakeholder Workshop held on 25th June 2018 • Go Southampton business briefing and workshop held on 29th September 2018 • Workshops with individual bus operators – 28, 29 & 30th November 2018 • Workshops with individual bus operators – 8th January 2019 • Public Transport Strategy Stakeholder Workshop held on 14th February 2019 • TCF Stakeholder briefing and workshop session held on 25th April 2019 • Rapid Bus Corridors Workshop held on 29th April 2019 with Bus Operators • Update to Travel Plan Network on TCF progress on 27th June 2019 • Newsletter update to local businesses via Travel Plan Network on 7th August 2019 • TCF Stakeholder briefing session held on 24th September 2019
In Summer 2018 extensive consultation was carried out whilst developing the Connected Southampton 2040 Transport Strategy (LTP4). This 12-week public consultation generated feedback and views from residents, businesses and local transport operator about issues and problem areas and potential solutions in the city, which was has guided the development of the TCF Programme, and these have subsequently incorporated in the compilation of the longlist.
132
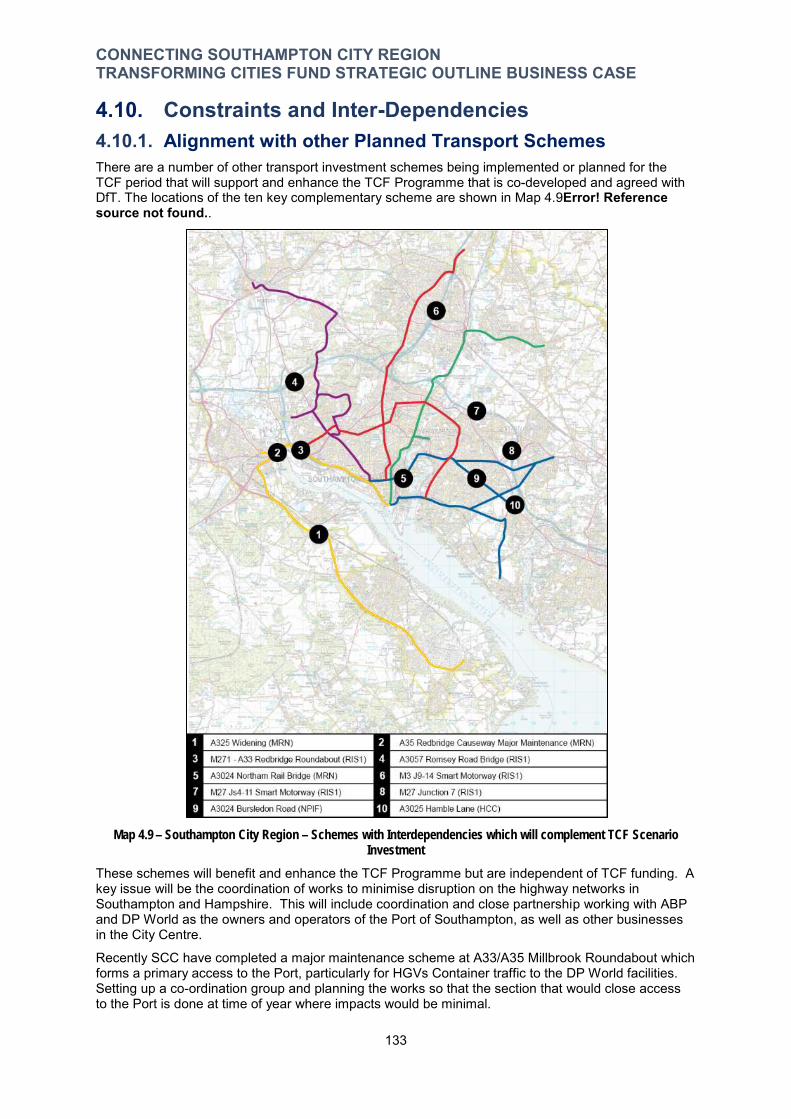
CONNECTING SOUTHAMPTON CITY REGION TRANSFORMING CITIES FUND STRATEGIC OUTLINE BUSINESS CASE
4.10. Constraints and Inter-Dependencies 4.10.1. Alignment with other Planned Transport Schemes There are a number of other transport investment schemes being implemented or planned for the TCF period that will support and enhance the TCF Programme that is co-developed and agreed with DfT. The locations of the ten key complementary scheme are shown in Map 4.9Error! Reference source not found..
Map 4.9 – Southampton City Region – Schemes with Interdependencies which will complement TCF Scenario Investment
These schemes will benefit and enhance the TCF Programme but are independent of TCF funding. A key issue will be the coordination of works to minimise disruption on the highway networks in Southampton and Hampshire. This will include coordination and close partnership working with ABP and DP World as the owners and operators of the Port of Southampton, as well as other businesses in the City Centre.
Recently SCC have completed a major maintenance scheme at A33/A35 Millbrook Roundabout which forms a primary access to the Port, particularly for HGVs Container traffic to the DP World facilities. Setting up a co-ordination group and planning the works so that the section that would close access to the Port is done at time of year where impacts would be minimal.
133
CONNECTING SOUTHAMPTON CITY REGION TRANSFORMING CITIES FUND STRATEGIC OUTLINE BUSINESS CASE
SCC and HCC are in close partnership working with Highways England on the Route Investment Strategy 1 (RIS1) schemes in the Southampton City Region area. The Route Sponsor (Area 3) through Solent Transport Strategy Working Group is aware and supports the Southampton TCF Programme.
These schemes are funded, and contractors will be on site delivering these schemes during the TCF period and will provide direct or indirect benefits to TCF:
M27 Smart Motorways (Junctions 4-11) (Highways England RIS1) March 2018-March 2020 – currently under construction – to upgrade the M27 between Southampton and Fareham to Smart Motorway standard to provide additional strategic capacity, through hard shoulder running and variable speed limits, this supports TCF by providing a strategic route through the City Region but also allows for pedestrian, bus and cycle connections across it and support improving productivity;
Corridor 1 - M271-A33 Redbridge Roundabout (Highways England RIS1) May 2019-March 2020 – capacity upgrade to the roundabout at southern end of M271 to provide free-flow ‘jet lane’ and lane widening on primary route to the Port, includes significant enhancements to the pedestrian and cycle facilities which form part of SCN1 and SCN8 – Redbridge Roundabout is the junction of these routes, and bus priority on the Southampton-Totton-Waterside Rapid Bus Corridor. Highways England will also deliver an early measures funded TCF scheme for Redbridge Roundabout which will complete the SCN1 corridor in Southampton.
Corridor 2 - A3057 Romsey Road Bridge (Highways England RIS1) 2018-2020 replacement of existing single lane structures across M27 on A3057 north west of Southampton. Will provide enhanced cycle facilities and connectivity between Southampton, Lordshill and Romsey. While not on a TCF corridor it will have supporting benefits in reducing the barrier of the M27 for cycle journeys;
Corridor 3 - SCN5 Inner Avenue Cycle Freeway Scheme and SCN2-3 between Northam, Bitterne and Bursledon – will deliver segregated on-road safe cycle lanes in the direction of traffic flow between London Road and Lodge Road
Corridors 3 & 4 - M3 Smart Motorways (Junctions 9-14) (Highways England RIS1) March 2020- upgrade the M3 between Winchester and Southampton to Smart Motorways standard to provide additional strategic capacity on important route for access to the Port of Southampton, this supports TCF with junction improvements at M3 J12 to support Rapid Bus Corridor from Winchester-Chandler’s Ford-Southampton;
Corridor 5a - M27 Southampton Junctions (Highways England RIS1) March 2020-March 2021 – capacity and safety improvements to M27 Junction 8 and A27 Windhover Roundabout at eastern end of Corridor 5 on Bursledon Road. Will provide signalisation of both roundabouts and new pedestrian and cycle facilities between Windhover, Junction 8 and Hedge End removing a barrier caused by the M27 for cycling between Hedge End, Hamble and Southampton. This will complete the SCN3 corridor on Bursledon Road. This originally was a larger scheme involving junction improvements along the A3024 corridor into Southampton and removal of the significant pinch point at Northam Rail Bridge but was de-scoped by DfT in February 2019 due to lower transport benefits for the SRN;
Corridor 5a - M27 Junction 7 (Highways England & Hampshire County Council) – 2020 – upgrading to the traffic signals to MOVA at M27 Junction 7, and signal and cycle-pedestrian crossing facility upgrades to A334/A27 Kanes Hill Roundabout (Hampshire) and A334 Thornhill Park Road/Hinkler Road junction in Southampton plus Bluetooth and new EVMS in Southampton. This will support reducing queuing around M27 J7 which is caused by high levels of traffic crossing the M27 and exiting from it and the interaction with the Kanes Hill and Hinkler Road junctions which contribute to the queuing. This will by reduce congestion and improve journey times for buses coming from Hedge End into Southampton along the A334 which at peak times contributes significantly to poor journey time reliability. The wider TCF Programme will support improvements to this route continuing from Bitterne into the City Centre;
Corridor 5a - A3024 Eastern Access to Southampton (NPIF) (Southampton City Council) January 2019-March 2020 – originally part of the M27 Southampton Junctions project but taken on by SCC in advance of any final de-scoping position. This £5.7m investment will deliver journey time reliability improvements, which will benefit bus passengers and also complete a section of SCN3 along A3024 Bursledon Road from the city boundary to Bitterne. It will provide
134

CONNECTING SOUTHAMPTON CITY REGION TRANSFORMING CITIES FUND STRATEGIC OUTLINE BUSINESS CASE
signal improvements to 11 junctions with new GLOSA technology and a segregated Cycle Freeway connecting communities in Bursledon, Sholing and Thornhill with Bitterne District Centre and the City Centre (via other funded quieter cycle route via SCN2). This provides early benefits and completion for TCF Corridor 5 with the objectives of improving bus connectivity, cycle mode share and improving air quality;
There are a number of other complementary schemes currently seeking funding:
Corridor 1 - A35 Redbridge Causeway Major Maintenance Major Road Network (MRN) scheme (HCC) – a causeway carries the A35 dual carriageway (a major non-motorway crossing) across the mouth of the River Test and a railway line. Inspections by HCC have determined that the bridge structures are deteriorating to the extent that weight and/or lane restrictions will be imposed. This scheme will fully replace all existing reinforced concrete piers that carry the to ensure the continued resilience and reliable operation of this important bridge connecting Totton and the New Forest with Southampton;
Corridor 1 - A326 Totton Western Bypass and Marchwood Bypass improvements (HCC) – to deliver capacity improvements at congested roundabouts and junctions on this key route from Hythe to Totton - addressing a forecast rise in traffic on this route by 15% between 2017 and 2036, which will support planned new development in the Waterside area at Marchwood and Hythe through improving journey time reliability and enable faster, more reliable bus passenger journeys.
Corridor 1 – A33 West Quay Road Realignment Local Large Major (LLM) scheme (SCC) – to improve journey time reliability and access to the Eastern Docks of the Port of Southampton, helping enable Port Masterplan growth to be realised. This scheme would complement the Port’s recent achievement of Freeport status.
Corridor 2 - Health Campus and Park & Ride (UHS Foundation Trust) - proposed Health Campus and 1,000 space permanent Park and Ride site on this site north of Brownhill Way.
Corridor 5a - A3024 Northam Rail Bridge Replacement Major Road Network (SCC and Network Rail) - was part of M27 Southampton Junctions scheme but de-scoped, a joint scheme has now been submitted to Major Road Network funding. The project is to replace the existing single carriageway structure with three new ones (two 2-lane highway, with potential for bus priority and one pedestrian and cycling on SCN3). This will replace the current structure taking the A3024 across the South Western Main Line and Eastern Docks Branch Line at Northam on TCF Corridor 5. The bridge is an ongoing significant maintenance asset for SCC and Network Rail with a current 7.5t weight restriction (except for buses) that if it continues to deteriorate could necessitate further restrictions preventing all traffic from crossing it. This would have significant impacts for accessibility and connectivity into Southampton City Centre from the east, including the SRN, as it is the main route for public transport across the River Itchen.
It is also a significant bottleneck and contributing to slow and inconsistent journey times for buses on the A3024. The bridge also has poor facilities for people walking and cycling acting as a constraint on high levels of cycling from eastern Southampton. TCF, and the NPIF investment on Bursledon Road, will provide an enhancement to this existing priority system by making it more dynamic and improving journey time reliability for the Rapid Bus Corridor. The full benefits for people walking, cycling and on public transport on this corridor are constrained by the bridge. Early sifting identified that the costs for the bridge (in excess of £60m) fall outside of TCF, and the inclusion of the A3024 as part of the MRN has opened up the opportunity to seek funding through the MRN.
Delivery of this scheme will mean the full benefits for the corridor will be realised as the final pinch point will be removed and bus priority can be provided. Without it (but with TCF funding) there will be still significant benefits for people walking, cycling and on buses but these will be suppressed.
Corridor 5b - A3025 Hamble Lane Improvement (HCC) – to widen Hamble Lane between the Tesco roundabout and the A3025 Portsmouth Road junction to reduce congestion and delay along this section of this important access route to Netley Abbey and Hamble;
135

CONNECTING SOUTHAMPTON CITY REGION TRANSFORMING CITIES FUND STRATEGIC OUTLINE BUSINESS CASE
4.10.2. External Dependencies Ticketing/payment solutions by bus operators e.g. introducing price-capped daily and weekly
tickets across multiple operators in urban areas by 2022; Fleet renewal - bus operators commitment to only purchase next generation ultra-low or zero
emissions buses from 2025 (but starting this process by 2023 in some urban areas; Land from Districts & Boroughs; Northam Estate Regeneration Plans (enabling reconfiguration of Northam Road/ Princes
Street junction); Tendering for Park & Ride service; SWR plans for ANPR and additional space for parking at Southampton Airport Parkway and
Eastleigh; UHS Foundation Trust, regarding the development of the Health Campus and Park & Ride; Co-operation from SWR and Network Rail on the delivery of interchange improvements at the
south side of Southampton Central Station and to construct drop off area at Hamble rail station;
National Express requirements; Planning – Fawley Power Station, Health Campus, Toys R Us site, listed building consent; BBLP and Skanska Apprenticeship programmes; and Co-operation from commercial developers and the City Council’s Commercial Property Joint
Venture on closure of Eastgate Street Multi-Storey Car Park and construction of new MSCP in vicinity of Lime Street, by Inner Ring Road.
4.10.3. Complementary Measures There are a number of complementary measures, policies and programmes that are currently in operation in the City Region. These interlink with the main TCF programme to provide a comprehensive approach to transforming transport, boosting productivity and fostering modal shift.
M3 & M27 Travel Demand Management Programme (Southampton City Council, Hampshire County Council, Portsmouth City Council & Highways England) – Designated Funds) – 2019-2021 – primarily directed at supporting modal shift and air quality improvements on the M3 and M27 while the major construction programme is on-site through Workplace Travel Planning, Communications and targeted C-ITS infrastructure to improve better journey time reliability for buses along A27 parallel to M27. This covers the space between the Southampton and Portsmouth City Regions through Segensworth-Swanwick and covers Whiteley as a major employment hub for the Solent. This will promote and complement the cycling and public transport TCF Programmes in both Southampton and Portsmouth. This will utilise the My Journey brand but be is focused on activities that relate to the SRN and the Smart Motorways programme but has close synergies and crossover with TCF (as TCF will implement many complementary measures to encourage modal shift away from short-hop trips on the M3 and M27);
University Hospital area Residents Parking scheme – In July 2019, a consultation was carried out with residents on a proposed extension to the scope of the area covered by residents permit parking (current area in red). This proposed extending parking restrictions to roads with 4,000 properties that are within a 20 minute walk of the University Hospital site. The majority of areas surveyed supported the proposals, which will be implemented in two phases from spring 2020. Once implemented, this will discourage staff from commuting by car, helping increase the use of the Hospital Park & Ride site and support mode shift to bus, cycling and walking.
Southampton Car Parking Plan - looks to reduce and relocate car parking in Southampton City Centre as part of the suite of measures to reduce car-borne trips into the City Centre. The proposed closure of Civic Centre Forecourt and Albion Place-Castle Way car parks, (central car parks close to the retail heart but on the main public transport and active travel spine) and repurposing them as gateway public realm and public transport hubs is part of the approach for a Liveable City Centre. Other measures identified in the Parking Plan are being proposed through TCF including new EVMS, junction changes on the Inner Ring Road to reduce congestion and promote a ‘Parking Ring’, and public realm and streetscape changes
136

CONNECTING SOUTHAMPTON CITY REGION TRANSFORMING CITIES FUND STRATEGIC OUTLINE BUSINESS CASE
that create more space for people. This supports the implementation of Park & Ride from Bargain Farm by reducing the easy and surplus of car parking in the City Centre reducing the attractiveness of driving into the City Centre. Parking still has a role to play in supporting the City Centre as an economic hub for some trips, but this enables greater transformation and take up of sustainable and active modes;
Case Study: City Centre Parking, Public Realm and Accessibility Currently there are 16,000 publicly accessible parking spaces in Southampton City Centre of which SCC controls only a third. Average occupancy rate of City Centre car parks is 60% on weekdays, and slightly higher at weekends. Occupancy rates peak at 80% at West Quay car park.
This large supply and relative ease of finding a space is a factor that encourages high car mode share into the City Centre to be made by car, and acts to reduce the market for bus and active travel.
Removing these car parks and redeveloping other smaller ones, along with changes to the highways space and repurposing as gateway public realm, sustainable transport corridors and public transport hubs is part of the approach to make the City Centre more liveable, reduce car trips, support public transport and greater intensification.
City Streets 2 – will deliver a complementary programme of a series of street improvements and public realm projects that will underpin the successful growth of the City Centre. Funding from developer contributions from many of the 12 Very Important Projects will be sought.
4.10.4. Constraints Table 4-32 below summarises the main expected constraints that could affect TCF scheme development and delivery and what the two LTAs would do to manage and take account of these constraints.
Constraint Issue or Potential Risk How impact will be mitigated
Land Land owned by a Third Party could be required
The majority of TCF H, M & L scenario schemes are within the highway boundary so third party land will not be required. For the small number of schemes that do require third party land, the LTAs’ Legal Services team will commence work immediately to secure the land once TCF funding has been confirmed.
Legal objections Through Traffic Regulation Order process, interested parties could object to removal of kerbside parking.
Where removal of kerbside parking is proposed, in order to help reduce congestion or delay for buses or allow cycle infrastructure improvements, the LTAs will ensure wherever possible that alternative parking provision (such as blue badge parking) or loading bays are available nearby.
Traffic Management
Significant congestion and traffic delay impacts during construction if works not carefully phased. This could worsen air quality.
We will liaise with HE regularly on progress in delivery of their schemes in the City Region. Both LTAs will work with respective highway partners BBLP and Skanska to programme construction carefully to ensure that works on adjacent corridors are staggered. Air quality monitoring will be undertaken for schemes within AQMAs.
Retaining access to Port of Southampton
TCF related construction work could hinder access to the Port, reducing its’ efficient operation and competitiveness.
During construction of measures on Corridor 1 along Redbridge Road, Millbrook Road West and Mountbatten Way, construction work will be undertaken at quieter times using overnight working as necessary. Liaison with ABP and DP World will be vital – will propose to use a similar relationship to previous successfully delivered major projects for Platform Road and Millbrook Roundabout
137

CONNECTING SOUTHAMPTON CITY REGION TRANSFORMING CITIES FUND STRATEGIC OUTLINE BUSINESS CASE
Constraint Issue or Potential Risk How impact will be mitigated
Environmental constraints
Removal of existing trees and vegetation could worsen carbon dioxide levels & should not be done during nesting season
For each tree removed, 3 new trees will be planted. As part of construction delivery planning early engagement will take place with Arborcultural Officers. Any schemes which require trees to be removed will have work programmed outside of nesting season.
Planning constraints
If planning permission is required, this would lengthen timescales for scheme design/ delivery.
Any schemes expected to require planning permission will be identified at an early stage and pre-application discussions will take place with the appropriate Local Planning Authority to ensure potential issues or concerns can be addressed.
Flood Risk Removal of grass verges to provide new cycle infrastructure improvements could increase surface runoff.
Early engagement will take place with the flood risk management team to identify areas that experience problems during heavy rainfall. The LTAs will work with them to ensure that suitable mitigation measures are developed.
Table 4-32 – Summary of main constraints relating to TCF scheme delivery
In many cases, early engagement with technical specialists and robust programme management, by building in time and resource to address issues, will be an important guiding principle to avoid unforeseen or adverse impacts on scheme delivery.
138
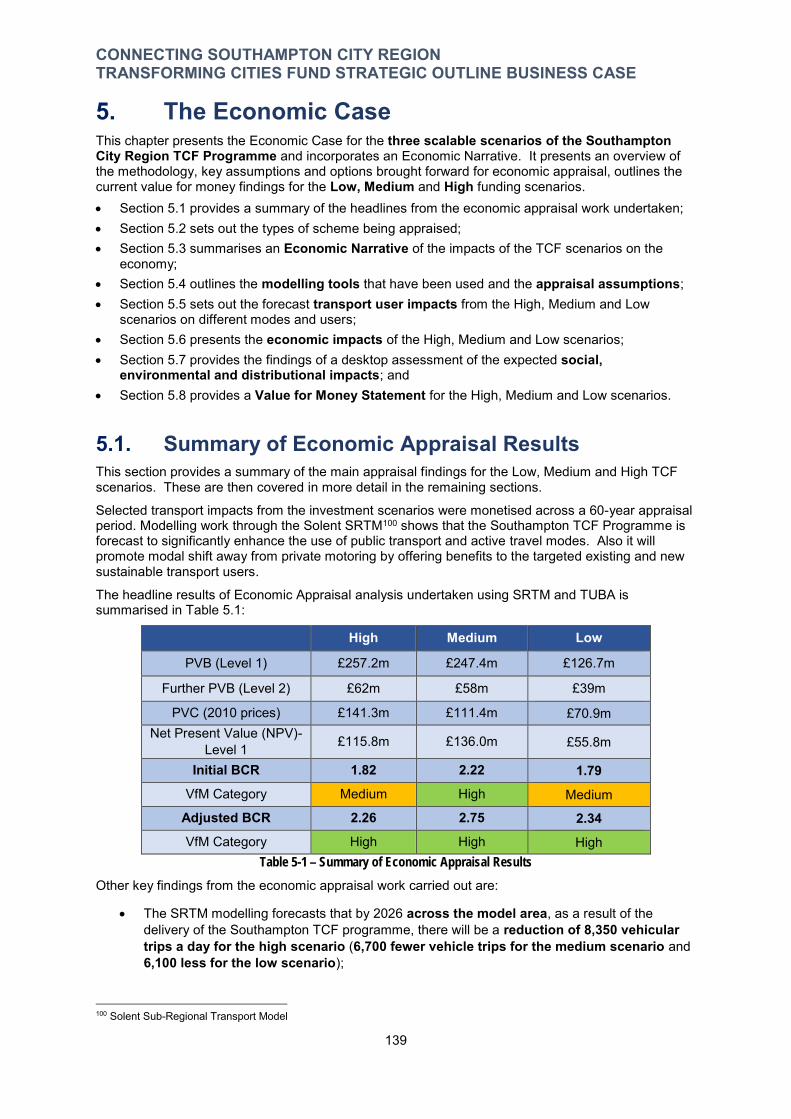
CONNECTING SOUTHAMPTON CITY REGION TRANSFORMING CITIES FUND STRATEGIC OUTLINE BUSINESS CASE
5. The Economic Case This chapter presents the Economic Case for the three scalable scenarios of the Southampton City Region TCF Programme and incorporates an Economic Narrative. It presents an overview of the methodology, key assumptions and options brought forward for economic appraisal, outlines the current value for money findings for the Low, Medium and High funding scenarios. Section 5.1 provides a summary of the headlines from the economic appraisal work undertaken; Section 5.2 sets out the types of scheme being appraised; Section 5.3 summarises an Economic Narrative of the impacts of the TCF scenarios on the
economy; Section 5.4 outlines the modelling tools that have been used and the appraisal assumptions; Section 5.5 sets out the forecast transport user impacts from the High, Medium and Low
scenarios on different modes and users; Section 5.6 presents the economic impacts of the High, Medium and Low scenarios; Section 5.7 provides the findings of a desktop assessment of the expected social,
environmental and distributional impacts; and Section 5.8 provides a Value for Money Statement for the High, Medium and Low scenarios.
5.1. Summary of Economic Appraisal Results This section provides a summary of the main appraisal findings for the Low, Medium and High TCF scenarios. These are then covered in more detail in the remaining sections.
Selected transport impacts from the investment scenarios were monetised across a 60-year appraisal period. Modelling work through the Solent SRTM100 shows that the Southampton TCF Programme is forecast to significantly enhance the use of public transport and active travel modes. Also it will promote modal shift away from private motoring by offering benefits to the targeted existing and new sustainable transport users.
The headline results of Economic Appraisal analysis undertaken using SRTM and TUBA is summarised in Table 5.1:
High Medium Low
PVB (Level 1) £257.2m £247.4m £126.7m
Further PVB (Level 2) £62m £58m £39m
PVC (2010 prices) £141.3m £111.4m £70.9m Net Present Value (NPV)-
Level 1 £115.8m £136.0m £55.8m
Initial BCR 1.82 2.22 1.79 VfM Category Medium High Medium
Adjusted BCR 2.26 2.75 2.34 VfM Category High High High
Table 5-1 – Summary of Economic Appraisal Results
Other key findings from the economic appraisal work carried out are:
The SRTM modelling forecasts that by 2026 across the model area, as a result of the delivery of the Southampton TCF programme, there will be a reduction of 8,350 vehicular trips a day for the high scenario (6,700 fewer vehicle trips for the medium scenario and 6,100 less for the low scenario);
100 Solent Sub-Regional Transport Model
139
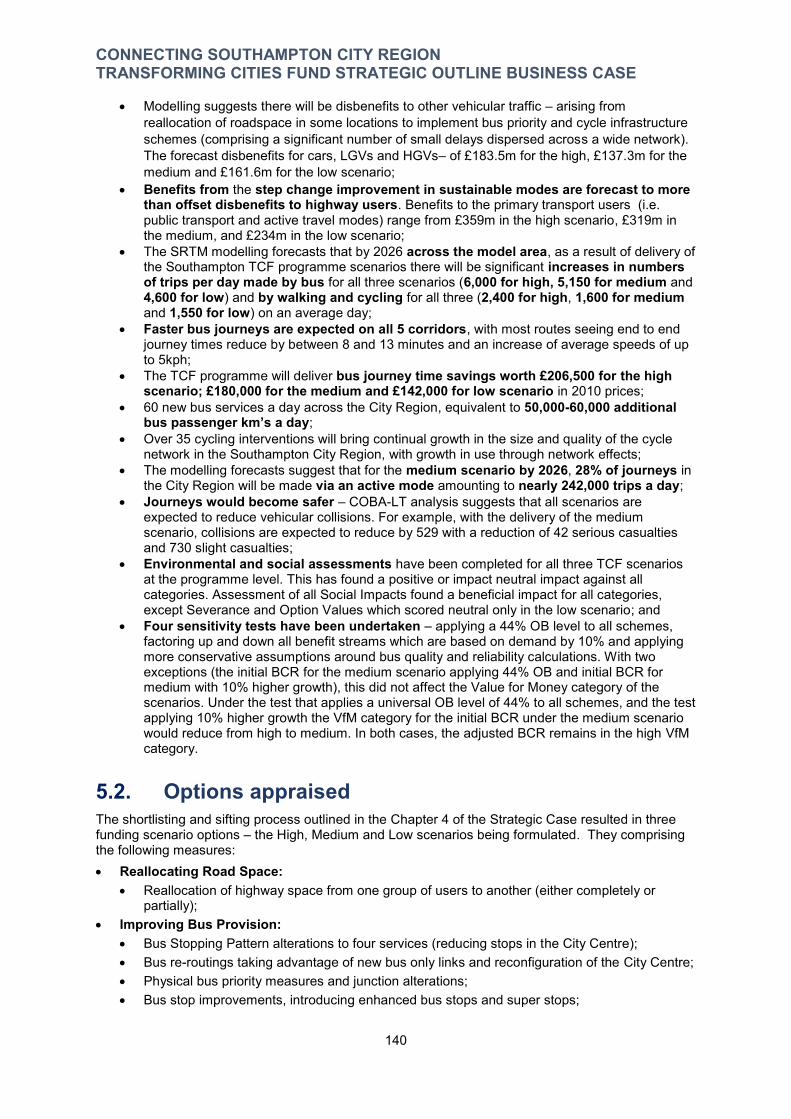
CONNECTING SOUTHAMPTON CITY REGION TRANSFORMING CITIES FUND STRATEGIC OUTLINE BUSINESS CASE
Modelling suggests there will be disbenefits to other vehicular traffic – arising from reallocation of roadspace in some locations to implement bus priority and cycle infrastructure schemes (comprising a significant number of small delays dispersed across a wide network). The forecast disbenefits for cars, LGVs and HGVs– of £183.5m for the high, £137.3m for the medium and £161.6m for the low scenario;
Benefits from the step change improvement in sustainable modes are forecast to more than offset disbenefits to highway users. Benefits to the primary transport users (i.e. public transport and active travel modes) range from £359m in the high scenario, £319m in the medium, and £234m in the low scenario;
The SRTM modelling forecasts that by 2026 across the model area, as a result of delivery of the Southampton TCF programme scenarios there will be significant increases in numbers of trips per day made by bus for all three scenarios (6,000 for high, 5,150 for medium and 4,600 for low) and by walking and cycling for all three (2,400 for high, 1,600 for medium and 1,550 for low) on an average day;
Faster bus journeys are expected on all 5 corridors, with most routes seeing end to end journey times reduce by between 8 and 13 minutes and an increase of average speeds of up to 5kph;
The TCF programme will deliver bus journey time savings worth £206,500 for the high scenario; £180,000 for the medium and £142,000 for low scenario in 2010 prices;
60 new bus services a day across the City Region, equivalent to 50,000-60,000 additional bus passenger km’s a day;
Over 35 cycling interventions will bring continual growth in the size and quality of the cycle network in the Southampton City Region, with growth in use through network effects;
The modelling forecasts suggest that for the medium scenario by 2026, 28% of journeys in the City Region will be made via an active mode amounting to nearly 242,000 trips a day;
Journeys would become safer – COBA-LT analysis suggests that all scenarios are expected to reduce vehicular collisions. For example, with the delivery of the medium scenario, collisions are expected to reduce by 529 with a reduction of 42 serious casualties and 730 slight casualties;
Environmental and social assessments have been completed for all three TCF scenarios at the programme level. This has found a positive or impact neutral impact against all categories. Assessment of all Social Impacts found a beneficial impact for all categories, except Severance and Option Values which scored neutral only in the low scenario; and
Four sensitivity tests have been undertaken – applying a 44% OB level to all schemes, factoring up and down all benefit streams which are based on demand by 10% and applying more conservative assumptions around bus quality and reliability calculations. With two exceptions (the initial BCR for the medium scenario applying 44% OB and initial BCR for medium with 10% higher growth), this did not affect the Value for Money category of the scenarios. Under the test that applies a universal OB level of 44% to all schemes, and the test applying 10% higher growth the VfM category for the initial BCR under the medium scenario would reduce from high to medium. In both cases, the adjusted BCR remains in the high VfM category.
5.2. Options appraised The shortlisting and sifting process outlined in the Chapter 4 of the Strategic Case resulted in three funding scenario options – the High, Medium and Low scenarios being formulated. They comprising the following measures: Reallocating Road Space:
Reallocation of highway space from one group of users to another (either completely or partially);
Improving Bus Provision: Bus Stopping Pattern alterations to four services (reducing stops in the City Centre); Bus re-routings taking advantage of new bus only links and reconfiguration of the City Centre; Physical bus priority measures and junction alterations; Bus stop improvements, introducing enhanced bus stops and super stops;
140
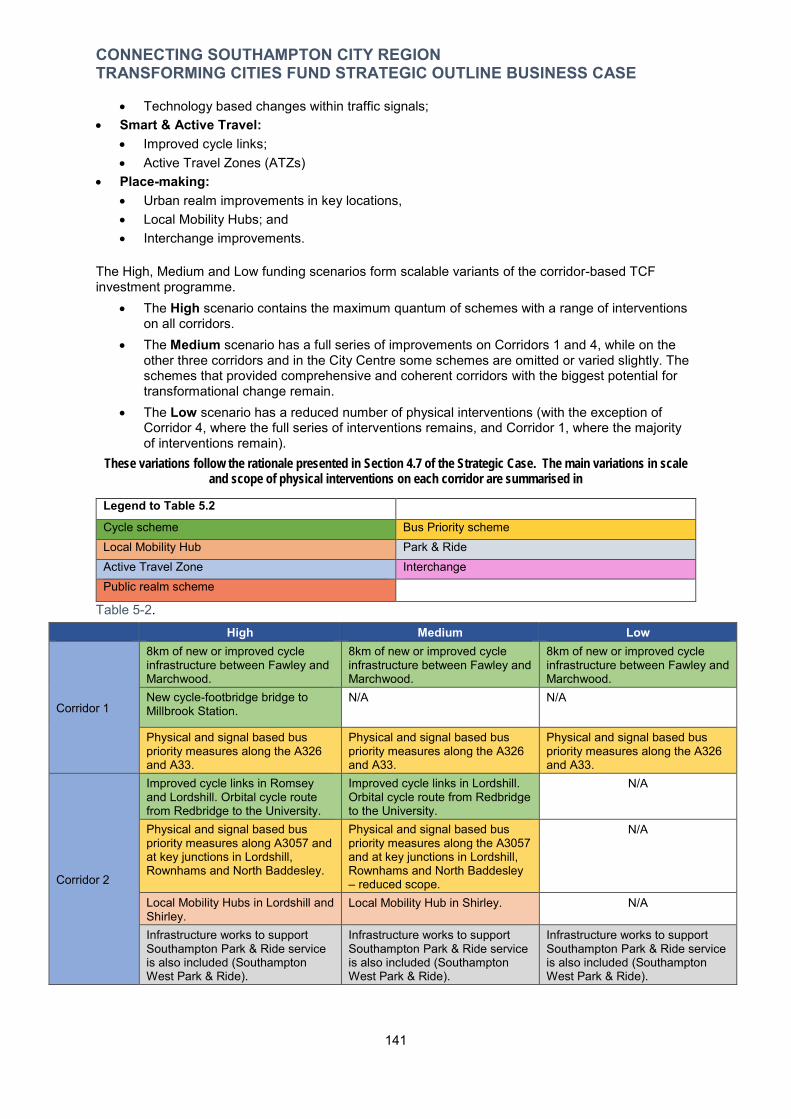
CONNECTING SOUTHAMPTON CITY REGION TRANSFORMING CITIES FUND STRATEGIC OUTLINE BUSINESS CASE
Technology based changes within traffic signals; Smart & Active Travel:
Improved cycle links; Active Travel Zones (ATZs)
Place-making: Urban realm improvements in key locations, Local Mobility Hubs; and Interchange improvements.
The High, Medium and Low funding scenarios form scalable variants of the corridor-based TCF investment programme.
The High scenario contains the maximum quantum of schemes with a range of interventions on all corridors.
The Medium scenario has a full series of improvements on Corridors 1 and 4, while on the other three corridors and in the City Centre some schemes are omitted or varied slightly. The schemes that provided comprehensive and coherent corridors with the biggest potential for transformational change remain.
The Low scenario has a reduced number of physical interventions (with the exception of Corridor 4, where the full series of interventions remains, and Corridor 1, where the majority of interventions remain).
These variations follow the rationale presented in Section 4.7 of the Strategic Case. The main variations in scale and scope of physical interventions on each corridor are summarised in
Legend to Table 5.2
Cycle scheme Bus Priority scheme Local Mobility Hub Park & Ride Active Travel Zone Interchange Public realm scheme
Table 5-2. High Medium Low
Corridor 1
8km of new or improved cycle infrastructure between Fawley and Marchwood.
8km of new or improved cycle infrastructure between Fawley and Marchwood.
8km of new or improved cycle infrastructure between Fawley and Marchwood.
New cycle-footbridge bridge to Millbrook Station.
N/A N/A
Physical and signal based bus priority measures along the A326 and A33.
Physical and signal based bus priority measures along the A326 and A33.
Physical and signal based bus priority measures along the A326 and A33.
Corridor 2
Improved cycle links in Romsey and Lordshill. Orbital cycle route from Redbridge to the University.
Improved cycle links in Lordshill. Orbital cycle route from Redbridge to the University.
N/A
Physical and signal based bus priority measures along A3057 and at key junctions in Lordshill, Rownhams and North Baddesley.
Physical and signal based bus priority measures along the A3057 and at key junctions in Lordshill, Rownhams and North Baddesley – reduced scope.
N/A
Local Mobility Hubs in Lordshill and Shirley.
Local Mobility Hub in Shirley. N/A
Infrastructure works to support Southampton Park & Ride service is also included (Southampton West Park & Ride).
Infrastructure works to support Southampton Park & Ride service is also included (Southampton West Park & Ride).
Infrastructure works to support Southampton Park & Ride service is also included (Southampton West Park & Ride).
141
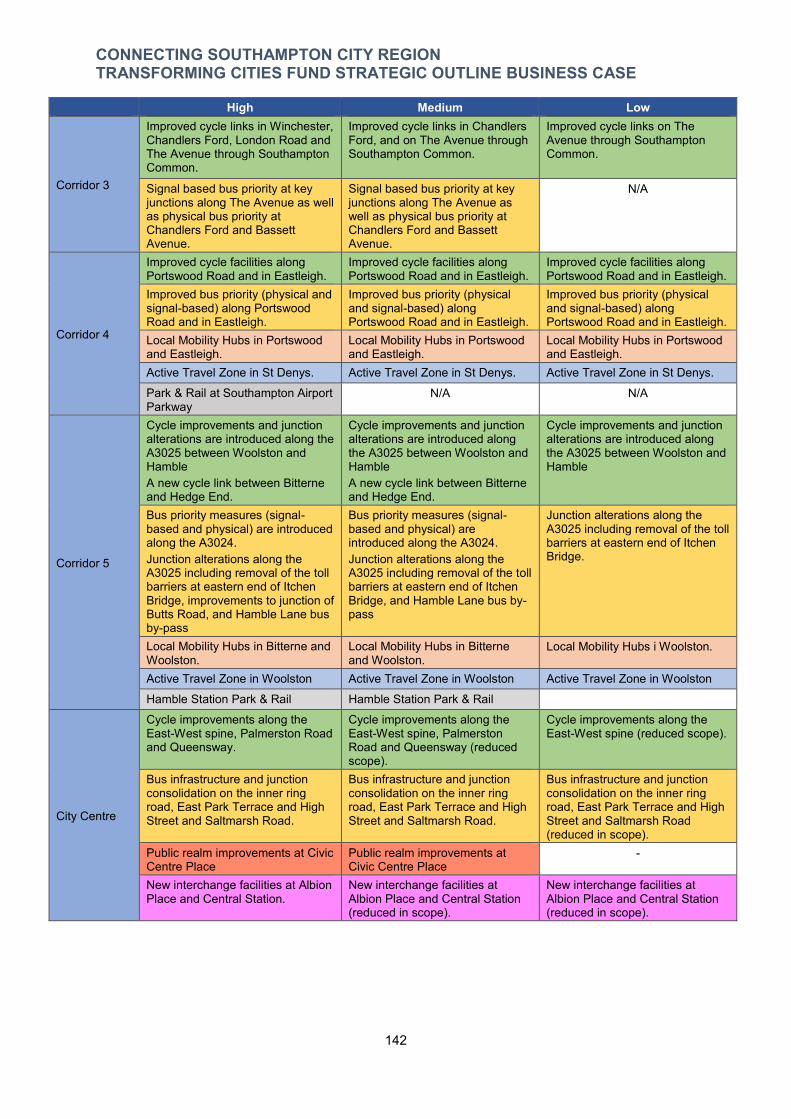
CONNECTING SOUTHAMPTON CITY REGION TRANSFORMING CITIES FUND STRATEGIC OUTLINE BUSINESS CASE
High Medium Low
Corridor 3
Improved cycle links in Winchester, Chandlers Ford, London Road and The Avenue through Southampton Common.
Improved cycle links in Chandlers Ford, and on The Avenue through Southampton Common.
Improved cycle links on The Avenue through Southampton Common.
Signal based bus priority at key junctions along The Avenue as well as physical bus priority at Chandlers Ford and Bassett Avenue.
Signal based bus priority at key junctions along The Avenue as well as physical bus priority at Chandlers Ford and Bassett Avenue.
N/A
Corridor 4
Improved cycle facilities along Portswood Road and in Eastleigh.
Improved cycle facilities along Portswood Road and in Eastleigh.
Improved cycle facilities along Portswood Road and in Eastleigh.
Improved bus priority (physical and signal-based) along Portswood Road and in Eastleigh.
Improved bus priority (physical and signal-based) along Portswood Road and in Eastleigh.
Improved bus priority (physical and signal-based) along Portswood Road and in Eastleigh.
Local Mobility Hubs in Portswood and Eastleigh.
Local Mobility Hubs in Portswood and Eastleigh.
Local Mobility Hubs in Portswood and Eastleigh.
Active Travel Zone in St Denys. Active Travel Zone in St Denys. Active Travel Zone in St Denys.
Park & Rail at Southampton Airport Parkway
N/A N/A
Corridor 5
Cycle improvements and junction alterations are introduced along the A3025 between Woolston and Hamble A new cycle link between Bitterne and Hedge End.
Cycle improvements and junction alterations are introduced along the A3025 between Woolston and Hamble A new cycle link between Bitterne and Hedge End.
Cycle improvements and junction alterations are introduced along the A3025 between Woolston and Hamble
Bus priority measures (signal-based and physical) are introduced along the A3024. Junction alterations along the A3025 including removal of the toll barriers at eastern end of Itchen Bridge, improvements to junction of Butts Road, and Hamble Lane bus by-pass
Bus priority measures (signal-based and physical) are introduced along the A3024. Junction alterations along the A3025 including removal of the toll barriers at eastern end of Itchen Bridge, and Hamble Lane bus by-pass
Junction alterations along the A3025 including removal of the toll barriers at eastern end of Itchen Bridge.
Local Mobility Hubs in Bitterne and Woolston.
Local Mobility Hubs in Bitterne and Woolston.
Local Mobility Hubs i Woolston.
Active Travel Zone in Woolston Active Travel Zone in Woolston Active Travel Zone in Woolston
Hamble Station Park & Rail Hamble Station Park & Rail
City Centre
Cycle improvements along the East-West spine, Palmerston Road and Queensway.
Cycle improvements along the East-West spine, Palmerston Road and Queensway (reduced scope).
Cycle improvements along the East-West spine (reduced scope).
Bus infrastructure and junction consolidation on the inner ring road, East Park Terrace and High Street and Saltmarsh Road.
Bus infrastructure and junction consolidation on the inner ring road, East Park Terrace and High Street and Saltmarsh Road.
Bus infrastructure and junction consolidation on the inner ring road, East Park Terrace and High Street and Saltmarsh Road (reduced in scope).
Public realm improvements at Civic Centre Place
Public realm improvements at Civic Centre Place
-
New interchange facilities at Albion Place and Central Station.
New interchange facilities at Albion Place and Central Station (reduced in scope).
New interchange facilities at Albion Place and Central Station (reduced in scope).
142

CONNECTING SOUTHAMPTON CITY REGION TRANSFORMING CITIES FUND STRATEGIC OUTLINE BUSINESS CASE
High Medium Low Bus Stop Improvements
Corridor 1, 3 and 4 have improvements to all bus stops within Hampshire boundary. Corridor 2 has a bus improvement in North Baddesley, Rownhams and Romsey and bus stop improvements along the A3024 west of Bitterne in Corridor 5. 2–5 Super Stops per corridor.
Similar to High, however there are no bus stop improvements in Corridor 5, and one less Super Stop in Corridor 2.
Only Corridors 1 and 4 experience bus stop improvements although these are of the same specification as the High. Only Corridors 4 and the City Centre include super stops.
Number of Active Travel Zones
2 2 2
Number of Mobility Hubs
6 5 3
Number of Instances of Highway Relocation
57 56 28
Legend to Table 5.2
Cycle scheme Bus Priority scheme Local Mobility Hub Park & Ride Active Travel Zone Interchange Public realm scheme
Table 5-2– Summary of Scope of High, Medium and Low scenarios for each TCF corridor
The TCF enabled physical changes to highway and bus infrastructure will in turn enable changes to be made to the routing and frequency of bus services by bus operators. These linked improvements have been discussed and worked up through close engagement with bus operators.
The main changes on each corridor are summarised in Table 5-3.
High Medium Low
Corridor 1
Routing change through Totton High Street using new bus bypass, City Centre, and Mountbatten Way.
Routing change through Totton High Street using new bus bypass, City Centre, and Mountbatten Way.
Routing change through Totton High Street using new bus bypass, City Centre, and Mountbatten Way.
Rationalisation of stopping patterns in City Centre to serve interchange.
Rationalisation of stopping patterns in City Centre to serve interchange.
Rationalisation of stopping patterns in City Centre to serve interchange.
Corridor 2
Routing change through City Routing change through City Routing change through City Centre. Morning buses will no Centre. Morning buses will no Centre. Morning buses will no longer take the diversionary route longer take the diversionary route longer take the diversionary route around Woolston which avoided around Woolston which avoided around Woolston which avoided congestion. congestion. congestion.
Rationalisation of stopping patterns in City Centre to serve interchange.
Rationalisation of stopping patterns in City Centre to serve interchange.
Rationalisation of stopping patterns in City Centre to serve interchange.
Corridor 3
Routing change through City Centre.
Routing change through City Centre.
Routing change through City Centre.
Additional Chandlers Ford-City Centre services 2/hr.
Additional Chandlers Ford-City Centre services - 2/hr.
Additional Chandlers Ford-City Centre services 2/hr.
Rationalisation of stopping patterns in City Centre to serve interchange.
Rationalisation of stopping patterns in City Centre to serve interchange.
Rationalisation of stopping patterns in City Centre to serve interchange.
Corridor 4 Routing change through City Centre.
Routing change through City Centre.
Routing change through City Centre.
BS2 – extra 2 buses an hour BS2 – extra 2 buses an hour BS2 – extra 2 buses an hour
143
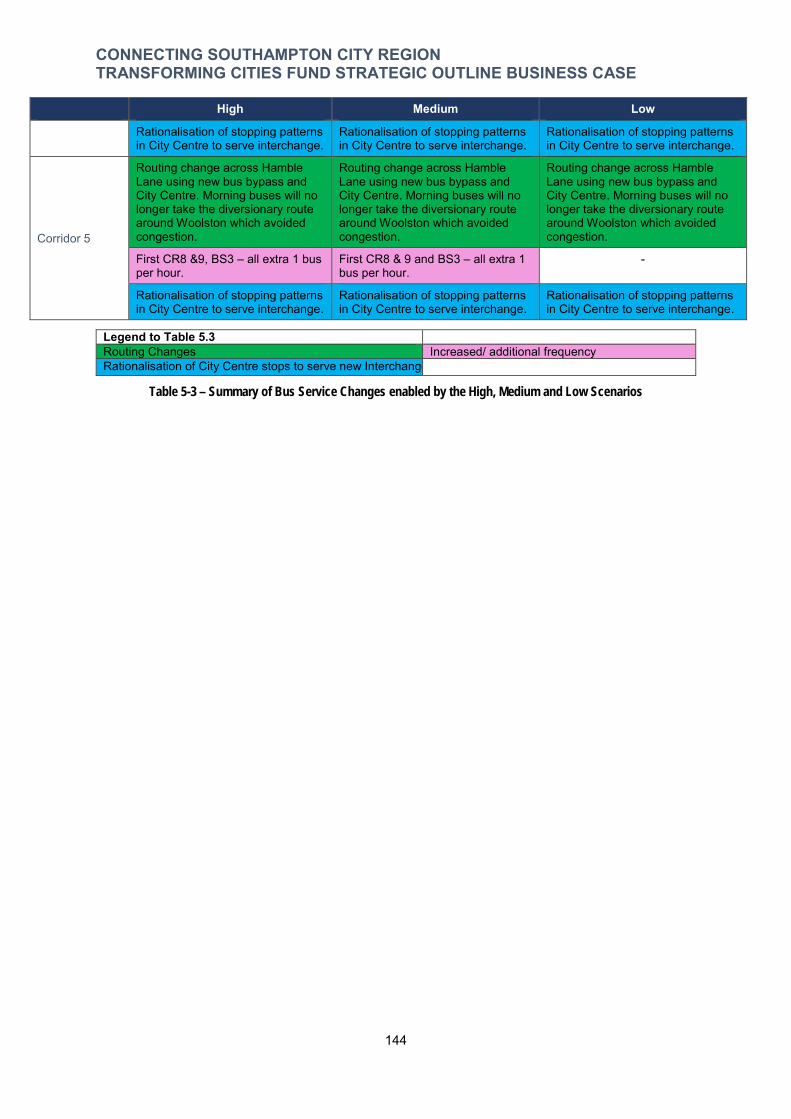
CONNECTING SOUTHAMPTON CITY REGION TRANSFORMING CITIES FUND STRATEGIC OUTLINE BUSINESS CASE
High Medium Low
Rationalisation of stopping patterns in City Centre to serve interchange.
Rationalisation of stopping patterns in City Centre to serve interchange.
Rationalisation of stopping patterns in City Centre to serve interchange.
Corridor 5
Routing change across Hamble Routing change across Hamble Routing change across Hamble Lane using new bus bypass and Lane using new bus bypass and Lane using new bus bypass and City Centre. Morning buses will no City Centre. Morning buses will no City Centre. Morning buses will no longer take the diversionary route longer take the diversionary route longer take the diversionary route around Woolston which avoided around Woolston which avoided around Woolston which avoided congestion. congestion. congestion.
First CR8 &9, BS3 – all extra 1 bus per hour.
First CR8 & 9 and BS3 – all extra 1 bus per hour.
-
Rationalisation of stopping patterns in City Centre to serve interchange.
Rationalisation of stopping patterns in City Centre to serve interchange.
Rationalisation of stopping patterns in City Centre to serve interchange.
Legend to Table 5.3 Routing Changes Increased/ additional frequency Rationalisation of City Centre stops to serve new Interchange
Table 5-3 – Summary of Bus Service Changes enabled by the High, Medium and Low Scenarios
144
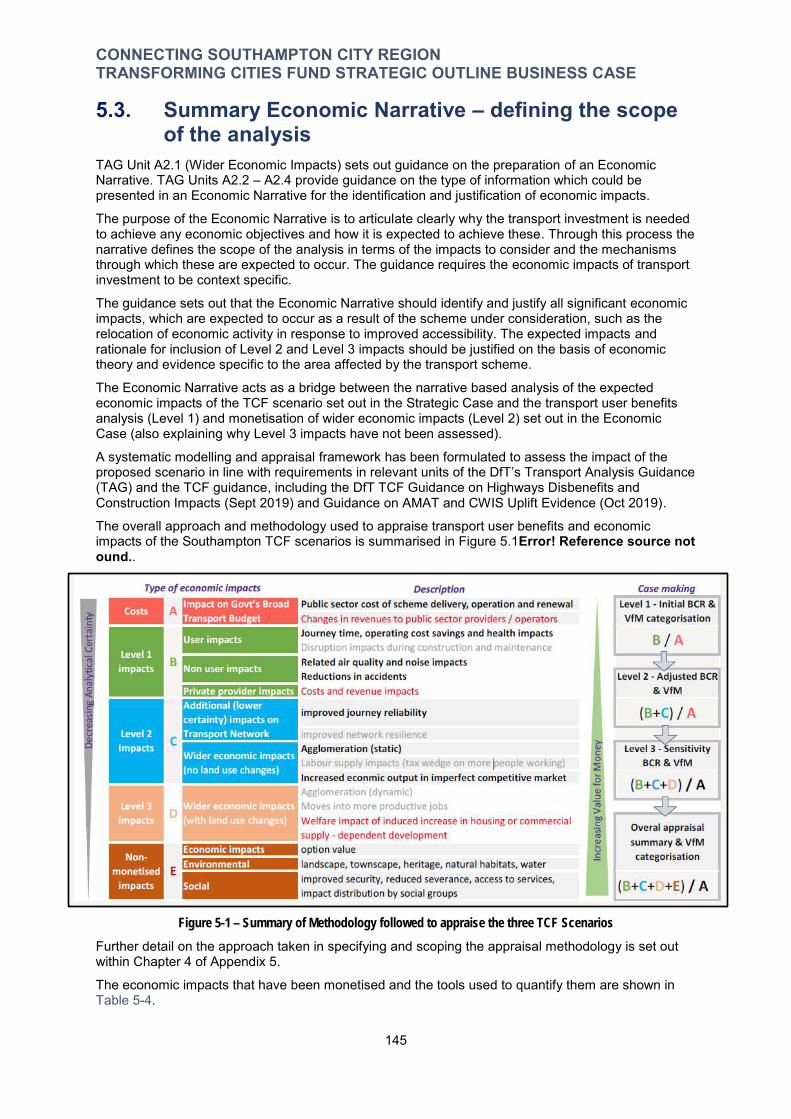
CONNECTING SOUTHAMPTON CITY REGION TRANSFORMING CITIES FUND STRATEGIC OUTLINE BUSINESS CASE
5.3. Summary Economic Narrative – defining the scope of the analysis
TAG Unit A2.1 (Wider Economic Impacts) sets out guidance on the preparation of an Economic Narrative. TAG Units A2.2 – A2.4 provide guidance on the type of information which could be presented in an Economic Narrative for the identification and justification of economic impacts.
The purpose of the Economic Narrative is to articulate clearly why the transport investment is needed to achieve any economic objectives and how it is expected to achieve these. Through this process the narrative defines the scope of the analysis in terms of the impacts to consider and the mechanisms through which these are expected to occur. The guidance requires the economic impacts of transport investment to be context specific.
The guidance sets out that the Economic Narrative should identify and justify all significant economic impacts, which are expected to occur as a result of the scheme under consideration, such as the relocation of economic activity in response to improved accessibility. The expected impacts and rationale for inclusion of Level 2 and Level 3 impacts should be justified on the basis of economic theory and evidence specific to the area affected by the transport scheme.
The Economic Narrative acts as a bridge between the narrative based analysis of the expected economic impacts of the TCF scenario set out in the Strategic Case and the transport user benefits analysis (Level 1) and monetisation of wider economic impacts (Level 2) set out in the Economic Case (also explaining why Level 3 impacts have not been assessed).
A systematic modelling and appraisal framework has been formulated to assess the impact of the proposed scenario in line with requirements in relevant units of the DfT’s Transport Analysis Guidance (TAG) and the TCF guidance, including the DfT TCF Guidance on Highways Disbenefits and Construction Impacts (Sept 2019) and Guidance on AMAT and CWIS Uplift Evidence (Oct 2019).
The overall approach and methodology used to appraise transport user benefits and economic impacts of the Southampton TCF scenarios is summarised in Figure 5.1Error! Reference source not ound..
Figure 5-1 – Summary of Methodology followed to appraise the three TCF Scenarios
Further detail on the approach taken in specifying and scoping the appraisal methodology is set out within Chapter 4 of Appendix 5.
The economic impacts that have been monetised and the tools used to quantify them are shown in Table 5-4.
145

CONNECTING SOUTHAMPTON CITY REGION TRANSFORMING CITIES FUND STRATEGIC OUTLINE BUSINESS CASE
Level Potential Economic Impacts Quantification Tools Assessment Methodology
Costs
CAPEX TUBA & Spreadsheet Monetised
OPEX (Operation, maintenance & renewal) Spreadsheet Whole life costs monetised
Revenues to public sector providers SRTM/ TUBA & Spreadsheet Monetised
1
User and private sector providers impacts
Highways Journey Time and VOC Savings SRTM/ TUBA Monetised
Public Transport User Benefits – Time Savings SRTM/ TUBA Monetised
Active Mode Users – Time Savings Qualified only Qualitatively Pedestrian Urban Realm Benefits VURT/ PERS Monetised
Public transport and Active Mode users – Journey Quality
PT - Spreadsheet (TAG Unit M3.2 Section 3.6) & Active Modes - AMAT
Monetised
Physical Activity Impacts i.e. absenteeism & Avoidance of Premature Deaths
Active Mode Appraisal Tool (AMAT) Monetised
Impacts on private sector providers (essentially public transport operators)
Bespoke cost model based on councils’ assumptions
Monetised
Disruption Impacts during construction and maintenance Spreadsheet Qualitatively
Non-user impacts
Wider Public Finances (Indirect Taxation Revenues) SRTM/ TUBA Monetised
Local Air Quality and Noise Impacts Spreadsheet - using marginal external costs Monetised
Greenhouse Gas Impacts TUBA Monetised
Reductions in accidents COBA-LT & bespoke spreadsheet to estimate cycling related saving only
Monetised
2
Bus user Journey reliability / resilience Spreadsheet - Bespoke spreadsheet based on observed data for bus services
Monetised
Wider economic impacts
Agglomeration (static) Qualified only Not included in final submission
Labour supply impacts Qualified only Not included in final submission
Increased economic output in imperfect competitive market
TAG Unit 2.1 - Wider Economic Impacts Appraisal Monetised
3 Induced housing or commercial supply -dependent development Qualified only Not included in
final submission Table 5-4 – Summary of Overall approach to Monetising Economic Impacts
5.3.1. How the Challenges covered in the Strategic Case translate into impacts on the economy of Southampton City Region
To recap, within section 3.4 of the Strategic Case we set out evidence of four main transport challenges, which all have adverse impacts on the functioning of the economy of the City Region:
1. Congestion resulting from high levels of car dependency is dampening economic growth; 2. Commuting patterns are complex with low levels of self-containment, with further growth in
greenfield locations likely to mean worsening congestion and unreliable journey times; 3. Congestion and delay mean end-to-end journey times by bus are getting longer, making the
bus a less appealing choice for car commuters; and 4. Rising income and health inequalities arising from increasing deprivation and poor air quality.
146
CONNECTING SOUTHAMPTON CITY REGION TRANSFORMING CITIES FUND STRATEGIC OUTLINE BUSINESS CASE
High Car Dependency - Whilst the Southampton City Region benefits from excellent connectivity to markets in other regions of the UK, such as the West Midlands (as shown in Map 3.2). The same cannot be said of the capacity and reliability of the transport links within the City Region itself, particularly the last mile to the Port (the biggest cruise port in northern Europe and the second largest container port in the UK) and other economic drivers.
The largely radial and intra-urban local transport networks (shown in Map 3.3) provide the vital transport connections between the SRN and the centres of Southampton, Eastleigh, Totton and Hedge End connecting where people live and work. Locally the transport network is important for residents to access job opportunities and services they require, for example retail, healthcare and education.
As explained in Section 3.2.4 of the Strategic Case, a large proportion of new development over the past 40 years has been planned around having access to the private car. As a result, many out-of-town or edge-of-town business parks (where a significant proportion of office and light industrial floorspace is provided) and many recent residential developments are located near the Strategic Road Network (SRN). Accordingly, such areas are not well connected to residential areas by public transport or cycle networks. This has encouraged higher levels of car use and dependency for commuting. Resulting in the self-containment of urban areas reducing over time. In Southampton City and Eastleigh Borough self-containment of commuting journeys is just 56% and 37% respectively.
Commuting Patterns - The commuting flows out of the city are similar in size to the commuting flows coming in to jobs in the city. Within the City Region, a significant number of local journeys are made on using the M3 and M27 motorways for part of their length. 32% of all traffic using the M27 travel only 1 or 2 junctions, and over 50% are travelling between 1 and 4 junctions. This high level of use of the SRN for local trips has meant it has been necessary for Highways England to invest in improving capacity through junction improvements. These include at Junctions 7 and 9 of the M27, with further investment planned at Junction 9 of the M3 and also in M3 and M27 Smart Motorways.
There are ambitious plans for growth in the City Region over the next two decades as outlined in 3.4.2.2 of the Strategic Case. Between 2011 and 2036, the Southampton City Region will need to accommodate an additional 42,000 new homes and 472,000m² of employment space. Delivery of this new employment space will result in 19,400 new jobs and the population of the City Region will increase by 22%. Analysis by Solent Transport suggests that by 2036, there will be 11.7% more trips on the City Region’s network than in 2014.
Whilst just under half of new homes planned will be in or around the City Centre, the remainder are in ‘greenfield’ locations as extensions to existing built up areas in Hampshire. These are likely to be car dependent unless connected by public transport, this could prove challenging to serve effectively by public transport without transformative investment. Modelling using the Southampton City Centre Microsimulation Model suggests that planned new development is forecast to increase trips into the City Centre by 18.5% by 2026.
Congestion - Highway capacity within the City Region is finite and it is not possible to build additional road capacity to meet the future level of peak demand either on the local highway network or on the SRN. Map 3.11shows that, by 2036, traffic volumes will increase on the majority of roads in the City Region. Average vehicle speeds are falling and delays per vehicle are increasing on many of the main radial routes used by buses to reach the City Centre, and in the City Centre itself (as shown in Map 3.12). Current levels of peak hour congestion are estimated to cost the Southampton economy £100m per annum.
Productivity in Southampton lags behind the national and South East average for GVA per head, as Figure 3-8 shows. There is under-representation of employment in professional and senior management roles, as Figure 3-7 shows and a wage gap between Southampton residents and workers as shown in Figure 3-10. While the City Centre has a wider employment catchment by public transport, securing high value jobs in the City Centre means connections need to be attractive and the public realm improved.
The Solent LEP sees closing this productivity gap by targeted investment to improve transport connectivity as a key priority for its’ emerging Local Industrial Strategy, set to be completed in April 2020. If worsening transport connectivity is not addressed, the long-term economic competitiveness of the City Region as a place to do business and to invest in is expected to suffer.
147

CONNECTING SOUTHAMPTON CITY REGION TRANSFORMING CITIES FUND STRATEGIC OUTLINE BUSINESS CASE
Air Quality - Poor air quality from transport sources, including nitrogen dioxide and particulate matter is a significant issue for the city as set out in Section 3.4.4.6 of the Strategic Case. There are approximately 110 preventable deaths in Southampton from poor air quality, and road based transport emssions can be the largest contributor. The Clean Air Zone, the interventions in the Clean Air Strategy, the NO2 Plan and the vision and actions set out in the Green City Charter for Southampton seek to deliver rapid improvements and significantly reduce carbon and NO2 emissions.
To transform transport connectivity and boost productivity a new approach is needed for the City Region that will deliver mode shift from the private car to bus and active modes,. The funding sought through TCF seeks to place the Southampton City Region on a different path towards more sustainable and less car-dependent patterns of commuting.
5.3.2. Economic Impact Logic Mapping For the purposes of explaining the economic impacts, the schemes in the three TCF scenarios broadly fall into four categories based on the physical changes they bring:
Reallocating road space (from general traffic to either bus or cycles or pedestrians); Improving bus provision; Smart and active travel; and Place-making.
The logic map in Figure 5-2 links the need for intervention, to proposed interventions, to outputs, to outcomes for users and the community. Finally this informs the economic impacts to be quantified or qualified in the appraisal.
Figure 5-2 – Logic Map showing how the three categories of physical changes TCF interventions will bring about translate into economic impacts to be monetised
148
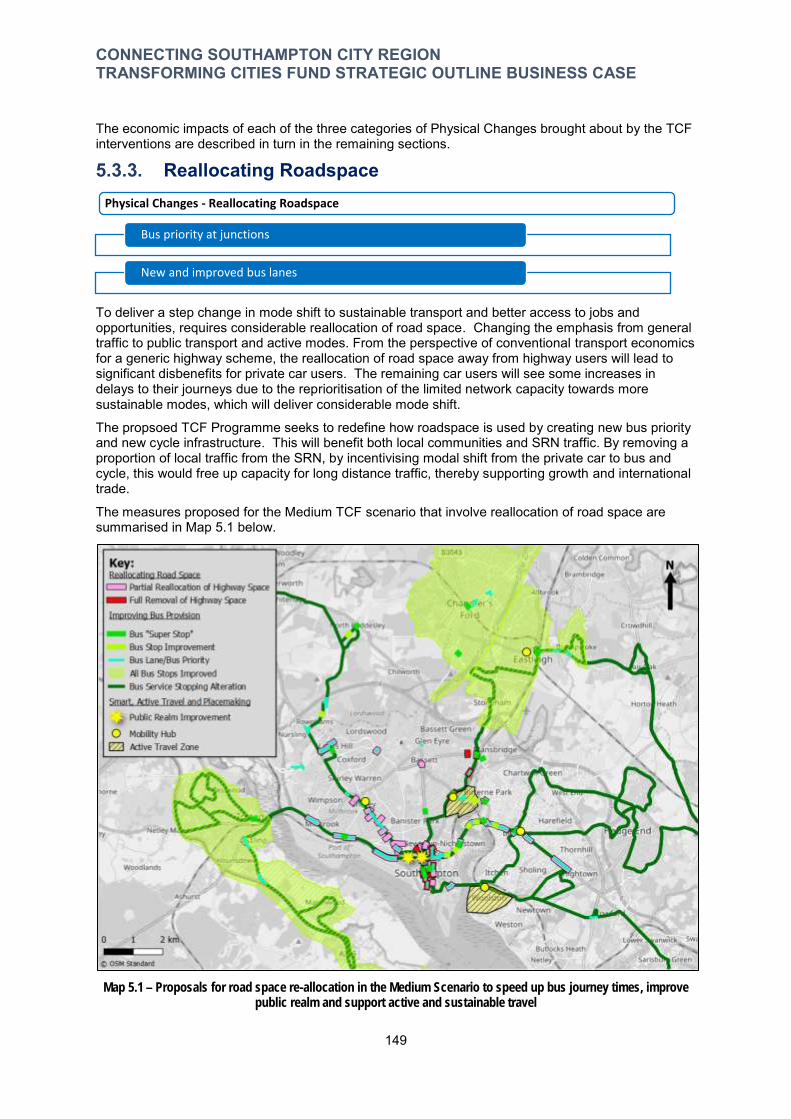
CONNECTING SOUTHAMPTON CITY REGION TRANSFORMING CITIES FUND STRATEGIC OUTLINE BUSINESS CASE
The economic impacts of each of the three categories of Physical Changes brought about by the TCF interventions are described in turn in the remaining sections.
5.3.3. Reallocating Roadspace Physical Changes - Reallocating Roadspace
Bus priority at junctions
New and improved bus lanes
To deliver a step change in mode shift to sustainable transport and better access to jobs and opportunities, requires considerable reallocation of road space. Changing the emphasis from general traffic to public transport and active modes. From the perspective of conventional transport economics for a generic highway scheme, the reallocation of road space away from highway users will lead to significant disbenefits for private car users. The remaining car users will see some increases in delays to their journeys due to the reprioritisation of the limited network capacity towards more sustainable modes, which will deliver considerable mode shift.
The propsoed TCF Programme seeks to redefine how roadspace is used by creating new bus priority and new cycle infrastructure. This will benefit both local communities and SRN traffic. By removing a proportion of local traffic from the SRN, by incentivising modal shift from the private car to bus and cycle, this would free up capacity for long distance traffic, thereby supporting growth and international trade.
The measures proposed for the Medium TCF scenario that involve reallocation of road space are summarised in Map 5.1 below.
Map 5.1 – Proposals for road space re-allocation in the Medium Scenario to speed up bus journey times, improve public realm and support active and sustainable travel
149
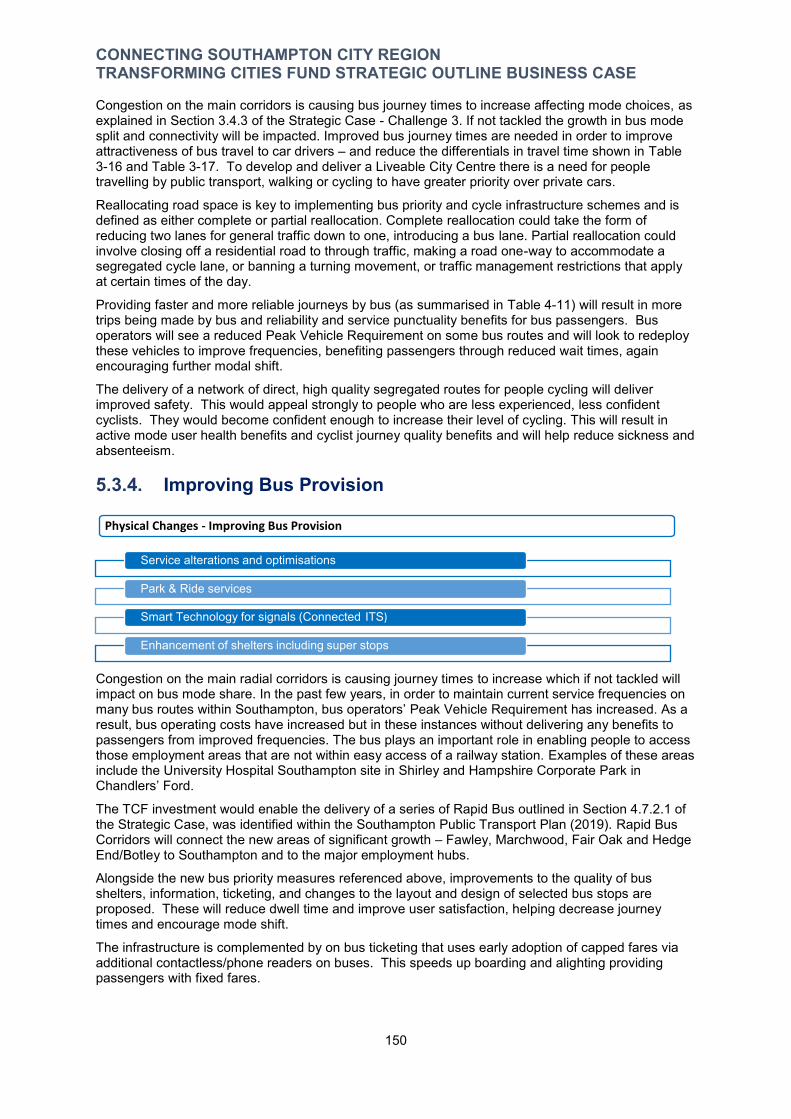
-
CONNECTING SOUTHAMPTON CITY REGION TRANSFORMING CITIES FUND STRATEGIC OUTLINE BUSINESS CASE
Congestion on the main corridors is causing bus journey times to increase affecting mode choices, as explained in Section 3.4.3 of the Strategic Case - Challenge 3. If not tackled the growth in bus mode split and connectivity will be impacted. Improved bus journey times are needed in order to improve attractiveness of bus travel to car drivers – and reduce the differentials in travel time shown in Table 3-16 and Table 3-17. To develop and deliver a Liveable City Centre there is a need for people travelling by public transport, walking or cycling to have greater priority over private cars.
Reallocating road space is key to implementing bus priority and cycle infrastructure schemes and is defined as either complete or partial reallocation. Complete reallocation could take the form of reducing two lanes for general traffic down to one, introducing a bus lane. Partial reallocation could involve closing off a residential road to through traffic, making a road one-way to accommodate a segregated cycle lane, or banning a turning movement, or traffic management restrictions that apply at certain times of the day.
Providing faster and more reliable journeys by bus (as summarised in Table 4-11) will result in more trips being made by bus and reliability and service punctuality benefits for bus passengers. Bus operators will see a reduced Peak Vehicle Requirement on some bus routes and will look to redeploy these vehicles to improve frequencies, benefiting passengers through reduced wait times, again encouraging further modal shift.
The delivery of a network of direct, high quality segregated routes for people cycling will deliver improved safety. This would appeal strongly to people who are less experienced, less confident cyclists. They would become confident enough to increase their level of cycling. This will result in active mode user health benefits and cyclist journey quality benefits and will help reduce sickness and absenteeism.
5.3.4. Improving Bus Provision
Physical Changes - Improving Bus Provision
Service alterations and optimisations
Park & Ride services
Smart Technology for signals (Connected ITS)
Enhancement of shelters including super stops
Congestion on the main radial corridors is causing journey times to increase which if not tackled will impact on bus mode share. In the past few years, in order to maintain current service frequencies on many bus routes within Southampton, bus operators’ Peak Vehicle Requirement has increased. As a result, bus operating costs have increased but in these instances without delivering any benefits to passengers from improved frequencies. The bus plays an important role in enabling people to access those employment areas that are not within easy access of a railway station. Examples of these areas include the University Hospital Southampton site in Shirley and Hampshire Corporate Park in Chandlers’ Ford.
The TCF investment would enable the delivery of a series of Rapid Bus outlined in Section 4.7.2.1 of the Strategic Case, was identified within the Southampton Public Transport Plan (2019). Rapid Bus Corridors will connect the new areas of significant growth – Fawley, Marchwood, Fair Oak and Hedge End/Botley to Southampton and to the major employment hubs.
Alongside the new bus priority measures referenced above, improvements to the quality of bus shelters, information, ticketing, and changes to the layout and design of selected bus stops are proposed. These will reduce dwell time and improve user satisfaction, helping decrease journey times and encourage mode shift.
The infrastructure is complemented by on bus ticketing that uses early adoption of capped fares via additional contactless/phone readers on buses. This speeds up boarding and alighting providing passengers with fixed fares.
150

- - --
CONNECTING SOUTHAMPTON CITY REGION TRANSFORMING CITIES FUND STRATEGIC OUTLINE BUSINESS CASE
Some bus re-routings are proposed on the corridors and within the City Centre (shown by the dark green lines in Map 5.1) that are expected to shorten operating mileage and bus journey times. These changes will make use of new bus interchange provision within the City Centre and will take advantage of new bus only links on the corridors.
The delivery of these Rapid Bus interventions and more reliable hospital and weekend public Park and Ride services will ensure that there is a high quality public transport offer in place to expand the reach of business’ labour markets, support greater agglomeration and ensure that the additional highway trips the are forecast to be created are of a lower order of magnitude, helping reduce expected congestion levels.
5.3.5. Smart & Active Travel Physical Changes - Smart & Active Travel
Better infrastructure for cycling and walking
Enhancing our urban realm
Active Travel Zones
Local Mobility Hubs
Improved Interchanges
The Southampton Cycle Strategy 2017-2027 and Hampshire Cycling Plan 2016 identified a Southampton Cycle Network (SCN) to be delivered by 2027 that connects employment opportunities within the City Centre and in major employment hubs, with suburban areas where people live. TCF funding will be directed towards delivering this already identified and planned network of cycling infrastructure. TCF funding will allow an accelerating the rate of completion of SCN infrastructure and bringing forward the benefits early of connecting together suburban areas with Southampton City Centre and other employment areas such as the University Hospital Southampton, the two Universities, Eastleigh town centre and employment areas in Chandlers Ford and Hedge End.
As explained in Section 4.7.3.1 of the Strategic Case, the TCF investment will see new Cycle Freeways connecting the City Centre to Totton & the Waterside, Chandlers Ford, Eastleigh and Hedge End with high degrees of segregation. These main routes along main road corridors will be supported by a network of Quietways which will penetrate into suburban residential neighbourhoods.
This accelerated rate of completion of the SCN through delivery of 80km of the SCN, as summarised in Table 5-5 below, will help to reduce reliance on the private car and will help tackle traffic congestion, improve people’s health, and air quality. Investment in cycling will be targeted at the 49% of journeys currently made in the City Region that are 3 miles or less.
Scenario Cycling/ Sustainable Travel Intervention Type Total Off Road Cycle Track
Segregated On Road Cycle Lane
Non Segregated On Road Cycle Lane
Active Travel Zone
High 13 9 3 2 27 Medium 11 7 2 2 22 Low 7 4 1 2 14
Table 5-5 – Summary of total number of Cycle Interventions and ATZs planned for delivery under High, Medium and Low Scenarios
The planned Active Travel Zones (ATZs) as outlined in Section 4.7.3.2 of the Strategic Case, and shown in Map 5.1 will help support sustainable and active lifestyles and transform the conditions for people to change their mode of travel and support increases in productivity and health. There will be investment in safe, direct and easy cycle and walking links from people’s front doors to the SCN and the Rapid Bus Corridors and to deter through traffic. They enable people to make more local
151

CONNECTING SOUTHAMPTON CITY REGION TRANSFORMING CITIES FUND STRATEGIC OUTLINE BUSINESS CASE
journeys on foot or bike to access local services in District Centres further reducing congestion and pollutions.
5.3.6. Place Making Physical Changes - Place Making
Enhancing our urban realm
Local Mobility Hubs
Improved Interchanges
Gateways are important to the success of the City Region as they are the first arrival points people experience of the area. They are key to make a positive first impression on visitors to the city and require excellent onward connections to function well.
As Section 4.74.1 of the Strategic Case explains, at Southampton Central, the current function and layout of the southern side of the station does not provide a coherent or attractive gateway to Southampton (or to the Port for arriving cruise passengers). The proposals for the southern side of Southampton Central illustrated in Figure 4-13 will better connect the station with the City Centre, through a high-quality public realm network. It will create an attractive gateway entrance point to the City Centre with excellent onward connections by Park & Ride, bus, taxi, cycle and foot. This will help support the planned regeneration of the Mayflower Quarter, to the south of Western Esplanade – one of the largest planned urban regeneration sites in central southern England.
Delivery of the Local Mobility Hubs (LMHs) described in Section 4.7.2.3 of the Strategic Case will widen the variety of travel options available to people. Developing points, in District or Town Centres, where people can hire different types of shared electric vehicles (cars, vans or bikes) from one point will increase people’s access to transport where they might not be able to.
Investment to deliver a high quality public realm is an essential part of realising a plan to re-focus the City Centre from one based on accommodating vehicles to one that is centred on people with more space for cycling and walking.
The planned public realm improvements at Civic Centre Place set out in Section 4.7.4.2 of the Strategic Case. As illustrated in Figure 4-14 will transform a four-lane road in to a bus and cycle only route. Under the ‘high’ scenario, the existing area of car parking on the north side of Civic Centre Road would be removed, and the footprint of the junction of Havelock Place, Western Esplanade, Portland Terrace and Civic Centre Road would be reduced. This scheme would reduce the severance impact of the Inner Ring Road, thereby better connecting the main pedestrian route from Southampton Central Station to both the main Central Business District and shopping heart of the City Centre and will enhance a key gateway into the City Centre. It will introduce 1000sq.m of soft landscaping, and convert 5700sq.m of road space into high quality public realm areas.
The bus interchange improvements planned at Albion Place and at Central Station will help improve the legibility of the bus network and make it easier for bus passengers to change service. The planned Travel Hubs at Southampton Airport Parkway, Swaythling and Hamble will help improve the quality of the passenger waiting experience and encourage more cycle-rail and bus-rail multi-modal trips.
Sections 5.5 and 5.6 identify and justify the expected economic impacts shown in dark green on Figure 5-2, forming part of the Economic Narrative. Further detail on the Economic Narrative for the Southampton TCF scalable Programme Level SOBC is set out in Chapters 3 and 4 of Appendix 5 (Economic Appraisal and Impact Report), but the key elements of it have been summarised in this section.
152
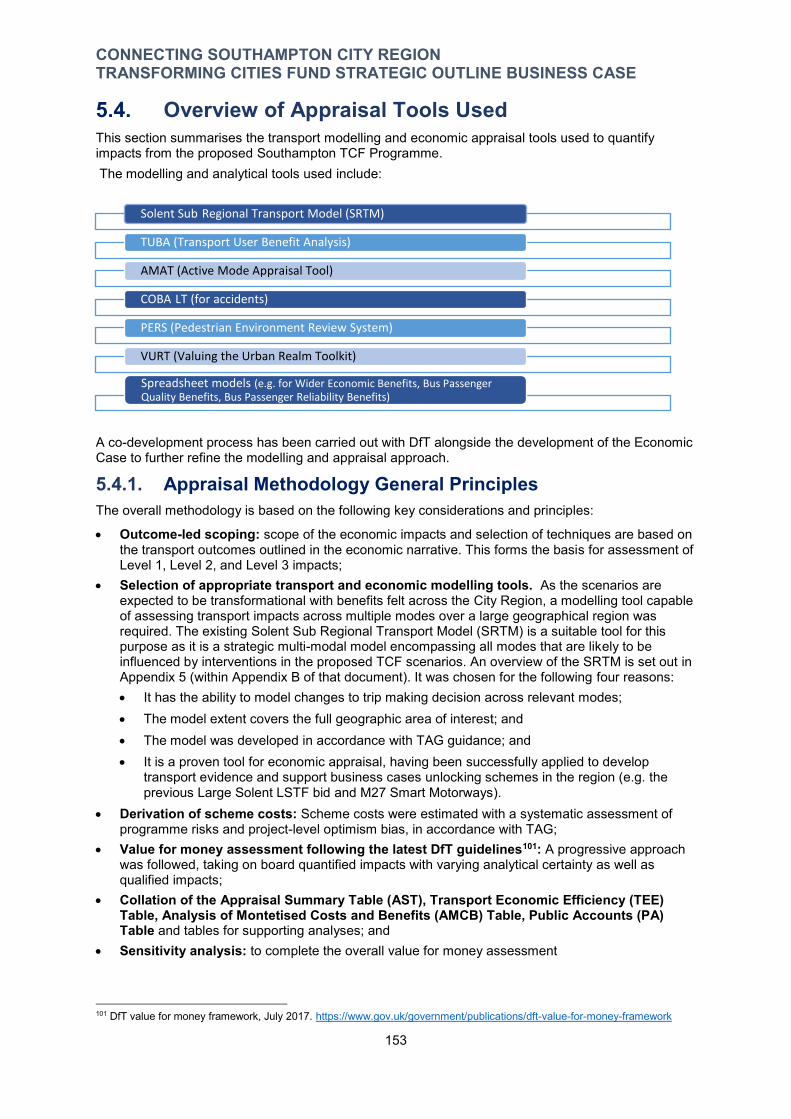
-
-
CONNECTING SOUTHAMPTON CITY REGION TRANSFORMING CITIES FUND STRATEGIC OUTLINE BUSINESS CASE
5.4. Overview of Appraisal Tools Used This section summarises the transport modelling and economic appraisal tools used to quantify impacts from the proposed Southampton TCF Programme. The modelling and analytical tools used include:
Solent Sub Regional Transport Model (SRTM)
TUBA (Transport User Benefit Analysis)
AMAT (Active Mode Appraisal Tool)
COBA LT (for accidents)
PERS (Pedestrian Environment Review System)
VURT (Valuing the Urban Realm Toolkit)
Spreadsheet models (e.g. for Wider Economic Benefits, Bus Passenger Quality Benefits, Bus Passenger Reliability Benefits)
A co-development process has been carried out with DfT alongside the development of the Economic Case to further refine the modelling and appraisal approach.
5.4.1. Appraisal Methodology General Principles The overall methodology is based on the following key considerations and principles:
Outcome-led scoping: scope of the economic impacts and selection of techniques are based on the transport outcomes outlined in the economic narrative. This forms the basis for assessment of Level 1, Level 2, and Level 3 impacts;
Selection of appropriate transport and economic modelling tools. As the scenarios are expected to be transformational with benefits felt across the City Region, a modelling tool capable of assessing transport impacts across multiple modes over a large geographical region was required. The existing Solent Sub Regional Transport Model (SRTM) is a suitable tool for this purpose as it is a strategic multi-modal model encompassing all modes that are likely to be influenced by interventions in the proposed TCF scenarios. An overview of the SRTM is set out in Appendix 5 (within Appendix B of that document). It was chosen for the following four reasons: It has the ability to model changes to trip making decision across relevant modes; The model extent covers the full geographic area of interest; and The model was developed in accordance with TAG guidance; and It is a proven tool for economic appraisal, having been successfully applied to develop
transport evidence and support business cases unlocking schemes in the region (e.g. the previous Large Solent LSTF bid and M27 Smart Motorways).
Derivation of scheme costs: Scheme costs were estimated with a systematic assessment of programme risks and project-level optimism bias, in accordance with TAG;
Value for money assessment following the latest DfT guidelines101: A progressive approach was followed, taking on board quantified impacts with varying analytical certainty as well as qualified impacts;
Collation of the Appraisal Summary Table (AST), Transport Economic Efficiency (TEE) Table, Analysis of Montetised Costs and Benefits (AMCB) Table, Public Accounts (PA) Table and tables for supporting analyses; and
Sensitivity analysis: to complete the overall value for money assessment
101 DfT value for money framework, July 2017. https://www.gov.uk/government/publications/dft-value-for-money-framework
153
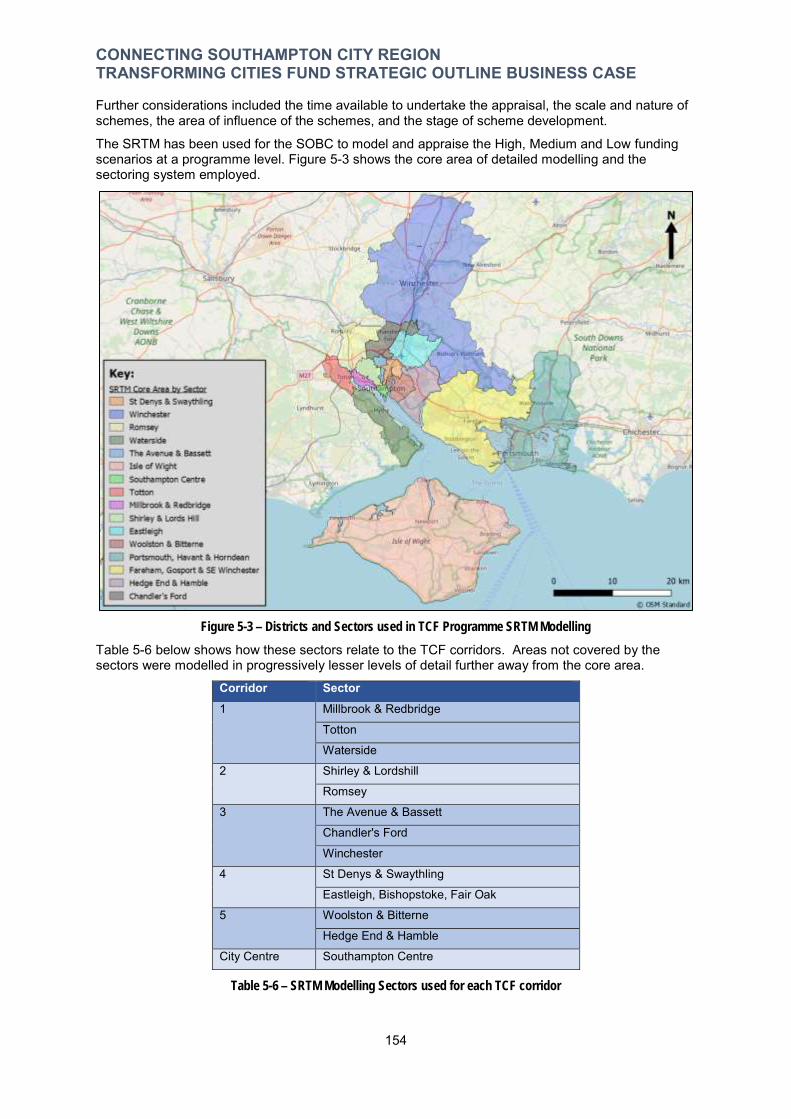
CONNECTING SOUTHAMPTON CITY REGION TRANSFORMING CITIES FUND STRATEGIC OUTLINE BUSINESS CASE
Further considerations included the time available to undertake the appraisal, the scale and nature of schemes, the area of influence of the schemes, and the stage of scheme development.
The SRTM has been used for the SOBC to model and appraise the High, Medium and Low funding scenarios at a programme level. Figure 5-3 shows the core area of detailed modelling and the sectoring system employed.
Figure 5-3 – Districts and Sectors used in TCF Programme SRTM Modelling
Table 5-6 below shows how these sectors relate to the TCF corridors. Areas not covered by the sectors were modelled in progressively lesser levels of detail further away from the core area.
Corridor Sector 1 Millbrook & Redbridge
Totton
Waterside
2 Shirley & Lordshill
Romsey
3 The Avenue & Bassett
Chandler's Ford
Winchester
4 St Denys & Swaythling
Eastleigh, Bishopstoke, Fair Oak
5 Woolston & Bitterne
Hedge End & Hamble
City Centre Southampton Centre
Table 5-6 – SRTM Modelling Sectors used for each TCF corridor
154
CONNECTING SOUTHAMPTON CITY REGION TRANSFORMING CITIES FUND STRATEGIC OUTLINE BUSINESS CASE
5.5. Methodology used to undertake economic appraisal and monetise impacts
This subsection covers four key aspects in relation to the methodology for undertaking the economic appraisal: Appraisal period for different types of intervention; Cost estimation and derivation of the Present Value of Costs (PVC); Modelling strategy and alignment with the impacts to capture; and The methodology used to monetise economic impacts.
5.5.1. Appraisal Period Level 1 transport impacts arising from the the scalable TCF investment scenarios were monetised across either a 20 or 60-year appraisal period. Public transport journey quality, pedestrian urban realm benefits, cyclists journey quality, and physical activity impacts were all appraised over a 20-year period. All other impacts were appraised over a 60-year period. Renewal costs have been included for all schemes, including cycle ways, public realm works and bus schemes.
5.5.2. TCF Scenario Costs Calculation of the Present Value of Costs (PVC) follows the guidance in TAG Unit A1.2. All costs in the Economic Case have been treated as per TAG guidance. Specifically, these include: Conversion of monetary figures to 2010 prices and values; Real inflation (based on assumptions of inflation rates, i.e. 5% for the first 5 years and then
gradually tapering down to 0% over the course of the remainder of the 60-year period, as discussed with DfT Economists at Co-Development Meeting on 5/11/2019);
Optimism Bias (OB) adjustment; and Market price adjustment. This section outlines how the PVC has been derived. The estimation of costs for the proposed programme of interventions sought to consider a full range of components including:
Investment / capital costs (both from public sector and transport operators); Operation, maintenance and renewal (OMR) costs for the highway and public transport
assets; and Grants, Subsidies, Developer Contributions and Revenue.
Investment costs (CAPEX) For physical interventions, capital cost estimates were prepared by the relevant local authorities and consultants working on scheme development. This uses bottom-up estimates on a Bill of Quantities basis, based on the latest designs of individual schemes and previous experience. Construction costs were estimated for individual schemes in present day prices. An allowance for design and Project Management was included as a percentage of this cost (the percentage differing depending on the scheme) – see Section 6.2 in Financial Case. Investment from other funding sources, (local match and third parthy funding such as from the bus operators) were collated and included in the funding tables by SCC and HCC. A Quantitative Risk Assessment has been undertaken at the programme level considering the specific risks which are pertinent, in order to inform the quantification of a specific contingency budget. More information on this is available in the Management Case. At this stage, the capital cost estimates for all schemes in the Economic Case are expressed as base costs plus an appropriate level of Optimism Bias (OB), which takes into account each intervention’s maturity and the complexity of the scheme. Based on this each project was categorised in to one of five categories. Each these has a different level of OB applied to cater for risks that are to be identified and quantified, summarised in Table 5-7.
155
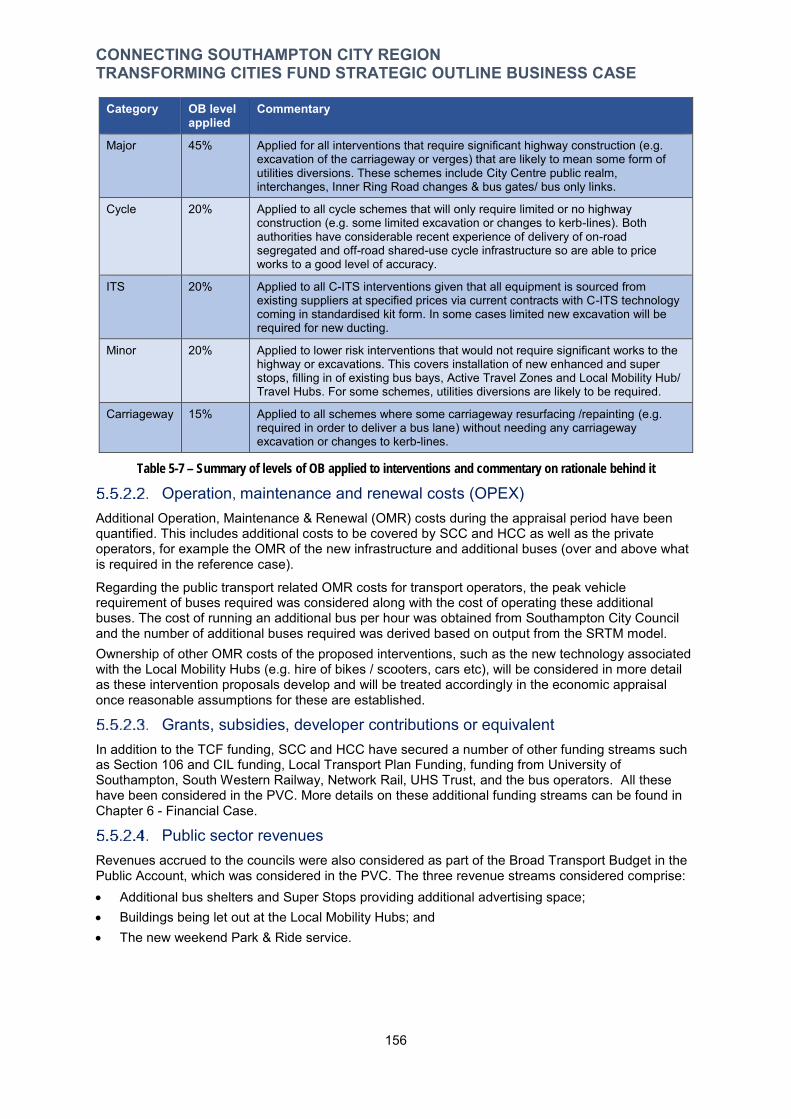
CONNECTING SOUTHAMPTON CITY REGION TRANSFORMING CITIES FUND STRATEGIC OUTLINE BUSINESS CASE
Category OB level applied
Commentary
Major 45% Applied for all interventions that require significant highway construction (e.g. excavation of the carriageway or verges) that are likely to mean some form of utilities diversions. These schemes include City Centre public realm, interchanges, Inner Ring Road changes & bus gates/ bus only links.
Cycle 20% Applied to all cycle schemes that will only require limited or no highway construction (e.g. some limited excavation or changes to kerb-lines). Both authorities have considerable recent experience of delivery of on-road segregated and off-road shared-use cycle infrastructure so are able to price works to a good level of accuracy.
ITS 20% Applied to all C-ITS interventions given that all equipment is sourced from existing suppliers at specified prices via current contracts with C-ITS technology coming in standardised kit form. In some cases limited new excavation will be required for new ducting.
Minor 20% Applied to lower risk interventions that would not require significant works to the highway or excavations. This covers installation of new enhanced and super stops, filling in of existing bus bays, Active Travel Zones and Local Mobility Hub/ Travel Hubs. For some schemes, utilities diversions are likely to be required.
Carriageway 15% Applied to all schemes where some carriageway resurfacing /repainting (e.g. required in order to deliver a bus lane) without needing any carriageway excavation or changes to kerb-lines.
Table 5-7 – Summary of levels of OB applied to interventions and commentary on rationale behind it
Operation, maintenance and renewal costs (OPEX) Additional Operation, Maintenance & Renewal (OMR) costs during the appraisal period have been quantified. This includes additional costs to be covered by SCC and HCC as well as the private operators, for example the OMR of the new infrastructure and additional buses (over and above what is required in the reference case).
Regarding the public transport related OMR costs for transport operators, the peak vehicle requirement of buses required was considered along with the cost of operating these additional buses. The cost of running an additional bus per hour was obtained from Southampton City Council and the number of additional buses required was derived based on output from the SRTM model. Ownership of other OMR costs of the proposed interventions, such as the new technology associated with the Local Mobility Hubs (e.g. hire of bikes / scooters, cars etc), will be considered in more detail as these intervention proposals develop and will be treated accordingly in the economic appraisal once reasonable assumptions for these are established.
Grants, subsidies, developer contributions or equivalent In addition to the TCF funding, SCC and HCC have secured a number of other funding streams such as Section 106 and CIL funding, Local Transport Plan Funding, funding from University of Southampton, South Western Railway, Network Rail, UHS Trust, and the bus operators. All these have been considered in the PVC. More details on these additional funding streams can be found in Chapter 6 - Financial Case.
Public sector revenues Revenues accrued to the councils were also considered as part of the Broad Transport Budget in the Public Account, which was considered in the PVC. The three revenue streams considered comprise: Additional bus shelters and Super Stops providing additional advertising space; Buildings being let out at the Local Mobility Hubs; and The new weekend Park & Ride service.
156

CONNECTING SOUTHAMPTON CITY REGION TRANSFORMING CITIES FUND STRATEGIC OUTLINE BUSINESS CASE
5.5.3. Modelling Strategy Within Appendix 5, Table 4-4 summarises the modelling strategy used to represent each type of TCF intervention and assesses the limitations of each approach used.
To model and appraise the significant number of interventions at a programme level, a standard modelling strategy has been adopted for each of the types of the physical changes / inputs shown in the second column of Figure 5-2 - the Logic Map.
This ensures consistency of approach for similar interventions that are proposed across different corridors.
5.5.4. Methodology used to monetise economic impacts This sub-section provides more information about the methodology used to carry out quantifying the individual monetised economic impacts set out in Table 5-4.
Appraisal of Highway and Public Transport Journey Time Savings This group of impacts covers:
Highway users travel time and vehicle operating costs (VOC) savings; Public transport users travel cost savings; Impacts on private sector providers – additional revenue and incremental investment /
operating costs accrued to bus operators; and User charges (such as impacts on parking, tolls and fares, etc).
These benefits have been captured in accordance with TAG Unit A1.3 and using TUBA version 1.9.12 (which is in line with TAG Databook v1.9.11 published in November 2018), based on 2019, 2026 and 2041 SRTM model runs.
The opening year appraised is 2023. The actual completion time for certain schemes may be earlier but the TCF funding window is to March 2023.
Annual user impacts were calculated for each modelled year. Benefits for non-modelled years (such as 2021 opening year for example) were calculated by linear interpolation between modelled years, and flat-line extrapolation beyond the final modelled year.
To ensure benefits to users were not overstated a conservative approach was adopted to annualisation factors in two ways:
Benefits were only considered for weekdays 12 hours (3hrs AM, 6hrs Inter-peak and 3 hrs PM) no off peak (19:00-07:00) benefits were calculated or applied; and
An annualisation factor of 253 was used in TUBA representing the number of working days in a year – i.e. no claim is made for weekend or bank holiday periods.
For the TUBA analysis, each scenario has been run with fixed land-use (i.e. LEIM module of SRTM disabled). This is to ensure the economic analysis is TAG compliant, as per Unit A1-1.
Bus fare revenue accrued to private sector providers essentially represents public transport operators’ income in this context. It was captured using TUBA alongside the user benefits based on SRTM output. Any additional incremental investment and operating costs incurred to the bus operators as a result of the proposed interventions over the 60-year appraisal period also count as private sector provider impacts.
TUBA also forecasts indirect tax revenue (ITR) impacts representing the change in fuel tax income to the Treasury as a result of drivers using more or less fuel due changes in vehicle speed. This impact was therefore captured alongside the user benefits.
Potential time savings accrued to active mode users have not been assessed, as when monetised, this was expected to be a modest amount, but this would represent an additional benefit stream.
Appraisal of Public transport and active mode users – Journey Quality Journey quality improvements, such as better ambience for cyclists and pedestrians and improved facilities for bus users, are expected to be a significant benefit stream that is closely aligned with the
157
CONNECTING SOUTHAMPTON CITY REGION TRANSFORMING CITIES FUND STRATEGIC OUTLINE BUSINESS CASE
objectives of the investment programme to create significant modal shift by delivering more attractive offering for sustainable modes. For bus passengers the benefits have been captured in accordance with PT - TAG Unit M3.2 Section 3.6 – Quality Factors. This was quantified via a range of assumptions on improvements at bus stops, such as New Interchanges with rail stations and Local Mobility Hubs, new bus shelters, Real Time Passenger Information (RTPI) at these stops, and ticketing improvements. The assessment was primarily focused on existing bus passengers, based on the quantum extracted from the SRTM model, on routes along the corridors where the interventions will occur. The methodology is expanded upon in Appendix 5 (within Appendix D.4 of that document). For Active Mode Users, the DfT’s Active Mode Appraisal Tool (AMAT) has been used to monetise the improvements to Journey Ambience. The number of cycling and walking trips before and after the scheme implementation has been taken from the relevant districts within the SRTM runs (New Forest, Test Valley, Southampton & Eastleigh). The AMAT tool requires the proportion of trips which uses the scheme infrastructure. Due to the nature of the schemes and the wide geographic region they cover, a theoretical approach was required to determine this proportion. Considering the range of routes planned for delivery through TCF funding, covering both orbital and radial journeys and the length of cycle trips, it has been assumed that 50% of trips will benefit from the interventions. Journey Ambience improvements to the urban realm experienced by pedestrians are considered as part of the Urban Realm Appraisal and are quantified using the VURT. The methodology followed is expanded upon in Appendix 5 (within Appendix D.1 of that document).
Improvements to Urban Realm A number of schemes within the scenarios make transformational improvements to the urban realm through interventions such as significant traffic restrictions, soft landscaping, pedestrian provisions such as seating and shelters, and footway improvements. Such interventions improve the environment for pedestrians and these improvements have been quantified as a monetised benefit.
Surveys were conducted to both understand current levels of pedestrian movements as well as to attribute Pedestrian Environment Review System (PERS) scores to the locations where significant improvements to the urban realm are expected. Intervention designs were also assigned PERS scores and the level of improvement at a given location in conjunction with the number of pedestrians affected. This formed the basis of inputs to the Valuing Urban Realm Tool (VURT) which quantified the economic benefits associated with the improvements at each location. The methodology used is expanded upon in Appendix 5 (within Appendix D.2 of that document).
Appraisal of Physical Activity Impacts As with Journey Ambience, the AMAT has also been used to monetise two main benefits arising from the increase in Physical Activity. Namely, reduced risk of premature death, and absenteeism. The same assumptions on cycle interventions, number of users and the proportion of those who use the scheme as described above were used. For walking trips, the number of current and new trips used the same assumptions and methodology as above. The methodology used is expanded upon in Appendix 5 (within Appendix D.1 of that document).
Appraisal of Other Economic Impacts Disruption impacts will be incurred by transport users during construction and maintenance works. For the TCF programme the main impact will be disbenefits during construction of the junction, segregated cycle routes, and bus lane schemes. This is more suitable to be assessed at subsequent stages of business case development ahead of scheme delivery given the nature of the SOBC and its focus on the entire investment programme rather than individual schemes. Traffic management plans will be developed at the next stage of business case development, considering the following:
Design, packaging, phasing and delivery of individual schemes need to consider minimise disruption during construction and maintenance; and
Traffic management plans and the approaches will vary significantly in accordance with the nature of scheme elements and their local context.
158
CONNECTING SOUTHAMPTON CITY REGION TRANSFORMING CITIES FUND STRATEGIC OUTLINE BUSINESS CASE
Impacts from reductions in the number of accidents - accident impacts have been monetised and account for impacts from the changes in traffic conditions in the highway network as a result of the proposed interventions as well as the reduction in highway travel demand due to mode shift from highway to more sustainable modes. COBA-LT software has been used to quantify and monetise these impacts for inclusion in the economic case based on SRTM output. A study area was selected for the COBA-LT analysis based on the likely geographical extent that the TCF scenario schemes would impact on accident numbers. Greenhouse gas, local air quality and noise impacts have been quantified and monetised using TUBA and for air quality and noise to calculate the marginal external costs. Level Two Benefits Bus Journey Time Reliability impacts refers to unpredictable delays to buses that arise from recurring congestion at the same period each day (day-to-day variability) or from non-recurring events such as incidents. This is a Level 2 impact. They have been quantified and monetised using a spreadsheet based on observed data for bus services from bus operators. From this data, a predicted impact on variability has been then been assumed and hence the journey time savings calculated which have been monetised using a weighted Value of Time Increased economic output in imperfect competitive markets is another Level 2 impact that has been monetised using the methodology prescribed in TAG Unit 2.1 - Wider Economic Impacts Appraisal. Static agglomeration and tax revenue from increased labour participation are two other Level 2 economic impacts that have not been quantified at this stage. Given the nature and focus of the programme on encouraging mode shift from private car to bus and active travel modes, the expected scale of both impacts is expected to be marginal.
Level 3 impacts such as induced housing or commercial supply (dependent development) have not been explicitly considered at the current stage. This will be considered in more detail after the final SOBC submission if requested by the DfT.
159

CONNECTING SOUTHAMPTON CITY REGION TRANSFORMING CITIES FUND STRATEGIC OUTLINE BUSINESS CASE
5.5.5. Transport Impacts from the proposed scenario Summary of Economic Impacts
Figure 5-4 summarises the breakdown of each of the monetised transport user benefits and disbenefits (Level 1) and Bus Reliability and Increased Economic Output in Imperfect Competitive Market impacts (Level 2) modelled for the High, Medium and Low funding scenarios.
Figure 5-4 – Summary of value of Level 1 and Level 2 impacts (benefits and disbenefits) for the High, Medium and Low scenarios (2010 Prices)
The highest benefits are for public transport journey times. To achieve the benefits for sustainable modes, there is significant highway journey time and vehicle operating costs (VOC) disbenefits. This is as expected, given the substantial amount of highway space reallocated to public transport.
This disbenefit is outweighed by the journey time and journey quality benefits for public transport users which comprises a significant proportion of the overall benefit for each scenario. The High and Medium scenarios also include benefits of around £25m and £22m respectively, these are associated with cyclists and pedestrians (based on journey quality, physical activity and urban realm impacts). Table 5-8 summarises the key expected Level 1 transport user impacts and Level 2 impacts arising from each of the three funding scenarios (Low, Medium and High) that have been forecast from SRTM model runs. To see more detail including figures and graphs that illustrate these impacts, please refer to the relevant sections of Chapters 5 and 6 of Appendix 5 highlighted in the third column of the table.
160

CONNECTING SOUTHAMPTON CITY REGION TRANSFORMING CITIES FUND STRATEGIC OUTLINE BUSINESS CASE
Transport Impact Modelled output Section in Appendix 5 that set out impacts in detail
Quantified Impacts Increased number of bus trips & increased bus passenger km
Increase in number of trips on an average day by bus in 2026 Sections 5.2.1 & 5.6.1: Figures 5-6, 5-7, 5-12, 5-13, 5-14, 5-16 and 5-17.
compared to do minimum of 2,883 (low); 3,301 (medium) & 3,965 (high). An increase in bus passenger km for all three TCF programmes (44,800 for low; 55,080 for medium; and 62,200 for high programme).
Increase in journeys made by walking and/ or cycling
Active travel trips are forecast to increase by 1,550 (low), 1,600 (medium) and 2,400 (high) per average day.
Section 5.6.1 – Figure 5-11 & 5-14. Section 5.7 – Figure 5-18
Average passenger speed by bus
All of the bus services on the 5 corridors experience an Section 5.2.1 – Figure 5-3increase in average speed, and reduced end to end journey
times of between 3 and 13 minutes per bus in AM peak by 2026.
Bus Journey Time Reliability
Corridor interventions to help improve bus journey time reliability, with reduced incidence of late running buses.
Section 5.2.1 – Figure 5-5
Monetised Level 1 Impacts Faster and more Reliable Journey Times by Bus
Bus corridors experience decreased journey times worth Section 5-2: Figures 5-3, 5-4, 5-5. Section 6.3: Table 6-1 & Figure 6-2.
£142,000 (low); £180,000 (medium) and £207,000 (high) in 2010 prices and values.
Reduced capacity for car users in some locations
As a result of reallocation of roadspace, the forecast Section 5.2.1 – Figure 5-6 and 5-7; Section 5.6.1: Figure 5-13 & Section 6.3: Table 6-2.
disbenefits for cars, LGVs and HGVs– of £161.6m for the low; £137.3m for the medium and £183.5m for the high in 2010 prices.
Bus operator revenues
Fares revenues increase by £98.3m (low); £108.3m (medium) and £136.2m (high) in 2010 prices.
Section 6.3, Table 6-3 & Figure 6-3.
Improved waiting and interchange experience for bus
Quality factor impacts for new and existing bus users are Section 5.3 – Section 6.3.1 – Table 6-6valued at £45.5m (low); £67.5m (medium) and £77m (high) in
2010 prices and values. Impacts from reduction in number of accidents
This impact is valued at £13.0m (low); £29.3m (medium) and £29.7m (high)
Section 5.4 – Table 5-1 & 5-2, Figure 5-9; Section 6.3.4 – Table 6-9.
Improved Cycle Journey ambience
Cycle journey ambience benefits are valued at £6.4m (low); £12.8m (medium) and £13.1m (high) in 2010 prices & values
Section 5.4 – Figure 5-8; Section 6.3.1 – Table 6-6
Pedestrian Urban Realm benefits
This impact is valued at £6.6m (low); £8.6m (medium) & £10.3m (high) in 2010 prices & values.
Section 5.5 – Figure 5-10; Section 6.3.1 – Table 6-6
Active Mode user health benefits
The impact of reduced risk of premature death and reduced Section 6.3.2 – Table 6-7absenteeism is valued at £0.9m (low); £0.95m (medium) &
£1.4m (high) in 2010 prices & values – new users only. Noise and Air Quality Impacts
The impact of reduced noise and improved air quality is £2.7m Section 6.3.3 – Table 6-8(low); £3.3m (medium) & £3.3m (high) in 2010 prices & values.
Greenhouse Gas Impacts
There is a small disbenefit from traffic moving slower, which is Section 6.3.3 – Table 6-8modelled to increase Greenhouse Gas emissions. This
disbenefit is £1.33m (low); £1.27m (medium) & £1.9m (high) in 2010 prices and values.
Monetised Level 2 impacts Bus user Reliability This impact is valued at £32.9m (low); £49.7m (medium) &
£50.9m (high) in 2010 prices and values. Section 6.3.5 – Table 6-10
Increased economic output in imperfect competitive market
This impact is valued at £6.1m (low); £9.2m (medium) & £10.95m (high) in 2010 prices and values.
Section 6.3.5 – Table 6-10
Table 5-8– Summary of expected transport user benefits, disbenefits and other economic impacts forecast from modelling of TCF low, medium and high programmes
161
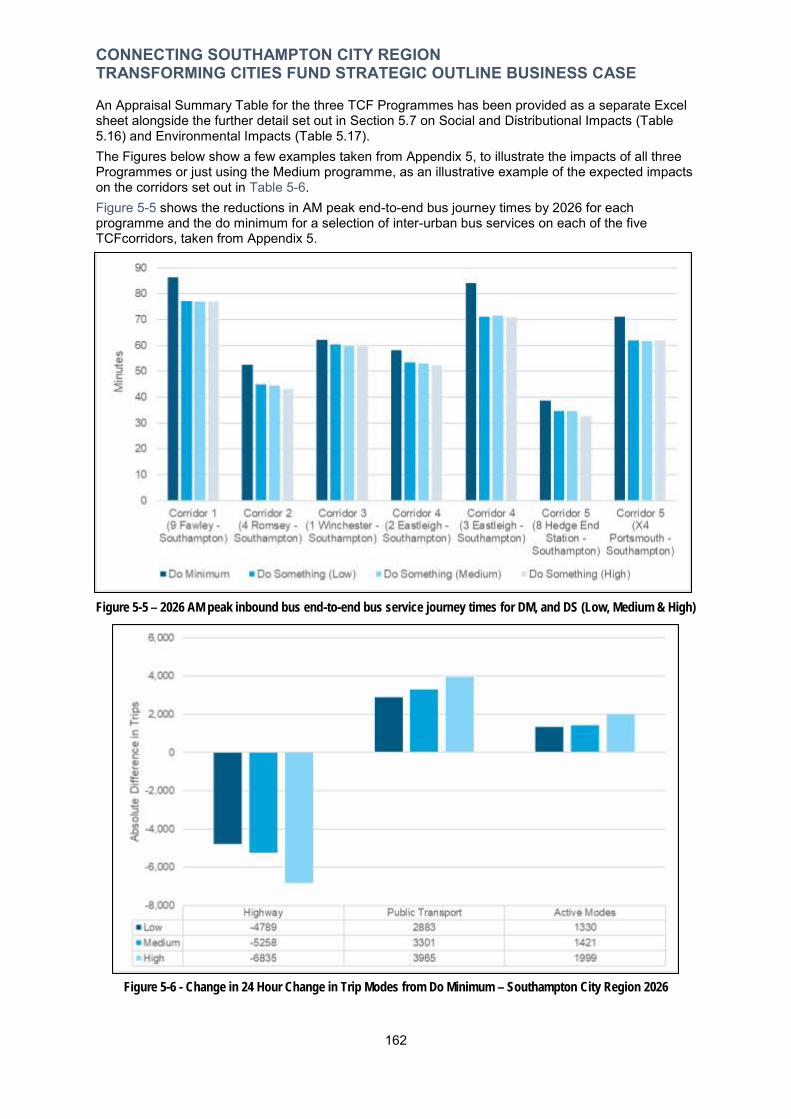
CONNECTING SOUTHAMPTON CITY REGION TRANSFORMING CITIES FUND STRATEGIC OUTLINE BUSINESS CASE
An Appraisal Summary Table for the three TCF Programmes has been provided as a separate Excel sheet alongside the further detail set out in Section 5.7 on Social and Distributional Impacts (Table 5.16) and Environmental Impacts (Table 5.17). The Figures below show a few examples taken from Appendix 5, to illustrate the impacts of all three Programmes or just using the Medium programme, as an illustrative example of the expected impacts on the corridors set out in Table 5-6. Figure 5-5 shows the reductions in AM peak end-to-end bus journey times by 2026 for each programme and the do minimum for a selection of inter-urban bus services on each of the five TCFcorridors, taken from Appendix 5.
Figure 5-5 – 2026 AM peak inbound bus end-to-end bus service journey times for DM, and DS (Low, Medium & High)
Figure 5-6 - Change in 24 Hour Change in Trip Modes from Do Minimum – Southampton City Region 2026
162

CONNECTING SOUTHAMPTON CITY REGION TRANSFORMING CITIES FUND STRATEGIC OUTLINE BUSINESS CASE
Figure 5-6 above shows the changes in highway, Public Transport and Active travel modes trips across the Southampton City Region over a 24 weekday for 2026 for each of the three programmes compared to the Do Minimum. Highway trips decrease for all scenarios, whereas both public transport and active mode trips increase.
The same trend is apparent looking at each corridor, in Figure 5-7 and Figure 5-8 using the example of the medium programme.
Figure 5-7 - Absolute change in 24 Hour Trip Modes from Do Minimum – Medium 2026
12%
-2%
0%
2%
4%
6%
8%
10%
Highway Public Transport Active Modes
-4%
City Centre Corridor 1 Corridor 2 Corridor 3 Corridor 4 Corridor 5
Figure 5-8 - Percentage change in 24 Hour Trip Modes from Do Minimum – Medium 2026
Figure 5-9 Shows the public transport mode user benefits split by corridor of journey origin for the medium scenario. The greatest proportion of user benefits are forecast to come from trips originating in the City Centre (31%) followed by trips originating on Corridor 5 (23%). Note that Corridor 5 is formed of two parallel corridors, Corridor 4 has the greatest proportion of benefits for a single corridor.
163
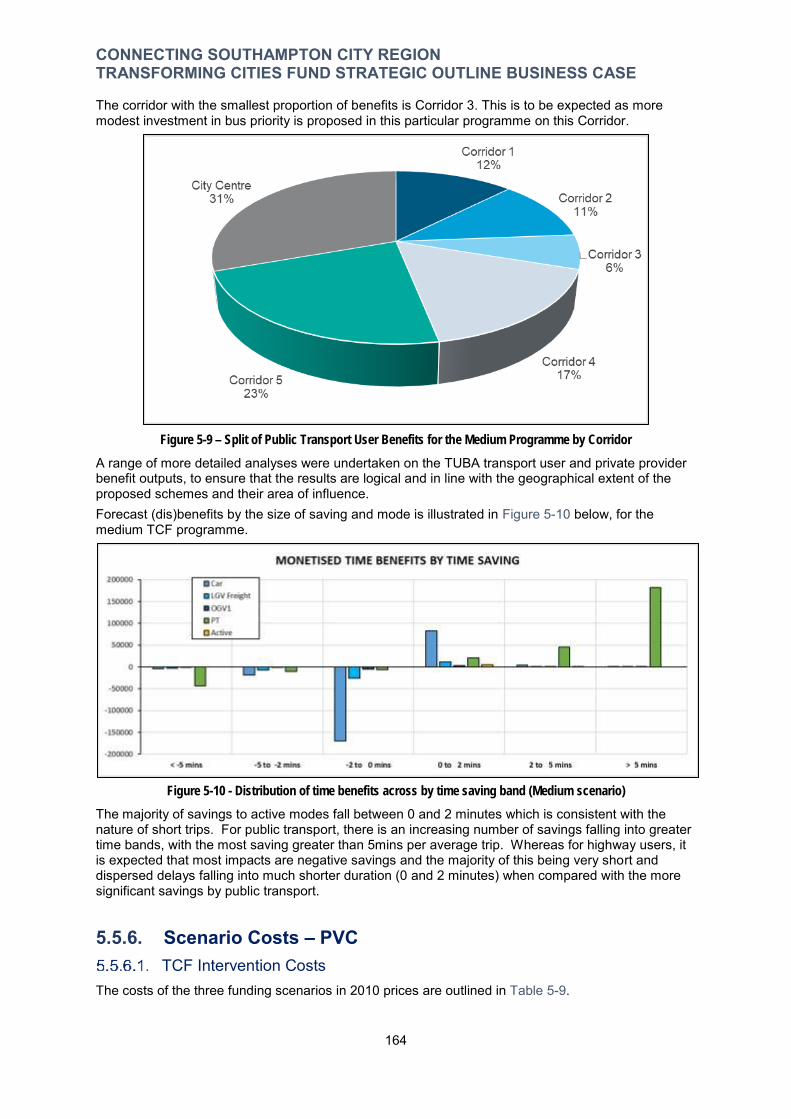
CONNECTING SOUTHAMPTON CITY REGION TRANSFORMING CITIES FUND STRATEGIC OUTLINE BUSINESS CASE
The corridor with the smallest proportion of benefits is Corridor 3. This is to be expected as more modest investment in bus priority is proposed in this particular programme on this Corridor.
Figure 5-9 – Split of Public Transport User Benefits for the Medium Programme by Corridor
A range of more detailed analyses were undertaken on the TUBA transport user and private provider benefit outputs, to ensure that the results are logical and in line with the geographical extent of the proposed schemes and their area of influence. Forecast (dis)benefits by the size of saving and mode is illustrated in Figure 5-10 below, for the medium TCF programme.
Figure 5-10 - Distribution of time benefits across by time saving band (Medium scenario)
The majority of savings to active modes fall between 0 and 2 minutes which is consistent with the nature of short trips. For public transport, there is an increasing number of savings falling into greater time bands, with the most saving greater than 5mins per average trip. Whereas for highway users, it is expected that most impacts are negative savings and the majority of this being very short and dispersed delays falling into much shorter duration (0 and 2 minutes) when compared with the more significant savings by public transport.
5.5.6. Scenario Costs – PVC TCF Intervention Costs
The costs of the three funding scenarios in 2010 prices are outlined in Table 5-9.
164
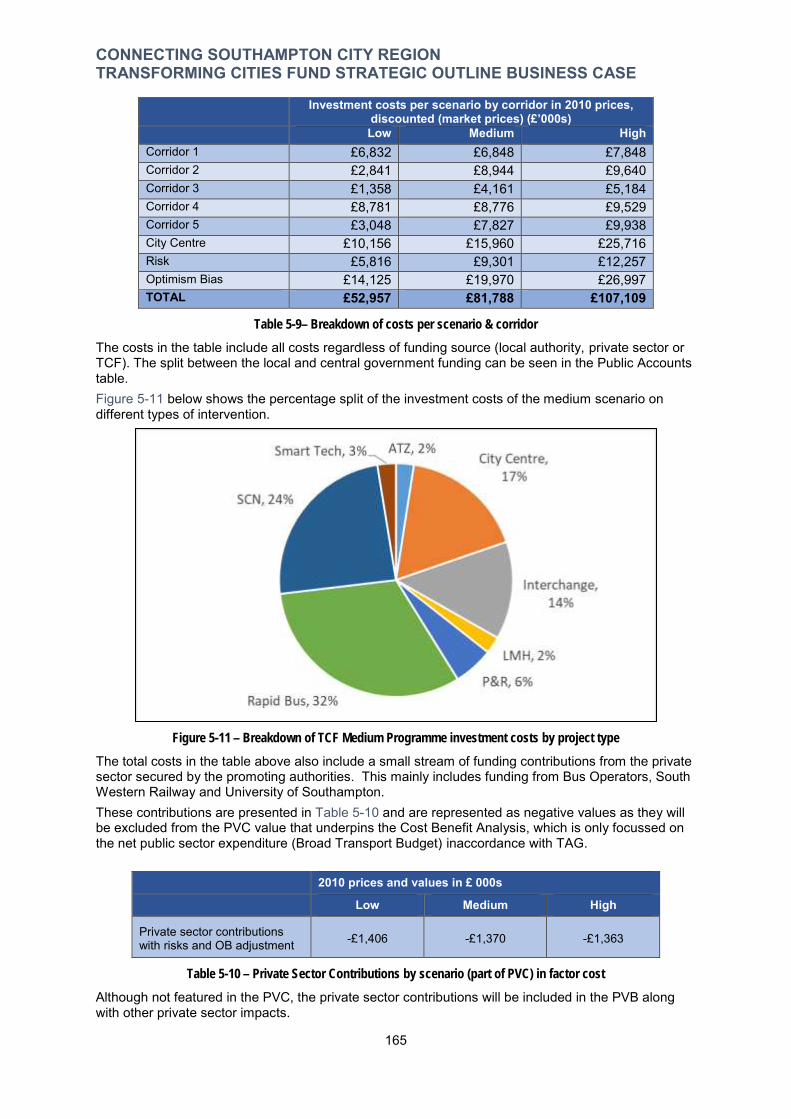
’
CONNECTING SOUTHAMPTON CITY REGION TRANSFORMING CITIES FUND STRATEGIC OUTLINE BUSINESS CASE
Investment costs per scenario by corridor in 2010 prices, discounted (market prices) (£’000s) Low Medium High
Corridor 1 £6,832 £6,848 £7,848 Corridor 2 £2,841 £8,944 £9,640 Corridor 3 £1,358 £4,161 £5,184 Corridor 4 £8,781 £8,776 £9,529 Corridor 5 £3,048 £7,827 £9,938 City Centre £10,156 £15,960 £25,716 Risk £5,816 £9,301 £12,257 Optimism Bias £14,125 £19,970 £26,997 TOTAL £52,957 £81,788 £107,109
Table 5-9– Breakdown of costs per scenario & corridor
The costs in the table include all costs regardless of funding source (local authority, private sector or TCF). The split between the local and central government funding can be seen in the Public Accounts table. Figure 5-11 below shows the percentage split of the investment costs of the medium scenario on different types of intervention.
Figure 5-11 – Breakdown of TCF Medium Programme investment costs by project type
The total costs in the table above also include a small stream of funding contributions from the private sector secured by the promoting authorities. This mainly includes funding from Bus Operators, South Western Railway and University of Southampton. These contributions are presented in Table 5-10 and are represented as negative values as they will be excluded from the PVC value that underpins the Cost Benefit Analysis, which is only focussed on the net public sector expenditure (Broad Transport Budget) inaccordance with TAG.
2010 prices and values in £ 000s
Low Medium High
Private sector contributions with risks and OB adjustment -£1,406 -£1,370 -£1,363
Table 5-10 – Private Sector Contributions by scenario (part of PVC) in factor cost
Although not featured in the PVC, the private sector contributions will be included in the PVB along with other private sector impacts.
165
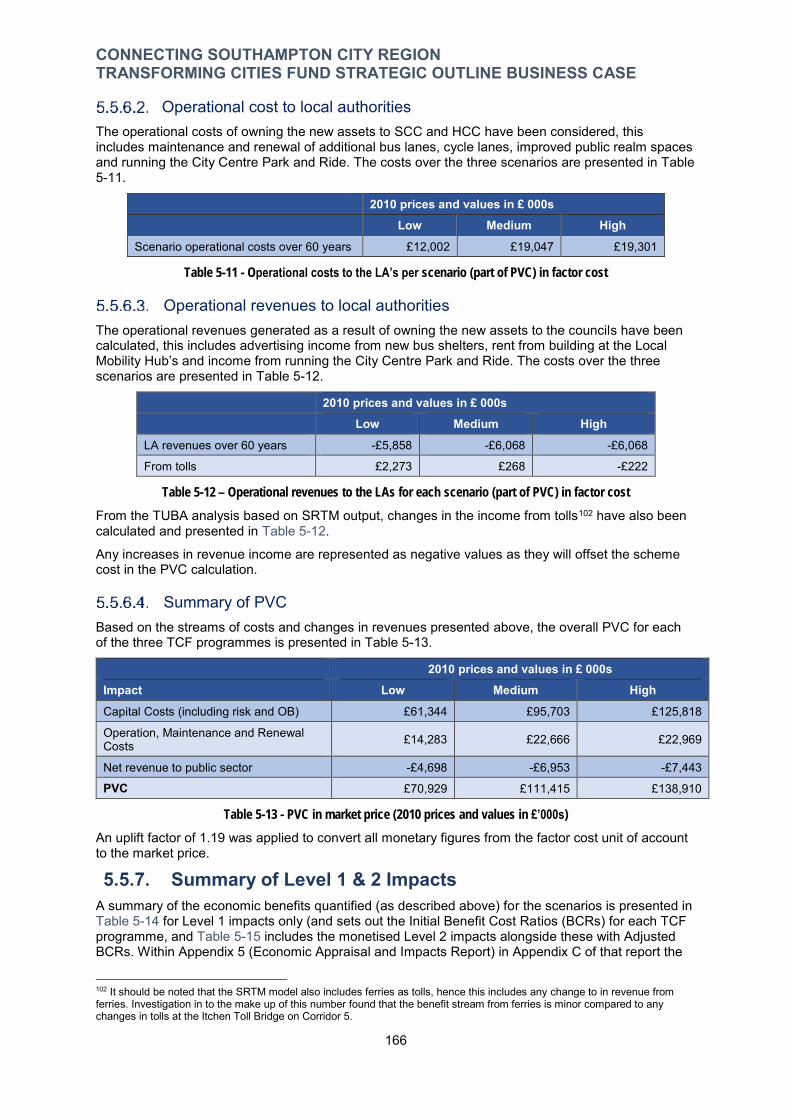
’
’
’
CONNECTING SOUTHAMPTON CITY REGION TRANSFORMING CITIES FUND STRATEGIC OUTLINE BUSINESS CASE
Operational cost to local authorities The operational costs of owning the new assets to SCC and HCC have been considered, this includes maintenance and renewal of additional bus lanes, cycle lanes, improved public realm spaces and running the City Centre Park and Ride. The costs over the three scenarios are presented in Table 5-11.
2010 prices and values in £ 000s
Low Medium High Scenario operational costs over 60 years £12,002 £19,047 £19,301
Table 5-11 - Operational costs to the LA’s per scenario (part of PVC) in factor cost
Operational revenues to local authorities The operational revenues generated as a result of owning the new assets to the councils have been calculated, this includes advertising income from new bus shelters, rent from building at the Local Mobility Hub’s and income from running the City Centre Park and Ride. The costs over the three scenarios are presented in Table 5-12.
2010 prices and values in £ 000s
Low Medium High LA revenues over 60 years -£5,858 -£6,068 -£6,068
From tolls £2,273 £268 -£222
Table 5-12 – Operational revenues to the LAs for each scenario (part of PVC) in factor cost
From the TUBA analysis based on SRTM output, changes in the income from tolls102 have also been calculated and presented in Table 5-12.
Any increases in revenue income are represented as negative values as they will offset the scheme cost in the PVC calculation.
Summary of PVC Based on the streams of costs and changes in revenues presented above, the overall PVC for each of the three TCF programmes is presented in Table 5-13.
2010 prices and values in £ 000s
Impact Low Medium High Capital Costs (including risk and OB) £61,344 £95,703 £125,818
Operation, Maintenance and Renewal Costs £14,283 £22,666 £22,969
Net revenue to public sector -£4,698 -£6,953 -£7,443
PVC £70,929 £111,415 £138,910
Table 5-13 - PVC in market price (2010 prices and values in £’000s)
An uplift factor of 1.19 was applied to convert all monetary figures from the factor cost unit of account to the market price.
5.5.7. Summary of Level 1 & 2 Impacts A summary of the economic benefits quantified (as described above) for the scenarios is presented in Table 5-14 for Level 1 impacts only (and sets out the Initial Benefit Cost Ratios (BCRs) for each TCF programme, and Table 5-15 includes the monetised Level 2 impacts alongside these with Adjusted BCRs. Within Appendix 5 (Economic Appraisal and Impacts Report) in Appendix C of that report the
102 It should be noted that the SRTM model also includes ferries as tolls, hence this includes any change to in revenue from ferries. Investigation in to the make up of this number found that the benefit stream from ferries is minor compared to any changes in tolls at the Itchen Toll Bridge on Corridor 5.
166

’
’
CONNECTING SOUTHAMPTON CITY REGION TRANSFORMING CITIES FUND STRATEGIC OUTLINE BUSINESS CASE
Transport Economic Efficiency, Public Accounts, and Analysis of Monetised Costs and Benefits (AMCB) are presented. These have also been provided in Excel Sheet format in Appendix 6a & b.
2010 prices and values in £ 000s
Impact Low Medium High
Highway Journey Time & Vehicle Operating Costs
-£161,614 -£137,339 -£183,502
Public Transport Journey Time £142,060 £180,044 £206,549
Public Transport Journey Quality £45,511 £67,544 £77,026
Public Transport Operator Revenue (net)
£83,431 £97,516 £117,402
Indirect Tax Revenues -£10,673 -£12,556 -£14,762
Cycle Journey Quality £6,381 £12,759 £13,150
Cycle Increase - Health Impacts £0,928 £0,954 £1,417
Urban Realm Improvements £6,576 £8,576 £10,299
Air Quality and Noise £2,680 £3,333 £3,275
Greenhouse Gases -£1,329 -£1,271 -£1,955
Reduction in Accidents £12,823 £27,827 £28,272
Present Value of Benefits (Level 1 Impacts)
£126,7722 £247,391 £257,182
Present Value of Costs (PVC) £70,929 £111,415 £141,343
Net Present Public Value (NPPV) £55,843 £135,976 £115,806
Initial BCR 1.79 2.22 1.82 Table 5-14 – Summary of Monetised Impacts (Level 1) and Calculation of Initial BCR for the three TCF Programmes
2010 prices and values in £ 000s
Impact Low Medium High
Present Value of Benefits (Level 1 Impacts)
£126,77 £247,391 £257,182
Bus Reliability £32,949 £49,680 £50,873
Economic output in imperfect markets
£6,072 £9,191 £10,953
Present Value of Benefits (Level 1 & 2 impacts)
£165,792 £306,262 £319,976
Present Value of Costs (PVC) £70,929 £111,415 £141,343
Net Present Public Value (NPPV) £94,864 £194,847 £177,632
Adjusted BCR 2.34 2.75 2.26
Table 5-15 - Calculation of Adjusted BCR (Level 1+2) for the three funding scenarios
167
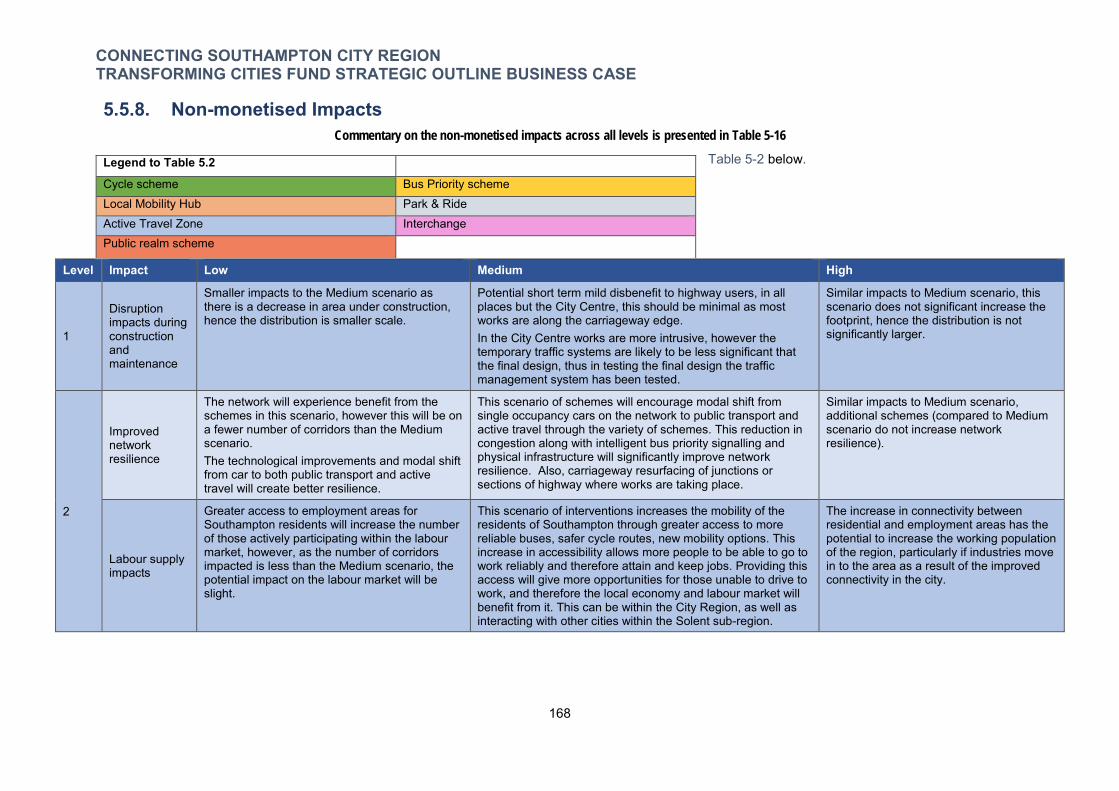
CONNECTING SOUTHAMPTON CITY REGION TRANSFORMING CITIES FUND STRATEGIC OUTLINE BUSINESS CASE
5.5.8. Non-monetised Impacts Commentary on the non-monetised impacts across all levels is presented in Table 5-16
Table 5-2 below.
Level Impact Low Medium High
1
Disruption impacts during construction and maintenance
Smaller impacts to the Medium scenario as there is a decrease in area under construction, hence the distribution is smaller scale.
Potential short term mild disbenefit to highway users, in all places but the City Centre, this should be minimal as most works are along the carriageway edge. In the City Centre works are more intrusive, however the temporary traffic systems are likely to be less significant that the final design, thus in testing the final design the traffic management system has been tested.
Similar impacts to Medium scenario, this scenario does not significant increase the footprint, hence the distribution is not significantly larger.
2
Improved network resilience
The network will experience benefit from the schemes in this scenario, however this will be on a fewer number of corridors than the Medium scenario. The technological improvements and modal shift from car to both public transport and active travel will create better resilience.
This scenario of schemes will encourage modal shift from single occupancy cars on the network to public transport and active travel through the variety of schemes. This reduction in congestion along with intelligent bus priority signalling and physical infrastructure will significantly improve network resilience. Also, carriageway resurfacing of junctions or sections of highway where works are taking place.
Similar impacts to Medium scenario, additional schemes (compared to Medium scenario do not increase network resilience).
Labour supply impacts
Greater access to employment areas for Southampton residents will increase the number of those actively participating within the labour market, however, as the number of corridors impacted is less than the Medium scenario, the potential impact on the labour market will be slight.
This scenario of interventions increases the mobility of the residents of Southampton through greater access to more reliable buses, safer cycle routes, new mobility options. This increase in accessibility allows more people to be able to go to work reliably and therefore attain and keep jobs. Providing this access will give more opportunities for those unable to drive to work, and therefore the local economy and labour market will benefit from it. This can be within the City Region, as well as interacting with other cities within the Solent sub-region.
The increase in connectivity between residential and employment areas has the potential to increase the working population of the region, particularly if industries move in to the area as a result of the improved connectivity in the city.
Legend to Table 5.2
Cycle scheme Bus Priority scheme Local Mobility Hub Park & Ride Active Travel Zone Interchange Public realm scheme
168
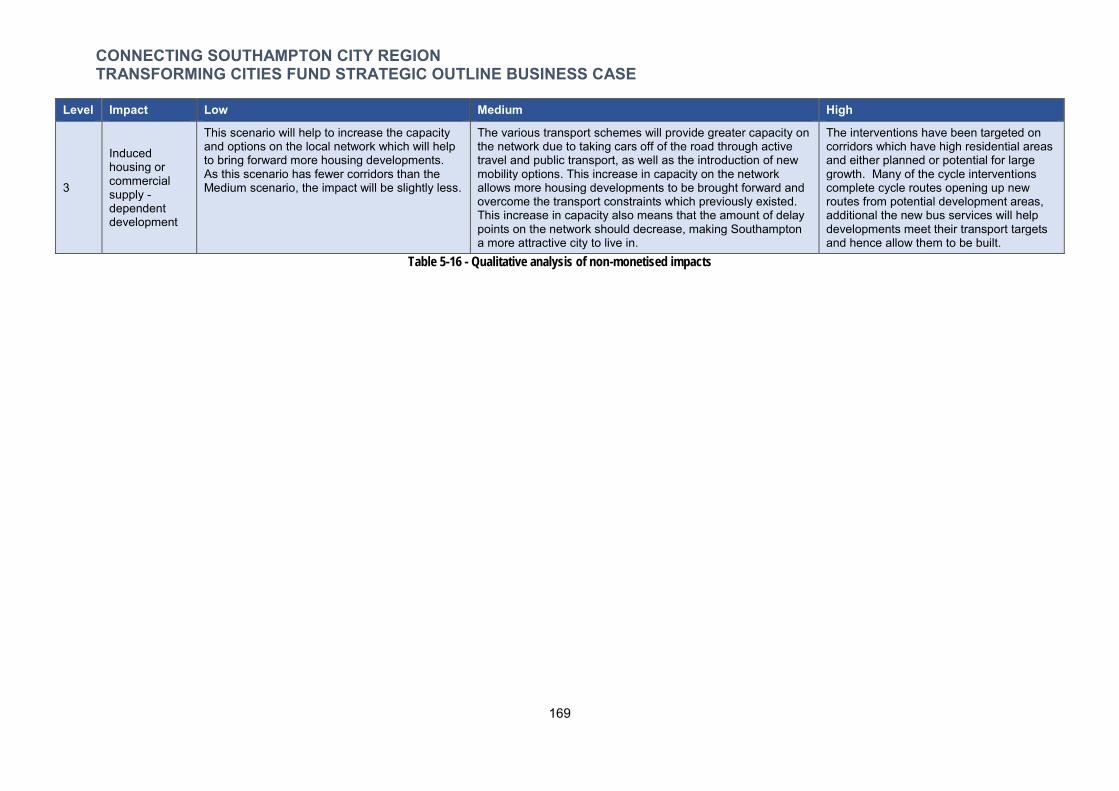
CONNECTING SOUTHAMPTON CITY REGION TRANSFORMING CITIES FUND STRATEGIC OUTLINE BUSINESS CASE
Level Impact Low Medium High
3
Induced housing or commercial supply -dependent development
This scenario will help to increase the capacity and options on the local network which will help to bring forward more housing developments. As this scenario has fewer corridors than the Medium scenario, the impact will be slightly less.
The various transport schemes will provide greater capacity on the network due to taking cars off of the road through active travel and public transport, as well as the introduction of new mobility options. This increase in capacity on the network allows more housing developments to be brought forward and overcome the transport constraints which previously existed. This increase in capacity also means that the amount of delay points on the network should decrease, making Southampton a more attractive city to live in.
The interventions have been targeted on corridors which have high residential areas and either planned or potential for large growth. Many of the cycle interventions complete cycle routes opening up new routes from potential development areas, additional the new bus services will help developments meet their transport targets and hence allow them to be built.
Table 5-16 - Qualitative analysis of non-monetised impacts
169

CONNECTING SOUTHAMPTON CITY REGION TRANSFORMING CITIES FUND STRATEGIC OUTLINE BUSINESS CASE
5.5.9. Sensitivity Tests To understand the impacts modelling and analysis assumptions can have on the results, a number of sensitivity tests have been carried out. The tests have been selected to test a range of the assumptions within all the model tools and techniques used.
The tests conducted are listed below then each is described in more detail in the sub-sections that follow: 44% Optimism Bias used for all projects; Higher growth in demand; Lower growth in demand; and More conservative assumptions used in the bus quality and reliability calculations.
Optimism Bias Test A level of Optimism Bias has been applied to each project depending on the maturity and nature of the intervention, as set out in Table 5-7. A sensitivity test using a global 44% of project costs (including risk) was used. This did not affect the Value for Money (VfM) category for any package, except for the Medium Scenario, where the the VfM category fell to Medium VfM, with an initial BCR just below 2. None of the adjusted BCRs see a change in VfM category.
Higher / lower growth tests In these tests all (dis)benefit streams which are based on demand were factored up/down by 10%. This did not affect the Value for Money category, with the exception of the medium package for the 10% lower growth scenario, which reduces the VfM category down to Medium, with an initial BCR just below 2. None of the adjusted BCRs see a change in VfM category.
More conservative assumptions used in the bus quality and reliability calculations
To understand the sensitivity of the results on the less established modelling assumptions, a test was carried out in which the bus quality and reliability assumptions were more conservative. Specifically, for bus quality it was assumed that there would not be any CCTV or RTPI installed (these were selected as they are the most risky in terms of delivery due to the electronics, technology and third parties involved).
For bus reliability the assumption around the scale of improvement was changed – in the main case the maximum minutes late currently experienced by 50% of buses would be the new average lateness. In the sensitivity test the maximum minutes late currently experienced by 60% of buses would be the new average. This means that in the base case it is assume that half the buses would become more reliable, but in the sensitivity test only 40% of buses experience an improvement.
To see the impact of these sensitivity tests on transport user benefits, Level 2 impacts and initial and adjusted BCRs, please refer to Appendix 5 – Table 6-19.
170
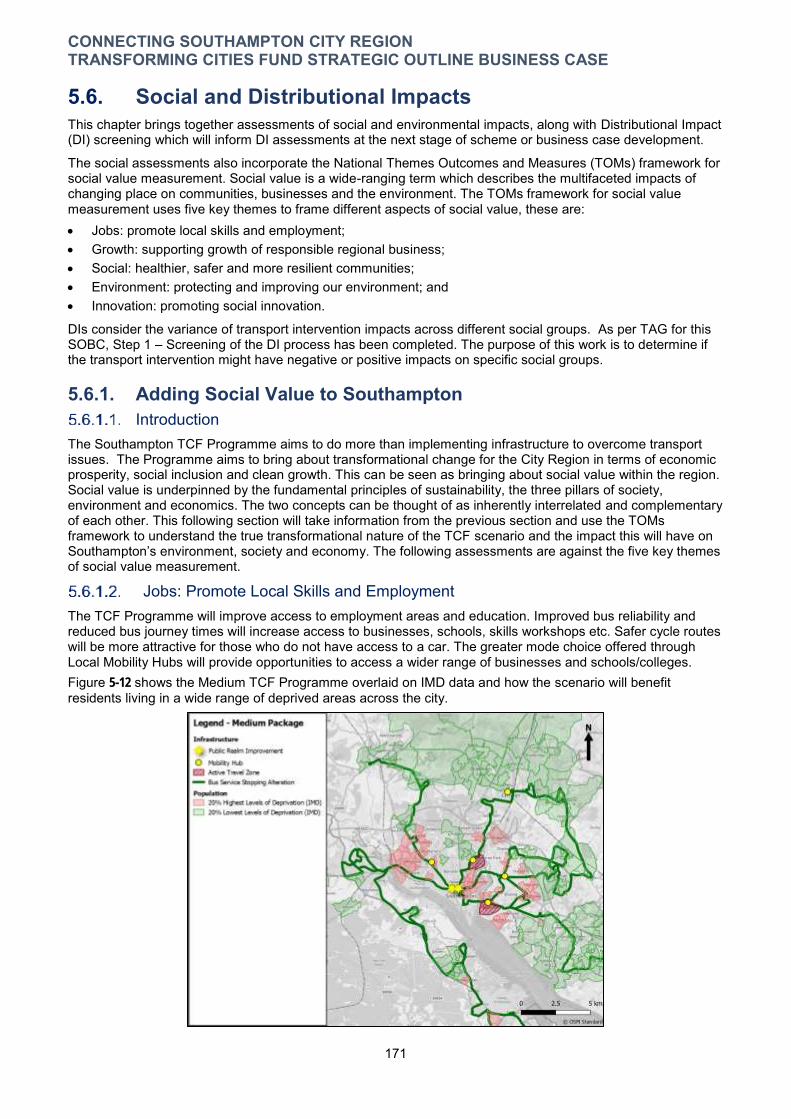
CONNECTING SOUTHAMPTON CITY REGION TRANSFORMING CITIES FUND STRATEGIC OUTLINE BUSINESS CASE
5.6. Social and Distributional Impacts This chapter brings together assessments of social and environmental impacts, along with Distributional Impact (DI) screening which will inform DI assessments at the next stage of scheme or business case development.
The social assessments also incorporate the National Themes Outcomes and Measures (TOMs) framework for social value measurement. Social value is a wide-ranging term which describes the multifaceted impacts of changing place on communities, businesses and the environment. The TOMs framework for social value measurement uses five key themes to frame different aspects of social value, these are: Jobs: promote local skills and employment; Growth: supporting growth of responsible regional business; Social: healthier, safer and more resilient communities; Environment: protecting and improving our environment; and Innovation: promoting social innovation.
DIs consider the variance of transport intervention impacts across different social groups. As per TAG for this SOBC, Step 1 – Screening of the DI process has been completed. The purpose of this work is to determine if the transport intervention might have negative or positive impacts on specific social groups.
5.6.1. Adding Social Value to Southampton Introduction
The Southampton TCF Programme aims to do more than implementing infrastructure to overcome transport issues. The Programme aims to bring about transformational change for the City Region in terms of economic prosperity, social inclusion and clean growth. This can be seen as bringing about social value within the region. Social value is underpinned by the fundamental principles of sustainability, the three pillars of society, environment and economics. The two concepts can be thought of as inherently interrelated and complementary of each other. This following section will take information from the previous section and use the TOMs framework to understand the true transformational nature of the TCF scenario and the impact this will have on Southampton’s environment, society and economy. The following assessments are against the five key themes of social value measurement.
Jobs: Promote Local Skills and Employment The TCF Programme will improve access to employment areas and education. Improved bus reliability and reduced bus journey times will increase access to businesses, schools, skills workshops etc. Safer cycle routes will be more attractive for those who do not have access to a car. The greater mode choice offered through Local Mobility Hubs will provide opportunities to access a wider range of businesses and schools/colleges. Figure 5-12 shows the Medium TCF Programme overlaid on IMD data and how the scenario will benefit residents living in a wide range of deprived areas across the city.
171
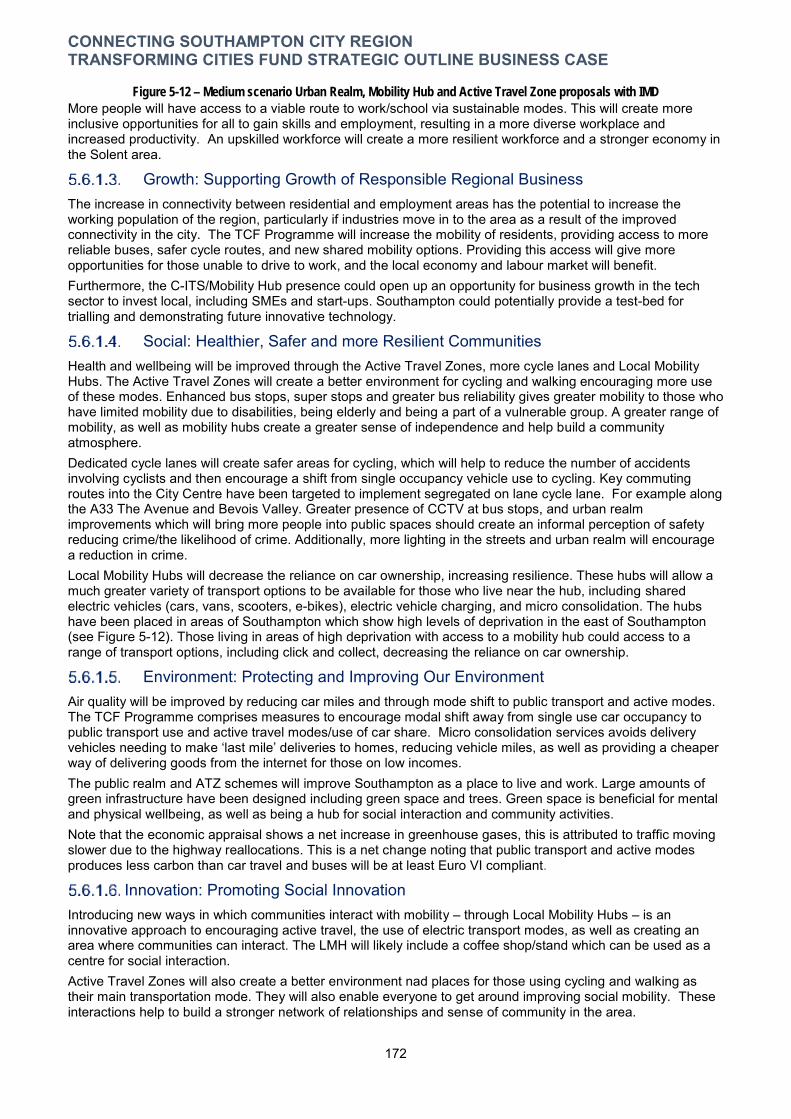
CONNECTING SOUTHAMPTON CITY REGION TRANSFORMING CITIES FUND STRATEGIC OUTLINE BUSINESS CASE
Figure 5-12 – Medium scenario Urban Realm, Mobility Hub and Active Travel Zone proposals with IMD
More people will have access to a viable route to work/school via sustainable modes. This will create more inclusive opportunities for all to gain skills and employment, resulting in a more diverse workplace and increased productivity. An upskilled workforce will create a more resilient workforce and a stronger economy in the Solent area.
Growth: Supporting Growth of Responsible Regional Business The increase in connectivity between residential and employment areas has the potential to increase the working population of the region, particularly if industries move in to the area as a result of the improved connectivity in the city. The TCF Programme will increase the mobility of residents, providing access to more reliable buses, safer cycle routes, and new shared mobility options. Providing this access will give more opportunities for those unable to drive to work, and the local economy and labour market will benefit. Furthermore, the C-ITS/Mobility Hub presence could open up an opportunity for business growth in the tech sector to invest local, including SMEs and start-ups. Southampton could potentially provide a test-bed for trialling and demonstrating future innovative technology.
Social: Healthier, Safer and more Resilient Communities Health and wellbeing will be improved through the Active Travel Zones, more cycle lanes and Local Mobility Hubs. The Active Travel Zones will create a better environment for cycling and walking encouraging more use of these modes. Enhanced bus stops, super stops and greater bus reliability gives greater mobility to those who have limited mobility due to disabilities, being elderly and being a part of a vulnerable group. A greater range of mobility, as well as mobility hubs create a greater sense of independence and help build a community atmosphere. Dedicated cycle lanes will create safer areas for cycling, which will help to reduce the number of accidents involving cyclists and then encourage a shift from single occupancy vehicle use to cycling. Key commuting routes into the City Centre have been targeted to implement segregated on lane cycle lane. For example along the A33 The Avenue and Bevois Valley. Greater presence of CCTV at bus stops, and urban realm improvements which will bring more people into public spaces should create an informal perception of safety reducing crime/the likelihood of crime. Additionally, more lighting in the streets and urban realm will encourage a reduction in crime. Local Mobility Hubs will decrease the reliance on car ownership, increasing resilience. These hubs will allow a much greater variety of transport options to be available for those who live near the hub, including shared electric vehicles (cars, vans, scooters, e-bikes), electric vehicle charging, and micro consolidation. The hubs have been placed in areas of Southampton which show high levels of deprivation in the east of Southampton (see Figure 5-12). Those living in areas of high deprivation with access to a mobility hub could access to a range of transport options, including click and collect, decreasing the reliance on car ownership.
Environment: Protecting and Improving Our Environment Air quality will be improved by reducing car miles and through mode shift to public transport and active modes. The TCF Programme comprises measures to encourage modal shift away from single use car occupancy to public transport use and active travel modes/use of car share. Micro consolidation services avoids delivery vehicles needing to make ‘last mile’ deliveries to homes, reducing vehicle miles, as well as providing a cheaper way of delivering goods from the internet for those on low incomes. The public realm and ATZ schemes will improve Southampton as a place to live and work. Large amounts of green infrastructure have been designed including green space and trees. Green space is beneficial for mental and physical wellbeing, as well as being a hub for social interaction and community activities. Note that the economic appraisal shows a net increase in greenhouse gases, this is attributed to traffic moving slower due to the highway reallocations. This is a net change noting that public transport and active modes produces less carbon than car travel and buses will be at least Euro VI compliant.
Innovation: Promoting Social Innovation Introducing new ways in which communities interact with mobility – through Local Mobility Hubs – is an innovative approach to encouraging active travel, the use of electric transport modes, as well as creating an area where communities can interact. The LMH will likely include a coffee shop/stand which can be used as a centre for social interaction. Active Travel Zones will also create a better environment nad places for those using cycling and walking as their main transportation mode. They will also enable everyone to get around improving social mobility. These interactions help to build a stronger network of relationships and sense of community in the area.
172
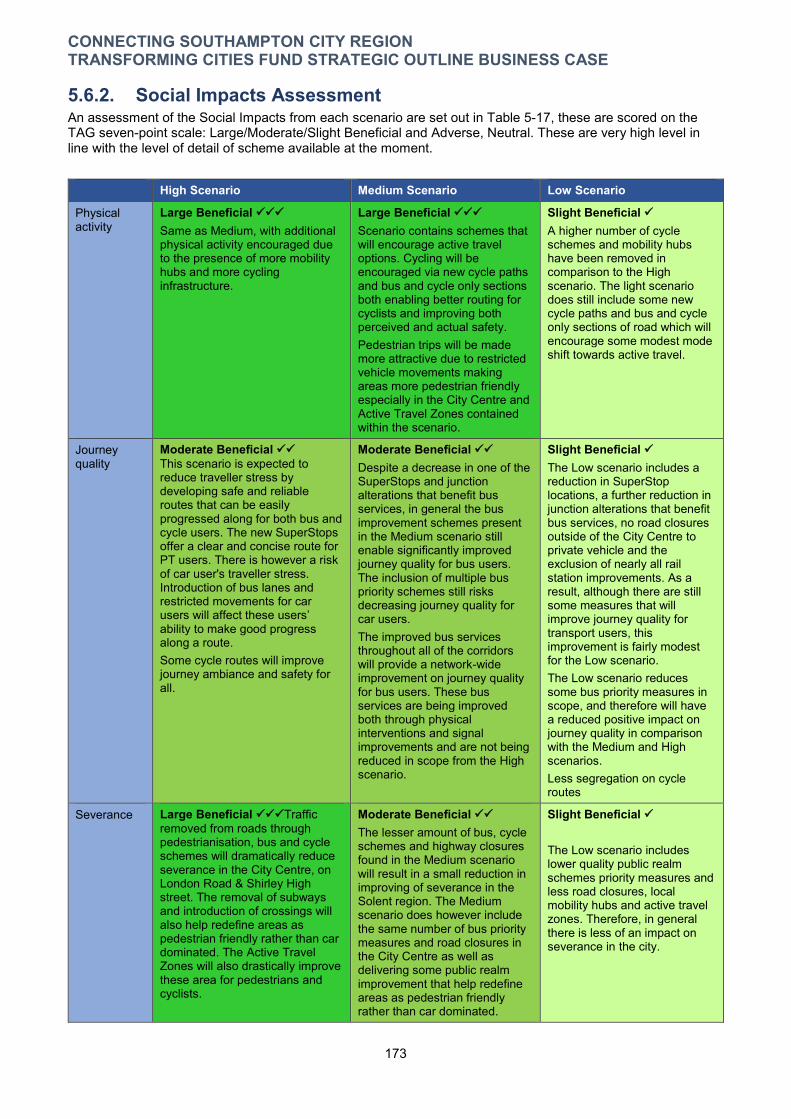
CONNECTING SOUTHAMPTON CITY REGION TRANSFORMING CITIES FUND STRATEGIC OUTLINE BUSINESS CASE
5.6.2. Social Impacts Assessment An assessment of the Social Impacts from each scenario are set out in Table 5-17, these are scored on the TAG seven-point scale: Large/Moderate/Slight Beneficial and Adverse, Neutral. These are very high level in line with the level of detail of scheme available at the moment.
High Scenario Medium Scenario Low Scenario
Physical activity
Large Beneficial Same as Medium, with additional physical activity encouraged due to the presence of more mobility hubs and more cycling infrastructure.
Large Beneficial Scenario contains schemes that will encourage active travel options. Cycling will be encouraged via new cycle paths and bus and cycle only sections both enabling better routing for cyclists and improving both perceived and actual safety. Pedestrian trips will be made more attractive due to restricted vehicle movements making areas more pedestrian friendly especially in the City Centre and Active Travel Zones contained within the scenario.
Slight Beneficial A higher number of cycle schemes and mobility hubs have been removed in comparison to the High scenario. The light scenario does still include some new cycle paths and bus and cycle only sections of road which will encourage some modest mode shift towards active travel.
Journey quality
Moderate Beneficial This scenario is expected to reduce traveller stress by developing safe and reliable routes that can be easily progressed along for both bus and cycle users. The new SuperStops offer a clear and concise route for PT users. There is however a risk of car user's traveller stress. Introduction of bus lanes and restricted movements for car users will affect these users’ ability to make good progress along a route. Some cycle routes will improve journey ambiance and safety for all.
Moderate Beneficial Despite a decrease in one of the SuperStops and junction alterations that benefit bus services, in general the bus improvement schemes present in the Medium scenario still enable significantly improved journey quality for bus users. The inclusion of multiple bus priority schemes still risks decreasing journey quality for car users. The improved bus services throughout all of the corridors will provide a network-wide improvement on journey quality for bus users. These bus services are being improved both through physical interventions and signal improvements and are not being reduced in scope from the High scenario.
Slight Beneficial The Low scenario includes a reduction in SuperStop locations, a further reduction in junction alterations that benefit bus services, no road closures outside of the City Centre to private vehicle and the exclusion of nearly all rail station improvements. As a result, although there are still some measures that will improve journey quality for transport users, this improvement is fairly modest for the Low scenario. The Low scenario reduces some bus priority measures in scope, and therefore will have a reduced positive impact on journey quality in comparison with the Medium and High scenarios. Less segregation on cycle routes
Severance Large Beneficial Traffic removed from roads through pedestrianisation, bus and cycle schemes will dramatically reduce severance in the City Centre, on London Road & Shirley High street. The removal of subways and introduction of crossings will also help redefine areas as pedestrian friendly rather than car dominated. The Active Travel Zones will also drastically improve these area for pedestrians and cyclists.
Moderate Beneficial The lesser amount of bus, cycle schemes and highway closures found in the Medium scenario will result in a small reduction in improving of severance in the Solent region. The Medium scenario does however include the same number of bus priority measures and road closures in the City Centre as well as delivering some public realm improvement that help redefine areas as pedestrian friendly rather than car dominated.
Slight Beneficial
The Low scenario includes lower quality public realm schemes priority measures and less road closures, local mobility hubs and active travel zones. Therefore, in general there is less of an impact on severance in the city.
173

CONNECTING SOUTHAMPTON CITY REGION TRANSFORMING CITIES FUND STRATEGIC OUTLINE BUSINESS CASE
High Scenario Medium Scenario Low Scenario
Security Moderate Beneficial Same as Medium.
Moderate Beneficial The improvement to bus stops and station interchange facilities will improve the perceived security. The increase in passengers will improve the natural surveillance of areas. Improvements to cycle facilities and an increased segregation from cars will improve the actual and perceived security of cyclists.
Moderate Beneficial Despite a reduced number of bus stop improvements and cycle facility improvements that segregate cyclists from cars, there is still a sufficient number of such schemes in the Low scenario to improve the security and perceived security of the region.
Option and non-use values
Moderate Beneficial The increased frequency, rationalised routing offering a more direct service, along with highway changes to improve bus journey times increases the perceived options to many residents.
Moderate Beneficial The increased frequency, rationalised routing offering a more direct service, along with highway changes to improve bus journey times increases the perceived options to many residents.
Slight Beneficial This scenario would result in less additional buses hence the smaller benefit.
Table 5-17 - Assessment of social impacts
5.6.3. Distributional Impacts – screening The geographic coverage of all scenarios are the same, as is the potential type of transport impacts – it is the quantum of these impacts which vary across the scenarios. For this reason, one screening exercise has been completed, which has found that future business cases will need to investigate the spatial impacts of all indicators except Affordability. Full details of this screening process are set out in Section 7.2.3 of Appendix 5. This contains the completed screening proforma. This has considered the appraisal output criteria to determine any potential impact of the intervention.
5.7. Environmental Impacts The level of environmental impact assessment is proportionate to the early stage of scheme development, the assessments are presented in Table 5-18. The assessments have used the TAG seven-point scale: Large/Moderate/Slight Beneficial and Adverse, Neutral. In some instances, the assessment reflects the ambition of the project team as they develop the scenario. The townscape impacts are not yet full known, this will be assessed through the detail designs of each scheme but the scheme intentions are known.
174

CONNECTING SOUTHAMPTON CITY REGION TRANSFORMING CITIES FUND STRATEGIC OUTLINE BUSINESS CASE
High Scenario Medium Scenario Low Scenario
Water Neutral Same as Medium.
Neutral Extensive consideration of the individual schemes impact on water courses is yet to be assessed as this is a programme level SOBC, however with regards to the programme there will not be a large increase in tarmacked area hence run off should not increase. Any interaction with water course will be designed so that negative impacts are mitigated and full consultation with the appropriate body will be carried out e.g. Environment Agency, the Port Authority or the Canals and River Trust.
Neutral Same as Medium.
Historic Neutral Same as Medium.
Neutral Consideration of the individual schemes impact on items of historic significant is yet to be assessed, however the designers’ intentions will be to mitigate any negative impacts and complete full consultations with the appropriate bodies.
The removal of car parking at Civic Centre and Albion Place will enhance the setting of the listed buildings. But maybe negative impact of introducing buses in Albion Place on Castle Walls Scheduled Ancient Monument, this will need to be mitigated.
Neutral Same as Medium.
Biodiversity Slight Beneficial Same as Medium as public realm increase from the medium scenario will not be significant enough to make large environmental impacts.
Slight Beneficial In most instances, schemes have been selected where no land take is required and works can be completed within the highway boundary, hence loss of habitats will be minimal. Where pedestrianisation, ATZs, and junction rationalisations schemes are taking place, green infrastructure will be considered with the design with the potential to improve localised biodiversity within the city space. The public realm will enhance the townscape reducing the dominance of the car.
Slight Beneficial Fewer cycle schemes will mean less habitats are disrupted. However, the reduction of public realm work in the centre reduces the opportunity to introduce biodiversity. Hence the overall score is the same.
175
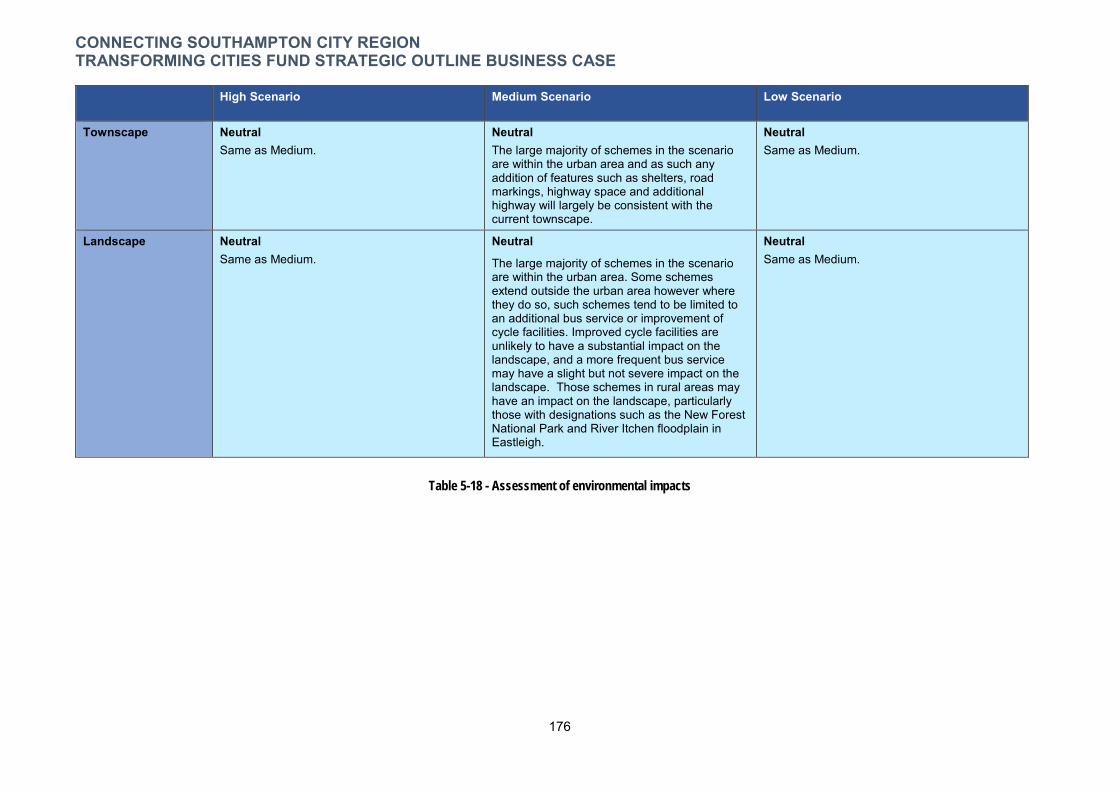
CONNECTING SOUTHAMPTON CITY REGION TRANSFORMING CITIES FUND STRATEGIC OUTLINE BUSINESS CASE
High Scenario Medium Scenario Low Scenario
Townscape Neutral Same as Medium.
Neutral Neutral Same as Medium.The large majority of schemes in the scenario
are within the urban area and as such any addition of features such as shelters, road markings, highway space and additional highway will largely be consistent with the current townscape.
Landscape Neutral Same as Medium.
Neutral Neutral Same as Medium. The large majority of schemes in the scenario
are within the urban area. Some schemes extend outside the urban area however where they do so, such schemes tend to be limited to an additional bus service or improvement of cycle facilities. Improved cycle facilities are unlikely to have a substantial impact on the landscape, and a more frequent bus service may have a slight but not severe impact on the landscape. Those schemes in rural areas may have an impact on the landscape, particularly those with designations such as the New Forest National Park and River Itchen floodplain in Eastleigh.
Table 5-18 - Assessment of environmental impacts
176
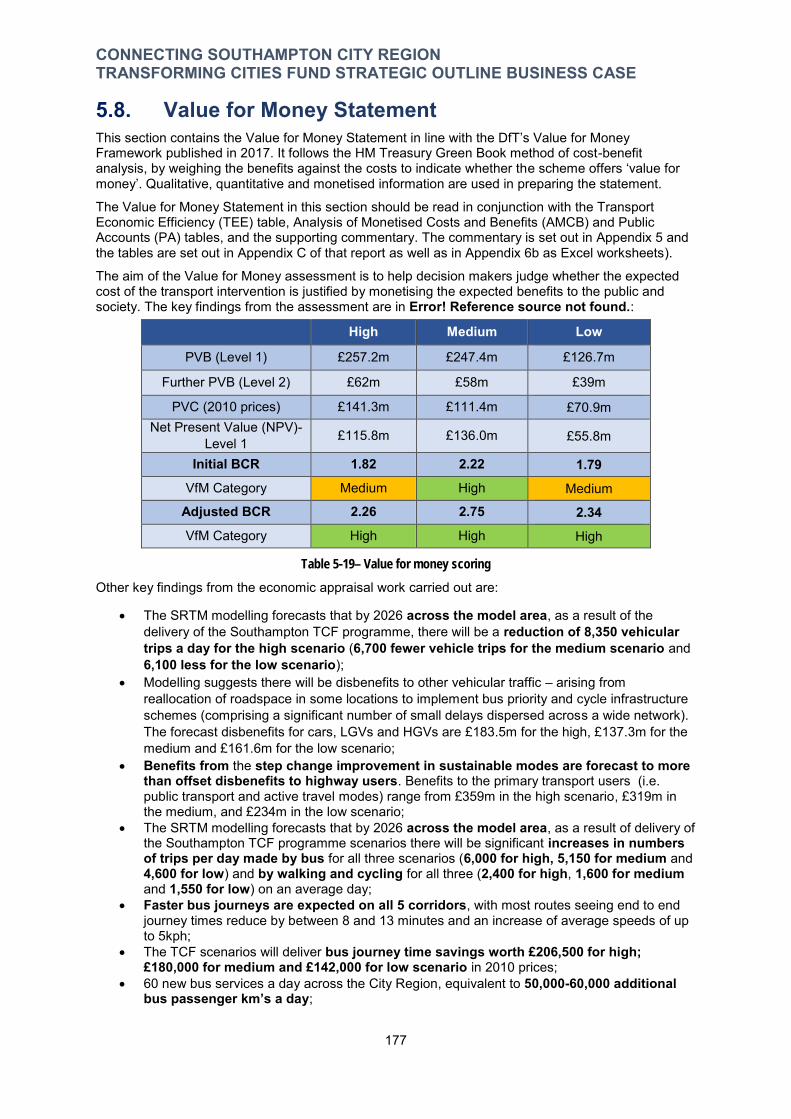
CONNECTING SOUTHAMPTON CITY REGION TRANSFORMING CITIES FUND STRATEGIC OUTLINE BUSINESS CASE
5.8. Value for Money Statement This section contains the Value for Money Statement in line with the DfT’s Value for Money Framework published in 2017. It follows the HM Treasury Green Book method of cost-benefit analysis, by weighing the benefits against the costs to indicate whether the scheme offers ‘value for money’. Qualitative, quantitative and monetised information are used in preparing the statement.
The Value for Money Statement in this section should be read in conjunction with the Transport Economic Efficiency (TEE) table, Analysis of Monetised Costs and Benefits (AMCB) and Public Accounts (PA) tables, and the supporting commentary. The commentary is set out in Appendix 5 and the tables are set out in Appendix C of that report as well as in Appendix 6b as Excel worksheets).
The aim of the Value for Money assessment is to help decision makers judge whether the expected cost of the transport intervention is justified by monetising the expected benefits to the public and society. The key findings from the assessment are in Error! Reference source not found.:
High Medium Low
PVB (Level 1) £257.2m £247.4m £126.7m
Further PVB (Level 2) £62m £58m £39m
PVC (2010 prices) £141.3m £111.4m £70.9m Net Present Value (NPV)-
Level 1 £115.8m £136.0m £55.8m
Initial BCR 1.82 2.22 1.79 VfM Category Medium High Medium
Adjusted BCR 2.26 2.75 2.34 VfM Category High High High
Table 5-19– Value for money scoring
Other key findings from the economic appraisal work carried out are:
The SRTM modelling forecasts that by 2026 across the model area, as a result of the delivery of the Southampton TCF programme, there will be a reduction of 8,350 vehicular trips a day for the high scenario (6,700 fewer vehicle trips for the medium scenario and 6,100 less for the low scenario);
Modelling suggests there will be disbenefits to other vehicular traffic – arising from reallocation of roadspace in some locations to implement bus priority and cycle infrastructure schemes (comprising a significant number of small delays dispersed across a wide network). The forecast disbenefits for cars, LGVs and HGVs are £183.5m for the high, £137.3m for the medium and £161.6m for the low scenario;
Benefits from the step change improvement in sustainable modes are forecast to more than offset disbenefits to highway users. Benefits to the primary transport users (i.e. public transport and active travel modes) range from £359m in the high scenario, £319m in the medium, and £234m in the low scenario;
The SRTM modelling forecasts that by 2026 across the model area, as a result of delivery of the Southampton TCF programme scenarios there will be significant increases in numbers of trips per day made by bus for all three scenarios (6,000 for high, 5,150 for medium and 4,600 for low) and by walking and cycling for all three (2,400 for high, 1,600 for medium and 1,550 for low) on an average day;
Faster bus journeys are expected on all 5 corridors, with most routes seeing end to end journey times reduce by between 8 and 13 minutes and an increase of average speeds of up to 5kph;
The TCF scenarios will deliver bus journey time savings worth £206,500 for high; £180,000 for medium and £142,000 for low scenario in 2010 prices;
60 new bus services a day across the City Region, equivalent to 50,000-60,000 additional bus passenger km’s a day;
177

CONNECTING SOUTHAMPTON CITY REGION TRANSFORMING CITIES FUND STRATEGIC OUTLINE BUSINESS CASE
Over 35 cycling interventions will bring continual growth in the size and quality of the cycle network in the Southampton City Region, with growth in use through network effects;
The modelling forecasts suggest that for the medium scenario by 2026, 28% of journeys in the City Region will be made via an active mode amounting to nearly 242,000 trips a day;
Journeys would become safer – COBA-LT analysis suggests that all scenarios are expected to reduce vehicular collisions. For example, with the delivery of the medium scenario, collisions are expected to reduce by 529 with a reduction of 42 serious casualties and 730 slight casualties; and
Environmental and social assessments have been completed for all three TCF scenarios at the programme level. This has found a positive or impact neutral impact against all categories. Assessment of all Social Impacts found a beneficial impact for all categories, except Severance and Option Values which scored neutral only in the low scenario.
Overall the Medium Scenario performs most strongly, representing High Value for Money both for Level 1 transport user impacts only – with an initial BCR of 2.22, and also when considering Level 2 impacts – with an adjusted BCR of 2.75. As well as providing high levels of benefits for sustainable modes (£319m), it results in the lowest levels of disbenefits to highway traffic (£137m) of the three scenarios appraised.
178
CONNECTING SOUTHAMPTON CITY REGION TRANSFORMING CITIES FUND STRATEGIC OUTLINE BUSINESS CASE
6. The Financial Case 6.1. Introduction This chapter sets out the approach taken to determine the funding requirements for delivering the Southampton TCF Programme.
This sets out the:
Project costs (6.2), and how these costs were calculated (6.2.1); The budget and funding profile, including local and third party match (6.3); Risk assessment (6.2.3); and The budgetary and accounting implications (6.5).
6.2. Project costs The Southampton TCF Programme project costs have been calculated from cost estimates prepared by quantity surveyors in either SCC or HCC’s Highways Service partnerships or supporting consultants commercial teams. At this current stage many schemes are at the feasibility or concept stage so costs are not based on a full bill of quantities. This approach has used suitable benchmarking from equivalent schemes completed recently in Southampton or Hampshire, including completed TCF Tranche 1 schemes. This has been done to ensure that these are reasonable and not subject to any significant increases due to inflation or other factors. Where a scheme is more advanced a more detailed estimate has been produced using rates for labour and materials along with known costs for equipment, traffic management, site supervision and preliminaries.
6.2.1. Cost Calculation The project costs consist of the following elements which together constitute the total cost for an individual project:
Base Construction costs – this includes preliminaries, materials, labour, equipment, traffic management, site supervision, risk costs that are included within the risk register, producing as-built drawings and an allowance for statutory undertaker service diversions;
Project Fees – these are costs incurred in the development of the project including internal fees to SCC or HCC, design, surveys, legal, procurement, finance or communications. Due to the different contractual and procedural arrangements between SCC and HCC, the fees have been calculated differently but are using the same headings. These are detailed below Southampton – 21.2%
- Project Fees - Strategic Transport for Policy and Delivery client management – 2.5%; - Support Services – SCC support services – legal, procurement, planning, contract
management – 1.2%; - Design & Surveys – scheme design, consultation support, traffic surveys, TROs,
utility diversions, costings, Road Safety Audit, topographical surveys – 15%; and - Other Services My Journey promotion and communications support – 2.5%.
Hampshire – 23.5% - Project Fees - Strategic Transport for Policy and Delivery client management – 2.5%; - Support Services – HCC support services – legal, procurement, planning, contract
management, ITS – 1.2%; - Design & Surveys – scheme design, consultation support, traffic surveys, TROs,
utility diversions, costings, Road Safety Audit, topographical surveys, ecology surveys – 15%; and
- Other Services – My Journey promotion and communications support – 2.5%. Where a scheme is in excess of £5m the following applies to cover additional scope and
complexity - Client Fees - Strategic Transport for Policy and Delivery client management – 5.5%; - Support Services – SCC or HCC support services – legal, procurement, planning,
contract management – 2.7%; - Design & Surveys – scheme design, consultation support, traffic surveys, TROs,
utility diversions, costings, Road Safety Audit, topographical surveys, ecology
179
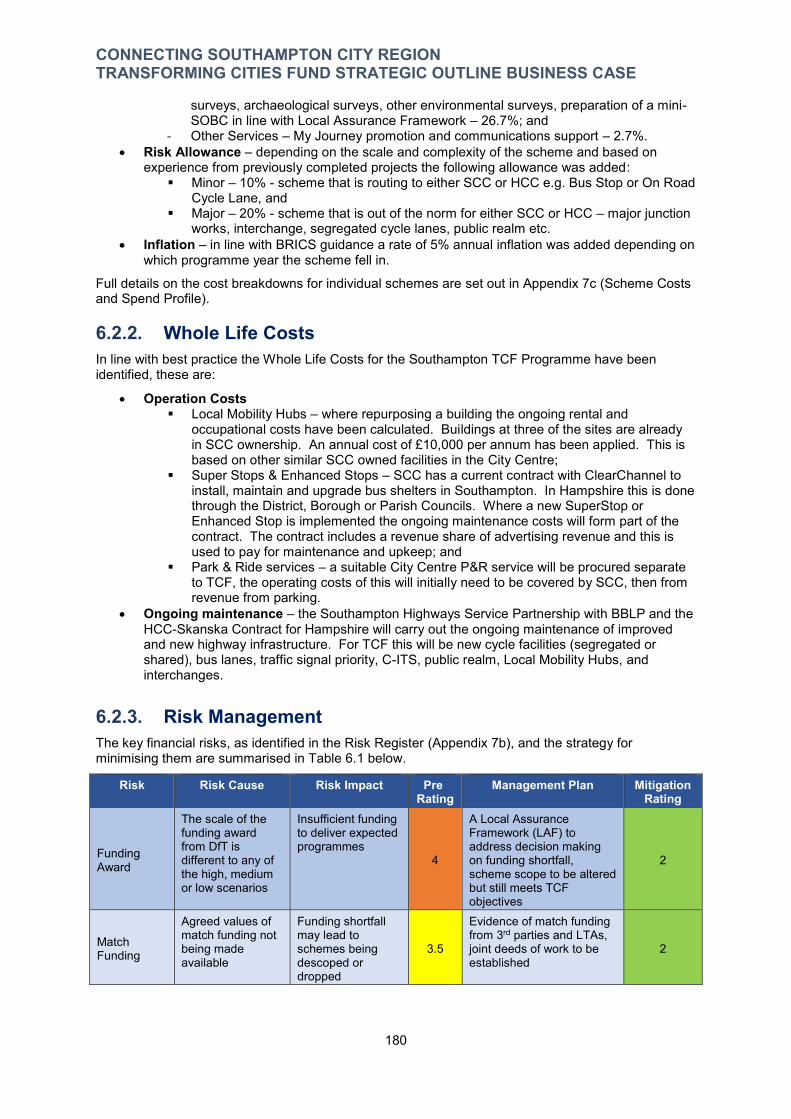
-
CONNECTING SOUTHAMPTON CITY REGION TRANSFORMING CITIES FUND STRATEGIC OUTLINE BUSINESS CASE
surveys, archaeological surveys, other environmental surveys, preparation of a mini-SOBC in line with Local Assurance Framework – 26.7%; and
- Other Services – My Journey promotion and communications support – 2.7%. Risk Allowance – depending on the scale and complexity of the scheme and based on
experience from previously completed projects the following allowance was added: Minor – 10% - scheme that is routing to either SCC or HCC e.g. Bus Stop or On Road
Cycle Lane, and Major – 20% - scheme that is out of the norm for either SCC or HCC – major junction
works, interchange, segregated cycle lanes, public realm etc. Inflation – in line with BRICS guidance a rate of 5% annual inflation was added depending on
which programme year the scheme fell in.
Full details on the cost breakdowns for individual schemes are set out in Appendix 7c (Scheme Costs and Spend Profile).
6.2.2. Whole Life Costs In line with best practice the Whole Life Costs for the Southampton TCF Programme have been identified, these are:
Operation Costs Local Mobility Hubs – where repurposing a building the ongoing rental and
occupational costs have been calculated. Buildings at three of the sites are already in SCC ownership. An annual cost of £10,000 per annum has been applied. This is based on other similar SCC owned facilities in the City Centre;
Super Stops & Enhanced Stops – SCC has a current contract with ClearChannel to install, maintain and upgrade bus shelters in Southampton. In Hampshire this is done through the District, Borough or Parish Councils. Where a new SuperStop or Enhanced Stop is implemented the ongoing maintenance costs will form part of the contract. The contract includes a revenue share of advertising revenue and this is used to pay for maintenance and upkeep; and
Park & Ride services – a suitable City Centre P&R service will be procured separate to TCF, the operating costs of this will initially need to be covered by SCC, then from revenue from parking.
Ongoing maintenance – the Southampton Highways Service Partnership with BBLP and the HCC-Skanska Contract for Hampshire will carry out the ongoing maintenance of improved and new highway infrastructure. For TCF this will be new cycle facilities (segregated or shared), bus lanes, traffic signal priority, C-ITS, public realm, Local Mobility Hubs, and interchanges.
6.2.3. Risk Management The key financial risks, as identified in the Risk Register (Appendix 7b), and the strategy for minimising them are summarised in Table 6.1 below.
Risk Risk Cause Risk Impact Pre Rating
Management Plan Mitigation Rating
Funding Award
The scale of the funding award from DfT is different to any of the high, medium or low scenarios
Insufficient funding to deliver expected programmes
4
A Local Assurance
2
Framework (LAF) to address decision making on funding shortfall, scheme scope to be altered but still meets TCF objectives
Match Funding
Agreed values of match funding not being made available
Funding shortfall may lead to schemes being descoped or dropped
3.5
Evidence of match funding from 3rd parties and LTAs, joint deeds of work to be established
2
180
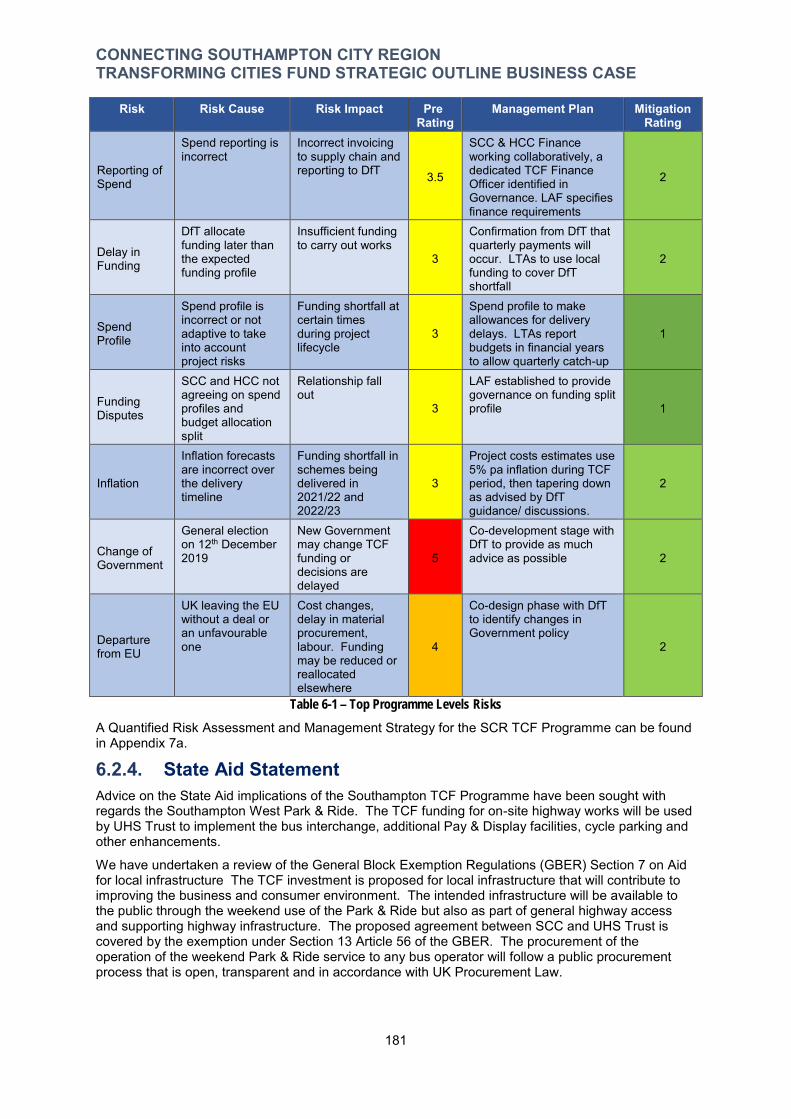
-
CONNECTING SOUTHAMPTON CITY REGION TRANSFORMING CITIES FUND STRATEGIC OUTLINE BUSINESS CASE
Risk Risk Cause Risk Impact Pre Rating
Management Plan Mitigation Rating
Reporting of Spend
Spend reporting is incorrect
Incorrect invoicing to supply chain and reporting to DfT 3.5
SCC & HCC Finance working collaboratively, a dedicated TCF Finance Officer identified in Governance. LAF specifies finance requirements
2
Delay in Funding
DfT allocate funding later than the expected funding profile
Insufficient funding to carry out works
3
Confirmation from DfT that quarterly payments will occur. LTAs to use local funding to cover DfT shortfall
2
Spend Profile
Spend profile is incorrect or not adaptive to take into account project risks
Funding shortfall at certain times during project lifecycle
3
Spend profile to make allowances for delivery delays. LTAs report budgets in financial years to allow quarterly catch-up
1
Funding Disputes
SCC and HCC not agreeing on spend profiles and budget allocation split
Relationship fall out
3
LAF established to provide governance on funding split profile 1
Inflation
Inflation forecasts are incorrect over the delivery timeline
Funding shortfall in schemes being delivered in 2021/22 and 2022/23
3
Project costs estimates use 5% pa inflation during TCF period, then tapering down as advised by DfT guidance/ discussions.
2
Change of Government
General election on 12th December 2019
New Government may change TCF funding or decisions are delayed
5
Co-development stage with DfT to provide as much advice as possible 2
Departure from EU
UK leaving the EU without a deal or an unfavourable one
Cost changes, delay in material procurement, labour. Funding may be reduced or reallocated elsewhere
4
Co-design phase with DfT to identify changes in Government policy
2
Table 6-1 – Top Programme Levels Risks
A Quantified Risk Assessment and Management Strategy for the SCR TCF Programme can be found in Appendix 7a.
6.2.4. State Aid Statement Advice on the State Aid implications of the Southampton TCF Programme have been sought with regards the Southampton West Park & Ride. The TCF funding for on-site highway works will be used by UHS Trust to implement the bus interchange, additional Pay & Display facilities, cycle parking and other enhancements.
We have undertaken a review of the General Block Exemption Regulations (GBER) Section 7 on Aid for local infrastructure The TCF investment is proposed for local infrastructure that will contribute to improving the business and consumer environment. The intended infrastructure will be available to the public through the weekend use of the Park & Ride but also as part of general highway access and supporting highway infrastructure. The proposed agreement between SCC and UHS Trust is covered by the exemption under Section 13 Article 56 of the GBER. The procurement of the operation of the weekend Park & Ride service to any bus operator will follow a public procurement process that is open, transparent and in accordance with UK Procurement Law.
181
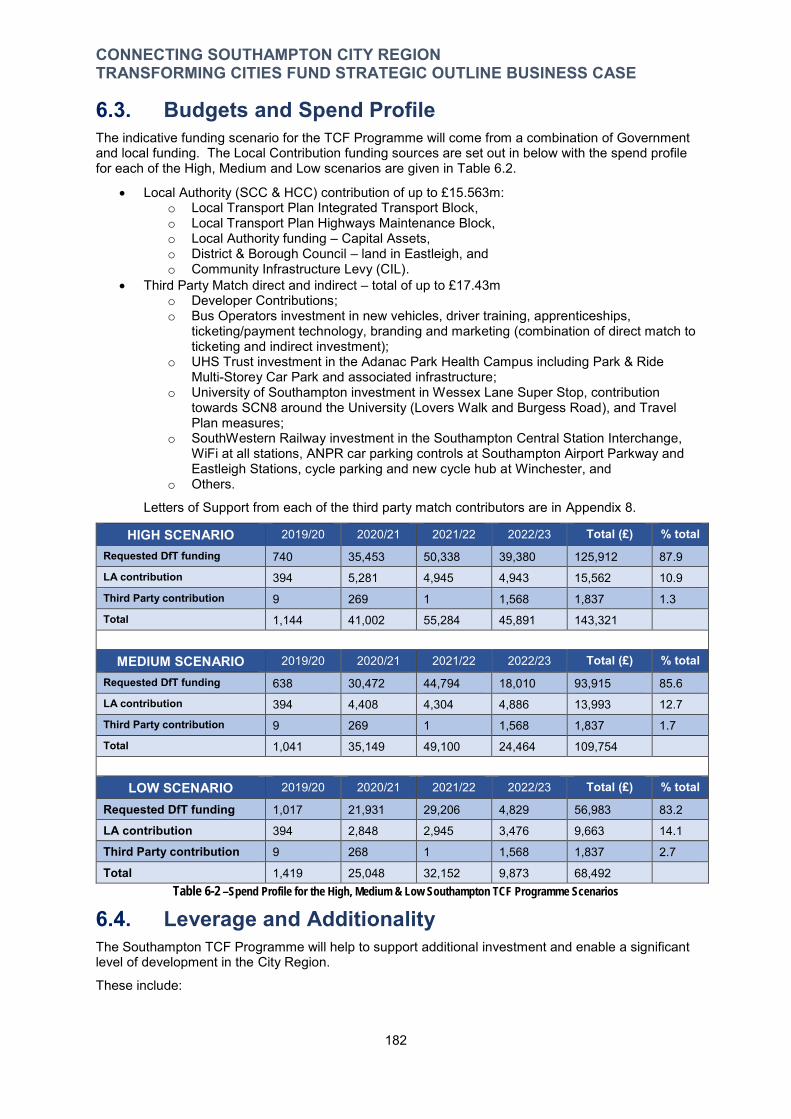
CONNECTING SOUTHAMPTON CITY REGION TRANSFORMING CITIES FUND STRATEGIC OUTLINE BUSINESS CASE
6.3. Budgets and Spend Profile The indicative funding scenario for the TCF Programme will come from a combination of Government and local funding. The Local Contribution funding sources are set out in below with the spend profile for each of the High, Medium and Low scenarios are given in Table 6.2.
Local Authority (SCC & HCC) contribution of up to £15.563m: o Local Transport Plan Integrated Transport Block, o Local Transport Plan Highways Maintenance Block, o Local Authority funding – Capital Assets, o District & Borough Council – land in Eastleigh, and o Community Infrastructure Levy (CIL).
Third Party Match direct and indirect – total of up to £17.43m o Developer Contributions; o Bus Operators investment in new vehicles, driver training, apprenticeships,
ticketing/payment technology, branding and marketing (combination of direct match to ticketing and indirect investment);
o UHS Trust investment in the Adanac Park Health Campus including Park & Ride Multi-Storey Car Park and associated infrastructure;
o University of Southampton investment in Wessex Lane Super Stop, contribution towards SCN8 around the University (Lovers Walk and Burgess Road), and Travel Plan measures;
o SouthWestern Railway investment in the Southampton Central Station Interchange, WiFi at all stations, ANPR car parking controls at Southampton Airport Parkway and Eastleigh Stations, cycle parking and new cycle hub at Winchester, and
o Others.
Letters of Support from each of the third party match contributors are in Appendix 8.
HIGH SCENARIO 2019/20 2020/21 2021/22 2022/23 Total (£) % total Requested DfT funding 740 35,453 50,338 39,380 125,912 87.9 LA contribution 394 5,281 4,945 4,943 15,562 10.9 Third Party contribution 9 269 1 1,568 1,837 1.3 Total 1,144 41,002 55,284 45,891 143,321
MEDIUM SCENARIO 2019/20 2020/21 2021/22 2022/23 Total (£) % total
Requested DfT funding 638 30,472 44,794 18,010 93,915 85.6 LA contribution 394 4,408 4,304 4,886 13,993 12.7 Third Party contribution 9 269 1 1,568 1,837 1.7 Total 1,041 35,149 49,100 24,464 109,754
LOW SCENARIO 2019/20 2020/21 2021/22 2022/23 Total (£) % total
Requested DfT funding 1,017 21,931 29,206 4,829 56,983 83.2
LA contribution 394 2,848 2,945 3,476 9,663 14.1
Third Party contribution 9 268 1 1,568 1,837 2.7
Total 1,419 25,048 32,152 9,873 68,492 Table 6-2 –Spend Profile for the High, Medium & Low Southampton TCF Programme Scenarios
6.4. Leverage and Additionality The Southampton TCF Programme will help to support additional investment and enable a significant level of development in the City Region.
These include:
182
CONNECTING SOUTHAMPTON CITY REGION TRANSFORMING CITIES FUND STRATEGIC OUTLINE BUSINESS CASE
A plan to invest £200m by ABP at the Port of Southampton in new quayside facilities to improve the efficiency and productivity of the Port. This includes new container berths, dredging, automotive handling facilities, and new cruise terminals. Without TCF the benefits of this investments in keeping the Port competitive may not be realised – the Port relies on the A33 for access and modal shift will enable crucial Port related business to access it.
Ongoing investment in Southampton City Centre delivering up to £2bn worth of development to 2026, this includes Nelson Gate and Mayflower Quarter developments at Southampton Central Station. These will continue the public realm and active travel links commenced through the Southampton Central Interchange scheme.
£80m investment by UHS Trust and partners in the Adanac Park Health Campus that will develop a high value cluster of health research and development related businesses alongside some relocated operations for UHS’ main campus. This is the location for the Southampton West Park & Ride – workers at the site will benefit from improved accessibility and connectivity by public transport and active travel. The P&R, onwards bus route, and cycle links will be crucial to ensuring that the Health Campus is acceptable and to mitigate the
£200m investment by University of Southampton and Solent University in their campus’ teaching, research and student environments;
Investment by Network Rail at Millbrook Station to replace and upgrade the existing platform footbridge. This links into the foot-cycle bridge across A33 Millbrook Road West (owned by SCC), which will be replaced and widened to provide a cycle and foot link from Freemantle residential area to Millbrook Station and SCN1;
Development at Fawley Power Station in the Waterside, residential development in and around Eastleigh, and in Hamble Peninsula.
6.5. Accounting Implications Southampton City Council will be the accountable body for the Southampton TCF Programme. With the Executive Director of Finance and Commercialisation, John Harrison, as the Section 151 Officer.
The project will be accounted for by SCC and HCC in line with the CIPFA Code of Practice for Local Authority Accounting. The infrastructure assets created will be held on the relevant authority’s balance sheet and adhere that authority’s standard accounting policies.
SCC will act as the distributor of funding based on the funding profile developed in the TCF Delivery Programme (Appendix 9) to Hampshire County Council. Through the TCF Governance and Local Assurance Framework, funds will be transferred to HCC based on that years programme at quarterly intervals. This is in line with the expected payments from the Department.
The standard financial procedure rules for approving the receipt of grant funding and incurring the associated expenditure will be followed by each authority.
Where any funding is being passed to third parties a Service Level Agreement will be entered into that sets out the roles and responsibilities of each party, the funding, delivery programme with milestones, and the project evaluation process.
Spend will be monitored annually and reported to the TCF Steering Board quarterly, with monthly reporting to the Delivery Board. Annual spend will be reported to Full Council and relevant Cabinet or Executive Members in each Authority.
183

CONNECTING SOUTHAMPTON CITY REGION TRANSFORMING CITIES FUND STRATEGIC OUTLINE BUSINESS CASE
7. The Commercial Case
7.1. Introduction The Chapter will explain that Southampton City Council (SCC) and Hampshire County Council (HCC) have several potential procurement routes available for the delivery of the Southampton City Region TCF Programme.
It provides information on:
The TCF Programme’s outputs based specification including a Logic Map showing the outcome and outputs related to inputs (7.2);
Procurement strategy for delivery of the TCF Programme (7.3); What consents, permissions, land and powers are required (7.4); and
How risk has been identified and manged (7.7).
7.2. Output Based Specification The Southampton City Region TCF Programme is focused on transforming how people get around so they have better access to jobs, education and quality of life. We aim to do this by reducing congestion and improving air quality through investment in public transport, active travel, interchanges and spaces that are for people.
The outcomes for the TCF Programme are given in the Logic Map, and in summary are:
Is better connected with more reliable journey times and it is easier access to employment; Significantly reduces the productivity gap and starts to rebalance our economy; Is easy to get around making people’s commute more efficient with a Mass Transit System
linking suburbs and main employment hubs, and easier interchange so public transport is a mode of first choice;
Is more healthy and active where journeys to work, education and leisure are enabled through a high quality cycle network;
Is fairer and socially equitable and improves people’s quality of life and health by increasing physical activity and reducing emissions, and providing quality liveable places;
Is at the forefront of innovation embracing new technology and mobility options; and Supports clean and sustainable growth that benefits all residents, businesses and visitors,
including a City Centre that puts the needs of people ahead of movement of vehicles and car parking.
Logic Map
The Logic Map identifies how inputs into the TCF Programme will deliver a range of outputs is shown in Figure 7-1. It also demonstrates the linkage between the infrastructure investment, the challenges we identified, and the anticipated medium term outcomes and the long term impacts of the TCF Programme.
184
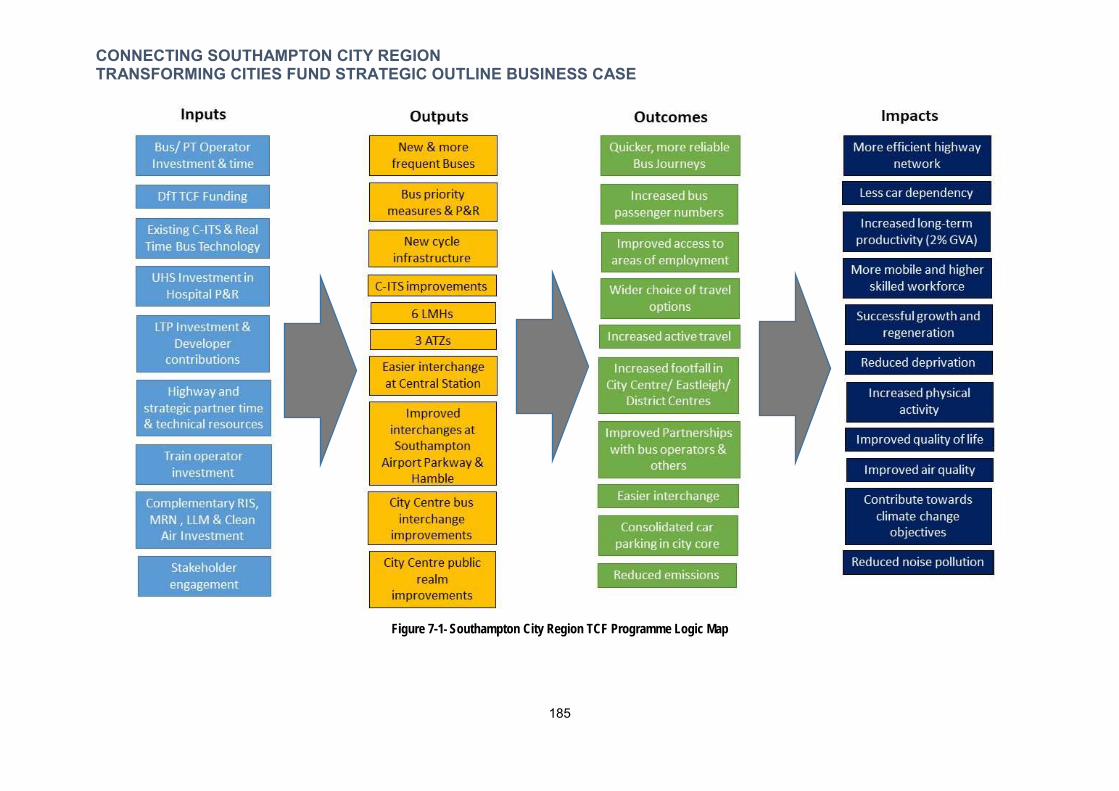
CONNECTING SOUTHAMPTON CITY REGION TRANSFORMING CITIES FUND STRATEGIC OUTLINE BUSINESS CASE
Figure 7-1- Southampton City Region TCF Programme Logic Map
185
CONNECTING SOUTHAMPTON CITY REGION TRANSFORMING CITIES FUND STRATEGIC OUTLINE BUSINESS CASE
7.3. Procurement Strategy Both Southampton City Council and Hampshire County Council have long term strategic highways partnerships, which means that procurement and contracting arrangements are already in place. There is also the ability for the authorities to work together through a Joint Working Agreement (signed in November 2019) and share resources.
In 2010, Southampton City Council entered into a ten-year, multi-million pound Strategic Highways Partnership (HSP) with Balfour Beatty Living Places (BBLP). This was secured through an OJEU process. The contract provides for all the design and construction services needed for the Southampton TCF Programme schemes in Southampton. Relevant features of the contract include the use of Target Cost, shared risk management, and minimisation of environmental impacts. In 2018 the contract was extended and is now effective up until 2025.
SCC can procure additional support via national frameworks, such as SCAPE. To add further resilence to programme delivery, quick turnaround is achievable through frameworks such as SCAPE as a route to progressing the scheme, subject to demonstration of best value.
In 2017, HCC entered into a seven year partnership to 2024 with Skanska to deliver highway maintenance and improvements works. This is also extendable beyond 2024. HCC also has a long term partnership with Atkins to carry out scheme design and development.
HCC is entering the Generation 4 (also known as ‘Gen4’) frameworks, which will commence from 2020, running until 2024. It is split between three frameworks with value ranges of up to £250k (for Gen4-1), between £50k and £10m (Gen4-2) and £8m to £150m (Gen4-3). The frameworks are managed by Hampshire County Council and will be used by several Local Authorities and public bodies within the South of England to deliver predominantly Civil Engineering and Highways related projects. The Gen4 framework is looking to build on the success of the Gen3 frameworks, which delivered over 300 projects with a total value up to £200m.
The framework will provide HCC and the other participating authorities with access to a range of highly skilled and experienced suppliers who can deliver a substantial number of projects effectively and efficiently. The framework will also incorporate critical success factor performance indicators, managed by the Gen4 framework management team, which ensure supplier performance will be maintained throughout the framework; providing a consistent, efficient and high quality level of delivery on projects throughout the Hampshire capital programme.
Where schemes are being delivered by a third party, such as UHS Trust or University of Southampton arrangements such as Service Level Agreements will be entered into. UHS Trust are carrying out an OJEU compliant procurement exercise for the delivery of the Health Campus including the multi-story car park for the Southampton West Park & Ride.
Construction Consolidation TCF offers the opportunity to implement sustainable construction techniques including consolidation of construction materials and waste. Southampton already has a Sustainable Distribution Centre close to M271 Junction 1 at Nursling. Operated through an existing contract with Meachers Global Logistics this is a point where deliveries to organisations who have signed up are consolidated from larger vehicles to smaller ones to make multiple drops in Southampton. This site, and other locations around the City Region, would be used as Sustainable Construction Consolidation points for materials and waste. This would minimise the number of deliveries to individual construction sites by different logistics providers into one or two movements a day. Doing this will meet the obligations within the Southampton Green City Charter and the Hampshire Climate Emergency.
A high level programme for the next stages of TBC scenario development is summarised in Table 8.1 within the Management Case.
A more detailed Delivery Programme setting out timeframes for delivery of proposed TCF schemes along each corridor is included in Appendix 9.
186
CONNECTING SOUTHAMPTON CITY REGION TRANSFORMING CITIES FUND STRATEGIC OUTLINE BUSINESS CASE
7.4. Consents, land and powers required This explains the necessary consents and powers that will be required to deliver the Southampton TCF Programme. It identifies any land that is outside of the control of either of SCC or HCC and the process required to acquire use of it.
7.4.1. Consents Required The majority of the Southampton TCF Schemes are within the existing highway boundary or land owned by SCC, HCC or the Districts and Boroughs. Schemes can be delivered under existing powers that SCC and HCC have as Local Highway Authorities and Local Transport Authorities, or through allowances in the General Permitted Development Order (GPDO) for a local authority.
Advice had been sought on the requirements for any planning permission, the following will require applications through the planning process:
Southampton West Park & Ride – as part of UHS Trust’s Health Campus planning permission will be required for the new Multi-Storey Car Park and access road from Frogmore Lane. An outline application is currently under consideration for the Health Campus, MSCP and associated infrastructure by SCC and Test Valley Borough Council. A decision on this is expected in December 2019;
Local Mobility Hubs – if the new building, or re-purposed, building is larger than 200m³ then permission will be required to construct or for change of use. This would be confirmed when a detailed design is prepared;
Civic Centre Forecourt as part of Civic Centre Place – should any part of the scheme materially impact on the Grade I listed Civic Centre building (including low level walls around the current car park) then Listed Building Consent would be required. The scheme is being designed in consultation with Historic England to remove the need to change any of the walls.
Albion Place Bus Interchange – this is located adjacent to the scheduled ancient monuments of Old Town Walls and Southampton Castle Walls within the Old Town Conservation Area. Bus infrastructure (stops, shelters) and public realm is considered permitted development, the proximity to the Town and Castle Walls means Schedule Ancient Monument Consent is required. Liaison with Historic England has commenced with a screening opinion awaited;
Bishopstoke Road widening (part of Eastleigh-Fair Oak Rapid Bus) – this impinges on green open space and flood plain. An Environmental Impact Assessment Screening has been sought from Eastleigh Borough Council;
Southampton Common (and other green spaces) – any changes to SCN8 across Southampton Common from Bellmoor Road to Lovers Walk, such as widening, would require an application under Section 38 of the Commons Act; and
Other permissions – Tree Preservation Orders.
Early engagement has been made with the relevant bodies and sufficient time to apply for these consents has been allowed in the scheme design and delivery programme. If a consent is not agreed the scheme will be altered accordingly.
Where schemes require work on, or near, railway land including Southampton Central Station Interchange, Hamble Station Park & Rail, Millbrook Station Footbridge (connects with a Network Rail bridge that is being upgraded), and Swaythling Station Travel Hub consents will be required from SWR and Network Rail. Early engagement has commenced with both parties.
7.4.2. Land Required The majority of schemes in the Southampton TCF Programme are predominantly within land that is in the control or ownership of SCC and HCC. This land is managed by either Highway Authority or another Council department such as Housing, Leisure or Education.
There are a few instances in which land is needed which is owned by, or in the control of, outside parties. These are in the ownership of either key partners or stakeholders in the Southampton TCF Programme who are engaged with the programme and have provided letters of support. Schemes affected are:
SCN1 Totton By-Pass – a 3m wide piece of land is required from ABP
187
CONNECTING SOUTHAMPTON CITY REGION TRANSFORMING CITIES FUND STRATEGIC OUTLINE BUSINESS CASE
Bishopstoke Road Bus Lane – land is required from Eastleigh Borough Council (as part of Bishopstoke Road Playing Fields) and others to facilitate widening of the road to install a bus lane;
Southampton West P&R – UHS Trust and partners are acquiring land for the Health Campus and Park & Ride site;
Southampton Central Station Interchange – land on the southern side of the station is within the franchise leasehold of SWR
Other Rail Station Access Schemes – Southampton Parkway Park & Rail and Travel Hub will involve working on land within the franchise leasehold of SWR at this station
Any other land identified that is the ownership of other parties will be acquired through negotiation with discussions already underway. Schemes affected are:
SCN5 Hut Hill Cycle Route approaching roundabout junction with Bournemouth Road/Chestnut Avenue in Chandler’s Ford. A small piece of land is required from Hampshire Corporate Park to deliver widening for the cycle route to pass around a bus stop.
7.4.3. Powers Required No additional powers will be required to deliver the Southampton TCF Programme. The vast majority of infrastructure works are schemes that can be delivered through the existing powers that SCC and HCC have as Local Highway Authorities.
7.5. Sourcing Options SCC and HCC have access to several procurement options which are compliant with European legislation and will be utilised to enable delivery of the TCF Southampton Programme.
The principal delivery option available to SCC is to use the Strategic Highways Partnership contract already in place with BBLP. This commenced in 2010 and remains effective until 2025 and therefore encompasses the TCF delivery period. This would be used in for Corridors 1-5 and the City Centre inclusive and any other schemes that are appropriate. This has been used previously to successfully deliver these types of scheme.
The principle delivery option available to HCC is through the contract with Skanska that commenced in 2017 and runs to 2024, covering the TCF period. This would be used for the sections of Corridors 1-5 that are in Hampshire.
Should it be the case that either SCC or HCC need to procure any of the scenarios through alternative routes they can utilise either of the following:
1. The National Procurement Framework – SCAPE. This is a viable and compliant option which provides an already established and transparent government approved procurement platform. The fact that the platform is already established will save time and avoid the additional costs associated with procuring via more traditional routes.
2. A further existing option available to SCC is to make use of the Hampshire County Council Generation 4 procurement platform. This gives SCC access to a framework of approved contractors and can be used to benchmark prices or for delivery of projects as required.
All these routes are already established and will save time and avoid the additional costs associated with procuring via other channels.
7.6. Payment Mechanisms Appropriate payment mechanisms and incentives can be built into the contract as summarised in Table 7-1. Performance targets on which incentives are based must be measurable. SCC and HCC will need to weigh up the benefits of proposed improvements, exercising appropriate judgement before agreeing to them.
188
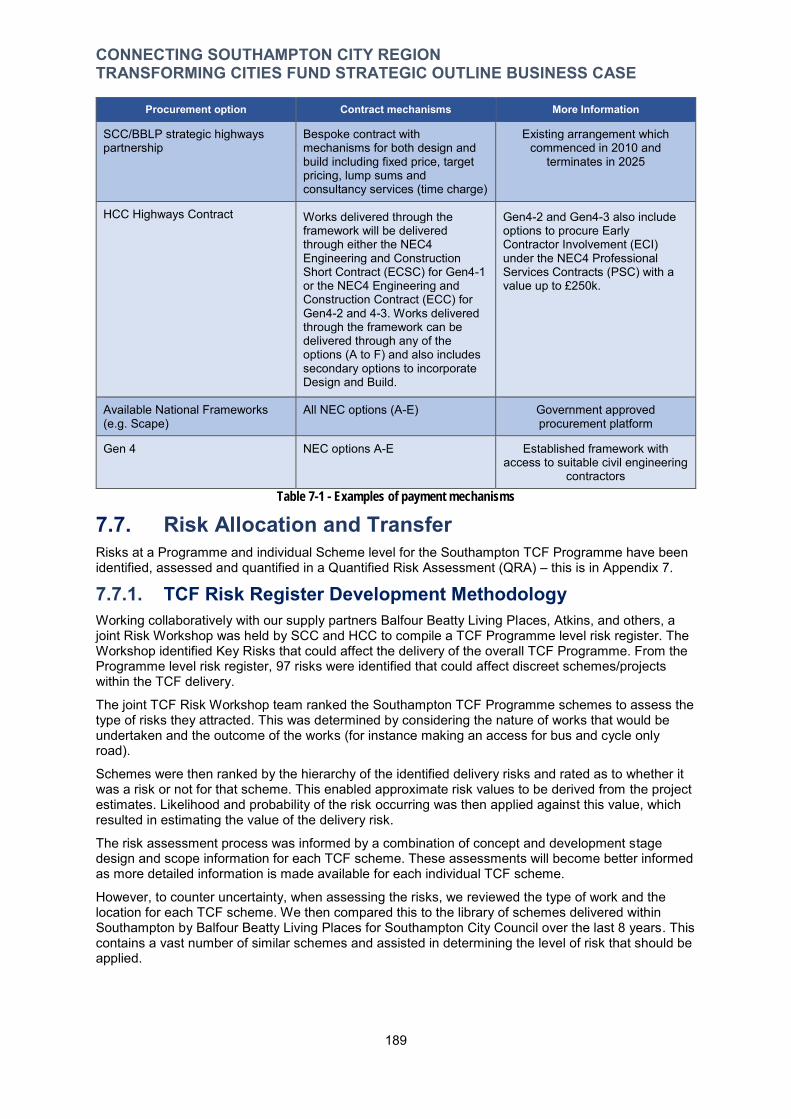
CONNECTING SOUTHAMPTON CITY REGION TRANSFORMING CITIES FUND STRATEGIC OUTLINE BUSINESS CASE
Procurement option Contract mechanisms More Information
SCC/BBLP strategic highways partnership
Bespoke contract with mechanisms for both design and build including fixed price, target pricing, lump sums and consultancy services (time charge)
Existing arrangement which commenced in 2010 and
terminates in 2025
HCC Highways Contract Works delivered through the framework will be delivered through either the NEC4 Engineering and Construction Short Contract (ECSC) for Gen4-1 or the NEC4 Engineering and Construction Contract (ECC) for Gen4-2 and 4-3. Works delivered through the framework can be delivered through any of the options (A to F) and also includes secondary options to incorporate Design and Build.
Gen4-2 and Gen4-3 also include options to procure Early Contractor Involvement (ECI) under the NEC4 Professional Services Contracts (PSC) with a value up to £250k.
Available National Frameworks (e.g. Scape)
All NEC options (A-E) Government approved procurement platform
Gen 4 NEC options A-E Established framework with access to suitable civil engineering
contractors
Table 7-1 - Examples of payment mechanisms
7.7. Risk Allocation and Transfer Risks at a Programme and individual Scheme level for the Southampton TCF Programme have been identified, assessed and quantified in a Quantified Risk Assessment (QRA) – this is in Appendix 7.
7.7.1. TCF Risk Register Development Methodology Working collaboratively with our supply partners Balfour Beatty Living Places, Atkins, and others, a joint Risk Workshop was held by SCC and HCC to compile a TCF Programme level risk register. The Workshop identified Key Risks that could affect the delivery of the overall TCF Programme. From the Programme level risk register, 97 risks were identified that could affect discreet schemes/projects within the TCF delivery.
The joint TCF Risk Workshop team ranked the Southampton TCF Programme schemes to assess the type of risks they attracted. This was determined by considering the nature of works that would be undertaken and the outcome of the works (for instance making an access for bus and cycle only road).
Schemes were then ranked by the hierarchy of the identified delivery risks and rated as to whether it was a risk or not for that scheme. This enabled approximate risk values to be derived from the project estimates. Likelihood and probability of the risk occurring was then applied against this value, which resulted in estimating the value of the delivery risk.
The risk assessment process was informed by a combination of concept and development stage design and scope information for each TCF scheme. These assessments will become better informed as more detailed information is made available for each individual TCF scheme.
However, to counter uncertainty, when assessing the risks, we reviewed the type of work and the location for each TCF scheme. We then compared this to the library of schemes delivered within Southampton by Balfour Beatty Living Places for Southampton City Council over the last 8 years. This contains a vast number of similar schemes and assisted in determining the level of risk that should be applied.
189
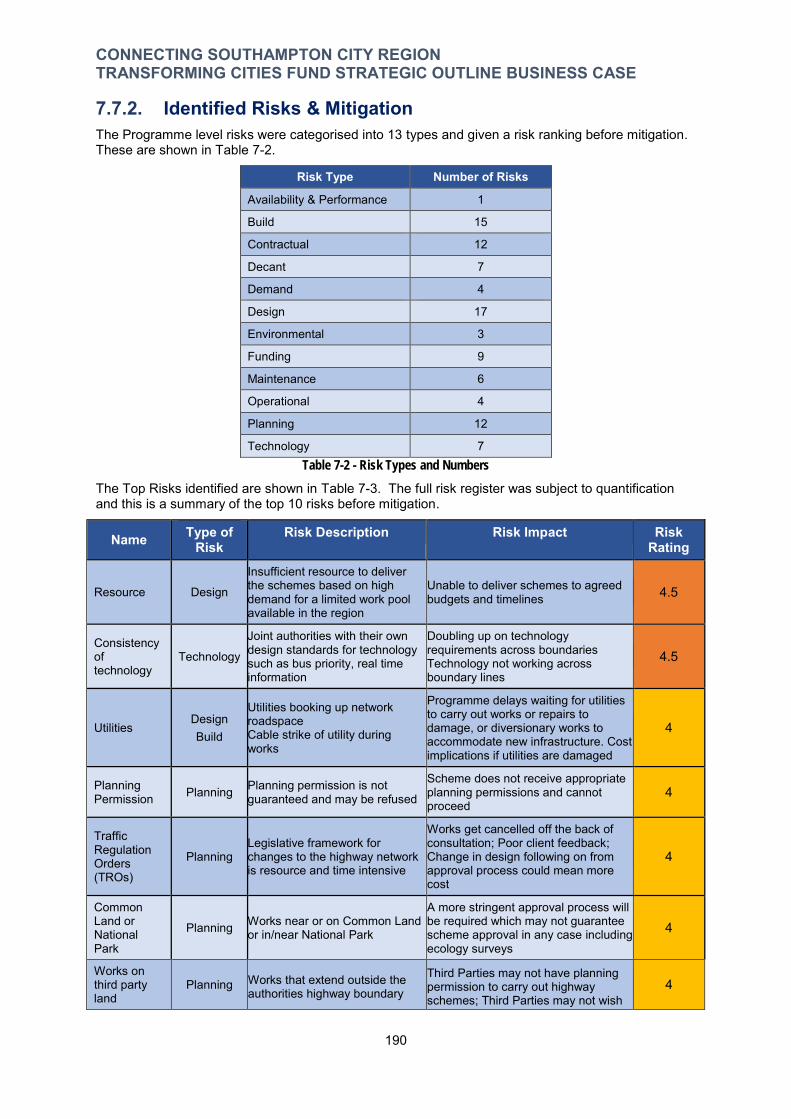
CONNECTING SOUTHAMPTON CITY REGION TRANSFORMING CITIES FUND STRATEGIC OUTLINE BUSINESS CASE
7.7.2. Identified Risks & Mitigation The Programme level risks were categorised into 13 types and given a risk ranking before mitigation. These are shown in Table 7-2.
Risk Type Number of Risks
Availability & Performance 1
Build 15
Contractual 12
Decant 7
Demand 4
Design 17
Environmental 3
Funding 9
Maintenance 6
Operational 4
Planning 12
Technology 7 Table 7-2 - Risk Types and Numbers
The Top Risks identified are shown in Table 7-3. The full risk register was subject to quantification and this is a summary of the top 10 risks before mitigation.
Name Type of Risk
Risk Description Risk Impact Risk Rating
Resource Design
Insufficient resource to deliver the schemes based on high demand for a limited work pool available in the region
Unable to deliver schemes to agreed budgets and timelines 4.5
Consistency of technology
Technology
Joint authorities with their own design standards for technology such as bus priority, real time information
Doubling up on technology requirements across boundaries Technology not working across boundary lines
4.5
Utilities Design Build
Utilities booking up network roadspace Cable strike of utility during works
Programme delays waiting for utilities
4 to carry out works or repairs to damage, or diversionary works to accommodate new infrastructure. Cost implications if utilities are damaged
Planning Permission Planning Planning permission is not
guaranteed and may be refused
Scheme does not receive appropriate planning permissions and cannot proceed
4
Traffic Regulation Orders (TROs)
Planning Legislative framework for changes to the highway network is resource and time intensive
Works get cancelled off the back of
4 consultation; Poor client feedback; Change in design following on from approval process could mean more cost
Common Land or National Park
Planning Works near or on Common Land or in/near National Park
A more stringent approval process will
4be required which may not guarantee scheme approval in any case including ecology surveys
Works on third party land
Planning Works that extend outside the authorities highway boundary
Third Parties may not have planning permission to carry out highway schemes; Third Parties may not wish
4
190

CONNECTING SOUTHAMPTON CITY REGION TRANSFORMING CITIES FUND STRATEGIC OUTLINE BUSINESS CASE
Name Type of Risk
Risk Description Risk Impact Risk Rating
and onto third party land (e.g. South West Rail)
to have schemes constructed on their land
Land use change Planning
Works may be occurring on land that requires a change of use planning permission
The scheme does not achieve planning permission and as such cannot proceed
4
Schemes do not receive road Reputational; Schemes are delayed from proposed timelines as they cannot commence without network occupancy
5 occupancy space to carry out
Network works. Constraints Design Schemes will create conflicting
TM on adjoining corridors leading to congestion delays
Table 7-3 – Top 10 Risk to Southampton TCF Programme and rating before mitigation
The 97 programme level risks in the Risk Register were given an initial risk rating based on their likelihood of occurring and the severity of that impact. The total number of risks per rating category before mitigation are summarised in Table 7-4 below.
Initial High Level QRA
Severity of Impact
High Medium Low
Like
lihoo
d High 0 1 0
Medium 4 71 3
Low 1 17 1
Table 7-4 – Initial Risk Assessment
Following a risk mitigation process the impact of the risks were revised to arrive at the ‘top ten’ key risks shown in Table 7-5.
Name Type of Risk
Risk Description Risk Impact Risk Rating
Land use change Planning
Works may be occurring on land that requires a change of use planning permission
The scheme does not achieve planning permission and as such cannot proceed 3
Resource Design
Insufficient resource to deliver the schemes based on high demand for a limited work pool available in the region
Unable to deliver schemes to agreed budgets and timelines 2.5
TRO Planning
Legislative framework for changes to the highway network is resource and time intensive
Works get cancelled following
2.5 consultation; Poor client feedback; Change in design following on from approval process could mean additional cost
Network Constraints Build
Schemes do not receive road
Reputational; Schemes are delayed from proposed timelines as they cannot commence without network occupancy
2.5 occupancy space to carry out works. Schemes will create conflicting TM on adjoining corridors leading to congestion delays
Displace-ment of Public Transport
Accessibility
Public transport hubs moving during construction and change to bus routes to avoid traffic management
Delays to bus operations reduced patronage on public transport modes
2.5
191
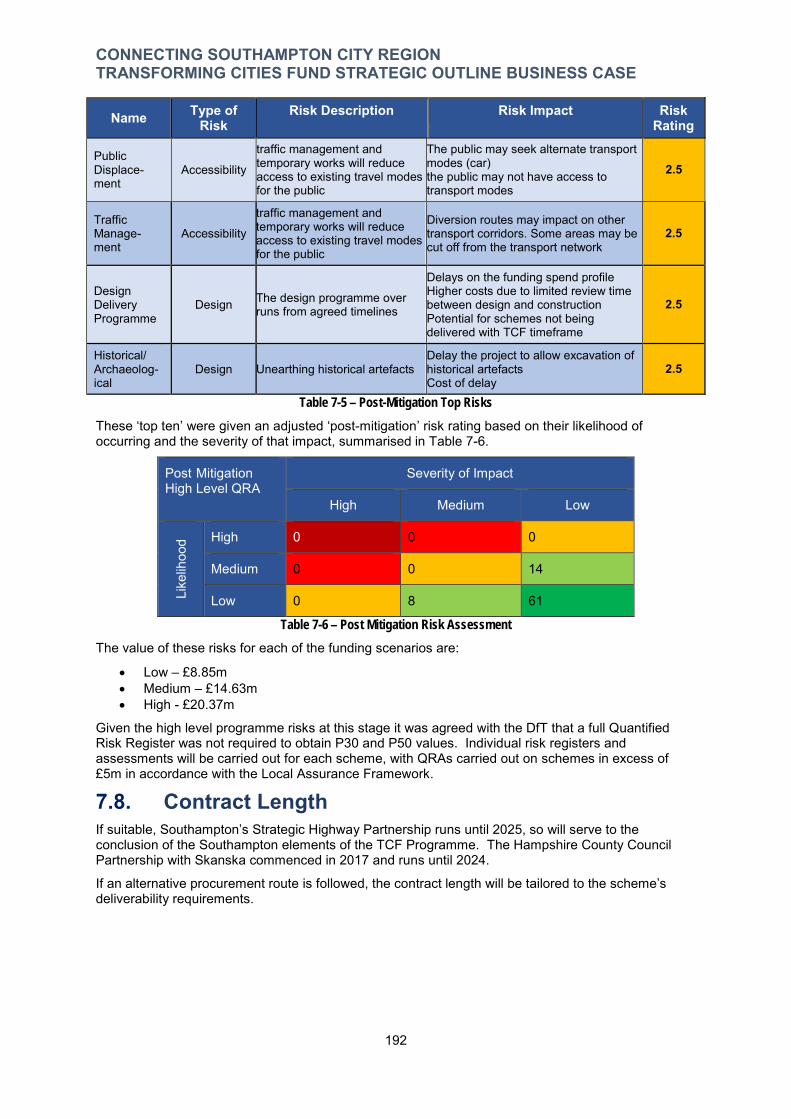
-
CONNECTING SOUTHAMPTON CITY REGION TRANSFORMING CITIES FUND STRATEGIC OUTLINE BUSINESS CASE
Name Type of Risk
Risk Description Risk Impact Risk Rating
Public Displace-ment
Accessibility
traffic management and temporary works will reduce access to existing travel modes for the public
The public may seek alternate transport modes (car) the public may not have access to transport modes
2.5
Traffic Manage-ment
Accessibility
traffic management and temporary works will reduce access to existing travel modes for the public
Diversion routes may impact on other transport corridors. Some areas may be cut off from the transport network
2.5
Design Delivery Programme
Design The design programme over runs from agreed timelines
Delays on the funding spend profile
2.5 Higher costs due to limited review time between design and construction Potential for schemes not being delivered with TCF timeframe
Historical/ Archaeolog-ical
Design Unearthing historical artefacts Delay the project to allow excavation of historical artefacts Cost of delay
2.5
Table 7-5 – Post-Mitigation Top Risks
These ‘top ten’ were given an adjusted ‘post-mitigation’ risk rating based on their likelihood of occurring and the severity of that impact, summarised in Table 7-6.
Post Mitigation High Level QRA
Severity of Impact
High Medium Low
Like
lihoo
d High 0 0 0
Medium 0 0 14
Low 0 8 61
Table 7-6 – Post Mitigation Risk Assessment
The value of these risks for each of the funding scenarios are:
Low – £8.85m Medium – £14.63m High - £20.37m
Given the high level programme risks at this stage it was agreed with the DfT that a full Quantified Risk Register was not required to obtain P30 and P50 values. Individual risk registers and assessments will be carried out for each scheme, with QRAs carried out on schemes in excess of £5m in accordance with the Local Assurance Framework.
7.8. Contract Length If suitable, Southampton’s Strategic Highway Partnership runs until 2025, so will serve to the conclusion of the Southampton elements of the TCF Programme. The Hampshire County Council Partnership with Skanska commenced in 2017 and runs until 2024.
If an alternative procurement route is followed, the contract length will be tailored to the scheme’s deliverability requirements.
192

CONNECTING SOUTHAMPTON CITY REGION TRANSFORMING CITIES FUND STRATEGIC OUTLINE BUSINESS CASE
8. The Management Case 8.1. Introduction This section sets out how Southampton City Council (SCC) and Hampshire County Council (HCC) plan to manage the delivery of the Southampton City Region TCF Programme to ensure that interventions are completed to budget, and to the right standard and by the planned timescales.
It covers the following elements:-
The overarching TCF Programme Level Delivery Plan and implementation strategy with a realistic and clear timetable for delivery (8.2);
A robust governance structure including details of the Project Sponsor (8.3); A risk management strategy (8.4); The approach to scheme design and construction (8.5); Evidence of delivery track record on previous and similar projects (8.6); A clear spend approvals process (8.7); A fit for purpose Local Assurance Framework (LAF) – (8.8); The approach to communications and stakeholder management (8.9); TCF Programme dependencies with other transport infrastructure projects (8.10); A clear approach to local monitoring and evaluation of the effectiveness of completed
interventions (8.11).
8.2. Delivery Plan Figure 8-1 below shows the timeframes for delivery of the Southampton TCF Programme, with all of the DfT TCF funded schemes completed by March 2023. This is based on the high funding scenario. The delivery plan for the medium and low scenarios can be found in Appendix 9.
193

CONNECTING SOUTHAMPTON CITY REGION TRANSFORMING CITIES FUND STRATEGIC OUTLINE BUSINESS CASE
Southampton City Region TCF Delivery Programme - High Scenario
Q3 Q4 Q1 Q2 Q3 Q4 Q1 Q2 Q3 Q4 Q1 Q2 Q3 Q4
1 1 SCC West Quay Road
1 1 SCC Millbrook Footbridge
1 1 HCC Redbridge Causeway
1 1 HCC Eling to Fawley Cycle
1 3 SCC Mountbatten Way Bus Lane
1 3 SCC Millbrook Rd/Regents Bus Lane
1 3 SCC Millbrook Rbt Bus lane
1 3 HCC Rushington Roundabout
1 3 HCC Marchwood Bypass - bus priority
1 3 HCC Totton Bus proirity - Junction Rd
1 3 Both Super Stops
1 3 Both Enhanced Stops
1 2 A33-A35 Smart Technology Corridor Both A35-A33 Smart Technology
2 4 SCN8 Orbital Cycle Route SCC SCN8 Orbital Cycle Route
2 5 Shirley Local Mobility Hub SCC Shirley Local Mobility Hub
2 6 A3057 Smart Technology Corridor SCC A3057 Smart Technology
2 7 SCC Lordshill Bus Interchange
2 7 SCC Lordshill Local Mobility Hub
2 8 SCC Adanac Park to Lordshill Cycle
2 8 SCC Rownhams Rd N to Lordshill Cycle
2 8 HCC Rownhams Lane Cycle
2 8HCC North Baddesley to Chilworth Cycle
2 9 SCC Shirley Road
2 9 HCC A3057 Jtns
2 9 Both Super Stops
2 9 Both Enhanced Stops
2 9 SCC Redbridge Hill/Romsey Rd
2 11 Southampton West Park & Ride SCC Southampton West P&R
2 10 Romsey Station Cycle Links & Hub HCC Romsey Station Cycle
3 12 SCC The Avenue Cycle
3 12 HCC Chandlers Ford Cycle
3 12 SCC London Rd Bus Only
3 12 SCC Winchester Road Roundabout
3 13 A33/A35 The Avenue/Burgess Road Junction SCC Avenue/Burgess Rd Jct
3 14 A33 Smart Technology SCC A33 Smart Technology
3 15 HCC Chandler's Ford Bus Priority
3 15 Both Super Stops
3 15 Both Enhanced Stops
3 16 Winchester Station Cycle Links HCC Winchester Cycle Links
4 25 SCC Portwood Road Bus Priority
4 25 SCC High Street Swaythling Bus
4 25 HCC Eastleigh - Fair Oak Bus Priority
4 25 Both Super Stops
4 25 Both Enhanced Stops
4 20 St Denys Road Rapid Bus SCC St Denys Rd Bus Priority
4 22 SCC Wessex Lane Super Stop
4 22 SCC Swaythling Travel Hub
4 23 HCC Airport Parkway Travel Hub
4 23 HCC Airport Parkway Park & Rail
4 17 SCC Inner Ave Quietways
4 17 SCC Bevois Valley Cycle
4 17 SCC Portwood Road Cycle
4 17 SCC Stoneham Lane Upgrade
4 19 St Denys Active Travel Zone SCC St Denys Road Active Travel Zone
4 21 SCC A335/St Denys Road Junction
4 21 SCC A335 Smart Technology
4 18 Portswood Local Mobility Hub SCC Portswood Local Mobility Hub
4 17 Eastleigh Town Centre Cycle HCC Eastleigh Town Centre Cycles
4 24 Eastleigh Local Mobility Hub HCC Eastleigh Local Mobility Hub
5 26 SCC Northam Road Cycle
5 26 HCC Bursledon Road Cycle
5 26 HCC Providence Hill Cycle
5 27 SCC Northam Road/Union/Princes Jtn
5 27 SCC Bitterne Rd W/Rampart Road Jtn
5 27 SCC Bitterne Rd W/Bullar Road Jtn
5 27 Hamble Cycle Routes HCC Hamble Cycle route
5 28 SCC Bitterne Interchange
5 28 SCC Bitterne Mobility Hub
5 29 SCC Bitterne Road West Bus Lanes
5 29 SCC Super Stops
5 29 SCC Enhanced Stops
5 30 A3024 Smart Technology Corridor SCC A3024 Smart Technology
5 32 HCC Chalk Hill Jct Improvement
5 32 HCC Hedge End Bus Priority
5 32 HCC Enhanced Stop Hedge End
5 31 SCN3 Bitterne-Hedge End Cycle Route HCC Bitterne to Hedge End Cycle
5 33 Woolston Interchange & Local Mobility Hub SCC Woolston Local Mobility Hub
5 34 Woolston Active Travel Zone SCC Woolston Active Travel Zone
5 SCC Itchen Bridge ANPR & Roundabout
5 HCC Providence Hill Bus Priority
5 HCC A27 Bus Stop Laybys
HCC Enhanced Bus Stops
HCC Hamble Lane Bus Bypass
5 37 Hamble Station Accessibility HCC Hamble Station Accessibility
5 36 SCC Portsmouth Rd Cycle
5 36 HCC Hamble Lane Cycle
CC 41 A33/A3024 Six Dials Junctions SCC Six Dials Junction
CC 39
East-West Spie Sustainable Transport
CorridorSCC
East/West Spine
CC 40 Northern Inner Ring Road Junctions SCC Northern Inner Ring Road
CC 43 Portland Terrace-Albion Place Bus Hubs SCC Portland Terrace
CC 42 Civic Centre Forecourt SCC Civic Centre Public Realm
CC 44 SCN6 City Centre Cycle Route SCC East Park Terrace Cycle/Bus
CC 45 City Centre Bus Priority SCC City Centre Bus Lane
CC 38 Southampton Central Station Interchange SCC Central Station Interchange
CC 38SWR Southampton Central Station
InterchangeSCC
SWR Southampton Central Station
Interchage
CC 39 Rapid Bus Ticketing Technology SCC On-Board Ticketing Technology
Scheme IDCorridor Sub-Scheme
35 Southampton-Bursledon Rapid Bus
SCN5 Southampton-Hamble Cycle Routes
Wessex Lane-Swaythling Station Travel Hubs
Southampton Airport Parkway Travel Hub
SCN6 Southampton-Eastleigh Cycle Route
A335 Smart Technology Corridor
SCN3 Southampton-Bursledon Cycle Route
A3024 Bitterne Road West Junctions
Bitterne Bus Interchange & Local Mobility
Hub
Southampton-Thornhill Rapid Bus
Bitterne-Hedge End Rapid Bus
Southampton-Fair Oak Bus
19/20 20/21 21/22 22/23
SCN1 Southampton-Totton-Hythe Cycle
Route
Southampton-Totton-Hythe Bus
Lordshill Local Mobility Hub & Interchange
SCN4 Lordshill-North Baddesley Cycle Route
Southampton-Shirley-Romsey Rapid Bus
SCN5 Southampton-Chandler's Ford Cycle
Route
Southampton-Chandler's Ford-Winchester
Rapid Bus
AuthorityScheme Name
Figure 8-1 –Southampton TCF Delivery Plan for High Scenario
194

CONNECTING SOUTHAMPTON CITY REGION TRANSFORMING CITIES FUND STRATEGIC OUTLINE BUSINESS CASE
8.3. Governance Structure This section sets out the strategic governance arrangements for the Southampton City Region TCF Programme. The governance for decision making is in three tiers as shown in the Project Governance chart in Figure 8-2. The governance is based on existing arrangements which are currently in place to facilitate joint working between the two local authorities through both Solent Transport and the delivery of the Southampton-Hampshire Access Fund revenue initiatives.
Figure 8-2 – Southampton City Region TCF Project Governance Structure
The Senior Responsible Officer is Mike Harris, Deputy Chief Executive of SCC. The Client Leads are Pete Boustred, Head of Green City & Infrastructure at SCC and Frank Baxter, Head of Integrated Transport at HCC. The SRO will report to the Steering Board to both the SCC Cabinet Member for Transport & Place and HCC Executive Member for Environment & Transport on the Programme.
The current Southampton-Hampshire Access Fund governance arrangements provide a robust template for successful and effective close partnership working arrangements between HCC and SCC that will be built upon for planning and delivery of Southampton TCF programme interventions.
The full Governance structure including further detail on the TCF Delivery Team is in Appendix 10.
8.3.1. Southampton TCF Strategic Governance Overview There are three main levels of Governance for the Southampton City Region TCF project: -
TCF Steering Board, political level, quarterly decision-making; TCF Delivery Board, strategic high-level officer level, monthly meeting; and TCF Project Team, officer level, weekly meeting.
The function and Terms of Reference of each of these three levels of Governance are set out in the remaining sections of this document.
Southampton TCF Steering Board The Steering Board is the most senior level of decision making for the Southampton area TCF project comprising political representation by the Portfolio Holders for both SCC and HCC, together with the Senior Responsible Officer (SRO), Client leads and HCC Assistant Director represented. The Client Leads for HCC and SCC would report on progress on developing and implementing the Transforming
195
CONNECTING SOUTHAMPTON CITY REGION TRANSFORMING CITIES FUND STRATEGIC OUTLINE BUSINESS CASE
Cities Fund programme and seek decisions or ratification on recommendations made by the Delivery Board.
Purpose of the Steering Board o To receive updates/reports on progress on the development of the Southampton City
Region TCF Strategic Outline Business Case (SOBC) and the subsequent implementation of schemes;
o To provide strategic direction on TCF for Southampton and to ratify recommendations made by the TCF Delivery Board and Project Team;
o To enable elected members of SCC and HCC to be kept informed of TCF progress and outcomes;
o To approve proposed spend on TCF schemes for each Financial Year; o To provide guidance for Solent Transport Joint Committee and each individual Council’s
decision making; and o Act as figurehead/ champion for the TCF project within each local authority.
Terms of Reference, Reporting & Decision Making o The Board will be provided with high level reporting on progress both of bid and then of
the programme, along with issues/ outcomes/ resolutions from legal, procurement, finance, consultation, communications, stakeholder engagement, consultation – reports will be by exception;
o Provide high level guidance on resolution of programme level issues and act as final decision-making point;
o The Board will be supplied with information on spend, progress, to ensure that direction of travel with the TCF project is in line with corporate and TCF objectives; and
o To delegate authority for some decisions to Delivery Board (e.g. regarding reallocation of funds, reporting to DfT, scheme progression or removal) as appropriate.
Southampton TCF Delivery Board The Delivery Board will provide strategic officer decision making (and recommendations for decision by the Steering Board) on the SOBC development and on TCF programme delivery. It is comprised of the Client Leads within both SCC and HCC as well as the Bid Leads for each authority and TCF Programme Manager, with support from specialists in Finance, Legal, Procurement and Communications.
Purpose of the Delivery Board: o To receive updates/ reports on progress on the development of the Southampton City
Region TCF Strategic Outline Business Case and the subsequent implementation of schemes;
o To provide strategic direction on TCF for Southampton and to ratify recommendations made by Project Team and escalate items to TCF Steering Board requiring decisions;
o To decide what information to report at quarterly Steering Board meetings in order to keep elected members of SCC and HCC informed of TCF delivery progress and outcomes;
o To approve over/underspend for future and current Financial Years, approval of budgets, allocation of funding;
o To develop a TCF Joint Working Agreement/Service Level Agreement between SCC and HCC, and with other partners – UHS Trust, University, bus operators, rail operators, etc;
o To act as decision maker on scenario allocation if DfT funding is different to bid ask, and on refinement of scenarios in line with programme of schemes and the SLA;
o To receive updates on finance, procurement, legal, network management, traffic orders, planning, and communications on TCF and approve plans as presented;
o To oversee communication with DfT and Stakeholders on progress through regular update newsletters and spend monitoring pro-formas; and
o To provide guidance to senior management teams within each authority.
196
CONNECTING SOUTHAMPTON CITY REGION TRANSFORMING CITIES FUND STRATEGIC OUTLINE BUSINESS CASE
Terms of Reference, Reporting & Decision Making o The board will be provided with information on decisions that need to be made, progress
on bid and scheme implementation, spend to date, and monitoring & evaluation; o To make decisions on allocation of budgets within the amounts received from DfT
(including reallocation if award amount is different to requested amount within one of the three scalable scenario)
o To make decisions on how over/under spend is managed, progression of schemes; and o To advise on strategic direction for communications with stakeholders.
Southampton TCF Project Team The Project Team provide regular guidance on the development of the Business Cases and then the implementation of schemes. It provides project related decision making and escalates items to Delivery Board for decision making. It is comprised of the Bid Leads for each authority, Southampton TCF Programme Manager, Delivery Leads for each work stream, Programme Office Support, Communications and Finance officers, and others involved in the TCF project.
Purpose of Project Team o To act as the leads for the completion of the Southampton TCF SOBC Business Case,
project by the submission date, (including client managing Atkins and SYSTRA consultancy support for Economic Case development), and subsequent Business Cases for >£5m schemes;
o To manage Phase 1 delivery and programme the delivery of the main schemes; o To monitor spend, highlight over/under spend, set out case for change in project budget
or spend profile, to monitor match funding and provide reports to Delivery Board and DfT; o To act as the main contacts for the DfT on day-to-day during co-development and
implementation; o To develop robust and effective governance arrangements including Terms of Reference,
Service Level Agreements, and other arrangements with partners through regular communications and events;
o To liaise with main Partners Group and provide Stakeholder Group with updates on TCF and schemes;
o To provide and monitor critical path timelines; o To prepare and monitor programme level risk register escalating significant risks for
schemes to Delivery Board as necessary; o To provide administration of Delivery Board / Steering Board meetings; and o To develop a local monitoring and evaluation framework for TCF in liaison with DfT,
working collaboratively with their national TCF monitoring and evaluation consultants.
Terms of Reference, Reporting & Decision Making o Receive updates on spend, delivery, bid preparation, communications, legal; and o To prepare agendas, decisions/ reports/ updates on TCF for Delivery Board; o To manage the Programme Level risk register; o To manage day to day relationships with TCF delivery partners, stakeholders and
interested parties affected by scheme delivery; and o To update and report on inter-dependencies from other schemes (HE, LTP, developer
funded) which could impact on TCF programme/ scheme delivery.
TCF Delivery Team The purpose of the TCF Delivery Team is to implement the funded TCF schemes. The team will be joint across both SCC and HCC but co-located at SCC and HCC offices. Team members will be SCC employees but with the ability to delivery schemes in Hampshire in partnership with HCC Transport Delivery Team.
The Delivery Team is led by Southampton TCF Programme Manager (1xFTE) who will have the responsibility for the day to day running of the TCF Programme and manage leads for each of the
197

CONNECTING SOUTHAMPTON CITY REGION TRANSFORMING CITIES FUND STRATEGIC OUTLINE BUSINESS CASE
projects areas. They will have responsibility for delivery of the Programme to budget, time and quality as set out by the Business Case. They will also be the primary point of contact for the DfT and liaise with the the DfT’s chosen consultants to develop a robust Monitoring & Evaluation Strategy (see 8.11).
The proposed TCF Delivery Team consists of the following FTEs;
Local Mobility Hub & Active Travel Zone Lead – responsible for delivery of the LMH and ATZ elements including community engagement;
Southampton Rapid Bus Lead – responsible for delivery and liaison with bus operators and SHBOA, and the lead area for Smart Technology;
City Centre Lead – responsible for delivery of the City Centre programme, and liaison with developers and the Southampton BID, bus operators; and
Southampton Cycle Network Lead – responsible for delivery of the SCN programme in both Hampshire and Southampton to the same standard – using consistent basis of design.
Each of these leads will have access to technical support, analysis and design supply chain through the SCC HSP with BBLP and HCC Framework with Atkins.
In addition, there will be a TCF lead for Finance & Contracts for each of SCC and HCC to support the Southampton TCF Programme Manager monitor spend on the programme and provide reports to Delivery and Steering Boards and the DfT.
Other technical Support includes officers from SCC and HCC Finance, Legal, Procurement, Contracts, and Programme Management teams.
Communications and promotion of activities relating to TCF will be vital to ensure the full benefits of the schemes are realised. A dedicated TCF Communications Officer will be responsible for communications and marketing strategies during the development, implementation, and operation of all the TCF schemes. They will report to the Solent Transport Communications Manager and the Southampton TCF Programme Manager. This will ensure that the messages about TCF are consistent across both Southampton and Hampshire through the My Journey programme. It will have synergies with the Portsmouth City Region TCF programme. This will maximise the advantage for the Solent. The TCF Communications Officer will be support by specialists in both SCC and HCC. Further details are in Section 8.9 and Appendix 11.
8.4. Risk Management Strategy A robust and systematic risk management process has been taken in order to identify, analyse, plan and manage risk which will be applied throughout the life of the TCF programme.
The current risk register, is set out in Appendix 7 and contains a total of 97 programme risks which remain open.
The risk register provides a snapshot of the risks at the current stage of development of interventions and will be kept under continuous and regular review throughout the TCF programme development.
As part of this review process, risk are regularly re-assessed, prioritised and rated. A mitigation strategy has been developed for all ‘significant’ risks. Effective control measures are being established to ensure risks are maintained at a level acceptable to the two authorities.
The stated aim is to be “best in class” but proportionate to the size and the stage of development of the project.
The time devoted to quantifying and managing risks will be proportionate to the size of the risk. Table 8-1 identifies and summarises the top nine high-level risks affecting the overall Southampton TCF programme.
198
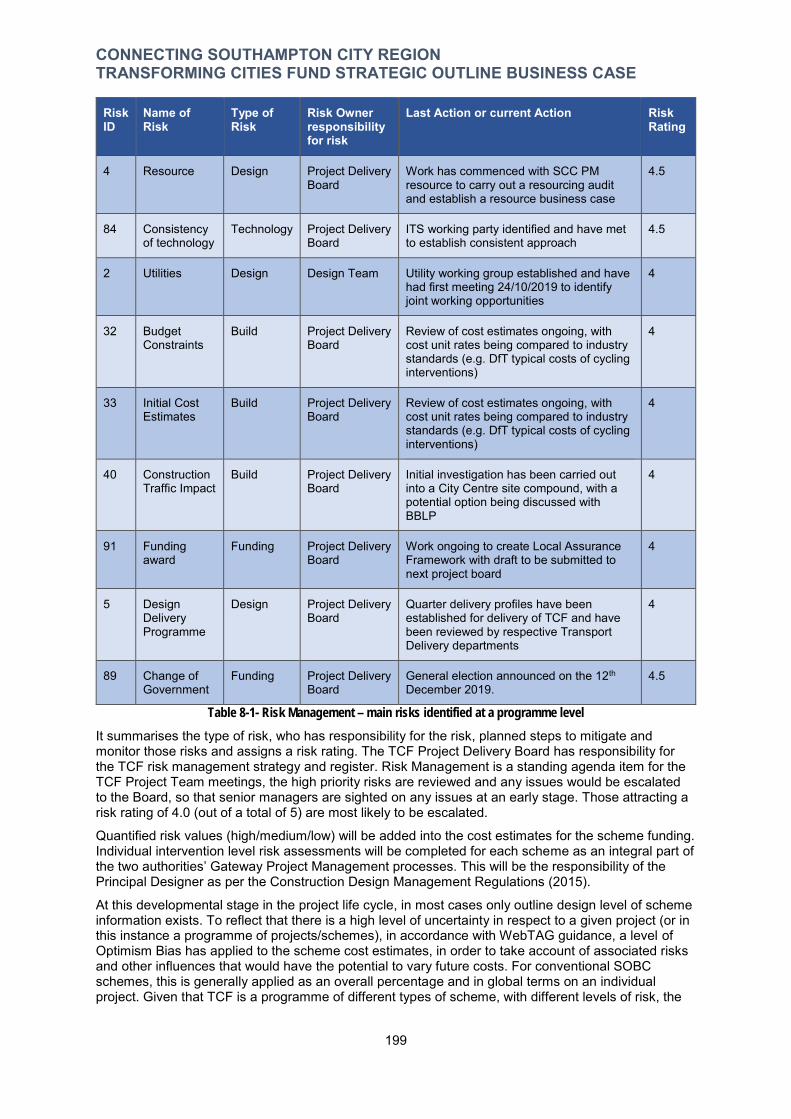
–
CONNECTING SOUTHAMPTON CITY REGION TRANSFORMING CITIES FUND STRATEGIC OUTLINE BUSINESS CASE
Risk ID
Name of Risk
Type of Risk
Risk Owner responsibility for risk
Last Action or current Action Risk Rating
4 Resource Design Project Delivery Board
Work has commenced with SCC PM resource to carry out a resourcing audit and establish a resource business case
4.5
84 Consistency of technology
Technology Project Delivery Board
ITS working party identified and have met to establish consistent approach
4.5
2 Utilities Design Design Team Utility working group established and have had first meeting 24/10/2019 to identify joint working opportunities
4
32 Budget Constraints
Build Project Delivery Board
Review of cost estimates ongoing, with 4 cost unit rates being compared to industry standards (e.g. DfT typical costs of cycling interventions)
33 Initial Cost Estimates
Build Project Delivery Board
Review of cost estimates ongoing, with 4 cost unit rates being compared to industry standards (e.g. DfT typical costs of cycling interventions)
40 Construction Traffic Impact
Build Project Delivery Board
Initial investigation has been carried out 4 into a City Centre site compound, with a potential option being discussed with BBLP
91 Funding award
Funding Project Delivery Board
Work ongoing to create Local Assurance Framework with draft to be submitted to next project board
4
5 Design Delivery Programme
Design Project Delivery Board
Quarter delivery profiles have been 4 established for delivery of TCF and have been reviewed by respective Transport Delivery departments
89 Change of Government
Funding Project Delivery Board
General election announced on the 12th
December 2019. 4.5
Table 8-1- Risk Management – main risks identified at a programme level
It summarises the type of risk, who has responsibility for the risk, planned steps to mitigate and monitor those risks and assigns a risk rating. The TCF Project Delivery Board has responsibility for the TCF risk management strategy and register. Risk Management is a standing agenda item for the TCF Project Team meetings, the high priority risks are reviewed and any issues would be escalated to the Board, so that senior managers are sighted on any issues at an early stage. Those attracting a risk rating of 4.0 (out of a total of 5) are most likely to be escalated.
Quantified risk values (high/medium/low) will be added into the cost estimates for the scheme funding. Individual intervention level risk assessments will be completed for each scheme as an integral part of the two authorities’ Gateway Project Management processes. This will be the responsibility of the Principal Designer as per the Construction Design Management Regulations (2015).
At this developmental stage in the project life cycle, in most cases only outline design level of scheme information exists. To reflect that there is a high level of uncertainty in respect to a given project (or in this instance a programme of projects/schemes), in accordance with WebTAG guidance, a level of Optimism Bias has applied to the scheme cost estimates, in order to take account of associated risks and other influences that would have the potential to vary future costs. For conventional SOBC schemes, this is generally applied as an overall percentage and in global terms on an individual project. Given that TCF is a programme of different types of scheme, with different levels of risk, the
199
CONNECTING SOUTHAMPTON CITY REGION TRANSFORMING CITIES FUND STRATEGIC OUTLINE BUSINESS CASE
Optimism Bias application has been done in a targeted way, tailored to the individual TCF projects, rather than as a global application of an overall percentage to the whole programme.
At present, the spend profiles that have been produced for each of the individual TCF projects have had an allowance of optimism bias added in the Economic Case. Quantifying the risk register with a risk allowance in addition to this would cause duplication with the optimism bias allowances and would stretch the boundaries of the funding envelopes for each scenario. At this stage of a programme level SOBC for TCF, it was not considered to be proportionate or appropriate to develop individual risk registers for each individual TCF intervention in the three scenarios. This will be progressed in March 2020 once a DfT funding decision is known.
8.5. Approach to Scheme Design and Construction Southampton City Council and Hampshire County Council will be the Clients for the works that are being implemented in their own administrative areas but overseeing by a TCF Programme Manager working across both authorities.
Within, Southampton the TCF Programme will be designed and delivered through the existing framework with the Council’s Highways Services Partner (HSP) Balfour Beatty Living Places (BBLP) and with Network Rail to manage interactions with the railway. Balfour Beatty Living Places has the resources to provide the structures technical design and approvals, supervision and implementation of the works. Where specialist support is required this is already in place or will be obtained via open tenders following SCC’s standard procurement process.
The nature of the HSP contract (it is based on the NEC3 Target Cost mechanism) means the works will be delivered with appropriate risks transferred to BBLP. Alternatively, some elements of the TCF scenario could potentially be procured through the SCAPE framework, which would bring in other resources. The procurement route for the limited number of higher cost interventions within the City Centre has yet to be finalised.
In Hampshire, identified schemes will be designed and delivered through an established project management and governance framework with a proven track record in delivering annual capital programmes of schemes.
Projects will be led by a client team and designed through Hampshire County Council Engineering Consultancy or Atkins as the County Council’s Strategic Partner. Hampshire County Council and Atkins have the resources to provide the design, procurement and supervision elements of the works. Should specialist support or additional resources be needed, the County Council has the contractual opportunities to bring this in as required.
Construction works will be procured through the Hampshire County Council Generation 4 (also known as ‘Gen4’) frameworks which will commence from 2020, running until 2024 and is split between frameworks with varying value ranges. The frameworks are managed by Hampshire County Council and will be used by organisations within the South of England to deliver Civil Engineering and Highways related projects.
The framework will provide HCC and the other participating authorities with access to a range of highly skilled and experienced suppliers who can deliver a substantial number of projects effectively and efficiently. The framework will also incorporate critical success factor performance indicators which ensure supplier performance will be maintained throughout the framework; providing a consistent, efficient and high-quality level of delivery on projects throughout the capital programme.
Each TCF project will follow SCC and HCC’s defined ‘Gateway’ project management system, which follows the principles set out and adopted by the Association Project Management (APM) and uses a staged gateway system. The Project Sponsor will take the scheme through the various identified Gateway process and into implementation, with support from SCC and HCC’s Finance, Legal and Procurement Teams. Implementation will be via approved contractors with relevant experience, procured in accordance with SCC and HCC’s procurement processes and procedures, these are set in the Commercial Case.
The TCF project management team is working closely with other strategic partners that will be actively involved in helping to deliver some interventions contained within the scalable TCF scenarios. These delivery partners include Network Rail, Highways England, Solent Transport (comprising of HCC,
200
CONNECTING SOUTHAMPTON CITY REGION TRANSFORMING CITIES FUND STRATEGIC OUTLINE BUSINESS CASE
SCC, PCC and IOW), the University Hospital Southampton Trust, South Western Railway and the University of Southampton.
8.6. Evidence of Experience of Delivering Similar Projects
Both Southampton and Hampshire and their Highway Service providers (BBLP and Skanska) have implemented a number of large-scale transport and highway projects over the past five years which have been delivered to time and to budget. This has involved liaison with key stakeholders in Southampton and Hampshire such as District & Borough Councils, bus and rail operators, Network Rail, and ABP as the owners of the Port.
Examples include:
TCF Tranche 1 scheme delivery (2019/20) – The two authorities have completed or have commenced construction on 80% of a Programme of £5.7m of TCF Tranche 1 investment, primarily in cycle infrastructure improvements and C-ITS technology;
A33/A35 Millbrook Roundabout 2018-2019 - £8m major maintenance scheme to reconstruct and resurface the roundabout and approach roads that is a major access point to the Port of Southampton Western Docks. Involved close liaison with ABP as the roundabout was closed in quadrants to maintain a level of access to the Port for HGVs and the closure of the section closest to the Port was programmed for the ‘quietest’ time of the year for Port. A comprehensive stakeholder management and communications plan was prepared and implemented to ensure that both the Port and travelling public were aware of what was happening and changes to traffic management;
DfT National Productivity Investment Fund (NPIF) 2018-ongoing - £5.7m project to improve journey time reliability and implement part of SCN3 Cycle Freeway along Bursledon Road as part of the A3024 Eastern Access Corridor;
DfT Maintenance Challenge Fund works; A33 First and Second Avenue SCN1 corridor improvements 2017-2019 - Created a Cycle
Freeway with segregated two-way cycle routes on First and Second Avenue to provide access to the Port and Millbrook Industrial Estates, and on Millbrook Road East to create a cycle focused filtered permeability scheme to improve environment for pedestrians and cyclists to access Southampton Central station;
Southampton and Hampshire DfT Access Fund 2017-ongoing - £3.3m behaviour change programme jointly run by SCC and HCC to promote walking and cycling for journeys to work and school in the same geographical area as TCF through the well-regarded My Journey brand. Includes workplace engagement, travel planning, schools engagement programme, large scale events and activities including City Let’s Ride to inspire people to cycle, and promotion of the new and existing cycle networks. This has close synergies with TCF as the My Journey vehicle will be used to promote and market the new facilities on the SCN as they are built;
Shared use footway and cycleway scheme Ennerdale Road in Bordon, Hampshire: Phase 1. - Scheme to construct new shared use footway and cycleway through area of woodland of Ennerdale Road/Oakley Road in Bordon, to provide a route of access to the site of a newly constructed secondary school. As of November the Phase 1 scheme is substantially complete and had a works cost of £197,600. This is the first of a number of phases of pedestrian and cycle improvements proposed for Ennerdale Road/Oakley Road that will be delivered over 2019/20 with a total scheme cost of approx. £900,000. The scheme forms one element of the Whitehill and Bordon Green Grid/Green Loop project, which has been developed in partnership working with East Hampshire District Council and Hampshire County Council, part funded by EM3 LEP and part from developer s106 contributions.
Eclipse Busway, Fareham to Gosport, Hampshire - the busway project has demonstrated strong value for money in terms of the economic return on investment. The original BCR of the project was calculated as 1.5 prior to construction and following completion of the scheme, independent analysis by KPMG indicates a BCR of 1.9 Eclipse has delivered up to £6.94 of benefit to users, non-users and the wider economy – a BCR of 6.94.
201
CONNECTING SOUTHAMPTON CITY REGION TRANSFORMING CITIES FUND STRATEGIC OUTLINE BUSINESS CASE
These examples are delivered alongside the annual Integrated Transport Programmes for both SCC and HCC of cycling, walking, public transport, accessibility and congestion reduction programmes, and annual Roads Maintenance Programmes.
8.7. Spend approvals process Southampton City Council will be the Accountable Body for the Southampton TCF Programme. Following any formal offer of funding there is a need to add funding to Southampton City Council’s Capital Programme. As the value of this project exceeds £2m, the Financial Regulations at SCC require it to be presented at Full Council with authority to spend. After a call-in period for scrutiny of 5 working days the project is formally added to the Capital Programme. The process is shown in Figure 8.3 below.
After being added to the Capital Programme projects are managed via the Council’s existing internal gateway processes for managing scheme delivery.
The transfer of funds from SCC (the Accountable Body) to HCC and to project partners will be in the form of quarterly payments, following receipt of the quarterly TCF payments from DfT. Hampshire County Council will follow an equivalent process to add TCF funding to their Capital Programme.
Through the projects both SCC and HCC have delivered, both authorities have learnt that they are best delivered through a partnership based approach, with multi-agency project teams co-located in shared offices to deal with issues quickly and meet the critical success criteria. Establishing project boards is essential for the effective management of the projects which involve key stakeholders. Key aspects such as Early Contractor Involvement, a clear governance framework and appropriate placement of project risk are vital to ensure a successful project is delivery. Each project has benefited from a clear communication strategy and close liaison with network management to ensure major works can be coordinated effectively across the City. SCC and HCC both have a defined project management system that follow the principles of good project management as set out by the Association Of Project Management (APM) and uses a staged gateway system.
This is a capital board structure which operates a formal and accepted gateway approval process for project delivery. Gateways provide key reporting and scrutiny process at stages of the process – Scheme Concept, Feasibility, Preliminary design, Detailed Design, Construction & Post-Implementation & Monitoring. Progress will be monitored through monthly TCF Delivery Board reporting with quarterly reporting to the Project Board on delivery, budget, programme and stakeholders/communications.
8.8. Local Assurance Framework All scheme costs fall below the £40m set by DfT, so would not automatically be retained by DfT for assurance purposes. To ensure good governance and oversight of the individual schemes in the Southampton TCF area, we are proposing to use a Local Assurance Framework (LAF) that is bespoke to TCF. This LAF is broadly based on the framework developed for the Solent Local Transport Body, with additional content based on the approach taken to due diligence in the Solent LEP Local Assurance Framework. The LAF will enable SCC and HCC to rigorously monitor the progress of each project and ensure that they meet the objectives of TCF and represent value for money as well as meet DfT WebTAG requirements for due diligence of schemes with a TCF contribution of over £5m.
A Scrutiny and Evaluation Panel will be appointed by the two Local Highway Authorities (LHAs) to provide independent advice on Value for Money (VfM) of schemes over £5m. The panel shall include representation from Solent Transport as an independent party to provide due diligence on the OBCs and FBCs for those schemes with a TCF contribution in excess of £5 million and up to £40 million. The Solent Transport representative vote shall be the deciding one in all decision making on scheme selection (in the event of a DFT funding award above or below one of the three scalable scenarios, where scheme selection is left at the discretion of the two LHAs).
SCC will be the Accountable Body for financial decision making and monitoring, with the SCC Executive Director for Finance & Commercialisation performing the role of Section 151 officer. The
202
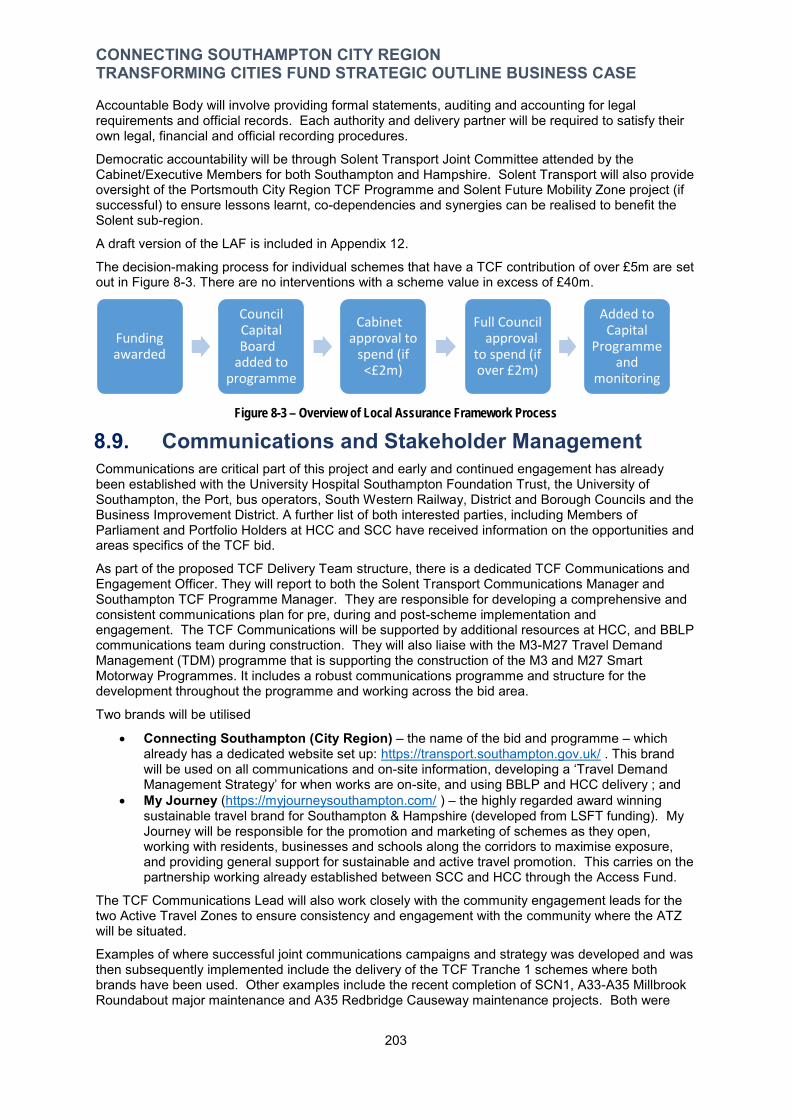
-
--
CONNECTING SOUTHAMPTON CITY REGION TRANSFORMING CITIES FUND STRATEGIC OUTLINE BUSINESS CASE
Accountable Body will involve providing formal statements, auditing and accounting for legal requirements and official records. Each authority and delivery partner will be required to satisfy their own legal, financial and official recording procedures.
Democratic accountability will be through Solent Transport Joint Committee attended by the Cabinet/Executive Members for both Southampton and Hampshire. Solent Transport will also provide oversight of the Portsmouth City Region TCF Programme and Solent Future Mobility Zone project (if successful) to ensure lessons learnt, co-dependencies and synergies can be realised to benefit the Solent sub-region.
A draft version of the LAF is included in Appendix 12.
The decision-making process for individual schemes that have a TCF contribution of over £5m are set out in Figure 8-3. There are no interventions with a scheme value in excess of £40m.
Funding awarded
Council Capital Board
added to programme
Cabinet approval to
spend (if <£2m)
Full Council approval
to spend (if over £2m)
Added to Capital
Programme and
monitoring
Figure 8-3 – Overview of Local Assurance Framework Process
8.9. Communications and Stakeholder Management Communications are critical part of this project and early and continued engagement has already been established with the University Hospital Southampton Foundation Trust, the University of Southampton, the Port, bus operators, South Western Railway, District and Borough Councils and the Business Improvement District. A further list of both interested parties, including Members of Parliament and Portfolio Holders at HCC and SCC have received information on the opportunities and areas specifics of the TCF bid.
As part of the proposed TCF Delivery Team structure, there is a dedicated TCF Communications and Engagement Officer. They will report to both the Solent Transport Communications Manager and Southampton TCF Programme Manager. They are responsible for developing a comprehensive and consistent communications plan for pre, during and post-scheme implementation and engagement. The TCF Communications will be supported by additional resources at HCC, and BBLP communications team during construction. They will also liaise with the M3-M27 Travel Demand Management (TDM) programme that is supporting the construction of the M3 and M27 Smart Motorway Programmes. It includes a robust communications programme and structure for the development throughout the programme and working across the bid area.
Two brands will be utilised
Connecting Southampton (City Region) – the name of the bid and programme – which already has a dedicated website set up: https://transport.southampton.gov.uk/ . This brand will be used on all communications and on-site information, developing a ‘Travel Demand Management Strategy’ for when works are on-site, and using BBLP and HCC delivery ; and
My Journey (https://myjourneysouthampton.com/ ) – the highly regarded award winning sustainable travel brand for Southampton & Hampshire (developed from LSFT funding). My Journey will be responsible for the promotion and marketing of schemes as they open, working with residents, businesses and schools along the corridors to maximise exposure, and providing general support for sustainable and active travel promotion. This carries on the partnership working already established between SCC and HCC through the Access Fund.
The TCF Communications Lead will also work closely with the community engagement leads for the two Active Travel Zones to ensure consistency and engagement with the community where the ATZ will be situated.
Examples of where successful joint communications campaigns and strategy was developed and was then subsequently implemented include the delivery of the TCF Tranche 1 schemes where both brands have been used. Other examples include the recent completion of SCN1, A33-A35 Millbrook Roundabout major maintenance and A35 Redbridge Causeway maintenance projects. Both were
203

CONNECTING SOUTHAMPTON CITY REGION TRANSFORMING CITIES FUND STRATEGIC OUTLINE BUSINESS CASE
based on close partnership work between SCC, HCC, BBLP and ‘My Journey’, and was successful and effective as these projects were sensitive with access to the Port.
Please refer to Appendix 11 for a copy of the approved and current Southampton City Region TCF Communications Plan.
Stakeholder Engagement - Regular meetings have been attended by a key stakeholder group (as indicated on the Governance Chart - Figure 8.2). At these meetings stakeholders have received timely and appropriate updates on the progress and content of the Business Case which has been well received and resulted in an encouraging number of letters of support.
Detailed engagement has been carried out with the two main bus operators, UHS Foundation Trust, South Western Railway and Network Rail. The bus operators and UHS Trust are key delivery partners for the rapid Bus and Southampton West Park & Ride projects. All of which have senior management awareness and support for the whole Southampton TCF Programme.
Stakeholder mapping has been carried out to identify our main stakeholders and their level of involvement. The resulting RACI analysis is in Appendix 13. This is summarised below.
Principal Stakeholders Stakeholders Interested Parties
Delivery of the whole, or part, of TCF schemes
Supporters of schemes Wider beneficiaries of TCF Schemes
Bus Operators – Bluestar (GSC), First Southampton
Hampshire District & Borough Councils (Eastleigh, New Forest & Test Valley)
Partnership for South Hampshire
UHS Trust Solent University Red Funnel
University of Southampton ABP Southampton & DP World SHBOA
South Western Railway Southampton Airport Southampton Workplace Travel Plan Network
Network Rail Residents
Solent Transport Businesses
Developers
National Park Authority
Members of Parliament Table 8-2 – Southampton TCF Stakeholders
Letters of support to the Southampton TCF Programme have been received for the majority of these stakeholders. Where applicable they have indicated the level of third party funding. The letters of support are in Appendix 8.
8.10. Programme Dependencies There are a number of external influences and factors which may impact upon the delivery of the TCF programme, a number of which are listed in the programme risk strategy. In addition to those are:-
The outcome of the Future Mobility Zone (FMZ) bid (early 2020). Other works to the highway network in the City Region:
o The Smart Motorway programme for the M27 and the M3 and any slippage within these Highways England programmes;
o Works to Highways England network carried as part of the Road Investment Strategy (RIS) – including the Redbridge Roundabout capacity improvement scheme, the M27 Southampton Junctions improvements planned at Junction 8 and Windhover Roundabout, M27 Junction 7, and M27 Junction 9 – any potential slippage in timeframes for construction could impact on construction of TCF interventions on the A3024 and A3025 corridors;
o The outcome of funding decisions by Department for Transport on the Major Road Network (MRN) and Local Large Majors (LLM) fund, affecting in particular, A326
204
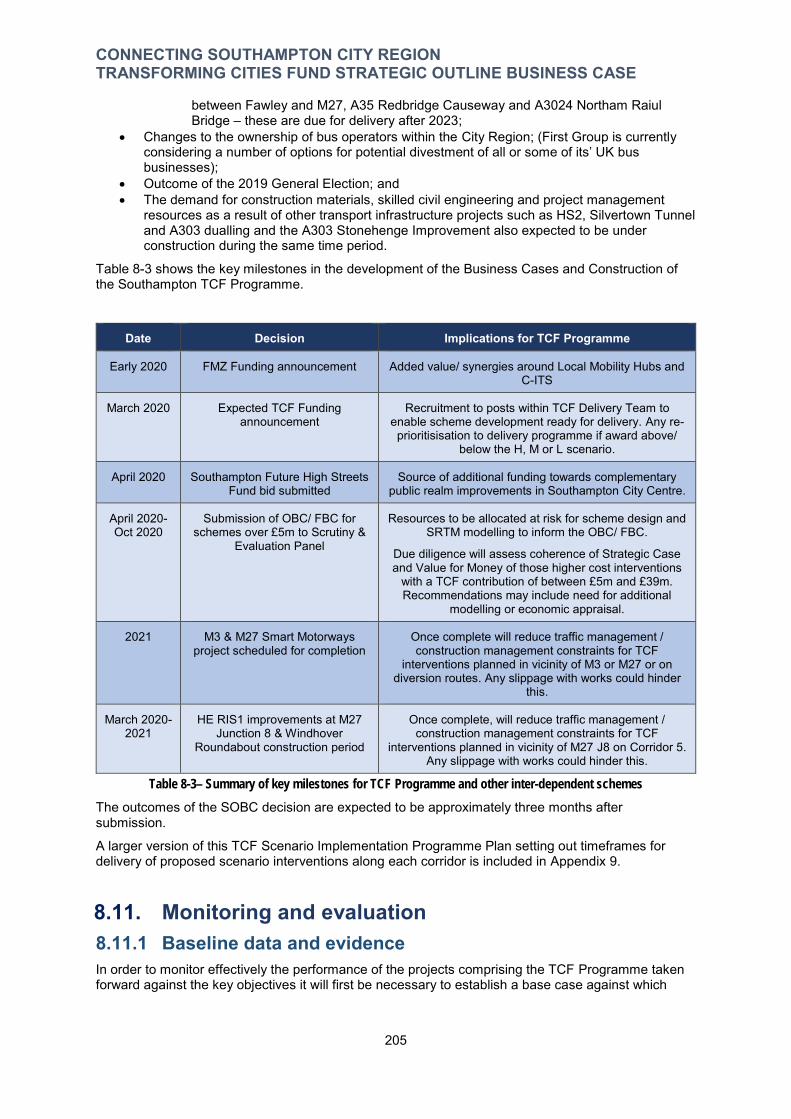
CONNECTING SOUTHAMPTON CITY REGION TRANSFORMING CITIES FUND STRATEGIC OUTLINE BUSINESS CASE
between Fawley and M27, A35 Redbridge Causeway and A3024 Northam Raiul Bridge – these are due for delivery after 2023;
Changes to the ownership of bus operators within the City Region; (First Group is currently considering a number of options for potential divestment of all or some of its’ UK bus businesses);
Outcome of the 2019 General Election; and The demand for construction materials, skilled civil engineering and project management
resources as a result of other transport infrastructure projects such as HS2, Silvertown Tunnel and A303 dualling and the A303 Stonehenge Improvement also expected to be under construction during the same time period.
Table 8-3 shows the key milestones in the development of the Business Cases and Construction of the Southampton TCF Programme.
Date Decision Implications for TCF Programme
Early 2020 FMZ Funding announcement Added value/ synergies around Local Mobility Hubs and C-ITS
March 2020 Expected TCF Funding announcement
Recruitment to posts within TCF Delivery Team to enable scheme development ready for delivery. Any re-prioritisisation to delivery programme if award above/
below the H, M or L scenario.
April 2020 Southampton Future High Streets Fund bid submitted
Source of additional funding towards complementary public realm improvements in Southampton City Centre.
April 2020-Oct 2020
Submission of OBC/ FBC for schemes over £5m to Scrutiny &
Evaluation Panel
Resources to be allocated at risk for scheme design and SRTM modelling to inform the OBC/ FBC.
Due diligence will assess coherence of Strategic Case and Value for Money of those higher cost interventions
with a TCF contribution of between £5m and £39m. Recommendations may include need for additional
modelling or economic appraisal.
2021 M3 & M27 Smart Motorways project scheduled for completion
Once complete will reduce traffic management / construction management constraints for TCF
interventions planned in vicinity of M3 or M27 or on diversion routes. Any slippage with works could hinder
this.
March 2020-2021
HE RIS1 improvements at M27 Junction 8 & Windhover
Roundabout construction period
Once complete, will reduce traffic management / construction management constraints for TCF
interventions planned in vicinity of M27 J8 on Corridor 5. Any slippage with works could hinder this.
Table 8-3– Summary of key milestones for TCF Programme and other inter-dependent schemes
The outcomes of the SOBC decision are expected to be approximately three months after submission.
A larger version of this TCF Scenario Implementation Programme Plan setting out timeframes for delivery of proposed scenario interventions along each corridor is included in Appendix 9.
8.11. Monitoring and evaluation 8.11.1 Baseline data and evidence In order to monitor effectively the performance of the projects comprising the TCF Programme taken forward against the key objectives it will first be necessary to establish a base case against which
205

CONNECTING SOUTHAMPTON CITY REGION TRANSFORMING CITIES FUND STRATEGIC OUTLINE BUSINESS CASE
performance can be measured. SCC and HCC already collect a considerable amount of traffic data which is being assessed and a list is provided in Appendix 15.
SCC and HCC will work the DfT and their appointed consultants, on the TCF monitoring and evaluation framework across all TCF City Regions. We will provide the necessary and requested data required for effective monitoring and evaluation of impacts.
Baseline data collection will need to be collected just prior to commencement of construction, so that the comparison of ‘before’ and ‘after’ scenarios uses the most up to date ‘before’ data.
It is envisaged that the baseline data will comprise the following:
Traffic journey times; Traffic flows – modal split and traffic counts; Bus service journey time reliability information (journey times, dwell times, delays); Bus patronage – at stops and on bus; Satisfaction surveys about public transport; Cycling and walking counts on corridors and off corridors; Public perception about cycling in Southampton and Hampshire through Sustrans BikeLife
project; Satisfaction with public realm; and Productivity, Socio-Demographic & Growth data.
Wherever possible SCC and HCC will use information already available from its own sources. Aas well as from rail and bus operators as part of the regular data gathering process. This will be in order to avoid incurring additional costs and adverse impacts on the public. It may also be necessary in certain instances to obtain some baseline data prior to the start of construction to ensure that construction activities do not impact on the validity of the baseline data.
Following implementation of the TCF Programme schemes, SCC and HCC will introduce a monitoring and evaluation regime in line with what is required by the DfT for their TCF Monitoring & Evaluation (M&E) Framework. The purpose of this regime will be to monitor performance of the system so as to ensure:
The schemes in the scenario are performing as intended; Any problems and/or possible improvements are identified; Key performance indicators are monitored; Established objectives for the TCF scenario are being achieved; and The TCF scenario continues to represent value for money.
The evaluation will enable the performance of the system to be continually optimised. Before the monitoring regime is introduced, consideration will be given to the availability of data, the practicality of obtaining it, whether it will properly reflect the indicators and the cost of obtaining it.
Depending on the approach taken by DfT’s across all TCF City Regions, it is proposed that monitoring of key data sets e.g. patronage and journey times would be conducted until at least one year after the TCF Programme completion as a minimum.
8.11.2 What the Southampton City Region is seeking to achieve through M&E
The purpose of the Southampton M&E regime will be to monitor performance of TCF funding so as to ensure:
The schemes in the scenario are performing as intended; Any problems and/or possible improvements are quickly identified, so that the delivery of the
projects can be progressively improved; Key performance indicators are monitored; The established themes in the TCF scenario are successfully achieved; The TCF scenario continues to represent value for money; and A clear insight is provided for future programmes, so that lessons can be expertly
disseminated.
206
CONNECTING SOUTHAMPTON CITY REGION TRANSFORMING CITIES FUND STRATEGIC OUTLINE BUSINESS CASE
8.11.3 Summary of Previous Experience of undertaking robust M&E
The SCR team fully appreciates the value of a comprehensive monitoring and evaluation regime and has an excellent track record of monitoring and evaluating the effectiveness of multi-faceted transport projects. In the last few years this has included both the South Hampshire LSTF (‘A Better Connected South Hampshire’) and the Southampton Access Fund (‘Southampton: Driving our Cycling Ambition into Local Towns, Schools, Colleges and Workplaces’).
Independent assessment of outputs and outcomes from LSTF and Access Fund has been carried out by the University of Southampton’s Transport Research Group (TRG). For TCF the TRG can be used to carry out independent analysis of the Programme, both at a programme level and at an individual scheme or corridor level. TRG have already carried out pre and post evaluation of SCN1 cycle routes.
8.11.4 The Proposed Approach There are eight key aspects to the way the Southampton City Region is approaching M&E. M&E will be the responsibility of the TCF Delivery Team working with SCC and HCC Strategic Transport Team (Bid Team) to ensure that the anticipated outputs and outcomes are as envisaged.
1. Best practice will be followed: look to ensure best practice is followed, using guidance, including any future DfT TCF M&E frameworks, such as: AECOM/pteg (2012) LSTF Monitoring and Evaluation Guidance – Final Report103, DfT (2012) Monitoring and Evaluation Framework for Local Authority Major Schemes104,
and The Tavistock Institute (2010) Guidance for Transport Impact Evaluations: Choosing an
Evaluation Approach to Achieve Better Attribution105. 2. There will be a clear base case: a clear base case against which performance can be
measured. Baseline data collection will be collected just prior to commencement of construction, so that the comparison of ‘before’ and ‘after’ scenarios uses the most up to date ‘before’ data.;
3. Changes will be made to the M&E framework as and when needed: If adjustments are needed to the monitoring, or additional metrics need to be added, then SCC & HCC will be prepared to make the necessary changes;
4. The M&E will be undertaken in close collaboration with the DfT-appointed consultants: there is value of consistency across the successful TCF areas. The SCR team will enthusiastically work with the consultants the DfT will appoint to manage the TCF monitoring and evaluation framework across all TCF City Regions. To help frame the discussions, the SCR team has identified a provisional set of metrics identified in the tables below.
5. The approach to M&E will be thorough, yet cost-effective: recognises the importance of having a robust monitoring framework but also the need to demonstrate value for money. Wherever possible the SCR team will use information already available from its own sources (including data both from Councils and bus operators), as part of the regular data gathering process, so as to avoid incurring additional costs and public irritation.
6. Further expertise will be called on if needed: Depending on the discussions that take place with the DfT-appointed consultants, one option available to the SCR team is to utilise the expertise and experience of the TRG. SCC and HCC have both worked very closely with the TRG over a number of years on transport research projects. TRG could easily be brought on board to provide expert, independent analysis for the TCF.
7. M&E will be carried out against all the main aspects of the TCF programme, including: Those outputs and outcomes identified in the logic map (Figure 7.1) where empirical
evidence is possible and practical
103 http://www.urbantransportgroup.org/system/files/general-docs/PTEG%20Monitoring%20and%20Evaluation%20Guidance%20Document%20FINAL.pdf 104 https://assets.publishing.service.gov.uk/government/uploads/system/uploads/attachment_data/file/9154/la-major-schemes-monitoring-evaluation.pdf 105 https://assets.publishing.service.gov.uk/government/uploads/system/uploads/attachment_data/file/525806/transport-impact-evaluations.pdf
207

CONNECTING SOUTHAMPTON CITY REGION TRANSFORMING CITIES FUND STRATEGIC OUTLINE BUSINESS CASE
The three key themes identified in Figure 3.21 (transforming mobility, transforming lifestyles and transforming gateways)
The overall TCF programme. 8. M&E will carry on after the completion of any physical works: It is proposed that monitoring of
key data sets like bus patronage and journey speeds would be conducted until at least one year after the TCF programme completion as a minimum. Naturally the SCR authorities will fully contribute to any evaluation and dissemination reports into the impacts of the TCF funding after the formal end of the programme.
These points are flexible and can be amended in line with the DfT’s TCF Montoring & Evaluation Framework when published.
During the TCF period the 2021 Census will take place, early outputs of this in 2022 will help to proide an update on some of the baseline socio-economic, origin and destination statistics.
8.11.4.1 Monitoring proposed to test the impact of Theme 1: Transforming Mobility It is proposed to monitor against five outcomes that collectively will transform mobility in the City Reigon as summarised in Table 8-4.
Please note: The tables below identify some potential criteria that will be considered for M&E. The precise criteria, data sources and monitoring techniques will be finalised in the detailed Monitoring and Evaluation framework that will drawn up in conjunction with the DfT–appointed consultants.
There is always a concern that non-TCF factors will influence some of the metrics. As far as possible, surveys and monitoring techniques will be carefully chosen to measure the aspects that specifically relate to TCF investment rather than any wider changes that are taking place. This includes coordination with other roadworks, neutral months, times of day etc.
Desired Outcomes Potential Criteria that will be considered
Measures and improvements that secure 11% more public transport
journeys
The number of high quality bus corridors completed Overall bus patronage The number of fare paying passengers using the bus Bus passenger satisfaction levels The number of bus priority interventions carried out Patronage of the new Demand Responsive Transport service A reduction on the demand for car parking in Southampton City
Centre
Reduced end to end bus journey times and improved service
reliability
The variability of journey times on the local road network The average speed of buses The percentage of non-frequent buses running on time The length of bus network with average speeds below 10kmph Surveys of waiting times (to assess changes to bus excess
waiting times) Checks of bus timetables (to see if improved journey times lead
to changes in scheduled bus journey times) Productivity boosted by a 2% reduction in the regional gap
GVA compared to both the South-East and the whole of the UK GVA compared to pre-TCF levels
For our most deprived communities to be better
connected with our economic drivers
New jobs created in the most deprived wards The level of youth unemployment in the most deprived wards Changes in the no. of NEETS in the most deprived wards
For sustainable economic growth to be supported in the SCR
The rate of staff turnover for local businesses in the SCR The number of job vacancies in the SCR
Table 8-4 – Outcomes for Theme 1 (Transforming Mobility)
To complement the above, consideration will be given to additionally monitor whether TCF investment has:
Reduced transport greenhouse gas emissions and NOx levels; and Improved the level of self-containment.
208

CONNECTING SOUTHAMPTON CITY REGION TRANSFORMING CITIES FUND STRATEGIC OUTLINE BUSINESS CASE
8.4.11.2 Monitoring proposed to test the impact of Theme 2: Transforming Lifestyles To test the success of this theme, two desired outcomes will be monitored against, as shown in Table 8-5:
Desired Outcomes Potential Criteria that will be considered The level of cycling activity Modal split
Cycling’s mode share to be The length of SCN cycle route completed increased by 10%, through the The number of full SCN routes completed
delivery of 80km of the The number of cycle crossings installed Southampton Cycleway Network The number of Active Travel Zones implemented
Types of interventions in ATZs Number of people engaged through ATZ process
Improved Air Quality
The number of AQMAs along the TCF corridors The trend for NOx levels along the TCF corridors
Table 8-5 - Outcomes for Theme 2 (Transforming Lifestyles)
To complement the above, consideration will be given to additionally monitor whether TCF investment has:
Made it proportionately safer to walk and cycle on the TCF corridors; Made the public more positive about the investments made in cycling (public perception about
cycling in Southampton and Hampshire will be monitored through the BikeLife project); Encouraged more people to walk; Level of participation in physical activity; Reduced the number of children in the City Region that are classified as obese; Reduced traffic noise along the key TCF corridors; and Reduced inequalities through the implementation of a number of accessibility schemes.
8.11.4.3 Monitoring proposed to test the impact of Theme 3: Transforming Gateways To test the success of this theme, monitoring of two outcomes is proposed as shown in Table 8-6:
Desired Outcomes Potential Criteria that will be considered Improved Satisfaction with the
public realm
Satisfaction surveys Footfall surveys in City Centre
The number of Local Mobility Hubs implemented The opening of the Southampton West Park & Ride and
Easier multi-modal journeys Bitterne Park & Travel, and patronage of them Completion of a multi-modal interchange at Southampton
General Station The uptake of the new park & rail car park ticketing product
Table 8-6 – Outcomes for Theme 3 (Transforming Gateways)
8.12. Benefits realisation plan Benefits realisation management is an integral part of SCC and HCC’s Project Management Gateway process. This ensures that all projects and programmes maximise benefits at project inception, and that these benefits are realised as the project is developed and implemented. All benefits from the TCF Programme will be achieved from scheme implementation; monitoring programmes as described in 8.11 will be proportional to the scale and type of the scheme will be in place to ensure benefits are realised. The programme level monitoring will provide an overall benefit realistaion plan for the Southampton City Region TCF Programme.
209

CONNECTING SOUTHAMPTON CITY REGION TRANSFORMING CITIES FUND STRATEGIC OUTLINE BUSINESS CASE
210