Embed Size (px)
Citation preview
Transforming & Expanding
Chemicals
José Luis Bernal ED REPSOL CHEMICALS
Disclaimer
3
ALL RIGHTS ARE RESERVED © REPSOL, S.A. 2019 The information included in this document is published pursuant to the provision of article 226 of the Spanish Securities Market Law. This document contains statements that Repsol believes constitute forward-looking statements which may include statements regarding the intent, belief, or current expectations of Repsol and its management, including statements with respect to trends affecting Repsol’s financial condition, financial ratios, results of operations, business, strategy, geographic concentration, production volume and reserves, capital expenditures, costs savings, investments and dividend payout policies. These forward-looking statements may also include assumptions regarding future economic and other conditions, such as future crude oil and other prices, refining and marketing margins and exchange rates and are generally identified by the words “expects”, “anticipates”, “forecasts”, “believes”, estimates”, “notices” and similar expressions. These statements are not guarantees of future performance, prices, margins, exchange rates or other events and are subject to material risks, uncertainties, changes and other factors which may be beyond Repsol’s control or may be difficult to predict. Within those risks are those factors described in the filings made by Repsol and its affiliates with the “Comisión Nacional del Mercado de Valores” in Spain and with any other supervisory authority of those markets where the securities issued by Repsol and/or its affiliates are listed. Repsol does not undertake to publicly update or revise these forward-looking statements even if experience or future changes make it clear that the projected performance, conditions or events expressed or implied therein will not be realized. Some of the figures included in this document are considered Alternative Performance Measures (APM) in accordance with the guidelines of the European Securities and Markets Authority (ESMA). Further information on APMs (definition, purpose, reconciliation with financial statement figures) may be found on Repsol´s corporate website. This document does not constitute an offer or invitation to purchase or subscribe shares, pursuant to the provisions of the Royal Legislative Decree 4/2015 of the 23rd of October approving the recast text of the Spanish Securities Market Law and its implementing regulations. In addition, this document does not constitute an offer to purchase, sell, or exchange, neither a request for an offer of purchase, sale or exchange of securities in any other jurisdiction. The information contained in the document has not been verified or revised by the External Auditors of Repsol.
4
Downstream Strategy & Chemicals
Repsol Chemicals: Position
Repsol Chemicals: Transformation
and Resilience
Repsol Chemicals: Strategy
AGENDA
5
Downstream Strategy & Chemicals
Repsol Chemicals: Position
Repsol Chemicals: Transformation and
Resilience
Repsol Chemicals: Strategy
AGENDA
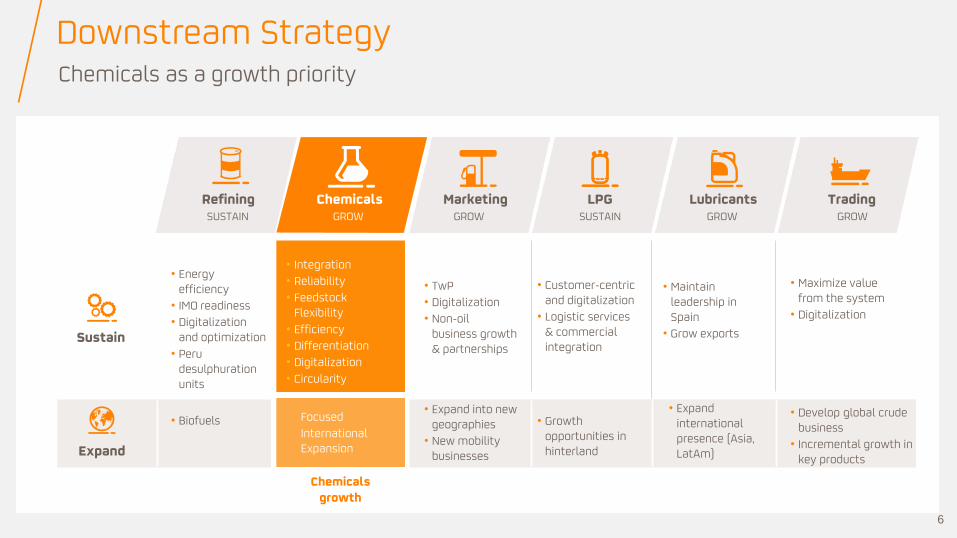
Downstream Strategy Chemicals as a growth priority
6
Chemicals Marketing Trading Lubricants LPG Refining SUSTAIN GROW
GROW SUSTAIN GROW GROW
Sustain
Expand
• Energy efficiency
• IMO readiness
• Digitalization and optimization
• Peru desulphuration units
• Integration
• Reliability
• Feedstock Flexibility
• Efficiency
• Differentiation
• Digitalization
• Circularity
• TwP
• Digitalization
• Non-oil business growth & partnerships
• Customer-centric and digitalization
• Logistic services & commercial integration
• Maintain leadership in Spain
• Grow exports
• Maximize value from the system
• Digitalization
• Biofuels
Focused
International Expansion
• Expand into new geographies
• New mobility businesses
• Growth opportunities in hinterland
• Expand international presence (Asia, LatAm)
• Develop global crude business
• Incremental growth in key products
Chemicals growth
7
Source: WoodMackenzie
Repsol Chemicals Growing Demand and Alignment with Energy Transition based on an Efficient & Integrated Business
Propylene Benzene Butadiene
ABSOLUTE GROWTH (Mt)
CAGR GLOBAL (%)
+3,8 CAGR BY REGION (%)
+2
ASIA
+6
ME&AF
+24
LATAM
+39
NA EUROPE
Ethylene
+3,5 +3,3 +2,0 +1,8
+3,2 +3,4 +1,0
+0,4
PERIOD 2019- 2025
~40 Mt/y of Ethylene new production needed in next 6 years (equivalent to ~45 new Steam Crackers of 1 Mt/y capacity at 90% utilization rate)
GLOBAL DEMAND OF SELECTED BASE CHEMICALS (Mt/y) 2007-2025
3,1%
3,2%
2007 2019 2020 2025
10
40 69
115
337 12 50
110
167
237
410 14
56
134
Ethylene
Propylene
Benzene
Butadiene
RATIONAL for Chemicals Growth
Growing Demand 01
Aligned with Energy Transition 02
Efficient & Integrated Business 03
347 12 51
114
173 206
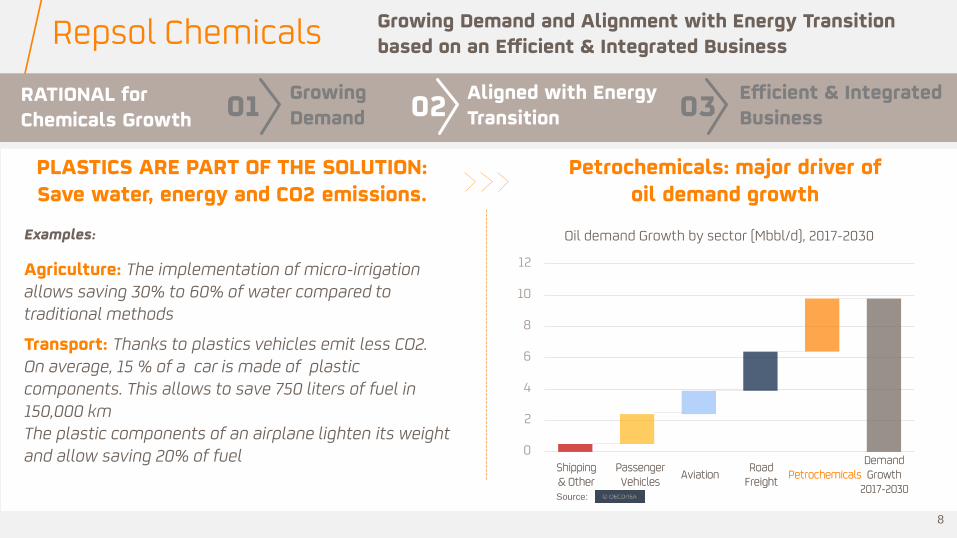
Agriculture: The implementation of micro-irrigation allows saving 30% to 60% of water compared to traditional methods
Transport: Thanks to plastics vehicles emit less CO2. On average, 15 % of a car is made of plastic components. This allows to save 750 liters of fuel in 150,000 km The plastic components of an airplane lighten its weight and allow saving 20% of fuel
PLASTICS ARE PART OF THE SOLUTION: Save water, energy and CO2 emissions.
Examples:
Petrochemicals: major driver of oil demand growth
RATIONAL for Chemicals Growth
Growing Demand 01
Aligned with Energy Transition 02
Efficient & Integrated Business 03
Repsol Chemicals Growing Demand and Alignment with Energy Transition based on an Efficient & Integrated Business
0
2
4
6
8
10
12
Oil demand Growth by sector (Mbbl/d), 2017-2030
Shipping & Other
Passenger Vehicles
Aviation Road
Freight Petrochemicals
Demand Growth
2017-2030
8
Source:
9
Downstream Strategy & Chemicals
Repsol Chemicals: Position
Repsol Chemicals: Transformation and
Resilience
Repsol Chemicals: Strategy
AGENDA
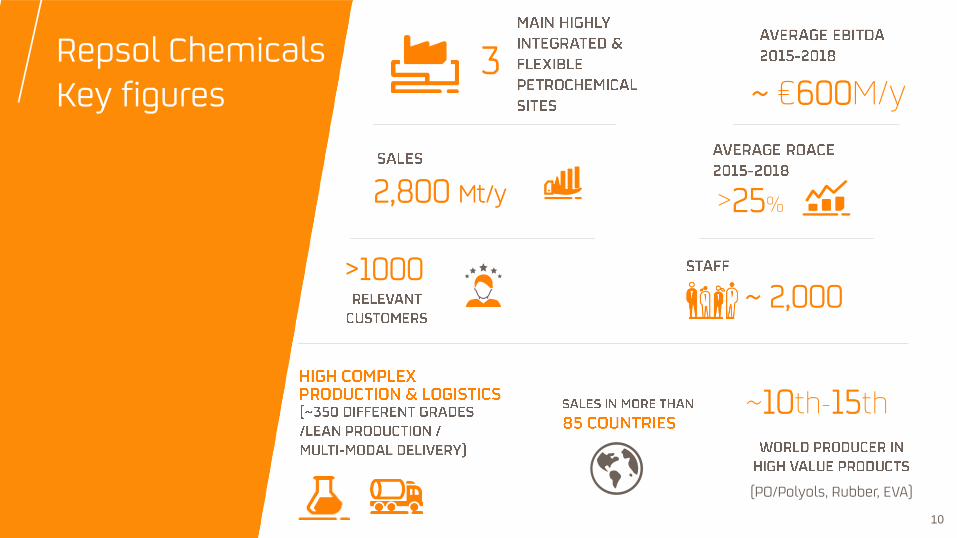
Repsol Chemicals Key figures
3
>1000
(PO/Polyols, Rubber, EVA)
~ €600M/y
>25% 2,800 Mt/y
~ 2,000
~10th-15th
10
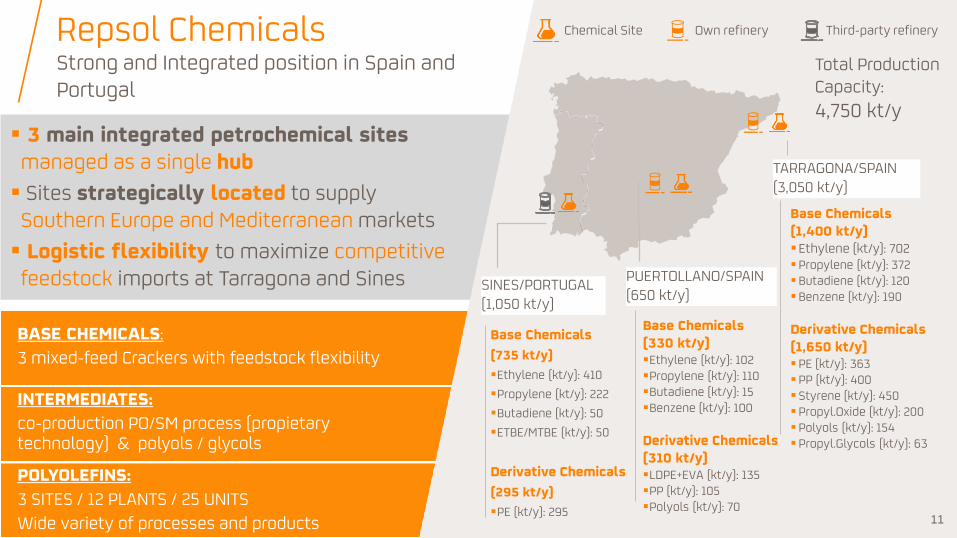
Repsol Chemicals Strong and Integrated position in Spain and Portugal
3 main integrated petrochemical sites managed as a single hub
Sites strategically located to supply Southern Europe and Mediterranean markets
Logistic flexibility to maximize competitive feedstock imports at Tarragona and Sines
Third-party refinery Own refinery Chemical Site
POLYOLEFINS:
3 SITES / 12 PLANTS / 25 UNITS
Wide variety of processes and products
BASE CHEMICALS:
3 mixed-feed Crackers with feedstock flexibility
INTERMEDIATES:
co-production PO/SM process (propietary technology) & polyols / glycols
TARRAGONA/SPAIN (3,050 kt/y)
Base Chemicals (1,400 kt/y) Ethylene (kt/y): 702 Propylene (kt/y): 372 Butadiene (kt/y): 120 Benzene (kt/y): 190
Derivative Chemicals (1,650 kt/y) PE (kt/y): 363 PP (kt/y): 400 Styrene (kt/y): 450 Propyl.Oxide (kt/y): 200 Polyols (kt/y): 154 Propyl.Glycols (kt/y): 63
PUERTOLLANO/SPAIN (650 kt/y)
SINES/PORTUGAL (1,050 kt/y)
Base Chemicals
(735 kt/y)
Ethylene (kt/y): 410
Propylene (kt/y): 222
Butadiene (kt/y): 50
ETBE/MTBE (kt/y): 50
Derivative Chemicals
(295 kt/y)
PE (kt/y): 295
Base Chemicals (330 kt/y) Ethylene (kt/y): 102 Propylene (kt/y): 110 Butadiene (kt/y): 15 Benzene (kt/y): 100
Derivative Chemicals (310 kt/y) LDPE+EVA (kt/y): 135 PP (kt/y): 105 Polyols (kt/y): 70
Total Production Capacity:
4,750 kt/y
11
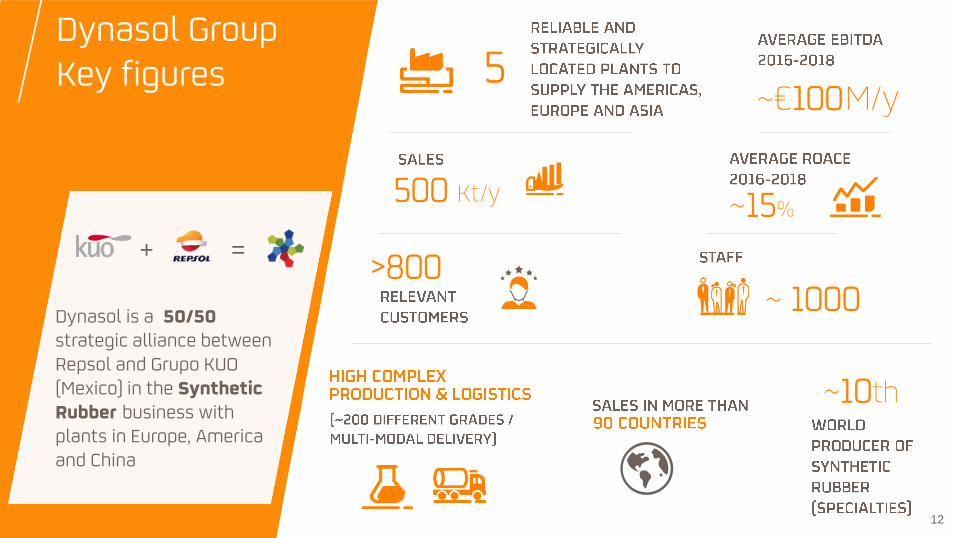
Dynasol Group Key figures 5
>800
~10th
~€100 M/y
~15% 500 Kt/y
~ 1000 Dynasol is a 50/50 strategic alliance between Repsol and Grupo KUO (Mexico) in the Synthetic Rubber business with plants in Europe, America and China
+ =
12
Dynasol Group World reference in Synthetic Rubber
One of the largest producer
in the world (10th) of Synthetic Rubber based on Styrene and Butadiene
and the 2nd largest
producer of Rubber Chemicals in Europe
DYNASOL-GPRO, NANJING
Rubber (kt/y): 30 NBR
CHINA (JV 50%) (130 kt/y)
Rubber (kt/y): 100 (SBS + BR + sSBR)
Accelerators (kt/y): 35
Rubber (kt/y): 120 SBS + SEBS + BR + sSBR
Rubber (kt/y): 110 SBS + SEBS + BR + sSBR
Rubber (kt/y): 130 eSBR + NBR
MEXICO (240 kt/y)
ÁLAVA
SANTANDER DYNASOL-CNGC, LIANOING
SPAIN (155 kt/y)
ALTAMIRA
Total Production Capacity:
525 kt/y
13
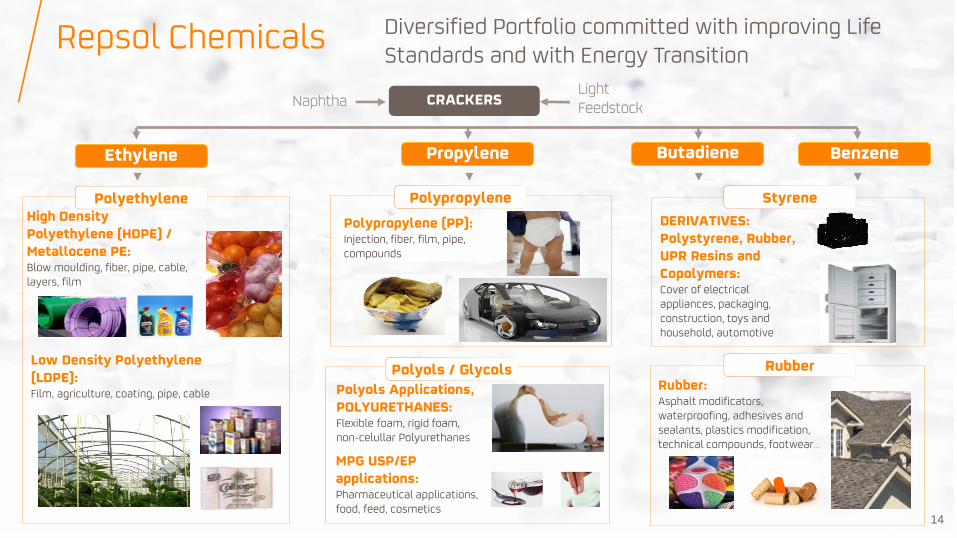
Diversified Portfolio committed with improving Life Standards and with Energy Transition
14
Repsol Chemicals
High Density Polyethylene (HDPE) / Metallocene PE: Blow moulding, fiber, pipe, cable, layers, film
Low Density Polyethylene (LDPE): Film, agriculture, coating, pipe, cable
Polypropylene (PP): Injection, fiber, film, pipe, compounds
Polyols Applications, POLYURETHANES: Flexible foam, rigid foam, non-celullar Polyurethanes
DERIVATIVES: Polystyrene, Rubber, UPR Resins and Copolymers: Cover of electrical appliances, packaging, construction, toys and household, automotive
Rubber: Asphalt modificators, waterproofing, adhesives and sealants, plastics modification, technical compounds, footwear…
CRACKERS
Ethylene Propylene Benzene Butadiene
Polyethylene Polypropylene
Polyols / Glycols
MPG USP/EP applications: Pharmaceutical applications, food, feed, cosmetics
Styrene
Naphtha Light Feedstock
Rubber
15
Downstream Strategy & Chemicals
Repsol Chemicals: Position
Repsol Chemicals: Transformation and
Resilience
Repsol Chemicals: Strategy
AGENDA
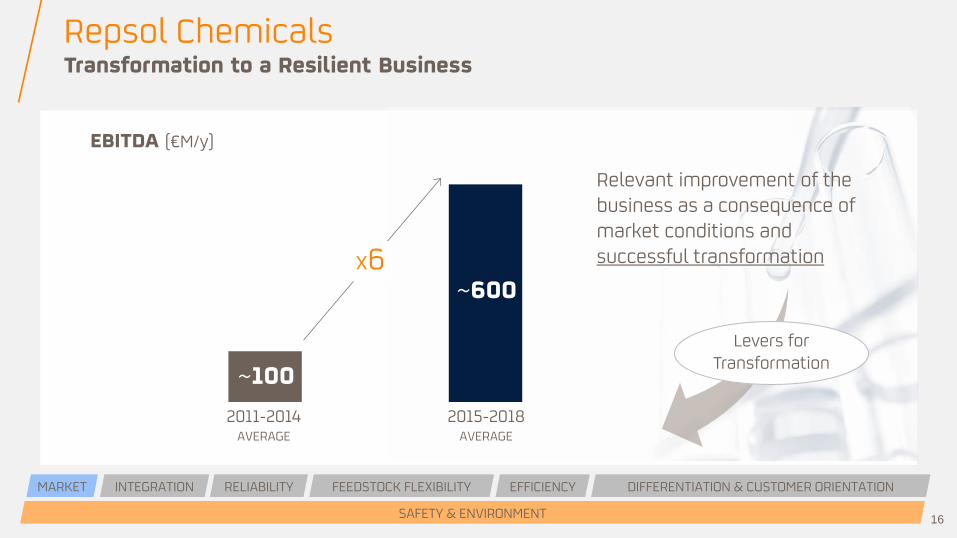
Transformation to a Resilient Business
16
2011-2014
AVERAGE
EBITDA (€M/y)
Relevant improvement of the business as a consequence of market conditions and successful transformation
~600
2015-2018 AVERAGE
Levers for Transformation
MARKET RELIABILITY FEEDSTOCK FLEXIBILITY EFFICIENCY DIFFERENTIATION & CUSTOMER ORIENTATION
SAFETY & ENVIRONMENT
INTEGRATION
x6
Repsol Chemicals
~100
Levers for transformation
17
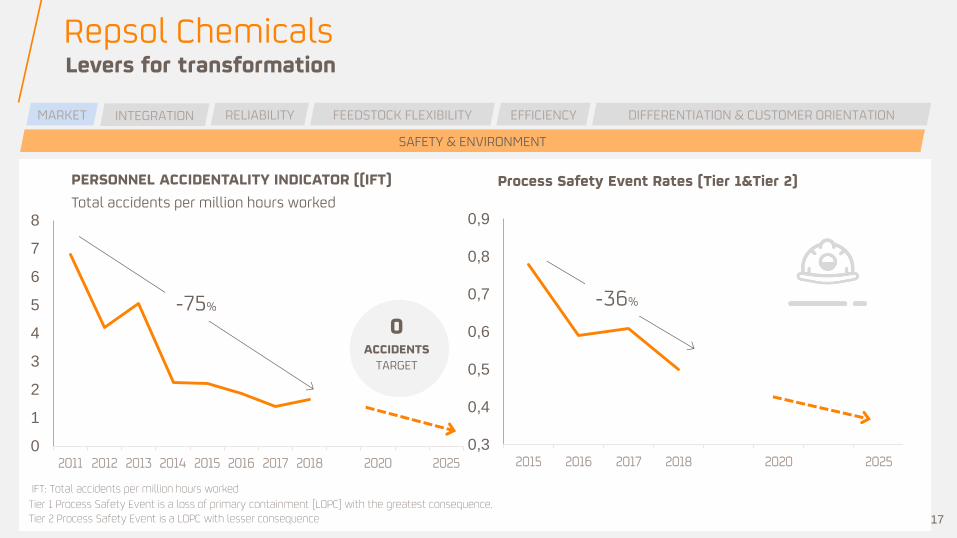
Repsol Chemicals
PERSONNEL ACCIDENTALITY INDICATOR ((IFT)
Total accidents per million hours worked
0
1
2
3
4
5
6
7
8
2011 2012 2013 2014 2015 2016 2017 2018 2020 2025
0 ACCIDENTS
TARGET
-75%
Process Safety Event Rates (Tier 1&Tier 2)
IFT: Total accidents per million hours worked
Tier 1 Process Safety Event is a loss of primary containment (LOPC) with the greatest consequence. Tier 2 Process Safety Event is a LOPC with lesser consequence
0,3
0,4
0,5
0,6
0,7
0,8
0,9
2015 2016 2017 2018 2020 2025
-36%
MARKET RELIABILITY FEEDSTOCK FLEXIBILITY EFFICIENCY DIFFERENTIATION & CUSTOMER ORIENTATION
SAFETY & ENVIRONMENT
INTEGRATION
18
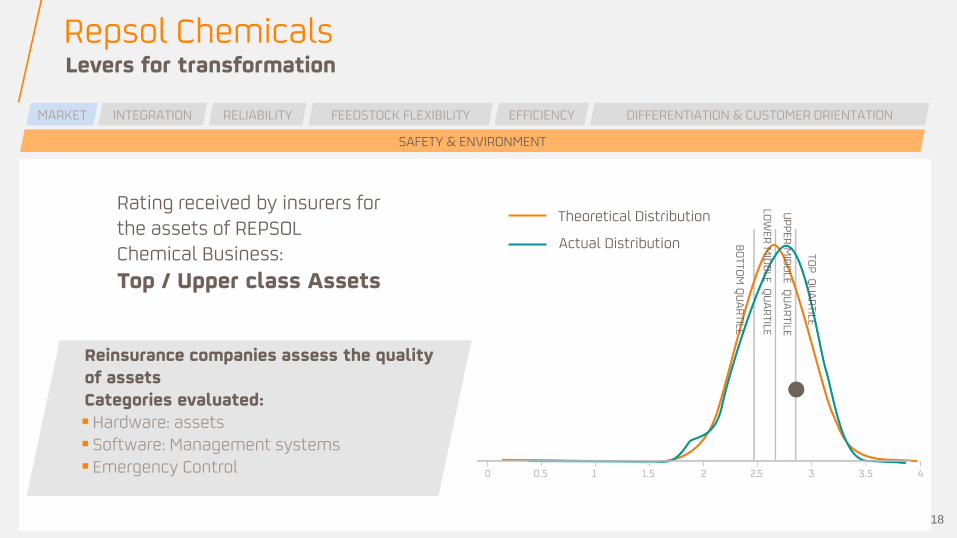
Reinsurance companies assess the quality of assets Categories evaluated: Hardware: assets Software: Management systems Emergency Control
BO
TTOM
QU
AR
TILE
LOW
ER M
IDD
LE QU
AR
TILE
UP
PER
MID
DLE Q
UA
RTILE
TOP
QU
AR
TILE
Actual Distribution
Theoretical Distribution Rating received by insurers for the assets of REPSOL Chemical Business:
Top / Upper class Assets
MARKET RELIABILITY FEEDSTOCK FLEXIBILITY EFFICIENCY DIFFERENTIATION & CUSTOMER ORIENTATION
SAFETY & ENVIRONMENT
INTEGRATION
Levers for transformation Repsol Chemicals
19 2011 2012 2013 2014 2015 2016 2017 2018 2020 2025
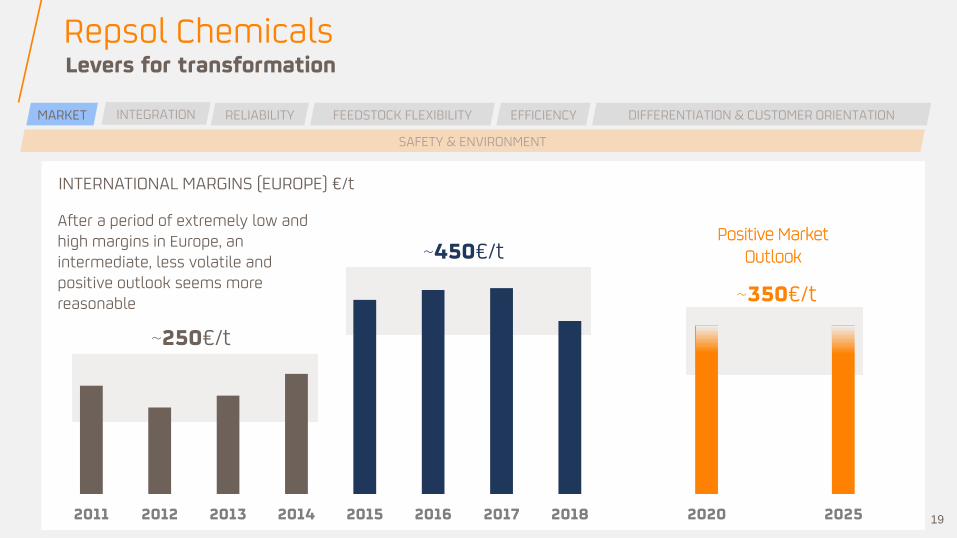
INTERNATIONAL MARGINS (EUROPE) €/t
~250€/t
~450€/t
~350€/t
Positive Market Outlook
After a period of extremely low and high margins in Europe, an intermediate, less volatile and positive outlook seems more reasonable
MARKET RELIABILITY FEEDSTOCK FLEXIBILITY EFFICIENCY DIFFERENTIATION & CUSTOMER ORIENTATION
SAFETY & ENVIRONMENT
INTEGRATION
Levers for transformation Repsol Chemicals
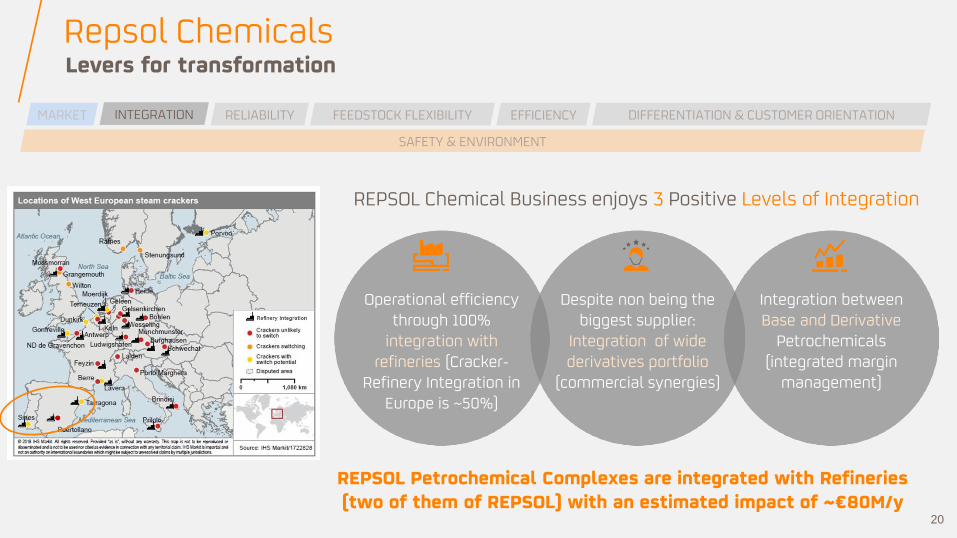
REPSOL Petrochemical Complexes are integrated with Refineries (two of them of REPSOL) with an estimated impact of ~€80M/y
MARKET RELIABILITY FEEDSTOCK FLEXIBILITY EFFICIENCY DIFFERENTIATION & CUSTOMER ORIENTATION
SAFETY & ENVIRONMENT
INTEGRATION
REPSOL Chemical Business enjoys 3 Positive Levels of Integration
Levers for transformation Repsol Chemicals
Operational efficiency through 100%
integration with refineries (Cracker-
Refinery Integration in Europe is ~50%)
Integration between Base and Derivative
Petrochemicals (integrated margin
management)
Despite non being the biggest supplier:
Integration of wide derivatives portfolio
(commercial synergies)
20
2020 20252011 Current21
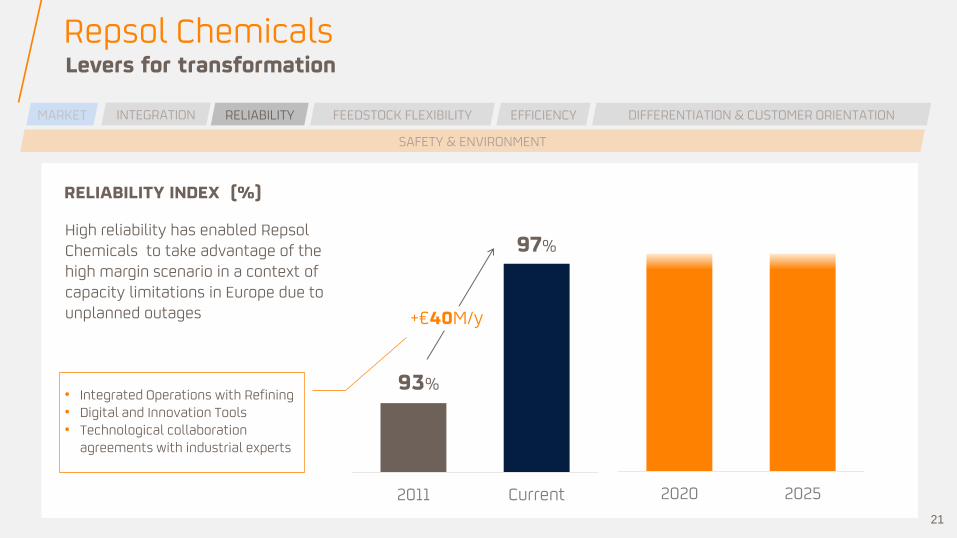
RELIABILITY INDEX (%)
+€40M/y
High reliability has enabled Repsol Chemicals to take advantage of the high margin scenario in a context of capacity limitations in Europe due to unplanned outages
93%
97%
• Integrated Operations with Refining • Digital and Innovation Tools • Technological collaboration
agreements with industrial experts
MARKET RELIABILITY FEEDSTOCK FLEXIBILITY EFFICIENCY DIFFERENTIATION & CUSTOMER ORIENTATION
SAFETY & ENVIRONMENT
INTEGRATION
Levers for transformation Repsol Chemicals
2011 Current 2020 2025
22
LIGHT FEEDSTOCK TO CRACKERS – LPG´s (%)
+€50M/y
% Light Feedstock: Crackers have evolved to get a ~35% light feedstock with potential to reach ~60 %
8%
40%
~50%
~ 60%
Investments in logistics and units (splitters, … ) to allow increased regular supply of LPG´s
MARKET RELIABILITY FEEDSTOCK FLEXIBILITY EFFICIENCY DIFFERENTIATION & CUSTOMER ORIENTATION
SAFETY & ENVIRONMENT
INTEGRATION
Ref. Europe: 25 %
Levers for transformation Repsol Chemicals
23
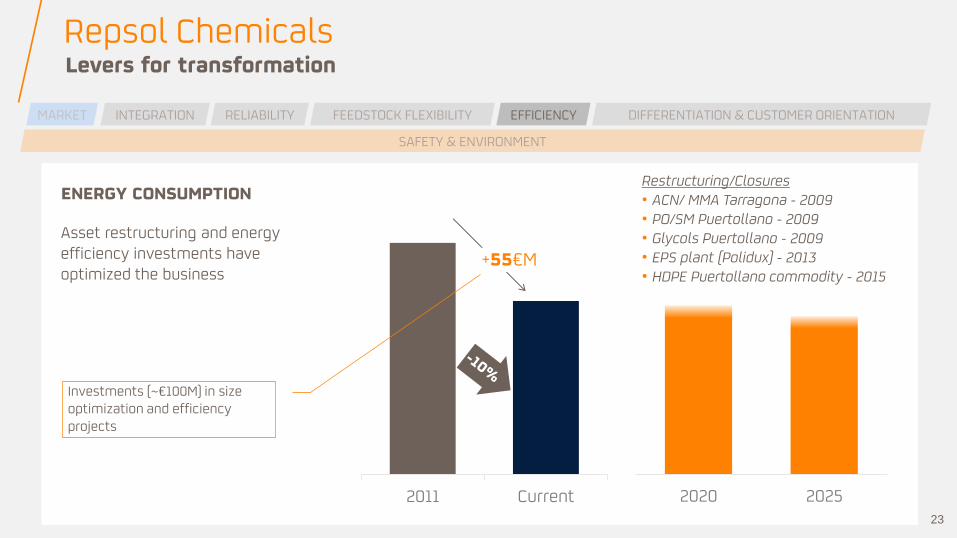
ENERGY CONSUMPTION
Asset restructuring and energy efficiency investments have optimized the business
2011 Current 2020 2025
+55€M
Restructuring/Closures • ACN/ MMA Tarragona - 2009 • PO/SM Puertollano - 2009 • Glycols Puertollano - 2009 • EPS plant (Polidux) - 2013 • HDPE Puertollano commodity - 2015
Investments (~€100M) in size optimization and efficiency projects
MARKET RELIABILITY FEEDSTOCK FLEXIBILITY EFFICIENCY DIFFERENTIATION & CUSTOMER ORIENTATION
SAFETY & ENVIRONMENT
INTEGRATION
Levers for transformation Repsol Chemicals
24
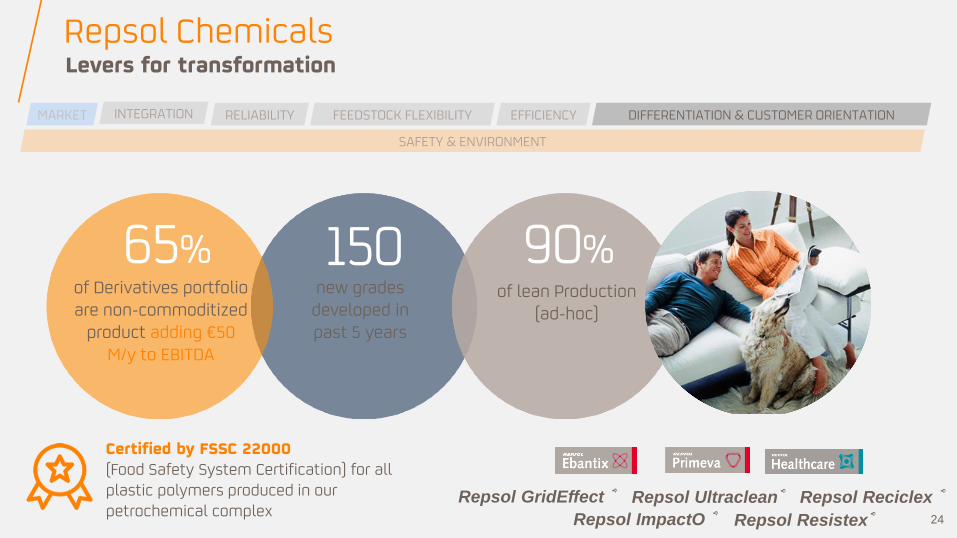
Repsol GridEffect ®
Repsol Resistex®
Repsol Reciclex ®
Repsol ImpactO ®
Repsol Ultraclean®
Certified by FSSC 22000 (Food Safety System Certification) for all plastic polymers produced in our petrochemical complex
new grades developed in past 5 years
150 of lean Production
(ad-hoc)
90% 65% of Derivatives portfolio are non-commoditized
product adding €50 M/y to EBITDA
MARKET RELIABILITY FEEDSTOCK FLEXIBILITY EFFICIENCY DIFFERENTIATION & CUSTOMER ORIENTATION
SAFETY & ENVIRONMENT
INTEGRATION
Levers for transformation Repsol Chemicals
25
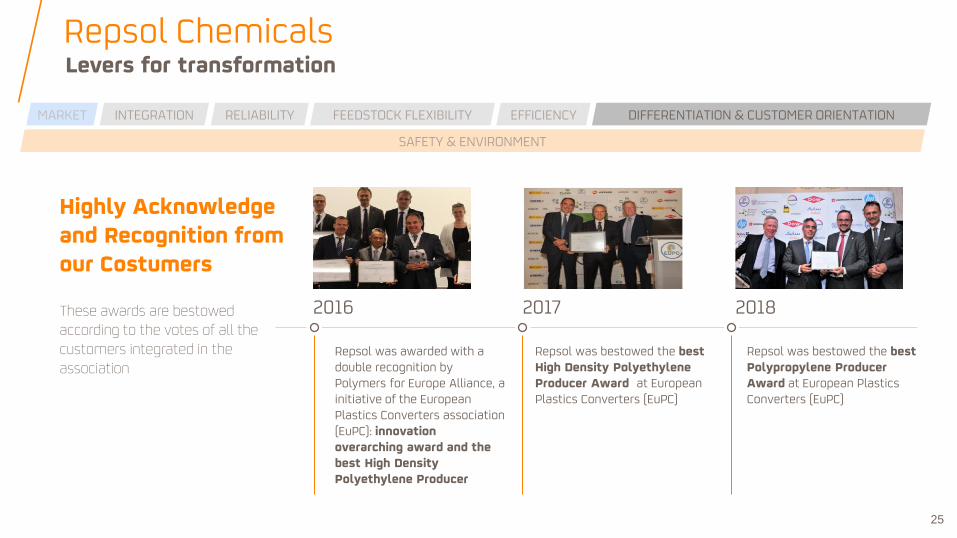
Repsol was awarded with a double recognition by Polymers for Europe Alliance, a initiative of the European Plastics Converters association (EuPC): innovation overarching award and the best High Density Polyethylene Producer
Repsol was bestowed the best High Density Polyethylene Producer Award at European Plastics Converters (EuPC)
Repsol was bestowed the best Polypropylene Producer Award at European Plastics Converters (EuPC)
2016 2017 2018
Highly Acknowledge and Recognition from our Costumers These awards are bestowed according to the votes of all the customers integrated in the association
MARKET RELIABILITY FEEDSTOCK FLEXIBILITY EFFICIENCY DIFFERENTIATION & CUSTOMER ORIENTATION
SAFETY & ENVIRONMENT
INTEGRATION
Levers for transformation Repsol Chemicals
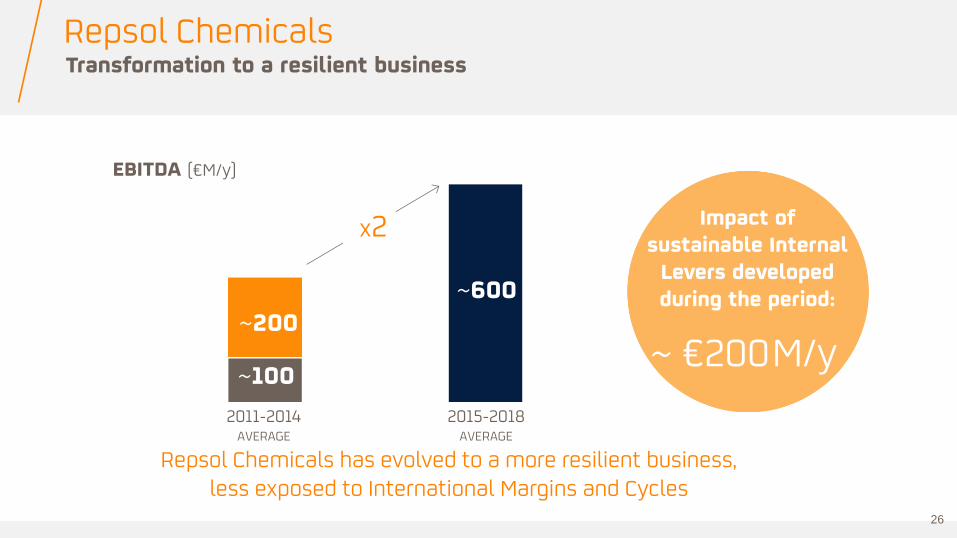
Impact of sustainable Internal
Levers developed during the period:
~ €200 M/y
Repsol Chemicals has evolved to a more resilient business, less exposed to International Margins and Cycles
2011-2014
AVERAGE
EBITDA (€M/y)
~600
2015-2018 AVERAGE
x2
~100
~200
Transformation to a resilient business Repsol Chemicals
26
27
Downstream Strategy & Chemicals
Repsol Chemicals: Position
Repsol Chemicals: Transformation and
Resilience
Repsol Chemicals: Strategy
AGENDA
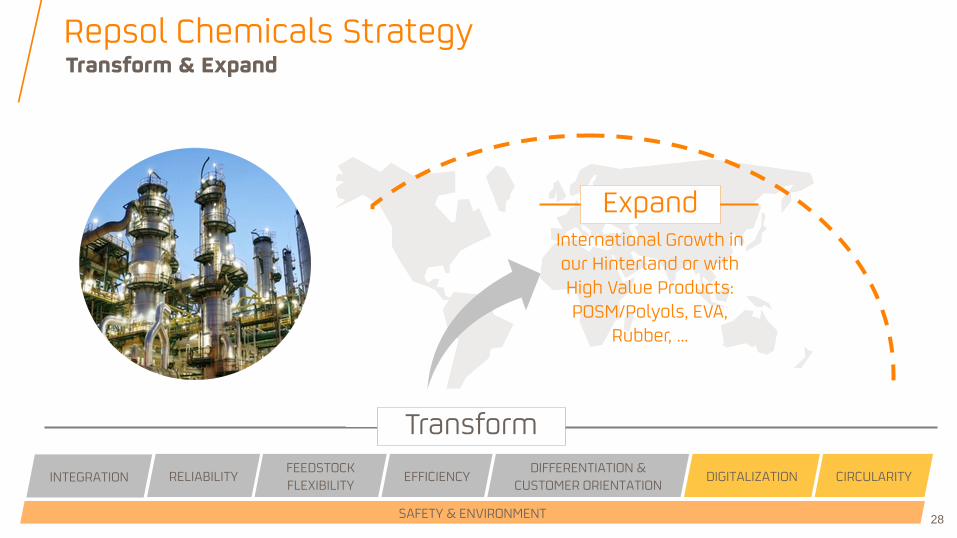
International Growth in our Hinterland or with High Value Products: POSM/Polyols, EVA,
Rubber, …
Transform
RELIABILITY FEEDSTOCK FLEXIBILITY
EFFICIENCY DIFFERENTIATION &
CUSTOMER ORIENTATION
SAFETY & ENVIRONMENT
INTEGRATION DIGITALIZATION CIRCULARITY
Expand
Transform & Expand Repsol Chemicals Strategy
28
29
Present 2020 2025
~600
~1,000
Expand: International Growth
Transform
EBITDA (€M/y) (x2)
~500 Transform CAPEX: €50M/y
Base CAPEX: €50M/y
Base CAPEX: €50M/y
Transform CAPEX: €50M/y
Expand CAPEX: 1500€M
Ambitious Targets Repsol Chemicals Strategy
30
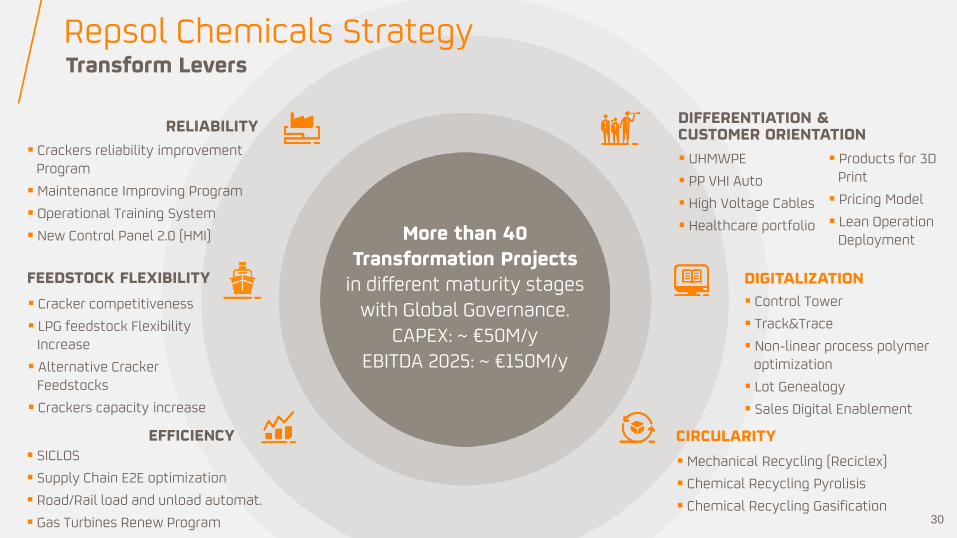
RELIABILITY
FEEDSTOCK FLEXIBILITY
EFFICIENCY
DIFFERENTIATION & CUSTOMER ORIENTATION
Crackers reliability improvement Program
Maintenance Improving Program
Operational Training System
New Control Panel 2.0 (HMI)
Cracker competitiveness
LPG feedstock Flexibility Increase
Alternative Cracker Feedstocks
Crackers capacity increase
SICLOS
Supply Chain E2E optimization
Road/Rail load and unload automat.
Gas Turbines Renew Program
UHMWPE
PP VHI Auto
High Voltage Cables
Healthcare portfolio
Control Tower
Track&Trace
Non-linear process polymer optimization
Lot Genealogy
Sales Digital Enablement
Mechanical Recycling (Reciclex)
Chemical Recycling Pyrolisis
Chemical Recycling Gasification
More than 40 Transformation Projects
in different maturity stages with Global Governance.
CAPEX: ~ €50M/y EBITDA 2025: ~ €150M/y
DIGITALIZATION
CIRCULARITY
Products for 3D Print
Pricing Model
Lean Operation Deployment
Transform Levers Repsol Chemicals Strategy
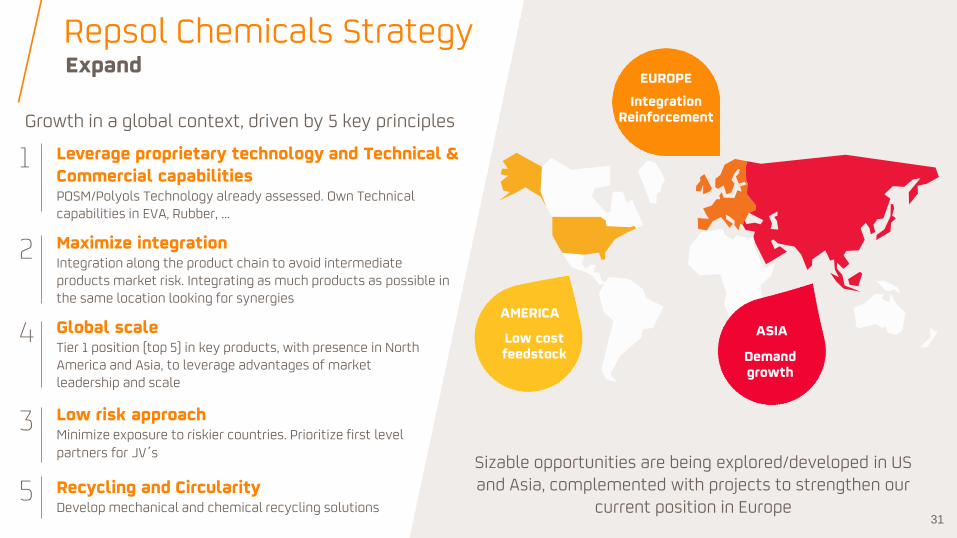
Growth in a global context, driven by 5 key principles
Leverage proprietary technology and Technical & Commercial capabilities POSM/Polyols Technology already assessed. Own Technical capabilities in EVA, Rubber, …
Maximize integration Integration along the product chain to avoid intermediate products market risk. Integrating as much products as possible in the same location looking for synergies
Low risk approach Minimize exposure to riskier countries. Prioritize first level partners for JV´s
Global scale Tier 1 position (top 5) in key products, with presence in North America and Asia, to leverage advantages of market leadership and scale
Recycling and Circularity Develop mechanical and chemical recycling solutions
1
2
3
4
5
AMERICA
Low cost feedstock
EUROPE
Integration Reinforcement
ASIA
Demand growth
Sizable opportunities are being explored/developed in US and Asia, complemented with projects to strengthen our
current position in Europe
Expand Repsol Chemicals Strategy
31
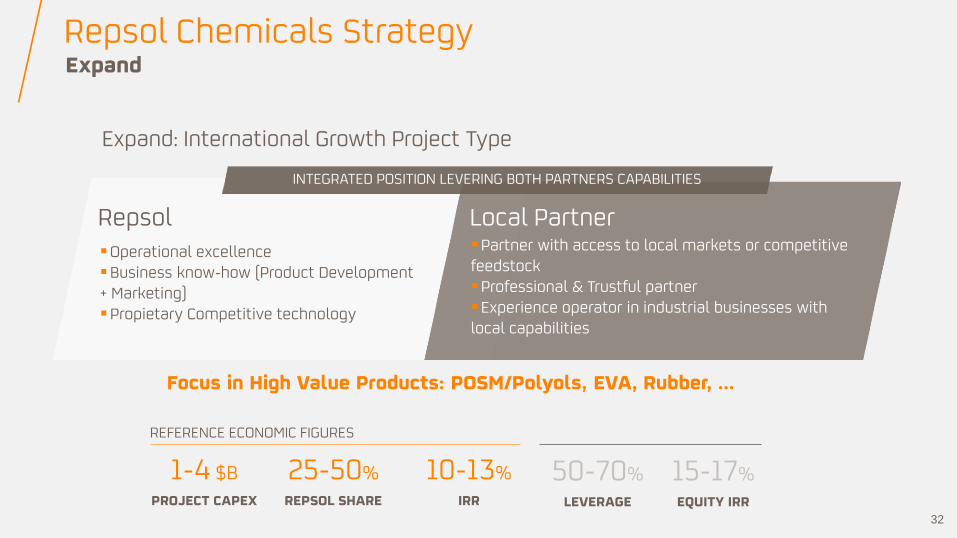
Expand: International Growth Project Type
32
Operational excellence Business know-how (Product Development + Marketing) Propietary Competitive technology
Local Partner
1-4 $B PROJECT CAPEX
25-50% REPSOL SHARE
10-13% IRR
50-70% LEVERAGE
15-17% EQUITY IRR
REFERENCE ECONOMIC FIGURES
Repsol
Focus in High Value Products: POSM/Polyols, EVA, Rubber, …
INTEGRATED POSITION LEVERING BOTH PARTNERS CAPABILITIES
Partner with access to local markets or competitive feedstock Professional & Trustful partner Experience operator in industrial businesses with local capabilities
Expand Repsol Chemicals Strategy
Key messages
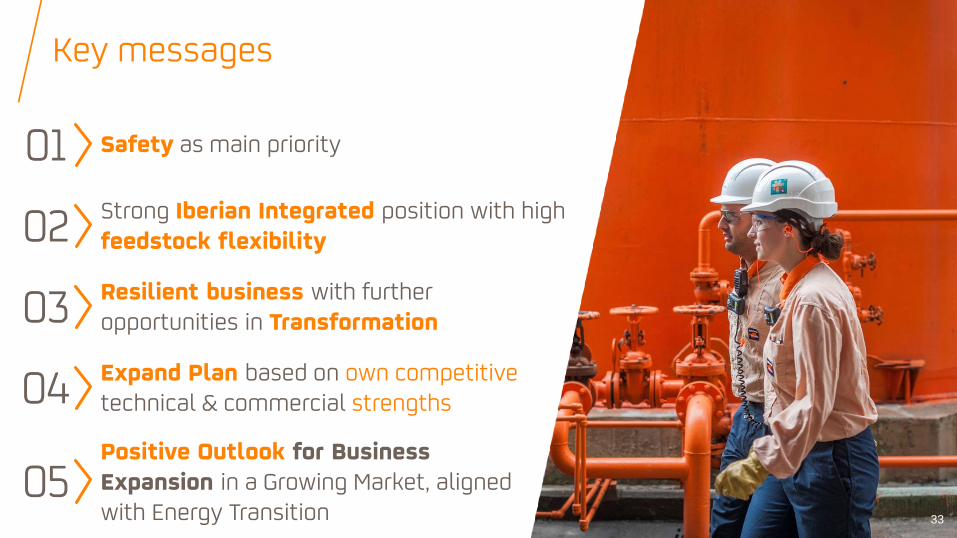
Safety as main priority
Resilient business with further opportunities in Transformation
Strong Iberian Integrated position with high feedstock flexibility
Expand Plan based on own competitive technical & commercial strengths
Positive Outlook for Business Expansion in a Growing Market, aligned with Energy Transition
01
02
03
04
05 33


![[1st Featured Article] Smart Community Projects · Smart Community Projects Transforming the Global Energy System “Smart Communities” focus on expanding the use of renewable energy](https://img.pdfslide.us/doc/110x75/5e89eeeb9a3f075c4505d3e3/1st-featured-article-smart-community-smart-community-projects-transforming-the.jpg)