Embed Size (px)
Citation preview
1
Transformer Health Indices and Probability of Failure
Reynold Cornell, AEPCarey Schneider, AEP
Tony McGrail, Doble EngineeringMatt Kennedy, Doble
EngineeringKen Kopechanski, CEATI
International Inc.
CIGRE GoTFCleveland, Ohio, USA
October 2017
2
CEATI International Inc.
Project Report Sponsored, Reviewed and Approved by:
• AltaLink• American Electric Power• American Transmission Company• Arizona Public Service Company• ATCO Electric• Avangrid Networks• Avista Utilities• BC Hydro• Chelan County PUD• Con Edison Inc.• ENMAX• EPCOR• Florida Power and Light • FortisBC Inc.
• Hydro One Sault Ste. Marie• Hydro Ottawa Limited • Manitoba Hydro• National Grid• NRECA• Newfoundland Power Inc.• Oakville Hydro• Ontario Power Generation• Pacific Gas & Electric Company• Powerlink Queensland• Saskatoon Light & Power• SaskPower• Seattle City Light• Toronto Hydro-Electric System Limited
Project 30/113 was undertaken under the direction of the CEATI Station Equipment Asset Management Program (SEAM)
3
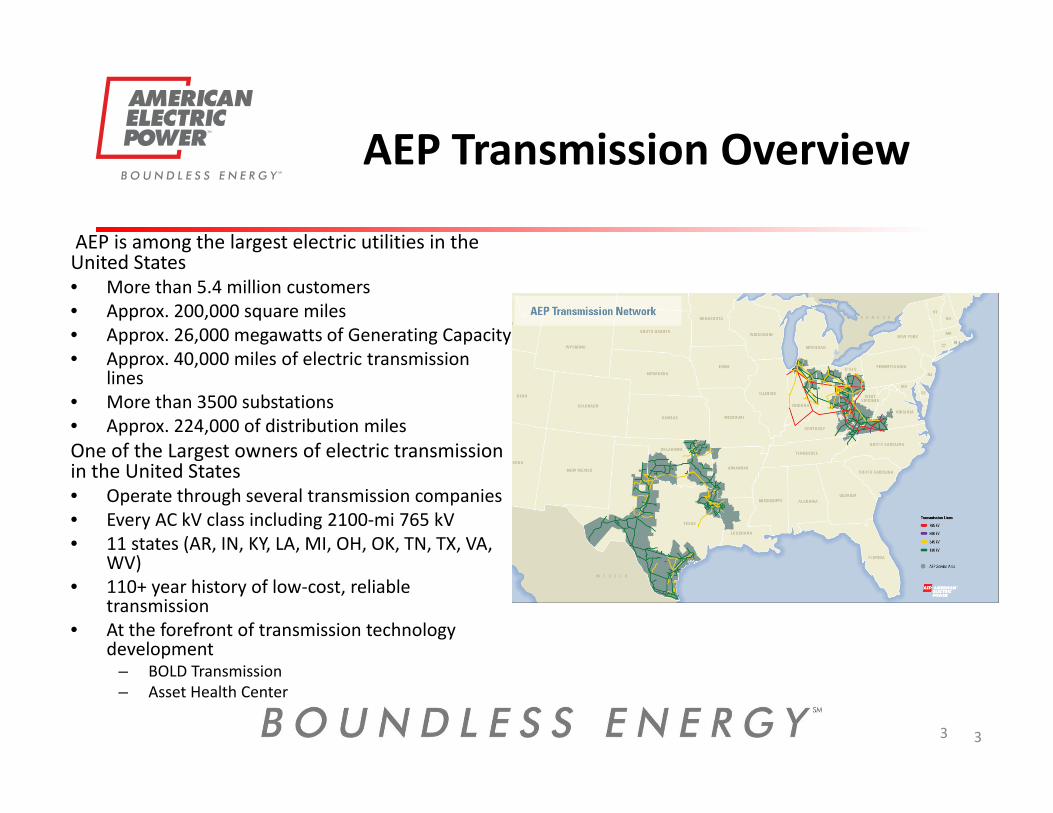
AEP Transmission Overview
AEP is among the largest electric utilities in the United States • More than 5.4 million customers • Approx. 200,000 square miles• Approx. 26,000 megawatts of Generating Capacity• Approx. 40,000 miles of electric transmission
lines • More than 3500 substations• Approx. 224,000 of distribution milesOne of the Largest owners of electric transmission in the United States • Operate through several transmission companies• Every AC kV class including 2100‐mi 765 kV• 11 states (AR, IN, KY, LA, MI, OH, OK, TN, TX, VA,
WV) • 110+ year history of low‐cost, reliable
transmission• At the forefront of transmission technology
development– BOLD Transmission – Asset Health Center
3
4
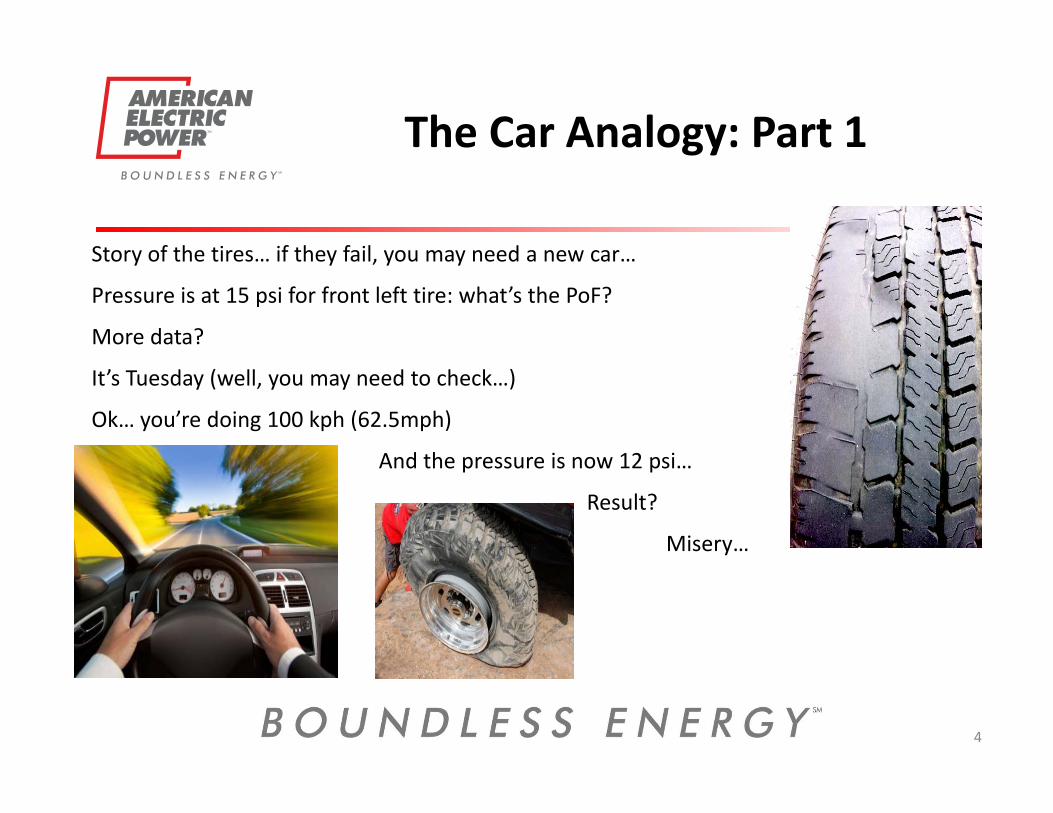
The Car Analogy: Part 1
Story of the tires… if they fail, you may need a new car…
Pressure is at 15 psi for front left tire: what’s the PoF?
More data?
It’s Tuesday (well, you may need to check…)
Ok… you’re doing 100 kph (62.5mph)
And the pressure is now 12 psi…
Result?
Misery…
5
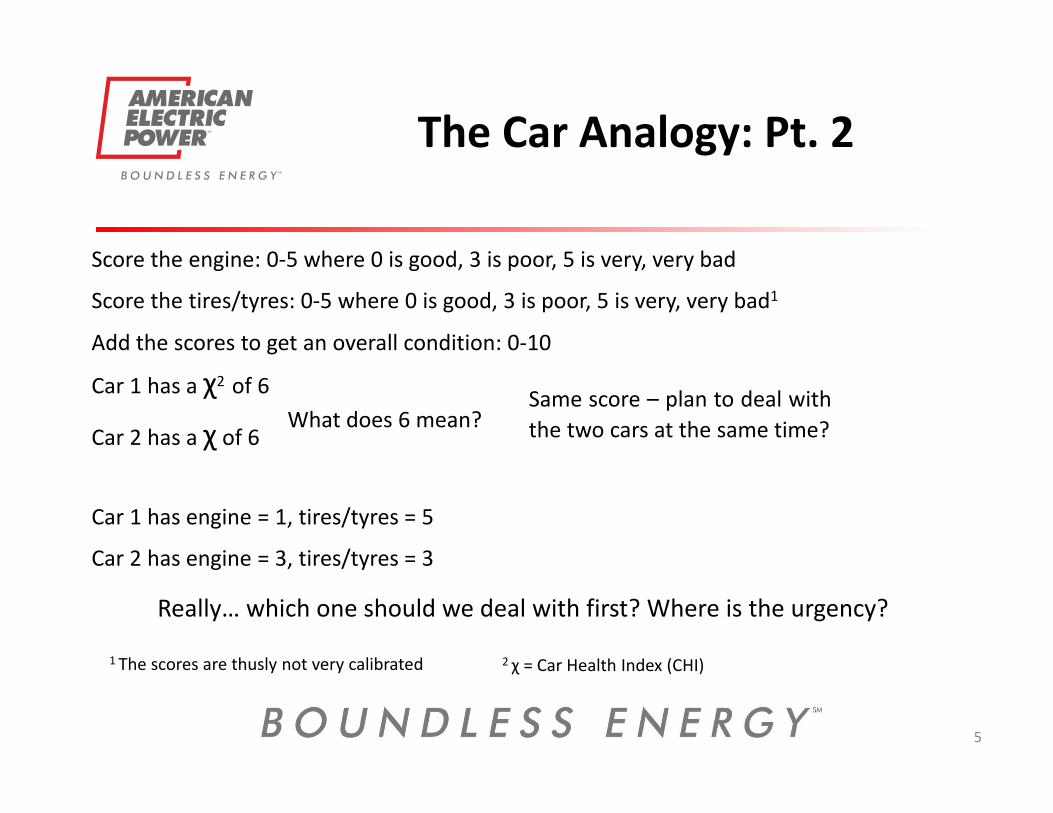
The Car Analogy: Pt. 2
Score the engine: 0‐5 where 0 is good, 3 is poor, 5 is very, very bad
Score the tires/tyres: 0‐5 where 0 is good, 3 is poor, 5 is very, very bad1
Car 1 has a χ2 of 6
Car 2 has a χ of 6
Add the scores to get an overall condition: 0‐10
1 The scores are thusly not very calibrated
Same score – plan to deal withthe two cars at the same time?
Car 1 has engine = 1, tires/tyres = 5
Car 2 has engine = 3, tires/tyres = 3
Really… which one should we deal with first? Where is the urgency?
What does 6 mean?
2 χ = Car Health Index (CHI)
6
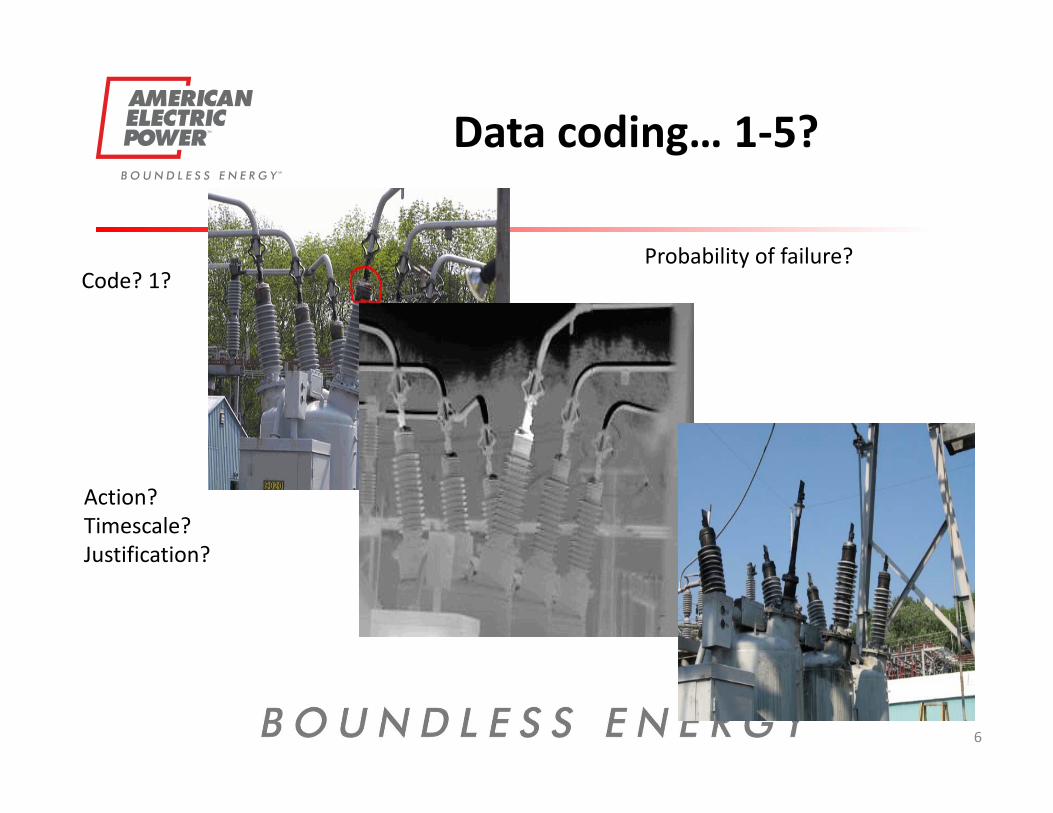
Data coding… 1‐5?
Code? 1?Probability of failure?
Action?Timescale?Justification?
7
Asset Health Index
AHI is an estimate of a generally unknown variable: the actual asset healthEstimating what – healthy enough to do what, exactly?
More data, should be a better estimate?An index should have associated action & timescale
Timescales should calibrate – be consistentThe AHI is a ‘model’:• “all models are ‘wrong’, some models are useful” 1
• “you don’t get a ‘correct’ model by excessive elaboration”1
• “The idea that complex physical, biological or sociological systems can be exactly
described by a few formulae is patently absurd.”2
1 Box, G. E. P. (1976), "Science and Statistics" (PDF),Journal of the American Statistical Association2 Cox, D. R. (1995), "Comment on “Model uncertainty, data mining and statistical inference”", Journal of the Royal Statistical Society
8
Where are we going?
What problem are you trying to solve?
“all models are ‘wrong’, some models are useful” 1
1 Box, G. E. P. (1976), "Science and Statistics" (PDF),Journal of the American Statistical Association
9
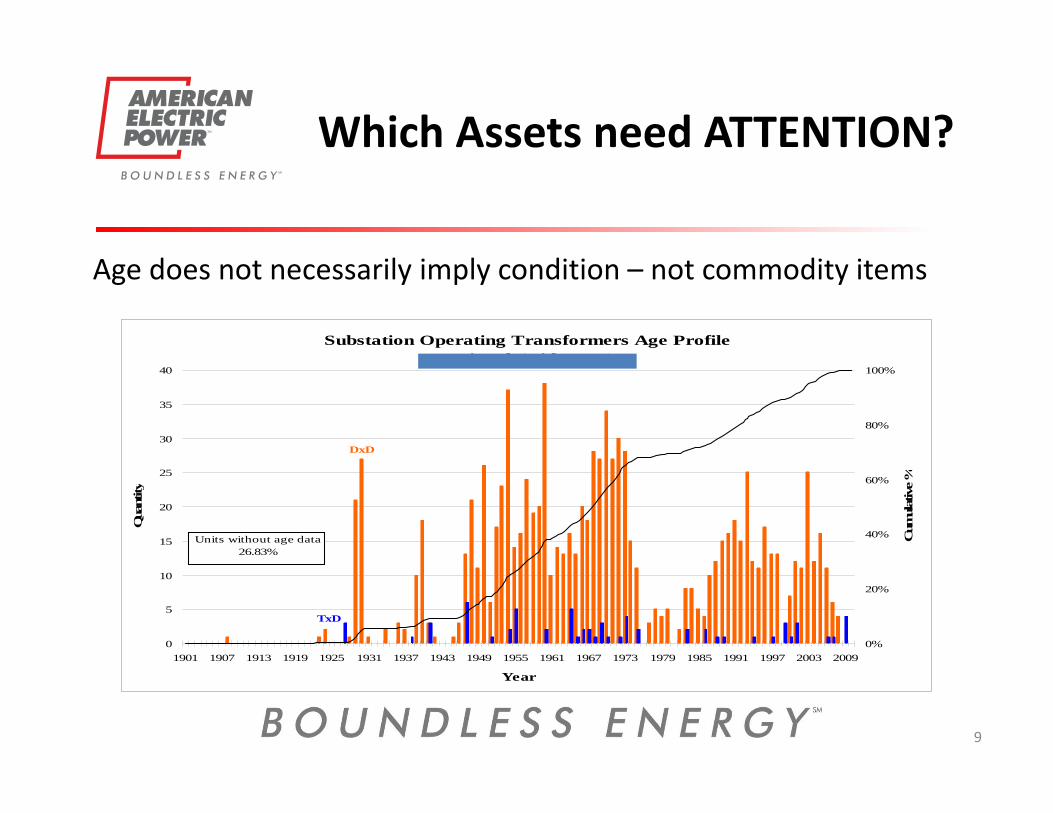
Which Assets need ATTENTION?
Age does not necessarily imply condition – not commodity items
Substation Operating Transformers Age ProfileNational Grid - EDO
DxD
TxD
0
5
10
15
20
25
30
35
40
1901 1907 1913 1919 1925 1931 1937 1943 1949 1955 1961 1967 1973 1979 1985 1991 1997 2003 2009
Year
Qua
ntity
0%
20%
40%
60%
80%
100%
Cum
ulat
ive %
Units without age data 26.83%
10
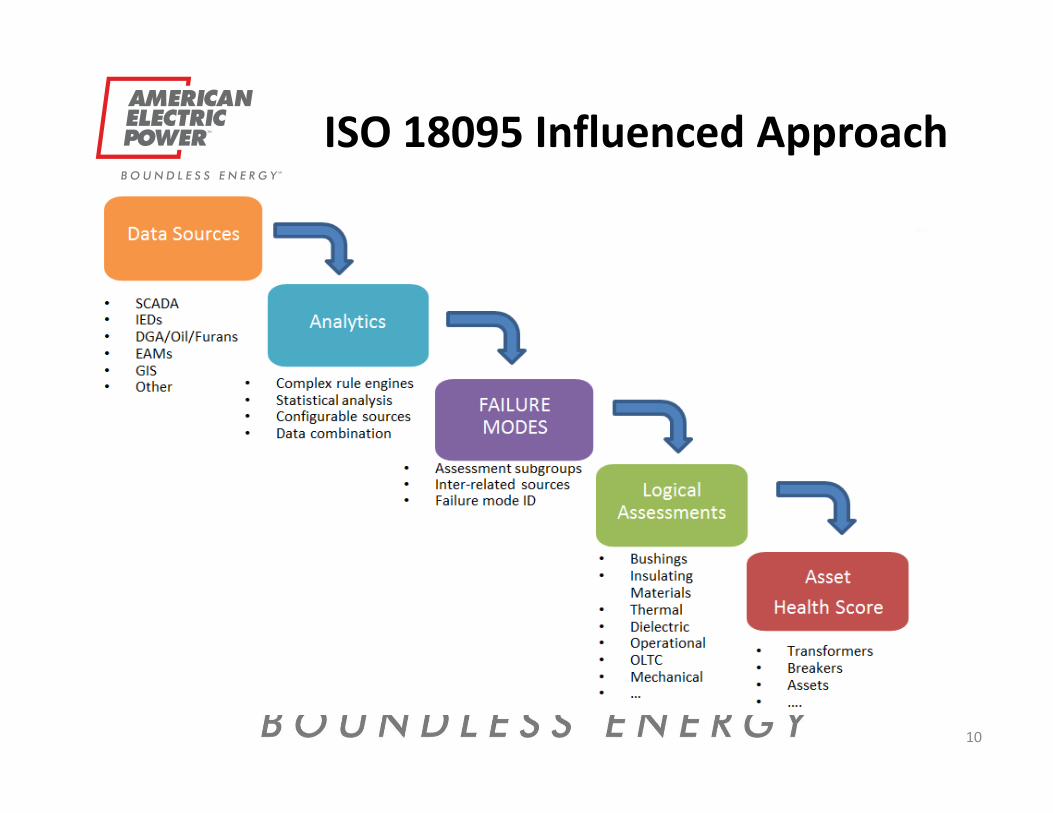
ISO 18095 Influenced Approach
11
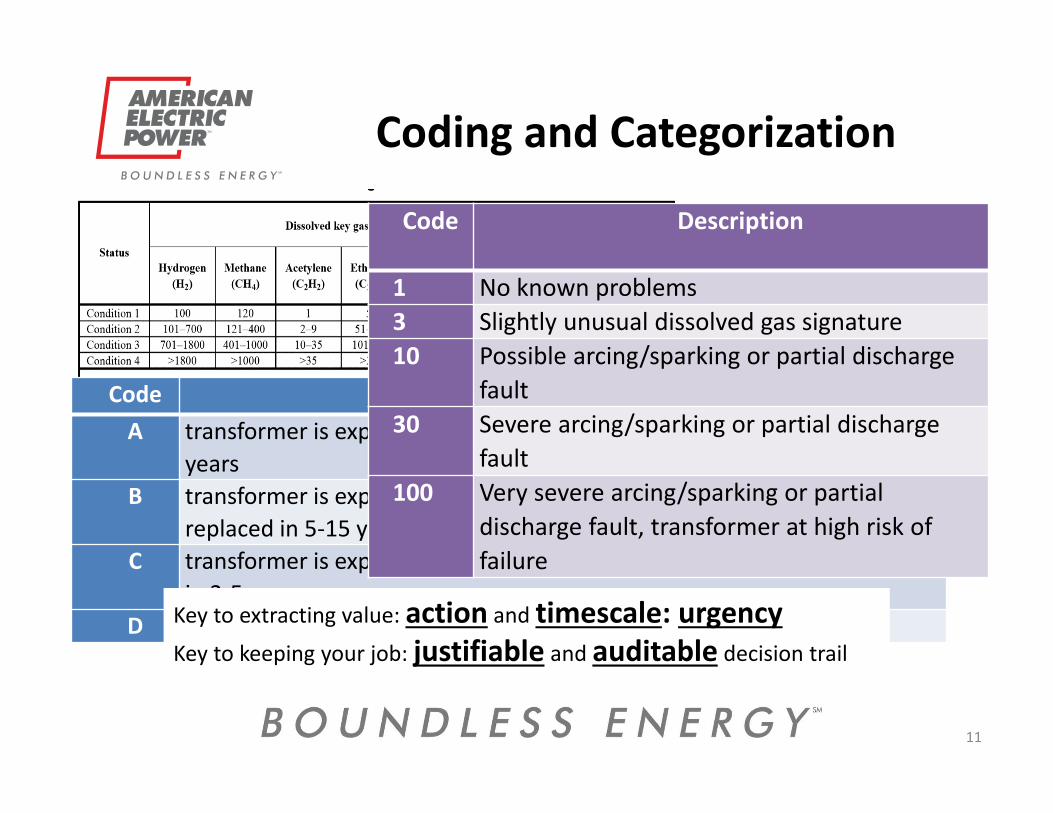
Coding and Categorization
Code DescriptionA transformer is expected to last for the foreseeable future, and at least 15
yearsB transformer is expected to last up to 15 years but may need to be
replaced in 5‐15 yearsC transformer is expected to last up to 5 years and may need to be replaced
in 2‐5 yearsD transformer is on active list for replacement within 2 years
Code Description
1 No known problems3 Slightly unusual dissolved gas signature10 Possible arcing/sparking or partial discharge
fault30 Severe arcing/sparking or partial discharge
fault100 Very severe arcing/sparking or partial
discharge fault, transformer at high risk of failure
Key to extracting value: action and timescale: urgencyKey to keeping your job: justifiable and auditable decision trail
12
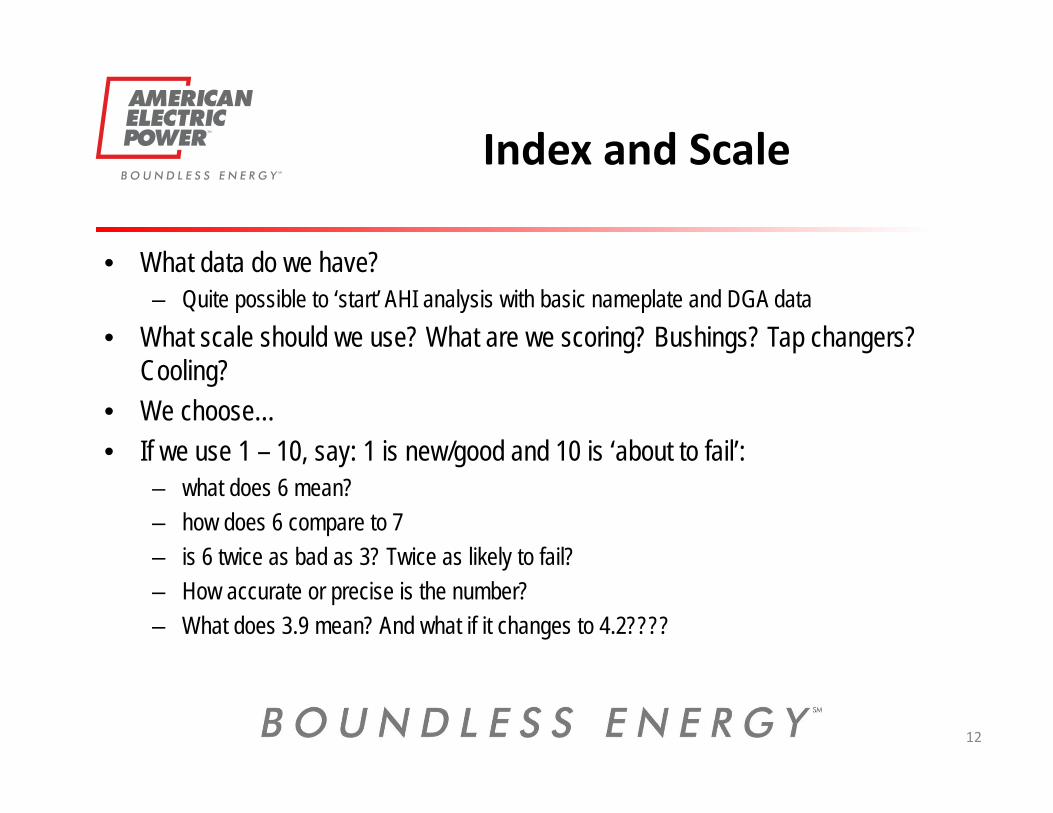
Index and Scale
• What data do we have?– Quite possible to ‘start’ AHI analysis with basic nameplate and DGA data
• What scale should we use? What are we scoring? Bushings? Tap changers? Cooling?
• We choose…• If we use 1 – 10, say: 1 is new/good and 10 is ‘about to fail’:
– what does 6 mean? – how does 6 compare to 7– is 6 twice as bad as 3? Twice as likely to fail?– How accurate or precise is the number? – What does 3.9 mean? And what if it changes to 4.2????
13
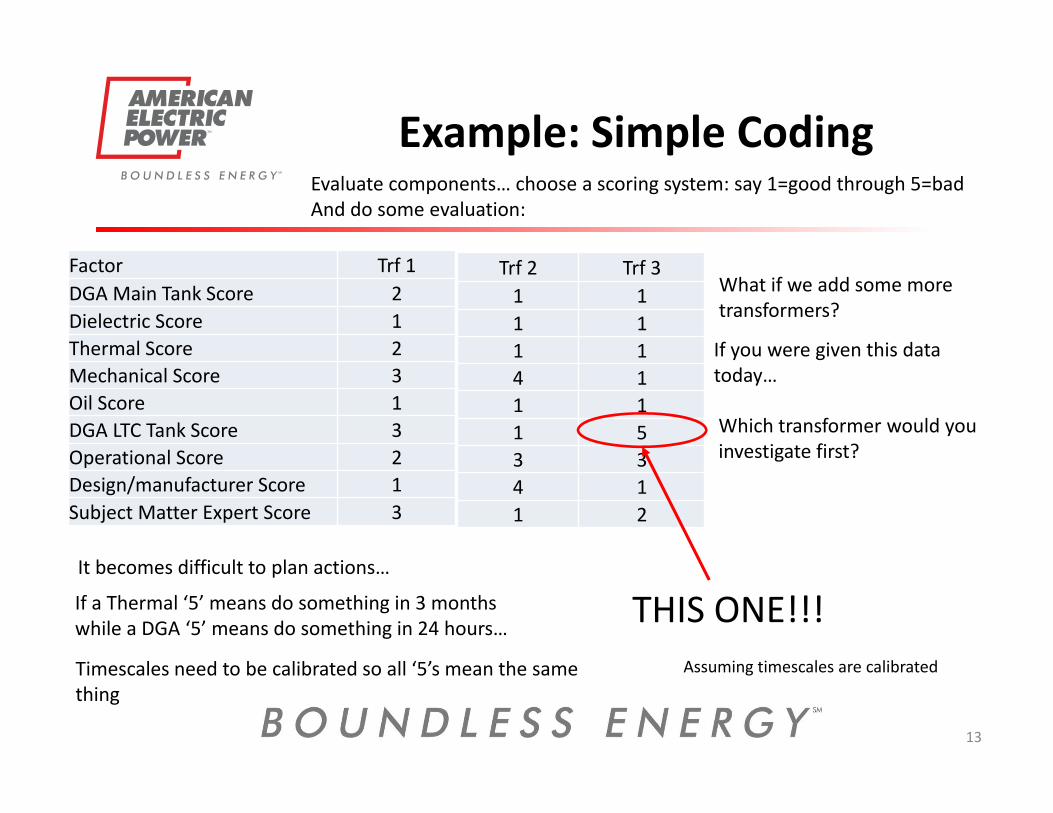
Example: Simple CodingEvaluate components… choose a scoring system: say 1=good through 5=badAnd do some evaluation:
If a Thermal ‘5’ means do something in 3 months while a DGA ‘5’ means do something in 24 hours…
It becomes difficult to plan actions…
Timescales need to be calibrated so all ‘5’s mean the same thing
What if we add some more transformers?
If you were given this data today…
Which transformer would you investigate first?
Assuming timescales are calibrated
Factor Trf 1DGA Main Tank Score 2Dielectric Score 1Thermal Score 2Mechanical Score 3Oil Score 1DGA LTC Tank Score 3Operational Score 2Design/manufacturer Score 1Subject Matter Expert Score 3
Trf 2 Trf 31 11 11 14 11 11 53 34 11 2
THIS ONE!!!
14
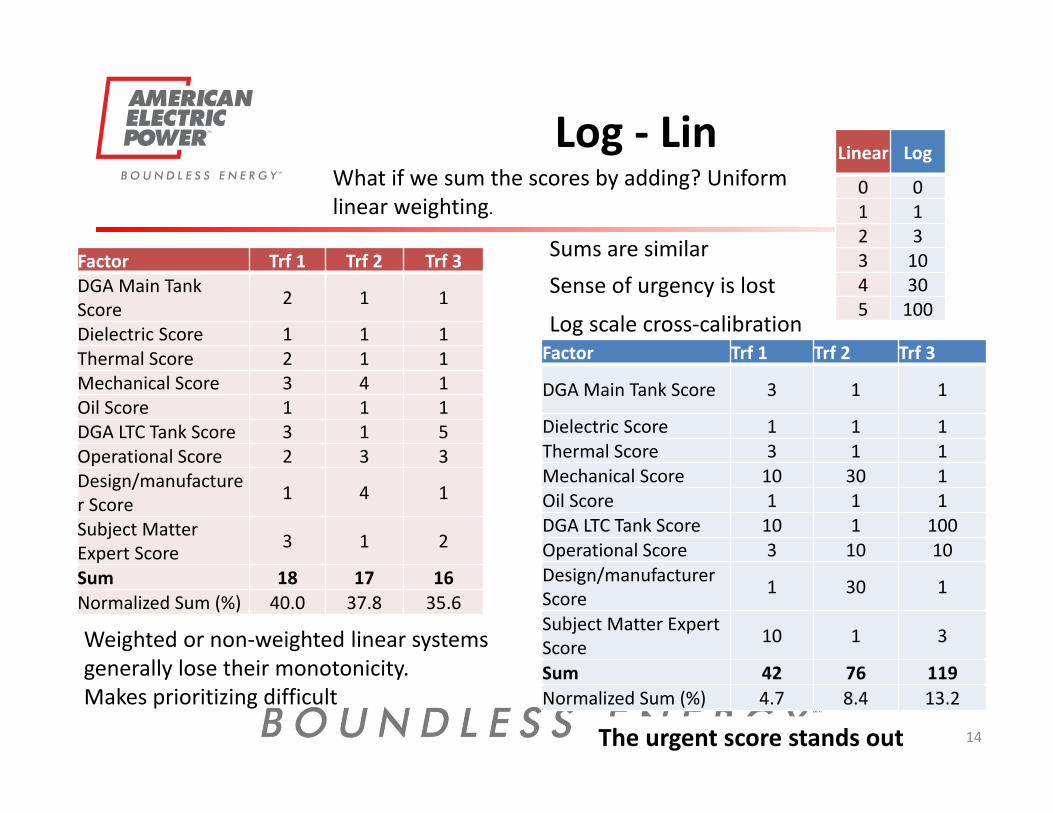
Log ‐ LinWhat if we sum the scores by adding? Uniform linear weighting.
Sums are similarFactor Trf 1 Trf 2 Trf 3DGA Main Tank Score 2 1 1
Dielectric Score 1 1 1Thermal Score 2 1 1Mechanical Score 3 4 1Oil Score 1 1 1DGA LTC Tank Score 3 1 5Operational Score 2 3 3Design/manufacturer Score 1 4 1
Subject Matter Expert Score 3 1 2
Sum 18 17 16Normalized Sum (%) 40.0 37.8 35.6
Sense of urgency is lost
Log scale cross‐calibration
Linear Log
0 01 12 33 104 305 100
Factor Trf 1 Trf 2 Trf 3
DGA Main Tank Score 3 1 1
Dielectric Score 1 1 1Thermal Score 3 1 1Mechanical Score 10 30 1Oil Score 1 1 1DGA LTC Tank Score 10 1 100Operational Score 3 10 10Design/manufacturer Score 1 30 1
Subject Matter Expert Score 10 1 3
Sum 42 76 119Normalized Sum (%) 4.7 8.4 13.2
The urgent score stands out
Weighted or non‐weighted linear systems generally lose their monotonicity.Makes prioritizing difficult
15
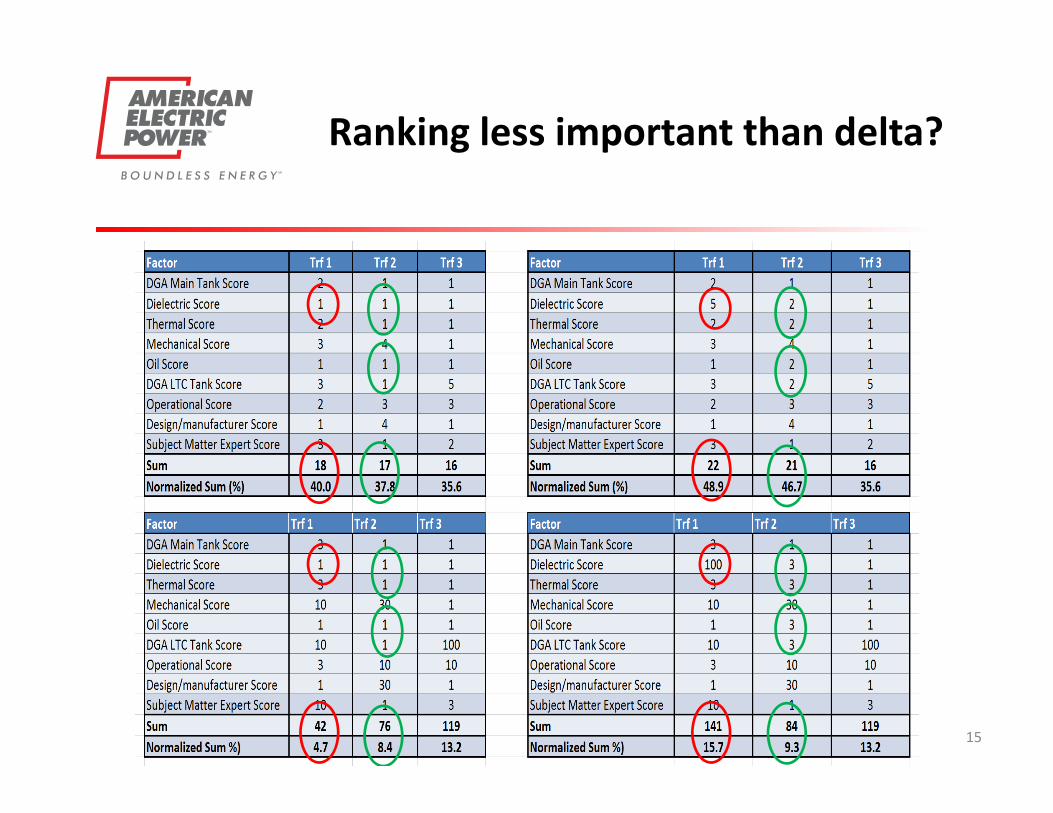
Ranking less important than delta?
16
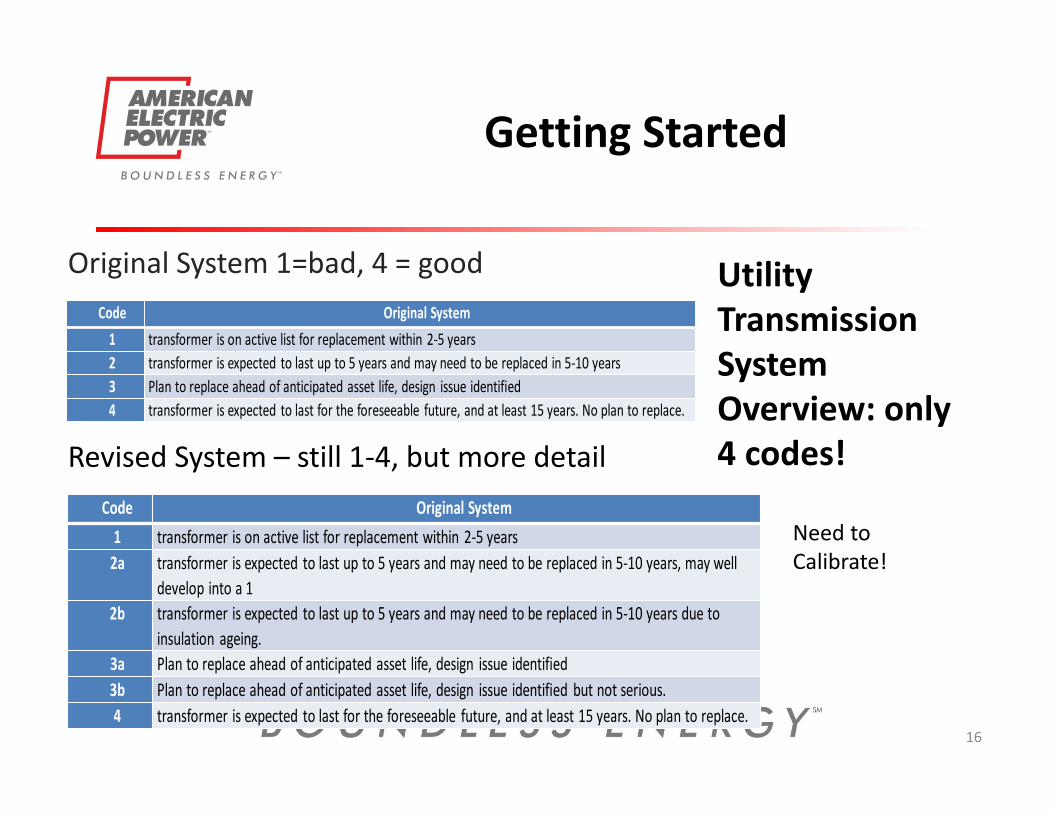
Getting Started
Utility Transmission System Overview: only 4 codes!Revised System – still 1‐4, but more detail
Original System 1=bad, 4 = good
Code Original System1 transformer is on active list for replacement within 2‐5 years2a transformer is expected to last up to 5 years and may need to be replaced in 5‐10 years, may well
develop into a 12b transformer is expected to last up to 5 years and may need to be replaced in 5‐10 years due to
insulation ageing.3a Plan to replace ahead of anticipated asset life, design issue identified 3b Plan to replace ahead of anticipated asset life, design issue identified but not serious.4 transformer is expected to last for the foreseeable future, and at least 15 years. No plan to replace.
Code Original System1 transformer is on active list for replacement within 2‐5 years2 transformer is expected to last up to 5 years and may need to be replaced in 5‐10 years3 Plan to replace ahead of anticipated asset life, design issue identified 4 transformer is expected to last for the foreseeable future, and at least 15 years. No plan to replace.
Need to Calibrate!
17
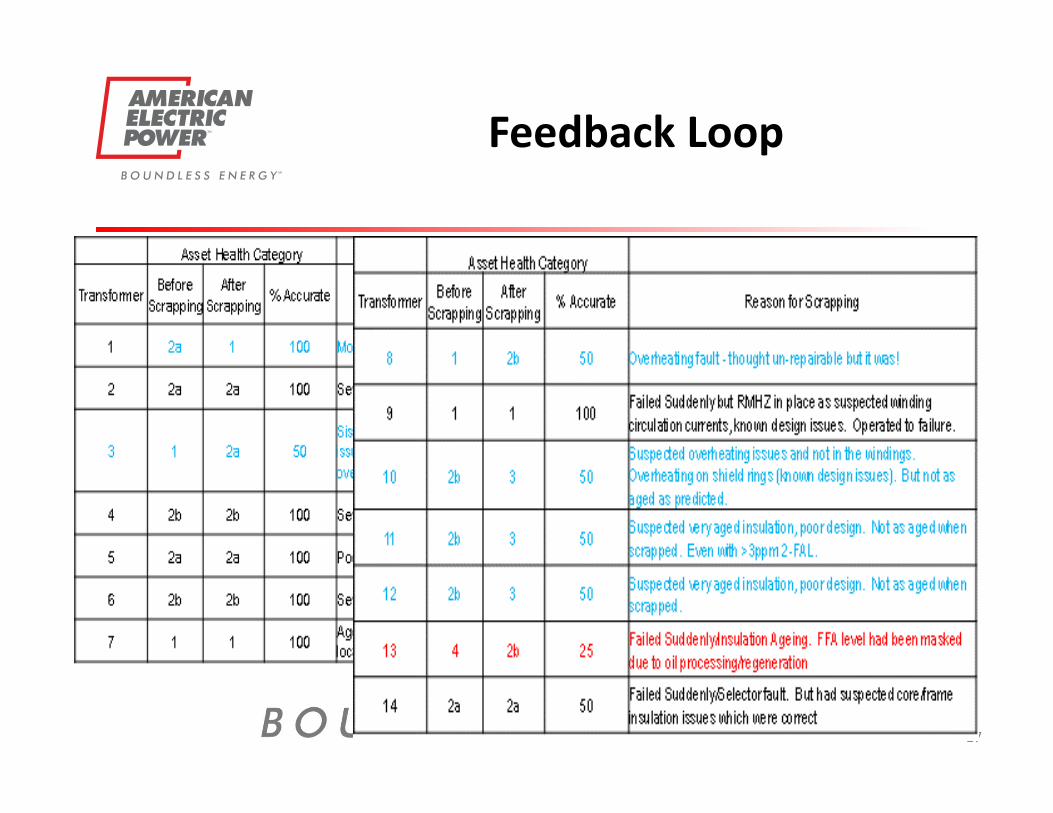
Feedback Loop
18
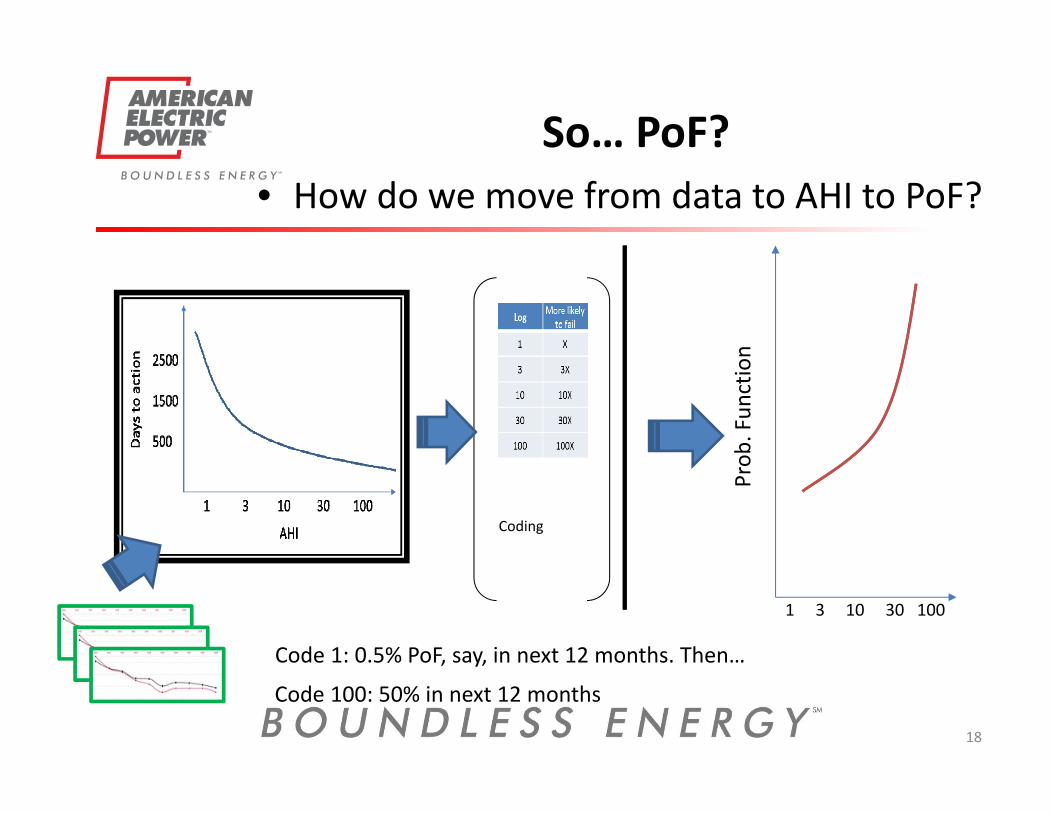
So… PoF?
Coding
1 3 10 30 100
Prob
. Fun
ction
• How do we move from data to AHI to PoF?
Code 1: 0.5% PoF, say, in next 12 months. Then…
Code 100: 50% in next 12 months
19
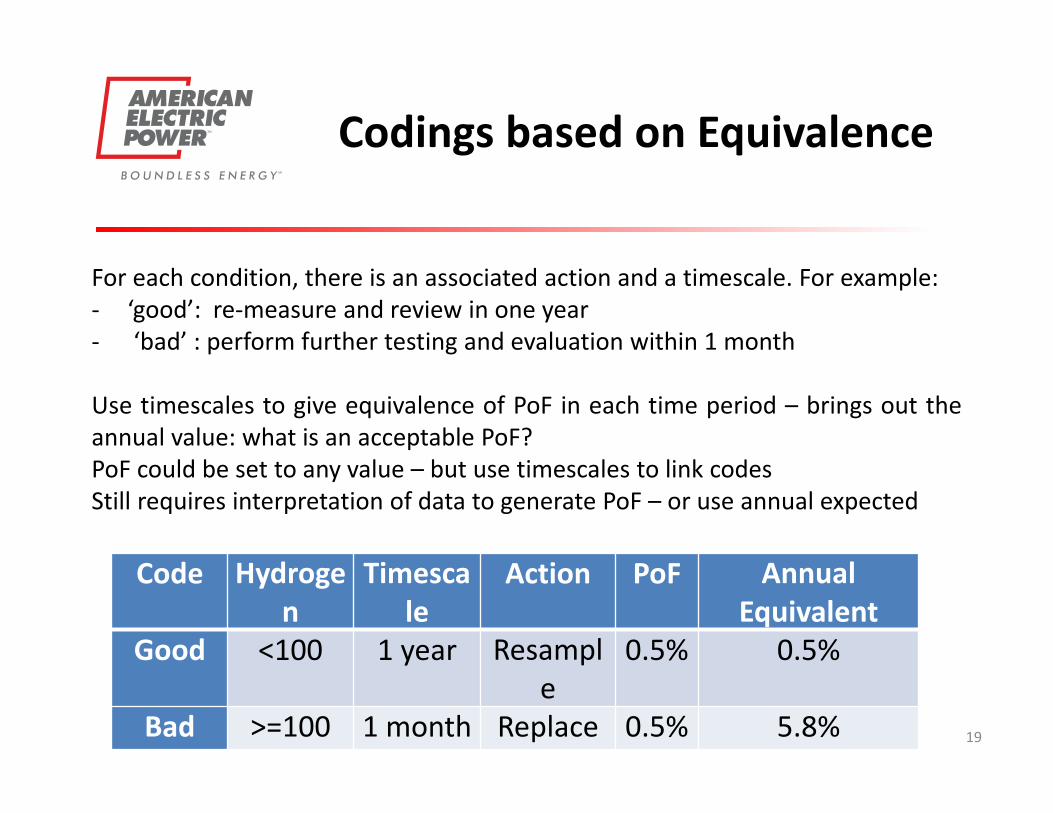
Codings based on Equivalence
For each condition, there is an associated action and a timescale. For example:‐ ‘good’: re‐measure and review in one year‐ ‘bad’ : perform further testing and evaluation within 1 month
Use timescales to give equivalence of PoF in each time period – brings out theannual value: what is an acceptable PoF?PoF could be set to any value – but use timescales to link codesStill requires interpretation of data to generate PoF – or use annual expected
Code Hydrogen
Timescale
Action PoF Annual Equivalent
Good <100 1 year Resample
0.5% 0.5%
Bad >=100 1 month Replace 0.5% 5.8%
20
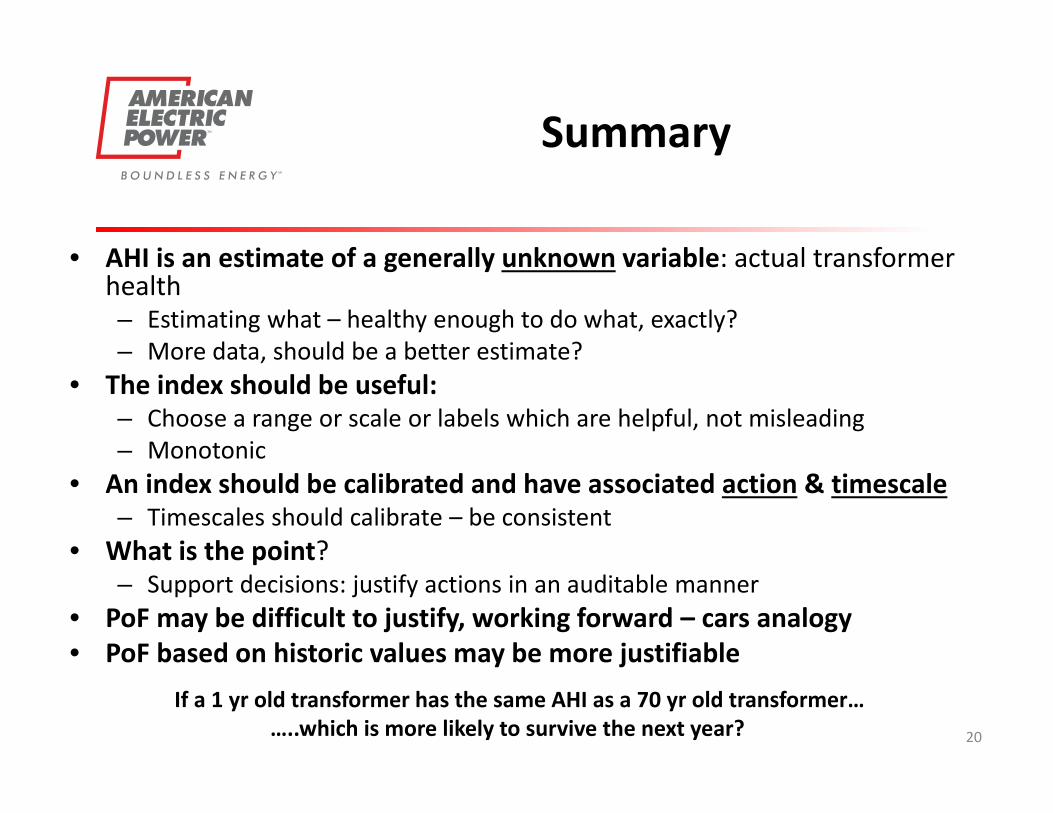
Summary
• AHI is an estimate of a generally unknown variable: actual transformer health– Estimating what – healthy enough to do what, exactly?– More data, should be a better estimate?
• The index should be useful: – Choose a range or scale or labels which are helpful, not misleading– Monotonic
• An index should be calibrated and have associated action & timescale – Timescales should calibrate – be consistent
• What is the point?– Support decisions: justify actions in an auditable manner
• PoF may be difficult to justify, working forward – cars analogy• PoF based on historic values may be more justifiable
If a 1 yr old transformer has the same AHI as a 70 yr old transformer……..which is more likely to survive the next year?
21
CEATI International Inc.
Project undertaken under the direction of the CEATI Station Equipment Asset Management Program (SEAM)
For more information on the SEAM Program and Project Report, please visit www.ceati.com
or contact [email protected]
Join us at our 2018 Spring Stations Workshop on “The Changing Face of Station Maintenance” in Tucson, AZ on March 7th, 2018!
22
ANY QUESTIONS!Thank you for your attentinon!