Embed Size (px)
Citation preview

TRANSFORMATIVE PROFESSIONAL DEVELOPMENT AND
TEACHER ENGAGEMENT
by
KIMBERLY E. GEIL
B.A., Stanford University, 1991
A thesis submitted to the
Faculty of the Graduate School of the
University of Colorado in partial fulfillment
of the requirement for the degree of
Doctor of Philosophy
School of Education
2011
This thesis entitled: Transformative Professional Development and Teacher Engagement
written by Kimberly E. Geil has been approved for the School of Education
Derek C. Briggs, Chair
Hilda Borko
Benjamin Kirshner
Daniel Liston
Karen Tracy
Jennifer Whitcomb
April 5, 2011
The final copy of this thesis has been examined by the signatories, and we find that both the content and the form meet acceptable presentation standards
of scholarly work in the above mentioned discipline.
HRC protocol # 0506.20
Geil
iii
ABSTRACT
Geil, Kimberly E. (Ph.D., Education)
Transformative Professional Development and Teacher Engagement
Thesis directed by Professor Derek C. Briggs
This quasi-experimental study attempts to estimate the effect that participation in
Courage to Teach (CTT), a transformative professional development (TPD) program, has on
subsequent engagement with teaching. The primary focus of a TPD program is on the person
who teaches, as opposed to content or technique. The subjects of the study are a sample of
alumni from CTT and the National Writing Project (NWP), a professional development program
used as a control group. Demographic data were collected for descriptive purposes and to
account for potentially confounding variables. Engagement was measured with the Maslach
Burnout Inventory (MBI), and survey data were also collected on issues related to retention and
perceived benefits of participation. Propensity score matching techniques were used to match the
PK-12 teachers from the two programs as closely as possible on the potentially confounding
variables.
On average, the CTT respondents reported higher levels of professional efficacy
(indicating greater engagement), and higher levels of emotional exhaustion and cynicism
(indicating lesser engagement) than the NWP respondents. The CTT respondents were also
compared to the normative sample of the MBI and other contemporary studies, and consistently
showed higher engagement on all three subscales. Descriptive and exploratory data were
obtained regarding respondents’ demographic characteristics (CTT respondents are older and
more experienced), the perceived effects of the program on respondents’ retention decisions (a

Geil
iv
larger percentage of CTT respondents appear to be questioning their career choice at the time of
their participation than NWP respondents), and the most valuable aspects of the program (CTT
respondents focus more on personal and professional benefits, while NWP respondents focus
primarily on professional aspects). Future research is needed to explore aspects of professional
development that promote engagement, whether or not a content focus is a necessary
requirement, and to resolve some of the issues that arose around proxy variables and temporal
precedence.
Geil
v
ACKNOWLEDGMENTS
There are many people to whom I owe a great deal of thanks. To start off, I would like to
thank my committee for allowing me to do things in my own way and on my own terms…that
made all the difference. Hilda Borko was my first advisor and the Research on Teaching seminar
I took from her was a wonderful introduction to graduate school. Jennie Whitcomb made me feel
very welcome when I arrived at the School of Education, especially when we realized that we
had previously taken a class together at Stanford. Karen Tracy’s communication courses were
always engaging and challenging, and it was a project for her class that led to an article co-
written with Ben Kirshner, whose mentoring in that area is very much appreciated. Dan Liston
introduced me to the Courage to Teach program that became the focus of my dissertation,
offered meaningful classroom experiences, and later joined Hilda as one of my two original co-
chairs. Dan and Hilda shepherded me through the initial stages of the project, helped me figure
out conceptually what it was I wanted to do, then turned the reins over to Derek Briggs when it
became clear that my interests had taken me in a more statistical direction.
It is no understatement to say that I would still be plodding along, perhaps never reaching
the finish line, if not for Derek. From pushing me to get my prospectus done in 2007, to having
just the right words of encouragement as the defense date approached, he was always available
when I needed him. I think it is fair to say that he is the perfect example of the philosophy that
underlies my study…that while content and technique in teaching are absolutely necessary, the
relationship between teacher and student can make the biggest difference of all. My dissertation
is a much stronger product thanks to his guidance and knowledge regarding statistics, but
ultimately it was his belief that I was capable of finishing that saw me through.
Geil
vi
I also have to thank my “R guru,” Ben Domingue. He spent many hours talking with me
on the phone, exchanging e-mails, and helping me understand the intricacies of the R
programming environment and MatchIt software that was critical to the propensity score
matching techniques I used. I would not have been able to finish without his help.
Terry Chadsey, now the Director of the Center for Courage and Renewal, was invaluable
in helping me get in touch with Courage to Teach facilitators and supporting my efforts. Dan
Liston and Paul Michalec graciously allowed me access to their Courage to Teach alumni for the
purposes of running a pilot test. Several people were very helpful at the National Writing Project,
particularly Paul LeMahieu, who provided access to the NWP sample and pushed my thinking in
many ways, and Linda Friedrich, who provided insightful editorial comments. Rich Argys,
Michelle Comstock, and Nicole Piasecki welcomed me into the Denver Writing Project, let me
attend workshops, and facilitated a pilot test with their alumni.
The Fetzer Institute in Kalamazoo, Michigan made the first Courage to Teach retreat
series possible in 1994. Later they sponsored a request for proposals for research on
transformative professional development. Thanks to Dan Liston’s leadership, several CU-
Boulder projects were partially funded, mine included, and I am very grateful for this support.
The CTT and NWP alumni who took time out of their busy lives to complete my survey
are the heart and soul of this research project. Many of them wrote fascinating and revealing
accounts of their experiences with the programs, and I am indebted to them for sharing their
thoughts and feelings.
Many of my classmates supported me at various times throughout this process. Danielle
Harlow offered essential critiques of my prospectus that made it possible for me to meet a
deadline that otherwise felt unattainable, and she and Laura Creighton were both friendly faces at

Geil
vii
my prospectus defense. Sue Arnold came to my dissertation defense, and she and her partner
Deb provided a welcome place to stay in the “yellow room” and a sympathetic ear to whatever
was going on in my life, be it grad school related or not. Bud Talbot, my office mate for many
years, also gave generously of his time and expertise to help me understand statistical concepts.
Patty McDonald and Sara McDonald both made me continue to feel welcome at the
School of Education even after I moved to California. Sara’s help was invaluable in scheduling
my dissertation defense, and Patty was always available to answer questions related to my own
work or other research grants over the years. Michelle Albright was accessible and friendly
whenever I had another question about dissertation deadlines, and I am indebted to her for
helping me get that final paperwork to the Graduate School on time.
Of course, I would not be where I am or who I am today without my parents, Phil and
Louise Geil. They always supported and encouraged me in my choices, from spending a summer
in Japan on an exchange program when I was sixteen, to going away to college, to living abroad
in Japan, to taking me in again when I came back to the States and began teaching Japanese, to
doting on their “granddog” Tucker, to welcoming Suna into the family. My siblings, Julie
Carson, Kristin Ham, and Jeffrey Geil have also been an important part of my life and even
though we are all scattered across the country now, I know we will always be close.
And that brings me to my partner, Suna Kneisley, who even though she came in on the
tail end of this journey was there during the most intense parts…the days when I worked nonstop
on the dissertation and did not do much else. She made sure there was always food in the fridge,
helped me create graphics and figure out how to import them into the dissertation, listened to me
when I was sure I would not finish, and most importantly, made me feel loved. Here’s to many
post-dissertation years!

Geil
viii
TABLE OF CONTENTS
LIST OF TABLES ..........................................................................................................................................................XII LIST OF FIGURES ......................................................................................................................................................XIII CHAPTER 1. RESEARCH PROBLEM AND SIGNIFICANCE OF STUDY .........................................................1
INTRODUCTION TO THE RESEARCH PROBLEM .................................................................................................................1 The Person Who Teaches............................................................................................................................................2
RESEARCH QUESTIONS .....................................................................................................................................................5 SIGNIFICANCE OF THE STUDY...........................................................................................................................................7
Engagement and Burnout ...........................................................................................................................................7 The Importance of Engaged Teachers .......................................................................................................................9 The Costs Associated with Low Engagement and Burnout ....................................................................................11 The Costs Associated with Movers and Leavers .....................................................................................................13
POSSIBLE WAYS TO PROMOTE ENGAGEMENT AND REDUCE ATTRITION.....................................................................14 The Potential of Transformative Professional Development .................................................................................16
SUMMARY AND STRUCTURE OF REMAINING CHAPTERS...............................................................................................16 CHAPTER 2. LITERATURE REVIEW AND CONCEPTUAL FRAMEWORK ................................................19
TRANSFORMATIVE PROFESSIONAL DEVELOPMENT AND COURAGE TO TEACH ...........................................................19 The History, Structure, and Mission of Courage to Teach.....................................................................................21 Courage to Teach and the Elements of Effective Professional Development .......................................................24
EXISTING RESEARCH AND EVALUATIONS ON THE COURAGE TO TEACH PROGRAM....................................................28 Findings of Existing Courage to Teach Research Studies......................................................................................31
POTENTIALLY CONFOUNDING AND DESCRIPTIVE VARIABLES .....................................................................................34 Demographic Characteristics of Teachers..............................................................................................................36
Age, Teaching Experience, and Retirement Eligibility .........................................................................................................37 Gender and Race/Ethnicity......................................................................................................................................................38 Teaching Certification and Full Time Status .........................................................................................................................40 Satisfaction With Salary ..........................................................................................................................................................41
School and Student Characteristics .........................................................................................................................41 Grade Level Taught .................................................................................................................................................................43 School Locale, Size, and Public/Private Sector .....................................................................................................................44 Free and Reduced Lunch Eligibility .......................................................................................................................................45 Racial Distribution of Students ...............................................................................................................................................46
SUMMARY OF CHAPTER..................................................................................................................................................47 CHAPTER 3. STUDY DESIGN AND DATA COLLECTION .................................................................................48
STUDY DESIGN................................................................................................................................................................48 Appropriate Control Group and the Counterfactual ..............................................................................................50 The History, Mission, and Structure of the National Writing Project ...................................................................52 Existing Research on the National Writing Project ................................................................................................54
SAMPLE SELECTION ........................................................................................................................................................57 Response Rates ..........................................................................................................................................................62
SURVEY INSTRUMENT.....................................................................................................................................................64 The Maslach Burnout Inventory...............................................................................................................................64
Reliability of the MBI..............................................................................................................................................................66 Validity of the MBI..................................................................................................................................................................68 Normative Sample of the MBI ................................................................................................................................................71
National Center for Education Statistics’ School and Staffing Surveys................................................................71 Researcher-Created Items ........................................................................................................................................72
PILOT TEST......................................................................................................................................................................72 CONFIDENTIALITY OF DATA...........................................................................................................................................73 SURVEY DATA LIMITATIONS..........................................................................................................................................73
Geil
ix
Response Rates and Representativeness..................................................................................................................73 FOCUS OF ANALYSIS ON PK-12 TEACHERS...................................................................................................................74 SUMMARY OF CHAPTER..................................................................................................................................................75
CHAPTER 4. CHARACTERISTICS OF RESPONDENTS .....................................................................................76 DEMOGRAPHICS ..............................................................................................................................................................76
Gender and Race/Ethnicity.......................................................................................................................................78 Age, Teaching Experience, and Retirement Eligibility ...........................................................................................79 Certification and Full Time Status...........................................................................................................................82 Satisfaction With Salary............................................................................................................................................83
SCHOOL AND STUDENT CHARACTERISTICS ...................................................................................................................84 School Level Taught..................................................................................................................................................85 Size of School.............................................................................................................................................................86 Location of School.....................................................................................................................................................87 Public or Private Sector ...........................................................................................................................................88 Percentages of Non-White Students and Students on Free or Reduced Lunch.....................................................88
CHARACTERISTICS OF THE PROFESSIONAL DEVELOPMENT PROGRAMS ......................................................................90 SUMMARY OF CHAPTER..................................................................................................................................................91
CHAPTER 5. EFFECTS OF PARTICIPATION IN COURAGE TO TEACH ON TEACHER ENGAGEMENT AND PERCEIVED BENEFITS ......................................................................................................93
PROPENSITY SCORE MATCHING.....................................................................................................................................94 Covariate Selection ...................................................................................................................................................94 Proxy Variables .........................................................................................................................................................96
Level of Involvement...............................................................................................................................................................97 Balance Before Matching .........................................................................................................................................97 Propensity Scores and Selection of Matched Cases .............................................................................................100 Subclasses and Balance After Matching................................................................................................................103
WHAT IS THE EFFECT OF PARTICIPATION IN COURAGE TO TEACH ON SUBSEQUENT TEACHER ENGAGEMENT? .....107 Comparisons Before Propensity Score Matching .................................................................................................107 Comparisons After Propensity Score Matching....................................................................................................108
Subclass Interactions..............................................................................................................................................................110 Courage to Teach and the Normative Sample of the MBI....................................................................................113 Courage to Teach and Other Studies of Teachers and the MBI ..........................................................................114 Discussion................................................................................................................................................................118
WHAT IS THE EFFECT OF PARTICIPATION IN COURAGE TO TEACH ON PERCEIVED BENEFITS OF THE PROFESSIONAL DEVELOPMENT PROGRAM? ..........................................................................................................................................120
Comparisons Before Propensity Score Matching .................................................................................................121 Comparisons After Propensity Score Matching....................................................................................................122 Discussion................................................................................................................................................................124
SUMMARY OF CHAPTER................................................................................................................................................125 CHAPTER 6. EXPLORATORY DATA REGARDING RETENTION ................................................................126
NO LONGER TEACHING ................................................................................................................................................127 INTENTIONS TO REMAIN IN TEACHING ........................................................................................................................128 PERCEIVED EFFECTS OF PROFESSIONAL DEVELOPMENT PROGRAM ON RETENTION DECISIONS..............................131
How Open-Ended Responses Were Coded ............................................................................................................131 Perceived Effects on Decisions to Remain in or Leave Teaching........................................................................132 No Effect on Retention Decisions...........................................................................................................................135
DISCUSSION...................................................................................................................................................................136 SUMMARY OF CHAPTER................................................................................................................................................136
CHAPTER 7. MOST VALUABLE ASPECTS OF PARTICIPATION IN PROFESSIONAL DEVELOPMENT PROGRAMS ..................................................................................................................................137
RESPONSES HEARD FREQUENTLY FROM BOTH CTT AND NWP RESPONDENTS.......................................................138 Importance of Community and People ..................................................................................................................138
Geil
x
The Gift of Time.......................................................................................................................................................139 Personal and Professional Rejuvenation...............................................................................................................140 Increased Confidence..............................................................................................................................................141 Safe Environment ....................................................................................................................................................142
RESPONSES MADE PRIMARILY BY CTT RESPONDENTS .............................................................................................143 Rediscovered or Affirmed Teaching as a Calling .................................................................................................143 Reflection .................................................................................................................................................................144 Opportunities for Inner Work.................................................................................................................................144 Clearness Committee and Other CTT Activities ...................................................................................................146 Deep Conversations ................................................................................................................................................147 Learning to Take Better Care of Themselves ........................................................................................................147
RESPONSES MADE MOSTLY BY NWP RESPONDENTS ................................................................................................148 Personal Writing .....................................................................................................................................................148 New Teaching Ideas ................................................................................................................................................149 Became Better Teachers .........................................................................................................................................149 Sharing Ideas and Learning With Other Teachers ...............................................................................................150 Walking In Their Students’ Shoes ..........................................................................................................................150 Research Opportunities ..........................................................................................................................................151 Taking on Leadership Roles and Pursuing Advanced Degrees ...........................................................................152 Teaching Demonstrations and Writing Groups ....................................................................................................153
DISCUSSION...................................................................................................................................................................153 SUMMARY OF CHAPTER................................................................................................................................................154
CHAPTER 8. DISCUSSION AND CONCLUSIONS ...............................................................................................155 MAJOR FINDINGS ..........................................................................................................................................................155
Characteristics of CTT Respondents......................................................................................................................155 Effects on Engagement............................................................................................................................................155 Effects on Perceived Benefits of Participation......................................................................................................159 Exploratory Data Regarding Retention .................................................................................................................159 Most Valuable Aspects of Participation ................................................................................................................160
LESSONS LEARNED REGARDING DATA COLLECTION AND STUDY DESIGN ...............................................................161 The Issue of Temporal Precedence ........................................................................................................................162 A Proposed Follow-Up Study.................................................................................................................................162
IMPLICATIONS AND DIRECTIONS FOR FUTURE RESEARCH..........................................................................................164 CTT Appeals to More Experienced Teachers........................................................................................................164 The Impact of Level of Involvement on Engagement ............................................................................................165 Engagement Levels of CTT Participants Before Participation............................................................................166 Interaction Between Participation in CTT and Emotional Exhaustion...............................................................166 Content Focus and Effective Professional Development......................................................................................166 Elements of Professional Development Most Effective at Increasing Engagement ...........................................167 CTT Respondents Searching For Renewal ............................................................................................................168 Opportunities for Participants to Stay Connected ................................................................................................169
SUMMARY AND CLOSING THOUGHTS ..........................................................................................................................170 REFERENCES ................................................................................................................................................................173 APPENDIX A: DETAILS OF EXISTING RESEARCH STUDIES RELATED TO TEACHER ENGAGEMENT AND RETENTION .........................................................................................................................186 APPENDIX B: RECRUITMENT E-MAIL TO COURAGE TO TEACH FACILITATORS AND ALUMNI............................................................................................................................................................................................190 APPENDIX C: ONLINE SURVEY FOR COURAGE TO TEACH ......................................................................194 APPENDIX D: ONLINE SURVEY FOR NATIONAL WRITING PROJECT ...................................................208 APPENDIX E: INSTRUCTORS AT THE COLLEGE/UNIVERSITY LEVEL .................................................210
DESCRIPTIVE CHARACTERISTICS .................................................................................................................................210

Geil
xi
Gender and Race/Ethnicity.....................................................................................................................................210 Age, Teaching Experience, and Retirement Eligibility .........................................................................................211 Full Time Status and Satisfaction With Salary......................................................................................................212
INTENTIONS TO REMAIN IN TEACHING ........................................................................................................................214 Effects of Participation on Retention Decisions ...................................................................................................215 Most Valuable Aspect of PD Program Participation ...........................................................................................216
SUMMARY .....................................................................................................................................................................217 APPENDIX F. REGRESSION COEFFICIENTS AND SUBCLASS DESCRIPTIVE STATISTICS..............218 APPENDIX G. MOST COMMONLY CODED THEMES IN OPEN-ENDED RESPONSE QUESTIONS ...221 APPENDIX H. LEVEL OF INVOLVEMENT SENSITIVITY ANALYSIS ........................................................223

Geil
xii
LIST OF TABLES
TABLE 2-1. EXISTING RESEARCH ON THE COURAGE TO TEACH PROGRAM......................................................................28 TABLE 2-2. RESEARCH ON DEMOGRAPHIC CHARACTERISTICS OF TEACHERS ON BURNOUT/ENGAGEMENT AND
ATTRITION/RETENTION .............................................................................................................................................36 TABLE 2-3. RESEARCH ON SCHOOL AND STUDENT CHARACTERISTICS AND TEACHER ATTRITION/RETENTION AND
BURNOUT/ENGAGEMENT...........................................................................................................................................42 TABLE 3-1. CTT AND NWP SAMPLE SITES .......................................................................................................................61 TABLE 3-2. RESPONSE RATES FOR CTT AND NWP...........................................................................................................62 TABLE 3-3. CORRELATIONS BETWEEN MBI SUBSCALES AND NCES BURNOUT/ENGAGEMENT SCALE ........................69 TABLE 3-4. CORRELATIONS BETWEEN MBI SUBSCALES AND APPLIED JOB, HOW LONG PLAN TO REMAIN TEACHER,
AND BECOME TEACHER AGAIN.................................................................................................................................70 TABLE 4-1. DEMOGRAPHIC CHARACTERISTICS OF CTT AND NWP PK-12 RESPONDENTS ............................................77 TABLE 4-2. SCHOOL AND STUDENT LEVEL CHARACTERISTICS OF CTT AND NWP RESPONDENTS ...............................85 TABLE 4-3. YEAR BEGAN PD PROGRAM AND TYPE OF CTT RETREAT SERIES ...............................................................91 TABLE 5-1. POTENTIALLY CONFOUNDING VARIABLES USED IN PROPENSITY SCORE MATCHING..................................95 TABLE 5-2. COMPARABILITY ON COVARIATES BEFORE PROPENSITY SCORE MATCHING ...............................................99 TABLE 5-3. COMPARISON OF MEAN AND STANDARDIZED DIFFERENCES BEFORE AND AFTER PROPENSITY SCORE
MATCHING ...............................................................................................................................................................104 TABLE 5-4. PERCENT BALANCE IMPROVEMENT IN MEAN DIFFERENCES AFTER PROPENSITY SCORE MATCHING ......106 TABLE 5-5. COMPARISON OF CTT AND NWP SCORES ON MBI SUBSCALES BEFORE PROPENSITY SCORE MATCHING
..................................................................................................................................................................................108 TABLE 5-6. COMPARISON OF CTT AND NWP EFFECT SIZES ON THE MBI SUBSCALES BY SUBCLASS AND OVERALL
..................................................................................................................................................................................109 TABLE 5-7. COMPARISON OF CTT SCORES ON MBI SUBSCALES TO MBI NORMATIVE SAMPLE OF TEACHERS ..........113 TABLE 5-8. DEMOGRAPHIC CHARACTERISTICS OF RECENT MBI TEACHER STUDIES ...................................................115 TABLE 5-9. COMPARISON OF CTT SCORES ON MBI SUBSCALES TO OTHER CONTEMPORARY STUDIES .....................116 TABLE 5-10. CTT RESPONDENTS COMPARED TO STUDIES AT SAME GRADE LEVEL ....................................................117 TABLE 5-11. ITEMS IN PERCEIVED BENEFITS OF PARTICIPATION SUBSCALES ...............................................................121 TABLE 5-12. PERCEIVED BENEFITS OF PD PROGRAM BEFORE PROPENSITY SCORE MATCHING ..................................122 TABLE 5-13. PERCEIVED BENEFITS OF PD PROGRAM AFTER PROPENSITY SCORE MATCHING ....................................123 TABLE 6-1. STATUS OF RESPONDENTS NOT CURRENTLY TEACHING AND THEIR REASONS FOR LEAVING ..................127 TABLE 6-2. INTENTIONS TO REMAIN IN TEACHING..........................................................................................................129 TABLE 6-3. COMPARISON OF PLANS TO REMAIN IN TEACHING BETWEEN CTT SAMPLE AND NEA SAMPLE..............130 TABLE 6-4. SELF-REPORTED EFFECTS ON RESPONDENTS’ DECISIONS TO REMAIN IN, LEAVE, OR RETURN TO
TEACHING.................................................................................................................................................................133

Geil
xiii
LIST OF FIGURES
FIGURE 2-1. DESIMONE’S PROPOSED CORE CONCEPTUAL FRAMEWORK FOR STUDYING THE EFFECTS OF PROFESSIONAL
DEVELOPMENT ON TEACHERS AND STUDENTS (P. 185). COPYRIGHT SAGE PUBLICATIONS, 2009.......................25 FIGURE 2-2. ADAPTATION OF DESIMONE’S CONCEPTUAL FRAMEWORK TO TRANSFORMATIVE PROFESSIONAL
DEVELOPMENT. ..........................................................................................................................................................27 FIGURE 3-1. SAMPLE SELECTION PROCESS FOR CTT AND NWP.......................................................................................59 FIGURE 3-2. SAMPLE ITEMS FROM THE MASLACH BURNOUT INVENTORY-EDUCATORS SURVEY...................................66 FIGURE 4-1. COMPARISON OF CTT RESPONDENTS AND THE NCES NATIONAL SAMPLE BY GENDER. ............................78 FIGURE 4-2. COMPARISON OF CTT RESPONDENTS AND THE NCES NATIONAL SAMPLE BY RACE/ETHNICITY. ..............79 FIGURE 4-3. COMPARISON OF CTT AND NWP RESPONDENTS BY AGE.............................................................................80 FIGURE 4-4. COMPARISON OF CTT AND NWP RESPONDENTS BY TEACHING EXPERIENCE. ............................................80 FIGURE 4-5. COMPARISON OF CTT RESPONDENTS AND THE NCES NATIONAL SAMPLE BY AGE. ...................................81 FIGURE 4-6. COMPARISON OF CTT RESPONDENTS AND THE NCES NATIONAL SAMPLE BY TEACHING EXPERIENCE.....81 FIGURE 4-7. COMPARISON OF CTT RESPONDENTS AND THE NCES NATIONAL SAMPLE BY FULL TIME TEACHING
STATUS. ......................................................................................................................................................................83 FIGURE 4-8. COMPARISON OF CTT RESPONDENTS AND THE NCES NATIONAL SAMPLE BY SCHOOL LEVEL. .................86 FIGURE 4-9. COMPARISON OF CTT RESPONDENTS AND THE NCES NATIONAL SAMPLE BY SCHOOL SIZE......................87 FIGURE 4-10. COMPARISON OF CTT AND THE NCES NATIONAL SAMPLE ON SCHOOL LOCALE......................................87 FIGURE 4-11. COMPARISON OF CTT AND THE NCES NATIONAL SAMPLE BY PUBLIC/PRIVATE SECTOR. .......................88 FIGURE 4-12. COMPARISON OF CTT RESPONDENTS AND THE NCES NATIONAL SAMPLE ON PERCENTAGES OF NON-
WHITE AND FRL STUDENTS......................................................................................................................................89 FIGURE 5-1. TREATMENT AND CONTROL CASES PLOTTED BY PROPENSITY SCORES, MATCHED AND UNMATCHED CASES,
AND SUBCLASSES. ....................................................................................................................................................102 FIGURE 5-2. STANDARDIZED MEAN DIFFERENCES ON COVARIATES BEFORE AND AFTER MATCHING. ...........................105 FIGURE 5-3. COMPARISON OF CTT AND NWP ON PERCEIVED BENEFICIAL EFFECTS OF PARTICIPATION IN THEIR
RESPECTIVE PD PROGRAM.......................................................................................................................................122
Geil
1
CHAPTER 1. RESEARCH PROBLEM AND SIGNIFICANCE OF STUDY
Introduction to the Research Problem
7:33A.M.: The shrill ringing of the phone penetrated into what had been a deep, dreamless sleep. Groggily, I answered it—I listened for a moment, and then sat bolt upright and started throwing on clothes and heading out of my apartment faster than I probably ever had in my whole life. It was the end of my first year of teaching high school Japanese at two local schools. For one of my classes, it was the day of the final exam. That class had started 15 minutes ago, and I was not there—thus the call from the school’s secretary. I had been so exhausted from end-of-semester activities the day before that I had taken a nap (something I rarely did before I started teaching) and had forgotten to switch my alarm back to A.M. from P.M. when I had gone to bed that night. It turned out all right in the end. It was a block class that lasted an hour and a half, and I had been planning to spend the first part reviewing anyhow—they just had to do it without me. And for my students, it was an added bonus when their teacher admitted to them that she had, indeed, overslept on the day of their final exam.
This incident, which took place over fifteen years ago, is representative in many ways of
how my first year of teaching went. It took all the resources and energy I could muster that first
year just to make it through each day, frantically come back home, grade papers, and try to figure
out what I would do in class the next day—and often I did not succeed as well as I would have
liked. It seemed that all I did that entire first year was go to school, plan for upcoming classes,
eat, and sleep. But I was also offered a window into the amazing world of teaching and learning.
My students were a fascinating collection of individuals, and trying to figure out how to best
reach each one of them on a day-to-day basis was an emotional and intellectual challenge that I
found very inspiring and satisfying. Teaching was, and still is, the most challenging and
rewarding job I have ever been lucky enough to have.
Geil
2
After two years of teaching, I had the beginnings of a strong and self-sustaining Japanese
language program at one of the schools. I had gone to Japan that summer with students and come
back reenergized and with lots of new ideas and materials. But I did not get to teach that third
year. My emergency teaching license was no longer sufficient, even though I planned on entering
an alternative licensure program, because now another person with a Japanese teaching license in
hand was available. And yet, I have to wonder—even if I had been able to teach that third year,
how long would I have stayed? Would I have been able to keep up the pace I was setting for
myself? Would I have left teaching altogether in a year or two more, or ended up staying but
without the passion that I had for teaching when I first started? I will never know the answers to
these questions, but they do help to explain how I have come to write a dissertation on
transformative professional development and teacher engagement and retention.
The Person Who Teaches
I am particularly interested in professional development programs that go beyond the
traditional focus on teaching technique and skills. I will refer to these programs as
transformative, in that they focus specifically on the person who teaches. Thanks to this focus,
the whole person becomes important: not just what she1 knows about subject matter and
pedagogy, but also—for example—how she interacts with her students; what kind of
relationships she has with her colleagues; how her own emotions influence her teaching; whether
or not she views teaching as a vocation or as “just a job;” and how she can best take care of
herself so that she has as much to give as possible to her teaching. Once again, my interest in this
form of professional development has been piqued by my own experiences as a teacher.
1 For consistency, and since the majority of the subjects in my study are female, I will use “she” as a generic term intended to refer to both male and female teachers and respondents.

Geil
3
I alluded above to the fact that I spent not only large amounts of time and energy as I
began to learn how to teach, but also a great deal of emotional energy. I quickly realized that
knowing my subject matter, although an absolutely necessary part of teaching well, was
insufficient. If I did not connect my subject material to my students in some way, if I did not
share my love of Japanese with them and draw out their own passions, then much of what I
attempted in the classroom fell on deaf ears. I also realized that I was not just dealing with
Japanese vocabulary and grammar structures in my classroom, but with whole human beings
who brought a wide variety of background knowledge and experiences to the table.
When I felt that I was most effective as a teacher, it was when I was able to help students
see strengths in themselves and in others that they had not been able to see before. I was only
able to do this if I developed relationships with my students and cultivated my own self-
awareness. During my first year a group of my students and I started a Japanese culture club, and
I was amazed at how different our interactions were when we were not in the classroom. In some
cases, I felt as if I was seeing students in a completely different light—becoming aware of
interests, talents, concerns, and insecurities that had not been apparent to me before. All of this
new information helped me in the classroom, specifically in my interactions with my students,
and how I responded to them and what I expected of them. When I saw how enthusiastically and
knowledgeably Haley talked about Japanese anime (animated cartoons), I realized that she did
have a genuine connection and interest in learning Japanese, even if I had not yet seen it in the
classroom—but I could find ways to build on that interest. If I knew that Ryan was likely not
paying attention because he was thinking about his parents’ impending divorce, I could avoid
projecting my own insecurities onto him and thinking that he was not paying attention because
he was being rebellious, or because I was a terrible teacher. As my students and I grew to know

Geil
4
more about each other, and as I realized more about myself and how I influenced interactions
with my students, the more positive our relationships became. In turn, more learning took place
in the classroom, and I felt more enthusiastic and fulfilled about teaching.
Getting to that point was not easy. I clashed with my students as I tried to figure out how
strict to be, whether to allow them to turn in homework late, how to deal with absences, what
tone to take with them as we interacted in the classroom. I needed all the help I could get, and I
turned to colleagues and friends who were willing to listen to my worries and concerns about
teaching. I needed to process what was going on in my classroom, how I had reacted, what I
could do differently next time, and I desperately wanted new ideas and perspectives. I needed
people who could acknowledge the conflicting emotions that I was feeling—exhilaration when
something went well, anxiety when I said the wrong thing or used too harsh a tone, fear that I
would come across as inexperienced. I did not want someone to tell me how to teach—I just
needed someone who would listen to me and provide support as I went through the process of
discovering who I was as a teacher. The people that I found with whom I could have these sorts
of conversations, especially current or former teachers, were invaluable to me in my
development. There was no formal outlet for this, however, and although I did find colleagues
who were willing to converse about teaching in this way, I had to seek them out on my own.
Many years later, when I was teaching an introductory undergraduate education course at
the University of Colorado at Boulder, I discovered a professional development program that met
many of the needs I had experienced in my initial foray into teaching. Through a connection with
one of my professors, I was able to attend a sampler retreat based on the Courage to Teach
professional development program, which is a program that is explicitly trying to be
transformative in its focus (M. Jackson & Jackson, 2002). At a retreat center tucked away in the

Geil
5
mountains, a diverse group of K-16 teachers, administrators, and graduate students gathered
together for a weekend to discuss the meaning of teaching in their lives and to reconnect with
their own personal gifts and strengths so that they could draw on them more completely in the
classroom and in their work. The retreat was not about offering advice, but rather about deep
listening and providing time for self-reflection, both in solitude and in the company of others. I
was hooked—this was exactly the sort of community I had been seeking when I first began
teaching Japanese all those years ago. I could only imagine how much having had access to a
community such as this would have helped me as a new teacher.
The Courage to Teach sampler retreat provided me with the space to reflect on many
questions, including how best to interact with my students, my relationships with my colleagues,
and my sense of myself as a teacher. These issues are closely intertwined with whether or not I
would have continued to teach at the K-12 level and the degree to which I would have remained
engaged. Together, these experiences have led me to hypothesize that transformative
professional development programs that focus on and provide support to the person who teaches
can be a valuable tool in helping teachers to stay positively engaged with the profession of
teaching.
Research Questions
The primary research question for this study is whether or not participation in a
transformative professional development (TPD) program has an effect on subsequent teacher
engagement and retention. Two other related questions involve the background characteristics of
teachers who choose to participate in TPD, and the perceived benefits of participation in TPD
programs.

Geil
6
To answer these questions, I gathered demographic information as well as data related to
engagement with teaching and perceived program benefits by surveying two groups of teachers:
(a) alumni of Courage to Teach, a transformative professional development program, and (b) a
sample of alumni from the National Writing Project, a non-transformative professional
development program. While the National Writing Project does contain some transformative
elements, it is not expressly designed as a TPD program and thus acts as a control group in this
quasi-experimental study. The three primary research questions are as follows:
1. What are the characteristics of teachers who participate in a transformative
professional development program such as Courage to Teach? How do they compare
to teachers who participate in other forms of professional development, and in what
ways?
2. Does participation in Courage to Teach have an effect on subsequent engagement
with and retention in teaching?
3. Are there differences between Courage to Teach and National Writing Project
participants with regards to (a) their assessment of the program’s effects on their
understanding of subject matter, professional relationships, energy levels, and
motivation to teach, and (b) their personal perceptions of the program’s most valuable
aspects?
The data from the two groups of professional development (PD) program alumni on the
online survey will be compared with each other, and the Courage to Teach (CTT) data will also
be compared with normative samples from previously existing instruments, and with a nationally
representative sample of teachers from the U.S. Department of Education’s National Center for
Education Statistics’ most recent Schools and Staffing and Teacher Follow-Up Surveys.
Geil
7
Characteristics that could affect engagement and retention other than participation in the PD
program (e.g., age, teaching experience, school size) will be accounted for in the study design,
which will be discussed in detail in Chapters Three and Five.
Significance of the Study
When teachers become less engaged, schools, teachers, and students all suffer. In
addition, teachers who lose their sense of engagement with the profession may decide to leave
the field, which has its own set of costs and consequences. Teachers are also a key component of
the success of the entire educational process, and so it is critically important to find ways to
promote teacher engagement.
Engagement and Burnout
What does an engaged teacher look like? She is enthusiastic about teaching, and looks
forward to going to school in the morning. She enjoys interacting with the people she comes into
contact with throughout the day, whether they are students, parents, staff, colleagues, or
administrators. She looks at her students positively, and is willing to give them the benefit of the
doubt even when they disappoint her; she is able to see things from their point of view. She sees
potential in her students, and she challenges herself to find out what they need in order to unlock
that potential and help them move forward with their learning. Her teaching brings her
satisfaction; she feels efficacious in her work and confident that her time and energy are being
well spent—that she is indeed making a difference (Maslach, 2003; Maslach, Schaufeli, &
Leiter, 2001).
Unfortunately, the exact opposite is an all too frequent picture: a teacher who dreads
going to school each day, who is sure her students are incapable of learning and have few
redeeming characteristics, who feels that she is wasting her time and energy in trying to teach or
Geil
8
do anything beyond the bare minimum (because the students will not appreciate her efforts or
take anything away from it anyway). This teacher is burned out.
Both these pictures are, of course, extremes, but they provide good descriptions of the
concepts of engagement and burnout. Much research has been done on the concept of burnout,
which is defined as:
...a syndrome of emotional exhaustion, depersonalization, and reduced personal
accomplishment that can occur among individuals who do “people-work” of some
kind. It is a response to the chronic emotional strain of dealing extensively with
other human beings, particularly when they are troubled or having problems.
(Maslach, 1982/2003, p. 2)
While burnout is often considered on its own, as a distinct phenomenon, recent work has
suggested that burnout can be viewed as one end of a spectrum, the opposite end of which is
“engagement” – a sense of personal fulfillment, energy, involvement, and efficacy regarding
one’s work (Leiter & Maslach, 2005; Maslach, 2003; Maslach, Jackson, & Leiter, 1996; Maslach
& Leiter, 2008; Maslach et al., 2001). If burnout is the negative end of the continuum, then
engagement is the positive end, and this continuum can be broken down even further into three
components: exhaustion-energy, cynicism-involvement, and inefficacy-efficacy (Leiter &
Maslach, 2005; Maslach & Leiter, 2008).
Burnout manifests itself through the following three dimensions: emotional exhaustion,
which involves a lack of energy for getting the job done, wanting to stay home from work or
even quit, and a feeling of “just not having anything left to give.” The second dimension,
cynicism or depersonalization, shows how the individual feels about others—someone with a
high degree of cynicism might start to detach from her students, to view them more harshly and
Geil
9
negatively, to see them less clearly as people she can empathize with and more as “others” who
are not deserving of her attention and are not capable of learning. The third dimension,
professional efficacy or personal accomplishment, is a reflection of how the person evaluates
herself. Feelings of inefficacy, a sense that nothing is being accomplished or can be
accomplished, and of one’s time and energy being wasted go along with reduced professional
efficacy (Byrne, 1999; Huberman & Vandenberghe, 1999; Maslach, 1982/2003, 1993, 1999,
2003; Maslach et al., 2001; Schutte, Toppinen, Kalimo, & Schaufeli, 2000).
An engaged teacher, on the contrary, would have low emotional exhaustion, low levels of
cynicism, and high feelings of professional efficacy. Engaged teachers have energy for getting
the job done, an eagerness to go to work, and the necessary emotional resources. They are
connected to their students, view them positively, see them as people they can empathize with,
and they also draw strength from their interactions with colleagues and other members of the
school community. Engaged teachers have strong feelings of efficacy, a sense of
accomplishment, and a belief that their time and energy are being put to good use.
The Importance of Engaged Teachers
Over the years, reviews of studies on student achievement have consistently shown that
the differences among teachers account for more of the variation in student performance than
almost any other in-school factor, including class size, composition of the students, and methods
or curriculum used (American Council of Education, 1999, 2002; Darling-Hammond, 2006a;
Darling-Hammond & Youngs, 2002; Hawley & Valli, 1999; Rivkin, Hanushek, & Kain, 2005).
While this is something that seems obvious for many people based on their own school
experiences, there is now empirical research to back up this claim. As the American Council of
Education’s research synthesis states, “The success of the student depends most of all on the

Geil
10
quality of the teacher. We know from empirical data what our intuition has always told us:
Teachers make a difference. We now know that teachers make the difference” (1999, p. 5).
Many educational researchers agree that we must look out for the well-being and vitality of our
teachers as they are such an important part of the effective functioning of our schools and the
education of our students (Darling-Hammond, 2006a; Darling-Hammond & Youngs, 2002;
Intrator & Kunzman, 2006; Maslach & Leiter, 1999).
Sam Intrator (2005) shares the words of a outstanding teacher, who told him that the most
critical aspect of good teaching was best expressed through the old saying, “‘If Momma ain’t
happy, ain’t nobody happy.’ If you get a teacher in the classroom who’s not happy, then look
out, little children” (p. 12). Intrator goes on to elaborate further:
It’s worth lingering on the cold implications of this teacher’s observation. If our
teachers are unwell— weary, unhappy, or demoralized— then our children will
suffer. Conversely, available, energized, and soulful teachers provide
opportunities for our children to thrive because—as teachers—our moral energy
matters, our idealism matters, our capacity to be fully present for students matters.
In other words—who we are matters. (2005, p. 12)
This observation brings home the fact that teachers, and especially engaged teachers, are a
critically important part of the learning process. Student learning is affected by teachers in many
ways; for example, one study found that college students randomly assigned to hear a short
lecture from a highly enthusiastic teacher (as measured by specific non-verbal cues) consistently
reported feeling more intrinsic motivation to learn about the subject of the lecture than the
students assigned to the low enthusiasm condition (Patrick, Hisley, & Kempler, 2000). Another
study with Dutch music teachers and their students found evidence of a correlation between the
Geil
11
amount of work enjoyment, absorption, and intrinsic motivation that the teachers felt and the
amount of similar experiences their students reported feeling (Bakker, 2005). Many teachers
themselves believe this to be true: in a national survey of over 40,000 teachers (Scholastic Inc. &
the Bill and Melinda Gates Foundation, 2010), 82% rated “effective and engaged teachers” as
absolutely essential to improving student achievement, more than any other item on the list.
The Costs Associated with Low Engagement and Burnout
Many teachers grapple with a loss of engagement in their vocation after years of
struggling with bureaucratic requirements, accountability standards, and low societal respect and
salaries (Brackett, Palomera, Mojsa-Kaja, Reyes, & Salovey, 2010; Farber, 1983; Sakharov &
Farber, 1983; Wood & McCarthy, 2002). This loss of engagement is exacerbated by discipline
problems in the classroom and the fact that teachers may do their work each day with few
opportunities to even talk to another adult, much less the chance to exchange ideas or collaborate
(Brouwers & Tomic, 2000; Cherniss, 1995; Pines, 2002; Troman, 2000). Furthermore, in today’s
climate of educational reforms and standardized testing, many teachers find themselves in
situations that force them to act in ways that run counter to their own purposes and values
regarding teaching.
All of the causes mentioned above can lead to a lack of engagement, or burnout, that can
be serious for the professionals themselves, the institutions in which they work, and the clients
they serve. Teachers suffering from a loss of engagement have essentially three options:
somehow reengaging with the profession, leaving the profession, or staying on but teaching in a
disaffected manner. Obviously those who stay on continue to affect their students most directly,
but the consequences of a loss of engagement with the vocation of teaching can affect all
students and teachers, regardless of where the teachers are in the process.

Geil
12
Initial studies conducted in the 1970s and 1980s by Maslach, Jackson, and colleagues
found a variety of negative consequences for not only the burned out professional, but also the
institution in which she worked and the clients in her care. These studies showed that:
[burnout can lead to] a deterioration in the quality of care or service provided by
the staff. It appears to be a factor in job turnover, absenteeism, and low morale.
Furthermore, burnout seems to be correlated with various self-reported indices of
personal dysfunction, including physical exhaustion, insomnia, increased use of
alcohol and drugs, and marital and family problems. (Maslach et al., 1996, p. 4)
Later studies have confirmed these findings—for example, Lowenstein (1991) found that
burnout among teachers was correlated with feelings of hopelessness, impatience, and irritability,
as well as increased drug and alcohol abuse. Teachers who have become burned out tend to have
less motivation or interest in teaching. They are not as patient when interacting with students,
and they are also less optimistic. As a result, they invest less time in planning for their courses,
and interact less with their students in terms of both quantity and quality. Students are likely to
receive less positive feedback and more criticism, which can affect their sense of self-efficacy
and ultimately their sense of competence as learners and their attitudes towards school (Farber,
1991; Huberman & Vandenberghe, 1999; Hughes, 2001; Maslach & Leiter, 1999; Pines, 2002).
Burned out teachers can negatively affect their colleagues as well, by causing personal conflict
or not following through on job tasks (Maslach et al., 2001). Burnout is correlated with the desire
to change jobs and thoughts about leaving teaching (S. E. Jackson, Schwab, & Schuler, 1986).
Eventually, some teachers leave the profession all together, and this brings with it its own host of
consequences.

Geil
13
The Costs Associated with Movers and Leavers
Districts across the nation are continually faced with the problem of attracting and
retaining qualified teachers. Teachers new to the profession leave at an alarming rate: almost
one-third leave within the first three years, and up to 50% after five years (Alliance for Excellent
Education, 2005; National Education Association, 2003a, 2003b). Even though many teachers
report high rates of fulfillment with their careers, they tend to leave at higher rates than those in
other occupations (Public Education Network, 2003). Ingersoll (2001), in an analysis of School
and Staffing Survey data from the early 1990s, found that the turnover rate for teachers hovered
at a rather high 14% compared to the annual rate of employee turnover in all fields, which the
Bureau of National Affairs has published at 11%. Approximately half of this turnover can be
attributed to teachers leaving the profession due to retirement, to have a family, or because they
are dissatisfied with teaching—the “leavers.” The other half consists of teachers who remain in
the profession but move to different schools—the “movers” (Luekens, Lyter, & Fox, 2004;
Provasnik & Dorfman, 2005). The percentage of all teachers who leave the profession in any
given year has gone up fairly steadily from 5.1% in the early 1990s to 8.0% in 2008-2009
(Keigher, 2010).
The cost to schools and students of these high turnover rates is, by some counts,
immense. The Alliance for Educational Excellence (2005) conservatively estimates that the
nation loses $2.2 billion each year to replace just the “leavers.” If the “movers” are included, the
cost rises to an estimated $4.9 billion every year. Regardless of whether teachers are transferring
to other schools or leaving the profession, administrators are still faced with the same task of
replacing them. This means more time and money spent hiring, recruiting, and training new
teachers (Luekens et al., 2004; Provasnik & Dorfman, 2005; Public Education Network, 2003).

Geil
14
Some estimate that it can cost up to $50,000 just to replace one teacher (Carroll & Fulton, 2004;
Darling-Hammond, 2006b).
There are also potential negative effects for both schools and students. Students suffer
because new teachers, especially if they did not receive adequate preparation to become a
teacher, often do not know how to effectively help all their students learn. They are too
frequently overwhelmed by “basic survival and classroom management rather than student
learning” (Darling-Hammond, 2006a, p. 42). Qualitative and quantitative research has shown
that new teachers are not as confident and effective in their practices as more experienced
teachers (Feiman-Nemser, 2001; Hanushek, Kain, & Rivkin, 1998; Rivkin et al., 2005). Even
more experienced teachers that move to a new school will have to divert some of their mental
energies to the tasks of getting to know the new school, its students, and its culture. Finally, on
an organizational level high turnover rates can negatively affect the community and cohesiveness
of a school, which are recognized as being of prime importance to the overall functioning and
effectiveness of schools (Bryk & Schneider, 2002; Ingersoll, 2001).
Clearly the costs to schools and students of low teacher engagement and high teacher
attrition rates are considerable in terms of time, money, energy, community, student learning,
and effectiveness. Engagement and retention of teachers are major issues for schools, and finding
ways to promote either one of them is a valuable goal. Recognizing the importance of teachers to
the educational process also reminds us of the need to help teachers be as engaged and as
effective as possible.
Possible Ways to Promote Engagement and Reduce Attrition
There are many ways we might be able to promote engagement and retention among
teachers. Attempts to address various structural issues are being made all around the country. For

Geil
15
example, the small schools movement tries to make schools and class sizes smaller so that it is
easier for meaningful relationships to be formed. Other districts are trying to adjust schedules to
allow greater opportunities for teachers to collaborate with other teachers and to engage with
their students in more meaningful ways. Schedules can be structured so that all of the teachers in
a department have regularly scheduled times to meet together or have their planning periods at
the same time. Block schedules in which students have longer class periods fewer times a week
allow teachers to have more time with their students, cover the subject matter more in-depth, and
get to know their students better (Coalition of Essential Schools, 2006; Hargreaves, 1998;
Hoffman & Levak, 2003; Sizer, 1999). And, of course, in many places the emphasis is on raising
salaries to higher levels or providing other financial incentives, both to entice qualified
candidates into teaching and to encourage others to stay (Hanushek, Kain, & Rivkin, 2001;
Moore Johnson et al., 2001; National Education Association, 2003a).
While structural changes to the working conditions and societal status of teachers are
definitely needed, another way to increase engagement, retention, and the well-being of teachers
is through professional development. Often, when we talk about influencing teachers, we focus
on teacher preparation programs. However, only about 17% of the teaching force are new hires
in a typical year, and only 4% are actually new to the profession and teaching for the first time—
all the rest of the new hires are experienced teachers who are either moving schools or are
returning to the profession after a break, often to raise a family (Provasnik & Dorfman, 2005).
Thus, inservice professional development is important because it has the potential to impact a
very high percentage of teachers. But all forms of professional development are not the same; in
fact, they often have very different goals.

Geil
16
The Potential of Transformative Professional Development
Transformative professional development that focuses on the person who teaches may be
able to address some of the needs that teachers have even after participating in preservice teacher
education programs and becoming a teacher. While teacher preparation programs provide
content and pedagogical skills, they rarely prepare new teachers for the emotional and
interpersonal interactions needed to be successful in the classroom (Cherniss, 1995; Friedman,
2000; Maslach, 1993; Pines, Aronson, & Kafry, 1981; Sakharov & Farber, 1983). As Darling-
Hammond says, teachers need the kind of preparation that will help them “manage, with grace
and purpose, the thousands of interactions that occur in a classroom each day” (2006a, p. 5).
Even the most experienced teachers are not immune from the struggles that can accompany a
particularly challenging student or difficult colleague. Teachers also rarely have the chance to
slow down and reflect on their strengths and weaknesses, their relationships, and the balance
between their personal and professional lives in a constructive manner. Transformative
professional development programs offer opportunities for the people who teach to focus on the
relational, emotional, and personal aspects of teaching, while providing what is sometimes a
much-needed source of support.
Summary and Structure of Remaining Chapters
This introductory chapter explained how I came to be interested in the issue of teacher
engagement as well as in transformative professional development. The primary research
questions and methods of data collection were introduced. Portraits of engaged and burned out
teachers were painted, and the concepts of burnout and engagement explicated. I discussed how
attrition and a loss of engagement on the part of teachers leads to great costs for schools,

Geil
17
communities, students, and teachers, and the importance of teachers themselves in the learning
process.
In Chapter Two, I will define transformative professional development in more detail and
introduce the transformative professional development program that will be the focus of this
study: Courage to Teach (CTT). I will review the research that has been conducted to date on
Courage to Teach programs to explain why I expect a program like CTT to influence
engagement and retention among teachers. Characteristics of schools, students, and teachers that
could also influence engagement and retention, as well as provide a descriptive picture of the
teachers who participate in TPD, will also be examined.
In Chapter Three, I will discuss the design of the study—a survey administered to a
sample of alumni from Courage to Teach and from the National Writing Project (NWP). The
sample selection process and the survey instrument will be reviewed. The primary instrument I
will use to measure engagement, the Maslach Burnout Inventory-Educators Survey, will be
discussed in terms of its reliability and validity. I will also describe the pilot test I conducted, talk
about confidentiality issues, and consider limitations to the survey data.
Chapter Four will discuss the results of the first research question, which asks about the
demographic characteristics of PK-12 teachers who choose to participate in Courage to Teach.
Chapter Five will delve into the second and third research questions, with regards to those data
being used to calculate estimated effects. I will also describe the technique called propensity
score matching, which matches the respondents in the two groups on a number of potentially
confounding variables to obtain the most comparable sample possible. This matched sample is
then used to make a causal estimation of an effect. Chapter Six and Chapter Seven will present
the remaining data on the second and third research questions, which are of a qualitative,

Geil
18
exploratory nature. Finally, Chapter Eight will synthesize the results, consider ways in which the
study could be improved, and talk about directions for future research.
Geil
19
CHAPTER 2. LITERATURE REVIEW AND CONCEPTUAL FRAMEWORK
Transformative Professional Development and Courage to Teach
Transformative professional development (TPD) holds particular promise for the
promotion of engagement with and retention in the profession of teaching. TPD encompasses
professional development programs that focus on the person who teaches, and not just on the
“what” or the “how” of teaching. As Parker Palmer (1998) explains,
The question we most commonly ask is the “what” question—what subjects shall
we teach? When the conversation goes a bit deeper, we ask the “how” question—
what methods and techniques are required to teach well? Occasionally, when it
goes deeper still, we ask the “why” question—for what purpose and to what ends
do we teach? But seldom, if ever, do we ask the “who” question—who is the self
that teaches? How does the quality of my selfhood form—or deform—the way I
relate to my students, my subject, my colleagues, my world? (p. 4)
In professional development programs that focus on the self that teaches, space opens up to
consider the whole person—not only the rational and cognitive aspects of teaching, but also the
emotional aspects, the relationships and interactions that take place in schools, and the teacher’s
own self-understanding and personal well-being. This definition aligns with that of the Fetzer
Institute, a Michigan-based philanthropic research center, which defines transformative
professional development as encompassing a small but innovative group of programs that focus
“on the emotional, spiritual, and personal dimensions of educators so they can bring their identity
and integrity more fully into their work” (Fetzer Institute, 2005, p. 1). A review of seven
transformative professional development programs found that all have a focus on wholeness, a
goal of integrating personal and professional worlds, and are based on a foundation of self-

Geil
20
awareness and community support (Byrnes & Borko, 2008). Goals of such transformative
professional development programs include giving teachers the chance “to renew their vitality
and sense of purpose, increase their capacity to be present, and draw on their inner resources...[so
that they can] engage in more meaningful ways in the classroom and with their colleagues”
(Fetzer Institute, 2005, p. 1). Inherent in this definition of transformative professional
development is a sense that the program will provide teachers with a source of personal support,
something that is often lacking in our educational culture. As Bryk and Schneider (2002) point
out,
While most discussions in education policy today focus on the technical
dimensions of teaching and its enhancement, that teachers’ humanness is very
much a part of their practice is important to remember, and teachers need
expressions of personal regard and support as much as anyone else does. (p. 27)
The use of the word “transformative” is also enlightening; with regards to people it
means to change or convert the appearance, character, nature, or condition of someone
(American Heritage Dictionary, 2001; Merriam-Webster, n.d.). As used in TPD, the implication
is that those who participate in such programs will leave feeling differently about themselves
than when they came in. This is due to the emphasis on the person who teaches, and it is the
“self” that is most likely to be “transformed.” In other contexts, “transformative” may refer to
political or social change on a more structural or systemic level, but in this study the term
indicates transformation at the level of the individual.
The primary difference between transformative professional development and other
forms of professional development is the area of focus. TPD focuses on the person who
teaches—the “who” of teaching, rather than the “what” and the “how”—and on the emotional
Geil
21
and relational aspects of teaching, how the teacher personally identifies with the profession of
teaching, and the well-being of the teacher. There is a hope that participants will learn ways to
take care of themselves on a personal level, which in turn may help them to better balance and
integrate their life and work. It could be said that TPD programs are “tending teachers not
training teachers” (Intrator & Scribner, 1998, p. 17). On the other hand, most non-transformative
professional development programs focus on a particular content area and the development of
the teachers’ knowledge and pedagogical skills, or on specific aspects of teaching such as
classroom management (Desimone, Porter, Garet, Yoon, & Birman, 2002; No Child Left Behind
Act, 2001). Specifically missing from the goals of a non-transformative professional
development program is this focus on the personal well-being of the participants—although it
may, of course, be a side-effect.
The History, Structure, and Mission of Courage to Teach
The Courage to Teach professional development program, now one of the most well
established examples of a transformative professional development program in the country, is the
focus of the current study. Courage to Teach began as a collaborative undertaking between
Parker Palmer, an author and educator, and the Fetzer Institute in Kalamazoo, Michigan. The
Fetzer Institute was interested in developing a long-term project that would “aid in the
‘formation of teachers’,” and in 1992 its president asked Palmer, a Senior Advisor at the
institute, to write a memo that could be used to inform the creation of this project (Center for
Courage and Renewal, 2006b). As Palmer (1992) explained, the focus of this program was to be
on teacher formation rather than teacher training for several reasons:
Formation is a concept from the spiritual traditions, and it involves a concern for
personal wholeness. Where training asks if the person has the right knowledge

Geil
22
and technique, formation asks after the state of the person’s soul. Where training
offers the person new data and methods, formation offers the person help in
discerning his or her identity and integrity. (p. 1)
In 1994 the first pilot retreat series began in southwest Michigan with 22 teachers in
attendance and Palmer as the facilitator. The response to this initial foray into a retreat series for
teachers that focused not on training and technique but on teachers’ individual integrity and
identity was “overwhelmingly positive,” and in 1996 four more sites across the country began
retreat programs: Michigan, South Carolina, Washington State, and Maryland/District of
Columbia (Palmer, Jackson, Jackson, & Sluyter, 2001). Today, the Center for Courage and
Renewal lists 106 Courage to Teach facilitators living in 30 states, along with an additional four
facilitators in Canada and one in Australia (Center for Courage and Renewal, n.d.-a). At least
3,000 educators have participated in Courage to Teach retreat series since that first pilot program
took place (Chadsey, 2010). The program has widened to include school principals and other
administrators, and has also spread into the fields of medicine, law, religion, philanthropy, and
the non-profit sector (Center for Courage and Renewal, 2006a, 2006b).
A Courage to Teach retreat series consists of four to eight quarterly retreats over a year
and a half to two years. All of the three-day weekend retreats have a specific seasonal theme,
which allows the group of twenty to thirty educators to use the “rich metaphors of the seasons as
a way of exploring vocational and life questions” (Center for Courage and Renewal, n.d.-b).
Both solitude and community are required for this work, and opportunities for large-group,
small-group, and individual pursuits are part of each retreat (Palmer et al., 2001). A variety of
methods are used to facilitate conversation and reflection, including personal stories, metaphors,
and poems (Center for Courage and Renewal, n.d.-b; M. Jackson & Jackson, 2002). The retreats
Geil
23
themselves are held in settings conducive to these activities, with adequate space for group work,
proximity to nature or walking paths, and comfortable rooms and nourishing food; participants
have noted the physical environment and the degree of care and respect with which they were
treated as being important parts of their overall experience (Intrator & Scribner, 1998, 2002).
Courage to Teach is specifically not about content, technique, or school reform, but rather
focuses on “renewing the inner lives of professionals in education.” The intention is that
participation in a Courage to Teach retreat series:
• Renews heart, mind, and spirit through the exploration of the inner landscape of a
teacher’s life;
• Reconnects to one’s identity and integrity—identifying and honoring gifts and
strengths, and acknowledging limits;
• Creates a context for careful listening and deep connection that also honors
diversity in person and profession;
• Helps educators create safe spaces and trusting relationships in their schools, with
their students and colleagues, and within their communities; and
• Explores the connection between attending to the inner life of educators and the
renewal of public education. (Center for Courage and Renewal, n.d.-b)
The focus of Courage to Teach is entirely on the person who teaches: that person’s
relationships, emotions, and engagement with teaching. Of particular importance in Courage to
Teach is the relationship between “soul and role”—between the identity of the person who
teaches and the professional role of the teacher, and the degree to which they are or are not a
good match (M. Jackson & Jackson, 2002). Courage to Teach operates under the assumption that
“we teach who we are,” and that it is only through exploring the self that teachers can bring the

Geil
24
best parts of themselves to bear in their teaching (M. Jackson & Jackson, 2002, p. 288). Courage
to Teach also aims to build safe spaces in which trusting relationships, deep listening skills, and a
caring community can be developed with the goal that participants will be able to create similar
spaces in their own schools and communities when they return (M. Jackson & Jackson, 2002;
Palmer et al., 2001). Finally, the program hopes to provide teachers with the space and time to
reflect on their lives and their teaching so that they may rediscover their vocational clarity,
(whether that means staying in teaching or not) and find a sense of renewal (M. Jackson &
Jackson, 2002).
Courage to Teach and the Elements of Effective Professional Development
While there is no absolute agreement on how to determine high-quality professional
development, a consensus has emerged on the elements that are most likely to lead to effective
professional development, which is generally defined as professional development that results in
changes in teacher knowledge, beliefs, and practices and ultimately in positive student learning
outcomes (Choy, Chen, & Bugarin, 2006; Desimone, 2009; Elmore, 2002; Hawley & Valli,
1999; Little, 1993; Porter, Garet, Desimone, Yoon, & Birman, 2000; Public Education Network
& The Finance Project, 2004; Wayne, Yoon, Zhu, Cronen, & Garet, 2008). Some of these
elements are based on “best practices” or expert opinion, others on theory, and others on
correlational research or case studies (Garet, Porter, Desimone, Birman, & Yoon, 2001).
Relatively little empirical research exists on whether and how these elements translate into
student outcomes or improvements in teaching, but gradually more research is being done to fill
this gap (Garet et al., 2001; Wayne et al., 2008).
The elements that are mentioned most frequently in the effective professional
development literature are those related to content, the teacher as a source of expertise, alignment
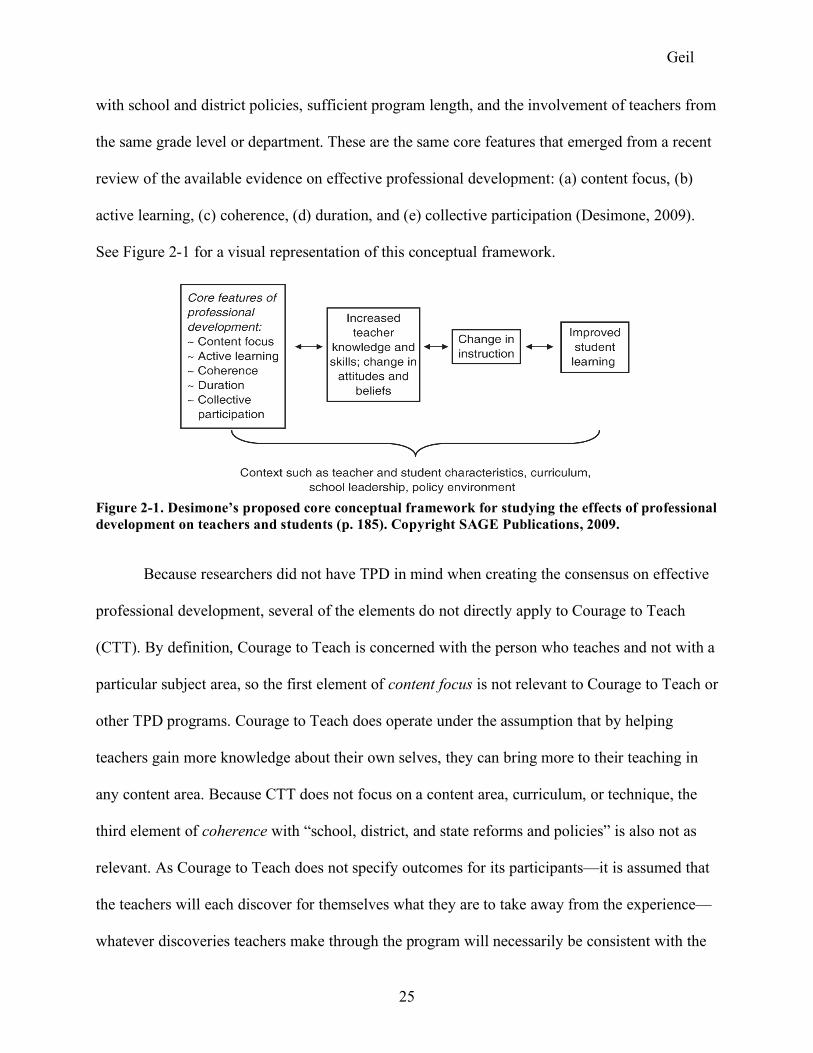
Geil
25
with school and district policies, sufficient program length, and the involvement of teachers from
the same grade level or department. These are the same core features that emerged from a recent
review of the available evidence on effective professional development: (a) content focus, (b)
active learning, (c) coherence, (d) duration, and (e) collective participation (Desimone, 2009).
See Figure 2-1 for a visual representation of this conceptual framework.
Figure 2-1. Desimone’s proposed core conceptual framework for studying the effects of professional development on teachers and students (p. 185). Copyright SAGE Publications, 2009.
Because researchers did not have TPD in mind when creating the consensus on effective
professional development, several of the elements do not directly apply to Courage to Teach
(CTT). By definition, Courage to Teach is concerned with the person who teaches and not with a
particular subject area, so the first element of content focus is not relevant to Courage to Teach or
other TPD programs. Courage to Teach does operate under the assumption that by helping
teachers gain more knowledge about their own selves, they can bring more to their teaching in
any content area. Because CTT does not focus on a content area, curriculum, or technique, the
third element of coherence with “school, district, and state reforms and policies” is also not as
relevant. As Courage to Teach does not specify outcomes for its participants—it is assumed that
the teachers will each discover for themselves what they are to take away from the experience—
whatever discoveries teachers make through the program will necessarily be consistent with the

Geil
26
teachers’ current knowledge and beliefs. The fifth element of effective professional development
is collective participation, which is defined as involving participants from the same grade,
department, or school (Desimone, 2009). CTT programs are occasionally focused around
participants from a single school, but because content is not the primary focus, this requirement
is again not as critical for CTT. Courage to Teach does focus on creating a professional learning
community that is collegial, collaborative, safe, and trusting, and it aims to provide participants
with the skills to foster similar relationships at their own schools (M. Jackson & Jackson, 2002;
Palmer, 1998)
Courage to Teach certainly possesses the second element of effective professional
development, that of active learning and viewing teachers as “experts.” Participants are rarely, if
ever, passively participating—they are writing, thinking, reflecting, sharing, reading, and
actively listening (M. Jackson & Jackson, 2002). In addition, CTT assumes that all teachers have
their own “inner teacher,” or source of wisdom and guidance, and one of the purposes of the
retreats is to help teachers listen to this inner voice. The underlying philosophy of CTT is that
teachers bring with them a wealth of knowledge about teaching and about students, as well as
themselves, and all they need are the tools and the resources to tap into this (M. Jackson &
Jackson, 2002; Palmer, 1998). The fourth element of effective professional development, which
is for the program to be of sufficient duration, is also met. Courage to Teach is definitely not a
one-shot workshop or conference; participants meet for at least four weekends over one to two
years.
When attempting to fit the framework for effective professional development to CTT, it
quickly becomes clear that several of the features either do not apply or are not relevant,
primarily because of CTT’s lack of focus on a particular content area. The features that do apply,

Geil
27
however, are easily met, and even the ones that are not applicable or relevant are not
immediately ruled out. Desimone’s conceptual framework can be adapted to fit transformative
professional development (see Figure 2-2). Content focus is replaced with a focus on the self,
and collective participation with relationships. These core TPD features result in changes to
teachers’ attitudes, beliefs, self-awareness, and interactions, which in turn lead to increased
teacher engagement and retention, or a better match between the person and the profession. In
theory, increased teacher engagement and a better match between person and profession also
lead to improved student learning, but this is not the focus of this study (as indicated by the
dashed box). This study attempts to determine if participation in TPD has a subsequent effect on
teacher engagement and retention, but even if an effect is found, this study cannot say why or
how this happens, only whether or not it does.
Figure 2-2. Adaptation of Desimone’s conceptual framework to transformative professional development.
One of the questions raised by this exercise is whether professional development without
a specific content focus can have an impact equal to or greater than that of professional
development programs with a particular content focus on teachers in the classroom, and
ultimately on student learning. If it can, then perhaps the proposed consensus on the elements of
effective professional development is unnecessarily narrow, limiting our conceptions of what

Geil
28
effective professional development can be. While the question of the impact on student learning
is beyond the scope of this study, the effect of participation in CTT on teacher engagement and
retention can begin to be addressed.
Existing Research and Evaluations on the Courage to Teach Program
There is a small body of research on the Courage to Teach program, consisting primarily
of qualitative dissertations and formal and informal evaluations. By examining this existing
work, I can see what has already been accomplished and where there are still gaps to be filled, as
well as find support for my hypothesis that participation in Courage to Teach has an effect on
subsequent teacher engagement and retention. Studies were included in this section only if they
focused specifically on Courage to Teach participants; studies on related programming such as
Courage to Lead and Circles of Trust or on adaptations of Courage to Teach retreat series (such
as a book group focusing on the book by the same name) were excluded. The following chart
describes the existing research (see Table 2-1).
Table 2-1. Existing Research on the Courage to Teach Program
Author(s) & Date Title Data Collection*
CTT Participants (Response
Rate)
# of Retreat Cohorts
(Locations) Dissertations McMahon, L. (2003)
Rekindling the Spirit to Teach: A Qualitative Study of the Personal and Professional Renewal of Teachers
Semi-structured interviews with teachers having at least 8 years of teaching experience
11 (NA) Multiple (Washington)
Simone, G. (2004)
Professional Development as a Process of Renewal: Case Studies of the Courage to Teach Program
Multiple case study; observations of CTT retreats; interviews and observations with teachers, facilitators, and students
4 (NA) 1 (Washington)
(Continued)

Geil
29
Table 2-1 (Continued)
Author(s) & Date Title Data Collection*
CTT Participants (Response
Rate)
# of Retreat Cohorts
(Locations) Dissertations
Poutiatine, M. (2005)
The Role of Identity and Integrity in Teacher Development: Towards a Grounded Theory of Teacher Formation
Qualitative study; individual and focus group interviews
16 (NA) Multiple (Washington)
Nollet, K. (2009)
Teacher Transformations: A Phenomenological Study on the Effect of Courage to Teach on Experienced Teachers' Growth and Development
Phenomenological study; survey and interviews after participation in CTT retreat series
10 (NA) 1 (New England)
Evaluations
Intrator, S. & Scribner, M. (1998)
An Evaluation of the Courage to Teach Program
Phone interviews and written feedback evaluations after participation in CTT retreat series
64 (75%) 4 (MD, MI, SC, WA)
Intrator, S. & Scribner, M. (2000)
Courage to Teach - Longitudinal Program Evaluation
Open-ended survey completed 3-5 years after participation in CTT retreat series
50 (53%) 5 (MD, MI, MI, SC, WA)
Intrator, S. & Scribner, M. (2002)
Evaluation of the 1999-2001 Courage to Teach Program - New England
Survey and phone interviews completed after participation in CTT retreat series; interviews with colleagues/supervisors
20 (83%) 1 (New England)
Poutiatine, M. (2002)
Data Analysis of Courage to Teach Teachers Surveys: Fall 2001
Survey completed before participation in first CTT retreat
45 (92%) 2 (Washington)
Poutiatine, M. (2003a)
Data Analysis of Teachers' Pre-Participation Surveys: Fall 2002
Survey completed before participation in first CTT retreat
51 (NR) 2 (Washington)
Poutiatine, M. (2003b)
Data analysis of Courage to Teach Teachers' Post Participation Survey: 2001-2003
Surveys completed after participation in CTT retreat series
41 (89%) 2 (Washington)
Poutiatine, M. (2003c)
Washington State Courage to Teach Comparison Report: Pre-Participation Surveys Teachers Groups A+B 2001 and 2002
See Poutiatine 2002 & 2003a 45 (92%) and
51 (NR)
2 and 2 (Washington)
Faulkner, A. (2003)
Evaluation of Courage to Teach Program - Texas
Surveys completed by community college instructors after participation in CTT retreat series
18 (NR) 1 (Texas)
Note. NA=Not applicable; NR=Not reported. * None of these studies involve control groups.
Geil
30
The dissertations by McMahon (2003), Simone (2004), Poutiatine (2005), and Nollet
(2009) are qualitative studies. Participant numbers were necessarily small in all four given the
methods being used; none had more than 16 Courage to Teach alumni. Interviews with
participants were used to gather data in all of the dissertations; some also used surveys,
observations of retreats and/or classroom practice, and interviews with facilitators of the retreats
and students of the participants.
All the evaluations involved some form of survey research either before or after
participation in a CTT retreat series. Two evaluations (Intrator & Scribner, 2000, 2002) also
included phone interviews with selected participants. The number of participants ranged from 20
to 64 and generally only involved alumni from one program or site, with the exception of two
evaluations that drew on alumni from four and five sites respectively (Intrator & Scribner, 1998,
2000).
One study (Intrator & Scribner, 2000) did gather data from colleagues and supervisors of
participants so that self-reported data could be triangulated, but to date there have been no known
studies or evaluations using any sort of control group in the study design. The majority of the
existing studies have involved participants from either a single site or a handful of sites, and also
from the same time range. In addition, the data related to engagement with teaching collected by
previous studies has been primarily anecdotal. The study being conducted here is the first known
to use a quasi-experimental design with a control group, the first to attempt to gather data from
Courage to Teach alumni all across the country and from those who have participated recently
and as early as the program’s inception 15 years ago, and the first to use a specific instrument to
attempt to measure the concept of engagement. Nevertheless, the existing research on Courage to
Geil
31
Teach provides an important foundation to build upon, as well as support for the hypothesis that
participation in CTT affects subsequent teacher engagement and retention.
Findings of Existing Courage to Teach Research Studies
A common thread running through the evaluations is the improvement that teachers
noticed in their relationships with both students and colleagues, which they commonly attributed
to their participation in CTT. For example, one teacher (Intrator & Scribner, 2002) said
I think it [participation in CTT] has made me get down to the root of it all – the
relationship between the teacher and student…The teachers kids talk about are
those who have made that connection with them…It helped me accept the kids as
who they are…I have developed more compassion, empathy, to look through the
world at a kid’s eye level (Elementary teacher, 28 years experience). (p. 15)
In another evaluation (Intrator & Scribner, 2000), 100% of the teachers responding
reported that they had seen improvements in their classroom practice, which they primarily
attributed to their new ability to create genuine connections with their students. Particularly in
the evaluative studies, CTT participants consistently report that their greatest source of
satisfaction and fulfillment in their professional lives revolves around connecting with their
students and helping them to learn (Poutiatine, 2002, 2003a, 2003b, 2003c). This mirrors studies
done on teachers in general and the aspects of teaching that bring the most fulfillment (e.g., Cohn
& Kottkamp, 1993; Lortie, 1975).
In a post-participation evaluation of 41 teachers (Poutiatine, 2003b), the majority said
that their relationships with colleagues had improved since their participation in the retreat series,
and they had become more open and less judgmental (although they were not specifically asked
if they felt these were results of their participation in CTT). In Intrator and Scribner’s (2000)
Geil
32
study, 68% of the participants said that CTT had led them to initiate more collegial relationships
at their schools. In another study in which participants’ supervisors were interviewed about any
changes they had noticed in the participant since the CTT retreat series, one remarked that “…the
experience gave her [the participant] some skills to deal with some of the more difficult people
on the faculty. She seemed to have more patience and acceptance for people who might be tough
to handle on a regular basis…” (Intrator & Scribner, 2002, p. 9).
Teachers report taking some of the activities that were modeled for them in the Courage
to Teach retreats, as well as the norms that were established, back to their own classrooms and
schools. For example, one high school department chair now begins each departmental meeting
by inviting one faculty member to talk for “five minutes about his or her passion for teaching
English or current areas of “aliveness” in teaching. The result has been a much greater sense of
connection and collegiality within the department...” (M. Jackson & Jackson, 2002, p. 302-03).
Teachers report being more comfortable with silence in the classroom and allowing students
more time to gather their thoughts and reflect on what they are learning. In turn, this allows the
teachers more opportunity to get to know their students. Some teachers also try to see their
students more clearly, recognize their strengths, and listen to them closely. “By being more
attentive to students’ gifts and lifting them up, not only is the student-teacher relationship
enhanced, but so is the opportunity for mutual respect and learning” (M. Jackson & Jackson,
2002, p. 299). This also applies to colleagues, as explained by this teacher, “I am less critical of
teachers in my department. I look more for their gifts than I do for their shortcomings. I find
what I seek. My colleagues have more gifts to share with students and staff than I noticed
previously” (Poutiatine, 2003b, p. 35).

Geil
33
Participants anecdotally report that their experiences in CTT helped them to learn more
about themselves and their strengths, as well as their needs, and that this enabled them to achieve
a better balance between their life and work (Intrator & Scribner, 2000; Poutiatine, 2003b). In
one study of 50 alumni that took place three to five years after their retreat series, 82% made
specific references to ways in which the program had helped them to live in a more balanced and
mindful manner, with over half saying that they were now better able to manage the demands of
both their work and their personal lives (Intrator & Scribner, 2000).
There is evidence that many teachers find their participation in CTT to be rejuvenating or
renewing in terms of their commitment to teaching (McMahon, 2003; Poutiatine, 2005; Simone,
2004). Anecdotal remarks also indicate that participation in CTT can be a factor in whether or
not teachers remain in the profession (Intrator & Scribner, 1998, 2000; Poutiatine, 2002, 2003b).
In Intrator and Scribner’s (2000) study, more than half had felt “burned out, frustrated, and
overwhelmed” at the time they enrolled in the retreat series, but 3 to 5 years later only 3 out of
113 had left the field of education; the rest were still teaching, in administrative positions, or had
retired. Out of this same group, 60% stated that CTT had helped them to renew their
commitment to teaching. In an earlier study (Intrator & Scribner, 1998), all 64 respondents said
that CTT had helped renew their faith in teaching, and some even attributed it to keeping them in
the field, as did this teacher:
I really care about kids and I’ve been told I’ve been an effective teacher… But I
think I would have quit. There’s nothing else that I could have been given that
would have been more valuable than the experience of Courage to Teach
(Elementary teacher, 5 years’ experience). (p. 14)

Geil
34
In a survey of participants before they began a CTT retreat series in Washington, 74%
said that they only very rarely or occasionally considered quitting their jobs as teachers. When
asked the same question two years later, after completion of the CTT retreat series, this number
had gone up to 84% (Poutiatine, 2002, 2003b). Again, many teachers in this study reported
feeling renewed and recommitted to teaching, and several stated that CTT had helped to keep
them in the profession:
When I applied for CTT I had a job lined up and was planning to leave education.
This fall I hosted two student teachers and I am mentoring another teacher on my
staff. The only change I made was within myself. (Poutiatine, 2003b, p. 53)
Participants in CTT retreat series consistently state that their participation in CTT is an
extremely positive experience (Intrator & Scribner, 1998, 2000, 2002; Poutiatine, 2003b, 2005).
There is also reason to believe, as the existing research suggests, that participation in CTT has
the potential to influence subsequent engagement with and retention in teaching.
Potentially Confounding and Descriptive Variables
Research has also shown that characteristics of teachers themselves, the schools they
teach at, and the students they teach can affect teacher engagement and retention. By gathering
information on these variables in my survey, I can describe the teachers who choose to
participate in transformative professional development, which helps to answer one of the
research questions of my study. In addition, these characteristics are important to consider as
potentially confounding variables for this quasi-experimental study: I am interested in
establishing that participation in CTT has a subsequent effect on teacher engagement and
retention, and the section above reviewed the research that supports this hypothesis. However, if
there are other variables that can also affect teacher engagement and retention, then I need to
Geil
35
consider those as well. If they are not accounted for, then any claim that participation in the TPD
program affects engagement can be countered with a claim that it is actually these other variables
that are causing the effects. In Chapter Five, I will explain how I used the technique of
propensity score matching to account for these potentially confounding variables. The remainder
of this chapter will review the existing research on the effects of these variables on teacher
engagement and retention (see Appendix A for details on the studies reviewed).
There are some limitations to the burnout/engagement research. Many of the studies
involve some degree of self-selection bias and a lack of a control group. Or, they were conducted
in particular regions of the country and/or with subsets of teachers that cannot be generalized.
Other studies on burnout and engagement have used an abridged or significantly modified
version of the Maslach Burnout Inventory that makes results challenging to compare. Still other
studies were conducted with teachers outside of the United States and cross-cultural differences
or expectations regarding teaching may influence the results. It is important to note that many of
the researchers acknowledge the limitations of their studies, and as I discuss in Chapter Three, in
social science research it is particularly difficult to conduct randomized experiments that would
yield unbiased estimates of causal effects (Ho, Imai, King, & Stuart, 2007; Rubin, 2007).
Many of the studies on teacher attrition and retention utilize the National Center for
Education Statistics’ School and Staffing Survey (SASS) and the related Teacher Follow-Up
Survey (TFS). The advantage of these surveys is that they allow researchers access to data on a
large, nationally representative sample of teachers. The surveys, which have been administered
six times since 1987, track actual turnover and attrition rates, as opposed to just intentions to
leave. Other studies examined here utilize data on specific subgroups of the teaching population
or from particular geographic regions, however, and as such their findings cannot be generalized

Geil
36
to teachers as a whole (Achinstein, Ogawa, Sexton, & Freitas, 2010; Borman & Dowling, 2008).
Nevertheless, these studies provide insight into how engagement and retention might be
influenced by these potentially confounding variables.
Demographic Characteristics of Teachers
The demographic characteristics of teachers are frequently included as potentially
confounding variables in other studies, and are used to provide descriptive statistics as well.
According to the existing research, there is reason to believe that age, teaching experience,
eligibility for retirement, gender, race/ethnicity, teaching certification, full-time status, and
satisfaction with salary could influence teacher engagement and retention (see Table 2-2).
Table 2-2. Research on Demographic Characteristics of Teachers on Burnout/Engagement and Attrition/Retention
Characteristics and Findings Relevant Studies
Age and Teaching Experience
Younger, Less Experienced More Burned Out
Byrne (1991); Kahn, Schneider, Jenkins-Henkelman, & Moyle (2006); Lau, Yuen, & Chan (2005); Russell, Altmaier, & Van Velzen (1987)
Older, More Experienced More
Burned Out DeHeus & Diekstra (1999); Friedman (1991)
No Effect on Engagement Grayson & Alvarez (2008); Hakanen, Bakker, & Schaufeli (2006); McCarthy, Lambert, O'Donnell, & Melendres (2009); Ozer & Beycioglu (2010)
Early & Late Career Teachers More
Likely to Leave Borman & Dowling (2008); Guarino, Santibanez, & Daley (2006)
New Teachers More Likely to Leave Hanushek, Kain, & Rivkin (2001)
Gender
Women More Exhausted Byrne (1991); Grayson & Alvarez (2008); Lau,
Yuen, & Chan (2005); Ozer & Beycioglu (2010)
(continued)
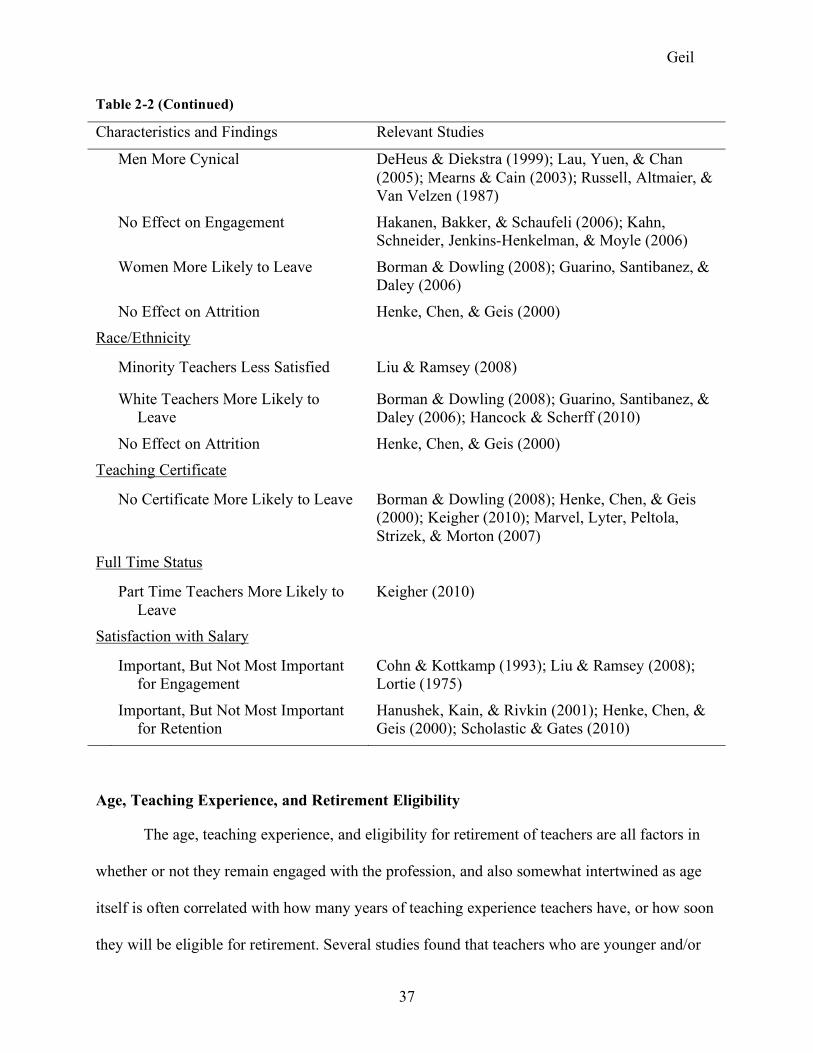
Geil
37
Table 2-2 (Continued)
Characteristics and Findings Relevant Studies
Men More Cynical DeHeus & Diekstra (1999); Lau, Yuen, & Chan (2005); Mearns & Cain (2003); Russell, Altmaier, & Van Velzen (1987)
No Effect on Engagement Hakanen, Bakker, & Schaufeli (2006); Kahn,
Schneider, Jenkins-Henkelman, & Moyle (2006)
Women More Likely to Leave Borman & Dowling (2008); Guarino, Santibanez, &
Daley (2006)
No Effect on Attrition Henke, Chen, & Geis (2000) Race/Ethnicity
Minority Teachers Less Satisfied Liu & Ramsey (2008)
White Teachers More Likely to
Leave Borman & Dowling (2008); Guarino, Santibanez, & Daley (2006); Hancock & Scherff (2010)
No Effect on Attrition Henke, Chen, & Geis (2000) Teaching Certificate
No Certificate More Likely to Leave Borman & Dowling (2008); Henke, Chen, & Geis (2000); Keigher (2010); Marvel, Lyter, Peltola, Strizek, & Morton (2007)
Full Time Status
Part Time Teachers More Likely to
Leave Keigher (2010)
Satisfaction with Salary
Important, But Not Most Important
for Engagement Cohn & Kottkamp (1993); Liu & Ramsey (2008); Lortie (1975)
Important, But Not Most Important
for Retention Hanushek, Kain, & Rivkin (2001); Henke, Chen, & Geis (2000); Scholastic & Gates (2010)
Age, Teaching Experience, and Retirement Eligibility
The age, teaching experience, and eligibility for retirement of teachers are all factors in
whether or not they remain engaged with the profession, and also somewhat intertwined as age
itself is often correlated with how many years of teaching experience teachers have, or how soon
they will be eligible for retirement. Several studies found that teachers who are younger and/or

Geil
38
have less teaching experience are more prone to burnout on at least one of the three subscales,
but most commonly emotional exhaustion (Byrne, 1991; Kahn, Schneider, Jenkins-Henkelman,
& Moyle, 2006; Lau, Yuen, & Chen, 2005; Russell, Altmaier, & Van Velzen, 1987). Other
studies found that burnout was more pronounced the older the teachers and the more teaching
experience they had (DeHeus & Diekstra, 1999; Friedman, 1991). Still other studies found no
influence on burnout of either age or teaching experience (Grayson & Alvarez, 2008; Hakanen,
Bakker, & Schaufeli, 2006; McCarthy, Lambert, O'Donnell, & Melendres, 2009; Ozer &
Beycioglu, 2010).
The teacher attrition/retention research suggests that age and teaching experience actually
have a U-shaped effect, in that younger and newer teachers are consistently more likely to leave
teaching than older, more experienced teachers—that is, until the older teachers reach retirement
age, at which point they are just as likely to leave as the newer teachers (Borman & Dowling,
2008; Guarino, Santibanez, & Daley, 2006). A study involving the entire population of Texas
public school teachers (over 375,000) also found that teachers with less than three years of
teaching experience were twice as likely to leave the Texas public schools as teachers in the
prime of their career with 11 to 30 years experience (Hanushek et al., 2001).
Gender and Race/Ethnicity
The evidence regarding the effect of gender on teacher burnout varies depending on the
MBI subscale being examined. Four studies reviewed here found that female teachers had higher
levels of emotional exhaustion than male teachers (Byrne, 1991; Grayson & Alvarez, 2008; Lau
et al., 2005; Ozer & Beycioglu, 2010), but one study in Greece found higher levels of emotional
exhaustion among male teachers (Bibou-Nakou, Stogiannidou, & Kiosseoglou, 1999). On the
cynicism subscale, the majority of studies find that male teachers are more likely to be
Geil
39
depersonalized (DeHeus & Diekstra, 1999; Lau et al., 2005; Mearns & Cain, 2003; Russell et al.,
1987). Another study found that in low-burnout schools, on average 15% more females were
employed than in high-burnout schools (Friedman, 1991), while two studies found no influence
of gender on burnout at all (Hakanen et al., 2006; Kahn et al., 2006).
A comprehensive review of 46 peer-reviewed empirical studies by Guarino, Santibanez,
and Daley (2006) on teacher recruitment and retention found that women are slightly more likely
to leave teaching than men. Borman and Dowling (2008), who conducted a meta-analysis of 34
quantitative studies on teacher attrition, agreed: for the 19 studies in their review that looked at
gender, they calculated that overall women were 1.3 times more likely to leave teaching than
men.
In terms of the race/ethnicity of the teacher, one study (Liu & Ramsey, 2008) analyzed
the 2000-2001 Teacher Follow-Up Survey data on those who voluntarily left teaching before
becoming eligible for retirement and their satisfaction with teaching. In general, they found that
minority2 teachers were actually less satisfied than White teachers on all but one aspect of
teaching measured by their model.
In the attrition/retention research the evidence leans towards White teachers being more
likely to leave the field or to be classified as a high-attrition risks than teachers of color. Guarino,
Santibanez, and Daley (2006) found that White teachers are more likely to leave than non-White
teachers. Borman and Dowling (2008) also calculated that for White teachers, the odds are 1.36
times more likely that they would leave teaching than non-White teachers. A study of the 4,520
full-time English/Language Arts teachers who had participated in the 2003-2004 Schools and
Staffing Survey found that White teachers were 45% more likely to be classified as a high-
2 The terms “minority” or “non-White” are typically used in the United States as a collective reference to any of the following races/ethnicities: African American or Black; American Indian or Alaskan Native; Asian; Hispanic, Chicano, Mexican American, or Latino; and Pacific Islander or Filipino.
Geil
40
attrition risk than non-White teachers (Hancock & Scherff, 2010). In a longitudinal study of
college graduates who had entered into teaching but left by the time they were re-surveyed four
years later, however, neither gender nor race/ethnicity were associated with new teachers leaving
the profession (Henke, Chen, & Geis, 2000).
Teaching Certification and Full Time Status
While I could not locate any studies that looked at the effect of teaching certification or
full time status on burnout and engagement, the retention research indicates that teachers who do
not hold certificates are considerably more likely to leave the field. Borman & Dowling (2008)
reviewed three studies that looked at rates of teacher attrition by whether or not respondents held
a teaching certificate, and they calculated the overall odds of leaving the profession as being 2.63
times greater for teachers without a teaching certificate as compared to teachers who did hold a
teaching certificate. The data from the two most recent Teacher Follow-Up Surveys in 2004-
2005 and 2008-2009 (Keigher, 2010; Marvel, Lyter, Peltola, Strizek, & Morton, 2007) confirm
this, with 85% of the teachers who hold regular teaching certificates staying in teaching, versus
only 67% of the teachers without a teaching certificate. So does the study of college graduates
who entered the teaching profession and then were resurveyed four years later: only 14 percent
of those holding teaching certificates had left the field, compared to 49 percent of those who
were not certified to teach (Henke et al., 2000).
There is also some evidence indicating that part-time teachers leave the profession at a
greater rate than those teaching full-time. In the most recent Teacher Follow-Up Survey from
2008-2009, 15.2% of the teachers who had been in part-time positions the previous year had left
teaching, as opposed to 7.3% of the teachers with full-time positions (Keigher, 2010).

Geil
41
Satisfaction With Salary
Liu and Ramsey (2008), in an analysis of the 2000-2001 Teacher Follow-Up Survey data,
found that satisfaction with salary and other forms of compensation was not correlated with
satisfaction with work conditions. Both Lortie (1975) and Cohn & Kottkamp (1993) found that
while salary mattered to teachers in terms of their satisfaction, it was most important only to a
very small percentage.
The attrition/retention research confirms this finding, in that while dissatisfaction with
salary is often associated with teacher attrition, other factors such as student characteristics or
administrative support are more strongly related or viewed as more important. Hanushek, Kain,
and Rivkin (2001) found in their study of Texas public school teachers that characteristics
associated with students were more strongly correlated with teacher turnover than salary, and
salary was a larger factor in whether or not teachers moved schools rather than left teaching
altogether. A survey of over 40,000 United States teachers by Scholastic and Gates (2010)
revealed that teachers felt that while salary was important when it came to retaining good
teachers, non-monetary compensation (such as supportive leadership or time to collaborate with
other teachers) was even more important. Henke and colleagues (2000) found that 10% of the
new graduates in their study who had gone into teaching and then left did so because they were
dissatisfied with salary and benefits.
School and Student Characteristics
Certain characteristics of schools and students appear to influence teachers’ engagement
with and decisions about whether or not to stay in the profession, such as grade level, location,
total number of students, student-teacher ratio, public or private sector, and the socioeconomic

Geil
42
class (as measured by free and reduced lunch eligibility) and race/ethnicity of students (see Table
2-3).
Table 2-3. Research on School and Student Characteristics and Teacher Attrition/Retention and Burnout/Engagement
Characteristics and Findings Relevant Studies
School Level
Secondary School Teachers More Burned Out
Day, Stobart, Sammons, Kington, Gu, & Smees, et al. (2006); Russell, Altmaier, & Van Velzen (1987)
No Effect on Engagement Hakanen, Bakker, & Schaufeli (2006)
Elementary Teachers More Likely to Leave
Borman & Dowling (2008); Keigher (2010); Marvel, Lyter, Peltola, Strizek, & Morton (2007)
School Locale
Teachers More Likely to Leave Urban Schools
Borman & Dowling (2008); Hanushek, Kain, & Rivkin (2001)
School Size and Student/Teacher Ratio
Teachers With Larger Classes More Exhausted
Russell, Altmaier, & Van Velzen (1987)
Teachers More Likely to Leave Small Schools
Borman & Dowling (2008); Ingersoll (2001); Keigher (2010); Luekens, Lyter, & Fox (2004); Marvel, Lyter, Peltola, Strizek, & Morton (2007)
Public or Private Sector
Teachers More Likely to Leave Private Schools
Borman & Dowling (2008); Ingersoll (2001); Keigher (2010); Luekens, Lyter, & Fox (2004); Marvel, Lyter, Peltola, Strizek, & Morton (2007)
Free or Reduced Lunch (FRL)
Teachers of FRL Students More Committed
Day, Stobart, Sammons, Kington, Gu, & Smees, et al. (2006)
Teachers More Likely to Leave Schools w/FRL Students
Borman & Dowling (2008)
(continued)

Geil
43
Table 2-3 (Continued)
Characteristics and Findings Relevant Studies
Non-White Students
Teachers More Likely to Leave Schools w/Non-White Students
Borman & Dowling (2008); Hanushek, Kain, & Rivkin (2001)
Non-White Teachers More Likely to Stay at Schools w/Non-White Students
Achinstein, Ogawa, Sexton, & Freitas (2010); Hanushek, Kain, & Rivkin (2001)
Grade Level Taught
In terms of the burnout research there is little recent work available regarding grade level,
especially conducted in the United States. A study of K-12 teachers in Iowa found that secondary
school teachers reported greater levels of cynicism, while elementary school teachers scored
higher on professional efficacy (Russell et al., 1987). A study in the United Kingdom, although it
did not use the MBI as an instrument, did find that primary school teachers had both higher
commitment levels and higher feelings of professional efficacy than secondary school teachers
(Day et al., 2006). A study of over 2,000 teachers at elementary, secondary, and vocational
schools in Finland, however, did not find any differences on the MBI based on the grade level
taught (Hakanen et al., 2006).
When the effects of 14 different studies are combined, teachers who teach in elementary
schools are slightly more likely to leave teaching than secondary school teachers, and this
difference is statistically significant (Borman & Dowling, 2008). A similar pattern develops in
the most recent Teacher Follow-Up Survey data, with greater percentages of elementary school
teachers leaving the profession than secondary school teachers (13.5% compared to 9.4% in
2004-2005, and 14.6% compared to 12.2% in 2008-2009) (Keigher, 2010; Marvel et al., 2007).

Geil
44
School Locale, Size, and Public/Private Sector
Little research was located connecting burnout and engagement with these school
characteristics. One study on burnout in teachers did not find any significant effects regarding
school size, but did find that teachers with larger classes reported higher levels of emotional
exhaustion (Russell et al., 1987). There is, however, research on these characteristics and their
effects on teacher attrition and retention.
With regards to where schools are located, Borman & Dowling (2008) analyzed six
studies and found a small but significant difference indicating that teachers at urban and
suburban schools are slightly more likely (1.13 times) to leave teaching than teachers at rural
schools. Hanushek, Kain, and Rivkin (2001), in their study of Texas public school teachers,
found that new teachers were 3.5 percentage points more likely to leave teaching if they had
been teaching at urban schools than were their suburban counterparts.
School size may also affect teacher attrition rates, with the evidence showing that
teachers at smaller schools are actually more likely to exit the profession (Borman & Dowling,
2008; Ingersoll, 2001; Keigher, 2010; Luekens et al., 2004; Marvel et al., 2007). The data on
school size may be confounded by whether or not the school is in the public or private sector.
Several studies have found that teachers at private schools are consistently more likely to leave
teaching than those at public schools (Borman & Dowling, 2008; Ingersoll, 2001; Keigher, 2010;
Luekens et al., 2004; Marvel et al., 2007). More than three-fourths of private schools, however,
are small in size (less than 300 students), so it is possible that teachers are more likely to leave
smaller schools not because they are smaller, but because they are more likely to be private
(Ingersoll, 2001).

Geil
45
Free and Reduced Lunch Eligibility
One commonly used measure of student socioeconomic class at a school is the
percentage of students that qualify for the federal free or reduced lunch programs. Eligibility for
free or reduced lunch (FRL) is calculated based on family household income; students qualify for
free lunch if their family income is less than 130% of federal poverty guidelines ($18,941 for a
family of two in 2009-2010) or for a reduced price lunch if their family income is less than 185%
of federal poverty guidelines ($26,955 for a family of two in 2009-2010) (USDA Food and
Nutrition Service, March 27, 2009). Students can also directly qualify for free or reduced school
lunch if they are receiving certain federal benefits such as the Supplemental Nutrition Assistance
Program (USDA Food and Nutrition Service, July 21, 2010).
I could not find any burnout/engagement research on this topic that has been conducted in
the United States, but a study in England of teachers’ commitment and effectiveness found that
for younger teachers, those at schools with lower populations of students eligible for Free
Student Meals (FSM) showed higher levels of commitment. However, across all phases of the
teaching career, it was actually teachers at the schools with the highest number of students
eligible for FSM who showed more sustained commitment and increased motivation (Day et al.,
2006).
In the attrition/retention research, Borman & Dowling (2008) found in a meta-analysis of
eight studies using a continuous measure of the percentage of students qualifying for FRL that as
the percentage of students went up, the odds of teachers leaving increased. Three other studies in
their review that classified schools as “low” socioeconomic status (more than 50% of students
qualifying for FRL) also found that the odds of teachers leaving were higher in the “low”
socioeconomic status schools.

Geil
46
Racial Distribution of Students
I was unable to find research related to this topic in the burnout/engagement field, but
according to the available attrition/retention research the odds of teachers leaving schools with
larger minority student populations are higher. Borman & Dowling’s (2008) meta-analysis of the
effects of five studies found that teachers were up to three times more likely to leave
predominantly minority schools than schools in which the majority of the student population was
White. Seven more studies that measured the percentage of minority students continuously also
found higher odds of attrition as the percentage increased. Hanushek, Kain, and Rivkin’s (2001)
study of public schools and teachers in Texas also found a similar pattern, in which
predominantly Black or Hispanic schools had higher rates of teacher attrition than non-Black or
non-Hispanic schools. They also found strong evidence that the teachers in their study who
moved to a different teaching position systematically moved to districts with higher percentages
of students matching their own race/ethnicity. A review of the research on the attrition rates of
minority teachers found that minority teachers were not only more likely to teach at urban
schools with high proportions of minority students and students on free and reduced lunch, but
also more likely to stay at these schools than non-minority teachers (Achinstein et al., 2010).
Looking back on the research on teacher burnout/engagement and attrition/retention that
has been reviewed here, there is fairly consistent evidence that certain background characteristics
of teachers, schools, and students are related to whether or not teachers remain engaged with, and
ultimately stay in the profession. There is not always agreement on the direction of effects, but
clearly correlations do exist. Since characteristics of teachers, schools, and students may be just
as likely to affect engagement and retention as participation in a TPD program, it is important to
include as many of these potentially confounding variables in the study design as possible.

Geil
47
Summary of Chapter
This chapter began by putting forth the definition of transformative professional
development used in this study, and introduced Courage to Teach, the TPD program that is this
study’s focus. A conceptual framework for studying effective professional development was
discussed, applied to CTT, and adapted for use with TPD programs. Studies and evaluations
specific to CTT were analyzed for evidence that supports the hypothesis that participation in
CTT has a positive effect on subsequent teacher engagement and retention, and to see if any gaps
exist that might need to be filled. Finally, a set of teacher, school, and student characteristics that
could be used both to describe participants in TPD, and that might also confound the results of
the study were introduced, along with the relevant literature. In the next chapter, I will discuss
the design of the study, sample selection, the survey instrument, and data collection.
Geil
48
CHAPTER 3. STUDY DESIGN AND DATA COLLECTION
This chapter will discuss the study design, sampling procedures, and survey instrument
with regards to the main research questions of the study. The first goal of this research study is to
describe the teachers who choose to participate in Courage to Teach and how they are similar to
and different from those who participate in the National Writing Project and teachers in general.
The second research question encompasses my main hypothesis, which is that participation in a
transformative professional development program such as CTT will affect subsequent teacher
engagement and retention. My third research question asks about the respondents’ perceived
benefits of participation regarding various aspects of teaching.
Study Design
The ideal way to answer these research questions, particularly when the goal is to
estimate causal effects, would be to design a study in which a large representative sample of
teachers is chosen from the entire population of teachers, and then each teacher is randomly
assigned to one of two treatment conditions: participation in Courage to Teach, or not. Upon
completion of the program, both groups could then be compared in terms of their engagement
with teaching, and if there are mean differences between the groups we can support the causal
inference that participation in the treatment has an effect on the outcome. In other words,
because of random assignment we could confidently claim that participation in CTT affects
engagement with teaching, and because of random sampling we can generalize this claim to the
entire population of teachers. It is critical in this scenario that the subjects are both randomly
sampled and randomly assigned to the treatment conditions, and the sample size must also be
sufficiently large (Ho et al., 2007). Of course, in the real world, it is extremely difficult to meet
all of these conditions. In most laboratories or research settings, randomized experiments have

Geil
49
random assignment but not random sampling, and often the number of subjects is relatively
small. And especially in the social sciences, issues such as expense, time, and ethical
considerations make it very difficult to perform even a randomized experiment (Ho et al., 2007;
Rubin, 2007).
My limited resources make a randomized experiment infeasible for this study. It is,
however, possible for me to conduct a quasi-experimental study (also known as an observational
study) and this is what I have chosen to do. Like a randomized experiment, an observational
study has a treatment and a control group, but the subjects in each group are not randomly
assigned. Observational studies are very common in education research, where it is often quite
difficult to randomly assign subjects (e.g., students, teachers) to treatment and control groups
(e.g., classes, programs, schools.) The simplest form of an observational study for my research
question would be to compare a group of teachers who have chosen to participate in CTT with a
group of teachers who have not participated in any professional development with respect to the
outcomes of interest. Unfortunately, from the outset the types of teachers who choose to
participate in a program like CTT no doubt have different characteristics from those who choose
not to participate, especially in terms of motivation (Wayne et al., 2008). When there are
differences like this that exist before a program begins, and if these differences are also
associated with the outcome of interest, any comparison of mean outcomes among the two
groups will be confounded by selection bias (Caliendo & Kopeinig, 2008; Campbell & Stanley,
1963; Shadish, Cook, & Campbell, 2002). In other words, there will be no way to know if any
observed differences in the outcomes are due to the treatment or to characteristics of the groups
themselves which exist even in the absence of treatment. A method is needed to deal with the
issue of selection bias and to ensure that the two groups in the study are as similar as possible,
Geil
50
regardless of the group they have self-selected into. For this study, this is a two-step process: (a)
selecting an appropriate control group, and (b) using a technique known as propensity score
matching to obtain the most comparable samples possible (propensity score matching is
discussed in detail in Chapter Five).
Appropriate Control Group and the Counterfactual
First, it is important to find a control group that is as close of a match as possible for the
CTT teachers. For my primary research question, I want to know if teachers who participate in
CTT are more engaged than if they had not participated in CTT. If I could measure each
teacher’s engagement in both of these scenarios, then I could take each teacher’s scores, subtract
the non-CTT score from the CTT score, and I would know the individual effect that CTT has on
engagement for each teacher. I could then proceed to average all the scores in each scenario
together, subtract one mean from the other, and I would be able to summarize with a single
number the average causal effect that CTT has on engagement.
The problem is that I cannot measure each teacher’s engagement in both of these
situations; I can only measure it in one. Two potential outcomes for each teacher exist; the one
that I cannot observe is known as the counterfactual. In order to obtain an estimate for this
potential outcome that I cannot observe, I use a control group. The control group’s scores on
engagement essentially act as a proxy for the scores that the treatment group would have
received (i.e., the counterfactual) if they had not participated in CTT, so it is important that the
control group be as similar as possible to the treatment group to minimize bias. Also, rather than
comparing individual teachers to each other, I am comparing the means of the two groups: the
average causal effect. However, this is not the actual average causal effect, as I cannot observe

Geil
51
it, but rather an estimated average causal effect (Briggs & Wiley, 2008; Caliendo & Kopeinig,
2008; Dawid, 2000; Winship & Morgan, 1999).
As there is reason to believe that teachers who choose to participate in voluntary, long-
term, time-intensive PD programs look different from teachers who do not, a control group
consisting of teachers who participate in no PD at all is probably not the best choice. This would
have the potential of overestimating the effect of CTT on engagement. The ideal control group
would be teachers who are just as motivated as those who participate in CTT, yet do not
participate in any professional development. As this ideal control group was not readily
available, a control group consisting of teachers who also choose to participate in a similarly
structured PD program is a good alternative, even though it might underestimate the effects of
CTT on engagement. Also, comparing CTT to a well-known, nationally recognized PD program
can provide useful information about CTT even if no effects on engagement are found.
In this study, the National Writing Project (NWP) fills this role. The National Writing
Project possesses Desimone’s five features of an effective professional development program
(see Chapter Two), is one of the largest nationwide PD programs in existence, and has been
described as “arguably the most successful teacher network in the United States” (Lieberman &
Wood, 2002, p. 40). Like CTT, participation in NWP is also a voluntary, time-intensive, long-
term commitment. Teacher-consultants of the NWP participate in a 4- to 5-week daily summer
institute during which they share their best teaching practices with each other, read research and
other professional literature, and engage in writing. The focus of the institutes is on improving
the teaching and learning of writing, and a side effect for many teacher-consultants is a
strengthening of their own identities as writers. In addition, teacher-consultants are encouraged
and expected to continue participation with their local Writing Project after the end of the actual

Geil
52
summer institute in a variety of ways (Blau, 1999; Gray, 2000; National Writing Project, 2006b).
It seems reasonable to expect that teachers who choose to participate in a 4- to 5-week intensive
summer program with follow-up are likely to resemble the CTT participants on a number of
characteristics, especially motivation. Because both CTT and NWP participants have self-
selected into similarly structured professional development programs, selection bias is decreased
to some degree, and I should have increased my chances of accurately capturing the
counterfactual outcome. Before continuing on to a discussion of how I obtained my samples, I
will first provide some background on the National Writing Project as well as a brief review of
the research that has been conducted on the program.
The History, Mission, and Structure of the National Writing Project
In the summer of 1974, James Gray attempted something quite different for the times—a
summer writing workshop for K-12 teachers in which the teachers participating in the workshop
would be the experts (Blau, 1999; Gray, 2000). Gray believed that successful teachers were an
extremely valuable resource, and their knowledge and experience should be shared outside their
own classrooms. It was clear that teachers in this first workshop were eager to learn from one
another and that the idea had a lot of promise. In 1976 Gray and his colleagues won a grant from
the National Endowment for the Humanities, which supported what was now known as the Bay
Area Writing Project, and helped spread the model across California and into other states (Gray,
2000).
Today, the National Writing Project has more than 200 sites located in all 50 states as
well as in Washington D.C., Puerto Rico, and the U.S. Virgin Islands. Funding, as of the early

Geil
53
nineties, comes in large part from the federal government3 along with matching funds from
corporations, foundations, universities, and K-12 schools (Gray, 2000; National Writing Project,
2005, 2008). In a typical calendar year, over 135,000 teachers take part in more than 7,000
programs associated with a National Writing Project site, and more than 12,000 teacher-leaders
conduct workshops or presentations in their own schools (National Writing Project, 2005; Stokes
& St. John, 2008).
All National Writing Project sites run summer institutes, generally four to five weeks, at
which a group of teachers who teach a variety of different levels and subjects gather together.
These teachers’ interactions during the institute focus on two main activities: demonstrating their
own successful teaching ideas to each other, and becoming “students” themselves as they work
on their own writing projects. They also study relevant research and theory in their fields (Blau,
1999; National Writing Project, 2006b).
After the summer institute has been completed, the teachers go back to their own schools
and districts. But, rather than losing touch, they stay connected with their writing project site in a
variety of ways. Many will lead workshops or presentations at their own area schools. Other
teachers form book clubs, teacher research or writing groups, or attend advanced summer
institutes or meetings for NWP alumni (Blau, 1999; Gray, 2000; National Writing Project,
2006b).
The stated goals of the National Writing Project are four-fold:
1. To improve student writing and learning in kindergarten through university
classrooms,
2. To extend the uses of writing in all disciplines,
3 On March 2, 2011, President Obama signed a bill that eliminates direct federal funding for the National Writing Project, according to an NWP press release (www.nwp.org/cs/public/print/resource/3507).

Geil
54
3. To provide schools, colleges, and universities with an effective professional
development model, and
4. To identify, celebrate, and enhance the professional role of successful classroom
teachers (National Writing Project, 2005, p. 2).
The overarching goal of the National Writing Project is to improve the teaching and
learning of writing in all disciplines across all age groups.
Existing Research on the National Writing Project
Evaluations of the National Writing Project have been conducted since the late 1990s by
Inverness Associates. Each participant is asked to complete a short survey at the completion of
the summer institute, and again at the end of the following school year. Response rates for these
surveys from the years 2000 to 2006 were 88% for the initial survey (19,536 respondents), and
29% overall (6,205 respondents) for the follow-up survey. On the initial survey, summer institute
participants consistently indicate very high satisfaction (over 95% every year) with the quality of
the overall experience, as well as its contribution to their understanding of the teaching of
writing, their own classroom practices, and expectations that their participation will result in
better writing skills for their students. In the follow-up surveys approximately eight months after
the completion of the summer institute, respondents also agree that their participation has given
them concrete teaching strategies (96%), helped them stay more up-to-date on the latest research
and practice (95%), and inspired them to seek further training and information (90%), among
other things. Approximately 80% or more of the follow-up respondents also agree that their
students wrote more and longer pieces, better understood the value of writing and the qualities of
good writing, and enjoyed writing more than their students had prior to their participation in the
summer institute (Stokes & St. John, 2008).

Geil
55
An internally conducted research project, known as the National Writing Project Legacy
Study, surveyed all summer institute participants from 1974 to 1994 about their professional
histories, receiving more than 2,000 responses (16.7%) by 2007. The study found that only 2%
leave the field of education before retirement, and 70% stay in the classroom for the entirety of
their careers. Out of those who have retired, 72% continue to volunteer or work in education
even after their retirement, and out of those who leave the classroom, 83% move to leadership or
administrative positions at the school level (LeMahieu, Fessahaie, Yang, Brown, & Friedrich,
2007; LeMahieu, Smith, & Hutchinson, 2008).
The National Writing Project is also conducting research on the question of whether
participation in NWP summer institutes results in increased student learning. Sixteen sites in
seven states employed pre- and post-assessments of student writing skills for students whose
teachers participated in NWP and for comparison classes of students whose teachers did not
participate. In all sixteen studies, the students whose teachers had participated in NWP showed
more growth than the comparison students, and the results favored the NWP students in
assessments of overall writing quality (National Writing Project, 2010).
Other research on the NWP has focused on the program as an example of an educational
reform network or professional learning community, particularly that of Lieberman and Wood,
who conducted an in-depth study of two summer institute sites, one urban and one rural, in
which they observed the institutes and interviewed participants. They determined that there are
social practices and norms that are formed in the summer institutes, and these norms help to
create networks, which in turn support participants in learning to become better teachers of
writing. Through the activities of teaching each other, taking the time to write and share their
writing, and engaging in research, participants learn to place a high priority on professional

Geil
56
relationships with colleagues and students. Lieberman and Wood make a point of saying that
these relationships are not for the purpose of “feel-good” interactions, but to establish an
intellectual context for learning (Lieberman, 2000; Lieberman & Wood, 2003). This speaks to
the NWP’s emphasis on the professional aspect of teaching and relationships, and a tendency in
our culture to privilege the cognitive and rational over the personal and emotional (Zembylas,
2003).
There is also anecdotal evidence that some participants find the experience to be
renewing and energizing. Participants have made comments along the lines of being “jazzed” or
“exhilarated,” and have said that being a part of a professional community keeps them “caring
and enthusiastic over the years” along with providing excitement and stimulation regarding
teaching (Lieberman & Wood, 2001, 2003).
Some participants in summer institutes even report that it is a transformational experience
for them, in that the experience “strongly influences how teachers think about their own
professional roles, changes what they do in classrooms, and affects how and what students learn”
(Lieberman & Wood, 2003, p. 99). Ann Whitney (2008), drawing on a case study of seven NWP
participants, argues that the act of writing itself is transformative, and that some of her subjects
experienced transformative learning—the ability to reframe an existing situation in a new way—
as a result of their participation in the summer institute.
The existing research on the National Writing Project highlights similarities and
differences between it and Courage to Teach. Both programs receive very high ratings from
participants, and there is at least anecdotal evidence that they both promote engagement and
retention. While NWP is not designed as a TPD program, some participants view it as a
transformative experience. Both CTT and NWP have a focus on relationships, but in NWP the
Geil
57
focus is primarily on professional relationships for the purposes of enhancing the teaching of
writing, although obviously for some participants these relationships have a personal dimension
as well. In Courage to Teach, there is a very strong emphasis on relationships and community,
but it differs from NWP in that it focuses on the connection between the personal and the
professional. And of course, the primary difference between the two programs is that the NWP
focuses on a specific content area, whereas CTT does not.
The similarities make it clear that the NWP is a well-matched control group for CTT on a
number of characteristics. In fact, the bar has been set rather high for CTT in terms of whether it
has an effect on engagement that is equal to or above that of NWP. Many of the characteristics of
CTT that are likely to lead to higher engagement, such as the development of community, also
exist in NWP. The question that remains is whether or not the emphasis on the self and on
personal aspects of relationships found in CTT results in a positive effect on engagement relative
to the emphasis on writing and on professional relationships that is found in NWP.
Sample Selection
Now that the two PD programs that are the focus of this study have been identified, I will
discuss how I obtained my sample of respondents from each program. Facilitators of CTT
programs are trained and supported by the Center for Courage and Renewal (CCR), which is
located in Seattle, Washington. According to the Director of the CCR, an estimated 30,000
people have participated in programs associated with the Center over the past 15 years, and
approximately 3,000 of those have taken part in Courage to Teach retreat series of at least four
retreats or more (Chadsey, 2010). However, there is no central office or database of CTT alumni;
records are kept by the retreat facilitators themselves. With the help of the assistant director at
CCR, all of the CTT facilitators in the country for which the CCR had contact information were

Geil
58
identified. In essence, an attempt was made to invite the entire population of CTT alumni to
participate in the research study; 24 distinct CTT programs in 18 states were identified at this
stage (see Figure 3-1).
The next step in the process was to secure a sample of NWP alumni. First of all, the
“population” approach taken with the CTT alumni could not be used as the number of NWP
alumni is vastly larger, with an average of 3,000 summer institute participants per year, or
potentially as many as 90,000 since 1974. In fact, an average of 135,000 teachers per year
participate in an NWP program or workshop, but for the purposes of this study, it is only those
teachers who take part in a summer institute who are of interest (National Writing Project, 2005,
2006a; St. John & Stokes, 2008). Because of the lack of centralized Courage to Teach data, little
was known about the CTT retreat program sites other than the state in which they had taken
place, and in some cases, the closest large city or general region of the retreat program. Using
this information, and with the help of the Director of Research and Evaluation at the NWP, a
sample of 24 NWP sites in the same 18 states was chosen to match the CTT sites based on
geography. CTT and NWP programs were matched geographically in an attempt to increase the
likelihood of obtaining respondents who are similar in regards to the demographics of their
teaching situations (e.g., school locale, student racial/ethnic composition, and free and reduced
lunch eligibility of students).
The NWP has been in existence since 1974, a good two decades before CTT held its first
retreat series in 1994. NWP is also more geographically diverse than CTT, as it has sites in all 50
states. So that the NWP sample would be more representative of NWP sites in general (based on
geography and age of site), 6 more sites were added to the NWP sample as “Round Two” sites.
This resulted in a total NWP sample of 30 sites in 24 states.

Geil
59
Figure 3-1. Sample selection process for CTT and NWP.

Geil
60
Facilitators and site directors of both programs were then contacted, again through
representatives from the national offices, and asked to forward the survey invitation to their
alumni via e-mail (for an example of these e-mails, see Appendix B). The survey was designed
to have three total contacts with alumni (the initial invitation and two follow-up reminders)
which has been shown to be the most effective number of contacts regarding response rates for
online surveys (Cook, Heath, & Thompson, 2000).
Ultimately, 21 CTT sites and 23 NWP sites forwarded the survey invitation on to their
alumni, reaching approximately 1350 and 1500 alumni respectively. These numbers are based on
the number of alumni each CTT facilitator or NWP site director reported sending the online
survey invitation to, minus the number of individual e-mail addresses that “bounced back” or
were no longer accurate. For both CTT and NWP, not all facilitators and site directors responded
to e-mails, even after multiple attempts to contact them. There were also a few facilitators and
site directors who did respond to the e-mail but were then unable to actually forward the survey
invitation to their alumni.
Four CTT programs in Illinois, Oregon, and Wisconsin in the initial sample turned out to
be defunct, too new to have alumni, or to be Courage to Lead programs instead of Courage to
Teach programs. These four programs are marked as N/A on Table 3-1 below. Four other CTT
programs in Arizona, Georgia, New York, and Virginia were added to the sample as “Round
Two” sites. Although not on the original list of programs identified by the Center for Courage
and Renewal, the facilitators of these programs responded to the initial invitation, indicated that
they had conducted at least one retreat series, and forwarded the invitation to those alumni. As it
turns out, three of these Round Two CTT sites matched geographically with three of the NWP
Round Two sites.
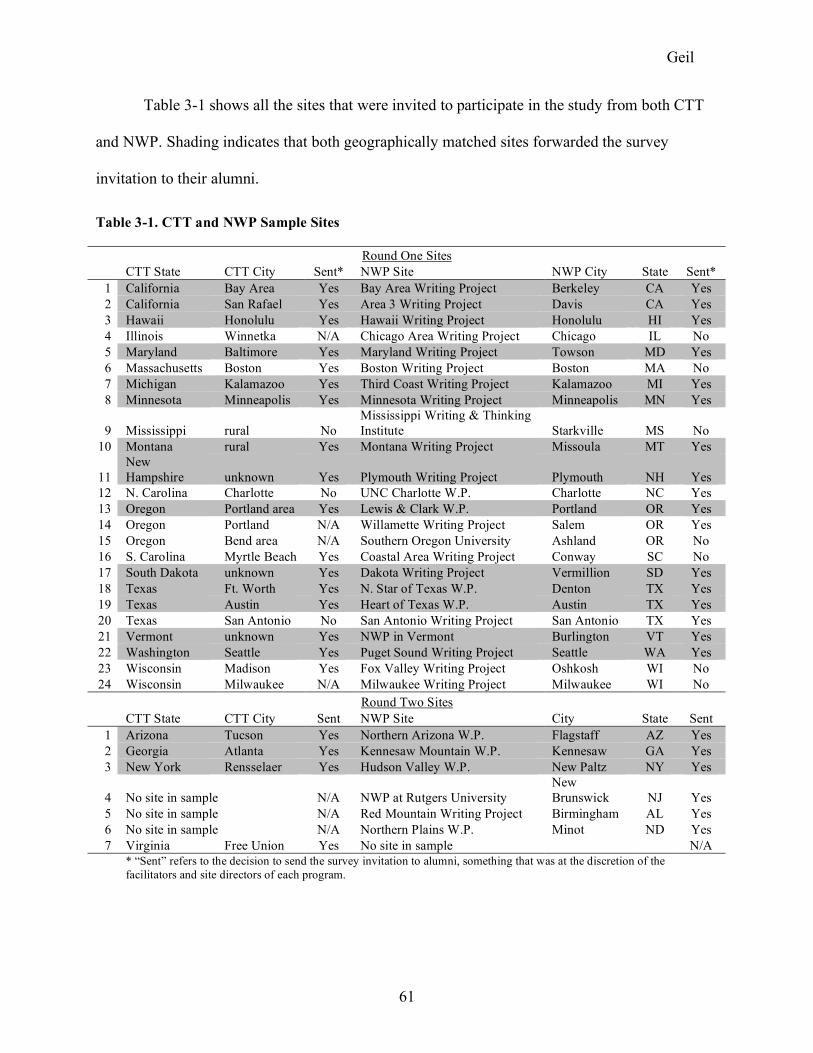
Geil
61
Table 3-1 shows all the sites that were invited to participate in the study from both CTT
and NWP. Shading indicates that both geographically matched sites forwarded the survey
invitation to their alumni.
Table 3-1. CTT and NWP Sample Sites
Round One Sites CTT State CTT City Sent* NWP Site NWP City State Sent*
1 California Bay Area Yes Bay Area Writing Project Berkeley CA Yes 2 California San Rafael Yes Area 3 Writing Project Davis CA Yes 3 Hawaii Honolulu Yes Hawaii Writing Project Honolulu HI Yes 4 Illinois Winnetka N/A Chicago Area Writing Project Chicago IL No 5 Maryland Baltimore Yes Maryland Writing Project Towson MD Yes 6 Massachusetts Boston Yes Boston Writing Project Boston MA No 7 Michigan Kalamazoo Yes Third Coast Writing Project Kalamazoo MI Yes 8 Minnesota Minneapolis Yes Minnesota Writing Project Minneapolis MN Yes
9 Mississippi rural No Mississippi Writing & Thinking Institute Starkville MS No
10 Montana rural Yes Montana Writing Project Missoula MT Yes
11 New Hampshire unknown Yes Plymouth Writing Project Plymouth NH Yes
12 N. Carolina Charlotte No UNC Charlotte W.P. Charlotte NC Yes 13 Oregon Portland area Yes Lewis & Clark W.P. Portland OR Yes 14 Oregon Portland N/A Willamette Writing Project Salem OR Yes 15 Oregon Bend area N/A Southern Oregon University Ashland OR No 16 S. Carolina Myrtle Beach Yes Coastal Area Writing Project Conway SC No 17 South Dakota unknown Yes Dakota Writing Project Vermillion SD Yes 18 Texas Ft. Worth Yes N. Star of Texas W.P. Denton TX Yes 19 Texas Austin Yes Heart of Texas W.P. Austin TX Yes 20 Texas San Antonio No San Antonio Writing Project San Antonio TX Yes 21 Vermont unknown Yes NWP in Vermont Burlington VT Yes 22 Washington Seattle Yes Puget Sound Writing Project Seattle WA Yes 23 Wisconsin Madison Yes Fox Valley Writing Project Oshkosh WI No 24 Wisconsin Milwaukee N/A Milwaukee Writing Project Milwaukee WI No
Round Two Sites CTT State CTT City Sent NWP Site City State Sent
1 Arizona Tucson Yes Northern Arizona W.P. Flagstaff AZ Yes 2 Georgia Atlanta Yes Kennesaw Mountain W.P. Kennesaw GA Yes 3 New York Rensselaer Yes Hudson Valley W.P. New Paltz NY Yes
4 No site in sample N/A NWP at Rutgers University New Brunswick NJ Yes
5 No site in sample N/A Red Mountain Writing Project Birmingham AL Yes 6 No site in sample N/A Northern Plains W.P. Minot ND Yes 7 Virginia Free Union Yes No site in sample N/A
* “Sent” refers to the decision to send the survey invitation to alumni, something that was at the discretion of the facilitators and site directors of each program.
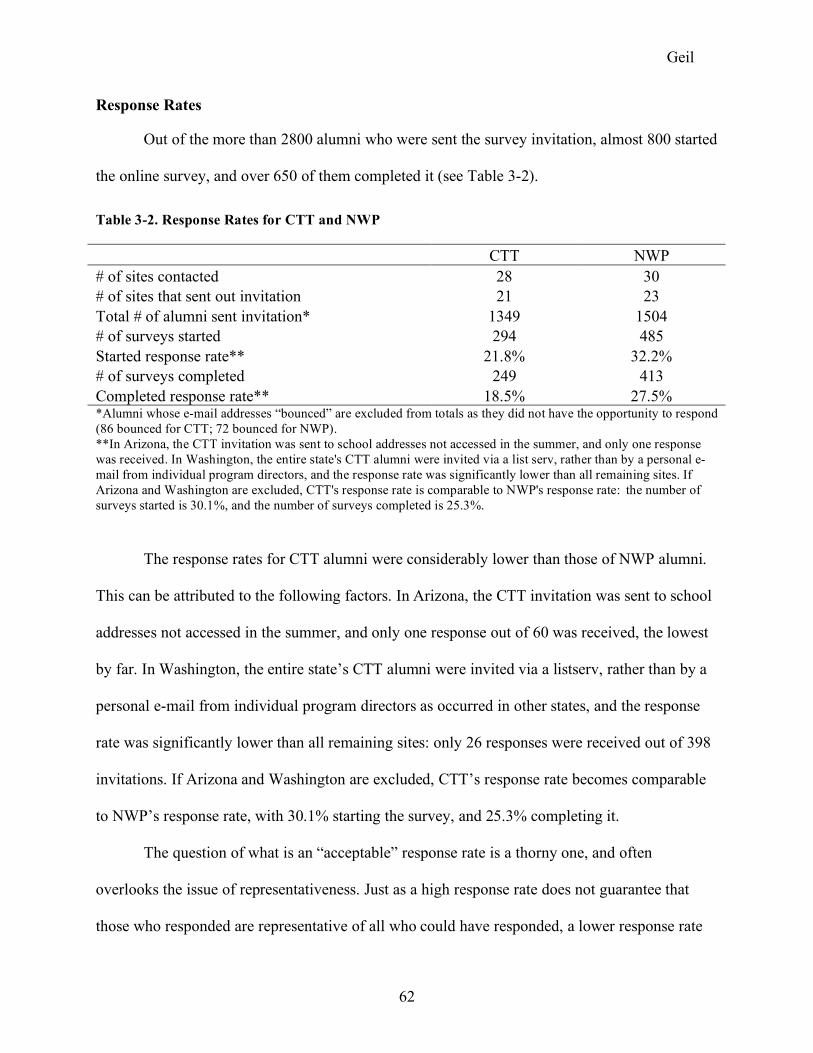
Geil
62
Response Rates
Out of the more than 2800 alumni who were sent the survey invitation, almost 800 started
the online survey, and over 650 of them completed it (see Table 3-2).
Table 3-2. Response Rates for CTT and NWP
CTT NWP # of sites contacted 28 30 # of sites that sent out invitation 21 23 Total # of alumni sent invitation* 1349 1504 # of surveys started 294 485 Started response rate** 21.8% 32.2% # of surveys completed 249 413 Completed response rate** 18.5% 27.5% *Alumni whose e-mail addresses “bounced” are excluded from totals as they did not have the opportunity to respond (86 bounced for CTT; 72 bounced for NWP). **In Arizona, the CTT invitation was sent to school addresses not accessed in the summer, and only one response was received. In Washington, the entire state's CTT alumni were invited via a list serv, rather than by a personal e-mail from individual program directors, and the response rate was significantly lower than all remaining sites. If Arizona and Washington are excluded, CTT's response rate is comparable to NWP's response rate: the number of surveys started is 30.1%, and the number of surveys completed is 25.3%.
The response rates for CTT alumni were considerably lower than those of NWP alumni.
This can be attributed to the following factors. In Arizona, the CTT invitation was sent to school
addresses not accessed in the summer, and only one response out of 60 was received, the lowest
by far. In Washington, the entire state’s CTT alumni were invited via a listserv, rather than by a
personal e-mail from individual program directors as occurred in other states, and the response
rate was significantly lower than all remaining sites: only 26 responses were received out of 398
invitations. If Arizona and Washington are excluded, CTT’s response rate becomes comparable
to NWP’s response rate, with 30.1% starting the survey, and 25.3% completing it.
The question of what is an “acceptable” response rate is a thorny one, and often
overlooks the issue of representativeness. Just as a high response rate does not guarantee that
those who responded are representative of all who could have responded, a lower response rate

Geil
63
does not mean that those who did respond are not a good representation of the whole population
(Krosnick, 1999). When the data is available, the best way to determine this is to analyze
characteristics of the non-respondents to see if there are any systematic patterns that explain why
they did not respond.
For both programs, there are reasons why the response rates may not have been higher.
First, in most cases, facilitators were asked to send out the initial survey invitation and two
follow-up reminders to encourage more participation. However, not all of the follow-up
reminders were sent out, and in a few cases, none of the follow-up reminders were sent out at all,
just the initial survey invitation was issued. Second, it is possible that some e-mail addresses
were out of date and did not reach the intended recipient, even though the e-mail message itself
did not “bounce back.” And third, the survey itself was administered near the end of the 2009
school year and into the summer, with some sites not issuing the original invitation until well
into the summer. In these cases, it is possible that teachers were either not looking at their school
e-mail or were not responding to e-mails because of summer vacation or other responsibilities.
Finally, people in the United States are becoming “over surveyed” and response rates to
surveys in all forms have generally been dropping, perhaps because being part of a survey is no
longer considered unique or unusual (Bickart & Schmittlein, 1999; Dey, 1997; Groves, Cialdini,
& Couper, 1992; Krosnick, 1999). Two meta-analyses of response rates for internet surveys
(Cook et al., 2000; Sheehan, 2001) found average mean response rates of 39.6% and 36.8% for
studies conducted between 1994 and 2000, and 1986 and 2001 respectively, and both noted that
response rates are falling. In fact, Sheehan’s meta-analysis showed a drop in response rates from
46% in 1995 to 24% in 2000. Given this, the response rate appears adequate, if not even on the
high side, for an internet survey of this type.

Geil
64
Survey Instrument
The online survey used in this research study consists of pre-existing items and survey
instruments as well as items that I created or adapted.
The Maslach Burnout Inventory
There are many possible ways to measure engagement with the profession of teaching,
such as participation in educational opportunities beyond the classroom, or the taking on of
additional responsibilities and leadership roles. The primary instrument used to measure
engagement in this study, however, is the Maslach Burnout Inventory-Educators’ Survey (MBI-
ES) (Maslach, Jackson, & Schwab, 1986). The creators of the MBI started by collecting
interview, questionnaire, and observational data on the attitudes and feelings of burned-out
human service professionals in a variety of fields, including teaching. In addition, they reviewed
other established scales for content material. Based on this initial exploratory research, they
hypothesized about the aspects that characterized the syndrome of burnout, and then designed the
items on the MBI to measure these aspects (Maslach & Jackson, 1981).
After running a factor analysis, three subscales emerged: emotional exhaustion, cynicism
(formerly depersonalization), and professional efficacy (formerly personal accomplishment). The
three-factor, or subscale, model of burnout and engagement has been confirmed with numerous
samples, including 469 teachers (Iwanicki & Schwab, 1981) and 710 teachers (Belcastro, Gold,
& Hays, 1983). Confirmatory factor analyses by Lee and Ashforth (1993) also have confirmed
the three-factor model, showing that emotional exhaustion and cynicism are “distinct but highly
correlated,” and that professional efficacy remains independent of the other two subscales
(Maslach et al., 1996).

Geil
65
The reader may recall the discussion in Chapter One of burnout and engagement and the
vignettes of an engaged versus a burned out teacher. While the MBI was initially created to
measure the concept of burnout, more recent research and writings by the authors of the tool
encourage the use of the MBI to measure the concept of engagement, with the theory being that
burnout and engagement are on opposite ends of a scale (Maslach, 2003; Maslach et al., 2001).
High engagement with the profession of teaching is operationalized here as low emotional
exhaustion, low cynicism, and high professional efficacy scores on the MBI-ES.
The original version of the MBI was designed for use with human service professionals,
and contains 22 statements about personal feelings and attitudes. The MBI-ES is essentially the
same as the original human services version, except that the word “recipient” has been replaced
with “student” (Maslach et al., 1996). Respondents indicate how often they experience the
feelings or attitudes depicted in the items using a 7-point scale ranging from “never” to “every
day.” There are nine items on the emotional exhaustion subscale, all of which describe feelings
of being exhausted by one’s work and emotionally overextended. The five items on the cynicism
subscale describe feelings of distance towards the recipients of one’s care, or an impersonal or
uncaring response. The eight items on the professional efficacy subscale, on the other hand,
describe positive feelings of competence, effectiveness, and meaning regarding one’s work and
the people that are the focus of that work (Maslach & Jackson, 1981; Maslach et al., 1996). For a
sample of items4 from the MBI (from this point on, the MBI-ES will be referred to simply as the
MBI), see Figure 3-2.
4 Due to copyright restrictions on the MBI, the only items that can be published are the sample items in Figure 3-2.

Geil
66
Directions: The purpose of this survey is to discover how educators view their jobs and the people with whom they work closely. Please read each statement carefully and decide if you ever feel this way about your job. If you have never had this feeling, write a "0" (zero) before the statement. If you have had this feeling, indicate how often you feel it by writing the number (from 1 to 6) that best describes how frequently you feel that way. How Often: 0 1 2 3 4 5 6
Never A few Once a A few Once a A few Every times month times week times a day a year or or less a month week less
I. Emotional Exhaustion I feel like I'm at the end of my rope. II. Cynicism (Depersonalization) I feel I treat some students as if they were impersonal objects. III. Professional Efficacy (Personal Accomplishment) I feel I'm positively influencing other people's lives through my work.
From the Maslach Burnout Inventory - Educators Survey by Christina Maslach, Susan E. Jackson, and Richard L. Schwab. Copyright 1986 by CPP, Inc. All rights reserved. Further reproduction is prohibited without the Publisher's consent.
Figure 3-2. Sample items from the Maslach Burnout Inventory-Educators Survey.
One thing to keep in mind when interpreting scores on the three subscales is that the
emotional exhaustion and cynicism statements all represent negative feelings or attitudes, so a
high score actually indicates burnout, while a low score indicates engagement. The professional
efficacy subscale is the opposite: all of the statements are positive, so a high score is indicative of
higher engagement, and a low score of burnout.
Reliability of the MBI
It is important to know that an instrument is reliably measuring what it is intended to
measure. For example, if you weighed yourself several days in a row, you would expect your
weight to not fluctuate too much; if the second day the scale reported that your weight was 15 lbs
Geil
67
higher than the previous day, and on the third day it said you weighed 10 lbs less, you would
begin to suspect that you could not trust your scale to reliably measure your true weight
(Thompson, 2003). The most commonly used reliability coefficient is Cronbach’s alpha, and
what it tells you is how much of the variation you measure is “real” versus how much is “noise.”
The higher the reliability, the more true variation you are detecting and the less noise. Reliability
coefficients, however, tend to go up as the number of items on a scale increases, so a high
reliability coefficient on a scale with 100 items may not actually be as good of a measure as a
scale with 10 items and a lower reliability coefficient. Generally speaking, Cronbach’s alpha
values of .70 and higher are considered acceptable (Field, 2005; Hogan, Benjamin, & Brezinski,
2000), though to a large extent this will depend on the intended use of the measure.
The following reliability coefficients were reported for the subscales of the MBI when
they were originally created: emotional exhaustion (.90), cynicism (.79), and professional
efficacy (.71) (Maslach et al., 1996). However, reliability cannot be established once and for all;
each time a test is used the sample of respondents may differ and this may affect the reliability,
so it must be measured for each study (Thompson, 2003; Wilkinson & the APA Task Force on
Statistical Inference, 1999). As it turns out, the reliabilities estimated using Cronbach’s alpha for
the data in this study are quite similar: emotional exhaustion is almost exactly the same (.91),
cynicism is lower (.71), and professional efficacy is higher (.77).
The MBI is intended to measure an “enduring state,” but because of the time frame and
nature of this study, it was not possible to conduct test-retest reliability analyses. However,
previous analyses of test-retest reliability by the instrument’s creators have indicated high
degrees of consistency within each subscale, with emotional exhaustion consistently having the

Geil
68
highest test-retest correlation (S. E. Jackson et al., 1986; Lee & Ashforth, 1993; Leiter, 1990;
Leiter & Durup, 1996).
Validity of the MBI
Typically, the purpose of measuring something is so that we can make inferences or take
actions based on the results we obtain. Along with reliability, it is important for an instrument to
be valid: for the inferences and actions we base on it to be supported by the available empirical
evidence and theoretical rationales (Messick, 1989). To continue with the above example, if you
decided to use a bathroom scale to measure students’ IQ, and then placed students in advanced or
remedial classes based on those results, you would obviously not have a valid instrument for that
purpose.
The MBI’s validity was originally evaluated relative to several different criteria,
including personal experience, dimensions of the job, and personal outcomes. For example,
coworkers or spouses of those who had taken the MBI were asked to provide a behavioral
evaluation of that person, including ratings of “how emotionally drained” the person was and
what his or her mood was upon returning home. High correlations emerged between the
respondent’s scores on the MBI, especially the emotional exhaustion and cynicism subscales,
and what his or her coworker or spouse said in the evaluations (S. E. Jackson & Maslach, 1982;
Maslach & Jackson, 1979). High burnout scores were found to be predictive of teachers’ desire
to quit their jobs (S. E. Jackson et al., 1986), and the hypothesis that workers who dealt with
higher numbers of clients would be closer to the burnout end of the scale was also confirmed
(Maslach & Jackson, 1984).
For the current study, the only data available with which to attempt to establish the
validity of the MBI by a similar method to that taken by Maslach and colleagues is that provided

Geil
69
by respondents to the survey questions. The following questions from the National Center for
Education Statistics were included on the survey so that their responses could be triangulated
with responses on the MBI: I sometimes feel it is a waste of time to try to do my best as a
teacher; If I could get a higher paying job I’d leave teaching as soon as possible; I don’t seem to
have as much enthusiasm now as I did when I began teaching; and I think about staying home
from school because I’m just too tired to go (respondents could choose from “Strongly disagree,”
“Somewhat disagree,” “Somewhat agree,” or “Strongly agree”). After combining these four
items into a subscale, correlations were run between it and the three subscales of the MBI (see
Table 3-3).
Table 3-3. Correlations Between MBI Subscales and NCES Burnout/Engagement Scale
NCES Burnout/Engagement Subscale (n=410)
Emotional Exhaustion Subscale
Cynicism Subscale
Professional Efficacy Subscale
Pearson's r 0.59 0.52 -0.45
Strong correlations emerged: the higher a respondent’s scores on the emotional
exhaustion and cynicism subscales, the more likely they were to agree with the items on the
NCES Burnout/Engagement Subscale, as would be expected. On the other hand, there was a
strong negative correlation between the NCES Burnout/Engagement Subscale and the
professional efficacy subscale of the MBI, also as expected: the stronger a respondent’s feelings
of accomplishment about teaching, the less likely they were to agree that trying to do their best
as a teacher was a waste of time, for example.
It also seems reasonable to expect that those who have scores indicative of higher
engagement with teaching would be less likely to have applied for a job in an attempt to leave
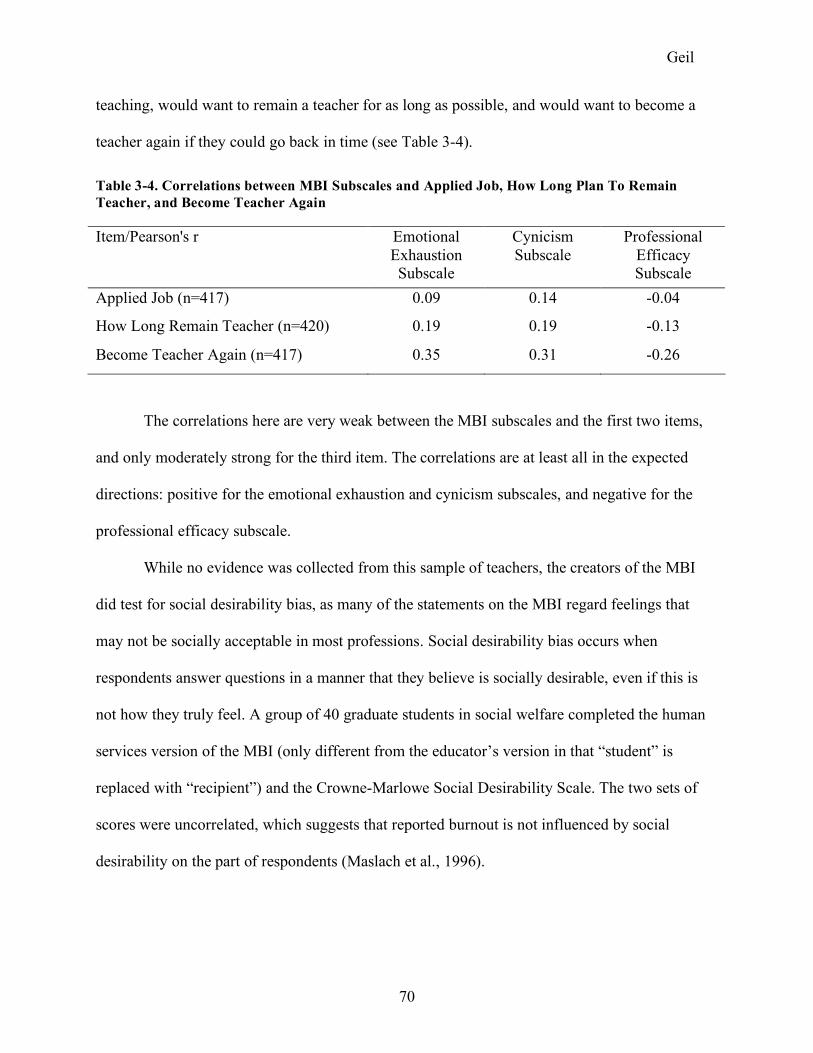
Geil
70
teaching, would want to remain a teacher for as long as possible, and would want to become a
teacher again if they could go back in time (see Table 3-4).
Table 3-4. Correlations between MBI Subscales and Applied Job, How Long Plan To Remain Teacher, and Become Teacher Again
Item/Pearson's r Emotional Exhaustion Subscale
Cynicism Subscale
Professional Efficacy Subscale
Applied Job (n=417) 0.09 0.14 -0.04
How Long Remain Teacher (n=420) 0.19 0.19 -0.13
Become Teacher Again (n=417) 0.35 0.31 -0.26
The correlations here are very weak between the MBI subscales and the first two items,
and only moderately strong for the third item. The correlations are at least all in the expected
directions: positive for the emotional exhaustion and cynicism subscales, and negative for the
professional efficacy subscale.
While no evidence was collected from this sample of teachers, the creators of the MBI
did test for social desirability bias, as many of the statements on the MBI regard feelings that
may not be socially acceptable in most professions. Social desirability bias occurs when
respondents answer questions in a manner that they believe is socially desirable, even if this is
not how they truly feel. A group of 40 graduate students in social welfare completed the human
services version of the MBI (only different from the educator’s version in that “student” is
replaced with “recipient”) and the Crowne-Marlowe Social Desirability Scale. The two sets of
scores were uncorrelated, which suggests that reported burnout is not influenced by social
desirability on the part of respondents (Maslach et al., 1996).

Geil
71
Normative Sample of the MBI
One advantage of using the MBI is that it is an instrument that has been administered to
thousands of subjects across a wide variety of careers, including teachers. Most importantly, the
responses of this study on the MBI can be compared to those of a normative sample of 4,163 K-
12 teachers. A normative sample is a group within a population who takes a test and is intended
to represent the larger population. This group’s scores are then used to create “norms” with
which other test takers’ scores can be compared. The normative sample for the MBI is not
chronologically matched (the majority of the studies used to create the sample are well over 15
years old), and very little is known about the demographics of the sample, so any comparisons
must be taken under consideration. Nevertheless, it can provide a starting comparison tool for
this study.
National Center for Education Statistics’ School and Staffing Surveys
There is also a set of items on the survey taken from the National Center for Education
Statistics’ Schools and Staffing Survey (SASS) Teacher Questionnaire and from the Teacher
Follow-Up Surveys (TFS). The set of surveys administered by this governmental agency is given
to a nationally representative sample of teachers, principals, schools, and school districts and has
been given since the mid-1980s, most recently in 2003-2004 and in 2007-2008 (National Center
for Education Statistics, 2010). I included some items in my survey because they probed
important demographic issues, and others were chosen specifically because of their overlap with
concepts measured by the MBI. The responses to these items can provide a chronologically
appropriate, nationally representative sample of teachers to act as another comparison group for
CTT when the data are available (not all of the SASS and TFS data are available to the public).

Geil
72
Researcher-Created Items
I created (or adapted from preexisting instruments) the remaining items on the survey,
which fell into four main categories: demographics, information related to professional
development participation, a scale of items attempting to measure the quality of the teacher’s
relationship with the subject he/she teaches5, and a scale of items specifically asking about the
effects of participation in the professional development program on various issues. The entire
survey (with the exception of the MBI, which for copyright purposes is limited to sample
statements) is available in Appendix C and D. Appendix C contains the CTT version of the
online survey, and Appendix D contains just those items on the NWP online survey that are
different from the CTT version.
Pilot Test
Before its final administration to the CTT and NWP alumni samples described above,
two rounds of pilot testing were undertaken. The CTT and NWP programs in Denver, CO both
agreed to ask their alumni to complete the pilot survey and to respond to the question: Do you
have any comments or suggestions about the survey in general that could be used to improve the
final version or increase the likelihood of busy teachers being willing to complete it? Twenty-
three responses were received from the Colorado CTT group and 28 responses were received
from the NWP group. Based on the results of the pilot survey and an analysis of the responses
received, many of the researcher-created items were reworded, changed, or discarded, several of
the NCES items were added or discarded, and parts of the survey were restructured to make it as
easy to complete as possible and not too lengthy. Because the final survey instrument is different
5 This subscale ended up both to be a relatively weak measurement, and also not as related to the outcomes of the study as I had anticipated, so it is not used in this analysis. Other survey items are also not used in this analysis for similar reasons.

Geil
73
from the version used in the pilot testing, the responses from the Colorado groups on the pilot
survey are not included in the analysis presented here.
Confidentiality of Data
Human Research Committee (HRC) approval for this study has been obtained from the
appropriate authorities at the University of Colorado at Boulder. In accordance with human
research guidelines, all data is kept on a secure computer in the researcher’s office, which is
locked. Printed data is also kept in a locked file cabinet in the researcher’s office. The anonymity
of all participants is preserved by reporting results in the aggregate, using pseudonyms or
identifying numbers, and/or excluding information that could be used to identify the subject.
Five years after the conclusion of the study, all data will be destroyed.
Survey Data Limitations
Even with all the care taken on the construction of the survey and sampling of survey
respondents there are clear limitations to the database that resulted, primarily with regards to
response rates and representativeness. As I analyzed the data, other limitations also emerged,
which will be discussed in future chapters.
Response Rates and Representativeness
I was not able to guarantee participation of all sites in my samples, which means that
even though the samples were designed to be representative in terms of geographical region and
age of site (both vis-à-vis each other and on an individual program basis), this level was not
achieved. Also, a geographic match was not obtained for all sites, and even for those sites that
are matched geographically, the respondents themselves are not matched one-to-one. To a large
degree, the propensity score matching techniques (to be described in Chapter Five) will help to
minimize this issue, as the respondents were ultimately matched on variables that encompass

Geil
74
geography. However, it is not accurate to state that the CTT and NWP samples are representative
of all sites in each program.
Nor is it possible to claim that the CTT and NWP respondents are representative of all
participants of each program as a whole. Although my response rate was high for a study of this
nature, there are still many who did not choose to respond, and there is little data available with
which to analyze the non-respondents. I have no way of knowing, for example, if only the
participants who benefited most from their participation in the PD program chose to respond, or
if it was only those who are already engaged with teaching. Any conclusions reached must
therefore be limited to the sample of CTT and NWP alumni who participated in this study.
Focus of Analysis on PK-12 Teachers
Although the survey was administered to respondents who teach at all levels, only those
respondents who were PK-12 teachers at the time they completed the survey are being analyzed
in the chapters that follow. While there are certainly differences between PK-12 schools at the
various levels, the differences between them are not as great as those between PK-12 schools and
colleges/universities. To keep the groups as comparable as possible, instructors at the
college/university level or other non-PK-12 levels have been excluded as well as any
respondents who indicated that they are administrators. Any respondents who were not currently
teaching were also taken out of the sample. In addition, a small proportion of cases were
excluded either because they had missing data regarding their current teaching status or because
they had participated in both CTT and NWP. After removing these cases, a total of 420 (144
CTT and 276 NWP) cases remain out of the original 662 completed responses received on the
survey. All of these 420 respondents completed the survey, participated in just one of the two PD
programs, and are currently PK-12 teachers.
Geil
75
For those who are interested in descriptive statistics on the subset of respondents who are
college and university level instructors, this information can be found in Appendix E. The
number of administrators who completed the survey was very small, and descriptive statistics
would not be particularly meaningful so they have not been calculated for this subset of
respondents.
Summary of Chapter
This chapter has explained how I came to use a quasi-experimental study design, as well
as the issues involved with trying to measure a counterfactual outcome and how an appropriately
selected control group can help minimize bias. The National Writing Project was introduced and
existing research examined to illuminate similarities and differences between the two PD
programs. The procedures that I used to select my sample were explained, along with my
response rates. The survey instrument, the pilot test, confidentiality issues, and survey data
limitations were also discussed.
In the next chapters, I will present my findings: Chapter Four will cover descriptive
characteristics of the CTT and NWP respondents and nationally representative samples of
teachers in general. Chapter Five will address the question of CTT’s effect on subsequent teacher
engagement and perceived benefits. Chapter Six will present exploratory data related to
retention, and Chapter Seven will do the same with regards to the most valuable aspects of the
PD programs.
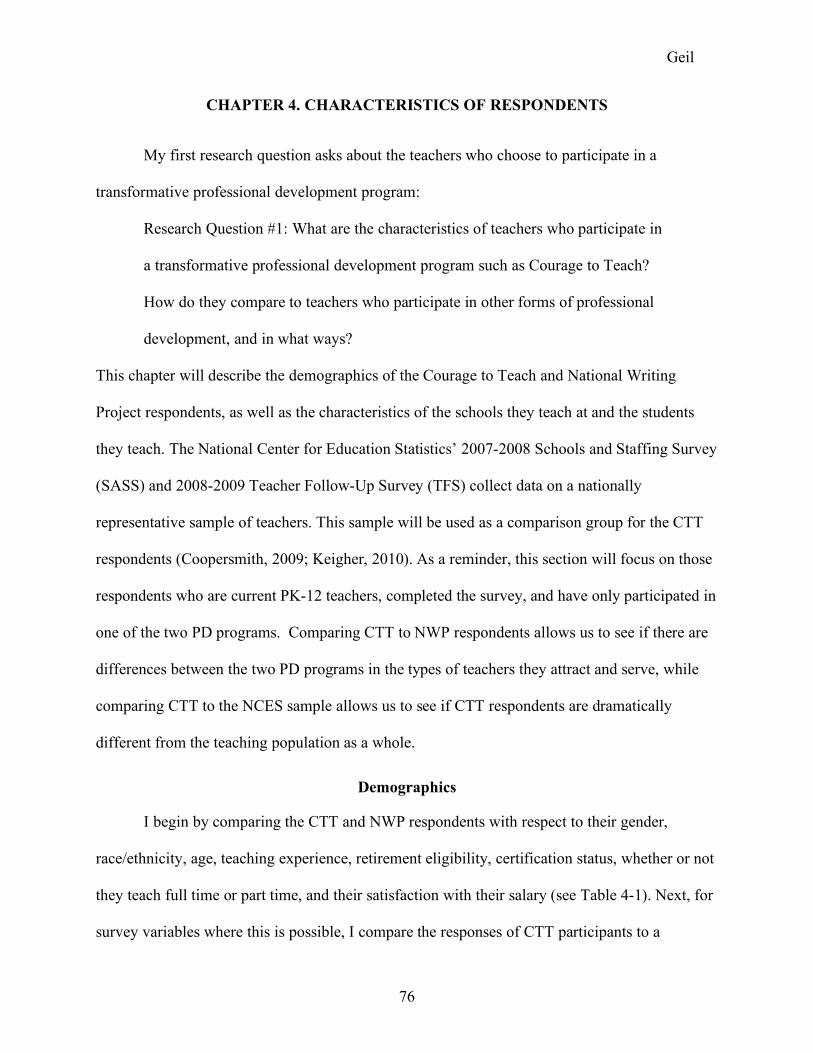
Geil
76
CHAPTER 4. CHARACTERISTICS OF RESPONDENTS
My first research question asks about the teachers who choose to participate in a
transformative professional development program:
Research Question #1: What are the characteristics of teachers who participate in
a transformative professional development program such as Courage to Teach?
How do they compare to teachers who participate in other forms of professional
development, and in what ways?
This chapter will describe the demographics of the Courage to Teach and National Writing
Project respondents, as well as the characteristics of the schools they teach at and the students
they teach. The National Center for Education Statistics’ 2007-2008 Schools and Staffing Survey
(SASS) and 2008-2009 Teacher Follow-Up Survey (TFS) collect data on a nationally
representative sample of teachers. This sample will be used as a comparison group for the CTT
respondents (Coopersmith, 2009; Keigher, 2010). As a reminder, this section will focus on those
respondents who are current PK-12 teachers, completed the survey, and have only participated in
one of the two PD programs. Comparing CTT to NWP respondents allows us to see if there are
differences between the two PD programs in the types of teachers they attract and serve, while
comparing CTT to the NCES sample allows us to see if CTT respondents are dramatically
different from the teaching population as a whole.
Demographics
I begin by comparing the CTT and NWP respondents with respect to their gender,
race/ethnicity, age, teaching experience, retirement eligibility, certification status, whether or not
they teach full time or part time, and their satisfaction with their salary (see Table 4-1). Next, for
survey variables where this is possible, I compare the responses of CTT participants to a

Geil
77
nationally representative sample of teachers from the NCES’s 2007-2008 Schools and Staffing
Survey (Coopersmith, 2009; Keigher, 2010).
Table 4-1. Demographic Characteristics of CTT and NWP PK-12 Respondents
CTT
NWP n % n %
Female 126 88.1 237 86.2 Race/Ethnicity
White 129 90.2 239 87.5 African American 6 4.2 7 2.6 Multiracial 5 3.5 12 4.4 Hispanic 2 1.4 4 1.5 Asian 1 0.7 6 2.2 American Indian 0 0.0 4 1.5 Pacific Islander 0 0.0 1 0.4
Age 30 yrs or younger 4 2.8 43 15.6 31-40 yrs old 29 20.1 74 26.9 41-50 yrs old 46 31.9 73 26.5 51-60 yrs old 55 38.2 64 23.3 61 yrs or older 10 6.9 21 7.6
Teaching Experience 5 yrs or less 20 14.0 107 38.9 6-10 yrs 32 22.4 66 24.0 11-20 yrs 59 41.3 64 23.3 21 yrs or more 32 22.4 38 13.8
Retirement Eligibility In 5 years or less 34 23.8 45 16.6 In 6 to 10 years 34 23.8 41 15.1 In 11 years or more 67 46.9 170 62.7
Has Teaching Certificate 134 94.4 268 98.5 Full Time Teacher 133 92.4 263 96.3 Satisfied With Salary
Strongly disagree 12 8.3 32 11.6 Somewhat disagree 37 25.7 55 19.9 Somewhat agree 69 47.9 139 50.4 Strongly agree 26 18.1 50 18.1

Geil
78
Gender and Race/Ethnicity
The majority of respondents in this study (at least 85% or more) are primarily female and
primarily white for both CTT and NWP. Compared to a nationally representative sample of
teachers surveyed by NCES on the 2007-2008 SASS (Coopersmith, 2009), the CTT teachers are
less diverse in terms of gender and race. Nationwide, almost 25% of the K-12 teaching force is
male, compared to only 12% of the CTT respondents (see Figure 4-1).
Figure 4-1. Comparison of CTT respondents and the NCES national sample by gender.
In the national sample, 16% of teachers are estimated to be non-White, as opposed to
only 10% of the CTT respondents (see Figure 4-2).
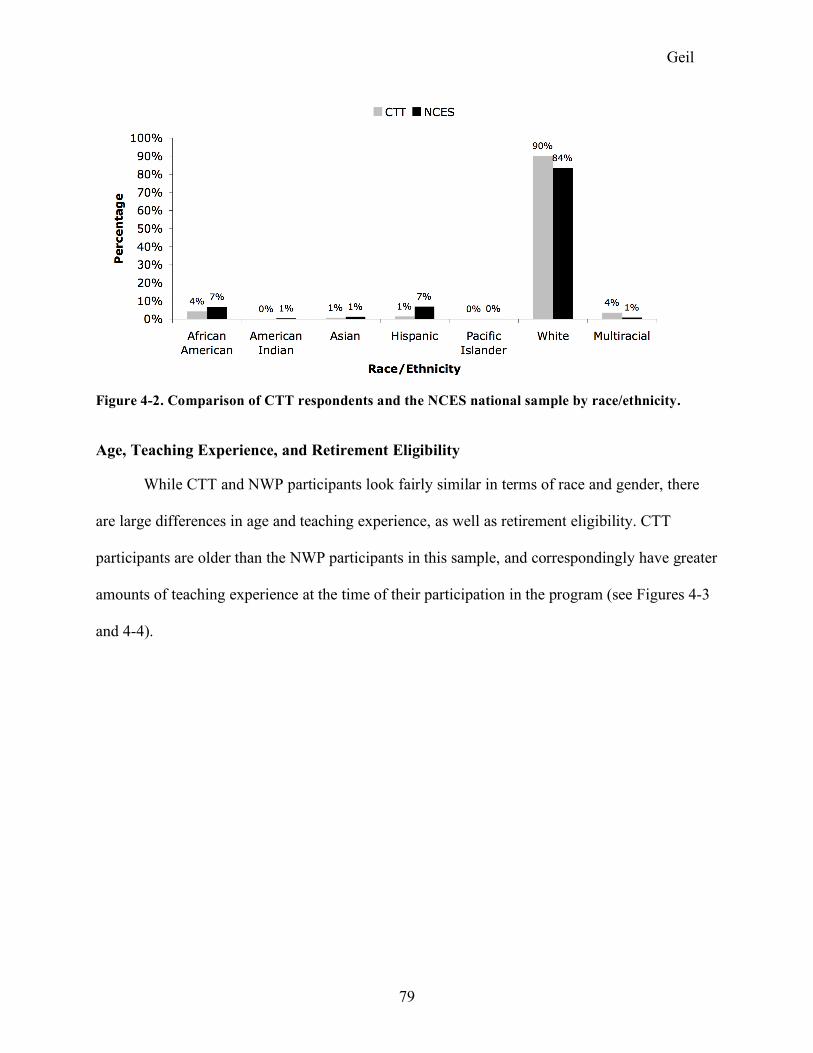
Geil
79
Figure 4-2. Comparison of CTT respondents and the NCES national sample by race/ethnicity.
Age, Teaching Experience, and Retirement Eligibility
While CTT and NWP participants look fairly similar in terms of race and gender, there
are large differences in age and teaching experience, as well as retirement eligibility. CTT
participants are older than the NWP participants in this sample, and correspondingly have greater
amounts of teaching experience at the time of their participation in the program (see Figures 4-3
and 4-4).

Geil
80
Figure 4-3. Comparison of CTT and NWP respondents by age.
Figure 4-4. Comparison of CTT and NWP respondents by teaching experience.
As would be expected given the differences in age and teaching experience, the CTT
respondents are also much closer to retirement than the NWP respondents, with almost half of
the CTT sample becoming eligible in the next 10 years compared to slightly less than a third of
the NWP sample.
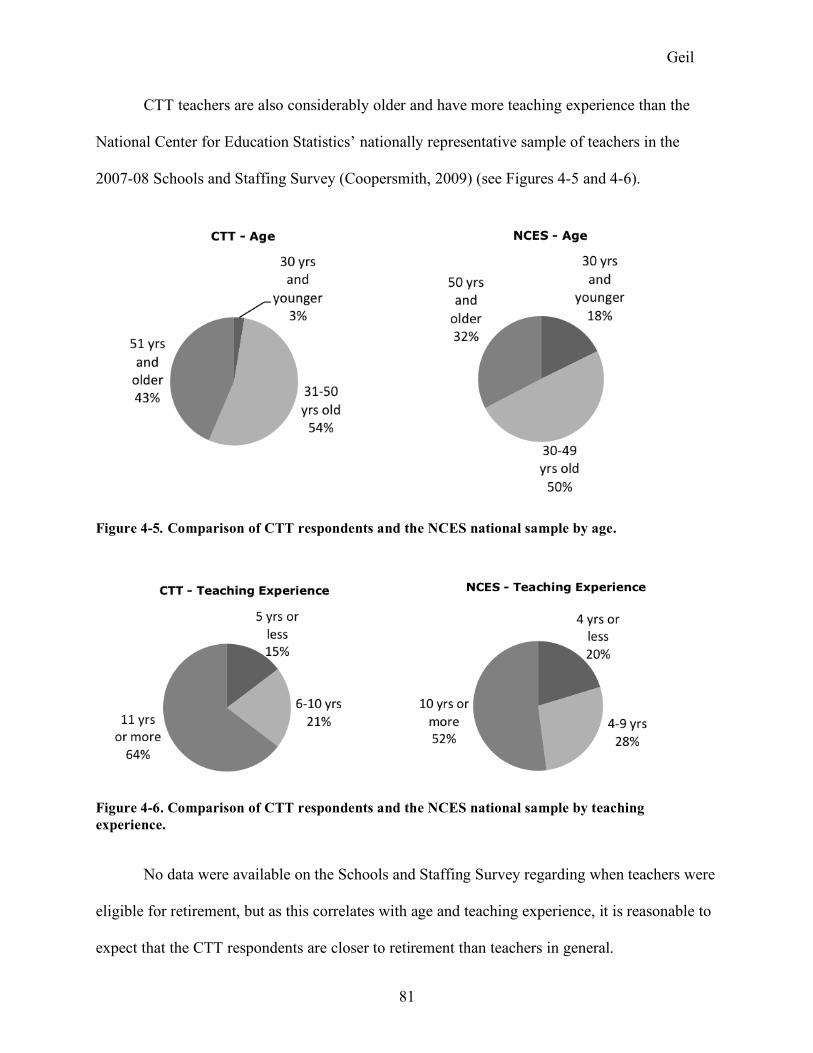
Geil
81
CTT teachers are also considerably older and have more teaching experience than the
National Center for Education Statistics’ nationally representative sample of teachers in the
2007-08 Schools and Staffing Survey (Coopersmith, 2009) (see Figures 4-5 and 4-6).
Figure 4-5. Comparison of CTT respondents and the NCES national sample by age.
Figure 4-6. Comparison of CTT respondents and the NCES national sample by teaching experience.
No data were available on the Schools and Staffing Survey regarding when teachers were
eligible for retirement, but as this correlates with age and teaching experience, it is reasonable to
expect that the CTT respondents are closer to retirement than teachers in general.

Geil
82
Certification and Full Time Status
The vast majority of both the CTT and the NWP respondents hold teaching certificates
for the state in which they are currently teaching. Slightly more of the NWP respondents have
teaching certificates than the CTT respondents, but both groups are well over 90%. The same
pattern exists for the CTT and NWP respondents in terms of their teaching status. Again, more
than 90% of the respondents in both programs teach full time, and NWP has slightly more full
time teachers than CTT in this sample.
It is challenging to directly compare the teaching certification of the CTT respondents to
the nationally representative sample of teachers from the 2007-2008 SASS (Keigher, 2010)
because of differences in how the data were collected. In the SASS, the data is broken down by
type of certificate: regular certificate, provisionary certificate (still needs to complete a
probationary period, a certification program, or other requirements such as additional
coursework or student teaching), or none of the above. If we compare the number of CTT
respondents reporting they hold a teaching certificate (94.4%) to the estimated number of
teachers in the nationwide sample holding a regular certificate (87.1%), then CTT appears to
have more teachers who hold a teaching certificate. But, if we compare the CTT respondents to
the estimated number of the nation’s teachers holding a regular or a provisionary certificate
(98.6%), then CTT has fewer teachers with certification. Because no distinction was made
between regular or provisionary certification for the CTT sample, it is not possible to determine
which scenario is more accurate.
When the CTT respondents are compared to a nationally representative sample of
teachers from the 2007-2008 SASS (Keigher, 2010) on full time teaching status, the two groups
look quite similar (see Figure 4-7).

Geil
83
Figure 4-7. Comparison of CTT respondents and the NCES national sample by full time teaching status.
In the CTT sample, 92% reported teaching full time, and an estimated 91% of the
nation’s teachers are full time teachers as well.
Satisfaction With Salary
About a third of the respondents from both PD programs indicated that they were not
completely satisfied with their salary, but the differences between the two groups are very slight.
While CTT had more respondents overall who agreed with the statement (I am satisfied with my
teaching salary), NWP had more respondents who strongly disagreed with the statement than
CTT. Both PD programs had exactly the same percentage of respondents who strongly agreed
with the statement (18%), indicating that they are indeed satisfied with their teaching salary.
While the data from the most recent SASS/TFS surveys is not available, I can compare
the CTT teachers to the teachers who completed the previous administration of the TFS
(National Center for Education Statistics, 2004-2005). Two-thirds (66%) of the CTT teachers
strongly or somewhat agreed with the statement: I am satisfied with my teaching salary. Slightly
less than half (48%) of the teachers on the TFS, regardless of whether they had stayed at the

Geil
84
same school or moved to another, said the same. So it appears that a significantly higher
percentage of the CTT teachers are satisfied with their salaries than in the nationally
representative sample.
School and Student Characteristics
Differences exist between CTT and NWP respondents in terms of the characteristics of
the schools at which they teach and the students at those schools. For all respondents who
provided their school’s name, city, and state, this information was used to search for their
schools on the Common Core of Data (CCD) database, a program of the U.S. Department of
Education’s National Center for Education Statistics. When a match was found, the relevant
characteristics of the school were retrieved from the CCD database. This section will examine
differences and similarities between the samples on school level, school size, school locale,
public or private sector, and percentages of non-White students and students eligible for free and
reduced lunch (FRL) (see Table 4-2).

Geil
85
Table 4-2. School and Student Level Characteristics of CTT and NWP Respondents
CTT NWP n % n % School Level
Elementary (PK-6) 56 39.4 65 23.7 Secondary (7-12) 41 28.9 104 38.0 Combined (PK-12) 32 22.5 80 29.2
No CCD data available 13 9.2 25 9.1 School Size
Less than 500 students 65 50.4 91 37.0 500-999 students 38 29.5 81 32.9 1,000 or more students 26 20.2 74 30.1
Student/Teacher Ratio 14.8 16.2 School Locale
Urban 52 40.3 64 25.5 Suburban 33 25.6 90 35.9 Town 10 7.8 38 15.1 Rural 34 26.4 59 23.5
Teaches at Public School 121 93.8 241 97.2 % of Non-White Students 129 37 246 34 % of Students Eligible for FRL 129 36 246 31
School Level Taught
There is a clear difference between the two PD program samples on school level. The
largest percentage of CTT respondents teach at elementary schools, while more of the NWP
respondents teach at secondary schools.
In order to compare the CTT respondents with the nationally representative sample from
the 2007-2008 SASS (Coopersmith, 2009), we will look only at those who have Common Core
of Data statistics available on school level and exclude all those for whom data were not
available. Although this raises the percentage of CTT respondents at elementary schools up to
43%, it is still far shy of the national estimate of 61% (see Figure 4-8).

Geil
86
Figure 4-8. Comparison of CTT respondents and the NCES national sample by school level.
The CTT sample also has a much higher percentage of teachers at combined schools
(which can include schools serving grades PK-12 or grades 6-8, as long as the school includes at
least one grade between PK-6 and one between grades 7-12).
Size of School
In terms of school size, the CTT teachers are more likely to be teaching at smaller
schools, while the NWP respondents are more likely to be teaching at larger schools. The CTT
respondents also have slightly lower student/teacher ratios at their schools than the NWP
respondents, although the difference is not great.
When the CTT respondents are compared to the nationally representative sample of
teachers and students from the 2007-08 Schools and Staffing Survey (Coopersmith, 2009), again
a higher percentage of the CTT participants teach at smaller schools (see Figure 4-9).
Geil
87
Figure 4-9. Comparison of CTT respondents and the NCES national sample by school size.
Location of School
There are differences between the two PD program samples regarding school locale, in
that more of the CTT respondents teach at urban schools, while more NWP respondents teach at
suburban schools. Compared to the nationwide sample on school locale (Coopersmith, 2009),
CTT has more teachers at urban schools than is estimated nationwide, and fewer teachers at
suburban schools (see Figure 4-10).
Figure 4-10. Comparison of CTT and the NCES national sample on school locale.
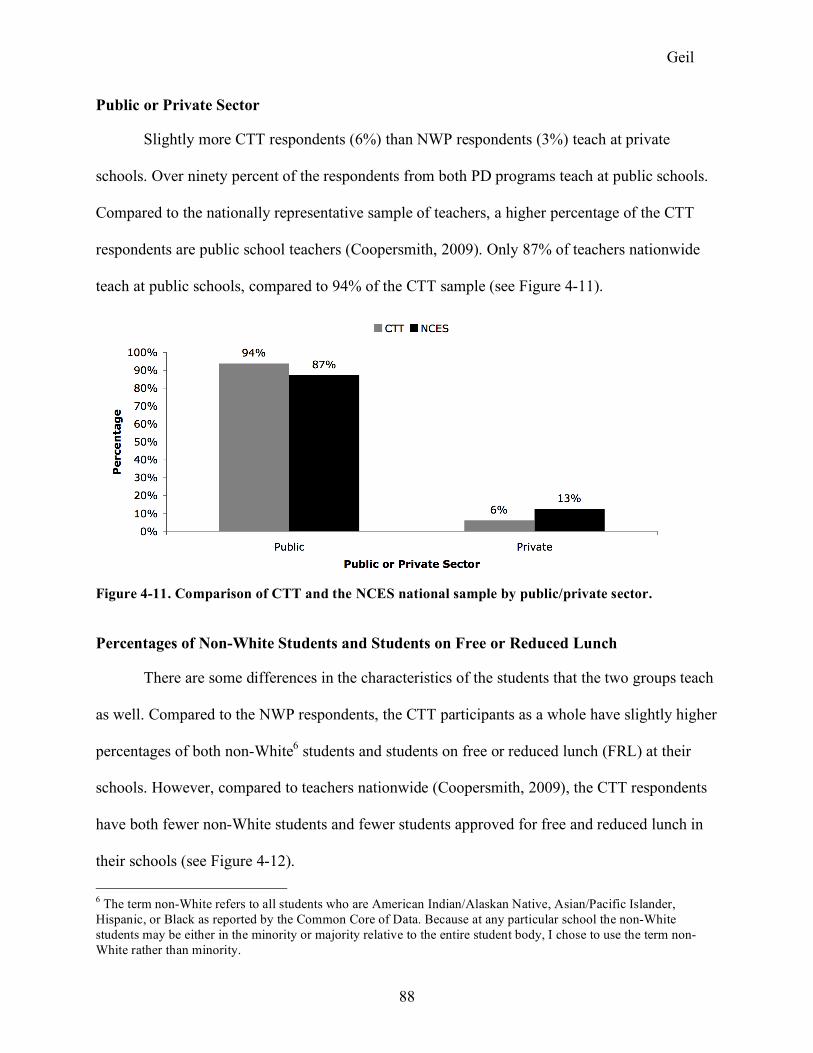
Geil
88
Public or Private Sector
Slightly more CTT respondents (6%) than NWP respondents (3%) teach at private
schools. Over ninety percent of the respondents from both PD programs teach at public schools.
Compared to the nationally representative sample of teachers, a higher percentage of the CTT
respondents are public school teachers (Coopersmith, 2009). Only 87% of teachers nationwide
teach at public schools, compared to 94% of the CTT sample (see Figure 4-11).
Figure 4-11. Comparison of CTT and the NCES national sample by public/private sector.
Percentages of Non-White Students and Students on Free or Reduced Lunch
There are some differences in the characteristics of the students that the two groups teach
as well. Compared to the NWP respondents, the CTT participants as a whole have slightly higher
percentages of both non-White6 students and students on free or reduced lunch (FRL) at their
schools. However, compared to teachers nationwide (Coopersmith, 2009), the CTT respondents
have both fewer non-White students and fewer students approved for free and reduced lunch in
their schools (see Figure 4-12).
6 The term non-White refers to all students who are American Indian/Alaskan Native, Asian/Pacific Islander, Hispanic, or Black as reported by the Common Core of Data. Because at any particular school the non-White students may be either in the minority or majority relative to the entire student body, I chose to use the term non-White rather than minority.
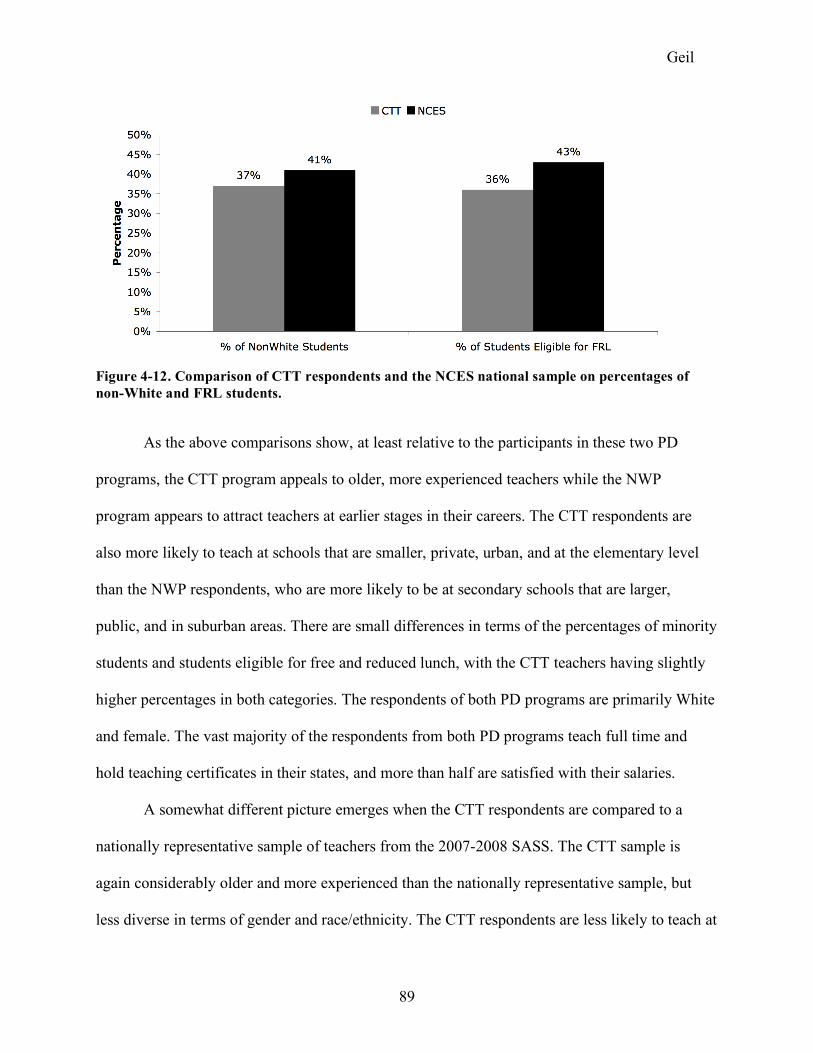
Geil
89
Figure 4-12. Comparison of CTT respondents and the NCES national sample on percentages of non-White and FRL students.
As the above comparisons show, at least relative to the participants in these two PD
programs, the CTT program appeals to older, more experienced teachers while the NWP
program appears to attract teachers at earlier stages in their careers. The CTT respondents are
also more likely to teach at schools that are smaller, private, urban, and at the elementary level
than the NWP respondents, who are more likely to be at secondary schools that are larger,
public, and in suburban areas. There are small differences in terms of the percentages of minority
students and students eligible for free and reduced lunch, with the CTT teachers having slightly
higher percentages in both categories. The respondents of both PD programs are primarily White
and female. The vast majority of the respondents from both PD programs teach full time and
hold teaching certificates in their states, and more than half are satisfied with their salaries.
A somewhat different picture emerges when the CTT respondents are compared to a
nationally representative sample of teachers from the 2007-2008 SASS. The CTT sample is
again considerably older and more experienced than the nationally representative sample, but
less diverse in terms of gender and race/ethnicity. The CTT respondents are less likely to teach at

Geil
90
elementary schools compared to the nationwide estimates, but a considerably higher percentage
of them teach at combined schools. The CTT program appears to attract teachers who are more
likely to teach at smaller schools (500 students or less) and in urban areas, but the students at
these schools are not as diverse with regards to percentages of minority students and students
eligible for free and reduced lunch. The CTT respondents are also more likely to teach at public
schools than the nationally representative sample. According to the available data, CTT
respondents are just as likely to hold teaching certificates and work full time as teachers
nationwide.
Characteristics of the Professional Development Programs
This last section examines when the respondents of the two professional development
programs participated, and also the type of CTT retreat series that the CTT respondents
participated in (see Table 4-3).
The NWP has been in existence twenty years longer than CTT, so it is no surprise that the
NWP respondents participated longer ago, in general, than the CTT respondents. Almost two-
thirds of the CTT respondents have participated in the last five years, compared to slightly over
half of the NWP respondents.
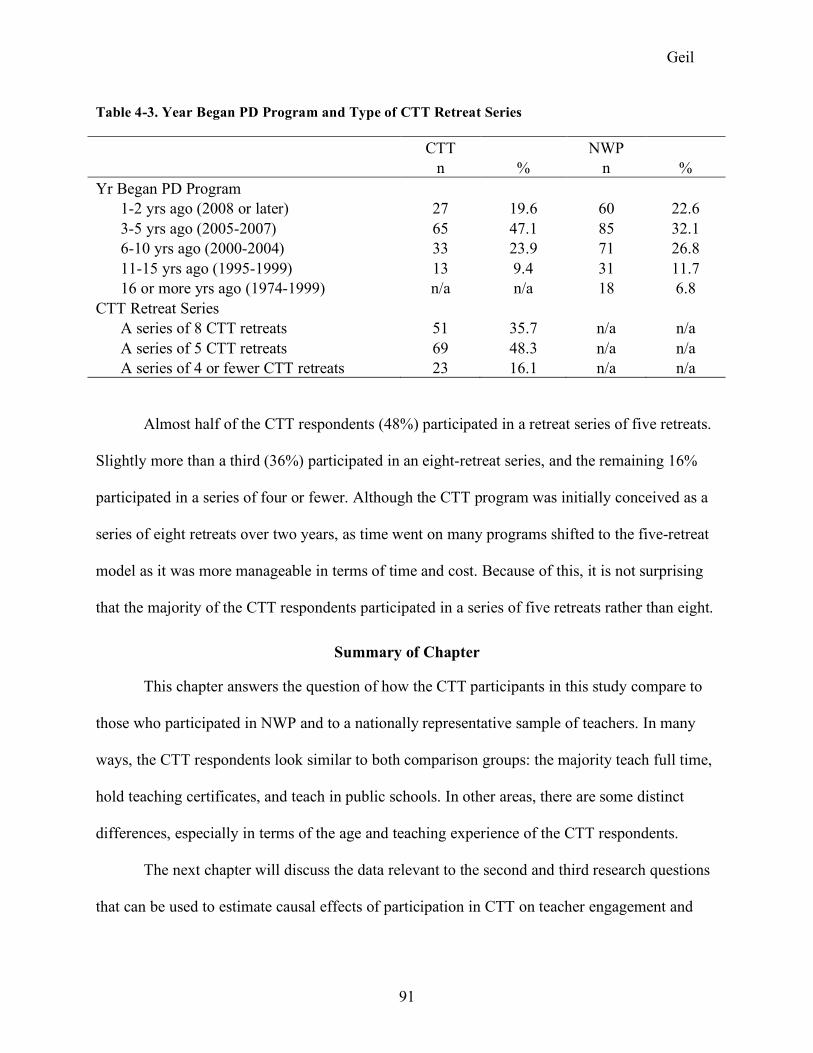
Geil
91
Table 4-3. Year Began PD Program and Type of CTT Retreat Series
CTT NWP n % n % Yr Began PD Program
1-2 yrs ago (2008 or later) 27 19.6 60 22.6 3-5 yrs ago (2005-2007) 65 47.1 85 32.1 6-10 yrs ago (2000-2004) 33 23.9 71 26.8 11-15 yrs ago (1995-1999) 13 9.4 31 11.7 16 or more yrs ago (1974-1999) n/a n/a 18 6.8
CTT Retreat Series A series of 8 CTT retreats 51 35.7 n/a n/a A series of 5 CTT retreats 69 48.3 n/a n/a A series of 4 or fewer CTT retreats 23 16.1 n/a n/a
Almost half of the CTT respondents (48%) participated in a retreat series of five retreats.
Slightly more than a third (36%) participated in an eight-retreat series, and the remaining 16%
participated in a series of four or fewer. Although the CTT program was initially conceived as a
series of eight retreats over two years, as time went on many programs shifted to the five-retreat
model as it was more manageable in terms of time and cost. Because of this, it is not surprising
that the majority of the CTT respondents participated in a series of five retreats rather than eight.
Summary of Chapter
This chapter answers the question of how the CTT participants in this study compare to
those who participated in NWP and to a nationally representative sample of teachers. In many
ways, the CTT respondents look similar to both comparison groups: the majority teach full time,
hold teaching certificates, and teach in public schools. In other areas, there are some distinct
differences, especially in terms of the age and teaching experience of the CTT respondents.
The next chapter will discuss the data relevant to the second and third research questions
that can be used to estimate causal effects of participation in CTT on teacher engagement and

Geil
92
perceived benefits. These are the questions for which the propensity score matching techniques
are being used, so first this process will be explained, and then the results will be presented.

Geil
93
CHAPTER 5. EFFECTS OF PARTICIPATION IN COURAGE TO TEACH ON TEACHER ENGAGEMENT AND PERCEIVED BENEFITS
The second research question asked about the effects of participation in a transformative
professional development (TPD) program on teacher engagement and retention:
Research Question #2: Does participation in Courage to Teach have an effect on
subsequent engagement with and retention in teaching?
This chapter will use the Maslach Burnout Inventory (MBI) to answer the part of the question
regarding engagement, comparing scores between Courage to Teach (CTT) and the National
Writing Project (NWP) and also CTT and normative/other samples of teachers who have taken
the MBI. As the data collected is not representative or generalizable, the results must be
constrained to the effects of CTT on teacher engagement for these respondents, as opposed to
TPD programs or CTT participants in general.
In this chapter I will also address the first part of the third research question, as it too
involves estimating effects:
Research Question #3a: What is the effect of participation in Courage to Teach on
the perceived benefits of participation with regards to: understanding of subject
matter, professional relationships, energy levels, and enjoyment of teaching?
Before analyzing the data relevant to the effect of CTT on teacher engagement or on perceived
benefits of participation, I will explain the technique of propensity score matching. I used
propensity score matching to select comparable subsets from my treatment and control groups,
which is critical to estimating effects with as little bias as possible.
Geil
94
Propensity Score Matching
Even though I am comparing the CTT teachers in my study to a sample of teachers who
participated in NWP (as opposed to teachers who have not chosen to participate in any
professional development) differences may still exist between the groups. Many of these
differences became apparent in Chapter Four; for example, the CTT respondents are older, have
considerably more teaching experience, and are closer to retirement than the NWP respondents.
Another step is needed to make these two groups comparable before looking at the outcomes.
The technique used here is known as propensity score matching, which in essence matches the
respondents on selected covariates so that they look as similar as possible. This step takes place
before any outcome variables have been analyzed; this is critical so as to avoid introducing any
bias (for example, choosing the samples that result in the outcomes the researcher wishes to see)
(Ho et al., 2007; Rubin, 2001, 2007).
Covariate Selection
Through propensity score matching techniques, the same distribution of all observed
covariates7 can be obtained for both the treatment and control groups (Rubin, 2001). Based on
the review of the literature on teacher burnout/engagement and attrition/retention in Chapter
Two, a number of variables emerged that could affect the outcomes of interest (e.g., age,
teaching experience, characteristics of students and schools). If the individuals in the treatment
and control groups are comparable on these covariates, one can be much more confident that any
mean differences found on the outcomes are due to the treatment rather than differences in the
groups themselves. To the extent that all plausible confounding variables have been measured
and the two groups are comparable with respect to these variables, then the resulting mean
7 A covariate is a variable that is not a part of the treatment but that could have an effect on the outcome; the terms covariate and variable are often used interchangeably.
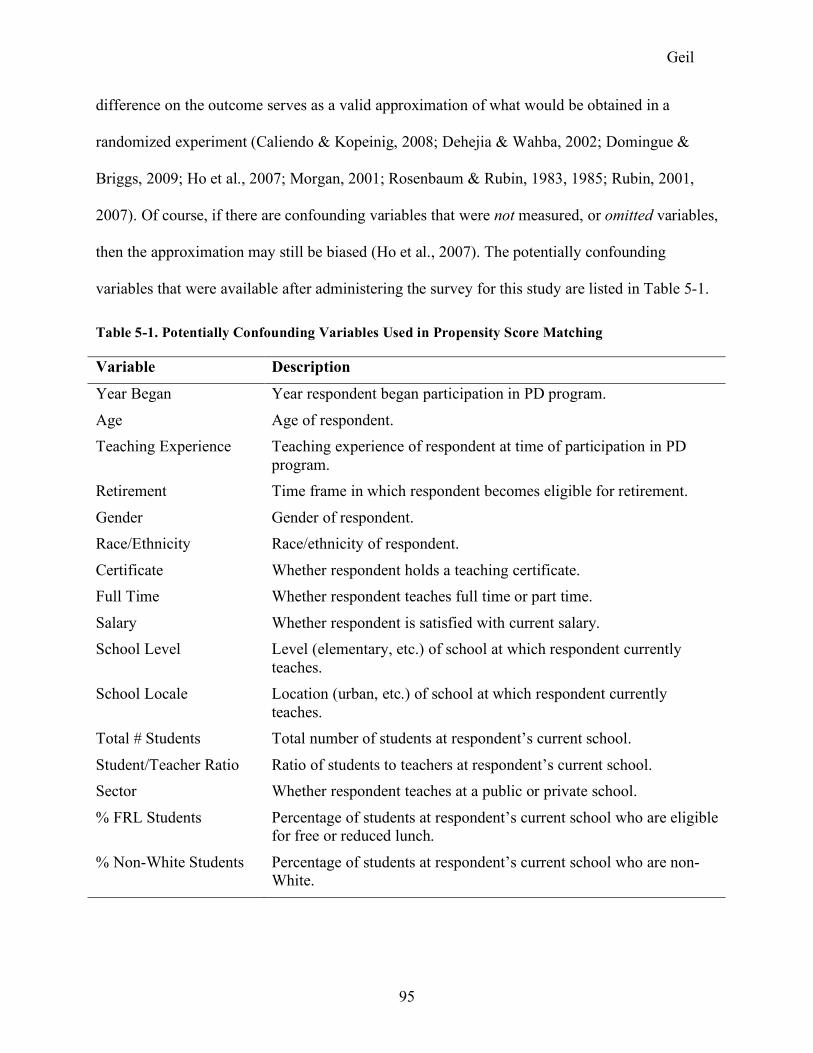
Geil
95
difference on the outcome serves as a valid approximation of what would be obtained in a
randomized experiment (Caliendo & Kopeinig, 2008; Dehejia & Wahba, 2002; Domingue &
Briggs, 2009; Ho et al., 2007; Morgan, 2001; Rosenbaum & Rubin, 1983, 1985; Rubin, 2001,
2007). Of course, if there are confounding variables that were not measured, or omitted variables,
then the approximation may still be biased (Ho et al., 2007). The potentially confounding
variables that were available after administering the survey for this study are listed in Table 5-1.
Table 5-1. Potentially Confounding Variables Used in Propensity Score Matching
Variable Description
Year Began Year respondent began participation in PD program.
Age Age of respondent. Teaching Experience Teaching experience of respondent at time of participation in PD
program. Retirement Time frame in which respondent becomes eligible for retirement.
Gender Gender of respondent. Race/Ethnicity Race/ethnicity of respondent.
Certificate Whether respondent holds a teaching certificate. Full Time Whether respondent teaches full time or part time.
Salary Whether respondent is satisfied with current salary. School Level Level (elementary, etc.) of school at which respondent currently
teaches. School Locale Location (urban, etc.) of school at which respondent currently
teaches. Total # Students Total number of students at respondent’s current school.
Student/Teacher Ratio Ratio of students to teachers at respondent’s current school. Sector Whether respondent teaches at a public or private school.
% FRL Students Percentage of students at respondent’s current school who are eligible for free or reduced lunch.
% Non-White Students Percentage of students at respondent’s current school who are non-White.

Geil
96
The covariates included in the propensity score matching should be those that could
influence the treatment assignment and also the outcome; they should not, however, be affected
by the treatment itself. This is in contrast to the outcome variables, which are expected to change
as a result of the treatment. All the variables should be measurable before participation in the
professional development program (Ho et al., 2007; Rubin, 2007).
Proxy Variables
Unfortunately, due to the retrospective nature of the survey it is difficult to know whether
or not certain covariates were themselves influenced by participation in CTT or NWP. Rather
than ask respondents how they felt at the time of their participation in the PD program, which
could easily have been a decade or two ago, I asked them about their current or most recent
teaching situation. For example, I gathered information on respondents’ current schools and used
these data as proxies for the covariates related to school and student characteristics. I reasoned
that if respondents hold the same position now that they did at the time they participated in the
PD program, these variables would be an acceptable estimate of the values I would have
obtained if the variables were measured before the treatment took place. Even for those
respondents who changed positions since their participation, chances are good that not all of the
characteristics of their school and students changed as well. Also, those characteristics that did
change may not have changed as a result of the respondent’s participation in the PD program. I
chose to use the school and student characteristics, as well as a few of the current teacher
characteristics (full time status, teaching certification, and satisfaction with salary) as proxy
variables even though I knew that I might be introducing some bias. Although the bias may be
minimal, I cannot know for certain. These proxy variables are a definite weakness of my study

Geil
97
and will limit any claims I may be able to make, but they allow me to account for contextual
variables in my analysis.
Level of Involvement
The National Writing Project decided to have site directors invite only the most involved
alumni (all summer institute alumni who had participated in an activity within the past three
years), but all CTT alumni were invited to participate, regardless of the degree to which they had
stayed involved with the program after their initial participation. As expected, more of the NWP
respondents (36%) rated themselves as very involved with the program, compared to the CTT
respondents (20%). While it would seem that the obvious solution is to include level of
involvement as one of the potentially confounding variables, I decided not to do so. Given that a
respondent’s level of involvement with the PD program can only occur after the treatment takes
place and is 100% affected by the treatment, including it in the propensity score matching
seemed sure to introduce bias (whereas I was able to make a reasonable argument for including
current school and student level characteristics as proxy variables). After obtaining my results, I
can run the propensity score matching again with level of involvement included to see if the
results change. If they do, I will know that level of involvement does have some influence on
engagement, although it will be difficult to say exactly what (see Chapter Eight).
Balance Before Matching
Now that the covariates have been decided upon, I want to know how comparable the two
groups are before any matching is done. If large differences exist between the groups on
particular variables and are allowed to remain, there is no way of knowing whether or not any
variations in the outcomes are actually due to these differences rather than participation in CTT.
Geil
98
In Table 5-2, I look at two measurements of balance on the covariates: (a) the difference
between the means of the two PD groups, which tells me how close or far apart they are in the
original units (for example, YrBeganPDProgram is measured in years, and the positive sign
indicates that the CTT mean is greater than the NWP mean), and (b) the standardized mean
difference, which standardizes all the units so that they can be compared to one other on the
same scale. Those variables with the largest standardized differences, whether positive or
negative, are the ones on which the two PD programs are most different before matching.
As can be seen in Table 5-2, some noticeable differences exist between the CTT and
NWP respondents. In fact, almost two-thirds of the covariates in the model have standardized
differences of .20 or higher, and seven covariates have standardized differences of .30 or greater.
After propensity score matching is completed, the groups will be compared again to see if the
differences between them on these variables have gotten closer, or in other words, if the balance
has improved. The goal of propensity score matching is to find the subsets of the two groups that
have the best balance on the selected covariates. To achieve this, respondents are analyzed based
on their propensity score and only those that are comparable to respondents in the other group
are retained in the sample; this process will be discussed in more detail in the next section.
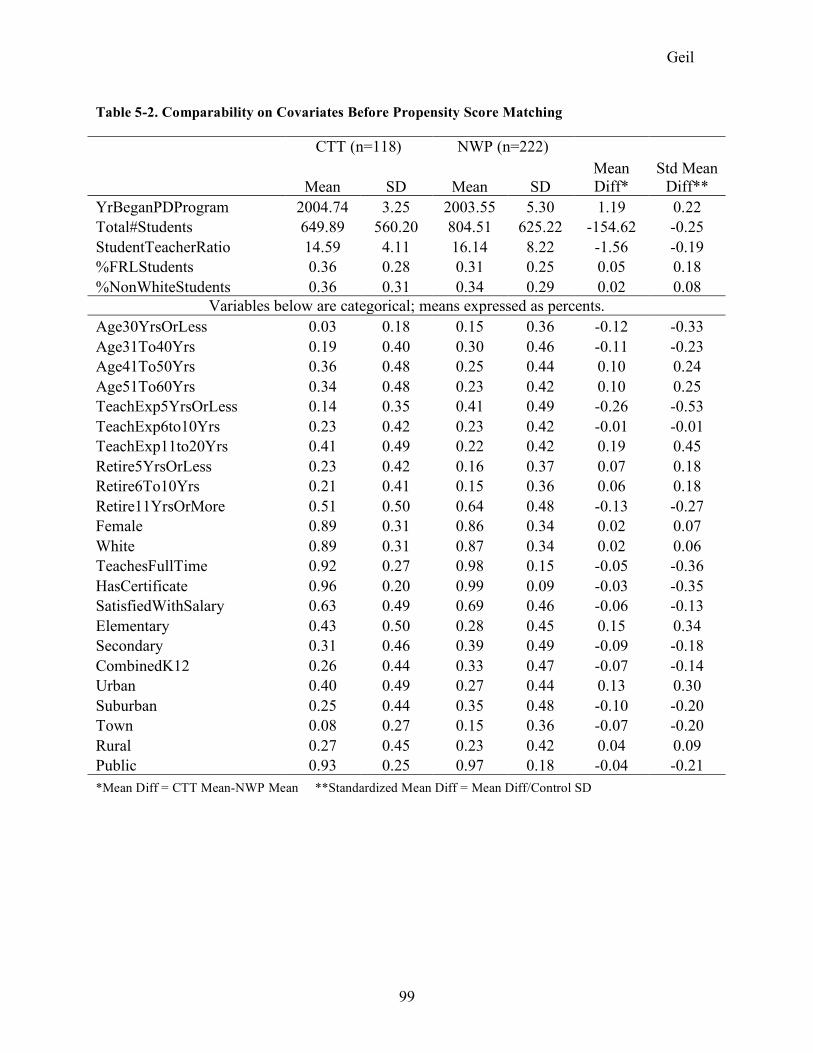
Geil
99
Table 5-2. Comparability on Covariates Before Propensity Score Matching
CTT (n=118)
NWP (n=222)
Mean SD Mean SD Mean Diff*
Std Mean Diff**
YrBeganPDProgram 2004.74 3.25 2003.55 5.30 1.19 0.22 Total#Students 649.89 560.20 804.51 625.22 -154.62 -0.25 StudentTeacherRatio 14.59 4.11 16.14 8.22 -1.56 -0.19 %FRLStudents 0.36 0.28 0.31 0.25 0.05 0.18 %NonWhiteStudents 0.36 0.31 0.34 0.29 0.02 0.08
Variables below are categorical; means expressed as percents.
Age30YrsOrLess 0.03 0.18 0.15 0.36 -0.12 -0.33 Age31To40Yrs 0.19 0.40 0.30 0.46 -0.11 -0.23 Age41To50Yrs 0.36 0.48 0.25 0.44 0.10 0.24 Age51To60Yrs 0.34 0.48 0.23 0.42 0.10 0.25 TeachExp5YrsOrLess 0.14 0.35 0.41 0.49 -0.26 -0.53 TeachExp6to10Yrs 0.23 0.42 0.23 0.42 -0.01 -0.01 TeachExp11to20Yrs 0.41 0.49 0.22 0.42 0.19 0.45 Retire5YrsOrLess 0.23 0.42 0.16 0.37 0.07 0.18 Retire6To10Yrs 0.21 0.41 0.15 0.36 0.06 0.18 Retire11YrsOrMore 0.51 0.50 0.64 0.48 -0.13 -0.27 Female 0.89 0.31 0.86 0.34 0.02 0.07 White 0.89 0.31 0.87 0.34 0.02 0.06 TeachesFullTime 0.92 0.27 0.98 0.15 -0.05 -0.36 HasCertificate 0.96 0.20 0.99 0.09 -0.03 -0.35 SatisfiedWithSalary 0.63 0.49 0.69 0.46 -0.06 -0.13 Elementary 0.43 0.50 0.28 0.45 0.15 0.34 Secondary 0.31 0.46 0.39 0.49 -0.09 -0.18 CombinedK12 0.26 0.44 0.33 0.47 -0.07 -0.14 Urban 0.40 0.49 0.27 0.44 0.13 0.30 Suburban 0.25 0.44 0.35 0.48 -0.10 -0.20 Town 0.08 0.27 0.15 0.36 -0.07 -0.20 Rural 0.27 0.45 0.23 0.42 0.04 0.09 Public 0.93 0.25 0.97 0.18 -0.04 -0.21 *Mean Diff = CTT Mean-NWP Mean **Standardized Mean Diff = Mean Diff/Control SD
Geil
100
Propensity Scores and Selection of Matched Cases
A propensity score is “the conditional probability of assignment to a particular treatment
given a vector of observed covariates” (Rosenbaum & Rubin, 1983, p. 41). More specifically, a
propensity score is a numerical value computed for each individual (typically using logistic
regression) that represents that person’s probability of being assigned to the treatment group
based on the covariates in the model—the higher the propensity score, the more likely this is
(Caliendo & Kopeinig, 2008; Dehejia & Wahba, 2002; Domingue & Briggs, 2009; Rosenbaum
& Rubin, 1983). The score itself says nothing about what PD program an individual actually
participated in, but rather her chances of having participated in CTT (indicated by a higher
propensity score) or in NWP (indicated by a lower propensity score), given her responses on the
covariates in the propensity score matching.
For the actual process of propensity score matching, only those cases without any missing
responses on the selected covariates can be included. I began with 420 respondents (144 CTT
and 276 NWP) who are currently PK-12 teachers, only participated in one of the two PD
programs, and reached the end of the survey. Out of this group, 26 of the CTT cases and 54 of
the NWP cases have some missing data on the covariates used in the matching process8. Once
these cases are removed so that the propensity score matching can be done, 340 cases remain
(118 CTT and 222 NWP) in the sample. Propensity scores are then calculated for each remaining
respondent on the selected covariates9.
Each group of respondents has a range of propensity scores; the participants who were in
CTT had scores that ranged from .05 to .97, and the NWP participants had scores ranging from 8 While there are procedures for estimating or imputing missing values (e.g., Little, R. J. A., & Rubin, D. B. (2002). Statistical Analysis with Missing Data, 2nd edition. New York: Wiley), implementing these procedures were outside the scope of this study. 9 The software package MatchIt in the R programming environment was used to calculate propensity scores and match cases (Gentleman, Ihaka, & R Core Development Team, 1993; Ho et al., 2007; Ho, Imai, King, & Stuart, 2010).

Geil
101
.01 to .83. All the cases with scores less than .05 (23 NWP cases) and greater than .83 (7 CTT
cases) were excluded from the sample because they were not comparable to anyone in the
opposite group. This leaves a sample of 111 CTT respondents and 199 NWP respondents, for a
total of 310 cases overall.
In Figure 5-1, the “Matched Treatment Units” represent the CTT respondents, and the
“Matched Control Units” represent the NWP respondents. All of the circles representing these
survey participants fall between approximately .05 and .83 on their propensity score, which is the
range of the overlap in propensity scores between the two groups. On the lower left hand corner,
a cluster of circles is apparent; these represent the 23 NWP cases with propensity scores less than
.05 that were “unmatched” and therefore excluded from the sample. The cluster of circles at the
top right hand corner of Figure 5-1 represents the seven CTT respondents with propensity scores
higher than .83 who were also excluded from the matched sample.
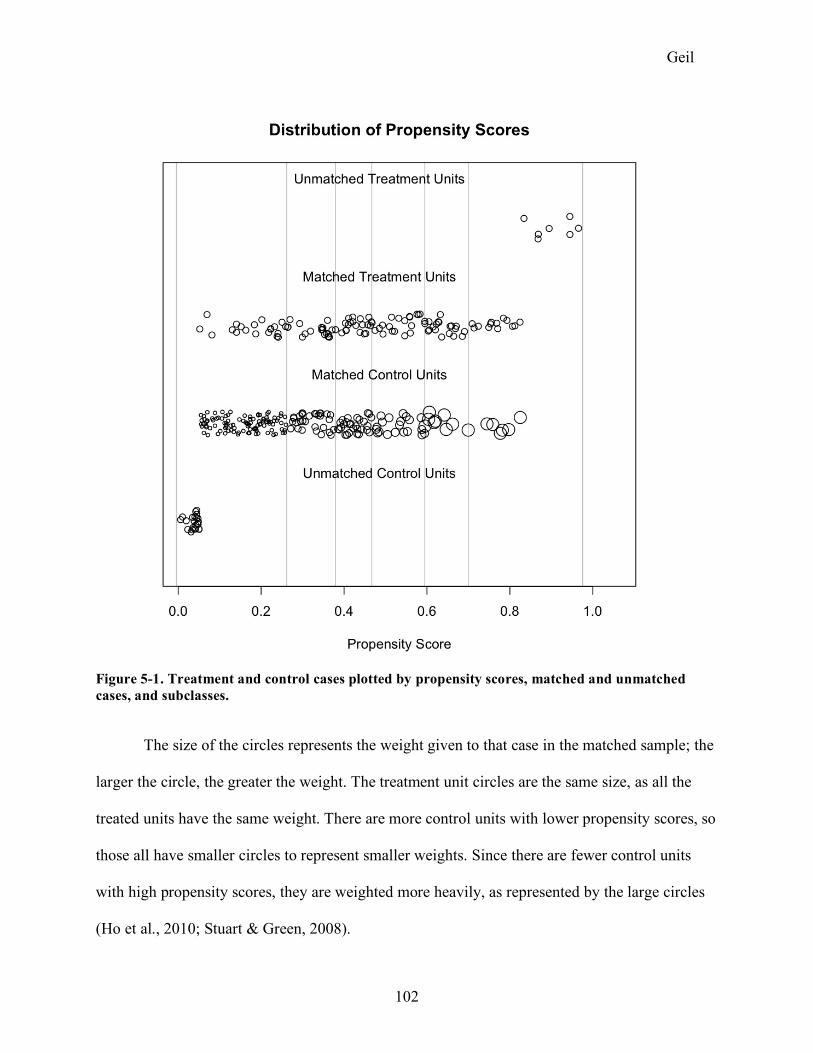
Geil
102
Figure 5-1. Treatment and control cases plotted by propensity scores, matched and unmatched cases, and subclasses.
The size of the circles represents the weight given to that case in the matched sample; the
larger the circle, the greater the weight. The treatment unit circles are the same size, as all the
treated units have the same weight. There are more control units with lower propensity scores, so
those all have smaller circles to represent smaller weights. Since there are fewer control units
with high propensity scores, they are weighted more heavily, as represented by the large circles
(Ho et al., 2010; Stuart & Green, 2008).

Geil
103
Subclasses and Balance After Matching
Even within the area of propensity score overlap there is quite a wide range of scores. It
makes more sense to compare CTT participants with low propensity scores to NWP participants
who also have low propensity scores, and vice versa. To accomplish this, the groups are divided
into subclasses or strata (Domingue & Briggs, 2009; Ho et al., 2007; Rosenbaum & Rubin,
1983). The default number of subclasses is six in the MatchIt software, and the best balance for
my data is achieved with six subclasses, as opposed to either four or five. The cutoff points for
the six subclasses are represented by the vertical gray lines in Figure 5-1. Once the subclasses
have been established, the two groups are analyzed again with respect to all of the covariates,
subclass by subclass, and then standardized, weighted by the number of treatment units in each
subclass, and averaged.
If the matching has been done correctly and the model is a good fit, then the mean
differences and the standardized mean differences between the groups on the variables will have
gotten smaller or disappeared altogether. We can see in Table 5-3 and Figure 5-2 that this is
indeed the case. Before matching, many of the standardized differences between the means were
.20 or higher, whereas after matching, no standardized difference is greater than .02, and many
are at zero. This means that the propensity score matching has done its job, in that now our two
groups are as close to each other as possible with respect to the covariates included in the
matching process.

Geil
104
Table 5-3. Comparison of Mean and Standardized Differences Before and After Propensity Score Matching
Before matching After matching and across all
subclasses
CTT Mean
(n=118)
NWP Mean
(n=222) Mean Diff
Std Mean Diff
CTT Mean
(n=111)
NWP Mean
(n=199) Mean Diff
Std Mean Diff
Overall Propensity Scores 0.49 0.27 0.22 NA 0.46 0.46 0.00 NA YrBegan 2004.74 2003.55 1.19 0.22 2004.60 2004.54 0.44 0.01 Total#Students 649.89 804.51 -154.62 -0.25 654.82 645.48 68.99 0.01 StudentTeacherRatio 14.59 16.14 -1.56 -0.19 14.64 14.71 0.27 0.00 %FRLStudents 0.36 0.31 0.05 0.18 0.35 0.34 0.04 0.01 %NonWhiteStudents 0.36 0.34 0.02 0.08 0.35 0.34 0.04 0.00
Variables below are categorical; means expressed as percents.
Age30YrsOrLess 0.03 0.15 -0.12 -0.33 0.04 0.05 0.01 -0.01 Age31To40Yrs 0.19 0.30 -0.11 -0.23 0.21 0.20 0.05 0.01 Age41To50Yrs 0.36 0.25 0.10 0.24 0.36 0.35 0.04 0.01 Age51To60Yrs 0.34 0.23 0.10 0.25 0.32 0.32 0.03 0.00 TeachExp5YrsOrLess 0.14 0.41 -0.26 -0.53 0.15 0.14 0.06 0.02 TeachExp6to10Yrs 0.23 0.23 -0.01 -0.01 0.24 0.24 0.08 0.00 TeachExp11to20Yrs 0.41 0.22 0.19 0.45 0.39 0.38 0.06 0.00 Retire5YrsOrLess 0.23 0.16 0.07 0.18 0.23 0.22 0.02 0.00 Retire6To10Yrs 0.21 0.15 0.06 0.18 0.21 0.21 0.03 0.00 Retire11YrsOrMore 0.51 0.64 -0.13 -0.27 0.51 0.51 0.05 0.00 Female 0.89 0.86 0.02 0.07 0.89 0.89 0.04 0.00 White 0.89 0.87 0.02 0.06 0.88 0.87 0.03 0.01 TeachesFullTime 0.92 0.98 -0.05 -0.36 0.96 0.95 0.01 0.00 HasCertificate 0.96 0.99 -0.03 -0.35 0.98 0.98 0.01 0.00 SatisfiedWithSalary 0.63 0.69 -0.06 -0.13 0.65 0.66 0.07 -0.01 Elementary 0.43 0.28 0.15 0.34 0.41 0.43 0.04 -0.01 Secondary 0.31 0.39 -0.09 -0.18 0.32 0.31 0.04 0.00 CombinedK12 0.26 0.33 -0.07 -0.14 0.27 0.25 0.04 0.01 Urban 0.40 0.27 0.13 0.30 0.38 0.37 0.06 0.00 Suburban 0.25 0.35 -0.10 -0.20 0.27 0.27 0.03 -0.01 Town 0.08 0.15 -0.07 -0.20 0.08 0.08 0.02 0.01 Rural 0.27 0.23 0.04 0.09 0.27 0.28 0.03 0.00 Public 0.93 0.97 -0.04 -0.21 0.94 0.96 0.03 -0.01
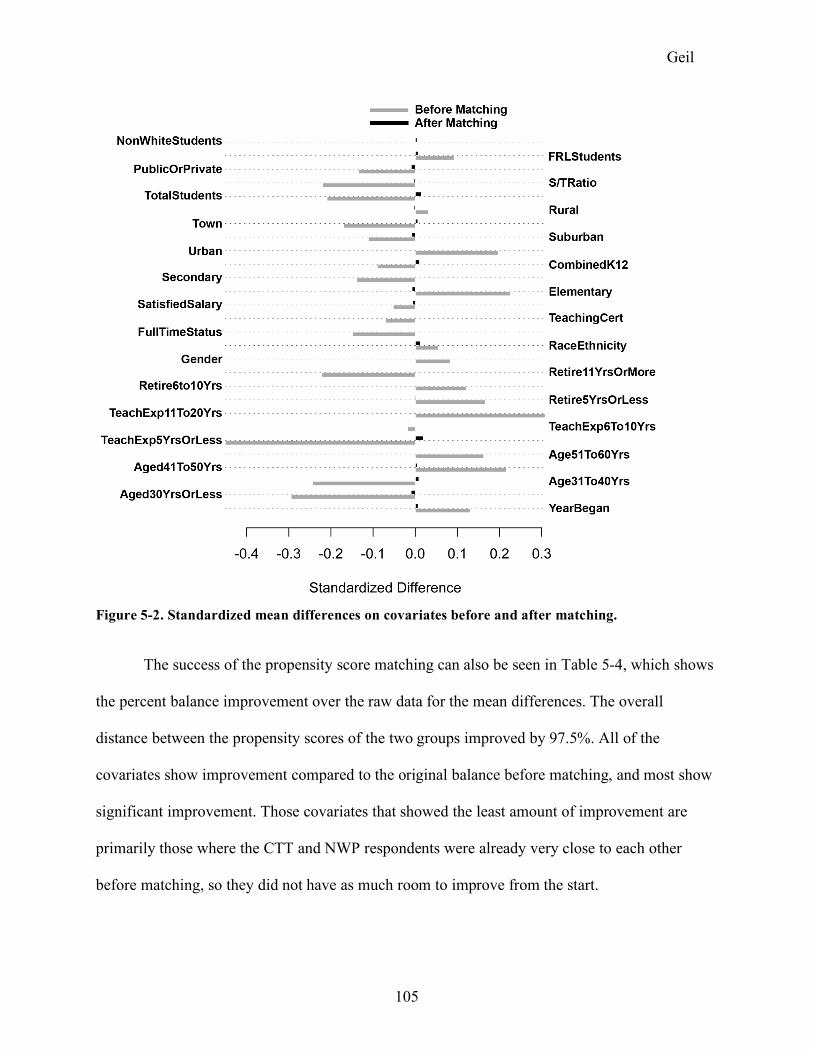
Geil
105
Figure 5-2. Standardized mean differences on covariates before and after matching.
The success of the propensity score matching can also be seen in Table 5-4, which shows
the percent balance improvement over the raw data for the mean differences. The overall
distance between the propensity scores of the two groups improved by 97.5%. All of the
covariates show improvement compared to the original balance before matching, and most show
significant improvement. Those covariates that showed the least amount of improvement are
primarily those where the CTT and NWP respondents were already very close to each other
before matching, so they did not have as much room to improve from the start.
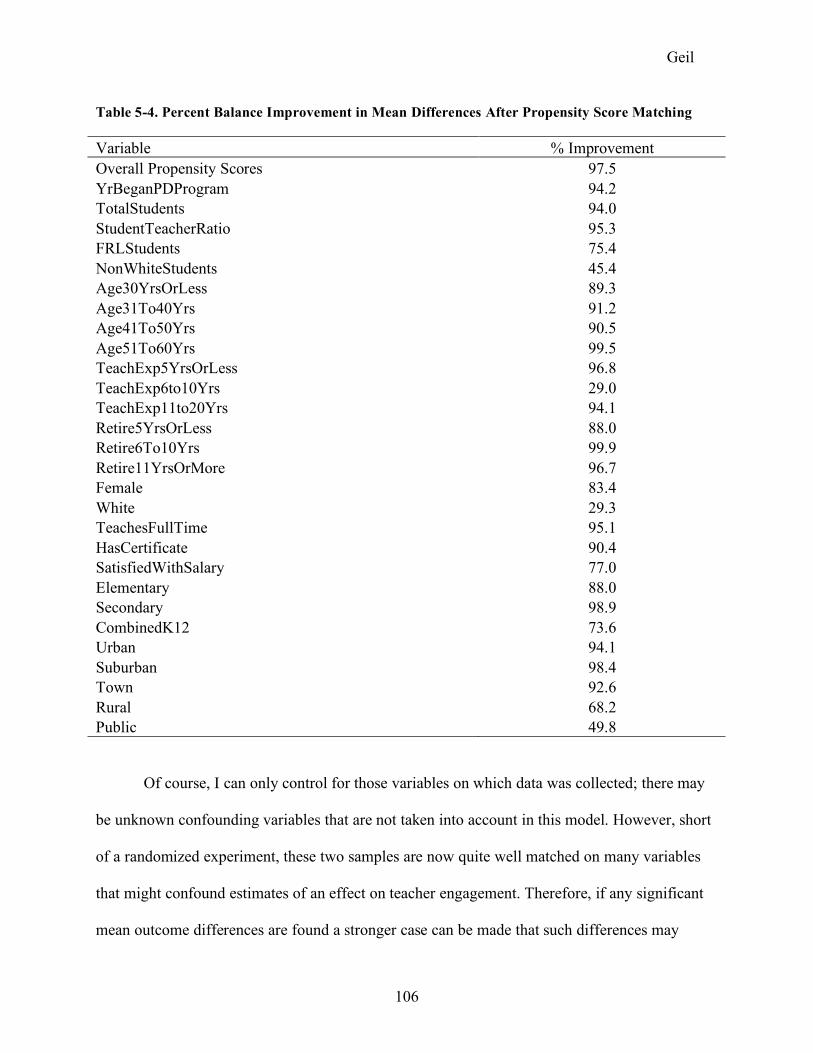
Geil
106
Table 5-4. Percent Balance Improvement in Mean Differences After Propensity Score Matching
Variable % Improvement Overall Propensity Scores 97.5 YrBeganPDProgram 94.2 TotalStudents 94.0 StudentTeacherRatio 95.3 FRLStudents 75.4 NonWhiteStudents 45.4 Age30YrsOrLess 89.3 Age31To40Yrs 91.2 Age41To50Yrs 90.5 Age51To60Yrs 99.5 TeachExp5YrsOrLess 96.8 TeachExp6to10Yrs 29.0 TeachExp11to20Yrs 94.1 Retire5YrsOrLess 88.0 Retire6To10Yrs 99.9 Retire11YrsOrMore 96.7 Female 83.4 White 29.3 TeachesFullTime 95.1 HasCertificate 90.4 SatisfiedWithSalary 77.0 Elementary 88.0 Secondary 98.9 CombinedK12 73.6 Urban 94.1 Suburban 98.4 Town 92.6 Rural 68.2 Public 49.8
Of course, I can only control for those variables on which data was collected; there may
be unknown confounding variables that are not taken into account in this model. However, short
of a randomized experiment, these two samples are now quite well matched on many variables
that might confound estimates of an effect on teacher engagement. Therefore, if any significant
mean outcome differences are found a stronger case can be made that such differences may

Geil
107
indeed be due to the treatment (participation in CTT). Such claims must be tempered due to the
existence of proxy variables and the possibility of omitted variables, but it is the best
approximation available given the study design and data. In the following sections, as I attempt
to answer the question of whether participation in CTT has an effect on engagement or on
perceived benefits of the PD programs, I will put the propensity score matched sample to use.
What is the Effect of Participation in Courage to Teach on Subsequent Teacher Engagement?
My primary research question asks if participation in CTT has an effect on subsequent
teacher engagement. In this study, engagement with teaching is measured using the Maslach
Burnout Inventory-Educators Survey (MBI) (Maslach et al., 1986). There are three subscales of
the MBI: emotional exhaustion, cynicism, and professional efficacy. Low emotional exhaustion,
low cynicism, and high professional efficacy scores are all meant to be indicative of engagement
with teaching, while scores on the other end of the scale would indicate burnout. While there are
other methods by which the concept of engagement could be operationalized, such as leadership
positions taken or educational activities outside of the classroom, these are not the focus of this
study.
Comparisons Before Propensity Score Matching
To begin with, I will look at the original sample of 420 CTT and NWP respondents who
are current PK-12 teachers, reached the end of the survey, and only participated in one out of the
two PD programs. This will show how the two samples compare before any matching has been
done to make the groups more similar on the potentially confounding variables. Table 5-5 shows
the means and standard deviations for both CTT and NWP on the MBI subscales and the
standardized difference between the means. As is evident from this table, prior to matching the

Geil
108
full CTT sample is slightly more emotionally exhausted, slightly less cynical, and has a higher
level of professional efficacy10, on average, than the full NWP sample.
Table 5-5. Comparison of CTT and NWP Scores on MBI Subscales Before Propensity Score Matching
CTT (n=144) NWP (n=276)
MBI Subscale Mean SD Mean SD Mean Diff
Std Mean Diff
Emotional Exhaustion 20.87 10.56 20.01 10.39 0.86 0.08
Cynicism 4.15 4.22 4.33 4.15 -0.18 -0.04 Professional Efficacy 41.21 5.25 40.64 5.44 0.57 0.11 Note. The reliability of the three subscales ranges from .7-.9 (Cronbach’s alpha). Bold font indicates higher engagement on the part of the CTT respondents.
The standardized differences between the means are in general quite small by most
conventions (small effect=.20, medium effect=.50, large effect=.80). These conventions are just
guidelines, however, and do not mean that even a very small effect might not be meaningful
(Cohen, 1969, 1992; Howell, 2002; Prentice & Miller, 1992).
Comparisons After Propensity Score Matching
The next step is to see what happens to comparisons of the two groups’ mean scores on
the MBI subscales after propensity score matching. As discussed earlier in this chapter,
propensity score matching selects only the cases that are comparable with respect to a number of
potentially confounding variables, which in this study include demographic characteristics of the
respondents as well as school and student level characteristics. The process then attempts to only
compare those cases that are the most alike, and it does this by placing cases in subclasses
10 The items on the emotional exhaustion and cynicism subscales represent negative feelings and attitudes, so a higher score indicates higher burnout, while a lower score indicates greater engagement. Because of this, an effect size with a positive sign actually indicates less engagement on the part of the CTT respondents. For the professional efficacy subscale, an effect size with a positive sign indicates greater engagement on the part of the CTT respondents.

Geil
109
according to the range of their propensity scores. Because most of the NWP respondents have
low propensity scores (indicating that they are not very likely to be in the CTT condition, as one
might expect), there are many more NWP cases in the lower subclasses than in the higher
subclasses (refer to Figure 5-2). Table 5-6 shows the effect size for each subclass and the
weighted effect size across all the subclasses.
Table 5-6. Comparison of CTT and NWP Effect Sizes on the MBI Subscales by Subclass and Overall
Effect Size by Subclass
MBI Subscale
Subclass 1
Subclass 2
Subclass 3
Subclass 4
Subclass 5
Subclass 6
Weighted Effect Size*
Emotional Exhaustion
0.49 0.03 -0.49 0.06 0.06 0.81 0.12
Cynicism 0.13 -0.48 -0.19 0.33 0.67 0.80 0.18
Professional Efficacy
0.14 0.53 0.14 0.54 -0.07 -0.75 0.13
CTT n 20 19 20 19 20 13 111
NWP n 105 31 28 20 9 6 199 Note. Bold font indicates higher engagement on the part of the CTT respondents. *Weighted Effect Size is weighted by the number of cases in the treatment (CTT).
Even after matching, the CTT respondents are again on average somewhat more
emotionally exhausted than the NWP respondents, and the size of the effect aggregated over all
six subclasses has increased to .12 from .08. On the cynicism subscale, the direction has actually
changed, and now the CTT respondents are more cynical than the NWP respondents, with an
effect size of .18 (from -0.4 in the unmatched sample). The CTT respondents continue to have a
stronger sense of professional efficacy than the NWP respondents, but the size of the effect
increases only slightly from .11 in the unmatched sample to .13 in the matched sample.

Geil
110
These findings seem to indicate that the results shown in Table 5-5 (before matching)
were biased in favor of CTT, particularly on the cynicism subscale. In other words, there appear
to have been pre-existing differences between CTT and NWP participants that confounded the
results. One potential confounder is the fact that the CTT respondents are more likely to teach at
elementary schools than the NWP respondents before being matched. A study conducted in the
United States several decades ago (Russell, 1987) suggests that secondary school teachers are
more cynical than elementary school teachers. Common sense also argues that this may be the
case, as teenagers who are struggling to assert their independence, acting out, and rebelling
against authority may be more challenging to empathize with than younger students. It is
possible that once the number of elementary school teachers is comparable between the two
groups, the CTT respondents are no longer less cynical by comparison.
Subclass Interactions
One problem with interpreting the main effect aggregated over all six subclasses is that
there are differences (i.e., interactions) in the effects by subclass. For example, on emotional
exhaustion, the negative11 effect of CTT relative to NWP is largest in the first and last
subclasses. There are only very small differences in subclasses 2, 4, and 5, and in subclass 3
there is a positive12 effect of CTT relative to the NWP respondents in that subclass.
If I look at the characteristics of the teachers in each subclass, these provide some clues
to help explain the differences between the subclasses. I will focus my attention on those
variables that contribute most to the propensity score matching, or in other words, those with the
greatest influence on whether or not the respondent was predicted to be in the CTT condition.
11 “Negative effect of CTT” is used to refer to any effect of CTT that results in decreased engagement (higher emotional exhaustion, higher cynicism, or lower professional efficacy). 12 “Positive effect of CTT” is used to refer to any effect of CTT that results in increased engagement (lower emotional exhaustion, lower cynicism, or higher professional efficacy).

Geil
111
Five variables stand out: age (particularly those who are 30 years or younger), teaching
experience (those who have had 11-20 years of teaching experience), school level (elementary
school), school locale (urban), and the year they began their participation in the PD program (see
Appendix F for logistic regression coefficients and descriptive statistics on each subclass).
The first subclass has the youngest respondents and the ones with the least teaching
experience when they participated in the PD program, as well as the most secondary school
teachers. The CTT and NWP respondents in the first subclass also participated in the PD
program the least recently, so more time on average has elapsed between when they participated
and when they completed the survey for this study. The next three subclasses in general contain
the respondents who are middle-aged and with more teaching experience: neither the least nor
the most experienced teachers, nor the youngest or the oldest, although as the subclasses go up,
age and experience go up as well. These respondents are also relatively well distributed amongst
elementary, secondary, and combined K-12 schools and also across urban, suburban, town, and
rural locales. The last two subclasses have the highest percentages of elementary school teachers
who teach in urban locations, and these respondents also participated most recently on average.
These respondents are older than all the other subclasses, and they had the most teaching
experience at the time they participated in the PD program.
If I look at the effects in each subclass, there is an imperfect, upside-down U-shaped
pattern: the first subclass indicates that participation in CTT has mostly negative effects on
engagement relative to participation in NWP. The next three subclasses contain the largest
positive effects of CTT on engagement, with the third subclass showing only positive effects of
CTT on engagement. In the fifth and sixth subclasses, the effects of CTT on engagement are
Geil
112
almost entirely negative and the largest of all. The effect sizes vary, and the pattern is not
completely consistent, but this description loosely fits the data.
What this pattern suggests is that CTT does not have equal effects for all respondents. For
those who are most likely to be in NWP (younger, the least experience at the time of their
participation, secondary school teachers, and participated the least recently), participation in CTT
actually has a negative effect on emotional exhaustion and cynicism relative to participation in
NWP, but a small positive effect on professional efficacy. For those respondents in the middle
(neither the youngest or the oldest, the teachers in the prime of their careers), participation in
CTT is more likely to have a positive effect on engagement relative to the NWP respondents in
those subclasses, especially for cynicism and professional efficacy. And finally, for those
respondents who are most likely to be in CTT (older, the most experience at the time of their
participation, elementary school teachers in urban locales, and who participated in the PD
program most recently), the negative effects of CTT on engagement are the most pronounced,
particularly on the cynicism subscale.
One possible explanation for why CTT appears to be least effective for those teachers
who are most likely to participate in it is that these teachers choose to participate in CTT because
they are seeking renewal or are questioning their commitment to teaching after many years in the
field. Relative to the comparable NWP respondents, perhaps participation in CTT appears to
have a less positive effect on engagement because these respondents were more in need of
engagement to begin with. This survey does not include data that would help to determine if this
is indeed the case, which is an issue in other areas as well and will be discussed later. Also, the
last subclasses are the ones with the smallest number of NWP respondents, and so the results
may not be as representative as those from the first four subclasses.

Geil
113
Nevertheless, the results from the matched samples seem to indicate that as age and
teaching experience increase, the effectiveness of CTT relative to NWP decreases, particularly
for respondents at urban, elementary schools. Participation in CTT also seems to have more of a
negative effect on engagement relative to NWP for the youngest and least experienced
respondents. It is those respondents in the prime of their careers with regards to age and teaching
experience who are most likely to reap a positive effect on engagement from their participation
in CTT relative to NWP.
Courage to Teach and the Normative Sample of the MBI
When the CTT sample is compared to the MBI’s normative sample of 4,163 teachers
(Maslach et al., 1996), large differences are seen on the cynicism and professional efficacy
subscales (see Table 5-7).
Table 5-7. Comparison of CTT scores on MBI Subscales to MBI Normative Sample of Teachers
CTT (n=144)
MBI (n=4163)
MBI Subscale Mean SD Mean SD Mean Diff
Std Mean Diff*
Emotional Exhaustion 21.90 10.52 21.25 11.01 0.65 0.06
Cynicism 4.35 4.40 11.00 6.19 -6.65 -1.07 Professional Efficacy 41.44 5.17 33.54 6.89 7.90 1.15 Note. The reliability of the three subscales ranges from .7-.9 (Cronbach’s alpha). Bold font indicates higher engagement on the part of the CTT respondents. *Standardized Mean Difference = Mean Diff/Control SD
On the emotional exhaustion subscale (lower means indicate engagement), the CTT
group mean of 21.90 is slightly higher than the normative sample mean of 21.25. For the
cynicism subscale, the CTT group mean is indicative of greater engagement (CTT=4.35,
normative sample=11.00). The same is true for the professional efficacy subscale, on which
higher means indicate engagement (CTT=41.44, normative sample=33.54). When standardized

Geil
114
differences between the means are looked at, there are large differences on both the cynicism and
professional efficacy subscales (-1.07 and 1.15 respectively).
Of course, these are not matched samples and there is quite a large time difference
between when they were taken, so these differences must be taken with a grain of salt.
Nevertheless, it is interesting that the CTT PK-12 teachers in my study are just as emotionally
exhausted as the normative sample, yet have much higher levels of professional efficacy and
much lower levels of cynicism, both of which indicate higher engagement.
Courage to Teach and Other Studies of Teachers and the MBI
There are a few studies that have (a) been conducted within the past ten years, (b)
administered the MBI-ES to teachers in the United States, and (c) provided means and standard
deviations for their samples on all three subscales of the MBI. These studies, along with the
normative sample of the MBI, act as proxies for the control group that I did not choose: teachers
who, at least as a whole, have not participated in any professional development programs. While
there are still differences between these studies and the sample of CTT teachers in this research,
these four studies also provide more chronologically appropriate comparisons than the normative
sample of the MBI.
All the studies mentioned here use self-selected, convenience samples of teachers. They
all take place in the United States, although only one (Kahn et al., 2006) samples teachers from
multiple states as in this study. Two are with K-12 teachers (Grayson & Alvarez, 2008; Mearns
& Cain, 2003), and one each is with elementary (McCarthy et al., 2009) and secondary (Kahn et
al., 2006) teachers only. In terms of gender, the range is from 68% to 96% female. The CTT
sample for this study is right in the middle, with 88% females. Because I asked the teachers in
my study to provide a range for both age and teaching experience, it is difficult to compare

Geil
115
directly to the other studies. It appears that the teachers in my study are slightly older than the
teachers in the other studies, and with correspondingly more teaching experience as well. With
the exception of one study in which just 71% of the respondents were Caucasian (Mearns &
Cain, 2003), in all the other studies 90% or higher of the sample is Caucasian (see Table 5-8).
Table 5-8. Demographic Characteristics of Recent MBI Teacher Studies
Study School Level (n) Females Age
Teaching Experience White Locale Location
Mearns & Cain (2003)
K-12 (86) 76%
39.52 yrs (SD=11.43)
13.88 yrs (SD=11.20) 71%
urban & suburban
Southern California
Kahn, Schneider, Jenkins-Henkelman, & Moyle (2006)
9-12 (339) 68% NR
13.70 yrs (SD=10.07) 90% NR
United States (41 states)
Grayson & Alvarez (2008)
K-12 (304) 74%
42.34 yrs (SD=11.59) NR 99% rural Ohio
McCarthy, Lambert, O’Donnell, & Melendres (2009)
K-6 (451) 96%
37.77 yrs (SD=10.56)
12.80 yrs (SD=8.94) NR
urban & suburban
Southeastern United States
CTT Sample PK-12 (144) 88%
38% btwn 51-60 yrs
40% btwn 11-20 yrs 90% all locales
United States (19 states)
When I compare the scores of my CTT sample on the three MBI subscales to the samples
of teachers in these four studies, the CTT scores are indicative of higher engagement in all but
two of the twelve possible comparisons (see Table 5-9).

Geil
116
Table 5-9. Comparison of CTT Scores on MBI Subscales to Other Contemporary Studies
CTT Sample (n=144) Mearns & Cain (2003) (n=86)
MBI Subscale Mean SD Mean SD Mean Diff
Std Mean Diff
Emotional Exhaustion 20.87 10.56 19.34 10.54 1.53 0.15 Cynicism 4.15 4.22 5.00 4.93 -0.85 -0.17 Professional Efficacy 6.79* 5.25 9.79* 7.53 -3.00 -0.40*
CTT Sample (n=144) Kahn et al. (2006)
(n=339)
Emotional Exhaustion 20.87 10.56 24.39 12.04 -3.52 -0.29 Cynicism 4.15 4.22 7.23 5.75 -3.08 -0.54 Professional Efficacy 41.21 5.25 37.35 6.95 3.86 0.56
CTT Sample (n=144) Grayson & Alvarez
(2008) (n=304)
Emotional Exhaustion 20.87 10.56 22.94 10.54 -2.07 -0.20 Cynicism 4.15 4.22 5.71 5.00 -1.56 -0.31 Professional Efficacy 41.21 5.25 37.84 7.03 3.37 0.48
CTT Sample (n=144) McCarthy et al. (2009) (n=451)
Emotional Exhaustion 20.87 10.56 20.56 10.11 0.31 0.03 Cynicism 4.15 4.22 4.46 4.41 -0.31 -0.07 Professional Efficacy 6.79* 5.25 13.28* 5.33 -6.49 -1.22* Note. Bold font indicates higher engagement on the part of the CTT respondents. * = reverse coded
On the emotional exhaustion subscale, there are two studies (McCarthy et al., 2009;
Mearns & Cain, 2003) with mean scores that are slightly lower (indicative of less emotional
exhaustion and less engagement) than the CTT sample mean. On the cynicism subscale, the CTT
sample mean is lower (indicative of less cynicism and higher engagement) than all four studies,
and the standardized mean difference is relatively large (greater than .30) in two cases. The CTT
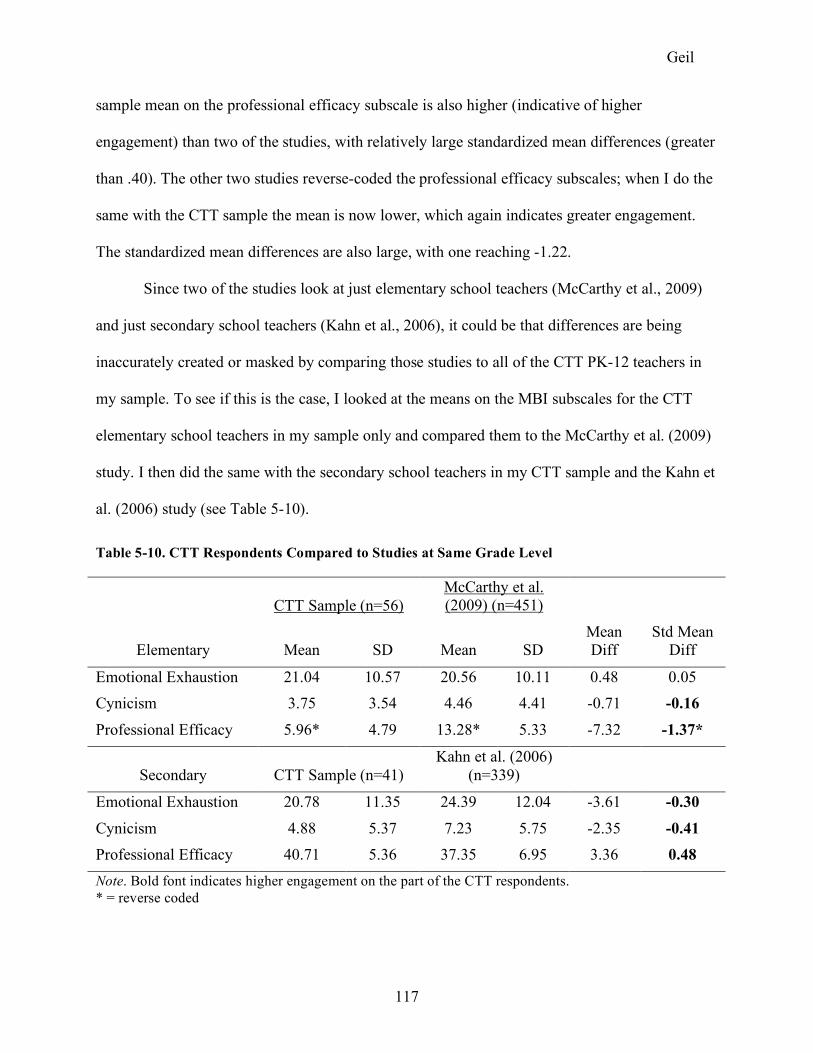
Geil
117
sample mean on the professional efficacy subscale is also higher (indicative of higher
engagement) than two of the studies, with relatively large standardized mean differences (greater
than .40). The other two studies reverse-coded the professional efficacy subscales; when I do the
same with the CTT sample the mean is now lower, which again indicates greater engagement.
The standardized mean differences are also large, with one reaching -1.22.
Since two of the studies look at just elementary school teachers (McCarthy et al., 2009)
and just secondary school teachers (Kahn et al., 2006), it could be that differences are being
inaccurately created or masked by comparing those studies to all of the CTT PK-12 teachers in
my sample. To see if this is the case, I looked at the means on the MBI subscales for the CTT
elementary school teachers in my sample only and compared them to the McCarthy et al. (2009)
study. I then did the same with the secondary school teachers in my CTT sample and the Kahn et
al. (2006) study (see Table 5-10).
Table 5-10. CTT Respondents Compared to Studies at Same Grade Level
CTT Sample (n=56) McCarthy et al. (2009) (n=451)
Elementary Mean SD Mean SD Mean Diff
Std Mean Diff
Emotional Exhaustion 21.04 10.57 20.56 10.11 0.48 0.05 Cynicism 3.75 3.54 4.46 4.41 -0.71 -0.16 Professional Efficacy 5.96* 4.79 13.28* 5.33 -7.32 -1.37*
Secondary CTT Sample (n=41) Kahn et al. (2006)
(n=339)
Emotional Exhaustion 20.78 11.35 24.39 12.04 -3.61 -0.30 Cynicism 4.88 5.37 7.23 5.75 -2.35 -0.41 Professional Efficacy 40.71 5.36 37.35 6.95 3.36 0.48 Note. Bold font indicates higher engagement on the part of the CTT respondents. * = reverse coded

Geil
118
As can be seen, the overall story remains the same, with the CTT sample means
indicative of higher engagement in all cases except one (the CTT elementary school teachers are
just slightly more emotionally exhausted than the elementary school teachers in the McCarthy et
al. study). The CTT elementary teachers in my sample are less cynical and considerably higher
in their feelings of professional efficacy. The CTT secondary school teachers in the sample are
more engaged than the secondary school teachers in the Kahn et al. (2006) study on all three
subscales, with all the standardized mean differences being larger than .30.
Discussion
So, how do I answer the question of whether or not participation in CTT affects
subsequent engagement with teaching as measured by the MBI? Given the data, it seems that the
effects are mixed. As a reminder, the NWP respondents are acting as a control group, or as a
proxy for the counterfactual: I want to know what a person’s level of engagement would be as
measured by the MBI if they had not chosen to participate in CTT, and the NWP program was
chosen for its similarity to CTT on several key components (e.g., voluntary, time-intensive).
With regards to emotional exhaustion, CTT appears to have a slight negative effect, as
the results for both the unmatched and matched samples indicate that the CTT respondents have
higher levels of emotional exhaustion than the NWP respondents.
The results also indicate an apparent negative effect of CTT on cynicism. While the CTT
respondents were less cynical before matching, after matching they were more cynical than the
NWP respondents and the effect size was the largest of the three subscales. I proposed that if
secondary teachers are indeed more cynical than elementary school teachers, then matching the
two groups on school level could help explain this switch in direction. Also, when I look at the
characteristics of the respondents in the various subclasses, the largest negative effects of CTT

Geil
119
on cynicism are in the last subclasses, which contain the oldest, most experienced teachers in the
study. This implies that there may be some sort of interaction between age, teaching experience,
and the effect of participation in CTT on cynicism.
The third subscale of professional efficacy is the only one to indicate a positive effect of
CTT on engagement. In both the matched and unmatched samples, the CTT respondents have
consistently higher levels of professional efficacy than the NWP respondents, although the effect
size is not large. Looking at the subclasses, the positive effects of participation in CTT relative to
NWP are found in the first four subclasses, which hold the younger teachers and those in the
prime of their careers, whereas the negative effects are again seen in the last two subclasses.
One issue that comes up when analyzing these results is the threat of temporal
precedence. In other words, to establish a causal effect I must be able to show that the cause
comes before the effect. The effects being studied here are scores on the subscales of the MBI:
emotional exhaustion, cynicism, and professional efficacy, and the cause is participation in CTT.
As it turns out, I cannot say with certainty that the higher emotional exhaustion I see in the CTT
respondents happened after they participated in CTT. The same applies for the CTT respondents’
higher cynicism and higher professional efficacy scores. It may be that the CTT respondents
were already emotionally exhausted, cynical, and feeling professionally efficacious even before
they participated in CTT. My results may reflect this prior state, rather than an actual effect of
participation in the PD program. Because of this threat to validity, coupled with the bias that may
have been introduced by the proxy variables I discussed at the beginning of the chapter, it is
more appropriate to consider my results as correlational rather than causal.
I also compared the CTT respondents in my study to the normative teaching sample of
the MBI, and to other more recent studies involving K-12 teachers. The CTT respondents
Geil
120
consistently score higher on engagement on all three subscales, with some small exceptions on
the emotional exhaustion subscale. As these are not matched samples, it is quite plausible that
these differences could have been caused by other variables that were not accounted for, but the
findings are at the very least suggestive in a correlational sense. It is worth noting that the CTT
respondents in this study score higher on engagement than the normative sample of the MBI and
samples of teachers in four other contemporary studies.
What is the Effect of Participation in Courage to Teach on Perceived Benefits of the Professional Development Program?
This next section of the chapter will present the results to the first part of the third
research question, as it also involves an estimation of effects. The degree to which the
respondents felt their participation in the PD program was beneficial or detrimental to their
understanding of subject matter, professional relationships, energy and stress levels, and
motivation to teach was measured using subscales of related Likert-scale items (see Table 5-11).

Geil
121
Table 5-11. Items in Perceived Benefits of Participation Subscales
What effect did your participation in [CTT or NWP] have on your…
Item Subscale
Understanding of subject matter Subject Repertoire of teaching ideas Subject
Interest in subject matter Subject Relationships with students Relationships
Relationships with colleagues Relationships Relationships with principals and/or administrators Relationships
Relationships with parents and community members Relationships Energy levels Energy & stress
Stress levels Energy & stress Enjoyment of teaching Teaching
Motivation to teach Teaching
1-Very detrimental, 2-Somewhat detrimental, 3-No effect, 4-Somewhat beneficial, 5-Very beneficial
Note. The reliability of the four subscales ranges from .7-.9 (Cronbach’s alpha).
Comparisons Before Propensity Score Matching
In all four areas with the unmatched samples of PK-12 teachers, there were large
differences: the NWP respondents reported their participation in NWP as being more beneficial
to their subject understanding and enjoyment of teaching than the CTT respondents did, while
the CTT respondents felt their participation in CTT was more beneficial to their energy/stress
levels and their professional relationships than the NWP participants (see Table 5-12 and Figure
5-3).
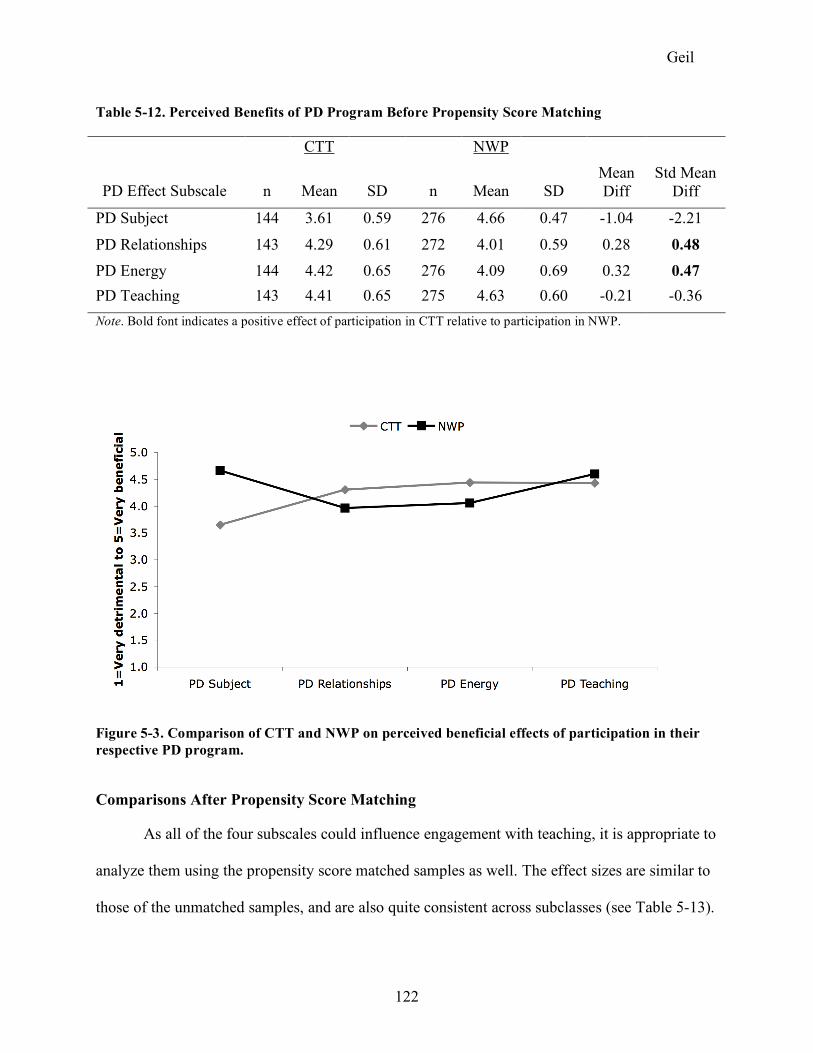
Geil
122
Table 5-12. Perceived Benefits of PD Program Before Propensity Score Matching
CTT NWP
PD Effect Subscale n Mean SD n Mean SD Mean Diff
Std Mean Diff
PD Subject 144 3.61 0.59 276 4.66 0.47 -1.04 -2.21
PD Relationships 143 4.29 0.61 272 4.01 0.59 0.28 0.48 PD Energy 144 4.42 0.65 276 4.09 0.69 0.32 0.47 PD Teaching 143 4.41 0.65 275 4.63 0.60 -0.21 -0.36 Note. Bold font indicates a positive effect of participation in CTT relative to participation in NWP.
Figure 5-3. Comparison of CTT and NWP on perceived beneficial effects of participation in their respective PD program.
Comparisons After Propensity Score Matching
As all of the four subscales could influence engagement with teaching, it is appropriate to
analyze them using the propensity score matched samples as well. The effect sizes are similar to
those of the unmatched samples, and are also quite consistent across subclasses (see Table 5-13).

Geil
123
Table 5-13. Perceived Benefits of PD Program After Propensity Score Matching
Effect Size by Subclass
PD Effect Subscale
Subclass 1
Subclass 2
Subclass 3
Subclass 4
Subclass 5
Subclass 6
Weighted Effect Size*
PD Subject -1.88 -1.36 -1.49 -1.40 -0.87 -1.76 -1.44
PD Relationships 0.47 0.39 0.84 0.47 0.75 0.17 0.54
PD Energy 0.68 0.10 0.16 1.09 0.60 0.76 0.55
PD Teaching -0.27 -0.47 -0.52 -0.10 0.38 -0.88 -0.27
CTT n 20 19 20 19 20 13 111
NWP n 105 31 28 20 9 6 199
Note. Bold font indicates a positive effect of participation in CTT relative to participation in NWP. *Weighted Effect Size is weighted by the number of cases in the treatment (CTT).
After propensity score matching, the direction of the effects is the same, but the size of
the effects is more in favor of CTT. Relative to NWP, participation in CTT still has a negative
effect on respondents’ perceived benefits to their subject understanding and their motivation to
teach. The size of the effects has decreased, however, and while they are still in favor of NWP
the effects are no longer as large: subject understanding has dropped from -2.21 to -1.44, and
motivation to teach has dropped from -0.36 to -0.27. The other two subscales of relationships and
energy have seen their effect sizes increase slightly, indicating a slightly larger positive effect of
CTT on these perceived benefits of participation in the PD program: the effect on relationships
has risen from 0.48 to 0.54, and from 0.47 to 0.56 on energy levels. When I look at the effect
sizes across each of the subclasses, there is some variation between subclasses, but the direction
of the effects is consistent (with one exception on the teaching subscale, which also has the
smallest effect size).

Geil
124
Discussion
The pattern of effects above meshes well with the stated goals of each professional
development program. NWP respondents felt that their participation in the program was
beneficial to their understanding of subject matter, repertoire of teaching ideas, and interest in
subject matter. This makes sense, as one of the main goals of NWP is to share good teaching
ideas and research on the teaching of writing. On the other hand, CTT has no specific subject
focus, so it follows that in general the CTT respondents reported less of a beneficial effect on
these items. While both NWP and CTT respondents felt that participation was beneficial to their
enjoyment of teaching and motivation to teach, the NWP respondents reported slightly higher
benefits than did the CTT respondents. This may be due to the fact that NWP respondents went
back to their classrooms armed with many new teaching ideas that they may have been excited to
put to use, whereas this was not a specific goal of CTT.
CTT respondents reported that their participation in the program was beneficial to their
relationships with students, colleagues, administrators, and parents, while NWP respondents
reported less of a benefit with respect to these relationships. Again, this makes sense, because
one of the goals of CTT is to allow participants “to engage in more meaningful ways in the
classroom and with their colleagues” (Fetzer Institute, 2005, p. 1). NWP does not have this as a
specific goal, even though creating a professional community is a large aspect of the summer
institutes. Both CTT and NWP respondents felt that their participation was beneficial to their
energy levels and to their stress levels, but the CTT respondents reported more benefits in these
areas than the NWP respondents. This may be due to the fact that the CTT program typically
provides time for participants to relax, think, journal, and reflect, as well as provide tools that can
be put to use in their day-to-day lives.

Geil
125
Summary of Chapter
This chapter explained the propensity score matching techniques that I used to obtain the
most comparable subset of respondents from each PD program on a set of potentially
confounding variables. To answer the question about whether or not participation in CTT has a
subsequent effect on engagement, I compared the scores of the CTT and NWP respondents on
the MBI subscales both before and after matching, and discussed the changes that occurred after
the samples were matched. The results were mixed, with participation in CTT appearing to have
small negative effects on engagement for emotional exhaustion and cynicism, and a small
positive effect on professional efficacy. I also compared the CTT respondents to the normative
sample of the MBI and other contemporary studies involving teachers, and found that the CTT
respondents consistently showed higher engagement.
In the second half of the chapter, I analyzed the data on respondents’ perceived benefits
of participation in the PD programs in four main areas. I found large positive effects of CTT both
before and after matching on relationships and energy/stress levels, a large negative effect of
CTT on subject understanding relative to NWP, and a smaller negative effect of CTT on
motivation to teach. The results here were in alignment with each program’s stated goals.
This chapter includes all the results that are an attempt to estimate causal effects.
Although there are some weaknesses to my data and study design that prevent me from
conclusively stating that I found causal effects, the results are at least suggestive and
correlational. In Chapter Six and Chapter Seven I will present the remainder of my findings;
these are not intended to estimate effects and are presented in a qualitative, exploratory manner.

Geil
126
CHAPTER 6. EXPLORATORY DATA REGARDING RETENTION
In the preceding chapter, I presented my findings related to the engagement portion of my
primary research question:
Research Question #2: Does participation in Courage to Teach have an effect on
subsequent engagement with and retention in teaching on participants?
The second half of this question still remains to be answered, but as I analyzed the data, several
issues became apparent. First of all, I do not have the data that would be required for a
systematic examination of retention. This would require longitudinal administrative records of
teachers’ movements in and out of the profession. My primary subset consists of respondents
who are currently PK-12 teachers, so obviously none of them have left the field of teaching.
There is a very small subset of respondents who have left teaching since their participation in the
PD program, but this group is not large enough to be eligible for any sort of matching
techniques. With the PK-12 teachers, I do have a few items that probe their intentions to remain
in teaching, but these are single items rather than a subscale. Given the fact that I do not have a
high quality instrument with which to measure retention, and also the weaknesses present in my
survey data, I cannot answer the question of whether or not participation in CTT has an effect on
subsequent retention.
I can, however, use the data that I have to look for correlations. All comparisons
involving the subset of PK-12 teachers are done with the unmatched samples, rather than the
matched samples, so there may be other factors confounding the results, and no effects are being
estimated. These items do provide some exploratory data on how committed the respondents in
the study are to teaching and if their participation influenced any decisions they were making
about their teaching careers.

Geil
127
No Longer Teaching
There is a small portion of respondents who were not teaching at the time they completed
the survey. For CTT, out of 256 respondents who answered the question about whether or not
they were currently teaching, 27 (11%) said they were not currently teaching. For NWP, 57
(13%) out of 443 respondents were not currently teaching. Because there are so few respondents
in this category, they are not broken out here by whether or not they had been primarily PK-12
teachers, college/university instructors, administrators, or in some other role at the time they
completed the PD program. In order to have been kept in the survey sample, however, they had
to be teaching as part of their responsibilities regardless of their primary role.
This subset of the sample was asked about their current employment status, whether or
not they were still involved in the field of education, and their reasons for leaving teaching (see
Table 6-1).
Table 6-1. Status of Respondents Not Currently Teaching and Their Reasons for Leaving
CTT NWP Status of Those Not Currently Teaching n % n % Still involved in education Still working - in the field of education 11 40.7 18 32.1 Currently retired - still volunteering in education 4 14.8 8 14.3 Currently retired - still working for pay in education 3 11.1 9 16.1 Student - in the field of education 0 0.0 6 10.7 Not involved in education Currently retired - no longer involved in education 5 18.5 1 1.8 Raising a family 3 11.1 6 10.7 Other 1 3.7 7 12.5 Taking care of parents/relatives 0 0.0 1 1.8 Main Reason Left Teaching To pursue a position other than that of a teacher 7 29.2 10 18.2 To retire 6 25.0 18 32.7 Pregnancy/child rearing 3 12.5 10 18.2 School staffing action (e.g., lay-off, reorganization) 2 8.3 3 5.5 Dissatisfied with previous school or teaching assignment 2 8.3 2 3.6 Health 1 4.2 2 3.6 For better salary or benefits 1 4.2 2 3.6 To take courses to improve career opps WITHIN education 1 4.2 6 10.9 Other family reasons 1 4.2 2 3.6

Geil
128
More of the NWP respondents who are not currently teaching are still involved in the
field of education in some way (73%) than the CTT respondents (67%). There are more CTT
respondents, however, who are still working in the field of education and have not retired (41%,
compared to 32% for NWP). But there are also more CTT respondents (19%) who have retired
and are no longer involved with the field of education than NWP respondents (only 2%).
Approximately equal percentages from both PD programs (11% each) are raising families.
Interestingly, 11% of the NWP respondents are students in the field of education, whereas none
of the CTT respondents fall into this category.
When asked about the main reasons they left teaching, the top three reasons for both
groups were to pursue a job other than teaching, to retire, or to raise a family. The most
important reason for the CTT respondents to leave teaching was actually to pursue a position
other than that of a teacher (29%, compared to 18% for NWP). For the NWP respondents, the
most important reason for leaving was to retire (33%, versus 25% for CTT). This may be
because the NWP respondents in this subset are much older than the NWP sample as a whole. In
fact, 39% of the NWP respondents who are no longer teaching are 61 years or older, compared to
only 8% of the NWP sample as a whole. This subset of the NWP sample also has even more
respondents in the category of 61 years or older (39%) than the CTT subset, which has 29%;
again, this is opposite of the sample as a whole, in which the CTT respondents are considerably
older than the NWP respondents.
Intentions to Remain in Teaching
There are a few items on the survey that provide a sense of what the PK-12 teachers’
intentions are regarding staying in or leaving teaching (see Table 6-2).
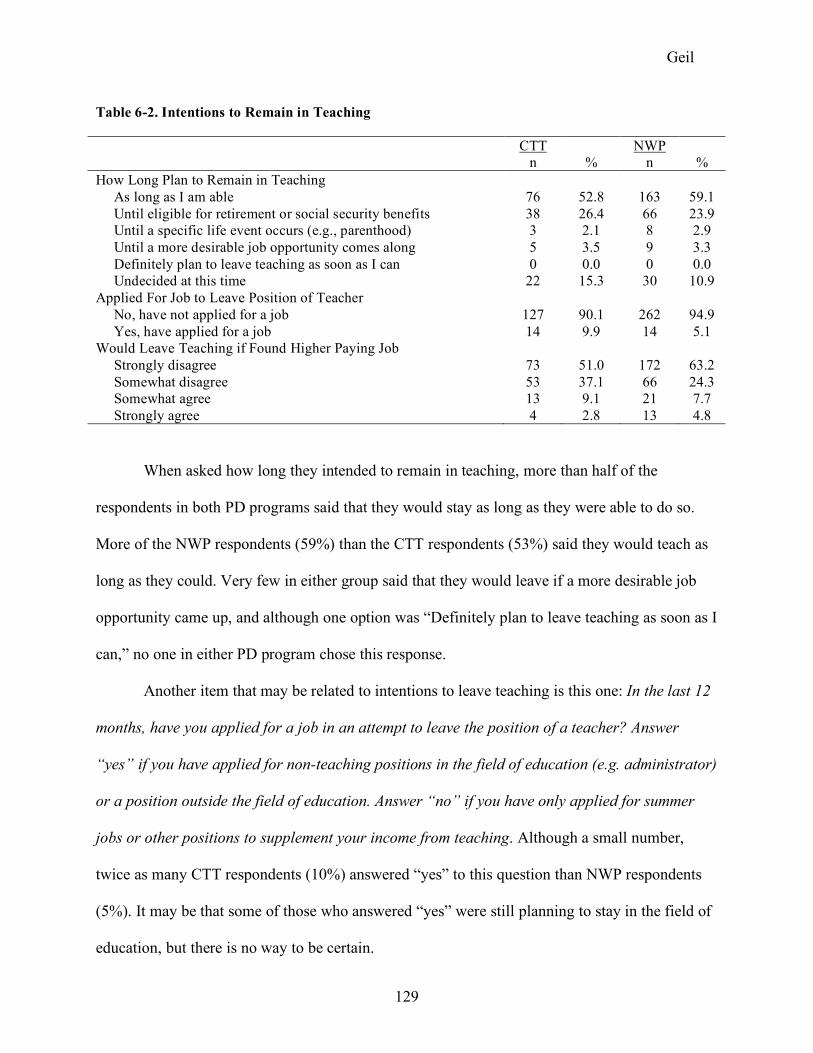
Geil
129
Table 6-2. Intentions to Remain in Teaching
CTT NWP n % n % How Long Plan to Remain in Teaching As long as I am able 76 52.8 163 59.1 Until eligible for retirement or social security benefits 38 26.4 66 23.9 Until a specific life event occurs (e.g., parenthood) 3 2.1 8 2.9 Until a more desirable job opportunity comes along 5 3.5 9 3.3 Definitely plan to leave teaching as soon as I can 0 0.0 0 0.0 Undecided at this time 22 15.3 30 10.9 Applied For Job to Leave Position of Teacher No, have not applied for a job 127 90.1 262 94.9 Yes, have applied for a job 14 9.9 14 5.1 Would Leave Teaching if Found Higher Paying Job Strongly disagree 73 51.0 172 63.2 Somewhat disagree 53 37.1 66 24.3 Somewhat agree 13 9.1 21 7.7 Strongly agree 4 2.8 13 4.8
When asked how long they intended to remain in teaching, more than half of the
respondents in both PD programs said that they would stay as long as they were able to do so.
More of the NWP respondents (59%) than the CTT respondents (53%) said they would teach as
long as they could. Very few in either group said that they would leave if a more desirable job
opportunity came up, and although one option was “Definitely plan to leave teaching as soon as I
can,” no one in either PD program chose this response.
Another item that may be related to intentions to leave teaching is this one: In the last 12
months, have you applied for a job in an attempt to leave the position of a teacher? Answer
“yes” if you have applied for non-teaching positions in the field of education (e.g. administrator)
or a position outside the field of education. Answer “no” if you have only applied for summer
jobs or other positions to supplement your income from teaching. Although a small number,
twice as many CTT respondents (10%) answered “yes” to this question than NWP respondents
(5%). It may be that some of those who answered “yes” were still planning to stay in the field of
education, but there is no way to be certain.

Geil
130
A third item on the survey asks whether or not respondents agree or disagree with the
following statement: If I could get a higher paying job I’d leave teaching as soon as possible. If I
combine the “somewhat disagree” and “strongly disagree” responses, the two PD programs are
almost exactly even. However, the NWP respondents are slightly more definite in their feelings
that they would not leave teaching for a higher paying job than the CTT respondents.
The problem with all three of these items, from a measurement point of view, is that they
are single items. It would be much better if I had multiple items that could be combined into a
subscale, but unfortunately these items all have different scales and combining them would be
difficult. Also, I originally intended to compare my CTT respondents to data from the most
recent SASS and TFS studies, but that data is no longer available to the public.
There is a study done by the National Education Association (2003c) in which
respondents were asked about their plans to remain in teaching. In the National Education
Association (NEA) study, a systematic sample of 2,826 teachers was chosen from random
districts across the country; 1,467 usable replies were received for a response rate of 67%. While
all the options on the NEA item are not exactly the same as on my survey, there are some
definite similarities (see Table 6-3).
Table 6-3. Comparison of Plans to Remain in Teaching Between CTT Sample and NEA Sample
How Long Plan to Remain in Teaching CTT Plans to Remain in Teaching NEA n % n % As long as I am able 76 53 Continue until required to retire NR 16 Until eligible for retirement or social security benefits 38 26 Continue until eligible for retirement NR 46
Until a specific life event occurs (e.g., parenthood, marriage) 3 2 (No equivalent) NR na
Until a more desirable job opportunity comes along 5 4 Probably continue unless something
better comes along NR 11
Undecided at this time 22 15 Undecided at this time NR 22 Definitely plan to leave teaching as soon as I can 0 0 Definitely plan to leave teaching as
soon as possible NR 5
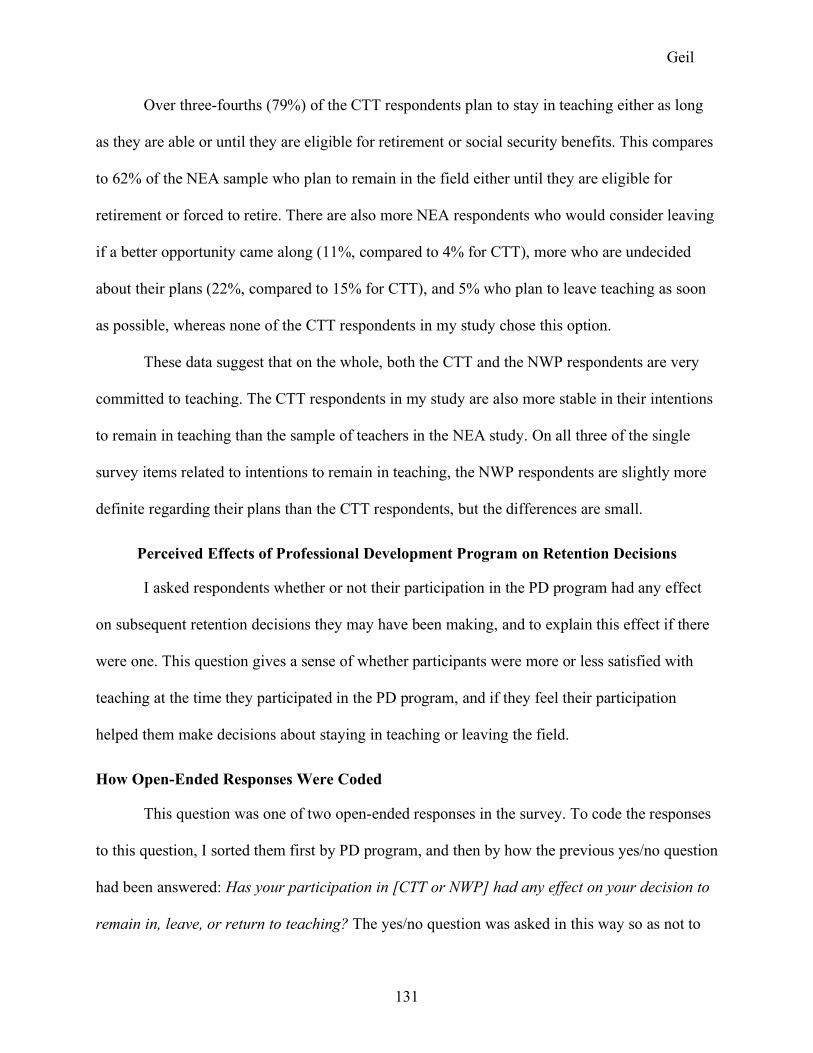
Geil
131
Over three-fourths (79%) of the CTT respondents plan to stay in teaching either as long
as they are able or until they are eligible for retirement or social security benefits. This compares
to 62% of the NEA sample who plan to remain in the field either until they are eligible for
retirement or forced to retire. There are also more NEA respondents who would consider leaving
if a better opportunity came along (11%, compared to 4% for CTT), more who are undecided
about their plans (22%, compared to 15% for CTT), and 5% who plan to leave teaching as soon
as possible, whereas none of the CTT respondents in my study chose this option.
These data suggest that on the whole, both the CTT and the NWP respondents are very
committed to teaching. The CTT respondents in my study are also more stable in their intentions
to remain in teaching than the sample of teachers in the NEA study. On all three of the single
survey items related to intentions to remain in teaching, the NWP respondents are slightly more
definite regarding their plans than the CTT respondents, but the differences are small.
Perceived Effects of Professional Development Program on Retention Decisions
I asked respondents whether or not their participation in the PD program had any effect
on subsequent retention decisions they may have been making, and to explain this effect if there
were one. This question gives a sense of whether participants were more or less satisfied with
teaching at the time they participated in the PD program, and if they feel their participation
helped them make decisions about staying in teaching or leaving the field.
How Open-Ended Responses Were Coded
This question was one of two open-ended responses in the survey. To code the responses
to this question, I sorted them first by PD program, and then by how the previous yes/no question
had been answered: Has your participation in [CTT or NWP] had any effect on your decision to
remain in, leave, or return to teaching? The yes/no question was asked in this way so as not to

Geil
132
be leading (in terms of a “right” answer), and also because of CTT’s philosophy of helping all
participants find the best path for them, even if that means leaving the profession. The open-
ended question was worded as follows: If “yes”[to the question above], briefly explain the effect
that your participation in [CTT or NWP] has had on your decision to remain in, leave, or return
to teaching.
Once the responses were sorted, I read through them group by group, writing down all
the broad themes and key phrases I noticed and using those to create a set of codes. I resorted the
responses so that they were in a random order based on PD program and whether or not any
effect had been attributed to the PD program, and hid this identifying information so that it
would not bias my coding of the responses. After coding was complete, I unhid the identifiers
and analyzed the frequencies of the codes by the respondents of the two PD programs.
In coding qualitative data there are always multiple ways to interpret responses. If three
other people coded these responses, they would most likely come up with three different results
(although with some broad themes in common). In fact, if I coded the data again I would
probably come up with somewhat different results. When reporting results, I looked for
differences of 10% or more on those responses made by at least one-tenth of the respondents,
and differences twice as large when the code applied to less than one-tenth of the respondents.
While somewhat arbitrary, these guidelines should help to reassure the reader that I am trying to
remove as much bias as possible from my interpretations, descriptive as they may be.
Perceived Effects on Decisions to Remain in or Leave Teaching
Eighty percent of the CTT respondents answered yes to Has your participation in [CTT
or NWP] had any effect on your decision to remain in, leave, or return to teaching? compared to
70% of the NWP sample (see Table 6-4).

Geil
133
Table 6-4. Self-Reported Effects on Respondents’ Decisions to Remain In, Leave, or Return to Teaching
CTT
NWP n % n %
PD Had Effect on Retention Decision 115 79.9 193 69.9 Specific Effects on Retention Decisions
Would have left teaching without PD 12 8.3 4 1.4 Helped them continue teaching 11 7.6 23 8.3 Changed positions 11 7.6 11 4.0 Took time off then returned to teaching 4 2.8 0 0.0
Never Planned to Leave Teaching 8 5.6 16 5.8 No Effect on Retention Decisions 7 4.9 11 4.0 Perseverance in Difficult Situations 22 15.3 8 2.9 Not the Only One to Feel/Think This Way 10 6.9 4 1.4
The open-ended responses shed some light on what state of mind respondents were in
when they decided to participate in the PD program. In the open-ended responses, 26% of the
CTT respondents specifically stated ways in which their participation had effected their decision
to remain in, leave, or return to teaching, compared to 14% of the NWP respondents. Double the
amount of CTT respondents (8%) credited the program with helping them to change positions as
NWP respondents (4%). For example, this CTT respondent said, “It gave me the confidence to
take a risk and try something new in education. I’m loving my new position” (Elementary, 11-15
years’ experience, participated in 2000)13. Equal percentages in both groups (8% in each) were
coded as making comments about the PD program helping them continue to teach (even though
they were not considering leaving). This response from an NWP respondent is representative:
“The participants and leaders in the institute inspire me to continue teaching. Their dedication
and goals for students remind me of the importance of giving my students the best education I
13 For each respondent quoted here, I have provided the level at which they teach, the number of years of experience they had at the time of their participation in the program, and the year that they began their participation in the program. Unless otherwise indicated, all respondents are female. Age and race/ethnicity are not included in order to protect the respondents’ confidentiality.

Geil
134
can create” (Secondary, 6-10 years’ experience, participated in 2007). A small group (3%) of the
CTT respondents said that their participation had helped them decide to take time off from
teaching and then return to it, whereas none of the NWP respondents made similar comments. As
this CTT participant put it, “Being involved in CTT helped me get through another difficult year
of teaching, and then helped with my decision to take a year off—the best thing I ever did. I am
now back with renewed energy and focus and have made some changes that invigorate me”
(Middle school, 16-20 years’ experience, participated in 2005).
Another relatively large discrepancy, even though the overall numbers are small, lay in
the fact that there were CTT respondents (8%) who had been seriously thinking of leaving
teaching when they began the program, but credited it with keeping them in teaching. This
compares to just 1% of the NWP respondents. For example, this CTT teacher said:
When I began the retreat cycle I truly felt that I needed to move on to something
else and I began the retreats as a sort of a ‘self-reflective’ journey of discovery as
to what to do next. However, by mid way through I felt very strongly that I was
indeed making a difference … the CTT retreats affirmed my self-confidence in
the teacher that I was and continue to be. (Secondary, 6-10 years’ experience,
participated in 2005)
A few CTT respondents (4%) also provided explicit statements of feeling burned out, as opposed
to 1% of the NWP respondents: “When I began my first CTT retreat series, I was seriously
questioning whether I was ‘burning out’ – feeling discouraged by how hard I was working, and
questioning whether I should consider a career change” (Elementary, 16-20 years’ experience,
participated in 2000).
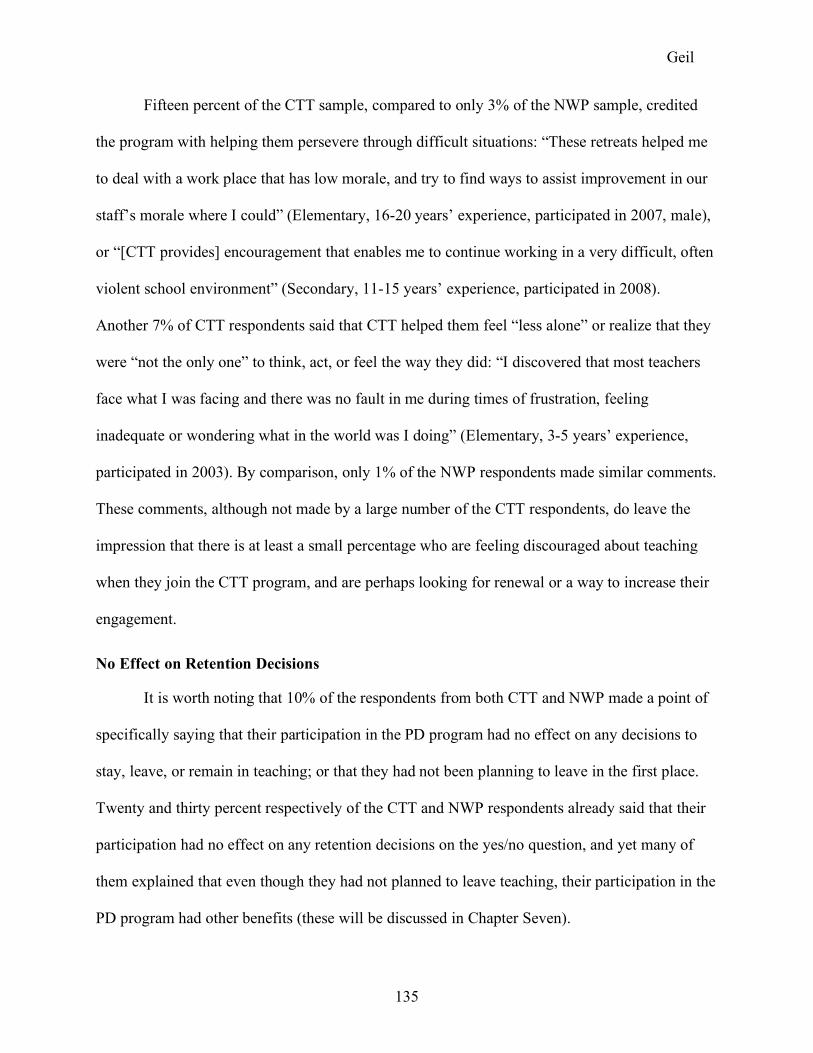
Geil
135
Fifteen percent of the CTT sample, compared to only 3% of the NWP sample, credited
the program with helping them persevere through difficult situations: “These retreats helped me
to deal with a work place that has low morale, and try to find ways to assist improvement in our
staff’s morale where I could” (Elementary, 16-20 years’ experience, participated in 2007, male),
or “[CTT provides] encouragement that enables me to continue working in a very difficult, often
violent school environment” (Secondary, 11-15 years’ experience, participated in 2008).
Another 7% of CTT respondents said that CTT helped them feel “less alone” or realize that they
were “not the only one” to think, act, or feel the way they did: “I discovered that most teachers
face what I was facing and there was no fault in me during times of frustration, feeling
inadequate or wondering what in the world was I doing” (Elementary, 3-5 years’ experience,
participated in 2003). By comparison, only 1% of the NWP respondents made similar comments.
These comments, although not made by a large number of the CTT respondents, do leave the
impression that there is at least a small percentage who are feeling discouraged about teaching
when they join the CTT program, and are perhaps looking for renewal or a way to increase their
engagement.
No Effect on Retention Decisions
It is worth noting that 10% of the respondents from both CTT and NWP made a point of
specifically saying that their participation in the PD program had no effect on any decisions to
stay, leave, or remain in teaching; or that they had not been planning to leave in the first place.
Twenty and thirty percent respectively of the CTT and NWP respondents already said that their
participation had no effect on any retention decisions on the yes/no question, and yet many of
them explained that even though they had not planned to leave teaching, their participation in the
PD program had other benefits (these will be discussed in Chapter Seven).

Geil
136
Discussion
Since this was a question about retention, what stands out for me is that the CTT
respondents are much more specific about the effects of the PD program on any decisions they
made regarding retention. There are also more CTT respondents who specifically said that they
were thinking about leaving teaching or who credited the PD program with helping them
persevere through a difficult situation than NWP respondents. This suggests that when they
signed up for the retreat series, at least a portion of the CTT respondents may have been less
enthused about teaching and thinking more about leaving when they began the program than the
NWP respondents. Even if this is the case, it is not a large percentage of the CTT respondents, so
this is not meant to imply that CTT is a program intended only for “burned out” teachers. But,
there is some evidence that more of the CTT teachers may have been feeling this way than the
NWP teachers, and in CTT they may have found a safe place to explore these questions and
emotions.
Summary of Chapter
This chapter presented exploratory data on the issue of retention. It suggests that all the
respondents in my study are very committed to teaching, but the CTT respondents may be
slightly less so than the NWP respondents. It also appears that a small percentage of the CTT
respondents were questioning their career choice when they began the program, and may have
been seeking renewal in some form. In the next chapter, I will analyze my final research
question, which asks about the most valuable aspects of participation in CTT or NWP from the
perspective of the respondents.

Geil
137
CHAPTER 7. MOST VALUABLE ASPECTS OF PARTICIPATION IN PROFESSIONAL DEVELOPMENT PROGRAMS
My third research question asked whether or not there were differences in how the
respondents perceived the benefits of their participation in the professional development program
on a variety of issues. This chapter will discuss the second sub question:
Research Question #3b: Are there differences between the CTT and NWP
participants with regards to their perceptions of the program’s most valuable
aspects?
I will answer this question using the responses to the two open-ended questions in the survey in
an attempt to get a sense of what respondents find most valuable about their participation.
Because I am not attempting to establish an effect, but rather looking for more exploratory,
descriptive data, the propensity score matched sample is not used here. In the previous chapter, I
explained in detail how I coded the first question blind; the second open-ended question was
coded in the same manner.
The first question asked respondents to explain the effects that their participation in the
PD program had on any retention decisions they may have been making: Briefly explain the
effect that your participation in [CTT or NWP] has had on your decision to remain in, leave, or
return to teaching. Whether they had been thinking about leaving teaching or not, most all of the
respondents answered this question by talking about the aspects of their participation that had
been most meaningful to them. The second question specifically asked respondents to share the
most valuable part of their CTT or NWP experience: As you look back on your [CTT retreat
series or NWP summer institute] experience, what stands out as the most valuable part to you?
Within each PD program, the responses to both questions revolved around similar
themes, so they are synthesized here. Between the two PD programs, however, there was

Geil
138
relatively little overlap in their responses. I will examine first those responses that were made
fairly frequently by both groups, second those that were made primarily by CTT respondents,
and third those that were specific mostly to the NWP respondents (see Appendix G for tables of
the most frequently coded themes for each question).
Responses Heard Frequently From Both CTT and NWP Respondents
While there were distinct differences between what the two groups of respondents had to
say about their participation in the PD programs, in a few key areas both groups were likely to
make the same types of comments.
Importance of Community and People
For both open-ended questions, the most frequently heard responses revolved around
people and community. I expected that because of the explicit focus in the program on building
relationships, the CTT respondents would be more likely to say that community had helped them
make decisions about whether or not to stay in teaching. However, it was the opposite: 33% of
the NWP respondents specifically said that the people they had met and the communities that
had formed had had an effect on their decisions to stay in or leave teaching, compared to 20% of
the CTT respondents.
Both the CTT and NWP respondents agreed that the most valuable aspects of the
programs were the people they met and the communities formed, but again the NWP respondents
were more likely to have this as a response. In fact, almost half of the NWP respondents (48%)
said this as opposed to 40% of the CTT respondents. It is true that the largest category of NWP
comments in this area revolved around professional connections, while the majority of the CTT
comments were about personal connections. For example, the NWP respondents said they valued
things like: “The growing network of NWP colleagues across the district, state, and national
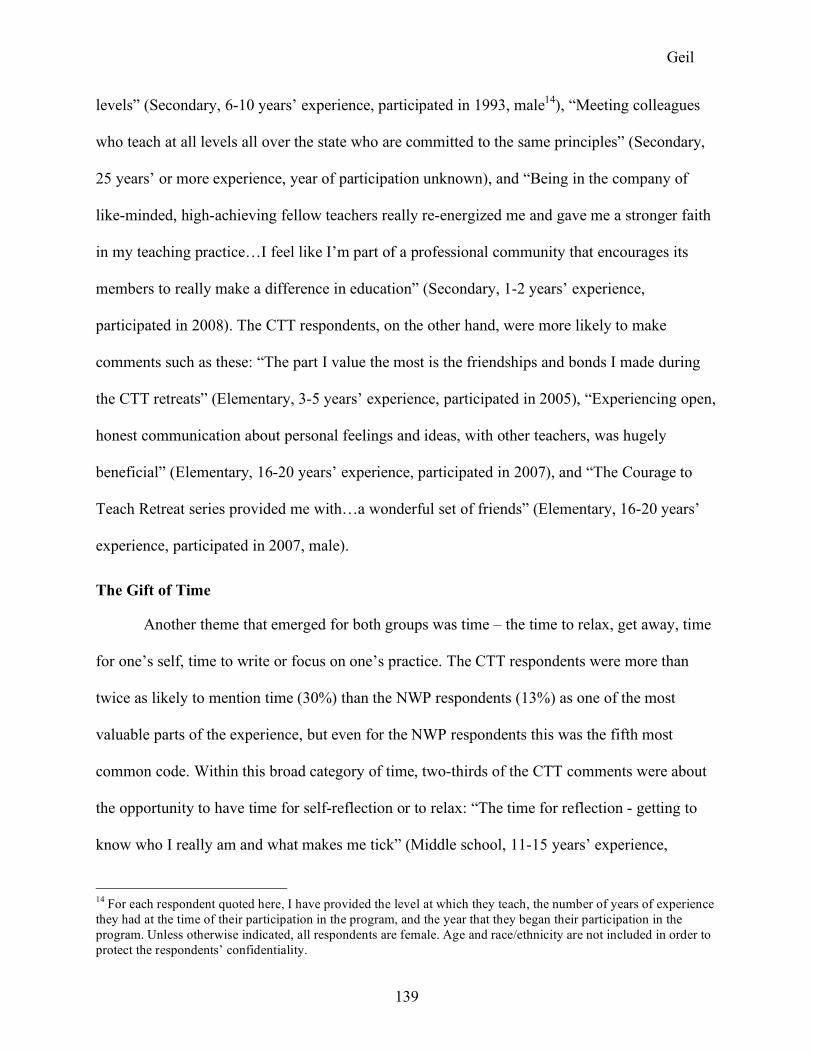
Geil
139
levels” (Secondary, 6-10 years’ experience, participated in 1993, male14), “Meeting colleagues
who teach at all levels all over the state who are committed to the same principles” (Secondary,
25 years’ or more experience, year of participation unknown), and “Being in the company of
like-minded, high-achieving fellow teachers really re-energized me and gave me a stronger faith
in my teaching practice…I feel like I’m part of a professional community that encourages its
members to really make a difference in education” (Secondary, 1-2 years’ experience,
participated in 2008). The CTT respondents, on the other hand, were more likely to make
comments such as these: “The part I value the most is the friendships and bonds I made during
the CTT retreats” (Elementary, 3-5 years’ experience, participated in 2005), “Experiencing open,
honest communication about personal feelings and ideas, with other teachers, was hugely
beneficial” (Elementary, 16-20 years’ experience, participated in 2007), and “The Courage to
Teach Retreat series provided me with…a wonderful set of friends” (Elementary, 16-20 years’
experience, participated in 2007, male).
The Gift of Time
Another theme that emerged for both groups was time – the time to relax, get away, time
for one’s self, time to write or focus on one’s practice. The CTT respondents were more than
twice as likely to mention time (30%) than the NWP respondents (13%) as one of the most
valuable parts of the experience, but even for the NWP respondents this was the fifth most
common code. Within this broad category of time, two-thirds of the CTT comments were about
the opportunity to have time for self-reflection or to relax: “The time for reflection - getting to
know who I really am and what makes me tick” (Middle school, 11-15 years’ experience,
14 For each respondent quoted here, I have provided the level at which they teach, the number of years of experience they had at the time of their participation in the program, and the year that they began their participation in the program. Unless otherwise indicated, all respondents are female. Age and race/ethnicity are not included in order to protect the respondents’ confidentiality.

Geil
140
participated in 2008), “Time away to reflect about all of me not just the teacher in me”
(Elementary, 16-20 years’ experience, participated in 2003), and “Quiet time to REST. I got to
take a nap! Then, I had the mental energy to really focus on how much I am committed to
teaching and renew my spirit as well” (Elementary, 11-15 years’ experience, participated in
2007). On the other hand, two-thirds of the NWP comments about time as a valuable aspect of
the program were about spending time on their own writing: “Being allowed—expected even—
to carve out time to research a topic of value and write daily” (Middle school, 1-2 years’
experience, participated in 2006), “Time to write!” (Middle school, 6-10 years’ experience,
participated in 2007), and “The most valuable part for me was the opportunity to write, and to
support other teachers in their writing process as well as be supported myself” (Elementary, 21-
25 years’ experience, participated in 1995).
Personal and Professional Rejuvenation
With regards to the first question about perceived effects on retention, respondents from
both programs said that they felt rejuvenated in some way as a result of their participation. The
NWP respondents had more responses in this category (29%, compared to 21% for CTT), and
were most likely to talk about a professional rejuvenation of their teaching on some level,
followed by renewed energy or enthusiasm. They made comments such as, “It was like getting a
second wind in my professional life” (Elementary, 6-10 years’ experience, participated in 1998),
“It gave me more encouragement and enthusiasm toward the content area, as well as giving me
more useful tools and strategies to implement in my classroom” (Secondary, 1-2 years’
experience, participated in 2008), and “The Summer Institute is the best professional
development I have ever done. It has reinvigorated my teaching and made me a more focused
and proficient educator” (Middle school, 11-15 years’ experience, participated in 2006).

Geil
141
The CTT respondents, on the other hand, were more likely to refer to rejuvenation on
both the personal and the professional level than the NWP respondents. As this CTT respondent
put it: “It has reinforced my enthusiasm for living. As the self discovery process inherent in CTT
evolved, so did my energy/interest for teaching” (Elementary, 21-25 years’ experience,
participated in 2005, male). Another said, “[CTT] provided an opportunity to renew myself –
physically, mentally and emotionally…It was a time to reflect on my motivation to remain in the
field of education, and renew my commitment to becoming the best teacher that I can become”
(Elementary, 11-15 years’ experience, participated in 2007).
On the second question about the most valuable part of the experience, however, more
CTT respondents mentioned some form of rejuvenation (11%) than the NWP respondents (2%).
They said things like, “The relaxing collaborative atmosphere of positive peers re-energized me.
I believe all teachers should attend these retreats with consistent follow-up retreats to let the
feeling stay” (Secondary, 25 years’ or more experience, participated in 2007) and “Stepping back
from the daily requirements of the classroom and re-connecting with myself inwardly; restorative
in this sense” (Secondary, 21-25 years’ experience, participated in 2007).
Increased Confidence
Although the numbers were not large, 5% of the CTT respondents said they had become
more confident as a result of their participation in the program, and so did 9% of the NWP
respondents—not quite double—and that this had helped them make decisions about staying in
or leaving teaching. One CTT respondent stated that “‘Teaching who we are’ is a very clarifying,
empowering, and validating credo that helped me to gain confidence and energy in the
classroom” (Secondary, 16-20 years’ experience, participated in 2007). An NWP respondent

Geil
142
said: “An effect the Summer Institute has had on my career is that I feel more confident in my
abilities, ideas, and lesson plans” (Secondary, 6-10 years’ experience, participated in 2008).
This theme was also present, again not in large numbers, in the responses to the question
about the most valuable aspect of the experience (4% in CTT and 5% in NWP). For example, the
CTT respondents talked about, “The validation I feel from other experienced professionals that I
get so rarely from my administration, colleagues, and parents at my school” (Secondary, 3-5
years’ experience, participated in 2006, male), and “Being more confident in myself and valuing
my expertise” (Elementary, 25 years or more of experience, participated in 2005). The NWP
respondents remarked on, “The confidence I gained about my own ideas and my ability to teach”
(Middle school, 3-5 years’ experience, participated in 2006) and “The affirmation I received
from Institute colleagues for my expertise, creativity, and skills was encouraging and refreshing”
(Secondary, 16-20 years’ experience, participated in 2004).
Safe Environment
Again this was not a comment made by large numbers of respondents in either group, but
another theme that emerged was the idea of both programs providing a safe environment for their
participants. This concept was mentioned by 7% of the CTT respondents and by 4% of the NWP
respondents, in comments such as these: “Having a supportive group of colleagues with whom I
could gather. Feeling like there was a ‘safe place’ to question whether or not this was the right
profession for me” (CTT, Elementary, 6-10 years’ experience, participated in 2006), and “We
were provided the opportunity to plan and implement new ideas in a safe and supportive
environment” (NWP, Elementary, 21-25 years’ experience, participated in 1995).

Geil
143
Responses Made Primarily By CTT Respondents
There was a set of responses that were made almost entirely by the CTT respondents, and
much less frequently by the NWP respondents. These are discussed below.
Rediscovered or Affirmed Teaching as a Calling
A full quarter (26%) of the CTT respondents on the first question said that CTT had
helped them either rediscover or affirm their calling to be a teacher: they mentioned a love of
teaching, a passion for it, something they were meant to do, or a way in which they were making
a difference in people’s lives. In contrast, only 4% of the NWP respondents mentioned similar
themes. The CTT respondents made comments such as these: “My participation allowed me to
reflect on why I am a teacher and why I love it so much. It reinforced all of my positive feelings
about teaching and gave me renewed energy and passion for my work” (Elementary, 16-20
years’ experience, participated in 2001); “The retreat helped me look into myself and realize that
I was there not for ‘just a job’, but because I wanted to be able to give something back to my
community” (Secondary, 3-5 years’ experience, participated in 1999); “I realized what it is about
teaching that I love so much: that being with kids every day in this way takes me out of my head
and into my heart, and requires me to be my ‘best self.’ I realized that this work, as hard as it is,
and as much of my time and energy as it takes, is what keeps me energized and alive and
passionate” (Elementary, 16-20 years’ experience, participated in 2000). CTT had either
reminded them or confirmed that they were in the right profession. It is interesting to note that
10% of the CTT respondents said they “rediscovered” their calling, which implies they had lost it
somehow to begin with. Only one NWP respondent reported feeling the same way.

Geil
144
Reflection
Fifteen percent of the CTT respondents mentioned “reflection” in some manner
(e.g., having the opportunity to spend more time reflecting, realizing its importance), compared
to just 3% of the NWP respondents in the first question. And almost 30% said that it was one of
the most valuable aspects of the PD program, while again only 3% of the NWP respondents said
the same thing. For example, the CTT respondents said: “Teachers are almost never given a
chance to reflect; it’s like a soothing balm to the spirit. This was profound for my life as well as
my teaching—to pause and take stock before moving again forward” (Middle school, 16-20
years’ experience, participated in 2005), “It taught me the (ongoing) value of reflection”
(Elementary, 11-15 years’ experience, participated in 2003), “I really enjoyed the quiet weekend
away from the noise of life to reflect on my choice of a career” (Secondary, 21-25 years’
experience, participated in 2004), and “Courage has made me reflect and see the big picture and
purpose” (Elementary, 6-10 years’ experience, participated in 2002).
Opportunities for Inner Work
It may be that the reason fewer CTT respondents brought up community compared to the
NWP respondents is because the self-reflection opportunities in a CTT retreat series have a more
salient effect on respondents’ retention-related decisions. Only the CTT respondents commented
on learning about themselves or doing inner work with regards to how the program had affected
their decision to stay in or leave teaching. Almost one quarter (24%) of the CTT sample did so,
compared to only 1% of the NWP sample, and for NWP these were primarily comments related
to learning about themselves as writers. On the other hand, 17% of the CTT group talked about
the “self” in some way, and 7% talked more specifically about the soul, doing inner work or
healing, or spiritual renewal. For example, CTT respondents said things such as: “Courage to
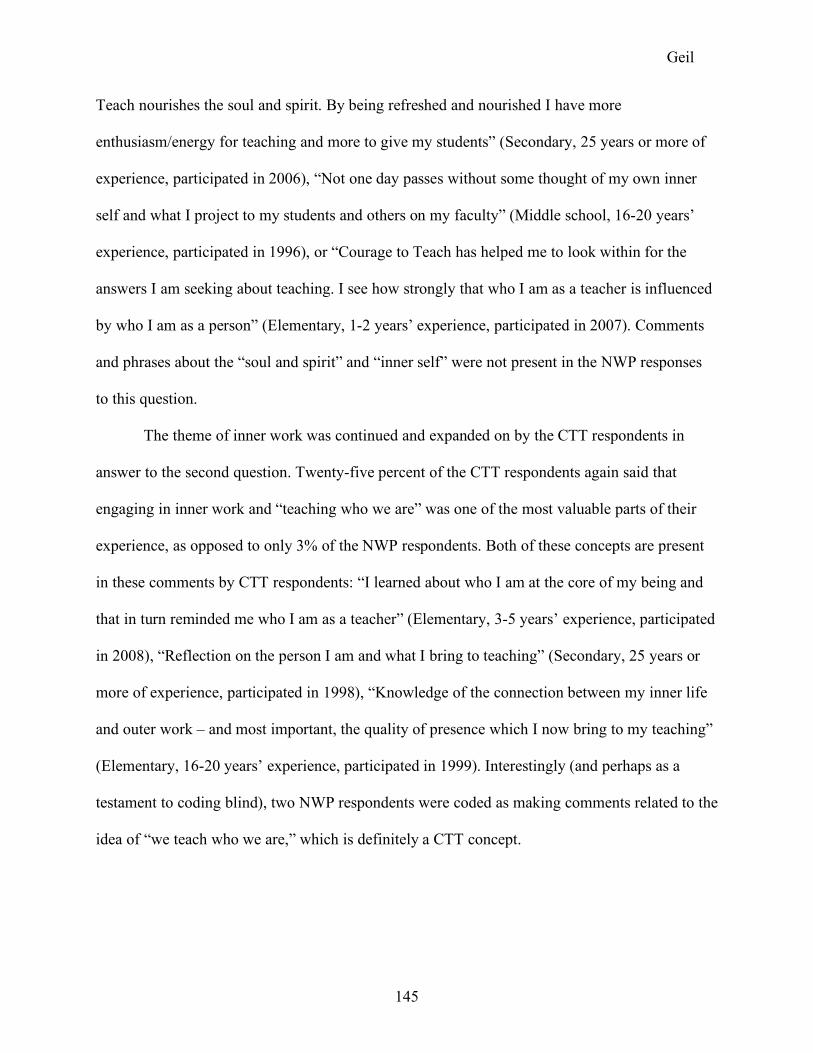
Geil
145
Teach nourishes the soul and spirit. By being refreshed and nourished I have more
enthusiasm/energy for teaching and more to give my students” (Secondary, 25 years or more of
experience, participated in 2006), “Not one day passes without some thought of my own inner
self and what I project to my students and others on my faculty” (Middle school, 16-20 years’
experience, participated in 1996), or “Courage to Teach has helped me to look within for the
answers I am seeking about teaching. I see how strongly that who I am as a teacher is influenced
by who I am as a person” (Elementary, 1-2 years’ experience, participated in 2007). Comments
and phrases about the “soul and spirit” and “inner self” were not present in the NWP responses
to this question.
The theme of inner work was continued and expanded on by the CTT respondents in
answer to the second question. Twenty-five percent of the CTT respondents again said that
engaging in inner work and “teaching who we are” was one of the most valuable parts of their
experience, as opposed to only 3% of the NWP respondents. Both of these concepts are present
in these comments by CTT respondents: “I learned about who I am at the core of my being and
that in turn reminded me who I am as a teacher” (Elementary, 3-5 years’ experience, participated
in 2008), “Reflection on the person I am and what I bring to teaching” (Secondary, 25 years or
more of experience, participated in 1998), “Knowledge of the connection between my inner life
and outer work – and most important, the quality of presence which I now bring to my teaching”
(Elementary, 16-20 years’ experience, participated in 1999). Interestingly (and perhaps as a
testament to coding blind), two NWP respondents were coded as making comments related to the
idea of “we teach who we are,” which is definitely a CTT concept.

Geil
146
Clearness Committee and Other CTT Activities
Respondents from both programs mentioned specific activities that they found
particularly valuable. For CTT respondents, the activity most often mentioned was the clearness
committee (14%). The clearness committee is a Quaker tradition that brings a group of people
together to help a selected “focus person” reach clarity on a question or issue of his or her own
choosing. It operates under the belief that on issues of life and vocation, each person has “an
inward source of authority that does not need to be prodded with external answers and ‘fixes’ but
needs only to be given a chance to speak and be heard” (M. Jackson & Jackson, 2002, p. 302).
For this reason, committee members are only allowed to ask honest, open questions to which
they do not know the answer or have an idea of what the focus person “should” do. For
committee members, participation can be powerful, as they experience what it is like to listen
deeply to someone, putting their own inner dialogue aside and focusing completely on a person
without trying to fix them (M. Jackson & Jackson, 2002; Palmer et al., 2001). And it was clearly
a powerful experience for the CTT respondents in this study, judging from these comments:
“The ‘clearness committee’ experience was/is/can be extraordinary” (Middle school, 16-20
years’ experience, participated in 2005), “Clearness [committee]…is an amazing gift”
(Elementary, 3-5 years’ experience, participated in 2005), and “I was amazed by the power of
Clearness Committees, both as a focus person and as a committee member” (Elementary, 16-20
years’ experience, participated in 2000).
After the clearness committee, the CTT respondents were most likely to bring up “third
things” (the poems and other small readings used in the retreats as conversation starters and food
for thought) (6%), the circle of trust created in the retreats (5%), and the emphasis on silence and
opportunities for journaling (4% each).

Geil
147
Deep Conversations
The CTT respondents are more likely to mention having deep, meaningful, personal
conversations or connections with the other members of their group (12%) as a valuable aspect,
whereas only 1% of the NWP respondents made similar remarks. The CTT respondents said that
they valued, “Sharing deep feelings about being human with others who may or may not
understand and/or feel the same way” (Middle school, 25 years or more of experience,
participated in 2005, male), “Having the opportunity to talk about real issues with people who
actually understand because they live it too” (Secondary, 11-15 years’ experience, participated in
2008), and “Sharing deep conversations with colleagues. I still meet with CTT colleagues to
engage in rich discourse about why I do what I do” (Elementary, 11-15 years’ experience, year
of participation unknown).
Learning to Take Better Care of Themselves
A small group of CTT respondents were also more likely to say that the program had
helped them take better care of themselves personally (8%) than the NWP respondents (2%), and
that this helped them make retention decisions about teaching. They made comments such as
“CTT has helped me focus and prioritize on my personal and professional needs” (Elementary,
16-20 years’ experience, participated in 2005) and “CTT helps me to remember to take care of
myself first and to honor myself as a person and not just work work work. I feel like when I take
the time to remember the things I’ve learned there I am a much better teacher” (Elementary, 6-10
years’ experience, participated in 2003).
The CTT respondents (4%) were also the only ones to say that this was one of the most
valuable aspects of their participation. They commented on, “Getting the opportunity to take care
of myself before taking care of everyone else – family as well as students” (Middle school, 21-25

Geil
148
years’ experience, participated in 2001), and “Teaching myself to stay balanced emotionally and
spiritually, by slowing down, being reflective and taking good care of myself and my soul”
(Secondary, 6-10 years’ experience, participated in 2005).
Responses Made Mostly By NWP Respondents
The comments made most frequently by the NWP respondents were quite different from
those made most frequently by the CTT respondents, revolving around writing, new ideas,
walking in their students’ shoes, research, and leadership opportunities.
Personal Writing
Given the program’s focus, it is not surprising that 15% of the NWP group talked about
writing in response to the first question: “The Summer Institute…confirmed my belief in the
power and importance of writing in the life of every student and, indeed, every person. I greatly
enjoyed the writing we did and learned a lot from it” (Secondary, 16-20 years’ experience,
participated in 2004). For the NWP respondents, it was also the second most valuable aspect
mentioned overall (30%), behind people and community. Many respondents talked about
realizing they were a writer, improving as a writer, and recognizing their love for writing and
their own writing skills, as these comments attest: “Becoming a writer and being able to share
that purpose and enthusiasm with my students” (Elementary, 11-15 years’ experience,
participated in 1989), “My personal writing stands out as the most valuable part of the Summer
Institute because it gave me a chance to practice an art form that was intimidating to me”
(Secondary, 6-10 years’ experience, participated in 2008), “Improvement in my own knowledge
and ability as a writer” (School level unknown, 16-20 years’ experience, participated in 2001),
and “I truly came to love writing” (Secondary, 1-2 years’ experience, participated in 2008).
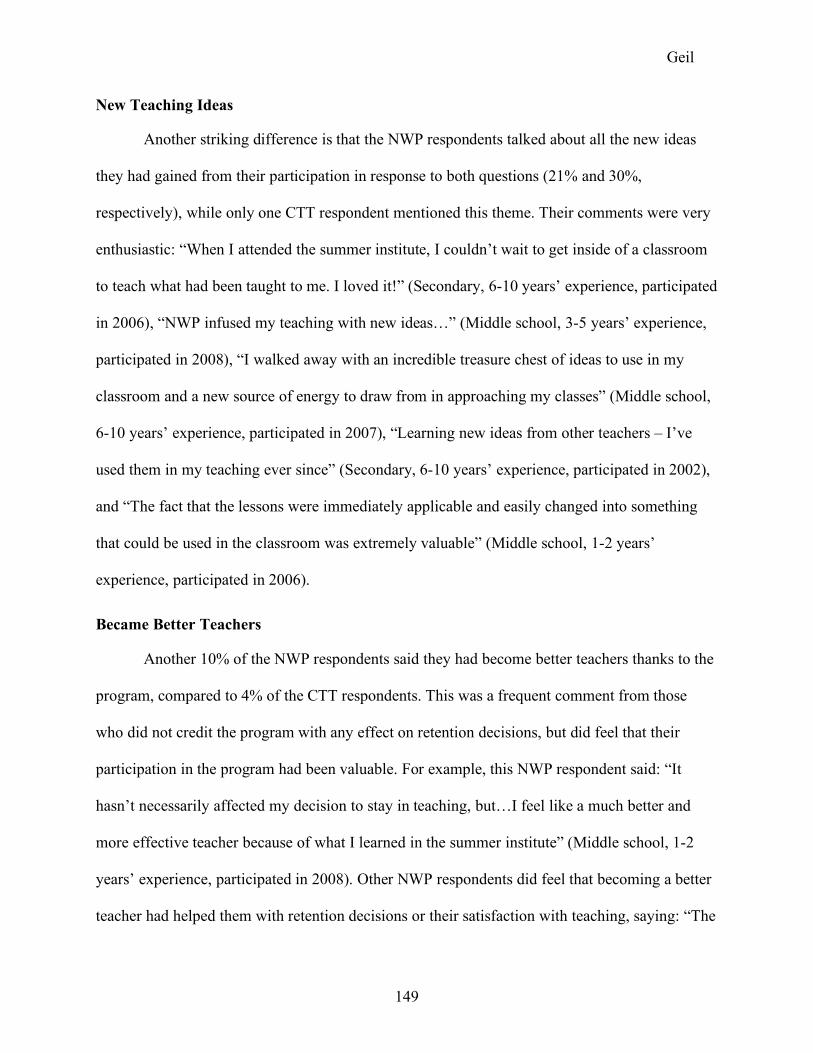
Geil
149
New Teaching Ideas
Another striking difference is that the NWP respondents talked about all the new ideas
they had gained from their participation in response to both questions (21% and 30%,
respectively), while only one CTT respondent mentioned this theme. Their comments were very
enthusiastic: “When I attended the summer institute, I couldn’t wait to get inside of a classroom
to teach what had been taught to me. I loved it!” (Secondary, 6-10 years’ experience, participated
in 2006), “NWP infused my teaching with new ideas…” (Middle school, 3-5 years’ experience,
participated in 2008), “I walked away with an incredible treasure chest of ideas to use in my
classroom and a new source of energy to draw from in approaching my classes” (Middle school,
6-10 years’ experience, participated in 2007), “Learning new ideas from other teachers – I’ve
used them in my teaching ever since” (Secondary, 6-10 years’ experience, participated in 2002),
and “The fact that the lessons were immediately applicable and easily changed into something
that could be used in the classroom was extremely valuable” (Middle school, 1-2 years’
experience, participated in 2006).
Became Better Teachers
Another 10% of the NWP respondents said they had become better teachers thanks to the
program, compared to 4% of the CTT respondents. This was a frequent comment from those
who did not credit the program with any effect on retention decisions, but did feel that their
participation in the program had been valuable. For example, this NWP respondent said: “It
hasn’t necessarily affected my decision to stay in teaching, but…I feel like a much better and
more effective teacher because of what I learned in the summer institute” (Middle school, 1-2
years’ experience, participated in 2008). Other NWP respondents did feel that becoming a better
teacher had helped them with retention decisions or their satisfaction with teaching, saying: “The

Geil
150
techniques I learned in the Summer Institute have definitely made me a better writing teacher
and have made the teaching of writing more rewarding for me, as I have seen improved skills in
my students’ written work” (Secondary, 11-15 years’ experience, participated in 2004) and “All
the writing project classes and workshops make me a better teacher and make me want to keep
learning with my students” (Middle school, 1-2 years’ experience, participated in 1993).
Sharing Ideas and Learning With Other Teachers
Among the NWP respondents, a theme also emerged in the second question about the
importance of sharing ideas and learning with other teachers in the program (20%, compared to
only 3% of CTT respondents). Since one of the primary activities of the summer institutes is for
each participant to give a teaching demonstration to the rest of the group, the propensity of NWP
respondents to mention this theme is not surprising. Many of their comments about the most
valuable part of the program reflected this aspect of the summer institutes: “Sharing ideas with
colleagues to create beautiful lessons” (Middle school, 1-2 years’ experience, participated in
2005, male), “The fun of learning together” (Secondary, 16-20 years’ experience, participated in
2001), “Being with and learning from other teachers who are enthusiastic to share ideas and
lessons with you was a wonderful part of the institute” (Elementary, 3-5 years’ experience,
participated in 2007). A few NWP respondents (8%) also mentioned similar topics in their
responses to the first question, such as this one: “What has stayed with me the longest is the
importance of learning from each other” (Secondary, 16-20 years’ experience, participated in
1989, male).
Walking In Their Students’ Shoes
There were a small percentage of comments in the first question about how the
respondents were now more student-focused in their teaching (7% for NWP, and 2% for CTT).
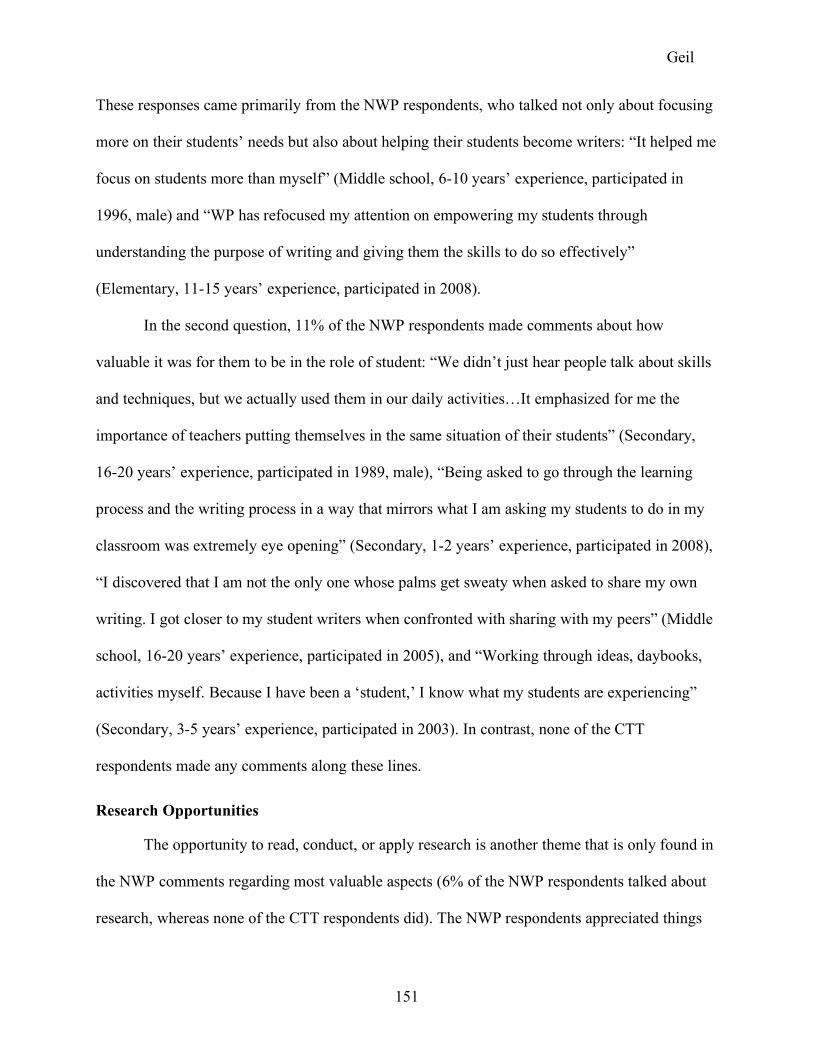
Geil
151
These responses came primarily from the NWP respondents, who talked not only about focusing
more on their students’ needs but also about helping their students become writers: “It helped me
focus on students more than myself” (Middle school, 6-10 years’ experience, participated in
1996, male) and “WP has refocused my attention on empowering my students through
understanding the purpose of writing and giving them the skills to do so effectively”
(Elementary, 11-15 years’ experience, participated in 2008).
In the second question, 11% of the NWP respondents made comments about how
valuable it was for them to be in the role of student: “We didn’t just hear people talk about skills
and techniques, but we actually used them in our daily activities…It emphasized for me the
importance of teachers putting themselves in the same situation of their students” (Secondary,
16-20 years’ experience, participated in 1989, male), “Being asked to go through the learning
process and the writing process in a way that mirrors what I am asking my students to do in my
classroom was extremely eye opening” (Secondary, 1-2 years’ experience, participated in 2008),
“I discovered that I am not the only one whose palms get sweaty when asked to share my own
writing. I got closer to my student writers when confronted with sharing with my peers” (Middle
school, 16-20 years’ experience, participated in 2005), and “Working through ideas, daybooks,
activities myself. Because I have been a ‘student,’ I know what my students are experiencing”
(Secondary, 3-5 years’ experience, participated in 2003). In contrast, none of the CTT
respondents made any comments along these lines.
Research Opportunities
The opportunity to read, conduct, or apply research is another theme that is only found in
the NWP comments regarding most valuable aspects (6% of the NWP respondents talked about
research, whereas none of the CTT respondents did). The NWP respondents appreciated things

Geil
152
such as, “The supportive environment to conduct self-motivated action research” (Elementary, 3-
5 years’ experience, participated in 2006), “The Summer Institute engaged me in professional
research and reading. This effort has made me an independent learner of my craft” (Secondary,
1-2 years’ experience, participated in 2005, male), and “I became committed to reading
research—and every summer have chosen a book on teaching to read and focus my efforts for
the coming year” (Secondary, 1-2 years’ experience, participated in 1994).
Taking on Leadership Roles and Pursuing Advanced Degrees
There was a small group of NWP respondents (7%) who said that they had taken on
additional leadership roles either at their schools or through NWP as a result of their
participation, compared to 1% of the CTT respondents. For example, this NWP respondent said,
“It has impacted the role that I have at my school. Now, I am the reading/writing coordinator and
provide professional development at the school – this is exciting and rewarding” (Elementary,
21-25 years’ experience, participated in 2002). Another commented, “It has made me want to be
a leader in my district. Last year I led a literacy group with a colleague, and we wrote a grant
for…our teachers to get funding for literacy certification. We got the grant, and our writing
cohort started this week” (Elementary, 6-10 years’ experience, participated in 2008).
There was also a group who attributed their decisions to pursue advanced degrees or
National Board Certification to participation in the professional development program. Although
the numbers were quite small, this was again more likely to be the case for the NWP respondents
(4%) than the CTT respondents (1%). As these two NWP respondents said, “Being in the
institute inspired me to pursue a master’s degree and National Board Certification through my
local university” (Middle school, 6-10 years’ experience, participated in 2008), and “My
participation in the Summer Institute is what set me on the path to get my Masters degree in
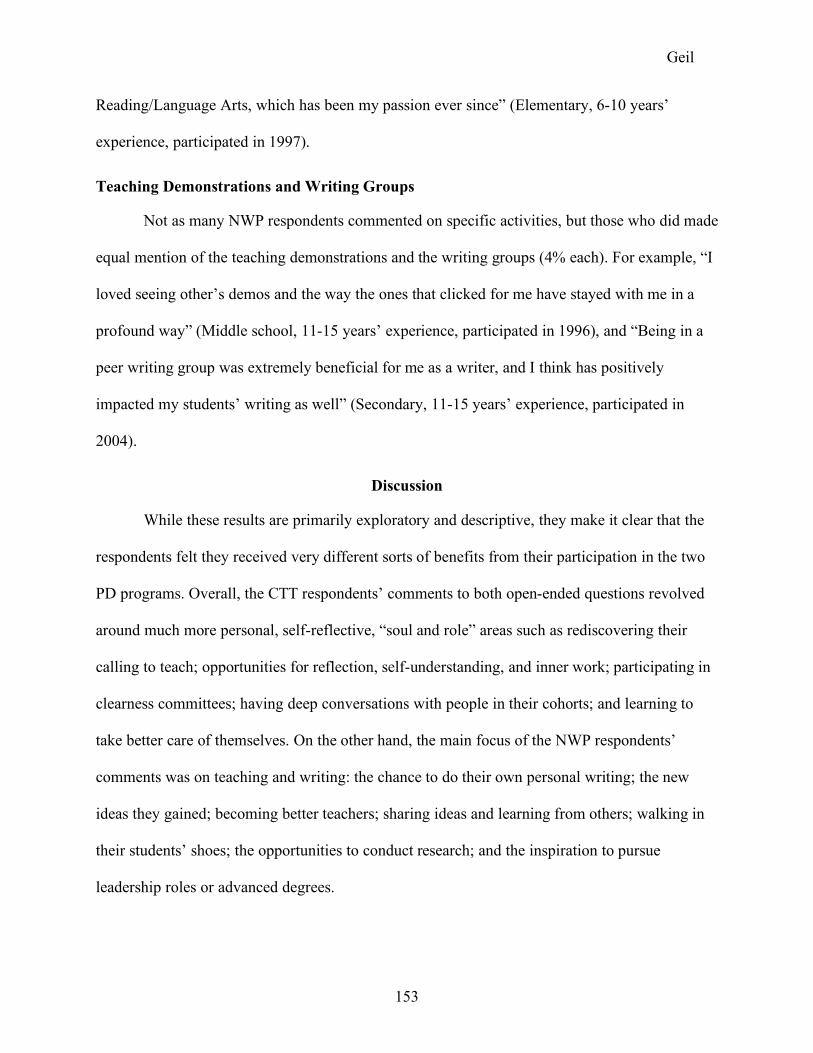
Geil
153
Reading/Language Arts, which has been my passion ever since” (Elementary, 6-10 years’
experience, participated in 1997).
Teaching Demonstrations and Writing Groups
Not as many NWP respondents commented on specific activities, but those who did made
equal mention of the teaching demonstrations and the writing groups (4% each). For example, “I
loved seeing other’s demos and the way the ones that clicked for me have stayed with me in a
profound way” (Middle school, 11-15 years’ experience, participated in 1996), and “Being in a
peer writing group was extremely beneficial for me as a writer, and I think has positively
impacted my students’ writing as well” (Secondary, 11-15 years’ experience, participated in
2004).
Discussion
While these results are primarily exploratory and descriptive, they make it clear that the
respondents felt they received very different sorts of benefits from their participation in the two
PD programs. Overall, the CTT respondents’ comments to both open-ended questions revolved
around much more personal, self-reflective, “soul and role” areas such as rediscovering their
calling to teach; opportunities for reflection, self-understanding, and inner work; participating in
clearness committees; having deep conversations with people in their cohorts; and learning to
take better care of themselves. On the other hand, the main focus of the NWP respondents’
comments was on teaching and writing: the chance to do their own personal writing; the new
ideas they gained; becoming better teachers; sharing ideas and learning from others; walking in
their students’ shoes; the opportunities to conduct research; and the inspiration to pursue
leadership roles or advanced degrees.

Geil
154
Even in the areas where there was some overlap in their comments, such as the
importance of the people they met and the communities formed, there were still differences in
tone. The CTT respondents’ comments were frequently about personal aspects of these
relationships, whereas the NWP respondents’ comments were much more related to the
professional side. This was true for the theme of rejuvenation as well, in which the NWP
respondents talked more about a professional rejuvenation of their teaching, while the CTT
respondents often brought up more personal aspects of renewal. And finally, in the code about
“time,” the CTT respondents appreciated the time for self-reflection and to relax, as opposed to
the NWP respondents, who primarily appreciated the time to spend writing.
Summary of Chapter
This chapter was devoted to the second part of the third research question, in which I
asked about what the respondents of the two PD programs perceived as the most valuable parts
of their experiences. There were distinct differences between the groups, and these differences
were very much in line with each program’s stated goals and philosophies. According to the
NWP participants, the most valuable aspects of the program are the benefits to their own
personal writing, their teaching, and their professional resources and connections. These contrast
rather sharply with the most valuable aspects of the program for the CTT respondents, which
focus on the personal connections made and the variety of opportunities for self-reflection. These
responses indicate that not only are there differences between the two programs, but the
programs’ goals are being transmitted to their participants, and their participants are finding the
programs valuable in the ways in which they were intended. In the final chapter, I will synthesize
all my findings and discuss implications and directions for future research.

Geil
155
CHAPTER 8. DISCUSSION AND CONCLUSIONS
Major Findings
At the beginning of this study, I posed three main research questions: (a) what are the
demographic characteristics of the teachers who choose to participate in a transformative
professional development program such as Courage to Teach, (b) does participation in CTT have
a subsequent effect on teacher engagement and retention, and (c) what are some of the perceived
benefits of participation expressed by the CTT and National Writing Project respondents. In this
chapter, I will summarize and discuss the major findings for each of these questions and consider
implications and directions for future research.
Characteristics of CTT Respondents
*CTT respondents are older, have more teaching experience, and are closer to retirement than NWP respondents or the nationally representative sample from NCES.
The most interesting finding demographically, and also one of the most unequivocal, is
that CTT appears to attract teachers who are older, have more teaching experience, and are on
average closer to retirement. This is true when the CTT respondents are compared to either the
NWP respondents or a nationally representative sample of K-12 teachers from the National
Center for Education Statistics’ Schools and Staffing Surveys. While there are certainly plenty of
teachers who participate in CTT early on in their careers, there is a definite trend towards more
mature teachers.
Effects on Engagement
*Participation in CTT appears to have a small positive effect (increased engagement) on professional efficacy relative to participation in NWP.
Participation in CTT has a small but positive effect on professional efficacy, indicating
increased engagement, relative to participation in NWP. CTT’s positive effect may be related to
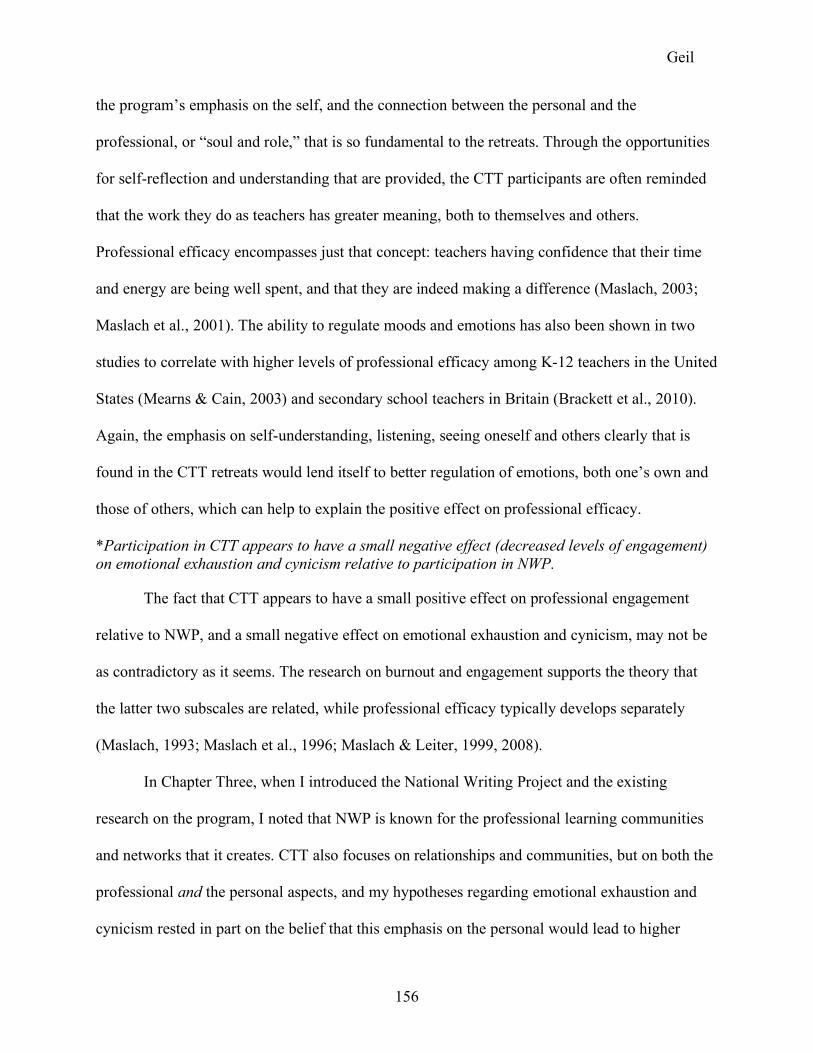
Geil
156
the program’s emphasis on the self, and the connection between the personal and the
professional, or “soul and role,” that is so fundamental to the retreats. Through the opportunities
for self-reflection and understanding that are provided, the CTT participants are often reminded
that the work they do as teachers has greater meaning, both to themselves and others.
Professional efficacy encompasses just that concept: teachers having confidence that their time
and energy are being well spent, and that they are indeed making a difference (Maslach, 2003;
Maslach et al., 2001). The ability to regulate moods and emotions has also been shown in two
studies to correlate with higher levels of professional efficacy among K-12 teachers in the United
States (Mearns & Cain, 2003) and secondary school teachers in Britain (Brackett et al., 2010).
Again, the emphasis on self-understanding, listening, seeing oneself and others clearly that is
found in the CTT retreats would lend itself to better regulation of emotions, both one’s own and
those of others, which can help to explain the positive effect on professional efficacy.
*Participation in CTT appears to have a small negative effect (decreased levels of engagement) on emotional exhaustion and cynicism relative to participation in NWP.
The fact that CTT appears to have a small positive effect on professional engagement
relative to NWP, and a small negative effect on emotional exhaustion and cynicism, may not be
as contradictory as it seems. The research on burnout and engagement supports the theory that
the latter two subscales are related, while professional efficacy typically develops separately
(Maslach, 1993; Maslach et al., 1996; Maslach & Leiter, 1999, 2008).
In Chapter Three, when I introduced the National Writing Project and the existing
research on the program, I noted that NWP is known for the professional learning communities
and networks that it creates. CTT also focuses on relationships and communities, but on both the
professional and the personal aspects, and my hypotheses regarding emotional exhaustion and
cynicism rested in part on the belief that this emphasis on the personal would lead to higher

Geil
157
engagement in these areas. However, in Chapter Seven, the NWP respondents were actually
more likely than the CTT respondents to bring up the people they met and the communities
formed through the program as one of the most valuable aspects of their participation, albeit
through a professional lens. It may be that NWP’s emphasis on professional relationships is just
as effective, if not more so, than CTT’s emphasis on the professional and the personal.
Another possible explanation is that CTT’s emphasis on the personal aspect of
relationships and on self-reflection heightens participants’ awareness of how they interact with
students as well as their own emotions. This may make them more likely to recognize that they
may have been treating students impersonally, or that they themselves are feeling emotionally
drained. In other words, participation in CTT may lead to a more introspective, honest appraisal
of one’s own attitudes and emotions. While this increased self-awareness may lead to higher
scores on the MBI subscales of cynicism and emotional exhaustion, it may not necessarily mean
that the CTT respondents are actually less engaged in these areas.
There are some other structural features of the NWP experience that may also influence
the results. For example, one of the hallmarks of the NWP summer institutes is that teachers
teach other teachers. What this means in practice is that teachers become students again, both for
the purpose of teaching demonstrations and also in writing groups. As some NWP respondents
mentioned (see Chapter Seven), walking in their students’ shoes gave them more empathy for
their students, which may translate into reduced cynicism—the ability to look at students
positively, give them the benefit of the doubt, and see things from their point of view.
Regarding emotional exhaustion, the NWP respondents reported that a very valuable
aspect of their participation was the infusion of new teaching ideas they received, which in many
cases energized them or got them excited to try out these new activities in their classrooms. It

Geil
158
seems reasonable that these feelings could lead to decreased emotional exhaustion—feelings of
enthusiasm and wanting to get to work in the morning.
It is important to note, however, that just because the CTT respondents in my study have
scores indicative of less engagement on emotional exhaustion and cynicism than the NWP
respondents does not mean they are in an absolute sense. As the next finding attests, the CTT
respondents are considerably more engaged relative to national norms.
*The CTT respondents are more engaged on all three subscales relative to the normative sample of the MBI and four other contemporary studies.
I compared my CTT respondents to the normative sample of K-12 teachers who took the
MBI, and to the results of four other contemporary studies involving K-12 teachers. While none
of these samples are representative, they are good proxies for a third comparison group: teachers
who do not choose to participate in a time-intensive professional development program such as
CTT or NWP. I hypothesized that the CTT respondents would be more engaged than this third
comparison group on all three subscales, and these predictions were not only borne out
consistently on two of the subscales (cynicism and professional efficacy), but the differences
were quite large. On the third subscale of emotional exhaustion, the CTT respondents were either
more engaged or just slightly less engaged than the comparison groups. This suggests that
participation in CTT has, at the least, a stronger correlation with reduced cynicism and higher
levels of professional efficacy compared to teachers who do not participate in professional
development, and a slightly less pronounced correlation with reduced emotional exhaustion.
Together with the finding that participation in CTT appears to have a positive effect on
professional efficacy relative to participation in NWP, the even larger differences between CTT
respondents and the MBI normative sample/contemporary studies strongly suggest that there
may be a real correlation between CTT and professional efficacy.

Geil
159
Effects on Perceived Benefits of Participation
*Participation in CTT appears to have a medium-sized positive effect on respondents’ perceived benefits to their professional relationships and their energy/stress levels, a large negative effect relative to NWP on subject understanding, and a small negative effect on motivation to teach.
The data suggest that participation in CTT has a medium-sized, positive effect on
respondents’ perceived benefits of participation to their professional relationships and
energy/stress levels. Given the program’s emphasis on developing safe spaces and trusting
relationships, and the opportunities provided for reflection and relaxation, these results seem
logical. On the other hand, there is a large negative effect relative to the NWP respondents on
subject understanding, and a small negative effect on motivation to teach. Again, as CTT does
not have a specific content focus, it is not surprising that it would not match the perceived
benefits of NWP in this area, but even so the CTT respondents do report slight benefits to their
subject understanding. The NWP’s focus on the teaching of writing may also explain the higher
motivation to teach and enjoyment of teaching that the NWP respondents exhibit: they are
excited to put all the new ideas they have gained into action.
Exploratory Data Regarding Retention
*Both CTT and NWP respondents appear to be committed to teaching in the long-term. CTT respondents are slightly less committed than NWP respondents, but more committed than a national sample of K-12 teachers.
When it comes to their current intentions regarding teaching, it is clear that the majority
of both CTT and NWP respondents have no intention of leaving teaching any time soon. When
asked how long they plan to remain in the position of a teacher, not a single one chose the option
of “Definitely plan to leave teaching as soon as I can,” and only a very small percentage from
each program said they would leave if a better opportunity came along. Very few respondents
from either program have applied for jobs recently in an attempt to leave teaching. And well over
three-fourths of the PK-12 teachers in both CTT and NWP disagreed with the statement that they

Geil
160
would leave teaching if they could find a higher paying job. Two-thirds of the respondents from
both professional development programs are also satisfied with their salary, as compared to just
under half of teachers in the NCES nationally representative sample. Overall, the NWP
respondents are slightly more definite in their responses on these items than the CTT
respondents, but the differences are not large; these are also single item measures on the
unmatched respondents, so should be considered descriptive in nature. The desire to remain in
teaching exhibited by the CTT PK-12 teachers who responded to this survey is also stronger than
that of a sample of American teachers surveyed by the National Education Association. It is
possible that the teachers who chose to respond to the survey are particularly committed to
teaching, but I do not have sufficient data on the non-respondents to determine whether or not
this is the case.
*A small group of CTT respondents were more likely to question whether or not teaching was the right career for them when they began the program.
At the time of their participation in the PD program, a small portion of the CTT
respondents are more likely to be questioning whether teaching is the right career choice than the
NWP teachers. Judging from CTT respondents’ comments, participation in the retreat series
helps them clarify retention decisions and renew their commitment to teaching, decide to change
positions, take time off, and even leave in some cases. It is important to add that deciding to
leave the profession of teaching is not necessarily a negative outcome by CTT standards,
especially if by doing so the participant is able to realize more congruency between their
personal and professional lives.
Most Valuable Aspects of Participation
*The CTT and NWP respondents show distinct differences in terms of what they find most valuable about participating in the professional development programs; their responses reflect the goals of the programs.

Geil
161
The CTT respondents’ answers to the questions about the most valuable part of their
experience and any effects that their participation had on retention decisions were primarily
related to personal connections and support; opportunities for self-understanding and inner work;
teaching as an extension of who they are as a person; time to relax, reflect, and renew their
energy and spirit; and rediscovering or reaffirming their calling to teach. The NWP respondents’
comments, on the other hand, focused on professional connections and resources, the new ideas
they gained for use in their classrooms, how valuable it had been to share and learn with other
teachers, the opportunities to pursue their own personal writing, and the feelings of rejuvenation
that resulted from all of the above. Even in the areas where there was some overlap, such as the
fact that both groups greatly valued the people they met and the connections they had formed,
there were still differences. In this case, the CTT respondents were much more likely to focus on
personal connections they had made, while the NWP respondents talked primarily in terms of
professional relationships. While the responses from the two groups are quite different in
substance and style, they are very well aligned with the goals of each respective PD program.
Lessons Learned Regarding Data Collection and Study Design
As I went through the process of collecting and analyzing my data, weaknesses to my
study design and survey instrument became apparent. For example, because of the retrospective
nature of the study and my desire to survey teachers who had participated in their PD program as
long as a decade or two ago, I did not attempt (nor was it particularly feasible) to gather data on
the respondents before they participated in the PD program. But now, as I look at the results, I
cannot say with any certainty that the outcomes I see are due to the programs themselves.
Geil
162
The Issue of Temporal Precedence
As I stated in Chapter Five, temporal precedence is a serious threat to my validity in that I
cannot show that the “cause” (participation in CTT) took place before the “effect” (engagement).
In other words, I do not know for certain that participation in CTT is what caused the apparent
negative effect on emotional exhaustion and cynicism and the positive effect on professional
efficacy. I also do not know what the respondents’ baseline levels of engagement were on the
MBI subscales. It could be, for example, that the CTT respondents were more emotionally
exhausted, cynical, and professionally efficacious before the PD program began than the NWP
respondents and participation in the program had no effect. Or, perhaps the CTT respondents
were actually significantly more exhausted, cynical, and/or efficacious before participation, but
participating in the program helped narrow these gaps. As it stands, my current study does not
provide the data needed to determine which, if any, of these scenarios are correct.
A Proposed Follow-Up Study
One possible way to remedy this issue of temporal precedence would be to conduct a
follow-up study with a pre/post design, so that data could be collected both before and after (and
possibly during) participation in the PD programs. While I would lose the retrospective aspect,
and also probably the large-scale nature of the study, I would gain the ability to more definitively
answer whether or not teachers who choose to participate in CTT are more or less engaged on
any of the three subscales to begin with than teachers who participate in NWP or teachers who
do not participate in professional development at all.
Even if it turns out that my CTT participants are more or less engaged to begin with, the
study could still provide valuable data on whether or not their engagement levels increase or
decrease after their participation in the PD program, with or without a control group. This would
Geil
163
help to answer the question of whether or not CTT has an effect on subsequent engagement and
retention, and also if the effect is consistent across all three subscales of the MBI.
Another advantage of a pre/post design is that I could better avoid the issues with having
to use proxy variables for some of the potentially confounding variables in my propensity score
matching. By asking directly about these potential confounders before participation in the PD
program began (school and student level characteristics), I could be sure that I was not
controlling for variables that were themselves influenced by the treatment.
A follow-up study could also attempt to mitigate the issue of possible omitted
confounding variables. While I covered variables related to teacher demographics, school
characteristics, and student characteristics thoroughly, the design of the study did not allow me to
ask about other potentially confounding variables such as the quality of respondents’
relationships with colleagues, students, or administrators before participation. In addition, if
pre/post data were collected on such variables this could help specifically determine the
mechanisms through which participation in the professional development programs affects
engagement.
A pre/post design such as the one I am envisioning would only be successful if I had full
buy-in from the retreat facilitators and site directors involved in the study. An advantage would
be that, with the help and encouragement of the facilitators and site directors, the response rate
could be considerably higher than what it was for the online survey I conducted. In fact, the
NWP has all their participants at the end of each summer institute complete an evaluation, and
the response rate is traditionally close to 90% (Stokes & St. John, 2008). I might not be able to
reach that rate, as the survey required for this proposed study is much more of a time
commitment, but it would certainly be higher than the response rate in my current study.
Geil
164
If the percentage of non-respondents is low, then the issue of non-respondent bias is
minimized (a systematic pattern that explains why some people responded and others did not; for
example, in my study it is quite possible that only those who are most engaged or positive about
the PD program responded). In any study there are bound to be those who do not respond, but
with the help of the facilitators, it should be possible to identify non-respondents and more easily
gather data to determine whether or not there is a systematic bias. The ability to generalize the
results to CTT and NWP alumni as a whole would also be increased, especially if the
retreats/sites were purposefully sampled. Ideally, this proposed study would reach a higher
number of respondents, minimize non-respondent bias, and increase generalizability.
The study I have conducted for this dissertation attempted to estimate causal effects of
participation in CTT on engagement, as measured by the MBI. Due to the threat of temporal
precedence and bias that may have been introduced through proxy or omitted variables, it is
more appropriate to consider my results as correlational, rather than causal; suggestive rather
than conclusive. Nevertheless, the results do raise some interesting questions and implications
for further research.
Implications and Directions for Future Research
CTT Appeals to More Experienced Teachers
Taken together, it seems that for those who responded to my survey, CTT does not appeal
equally to all teachers, but rather draws more heavily from those who are more advanced in their
careers. The NWP also has a niche, in that it attracts a disproportionate number of teachers who
are at earlier stages in their career, and this has been confirmed by data collected from summer
institute participants in evaluation studies (Stokes & St. John, 2008). If CTT facilitators wish to
expand the program’s appeal, then this information could help them do so, or it could be used to
Geil
165
better tailor the program to their primary audience (if it indeed generalizes to CTT participants as
a whole). It may be that CTT’s focus on “soul and role” has particular appeal to teachers who
have already devoted a considerable portion of their careers to teaching, have invested a great
deal of their time and energy, and are searching for ways to maintain their engagement with the
profession. It would be interesting to further pursue this question of why teachers with these
characteristics appear to be attracted to the CTT program.
The Impact of Level of Involvement on Engagement
In Chapter Five I mentioned that the NWP respondents in my study rate themselves as
being more involved with the PD program after their participation than the CTT respondents, but
it did not seem appropriate to include level of involvement as a potentially confounding variable.
I did say that I could run the propensity score matching again as a sensitivity analysis to see if
the results change, and I have done so (see Appendix H). When level of involvement is included
in the propensity score matching, the CTT respondents are even more emotionally exhausted and
not as professionally efficacious relative to the NWP respondents. On the cynicism subscale, the
CTT respondents are still more cynical than the NWP respondents, but the difference is not as
great as it was when level of involvement was not included in the propensity score matching.
This means that relative to the NWP respondents, the CTT respondents are less engaged to a
greater degree on two out of the three subscales after matching with level of involvement.
This suggests that there is an influence of level of involvement on the results, but it
appears to be in the opposite direction from what I would have expected. If the CTT respondents
were less involved before matching, but then equally as involved as the NWP respondents after
matching, I would expect that the CTT respondents would look more engaged relative to the
NWP respondents. Or, at the very least, the gap would begin to close, but this was not the case in

Geil
166
two out of the three MBI subscales. Attempting to determine why level of involvement had this
effect on CTT would be a good topic for future study.
Engagement Levels of CTT Participants Before Participation
The results of my study suggest that CTT has a small positive effect on professional
efficacy and a small negative effect on emotional exhaustion and cynicism relative to the NWP
respondents. The CTT respondents also appear to be consistently more engaged with regards to
professional efficacy and cynicism, and slightly less so with regards to emotional exhaustion,
than the normative sample of the MBI and four other contemporary studies. But these results
raise a new question: are the CTT respondents more or less engaged before their participation in
the retreat series? The follow-up study that I described in the previous section could be one way
to begin to answer this question.
Interaction Between Participation in CTT and Emotional Exhaustion
It would also be interesting to examine the CTT respondents more closely with respect to
emotional exhaustion, as that seems to be the subscale on which they are the least engaged,
relative to the NWP respondents, the MBI normative sample, and two of the contemporary
studies. If I could first establish whether or not the CTT respondents are particularly emotionally
exhausted before their participation in the program, the next step would be to determine why this
is the case.
Content Focus and Effective Professional Development
In Chapter Two, I laid out the consensus on what constitutes effective professional
development, and suggested that the requirement for content focus may make it too narrow.
While the effects are not large, CTT does appear to have a small positive effect on one of the
subscales of the MBI, and small negative effects on the other two subscales. This is in

Geil
167
comparison to a highly regarded, time-tested program—the National Writing Project—which
meets all of the consensus requirements for effective professional development. The small
effects and the fact that one was in favor of CTT lend support to my argument that we may be
limiting professional development opportunities for teachers if we only consider those programs
with a specific content focus to be effective. But the question of why CTT respondents are more
emotionally exhausted and cynical relative to the NWP respondents is also raised, and this would
be worthy of future study.
In Chapter Two, I also adapted Desimone’s (2009) conceptual framework to fit
transformative professional development, and argued that increased teacher engagement could
ultimately lead to increased student learning. While this would present even more design
challenges, a logical next step is to try to establish a link between participation in CTT and
increased student learning.
Elements of Professional Development Most Effective at Increasing Engagement
Some of the similarities between NWP and CTT that made NWP a good control group
may have confounded the results. Anecdotally, NWP teacher consultants have reported that they
found their participation in the summer institutes to be personally transformative (Lieberman &
Wood, 2001). In addition, although NWP summer institutes are not designed to be
transformative professional development according to the definition used in this study (explicit
focus on the who that teaches, rather than the what or the how), many of the practices of NWP
summer institutes parallel those used in CTT retreat programs. NWP teacher consultants report
that the summer institutes provide a venue in which community is formed, trust is developed,
and emotional support provided, resulting in more energy and enthusiasm for teaching, and the
chance to explore their own identity as writers, students, and teachers (Lieberman & Wood,

Geil
168
2001). The emphasis on creating a safe, trusting community in which teachers can share their
teaching ideas and personal writing with each other, the opportunity to walk in their students’
shoes, and the emphasis on developing personally as a writer all combine to create a
transformative experience for some teachers.
These similarities bring up the question of which elements of professional development
are most effective at increasing engagement. While the qualitative data suggest that the CTT
participants and the NWP participants have very different experiences, there are still areas of
overlap. Perhaps an emphasis on community, whether professional or personal or both, has the
potential to translate into increased engagement regardless of whether the primary focus is on a
specific content area or on self-understanding. Further research could unpack which elements of
professional development, transformative or not, are most successful at increasing engagement.
CTT Respondents Searching For Renewal
While hardly definitive, the results to the open-ended questions and the items related to
retention suggest that a larger percentage of the CTT respondents are looking for some type of
renewal when they begin the PD program. The numbers were small, but more CTT respondents
were questioning their career choice before their participation, talking about how CTT helped
them persevere through difficult situations, or made them feel less alone. They talked more about
the time to relax and reflect being a valuable aspect of their experience, at a rate of more than
double that of the NWP respondents, implying that they were more in need of it to begin with.
There was a group of CTT respondents who credited the program with helping them to
rediscover teaching as a calling, which implies that they had previously lost this feeling.
Participation in CTT had a positive effect on perceived benefits to their energy and stress levels

Geil
169
relative to participation in NWP, which also suggests that the CTT respondents may have been
looking for this type of renewal when they signed up.
Compared to CTT respondents as a whole, this is a relatively small percentage, so it does
not mean that CTT is only for “burned out” teachers. On the contrary, the majority of the CTT
respondents are very committed to teaching as a career, satisfied with their salaries, and planning
to stay in the field as long as possible. But for those teachers who are looking for a safe place to
question whether or not they are in the right career, CTT provides a valuable outlet. This also
lends support to the idea that perhaps the CTT respondents are generally more emotionally
exhausted and cynical before participation in the PD program, but future research is need to
determine if this is the case.
Opportunities for Participants to Stay Connected
The results of my study suggest that, relative to a comparable program in terms of
structure, time, and intensity, CTT is not as successful at raising engagement on two out of three
MBI subscales. One way in which CTT might be able to improve is by establishing more
avenues through which participants can stay involved after the retreat series is complete. NWP
has a very well established system that enables teacher consultants to stay connected with the
program. In fact, they are expected to stay involved for at least a year after their participation in
the summer institute. Because NWP participants can go back and get a “shot” of energy and
community and ideas, this undoubtedly helps them to keep their engagement levels high. CTT,
on the other hand, has no such system in place, but I think this would be worth considering.
NWP’s network of teachers is also one of its strengths, as the respondents in my study
eloquently attest. Many CTT participants are the only ones at their schools to participate in the
program, and it is more difficult for them to continue that sense of community once their retreat

Geil
170
series is over. If CTT could more systematically promote networking and community after the
retreat series are finished, this could be very beneficial to participants.
Summary and Closing Thoughts
At the conclusion of this study, I can now paint a picture of what the CTT respondents
look like compared to the NWP respondents and a nationally representative sample. I set a very
high bar for CTT to pass in terms of whether or not it has an effect on engagement relative to
NWP, and it passed the bar on one of the MBI subscales and fell short on two others. Given the
high standards set by NWP, I view this as lending some support to my belief that professional
development programs without an emphasis on content have the potential to increase
engagement in at least some areas. And although the samples are not matched or contemporary,
the CTT respondents do appear to be equally or more engaged on all three subscales compared to
the normative sample of the MBI and four other contemporary studies. Some questions that arose
include whether or not the cause preceded the effect, what the level of engagement on each of the
MBI subscales was for respondents before their participation in the programs, and whether proxy
variables and/or omitted variables may be confounding the results. I have described a potential
follow-up study that could help to answer these and other questions.
It is important to point out that both PD programs being studied here are of high quality
and clear value to their participants in a number of ways. In the crush of numbers and effect sizes
and control groups, this can sometimes get lost. As these NWP participants said, “What I’ve
learned about being a better teacher of writing (in all subject areas) has made me look forward to
each new day and year” (Elementary, 11-15 years’ experience, participated in 1989), “The
Writing Project provided a network of educators, professional development opportunities,
resources for implementing my ideas at my school, continuous learning and creativity. All of

Geil
171
these inspired my teaching for over 25 years” (Secondary, 6-10 years’ experience, participated in
1983), and “Participating in the Summer Institute provided me with deeper satisfaction about
teaching than any other professional development training I have been involved with”
(Elementary, 11-15 years’ experience, participated in 2008).
The participants in CTT are equally appreciative, as these remarks show:
“The CTT retreat series was one of the greatest transformational experiences in my life”
(Elementary, 11-15 years’ experience, participated in 1999), “To become a member of a
community of teachers who learn how to open our hearts to each other, sharing heartaches,
disappointments, tears, concerns, delights, laughter, triumphs, and the small sorrows and joys of
daily life is to receive support, understanding, and encouragement I have found in no other
community” (Elementary, 21-25 years’ experience, participated in 2008), “Courage work has
both energized me and made me relax again in the classroom, and this past school year is the
best, most successful and satisfying year I have ever had in 16 years of teaching. My connections
with students were authentic and lasting, and their understanding of the subject matter was better
as a result” (Secondary, 16-20 years’ experience, participated in 2008), “The CTT addresses an
important aspect of teaching that a grad school/certification program doesn’t address – the
psychological and emotional element of this work. To be an effective teacher, one MUST attend
to the inner life/soul, and the CTT program helped me to understand and nurture this aspect of
my professional life” (Elementary, 6-10 years’ experience, participated in 2005), and “My
Courage to Teach retreat experience 13 years ago informs my way of being a teacher to this
day…No other inservice I have ever attended has been so powerful or so long lasting in terms of
its benefit to me and my relationship with my students” (Middle school, 16-20 years’ experience,
participated in 1996).

Geil
172
As these comments make abundantly clear, participation in either one of these two
professional development programs is something of great value to these teachers, their students,
and the schools and communities in which they work. It is my hope that both will find ways to
weather the difficult financial times in which we find ourselves and continue to make a
difference in teachers’ lives.
Geil
173
REFERENCES
Achinstein, B., Ogawa, R. T., Sexton, D., & Freitas, C. (2010). Retaining Teachers of Color: A
Pressing Problem and a Potential Strategy for ''Hard-to-Staff'' Schools. Review of Educational Research, 80(1), 71-107.
Alliance for Excellent Education. (2005). Teacher Attrition: A Costly Loss to the Nation and to the States. Washington, DC: Alliance for Excellent Education.
American Council of Education. (1999). To Touch the Future: Transforming the Way Teachers Are Taught. Washington, D.C.: American Council of Education.
American Council of Education. (2002). Touching the Future: Final Report - Presidents' Task Force on Teacher Education. Washington, D.C.: American Council of Education.
American Heritage Dictionary. (2001). The American Heritage Dictionary, Fourth Edition. New York, NY: Dell Publishing.
Bakker, A. B. (2005). Flow among music teachers and their students: The crossover of peak experiences. Journal of Vocational Behavior, 66, 26-44.
Belcastro, P. A., Gold, R. S., & Hays, L. C. (1983). Maslach Burnout Inventory: Factor structures for samples of teachers. Psychological Reports, 53, 364-366.
Bibou-Nakou, I., Stogiannidou, A., & Kiosseoglou, G. (1999). The Relation Between Teacher Burnout and Teachers' Attributions and Practices Regarding School Behaviour Problems. School Psychology International, 20, 209-217.
Bickart, B., & Schmittlein, D. (1999). The Distribution of Survey Contact and Participation in the United States: Constructing a Survey-Based Estimate. Journal of Marketing Research, XXXVI(May), 286-294.
Blau, S. (1999). The Only New Thing Under the Sun: 25 Years of the National Writing Project. The National Writing Project Quarterly(Summer).
Borman, G. D., & Dowling, N. M. (2008). Teacher Attrition and Retention: A Meta-Analytic and Narrative Review of the Research. Review of Educational Research, 78(3), 367-409.
Brackett, M. A., Palomera, R., Mojsa-Kaja, J., Reyes, M. R., & Salovey, P. (2010). Emotion-Regulation Ability, Burnout, and Job Satisfaction Among British Secondary-School Teachers. Psychology in the Schools, 47(4), 406-417.
Briggs, D. C., & Wiley, E. (2008). Causes and Effects. In K. E. Ryan & L. A. Shepard (Eds.), The Future of Test-Based Educational Accountability. New York: Routledge.

Geil
174
Brouwers, A. H., & Tomic, W. (2000). A longitudinal study of teacher burnout and perceived self-efficacy in classroom management. Teaching & Teacher Education, 16, 239-253.
Bryk, A. S., & Schneider, B. (2002). Trust in Schools: A Core Resource for Improvement. New York: Russell Sage Foundation.
Byrne, B. M. (1991). Burnout: Investigating the Impact of Background Variables for Elementary, Intermediate, Secondary, and University Educators. Teaching and Teacher Education, 7(2), 197-209.
Byrne, B. M. (1999). The Nomological Network of Teacher Burnout: A Literature Review and Empirically Validated Model. In R. Vandenberghe & A. M. Huberman (Eds.), Understanding and Preventing Teacher Burnout (pp. 15-37). Cambridge: Cambridge University Press.
Byrnes, K., & Borko, H. (2008). Mapping Transformative Professional Development Programs and Research. Report to the Fetzer Institute, Kalamazoo, MI. Boulder: University of Colorado at Boulder.
Caliendo, M., & Kopeinig, S. (2008). Some Practical Guidance for the Implementation of Propensity Score Matching. Journal of Economic Surveys, 22(1), 31-72.
Campbell, D. T., & Stanley, J. C. (1963). Experimental and Quasi-Experimental Designs for Research on Teaching. In N. L. Gage (Ed.), Handbook of Research on Teaching. Chicago: Rand McNally. (Reprinted as Experimental and Quasi-Experimental Design for Research. Chicago: Rand McNally, 1966).
Carroll, T., & Fulton, K. (2004). The True Cost of Teacher Turnover. Threshold: Exploring the Future of Education, Spring, 16-17.
Center for Courage and Renewal. (2006a). Frequently Asked Questions. Retrieved October 19, 2006, from www.couragerenewal.org
Center for Courage and Renewal. (2006b). History of Courage to Teach and CCR. Retrieved October 19, 2006, from www.couragerenewal.org
Center for Courage and Renewal. (n.d.-a). Circle of Trust Facilitators. Retrieved January 10, 2011, from http://www.couragerenewal.org/about/facilitators
Center for Courage and Renewal. (n.d.-b). Courage to Teach. Retrieved January 10, 2011, from http://www.couragerenewal.org/programs/courage-to-teach
Chadsey, T. (2010). Personal e-mail communication with Kimberly Geil on December 16-17, 2010.
Cherniss, C. (1995). Beyond Burnout - Helping Teachers, Nurses, Therapists, and Lawyers Recover from Stress and Disillusionment. New York: Routledge.

Geil
175
Choy, S., Chen, X., & Bugarin, R. (2006). Teacher Professional Development in 1999-2000: What Teachers, Principals, and District Staff Report. Washington, D.C.: National Center for Education Statistics, U.S. Department of Education.
Coalition of Essential Schools. (2006, August 21). About the Coalition of Essential Schools. Retrieved May 20, 2007, from www.essentialschools.org
Cohen, J. (1969). Statistical power analysis for the behaviorial sciences. Hillsdale, NJ: Erlbaum.
Cohen, J. (1992). A Power Primer. Psychological Bulletin, 112(1), 155-159.
Cohn, M. M., & Kottkamp, R. B. (1993). Teachers: The Missing Voice in Education. New York: State University of New York Press.
Cook, C., Heath, F., & Thompson, R. L. (2000). A Meta-Analysis of Response Rates in Web- or Internet-Based Surveys. Educational and Psychological Measurement, 60(6), 821-836.
Coopersmith, J. (2009). Characteristics of Public, Private, and Bureau of Indian Education Elementary and Secondary School Teachers in the United States: Results From the 2007-08 Schools and Staffing Survey (NCES 2009-324). Washington, D.C.: National Center for Education Statistics, Institute of Education Sciences, U.S. Department of Education.
Darling-Hammond, L. (2006a). Powerful Teacher Education - Lessons from Exemplary Programs: Jossey-Bass.
Darling-Hammond, L. (2006b). Securing the Right to Learn: Policy and Practice for Powerful Teaching and Learning. Educational Researcher, 35(7), 13-24.
Darling-Hammond, L., & Youngs, P. (2002). Defining “Highly Qualified Teachers”: What Does “Scientifically-Based Research” Actually Tell Us? Educational Researcher, 31(9), 13-25.
Dawid, A. P. (2000). Causal inference without counterfactuals. Journal of American Statistical Association, 95(450), 407-448.
Day, C., Stobart, G., Sammons, P., Kington, A., Gu, Q., Smees, R., et al. (2006). Variations in Teachers’ Work, Lives and Effectiveness. England: Department for Education and Skills (Research Report No. 743).
Dehejia, R. H., & Wahba, S. (2002). Propensity Score-Matching Methods for Nonexperimental Causal Studies. The Review of Economics and Statistics, 84(1), 151-161.
DeHeus, P., & Diekstra, R. F. W. (1999). Do Teachers Burn Out More Easily? A Comparison of Teachers with Other Social Professions on Work Stress and Burnout Symptoms. In R. Vandenberghe & A. M. Huberman (Eds.), Understanding and Preventing Teacher Burnout (pp. 269-284). Cambridge: Cambridge University Press.

Geil
176
Desimone, L. M. (2009). Improving Impact Studies of Teachers' Professional Development: Toward Better Conceptualizations and Measures. Educational Researcher, 38(3), 181-199.
Desimone, L. M., Porter, A. C., Garet, M. S., Yoon, K. S., & Birman, B. F. (2002). Effects of Professional Development on Teachers' Instruction: Results from a Three-year Longitudinal Study. Educational Evaluation and Policy Analysis, 24(2), 81-112.
Dey, E. L. (1997). Working With Low Survey Response Rates: The Efficacy of Weighting Adjustments. Research in Higher Education, 38(2), 215-227.
Domingue, B., & Briggs, D. C. (2009). Using Linear Regression and Propensity Score Matching to Estimate the Effect of Coaching on the SAT. Multiple Linear Regression Viewpoints, 35(1), 12-29.
Elmore, R. F. (2002). Bridging the Gap between Standards and Achievement - The Imperative for Professional Development in Education (pp. 1-44). Washington, D.C.: Albert Shanker Institute.
Farber, B. A. (1983). Introduction: A Critical Perspective on Burnout. In B. A. Farber (Ed.), Stress and Burnout in the Human Service Professions (pp. 1-20). New York: Pergamon Press.
Farber, B. A. (1991). Crisis in Education - Stress and Burnout in the American Teacher. San Francisco: Jossey-Bass Inc.
Feiman-Nemser, S. (2001). From Preparation to Practice: Designing a Continuum to Strengthen and Sustain Teaching. Teachers College Record, 103(6), 1013-1055.
Fetzer Institute. (2005). Transformative Professional Development: The influence of emotional, spiritual, and personal development of educators on public education. Kalamazoo, MI: Fetzer Institute.
Field, A. (2005). Discovering Statistics Using SPSS (Second ed.). London: SAGE Publications Ltd.
Friedman, I. A. (1991). High- and Low-Burnout Schools: School Culture Aspects of Teacher Burnout. Journal of Educational Research, 84, 325-333.
Friedman, I. A. (2000). Burnout in Teachers: Shattered Dreams of Impeccable Professional Performance. Journal of Clinical Psychology, 56(5), 595-606.
Garet, M. S., Porter, A. C., Desimone, L., Birman, B. F., & Yoon, K. S. (2001). What Makes Professional Development Effective? Results From a National Sample of Teachers. American Educational Research Journal, 38(4), 915-945.
Gentleman, R., Ihaka, R., & R Core Development Team. (1993). The R Project for Statistical Computing. Retrieved October 15, 2010, from http://www.r-project.org/.

Geil
177
Gray, J. (2000). Teachers at the Center - A Memoir of the Early Years of the National Writing Project. Berkeley: National Writing Project.
Grayson, J. L., & Alvarez, H. K. (2008). School climate factors relating to teacher burnout: A mediator model. Teaching and Teacher Education, 24, 1349-1363.
Groves, R. M., Cialdini, R. B., & Couper, M. P. (1992). Understanding the Decision to Participate in a Survey. Public Opinion Quarterly, 56(4), 475-495.
Guarino, C. M., Santibanez, L., & Daley, G. A. (2006). Teacher Recruitment and Retention: A Review of the Recent Empirical Literature. Review of Educational Research, 76(2), 173-208.
Hakanen, J. J., Bakker, A. B., & Schaufeli, W. B. (2006). Burnout and work engagement among teachers. School Psychology International, 43(6), 495-513.
Hancock, C. B., & Scherff, L. (2010). Who Will Stay and Who Will Leave? Predicting Secondary English Teacher Attrition Risk. Journal of Teacher Education, 61(4), 328-338.
Hanushek, E. A., Kain, J. F., & Rivkin, S. G. (1998). Teachers, Schools, and Academic Achievement: NBER Working Paper No. W6691. Available at SSRN: http://ssrn.com/abstract=122569o. Document Number)
Hanushek, E. A., Kain, J. F., & Rivkin, S. G. (2001). Why Public Schools Lose Teachers. Cambridge, MA: National Bureau of Economic Research Working Paper No. 8599. Available at www.nber.org/papers/w8599.
Hargreaves, A. (1998). The Emotional Practice of Teaching. Teaching and Teacher Education, 14(8), 835-854.
Hawley, W. D., & Valli, L. (1999). The Essentials of Effective Professional Development: A new consensus. In L. Darling-Hammond & G. Sykes (Eds.), Teaching as the Learning Profession: Handbook of Policy and Practice (pp. 127-150). San Francisco: Jossey-Bass.
Henke, R. R., Chen, X., & Geis, S. (2000). Progress Through the Teacher Pipeline: 1992–93 College Graduates and Elementary/Secondary School Teaching as of 1997. Washington, D.C.: National Center for Education Statistics, U.S. Department of Education.
Ho, D. E., Imai, K., King, G., & Stuart, E. A. (2007). Matching as Nonparametric Preprocessing for Reducing Model Dependence in Parametric Causal Inference. Political Analysis(15), 199-236.
Ho, D. E., Imai, K., King, G., & Stuart, E. A. (2010). MatchIt: Nonparametric Preprocessing for Parametric Causal Inference: Available at: http://gking.harvard.edu/node/4355/rbuild_documentation/.

Geil
178
Hoffman, D., & Levak, B. A. (2003). Personalizing Schools. Educational Leadership, 61(1), 30-34.
Hogan, T. P., Benjamin, A., & Brezinski, K. L. (2000). Reliability methods: a note on the frequency of use of various types. Educational and Psychological Measurement, 60(4), 523-531.
Howell, D. C. (2002). Statistical Methods for Psychology (5th ed.). Pacific Grove, CA: Duxbury/Thomson Learning.
Huberman, A. M., & Vandenberghe, R. (1999). Introduction: Burnout and the Teaching Profession. In R. Vandenberghe & A. M. Huberman (Eds.), Understanding and Preventing Teacher Burnout (pp. 1-11). Cambridge: Cambridge University Press.
Hughes, R. E. (2001). Deciding to leave but staying: teacher burnout, precursors and turnover. International Journal of Human Resource Management, 12(2), 288-298.
Ingersoll, R. M. (2001). Teacher Turnover and Teacher Shortages: An Organizational Analysis. American Educational Research Journal, 38(3), 499-534.
Intrator, S. M. (2005). The Heart of a Teacher: Making the Connection between Teaching and Inner Life. Educating Children for Democracy(9), 12-16.
Intrator, S. M., & Kunzman, R. (2006). The Person in the Profession: Renewing Teacher Vitality through Professional Development. The Educational Forum, 71(Fall), 16-32.
Intrator, S. M., & Scribner, M. (1998). An Evaluation of the Courage to Teach Program. Bainbridge Island, WA: Center for Teacher Formation.
Intrator, S. M., & Scribner, M. (2000). Courage to Teach - Longitudinal Program Evaluation. Bainbridge Island, WA: Center for Teacher Formation.
Intrator, S. M., & Scribner, M. (2002). Evaluation of the 1999-2001 Courage to Teach Program - Courage to Teach New England. Bainbridge Island, WA: Center for Teacher Formation.
Iwanicki, E. F., & Schwab, R. L. (1981). A cross-validational study of the Maslach Burnout Inventory. Educational and Psychological Measurement, 41, 1167-1174.
Jackson, M., & Jackson, R. (2002). Courage to Teach: A Retreat Program of Personal and Professional Renewal for Educators. In S. M. Intrator (Ed.), Stories of The Courage to Teach: Honoring the Teacher's Heart (pp. 282-308). San Francisco: Jossey-Bass.
Jackson, S. E., & Maslach, C. (1982). After-effects of job-related stress: Families as victims. Journal of Occupational Behavior, 3, 63-77.
Jackson, S. E., Schwab, R. L., & Schuler, R. S. (1986). Toward an understanding of the burnout phenomenon. Journal of Applied Psychology, 71, 630-640.
Geil
179
Kahn, J. H., Schneider, K. T., Jenkins-Henkelman, T. M., & Moyle, L. L. (2006). Emotional social support and job burnout among high-school teachers: Is it all due to dispositional affectivity? Journal of Organizational Behavior, 27, 793-807.
Keigher, A. (2010). Teacher Attrition and Mobility: Results From the 2008-09 Teacher Follow--up Survey (NCES 2010-353). Washington, DC: National Center for Education Statistics, U.S. Department of Education. Retrieved from http://nces.ed.gov/pubsearch.
Krosnick, J. (1999). Survey Research. Annual Review of Psychology, 50, 537-567.
Lau, P. S. Y., Yuen, M. T., & Chen, R. M. C. (2005). Do Demographic Characteristics Make a Difference to Burnout Among Hong Kong Secondary School Teachers? Social Indicators Research, 71(1-3), 491-516.
Lee, R. T., & Ashforth, B. E. (1993). A longitudinal study of burnout among supervisors and managers: Comparisons between the Leiter and Maslach (1988) and Golembiewski et al. (1986) models. Organizational Behavior and Human Decision Processes, 14, 3-20.
Leiter, M. P. (1990). The impact of family and organizational resources on the development of burnout: A longitudinal study. Human Relations, 43, 1067-1083.
Leiter, M. P., & Durup, J. (1996). Work, home, and in-between: A longitudinal study of spillover. Journal of Applied Behavioral Science, 32, 29-47.
Leiter, M. P., & Maslach, C. (2005). A mediation model of job burnout. In A. S. G. Atoniou & C. L. Cooper (Eds.), Research companion to organizational health psychology (pp. 544-564). Cheltenham, United Kingdom: Edward Elgar.
LeMahieu, P., Fessahaie, S., Yang, K. M., Brown, R., & Friedrich, L. (2007). The National Writing Project Legacy Study. Berkeley, CA: National Writing Project. http://www.nwp.org/cs/public/print/resource/2411.
LeMahieu, P., Smith, M. A., & Hutchinson, J. (2008). The NWP Legacy: A Congressional Briefing. Berkeley, CA: National Writing Project. http://www.nwp.org/cs/public/print/doc/extranet/supportingthenwp.
Lieberman, A. (2000). Networks as Learning Communities: Shaping the Future of Teacher Development. Journal of Teacher Education, 51(3), 221-227.
Lieberman, A., & Wood, D. (2001). When Teachers Write: Of Networks and Learning. In Teachers Caught in the Action: Professional Development That Matters (pp. 174-187): Teachers College, Columbia University.
Lieberman, A., & Wood, D. (2003). Inside the National Writing Project: Connecting Network Learning and Classroom Teaching. New York: Teachers College Press.
Lieberman, A., & Wood, D. R. (2002). The National Writing Project. Educational Leadership, 59(6), 40-43.

Geil
180
Little, J. W. (1993). Teachers' Professional Development in a Climate of Educational Reform. Educational Evaluation and Policy Analysis, 15(2), 129-151.
Liu, X. S., & Ramsey, J. (2008). Teachers’ job satisfaction: Analyses of the Teacher Follow-up Survey in the United States for 2000–2001. Teaching and Teacher Education, 24, 1173–1184.
Lortie, D. (1975). Schoolteacher: A sociological study. Chicago: University of Chicago Press.
Lowenstein, L. (1991). Teacher Stress Leading to Burnout -- Its Prevention and Cure. Education Today, 41(2), 12-16.
Luekens, M. T., Lyter, D. M., & Fox, E. E. (2004). Teacher Attrition and Mobility - Results from the Teacher Follow-up Survey, 2000–01. Washington, D.C.: National Center for Education Statistics, U.S. Department of Education.
Marvel, J., Lyter, D. M., Peltola, P., Strizek, G. A., & Morton, B. A. (2007). Teacher Attrition and Mobility: Results from the 2004-05 Teacher Follow-up Survey (First Look). Washington, D.C.: National Center for Education Statistics, U.S. Department of Education.
Maslach, C. (1982/2003). Burnout - The Cost of Caring. Cambridge, MA: Malor Books.
Maslach, C. (1993). Burnout: A Multidimensional Perspective. In W. B. Schaufeli, C. Maslach & T. Marek (Eds.), Professional Burnout: Recent Developments in Theory and Research (pp. 19-32). Washington, D.C.: Taylor & Francis.
Maslach, C. (1999). Progress in Understanding Teacher Burnout. In R. Vandenberghe & A. M. Huberman (Eds.), Understanding and Preventing Teacher Burnout (pp. 211-222). Cambridge: Cambridge University Press.
Maslach, C. (2003). Job Burnout: New Directions in Research and Intervention. Current Directions in Psychological Science, 12(5), 189-192.
Maslach, C., & Jackson, S. E. (1979). Burned-out cops and their families. Psychology Today, 12(12), 59-62.
Maslach, C., & Jackson, S. E. (1981). The Measurement of Experienced Burnout. Journal of Occupational Behavior, 2, 99-113.
Maslach, C., & Jackson, S. E. (1984). Patterns of burnout among a national sample of public contact workers. Journal of Health and Human Resources Administration, 7, 189-212.
Maslach, C., Jackson, S. E., & Leiter, M. P. (1996). Maslach Burnout Inventory Manual (Third ed.). Mountain View: CPP, Inc.
Maslach, C., Jackson, S. E., & Schwab, R. L. (1986). Maslach Burnout Inventory-Educators Survey (MBI-ES). Mountain View: CPP, Inc. All rights reserved.
Geil
181
Maslach, C., & Leiter, M. P. (1999). Teacher Burnout: A Research Agenda. In R. Vandenberghe & A. M. Huberman (Eds.), Understanding and Preventing Teacher Burnout (pp. 295-303). Cambridge: Cambridge University Press.
Maslach, C., & Leiter, M. P. (2008). Early Predictors of Job Burnout and Engagement. Journal of Applied Psychology, 93(3), 498-512.
Maslach, C., Schaufeli, W. B., & Leiter, M. P. (2001). Job Burnout. Annual Review of Psychology, 52, 397-422.
McCarthy, C. J., Lambert, R. G., O'Donnell, M., & Melendres, L. T. (2009). The Relation of Elementary Teachers’ Experience, Stress, and Coping Resources to Burnout Symptoms. The Elementary School Journal, 109(3), 282-300.
McMahon, L. G. (2003). Rekindling the Spirit to Teach: A Qualitative Study of the Personal and Professional Renewal of Teachers. Unpublished doctoral dissertation, Gonzaga University, Spokane, WA.
Mearns, J., & Cain, J. E. (2003). Relationships Between Teachers' Occupational Stress and Their Burnout and Distress: Roles of Coping and Negative Mood Regulation Expectancies. Anxiety, Stress, and Coping, 16, 71-82.
Merriam-Webster. (n.d.). Merriam-Webster Online Dictionary. Retrieved January 10, 2011, from http://www.merriam-webster.com/dictionary/transformative.
Moore Johnson, S., Birkeland, S., Kardos, S. M., Kauffman, D., Liu, E., & Peske, H. G. (2001). Retaining the Next Generation of Teachers: The Importance of School-Based Support. Harvard Educational Letter(July/August 2001).
Morgan, S. L. (2001). Counterfactuals, Causal Effect Heterogeneity, and the Catholic School Effect on Learning. Sociology of Education, 74(4), 341-374.
National Center for Education Statistics. (2004-2005). Percentage of public school teacher stayers, movers, and leavers who strongly or somewhat agreed with statements about their 2003–04 base year school and 2004–05 current school. Washington, D.C.: U.S. Department of Education. Retrieved from http://nces.ed.gov/surveys/sass/tables/tfs_2005_04.asp.
National Center for Education Statistics. (2010). Schools and Staffing Survey (SASS). Retrieved December 18, 2010, from http://nces.ed.gov/surveys/sass/
National Education Association. (2003a). Meeting the Challenges of Recruitment and Retention: A Guidebook on Promising Strategies to Recruit and Retain Qualified and Diverse Teachers: National Education Association.
National Education Association. (2003b). Teacher Shortage Fact Sheet. Retrieved November, 2005, from www.nea.org/teachershortage/03shortagefactsheet.html
Geil
182
National Education Association. (2003c). The Status of the American Public School Teacher 2000-2001. Washington, D.C.: National Education Association.
National Writing Project. (2005). 2005 Annual Report - National Writing Project - Helping Teachers Teach Writing. Berkeley: National Writing Project.
National Writing Project. (2006a). 2006 Annual Report - National Writing Project. Berkeley: National Writing Project.
National Writing Project. (2006b). Local Site Core Programs. Retrieved October 16, 2006, from www.writingproject.org/Programs/localsites/
National Writing Project. (2008). 2008 Annual Report - National Writing Project. Berkeley: National Writing Project.
National Writing Project. (2010). Writing Project Professional Development Continues to Yield Gains in Student Writing Achievement, NWP Research Brief No.2. Berkeley, CA: National Writing Project.
No Child Left Behind Act. (2001). No Child Left Behind Act of 2001. Public Law 107-110. 107th U.S. Congress. Washington, DC: Government Printing Office.
Nollet, K. (2009). Teacher Transformations - A Phenomenological Study on the Effect of Courage to Teach on Experienced Teachers' Growth and Development. Unpublished doctoral dissertation, Lesley University.
Ozer, N., & Beycioglu, K. (2010). The relationship between teacher professional development and burnout. Procedia Social and Behavioral Sciences, 2, 4928–4932.
Palmer, P. (1992). Reflections on a Program for "The Formation of Teachers" - An occasional paper of the Fetzer Institute. Retrieved Oct. 20, 2005, from http://www.teacherformation.org/html/rr/reflections.cfm?dsp_mode=print
Palmer, P. (1998). The Courage to Teach - Exploring the Inner Landscape of a Teacher's Life. San Francisco: Jossey-Bass.
Palmer, P., Jackson, M., Jackson, R., & Sluyter, D. (2001). The Courage to Teach: A Program for Teacher Renewal. In L. Lantieri (Ed.), Schools with Spirit - Nurturing the Inner Lives of Children and Teachers (pp. 132-147). Boston: Beacon Press.
Patrick, B. C., Hisley, J., & Kempler, T. (2000). "What’s everybody so excited about?": The effects of teacher enthusiasm on student intrinsic motivation and vitality. Journal of Experimental Education, 68(3), 217-236.
Pines, A. M. (2002). Teacher Burnout: a psychodynamic existential perspective. Teachers and Teaching: theory and practice, 8(2), 121-140.

Geil
183
Pines, A. M., Aronson, E., & Kafry, D. (1981). Burnout - from tedium to personal growth. New York: The Free Press.
Porter, A. C., Garet, M. S., Desimone, L., Yoon, K. S., & Birman, B. F. (2000). Does Professional Development Change Teaching Practice? Results From a Three-Year Study - Executive Summary. Washington, D.C.: U.S. Department of Education, Office of the Undersecretary, Planning and Evaluation Service, Elementary and Secondary Education Division.
Poutiatine, M. I. (2002). Data Analysis of Courage to Teach Teacher Surveys: Fall 2001. Bainbridge Island, WA: Center for Teacher Formation (now the Center for Courage and Renewal).
Poutiatine, M. I. (2003a). Data Analysis of Teachers Pre-Participation Surveys: Fall 2002. Bainbridge Island, WA: Center for Teacher Formation (now the Center for Courage and Renewal).
Poutiatine, M. I. (2003b). Data Analysis of Courage to Teach Teachers' Post Participation Survey: 2001-2003 - Washington State Teachers' Group A+B. Bainbridge Island, WA: Center for Teacher Formation (now the Center for Courage and Renewal).
Poutiatine, M. I. (2003c). Washington State Courage to Teach Comparison Report: Pre-Participation Surveys Teachers Groups A+B 2001 and 2002, Leaders Groups C 2001 and 2002. Bainbridge Island, WA: Center for Teacher Formation (now the Center for Courage and Renewal).
Poutiatine, M. I. (2005). The Role of Identity and Integrity in Teacher Development: Towards A Grounded Theory Of Teacher Formation. Unpublished doctoral dissertation, Gonzaga University, Spokane, WA.
Prentice, D. A., & Miller, D. T. (1992). When Small Effects Are Impressive. Psychological Bulletin, 112(1), 160-164.
Provasnik, S., & Dorfman, S. (2005). Mobility in the Teacher Workforce - Findings from The Condition of Education 2005. Washington, D.C.: National Center for Education Statistics, U.S. Department of Education.
Public Education Network. (2003). The Voice of the New Teacher. Washington, DC: Public Education Network.
Public Education Network, & The Finance Project. (2004). Teacher Professional Development: A Primer for Parents & Community Members. Washington, DC: Public Education Network & The Finance Project.
Rivkin, S. G., Hanushek, E. A., & Kain, J. F. (2005). Teachers, Schools, and Academic Achievement. Econometrica, 73(2), 417-458.

Geil
184
Rosenbaum, P. R., & Rubin, D. B. (1983). The central role of the propensity score in observational studies for causal effects. Biometrika, 70(1), 41-55.
Rosenbaum, P. R., & Rubin, D. B. (1985). Constructing a Control Group Using Multivariate Matched Sampling Methods That Incorporate the Propensity Score. The American Statistician, 39(1), 33-38.
Rubin, D. B. (2001). Using Propensity Scores to Help Design Observational Studies: Application to the Tobacco Litigation. Health Services & Outcomes Research Methodology, 2, 169-188.
Rubin, D. B. (2007). The design versus the analysis of observational studies for causal effects: Parallels with the design of randomized trials. Statistics in Medicine, 26, 20-36.
Russell, D. W., Altmaier, E., & Van Velzen, D. (1987). Job-Related Stress, Social Support, and Burnout Among Classroom Teachers. Journal of Applied Psychology, 72(2), 269-274.
Sakharov, M., & Farber, B. A. (1983). A Critical Study of Burnout in Teachers. In B. A. Farber (Ed.), Stress and Burnout in the Human Service Professions (pp. 65-81). New York: Pergamon Press.
Scholastic Inc. & the Bill and Melinda Gates Foundation. (2010). Primary Sources: America’s Teachers on America’s Schools. New York, NY: Scholastic Inc.
Schutte, N., Toppinen, S., Kalimo, R., & Schaufeli, W. B. (2000). The factorial validity of the Maslach Burnout Inventory-General Survey (MBI-GS) across occupational groups and nations. Journal of Occupational and Organizational Psychology, 73, 53-66.
Shadish, W. R., Cook, T. D., & Campbell, D. T. (2002). Experimental and Quasi-Experimental Designs for Generalized Causal Inference. Boston: Houghton Mifflin Company.
Sheehan, K. (2001). E-mail Survey Response Rates: A Review. Journal of Computer-Mediated Communication, 6(2).
Simone, G. (2004). Professional Development as a Process of Renewal: Case Studies of the Courage to Teach Program. Unpublished doctoral dissertation, University of Colorado at Boulder, Boulder, CO.
Sizer, T. R. (1999). No two are quite alike. Educational Leadership, 57, 6-11.
St. John, M., & Stokes, L. (2008). Investing in the Improvement of Education: Lessons to be Learned from the National Writing Project: Inverness Research Associates.
Stokes, L., & St. John, M. (2008). Teachers' Assessments Of Professional Development Quality, Value, And Benefits: Results From Seven Annual Surveys Of Participants In National Writing Project Summer Institutes: Inverness Research Associates.

Geil
185
Stuart, E. A., & Green, K. M. (2008). Using Full Matching to Estimate Causal Effects in Nonexperimental Studies: Examining the Relationship Between Adolescent Marijuana Use and Adult Outcomes. Developmental Psychology, 44(2), 395-406.
Thompson, B. (2003). Understanding Reliability and Coefficient alpha, Really. In B. Thompson (Ed.), In Score Reliability. CA: SAGE Publications.
Troman, G. (2000). Teacher Stress in the Low-Trust Society. British Journal of Sociology of Education, 21(3), 331-352.
USDA Food and Nutrition Service. (July 21, 2010). Applying for Free and Reduced Price School Meals. Retrieved January 12, 2011, from http://www.fns.usda.gov/cnd/frp/frp.process.htm
USDA Food and Nutrition Service. (March 27, 2009). Child Nutrition Program - Income Eligibility Guidelines. Federal Register, Vol. 74, No. 58. Retrieved January 12, 2011, from http://www.fns.usda.gov/cnd/Governance/notices/iegs/IEGs09-10.pdf
Wayne, A. J., Yoon, K. S., Zhu, P., Cronen, S., & Garet, M. S. (2008). Experimenting With Teacher Professional Development: Motives and Methods. Educational Researcher, 37(8), 469-479.
Whitney, A. (2008). Teacher Transformation in the National Writing Project. Research in the Teaching of English, 43(2), 144-187.
Wilkinson, L., & the APA Task Force on Statistical Inference. (1999). Statistical methods in psychology journals: Guidelines and explanations. American Psychologist, 54(8), 594-604.
Winship, C., & Morgan, S. L. (1999). The Estimation of Causal Effects from Observational Data. Annual Review of Sociology, 25, 659-707.
Wood, T., & McCarthy, C. (2002). Understanding and Preventing Teacher Burnout. Washington, D.C.: ERIC Clearinghouse on Teaching and Teacher Education.
Zembylas, M. (2003). Caring for Teacher Emotion: Reflections on Teacher Self-Development. Studies in Philosophy and Education, 22, 103-125.
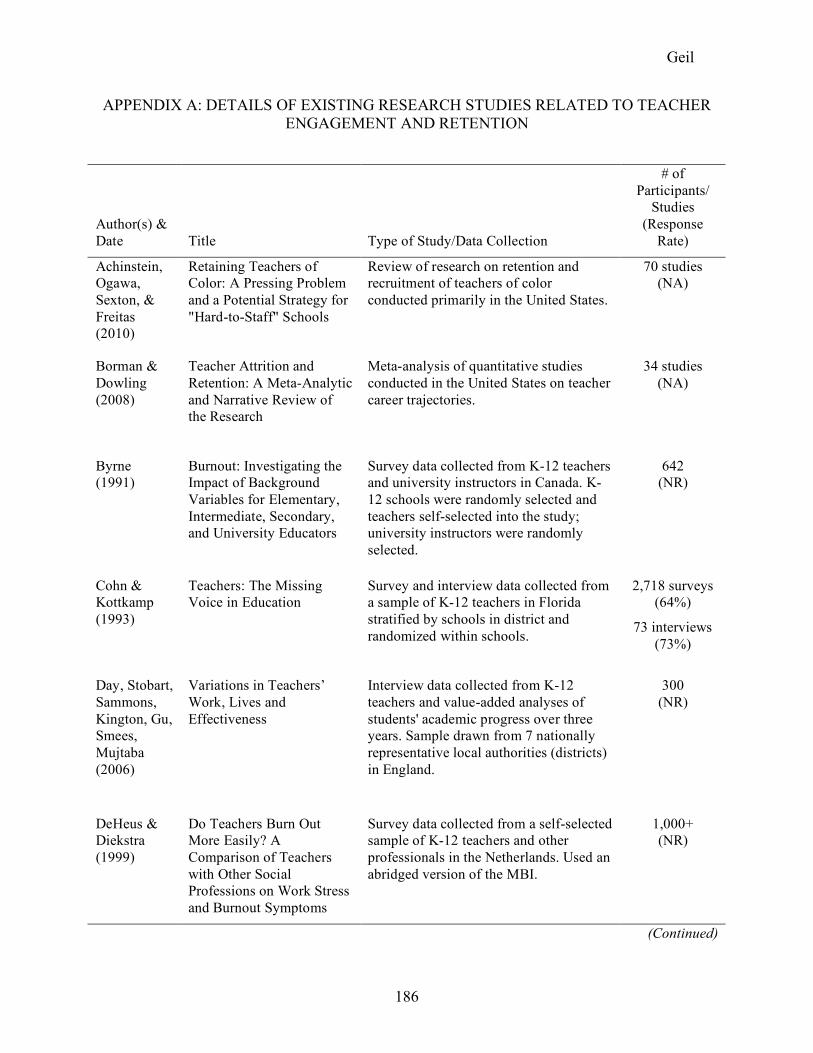
Geil
186
APPENDIX A: DETAILS OF EXISTING RESEARCH STUDIES RELATED TO TEACHER ENGAGEMENT AND RETENTION
Author(s) & Date Title Type of Study/Data Collection
# of Participants/
Studies (Response
Rate)
Achinstein, Ogawa, Sexton, & Freitas (2010)
Retaining Teachers of Color: A Pressing Problem and a Potential Strategy for "Hard-to-Staff" Schools
Review of research on retention and recruitment of teachers of color conducted primarily in the United States.
70 studies (NA)
Borman & Dowling (2008)
Teacher Attrition and Retention: A Meta-Analytic and Narrative Review of the Research
Meta-analysis of quantitative studies conducted in the United States on teacher career trajectories.
34 studies (NA)
Byrne (1991)
Burnout: Investigating the Impact of Background Variables for Elementary, Intermediate, Secondary, and University Educators
Survey data collected from K-12 teachers and university instructors in Canada. K-12 schools were randomly selected and teachers self-selected into the study; university instructors were randomly selected.
642 (NR)
Cohn & Kottkamp (1993)
Teachers: The Missing Voice in Education
Survey and interview data collected from a sample of K-12 teachers in Florida stratified by schools in district and randomized within schools.
2,718 surveys (64%)
73 interviews (73%)
Day, Stobart, Sammons, Kington, Gu, Smees, Mujtaba (2006)
Variations in Teachers’ Work, Lives and Effectiveness
Interview data collected from K-12 teachers and value-added analyses of students' academic progress over three years. Sample drawn from 7 nationally representative local authorities (districts) in England.
300 (NR)
DeHeus & Diekstra (1999)
Do Teachers Burn Out More Easily? A Comparison of Teachers with Other Social Professions on Work Stress and Burnout Symptoms
Survey data collected from a self-selected sample of K-12 teachers and other professionals in the Netherlands. Used an abridged version of the MBI.
1,000+ (NR)
(Continued)

Geil
187
Author(s) & Date Title Type of Study/Data Collection
# of Participants/
Studies (Response
Rate)
Friedman (1991)
High- and Low-Burnout Schools: School Culture Aspects of Teacher Burnout
Interviews and observations of 5 randomly selected teachers from 12 extremely "high" or "low" burnout schools in Israel, as determined by a modified version of the MBI administered to 1,597 randomly selected teachers in 78 elementary schools.
60 (NR)
Grayson & Alvarez (2008)
School Climate Factors Relating to Teacher Burnout: A Mediator Model
Survey data collected from a self-selected sample of K-12 teachers in 17 rural schools in Ohio; principals of the schools self-selected their school into the study.
320 (60%)
Guarino, Santibanez, & Daley (2006)
Teacher Recruitment and Retention: A Review of the Recent Empirical Literature
Critical review of quantitative and qualitative studies on retention and recruitment of teachers utilizing data collected between 1990 and 2004 and conducted in the United States.
46 studies (NA)
Hakanen, Bakker, & Schaufeli (2006)
Burnout and Work Engagement Among Teachers
Survey data collected from K-12 and vocational school teachers. All teachers in the education department of Helsinki, Finland were sent the survey.
2,038 (52%)
Hancock & Scherff (2010)
Who Will Stay and Who Will Leave? Predicting Secondary English Teacher Attrition Risk
U.S. Department of Education’s National Center for Education Statistics (NCES) 2003-04 Schools and Staffing Survey data for all the full-time English, composition, and language arts teachers who participated in it.
4,520 (NR)
Hanushek, Kain, & Rivkin (2001)
Why Public Schools Lose Teachers
Matched student/teacher panel data from all Texas public elementary schools.
376,078 (NR)
Henke, Chen, & Geis (2000)
Progress Through the Teacher Pipeline: 1992–93 College Graduates and Elementary/Secondary School Teaching as of 1997
Respondents to the NCES Baccalaureate & Beyond Survey administered in 1993 (the year respondents graduated from college) who also completed follow-up surveys in 1994 and 1997.
9,274 (83%)
(Continued)

Geil
188
Author(s) & Date Title Type of Study/Data Collection
# of Participants/
Studies (Response
Rate)
Ingersoll (2001)
Teacher Turnover and Teacher Shortages: An Organizational Analysis
Data collected from the K-12 teachers who responded to the NCES 1991-1992 Teacher Follow-Up Survey and 1990-1991 Schools and Staffing Survey.
6,733 (NR)
Kahn, Schneider, Jenkins-Henkelman, & Moyle (2006)
Emotional Social Support and Job Burnout Among High-School Teachers: Is It All Due To Dispositional Affectivity?
Secondary school teachers recruited through teacher and educator listservs to participate in a web survey on high school teachers' perceptions of their jobs. Respondents represented 41 states in the U.S.
339 (NA)
Keigher (2010)
Teacher Attrition and Mobility: Results From the 2008-09 Teacher Follow-up Survey (First Look)
Data collected from the NCES 2008-2009 Teacher Follow-Up Survey. Sample drawn from the 44,200 K-12 teachers who completed interviews for the 2007-2008 SASS. All non-respondents contacted personally or by phone.
4,750 (86%)
Lau, Yuen, & Chen (2005)
Do Demographic Characteristics Make a Difference to Burnout Among Hong Kong Secondary School Teachers?
Survey data collected from a randomly selected sample of secondary teachers in 45 schools in Hong Kong.
1,797 (80%)
Liu & Ramsey (2008)
Teachers' Job Satisfaction: Analyses of the Teacher Follow-Up Survey in the United States for 2000-2001
Analysis of data collected on the NCES 2000-2001 Teacher Follow-Up Survey from all K-12 teachers who voluntarily chose to leave teaching prior to reaching retirement.
4,952 (NR)
Lortie (1975)
Schoolteacher: A Sociological Study
Interview data collected from K-12 teachers randomly chosen from purposefully selected schools in New England. Survey administered to all professional staff in Dade County, Florida present that day.
94 interviews (94%)
6,539 surveys (NR)
(Continued)

Geil
189
Author(s) & Date Title Type of Study/Data Collection
# of Participants/
Studies (Response
Rate)
Luekens, Lyter, & Fox (2004)
Teacher Attrition and Mobility - Results from the Teacher Follow-up Survey, 2000–01
Data collected from the NCES 2000-2001 Teacher Follow-Up Survey. Sample drawn from the 50,000+ K-12 teachers who completed interviews for the 1999-2000 SASS.
8,400~ (90%)
Marvel, Lyter, Peltola, Strizek, & Morton (2007)
Teacher Attrition and Mobility: Results from the 2004-05 Teacher Follow-up Survey (First Look)
Data collected from the NCES 2004-05 Teacher Follow-Up Survey. Sample drawn from the 51,748 K-12 teachers who completed interviews for the 2003-04 SASS. All non-respondents contacted personally or by phone.
7,429 (92%)
McCarthy, Lambert, O'Donnell, & Melendres (2009)
The Relation of Elementary Teachers’ Experience, Stress, and Coping Resources to Burnout Symptoms
Survey data collected from a convenience sample of elementary school teachers from 13 schools in three adjacent metropolitan counties in the southeastern United States over a period of two academic years.
451 (78%)
Mearns & Cain (2003)
Relationships Between Teachers' Occupational Stress and Their Burnout and Distress: Roles of Coping and Negative Mood Regulation Expectancies
Survey data collected from a self-selected sample of K-12 teachers at 6 small- to medium-sized schools in southern California; no information provided on how schools were selected.
86 (58%)
Ozer & Beycioglu (2010)
The Relationship Between Teacher Professional Development and Burnout
Survey data collected from elementary school teachers in Turkey; no information provided about how sample was selected.
144 (NR)
Russell, Altmaier, & Van Velzen (1987)
Job-Related Stress, Social Support, and Burnout Among Classroom Teachers
Mail survey data collected from a stratified random sample of public K-12 teachers in Iowa.
316 (53%)
Scholastic & Gates (2010)
Primary Sources: America’s Teachers on America’s Schools
Phone and online survey data collected from K-12 public school teachers in the United States selected by Harris Interactive and attempting to include the best and broadest representation of teachers.
40,490 (NR)
Note. NA=not applicable; NR=not reported

Geil
190
APPENDIX B: RECRUITMENT E-MAIL TO COURAGE TO TEACH FACILITATORS AND ALUMNI
Dear Courage & Renewal colleagues: I am pleased to introduce Kimberly Geil, a doctoral student of Dan Liston’s in the School of Education at the University of Colorado at Boulder, and to ask you to participate in her research by passing on her request to teachers who’ve been in a Courage to Teach series. Dan is a Courage & Renewal facilitator in Colorado. Kim attended his Courage to Teach® Sampler Retreat in 2004. That experience has helped focus her research interests, and for her dissertation she is researching teacher engagement and retention, specifically as it relates to professional development that concentrates on the personal, relationship side of teaching. Through an online survey, she is gathering data on teachers’ level of engagement with their craft. As you know, there is a need for more empirical research on programs such as Courage to Teach, and we believe that her work has the potential to provide some valuable insights. We would like to support her in this research effort, and are asking for your help in forwarding information about the survey to your Courage to Teach alumni and gathering a few pieces of information for the study. Your participation is very important to the success of this research, as the validity of claims rests in part upon the number of Courage to Teach alumni reached. Below you will find her letter asking you to invite your Courage to Teach Alumni to participate. Also below (and attached) is a letter from Kim that can be passed on to your CTT alums. We hope that you will be as enthusiastic about this research project as we are, and encourage your alumni (and you, too!) to take part. With gratitude and best wishes, Terry Chadsey Associate Director Center for Courage & Renewal
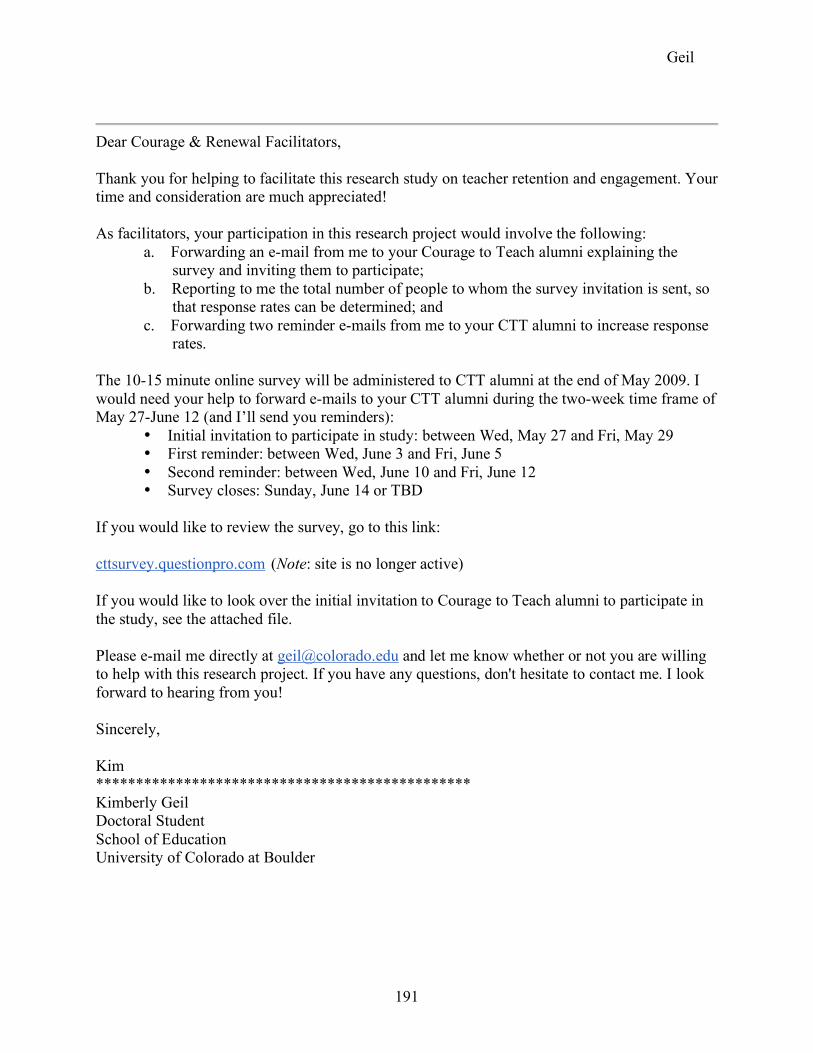
Geil
191
Dear Courage & Renewal Facilitators, Thank you for helping to facilitate this research study on teacher retention and engagement. Your time and consideration are much appreciated! As facilitators, your participation in this research project would involve the following:
a. Forwarding an e-mail from me to your Courage to Teach alumni explaining the survey and inviting them to participate;
b. Reporting to me the total number of people to whom the survey invitation is sent, so that response rates can be determined; and
c. Forwarding two reminder e-mails from me to your CTT alumni to increase response rates.
The 10-15 minute online survey will be administered to CTT alumni at the end of May 2009. I would need your help to forward e-mails to your CTT alumni during the two-week time frame of May 27-June 12 (and I’ll send you reminders):
• Initial invitation to participate in study: between Wed, May 27 and Fri, May 29 • First reminder: between Wed, June 3 and Fri, June 5 • Second reminder: between Wed, June 10 and Fri, June 12 • Survey closes: Sunday, June 14 or TBD
If you would like to review the survey, go to this link: cttsurvey.questionpro.com (Note: site is no longer active) If you would like to look over the initial invitation to Courage to Teach alumni to participate in the study, see the attached file. Please e-mail me directly at [email protected] and let me know whether or not you are willing to help with this research project. If you have any questions, don't hesitate to contact me. I look forward to hearing from you! Sincerely, Kim *********************************************** Kimberly Geil Doctoral Student School of Education University of Colorado at Boulder

Geil
192
[Note to CTT Facilitators: Below is a short introduction I have written up for you to send directly to your CTT alumni. You may send it as is with your name(s) at the bottom, or feel free to change or add to it however you’d like. Please include with it the introduction to the study below from me that explains the project a little bit more and includes the survey link. Thank you!] Subject: Teacher Engagement & Retention Study Dear Courage to Teach alumni: We are writing to request your help with a research project that we believe has the potential to provide some valuable insights about Courage to Teach. The study is being conducted by Kimberly Geil, a doctoral student of Dan Liston and Hilda Borko at the University of Colorado at Boulder, School of Education. Dan is a Courage & Renewal facilitator in Colorado, and Kim attended his Courage to Teach ® Sampler Retreat in 2004 and was immediately impressed by the process. That experience has helped focus her research interests, and for her dissertation she is researching teacher engagement and retention, specifically as it relates to professional development that concentrates on the personal, relationship side of teaching. Through an online survey, she plans to gather empirical data on teachers’ level of engagement with their craft. As you may know, there is a need for more empirical research on programs such as Courage to Teach, and we believe that her work has the potential to provide some valuable insights. We would like to support her in this research effort, and we are asking you to help by completing the survey. Please see her request below for details. We hope that you will be as enthusiastic about this research project as we are, and we encourage you to participate. We are also participating in this study and hope that you can find time in your schedules to complete the survey as well. Sincerely, [Courage to Teach Facilitator(s)] and Terry Chadsey, Associate Director, Center for Courage & Renewal [email protected]

Geil
193
Dear Courage to Teach alumni, Thank you for volunteering to participate in this research study on teacher retention and engagement. Your time and consideration are much appreciated! The survey will take approximately 10-20 minutes to complete. To begin, click on the link below and you will be redirected to an online survey site. cttsurvey.questionpro.com (Note: site is no longer active) The consent form that you’ll see when you click on the above link should answer any questions you may have about the risks and benefits of participation in the study, privacy issues (it’s completely anonymous if you so choose), and so on, but if not, please don’t hesitate to contact me directly. It is entirely your choice whether or not to participate in this study, and you may withdraw at any time. The survey will be open through at least Sunday, June 14th. I know this is a busy time of year, and I very much appreciate your help with this project. The more of you that respond, the higher the response rate (and in the world of research, that’s a very good thing!). Thank you! Sincerely, Kimberly Geil School of Education University of Colorado at Boulder
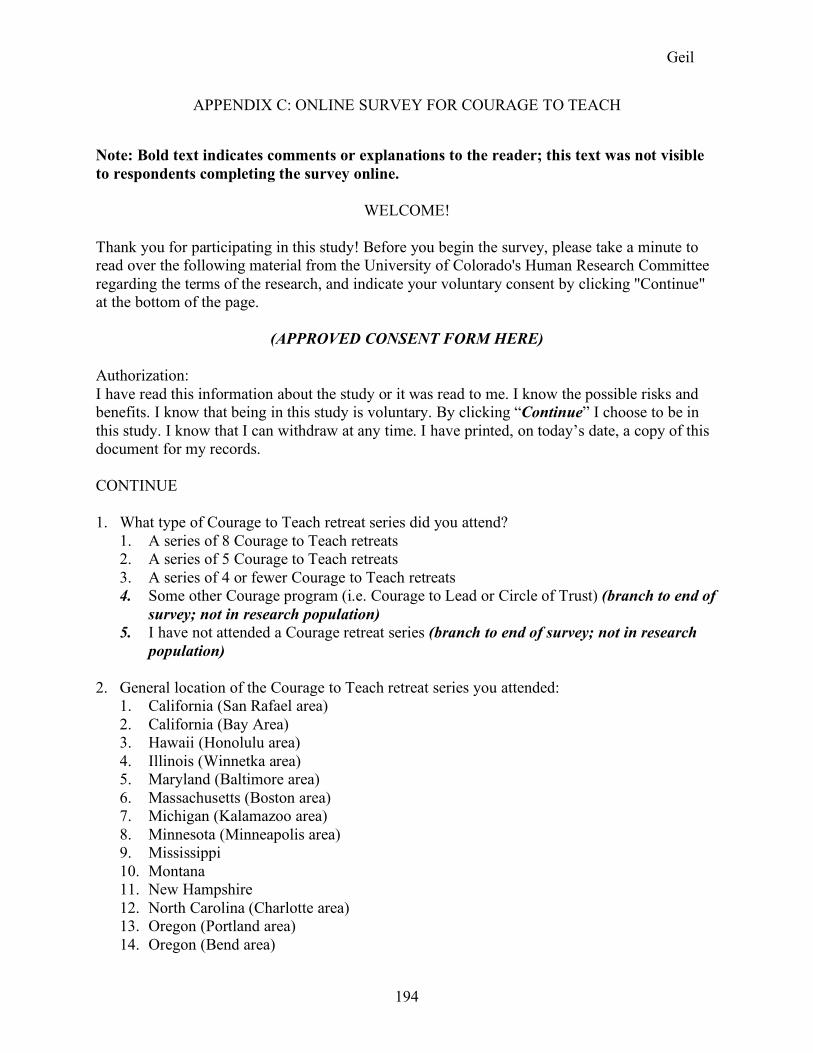
Geil
194
APPENDIX C: ONLINE SURVEY FOR COURAGE TO TEACH
Note: Bold text indicates comments or explanations to the reader; this text was not visible to respondents completing the survey online.
WELCOME! Thank you for participating in this study! Before you begin the survey, please take a minute to read over the following material from the University of Colorado's Human Research Committee regarding the terms of the research, and indicate your voluntary consent by clicking "Continue" at the bottom of the page.
(APPROVED CONSENT FORM HERE) Authorization: I have read this information about the study or it was read to me. I know the possible risks and benefits. I know that being in this study is voluntary. By clicking “Continue” I choose to be in this study. I know that I can withdraw at any time. I have printed, on today’s date, a copy of this document for my records. CONTINUE 1. What type of Courage to Teach retreat series did you attend?
1. A series of 8 Courage to Teach retreats 2. A series of 5 Courage to Teach retreats 3. A series of 4 or fewer Courage to Teach retreats 4. Some other Courage program (i.e. Courage to Lead or Circle of Trust) (branch to end of
survey; not in research population) 5. I have not attended a Courage retreat series (branch to end of survey; not in research
population) 2. General location of the Courage to Teach retreat series you attended:
1. California (San Rafael area) 2. California (Bay Area) 3. Hawaii (Honolulu area) 4. Illinois (Winnetka area) 5. Maryland (Baltimore area) 6. Massachusetts (Boston area) 7. Michigan (Kalamazoo area) 8. Minnesota (Minneapolis area) 9. Mississippi 10. Montana 11. New Hampshire 12. North Carolina (Charlotte area) 13. Oregon (Portland area) 14. Oregon (Bend area)

Geil
195
15. South Carolina (Myrtle Beach area) 16. South Dakota 17. Texas (Ft. Worth area) 18. Texas (Austin area) 19. Texas (San Antonio area) 20. Vermont 21. Washington (Seattle area) 22. Wisconsin (Madison area) 23. Wisconsin (Milwaukee area) 24. Arizona 25. Colorado 26. Georgia 27. Idaho 28. New York 29. Virginia 30. Other/No response
3. In what year(s) did you participate in the Courage to Teach retreat series checked above (i.e. 2004-2005)? _______________
4. Your primary role at the time of your participation in the Courage to Teach retreat series.
Check only one: 1. K-12 teacher (branch to Teaching Experience Q) 2. College or university professor/instructor (branch to Teaching Experience Q) 3. Administrator 4. None of the above
5. (If “Administrator” or “None of the above”) At the time of your participation in the Courage to Teach retreat series, were you engaged in any teaching activities? 1. No, I was not engaged in any teaching activities (branch to Not Teaching at Time of
Participation) 2. Yes, for less than half of my time 3. Yes, for 50% or more of my time
6. Please describe the teaching activities you were engaged in at the time of your participation in the Courage to Teach retreat series: ______________________________________________

Geil
196
7. Years of teaching experience at the time of your participation in the Courage to Teach retreat series? Check one: 1. Less than one year 2. 1-2 years 3. 3-5 years 4. 6-10 years 5. 11-15 years 6. 16-20 years 7. 21-25 years 8. More than 25 years 9. Not applicable
8. Do you have any colleagues at your school who have also participated in a Courage to Teach
retreat series? Check one: 1. No, not that I know of 2. There are one or two other teachers who have 3. There are 3-5 teachers who have 4. There are 6-10 teachers who have 5. There are more than 10 teachers who have
9. Since your participation in the Courage to Teach retreat series, have you done any of the following? Check all that apply: 1. Participated in another Courage to Teach retreat series 2. Participated in any workshops or programs related to Courage 3. Participated in a Courage to Lead program 4. Participated in a Circle of Trust program 5. Begun or completed training to become a Courage to Teach facilitator 6. Facilitated a Courage to Teach retreat series 7. Facilitated any workshops or programs related to Courage 8. Read any books about Courage to Teach or by Parker Palmer 9. Read, listened, or watched any of the resources available on the Center for Courage and
Renewal's website 10. Continued the "inner work" begun at the retreats in your own personal way 11. Other (please describe): ______________
10. How would you rate your level of involvement with Courage to Teach and related programming since your initial participation in the Courage to Teach retreat series? 1. Not at all involved 2. Somewhat involved 3. Very involved
11. Are you currently teaching? Check one: 1. No, I’m not currently teaching (branch to Not Currently Teaching questions) 2. Yes, at the K-12 level 3. Yes, at the college/university level 4. Yes, at a level other than K-12 or college/university (please specify): ____________

Geil
197
12. How long do you plan to remain in teaching? Check one: 1. As long as I am able 2. Until I am eligible for retirement benefits from this job 3. Until I am eligible for retirement benefits from a previous job 4. Until I am eligible for social security benefits 5. Until a specific life event occurs (e.g., parenthood, marriage) 6. Until a more desirable job opportunity comes along 7. Definitely plan to leave teaching as soon as I can 8. Undecided at this time
13. In the last 12 months, have you applied for a job in an attempt to leave the position of a teacher? Answer "yes" if you have applied for non-teaching positions in the field of education (e.g., administrator) or a position outside the field of education. Answer "no" if you have only applied for summer jobs or other positions to supplement your income from teaching. 1. Yes 2. No
14. When will you be eligible for retirement? Check one: (branch to Current Teaching Position questions) 1. Next year 2. In two years 3. In 3-5 years 4. In 6-10 years 5. In 11 years or more 6. Don’t know 7. Not eligible for retirement
Not Currently Teaching questions: 15. Which of the following best describes your current status? Check only one:
1. Still working – in the field of education 2. Still working – in a field other than education 3. Currently retired – no longer involved in the field of education 4. Currently retired – still working for pay in the field of education 5. Currently retired – still volunteering in the field of education 6. Student – in the field of education 7. Student – in a field other than education 8. Raising a family 9. Taking care of parents/relatives 10. Other (please describe): ______________________________

Geil
198
16. Indicate the level of importance EACH of the following played in your decision to leave your most recent teaching position: (1-Not at all important, 2-Slightly important, 3-Somewhat important, 4-Very important, 5-Extremely important) 1. Change in residence 2. Pregnancy/child rearing 3. Health 4. To retire 5. School staffing action (e.g., reduction-in-force, lay-off, school closing, school
reorganization, reassignment) 6. For better salary or benefits 7. To pursue a position other than that of a teacher 8. To take courses to improve career opportunities WITHIN the field of education 9. To take courses to improve career opportunities OUTSIDE the field of education 10. Dissatisfied with teaching as a career 11. Dissatisfied with previous school or teaching assignment 12. Other family reasons
17. From the items below, which do you consider the MOST important reason in your decision to leave teaching? Choose only one: 1. Change in residence 2. Pregnancy/child rearing 3. Health 4. To retire 5. School staffing action (e.g., reduction-in-force, lay-off, school closing, school
reorganization, reassignment) 6. For better salary or benefits 7. To pursue a position other than that of a teacher 8. To take courses to improve career opportunities WITHIN the field of education 9. To take courses to improve career opportunities OUTSIDE the field of education 10. Dissatisfied with teaching as a career 11. Dissatisfied with previous school or teaching assignment 12. Other family reasons
18. Would you consider returning to the position of a K-12 or college/university teacher? 1. Yes 2. No
Current Teaching Position questions The following questions ask about your current teaching position. If you are not currently teaching, fill them out based on the most recent teaching position you have held: 19. School name (this will be used only in conjunction with the National Center for Education
Statistics’ database to gather general information about your school, not to identify you): _________________________ 1. City: ________________________________ 2. State (select from drop-down menu):

Geil
199
20. Do you currently (or did you at your most recent teaching position) teach part-time or full-time? 1. Part-time 2. Full-time
21. What grade(s) do you currently teach (or did you teach at your most recent teaching
position)? Check all that apply: 1. Preschool 2. Kindergarten 3. 1st grade 4. 2nd grade 5. 3rd grade 6. 4th grade 7. 5th grade 8. 6th grade 9. 7th grade 10. 8th grade 11. 9th grade 12. 10th grade 13. 11th grade 14. 12th grade 15. Undergraduate students 16. Graduate students 17. Non-degree seeking students 18. Other (please specify): ____________________
22. Check the teaching discipline below that best describes your main teaching assignment (the
field in which you teach, or taught, the most classes). Check only one: 1. Bilingual/English as a Second Language 2. Special Education 3. Generalist/All Elementary Subjects 4. Education (including Teacher Education, Administration, Counseling, etc.) 5. Arts and Music 6. English and Language Arts 7. Foreign Language 8. Health Education and/or Physical Education 9. Mathematics and/or Computer Science 10. Natural Sciences (including Engineering) 11. Social Sciences (including History) 12. Vocational, Career, or Technical Education 13. Miscellaneous (please specify): _______________________________
23. Would you consider the teaching discipline that you checked above to be your
specialty/strongest area of teaching? 1. Yes 2. No

Geil
200
24. (If “no”) Check the teaching discipline below that you feel is your specialty or your strongest area (NOTE: this may be different than your main teaching assignment). Check only one: 1. Bilingual/English as a Second Language 2. Special Education 3. Generalist/All Elementary Subjects 4. Education (including Teacher Education, Administration, Counseling, etc.) 5. Arts and Music 6. English and Language Arts 7. Foreign Language 8. Health Education and/or Physical Education 9. Mathematics and/or Computer Science 10. Natural Sciences (including Engineering) 11. Social Sciences (including History) 12. Vocational, Career, or Technical Education 13. Miscellaneous (please specify): _______________________________
25. What percentage (approximately) of the students you teach (or most recently taught) are of
limited-English proficiency? Students of limited-English proficiency are those whose native or dominant language is other than English, and who have sufficient difficulty speaking, reading, writing, or understanding the English language as to deny them the opportunity to learn successfully in an English-speaking-only classroom. 1. None 2. 1-9% 3. 10-24% 4. 25-29% 5. 50-74% 6. 75%-99% 7. 100%
26. When you participated in the Courage to Teach retreat series, was your teaching position
(e.g. school, grade level, subject, students) the same as the position you just described above? 1. Yes (branch to Motivations for Teaching Questions) 2. No

Geil
201
27. (If “no”) From the statements below, which do you consider the MOST important reason in your decision to change the teaching position you held at the time of your participation in the Courage to Teach retreat series? Choose only one: 1. New school was closer to my home 2. Salary or benefits were better in my new teaching position 3. I felt job security would be higher at the new school 4. I had an opportunity for a better teaching assignment (subject area or grade level) at the
new school 5. I was dissatisfied with workplace conditions (e.g. facilities, classroom resources, school
safety) at my previous school 6. I was dissatisfied with support from administrators at my previous school 7. I was dissatisfied with changes in my job description or responsibilities at my previous
school 8. I was laid off or involuntarily transferred 9. I did not have enough autonomy over my classroom at my previous school 10. I was dissatisfied with opportunities for professional development at my previous school 11. I was dissatisfied with my previous school for other reasons not included above (please
describe): ___________________________________________________ Motivations for Teaching questions The next questions ask about your motivations for teaching. 28. Please indicate the level of importance each of the following played in your decision to
become a teacher: (1-Not at all important, 2, 3, 4, 5-Extremely important) 1. Wanted to make a difference/contribute to society 2. Best job available to me at the time 3. Wanted to work with children/young people 4. Stable job with steady paycheck 5. Love of/enthusiasm for the subject I teach 6. Schedule was ideal (e.g. for raising a family, traveling during the summer) 7. Always wanted to be a teacher 8. Interested in issues of social justice and equity
29. From the statements below, which do you consider the MOST important reason in your
decision to become a teacher? Choose only one: (drop-down menu) 1. Wanted to make a difference/contribute to society 2. Best job available to me at the time 3. Wanted to work with children/young people 4. Stable job with steady paycheck 5. Love of/enthusiasm for the subject I teach 6. Schedule was ideal (e.g. for raising a family, traveling during the summer) 7. Always wanted to be a teacher 8. Interested in issues of social justice and equity 9. Other (please explain below):

Geil
202
30. If you could go back in time and start over again, would you become a teacher or not? 1. Certainly would become a teacher 2. Probably would become a teacher 3. Chances about even for and against 4. Probably would not become a teacher 5. Certainly would not become a teacher
31. Indicate the level of importance each of the following plays in your decision to remain in
teaching: (NOTE: If you are not currently teaching, you may skip this question) (1-Not at all important, 2, 3, 4, 5-Extremely important) 1. Feel I am making a difference/contributing to society 2. Nothing better has come along 3. Enjoy working with children/young people 4. Stable job with steady paycheck 5. Love of/enthusiasm for the subject I teach 6. Schedule is ideal (e.g. for raising a family, traveling during the summer) 7. It’s the perfect job for me 8. Allows me to work towards social justice and equity goals 9. Too close to retirement to quit now
32. From the statements below, which do you consider the MOST important reason in your
decision to remain in teaching? Choose only one: (NOTE: If you are not currently teaching, you may skip this question) 1. Feel I am making a difference/contributing to society 2. Nothing better has come along 3. Enjoy working with children/young people 4. Stable job with steady paycheck 5. Love of/enthusiasm for the subject I teach 6. Schedule is ideal (e.g. for raising a family, traveling during the summer) 7. It’s the perfect job for me 8. Allows me to work towards social justice and equity goals 9. Too close to retirement to quit now 10. Other (please explain below):
33. The next set of statements addresses job-related feelings.
Please read each statement carefully. If you are currently teaching, decide if you ever feel this way about your current teaching position. If you are not currently teaching, decide if you ever felt this way about your most recent teaching position. If you have never had this feeling, check “Never.” If you have had this feeling, indicate how often you feel it (or felt it) by checking the category that best describes how frequently you feel (or felt) that way. (1-Never, 2-A few times a year or less, 3-Once a month or less, 4-A few times a month, 5-Once a week, 6-A few times a week, or 7-Everyday.)

Geil
203
Sample Items (due to copyright restrictions, only sample MBI items may be published): I feel I treat some students as if they were impersonal objects. I feel I'm positively influencing other people's lives through my work. I feel like I'm at the end of my rope.
(Modified and reproduced by special permission of the Publisher, CPP, Inc., Mountain View, CA 94043 from Maslach Burnout Inventory - Educators Survey by Christina Maslach and Susan E. Jackson. Copyright 1986 by CPP, Inc. All rights reserved. Further reproduction is prohibited without the Publisher's written consent.)
34. To what extent do you agree or disagree with the following statements about your current
teaching position? If you are not currently teaching, respond according to how you felt at your most recent teaching position. (1-Strongly disagree, 2-Somewhat disagree, 3-Somewhat agree, 4-Strongly agree, or 5-Not applicable) 1. The school administration’s behavior toward the staff is supportive and encouraging. 2. I receive a great deal of support from parents for the work I do. 3. Necessary materials such as textbooks, supplies, and copy machines are available as
needed by staff. 4. Routine duties and paperwork interfere with my job of teaching. 5. My principal/administrator enforces school rules for student conduct and backs me up
when I need it. 6. Rules for student behavior are consistently enforced by teachers in my school, even for
students who are not in their classes. 7. Most of my colleagues share my beliefs and values about what the central mission of the
school should be. Thanks for hanging in here! We know these types of questions can get a bit tedious, but they are important to the research.
35. To what extent do you agree or disagree with the following statements about your current
teaching position? If you are not currently teaching, respond according to how you felt at your most recent teaching position. (1-Strongly disagree, 2-Somewhat disagree, 3-Somewhat agree, 4-Strongly agree, or 5-Not applicable) 1. The principal/administrator knows what kind of school he or she wants and has
communicated it to the staff. 2. There is a great deal of cooperative effort among the staff members. 3. I worry about the security of my job because of the performance of my students on state
or local tests. 4. State or district content standards have had a positive influence on my satisfaction with
teaching. 5. I feel comfortable asking my colleagues for advice on teaching. 6. In the community where I teach, teachers are highly respected.

Geil
204
36. Indicate how descriptive the following statements are of you and your students. If you are not currently teaching, respond based on your most recent teaching position. (1-Not at all descriptive, 2, 3, 4, 5-Extremely descriptive) 1. I find the subject(s) I teach fascinating. 2. My students are excited about learning the subject(s) I teach. 3. I get a great deal of satisfaction from seeing my students learn the subject material. 4. I incorporate new things I have learned about a topic into my lesson plans. 5. I use real-world examples in my teaching. 6. Through learning about the subject(s) I teach, I have learned about myself as a person. 7. My students learn about themselves as people through studying the subject(s) I teach. 8. I prefer to use the textbook or pre-made activities when teaching rather than using
activities I have created myself. 9. I teach a wide range of students effectively (e.g. students of different skill levels,
language ability).
37. To what extent do you agree or disagree with this last set of statements about your attitude toward teaching and your school? If you are not currently teaching, respond according to how you felt at your most recent teaching position. (1-Strongly disagree, 2-Somewhat disagree, 3-Somewhat agree, 4-Strongly agree, or 5-Not applicable) 1. I am satisfied with my teaching salary. 2. I sometimes feel it is a waste of time to try to do my best as a teacher. 3. I am generally satisfied with being a teacher at this school. 4. The stress and disappointments involved in teaching at this school aren’t really worth it. 5. The teachers at this school like being here; I would describe us as a satisfied group. 6. I like the way things are run at this school. 7. If I could get a higher paying job I’d leave teaching as soon as possible. 8. I think about transferring to another school. 9. I don’t seem to have as much enthusiasm now as I did when I began teaching. 10. I think about staying home from school because I’m just too tired to go.
Not Teaching at Time of Participation Thank you for your willingness to participate in this research. Based on your answer to the previous question, you are not a member of the primary population being studied, but we would still like to ask you a few more questions about your Courage to Teach experience. Please click “continue” below. Courage to Teach Retreat Series questions
38. Has your participation in the Courage to Teach retreat series had any effect on your decision
to remain in, leave, or return to teaching? 1. Yes 2. No
39. (If “yes”) Briefly explain the effect that your participation in the Courage to Teach retreat series has had on your decision to remain in, leave, or return to teaching: _________________________________________

Geil
205
40. What effect did your participation in the Courage to Teach retreat series have on your: (1-Very detrimental, 2-Somewhat detrimental, 3-No effect, 4-Somewhat beneficial, 5-Very beneficial) 1. Understanding of subject matter 2. Repertoire of teaching ideas 3. Relationships with students 4. Relationships with colleagues 5. Relationships with administrators 6. Relationships with parents and community members 7. Energy levels 8. Stress levels 9. Enjoyment of teaching 10. Motivation to teach 11. Interest in subject matter
41. As you look back on your Courage to Teach retreat series experience, what stands out as the
most valuable part to you? _____________________________________________________ 42. Have you ever participated in a Summer Institute of the National Writing Project?
1. Yes 2. No
Just a few more background questions, and we’re done! 43. What gender do you most identify with?
1. Female 2. Male
44. Check the category that most accurately reflects your ethnic background. Check only one: 1. African American or Black, not of Hispanic origin 2. American Indian or Alaskan Native 3. Asian 4. Hispanic, Chicano, Mexican American, Latino 5. Pacific Islander/Filipino 6. White, not of Hispanic origin 7. Multiracial (Indicate other ethnic or racial terms that further or better describe your
ethnic background) ______________________________
45. Age? Check one: 1. 25 years or younger 2. 26-30 years old 3. 31-40 years old 4. 41-50 years old 5. 51-60 years old 6. 61 years old or older

Geil
206
46. Do you hold any of the following academic degrees? Check all that apply: 1. Bachelor’s degree 2. Master’s degree 3. PhD
47. Are any of the degrees you checked above in education-related fields? Check any degrees that are: 1. Bachelor’s degree 2. Master’s degree 3. PhD
48. Do you hold a teaching certificate in the state you are currently teaching (or most recently taught) in? 1. Yes 2. No 3. Not applicable
49. Did you enter teaching through an alternative certification program? (An alternative
program is a program that was designed to expedite the transition of non-teachers to a teaching career, for example, a state, district, or university alternative certification program.) 1. Yes 2. No 3. Not applicable
That’s it for the survey! 50. A second phase of this study will involve phone interviews with a small sample of
participants who completed this online survey. Please provide your name, e-mail address, and phone number below if you are willing to be contacted for this portion of the research. 1. Name: _________________________ 2. E-mail address: ______________________ 3. Phone number: _________________________
Not member of research population: Thank you for your willingness to complete this survey. However, based on your answer to the previous question, you are not a member of the population being studied and your participation is no longer needed. Thank you, and please click “Continue” at the bottom of the page. Thank you page: Thank you very much for participating in this survey! Your response has been saved and recorded with ID # 123456. If you would like to receive a summary of the results of this survey (expected completion date: Summer 2010), send an e-mail to [email protected] with “CTT Research Results” in the subject line and your e-mail address in the body of the message.

Geil
207
If you’re interested in learning about QuestionPro survey software, click on the “Thank you for completing this survey” link or the “Free Trial” button below. Otherwise, you may close the window now. Thank you again for your participation in this research project! At the bottom of each page: Please contact [email protected] if you have any questions regarding this survey.

Geil
208
APPENDIX D: ONLINE SURVEY FOR NATIONAL WRITING PROJECT
Note: The majority of the items on the surveys are exactly the same (with the exception of the name of the professional development program). This appendix shows only those questions that are substantially different from the questions on the survey for the Courage to Teach respondents. 1. As all summer institutes are of similar length, NWP respondents were not asked
question 1. 2. Writing Project that sponsored the Summer Institute you attended:
1. I have not attended a Summer Institute (branch to end of survey; not in research population)
2. Area 3 Writing Project, California 3. Bay Area Writing Project, California 4. Boston Writing Project, Massachusetts 5. Chicago Area Writing Project, Illinois 6. Coastal Area Writing Project, South Carolina 7. Dakota Writing Project, South Dakota 8. Fox Valley Writing Project, Wisconsin 9. Hawaii Writing Project, Hawaii 10. Heart of Texas Writing Project, Texas 11. Hudson Valley Writing Project, New York 12. Kennesaw Mountain Writing Project, Georgia 13. Lewis & Clark Writing Project, Oregon 14. Maryland Writing Project, Maryland 15. Milwaukee Writing Project, Wisconsin 16. Minnesota Writing Project, Minnesota 17. Montana Writing Project, Montana 18. National Writing Project at Rutgers University, New Jersey 19. National Writing Project in Vermont, Vermont 20. North Star of Texas Writing Project, Texas 21. Northern Arizona Writing Project, Arizona 22. Northern Plains Writing Project, North Dakota 23. Plymouth Writing Project, New Hampshire 24. Puget Sound Writing Project, Washington 25. Red Mountain Writing Project, Alabama 26. San Antonio Writing Project, Texas 27. Southern Oregon University, Oregon 28. Third Coast Writing Project, Michigan 29. UNC Charlotte Writing Project, North Carolina 30. University of Mississippi, Mississippi 31. Willamette Writing Project, Oregon 32. Other (please specify):
3. Year you participated in the Summer Institute (yyyy): ____________

Geil
209
9. Since your participation in the Summer Institute, have you engaged in any of the following Writing Project activities? Check all that apply: 1. Advanced Institutes 2. Inservice workshops 3. “Saturday seminars” 4. Teacher research/inquiry groups 5. New teacher support programs 6. Parent and community workshops 7. Young Writers’ programs 8. Teacher reading or writing group 9. Writing project activities at the national level 10. Become a site director or co-director 11. Other (please describe): ________________

Geil
210
APPENDIX E: INSTRUCTORS AT THE COLLEGE/UNIVERSITY LEVEL
In the original sample, there are 39 CTT respondents and 55 NWP respondents who are
currently teaching at the college or university level. When I exclude all those who did not
complete the survey (2 CTT and 5 NWP) and who have participated in both PD programs (6
CTT and 2 NWP), there are 31 CTT and 48 NWP cases remaining. These cases are the focus of
this appendix. To distinguish them from the PK-12 teachers, I will refer to them collectively as
“instructors,” even though undoubtedly they fill a variety of different roles at their institutions. In
this appendix, I will describe their demographic characteristics, look at their intentions to remain
in teaching, and examine what they think about the benefits of the PD programs in which they
participated.
Descriptive Characteristics
Gender and Race/Ethnicity
As with the PK-12 teachers, the majority of the college/university level instructors are
female and Caucasian for both PD programs (see Table 1).
Table 1. Gender and Race/Ethnicity of College and University Instructors
CTT NWP n % n % Gender
Female 22 71.0 36 76.6 Male 9 29.0 11 23.4
Race/Ethnicity White 27 87.1 42 87.5 African American 1 3.2 1 2.1 Hispanic 1 3.2 0 0.0 Multiracial 1 3.2 1 2.1 Pacific Islander 1 3.2 0 0.0 Asian 0 0.0 3 6.3 American Indian 0 0.0 1 2.1

Geil
211
Unlike the PK-12 teachers, however, the instructors are considerably more diverse in
terms of gender and slightly more diverse in terms of race/ethnicity. Whereas only 12% and 14%
of the CTT and NWP PK-12 teachers are male, that percentage jumps to 29% and 23%
respectively for the CTT and NWP instructors. The CTT instructors are also slightly more
diverse than the CTT PK-12 teachers: 87% of the instructors are White, compared to 90% of the
CTT PK-12 teachers. The percentage of NWP instructors who are White is exactly the same as
that of the NWP PK-12 teachers (88%).
Age, Teaching Experience, and Retirement Eligibility
The college and university instructors exhibit very similar patterns as the PK-12 teachers,
in that the CTT instructors are consistently older, have more teaching experience, and are closer
to retirement than the NWP instructors (see Table 2).
Table 2. Age, Teaching Experience, and Retirement Eligibility of College and University Instructors
CTT NWP n % n % Age
30 yrs or younger 0 0.0 3 6.3 31-40 yrs 4 12.9 13 27.1 41-50 yrs 6 19.4 12 25.0 51-60 yrs 11 35.5 12 25.0 61 yrs or older 10 32.3 8 16.7
Teaching Experience 5 years or less 2 6.5 16 33.3 6-10 years 2 6.5 16 33.3 11-20 years 11 35.5 10 20.8 21 years or more 16 51.6 6 12.5
Retirement Eligibility In 5 years or less 12 38.7 11 25.6 In 6-10 years 6 19.4 2 4.7 In 11 years or more 12 38.7 23 53.5 Don't know 1 3.2 6 14.0 Not eligible for retirement 0 0.0 1 2.3
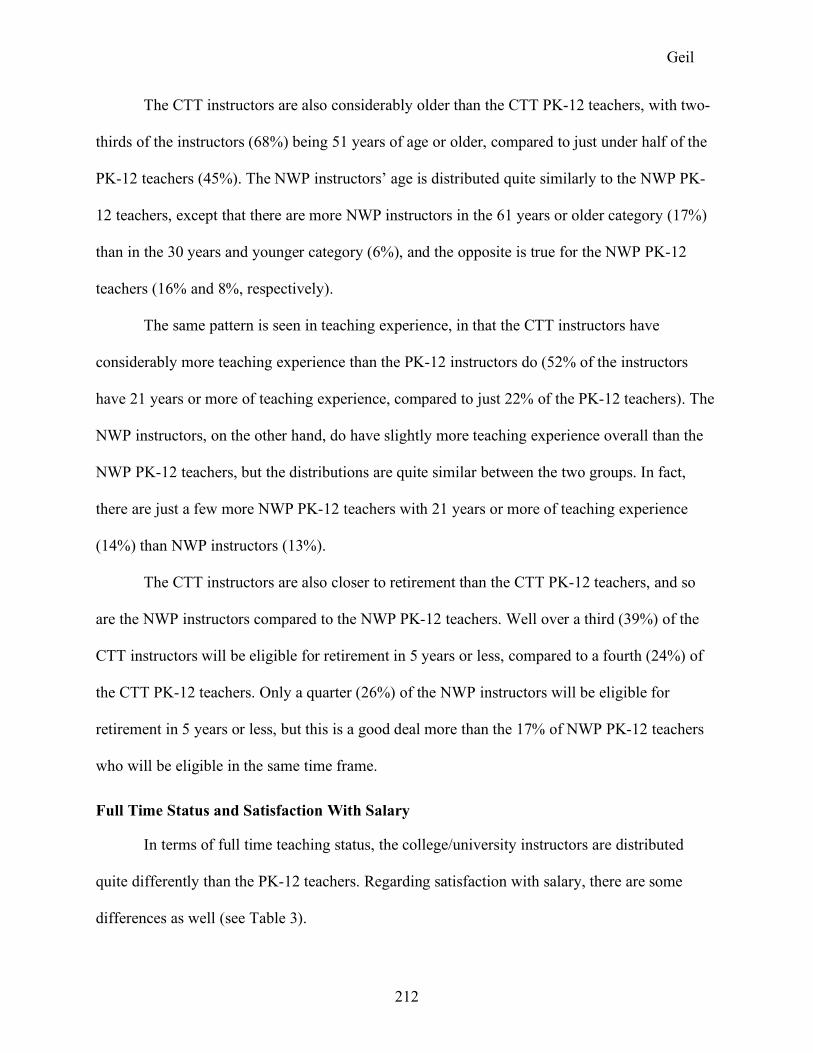
Geil
212
The CTT instructors are also considerably older than the CTT PK-12 teachers, with two-
thirds of the instructors (68%) being 51 years of age or older, compared to just under half of the
PK-12 teachers (45%). The NWP instructors’ age is distributed quite similarly to the NWP PK-
12 teachers, except that there are more NWP instructors in the 61 years or older category (17%)
than in the 30 years and younger category (6%), and the opposite is true for the NWP PK-12
teachers (16% and 8%, respectively).
The same pattern is seen in teaching experience, in that the CTT instructors have
considerably more teaching experience than the PK-12 instructors do (52% of the instructors
have 21 years or more of teaching experience, compared to just 22% of the PK-12 teachers). The
NWP instructors, on the other hand, do have slightly more teaching experience overall than the
NWP PK-12 teachers, but the distributions are quite similar between the two groups. In fact,
there are just a few more NWP PK-12 teachers with 21 years or more of teaching experience
(14%) than NWP instructors (13%).
The CTT instructors are also closer to retirement than the CTT PK-12 teachers, and so
are the NWP instructors compared to the NWP PK-12 teachers. Well over a third (39%) of the
CTT instructors will be eligible for retirement in 5 years or less, compared to a fourth (24%) of
the CTT PK-12 teachers. Only a quarter (26%) of the NWP instructors will be eligible for
retirement in 5 years or less, but this is a good deal more than the 17% of NWP PK-12 teachers
who will be eligible in the same time frame.
Full Time Status and Satisfaction With Salary
In terms of full time teaching status, the college/university instructors are distributed
quite differently than the PK-12 teachers. Regarding satisfaction with salary, there are some
differences as well (see Table 3).

Geil
213
Table 3. Teaching Status and Satisfaction With Salary
CTT NWP n % n % Teaching Status
Full time 25 80.6 24 50.0 Part time 6 19.4 24 50.0
Satisfied With Salary Strongly disagree 4 12.9 14 29.2 Somewhat disagree 8 25.8 15 31.3 Somewhat agree 15 48.4 12 25.0 Strongly agree 4 12.9 7 14.6
Whereas over 90% of the PK-12 teachers in both PD programs are teaching full time,
only 81% of the CTT instructors and only 50% of the NWP instructors are teaching full time.
Clearly more of the instructors are part time than the PK-12 teachers, which makes sense
considering that there are probably more part time positions available at the college and
university levels. The NWP instructors hold significantly more part time positions.
With regards to how satisfied they are with their salaries, the CTT instructors (61%) are
considerably more satisfied than the NWP instructors (40%). This may be due to the high
proportion of part-time positions held by the NWP respondents, or perhaps the fact that they are
at earlier stages in their careers. Compared to the PK-12 teachers in each PD program, the CTT
instructors feel similarly, although they are slightly less satisfied than the CTT PK-12 teachers
(39% of the CTT instructors are dissatisfied, compared to 34% of the CTT PK-12 teachers). The
NWP instructors, however, are much more dissatisfied than the NWP PK-12 teachers, most
likely for some of the same reasons I brought up above. Almost two-thirds (61%) of the NWP
instructors are not satisfied to some degree with their salaries, compared to 32% of the NWP PK-
12 teachers.

Geil
214
Intentions to Remain in Teaching
The college and university instructors’ responses to the following three survey items
provide a sense of their intentions to remain in teaching (see Table 4).
Table 4. College and University Instructors’ Intentions to Remain in Teaching
CTT NWP n % n % How Long Plan to Remain in Teaching
As long as I am able 17 54.8 31 64.6 Until eligible for retirement benefits from this job 8 25.8 3 6.3 Until eligible for social security benefits 1 3.2 1 2.1 Until a more desirable job opportunity comes along 1 3.2 2 4.2 Undecided at this time 4 12.9 11 22.9
Applied for Job to Leave Teaching No, have not applied for a job 30 96.8 41 87.2 Yes, have applied for a job 1 3.2 6 12.8
Would Leave Teaching for a Higher Paying Job Strongly disagree 18 58.1 28 59.6 Somewhat disagree 11 35.5 13 27.7 Somewhat agree 1 3.2 6 12.8 Strongly agree 1 3.2 0 0.0
The responses to these three items tell a different story for the college/university
instructors than they do for the PK-12 teachers. Amongst the PK-12 teachers, the CTT PK-12
teachers were not as stable in their intentions to remain in teaching as the NWP PK-12 teachers:
they were less likely to want to stay in teaching as long as they are able, more likely to have
applied for a job to leave the position of teacher, and more likely to agree that they would leave
teaching if they could find a higher paying job. On the contrary, the picture is slightly different
when I look at just the college/university instructors. While the NWP instructors are still more
likely to say they want to stay in teaching as long as they are able (65%, compared to 55%), there
are more CTT instructors who plan to stay in teaching until they retire (29%, versus 8% of NWP

Geil
215
instructors), and fewer who are undecided about their future in teaching (13%, compared to 23%
for NWP).
While the NWP PK-12 teachers were less likely to have applied for a job to leave the
position of teacher (5% of NWP PK-12 teachers had applied, compared to 10% of CTT PK-12
teachers), the opposite is true for the NWP instructors: 13% have applied for a job, compared to
just 3% of CTT instructors. And the NWP instructors are twice as likely (13%, compared to 6%
for CTT instructors) to agree that they would leave teaching immediately if they could find a
higher paying job. As noted above, this may be due to the high percentage of part-time
instructors who are still early in their careers in the NWP group.
Effects of Participation on Retention Decisions
The college/university instructors responded to two questions about whether or not the
professional development program affected any decisions they made about retention. When
asked the yes/no question of: Has your participation in the [CTT retreat series or NWP summer
institute] had any effect on your decision to remain in, leave, or return to teaching?, the results
were opposite from what they were with the PK-12 teachers. More of the NWP instructors said
that their participation had an effect (79%) than the CTT instructors (68%), whereas for the PK-
12 teachers the percentages were reversed (80% of the CTT PK-12 teachers said yes, and 70% of
the NWP PK-12 teachers said no).
When asked to explain the effect of the PD program on their retention decisions, the
general themes mirrored those found in the PK-12 responses. Again, the NWP instructors were
more likely to comment on gaining new ideas that helped them stay enthused and become better
teachers. They talked about realizing that they could enjoy teaching, sustaining their enthusiasm
and love for teaching or teaching writing, and being inspired by the colleagues they met in the

Geil
216
summer institutes. Some were motivated to pursue advanced degrees. There was a thread of
comments relating to the community of the summer institute helping them counter the negativity
they found elsewhere in their professional lives, and a sense of being grateful for the opportunity
to connect with other teachers and instructors who were motivated and enthusiastic about
teaching and doing their best for students.
Many of the same themes were present in the CTT responses: for example, the people
they had met and the communities that had been created, and feelings of renewed enthusiasm for
teaching. Also in the CTT responses (but not so much in the NWP responses) was the focus on
learning about oneself personally and how this tied into their teaching. Many of the CTT
instructors made comments about their identity and integrity, how who they are effects how they
teach, and about the importance of maintaining a good balance in their personal and professional
lives. They also made more comments about how the program helped them either rediscover or
reaffirm their sense of teaching as a calling or a vocation, rather than just a job.
Most Valuable Aspect of PD Program Participation
The second open-ended question asked, As you look back on your [CTT retreat series or
NWP summer institute] experience, what stands out as the most valuable part to you?
The majority of the NWP responses were about writing: the opportunity to do their own
writing, to become a writer, improve their skills, participate in a writing group, and so on. There
was again a strong sense of the importance of meeting other teachers and forming relationships
and professional (and sometimes personal) networks. Several also mentioned the value of getting
new ideas for teaching writing, putting theory into practice, and doing their own research.
For the CTT instructors, the comments again revolved around the people they had met,
the caring, trusting relationships and communities that had developed, and the sense of support
Geil
217
they felt. Several mentioned that it was valuable for them to realize that others felt the same way,
or had similar doubts and fears. They also talked about the importance of reflecting on their inner
self and on their life and vocation, and the clearness committee was mentioned multiple times.
Summary
The instructors of both PD programs are older, have more teaching experience, and are
closer to retirement than their PK-12 counterparts. It seems that the two programs attract
different groups at the college/university level: CTT attracts instructors with considerable
amounts of experience who are nearing the end of their careers, while NWP is more attractive to
instructors who are still relatively new to teaching and further away from retirement. The CTT
instructors are also more likely to teach full time and to be satisfied with their salaries than the
NWP instructors.
The CTT instructors are more definite about their intentions to remain in teaching than
the NWP instructors. The CTT instructors are also more definite about their intentions than the
CTT PK-12 teachers are, while for the NWP instructors this trend is generally in the opposite
direction.
Unlike the PK-12 teachers, more NWP instructors reported that their participation in the
program had an effect on a decision they were making regarding retention than the CTT
instructors. The comments made by both groups regarding the effects the program had on
retention decisions were very similar to those made by the respective PK-12 teachers in each PD
program. The same was true regarding the instructors’ comments about the most valuable aspect
of their participation: The NWP instructors’ responses revolved around writing, meeting other
teachers, and new ideas for teaching, while the CTT instructors’ comments were mostly about
having found caring, trusting relationships and doing work related to their inner lives.
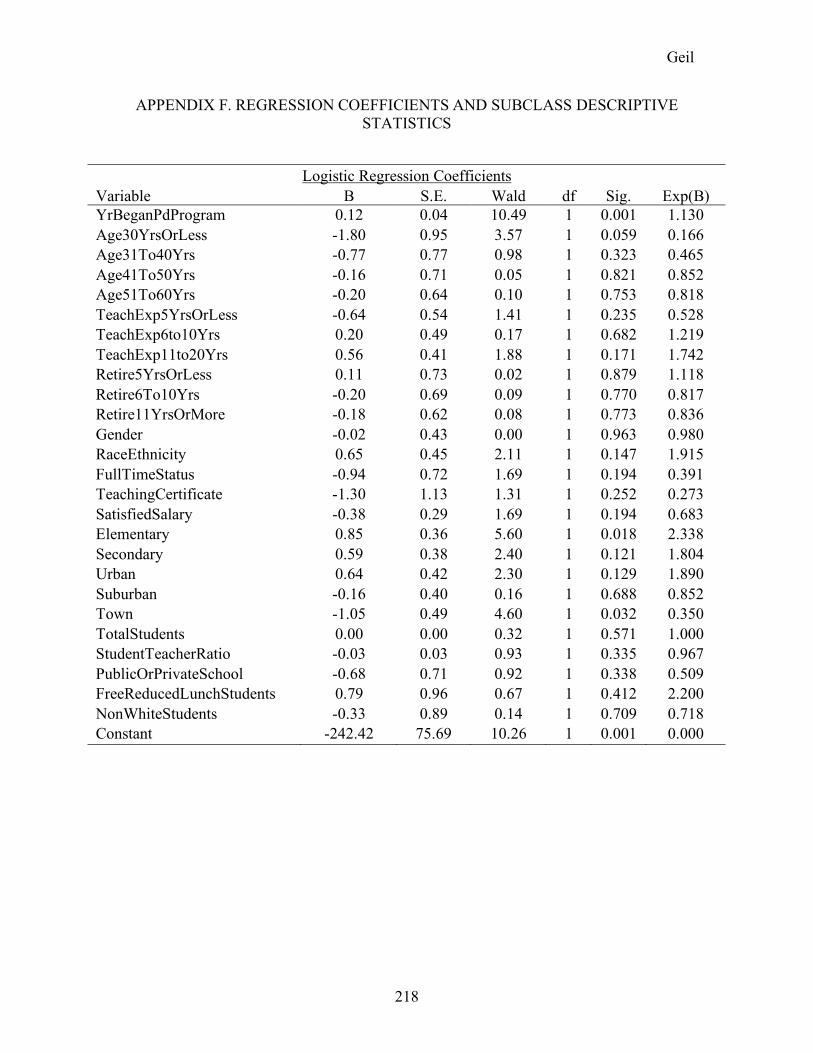
Geil
218
APPENDIX F. REGRESSION COEFFICIENTS AND SUBCLASS DESCRIPTIVE STATISTICS
Logistic Regression Coefficients Variable B S.E. Wald df Sig. Exp(B) YrBeganPdProgram 0.12 0.04 10.49 1 0.001 1.130 Age30YrsOrLess -1.80 0.95 3.57 1 0.059 0.166 Age31To40Yrs -0.77 0.77 0.98 1 0.323 0.465 Age41To50Yrs -0.16 0.71 0.05 1 0.821 0.852 Age51To60Yrs -0.20 0.64 0.10 1 0.753 0.818 TeachExp5YrsOrLess -0.64 0.54 1.41 1 0.235 0.528 TeachExp6to10Yrs 0.20 0.49 0.17 1 0.682 1.219 TeachExp11to20Yrs 0.56 0.41 1.88 1 0.171 1.742 Retire5YrsOrLess 0.11 0.73 0.02 1 0.879 1.118 Retire6To10Yrs -0.20 0.69 0.09 1 0.770 0.817 Retire11YrsOrMore -0.18 0.62 0.08 1 0.773 0.836 Gender -0.02 0.43 0.00 1 0.963 0.980 RaceEthnicity 0.65 0.45 2.11 1 0.147 1.915 FullTimeStatus -0.94 0.72 1.69 1 0.194 0.391 TeachingCertificate -1.30 1.13 1.31 1 0.252 0.273 SatisfiedSalary -0.38 0.29 1.69 1 0.194 0.683 Elementary 0.85 0.36 5.60 1 0.018 2.338 Secondary 0.59 0.38 2.40 1 0.121 1.804 Urban 0.64 0.42 2.30 1 0.129 1.890 Suburban -0.16 0.40 0.16 1 0.688 0.852 Town -1.05 0.49 4.60 1 0.032 0.350 TotalStudents 0.00 0.00 0.32 1 0.571 1.000 StudentTeacherRatio -0.03 0.03 0.93 1 0.335 0.967 PublicOrPrivateSchool -0.68 0.71 0.92 1 0.338 0.509 FreeReducedLunchStudents 0.79 0.96 0.67 1 0.412 2.200 NonWhiteStudents -0.33 0.89 0.14 1 0.709 0.718 Constant -242.42 75.69 10.26 1 0.001 0.000

Geil
219
Age
Subclass Age 30 Yrs or
Less Age 31 to 40
Yrs Age 41 to 50
Yrs Age 51 to 60
Yrs Age 61 Yrs or
More 1 0.21 0.41 0.17 0.19 0.02 2 0.04 0.34 0.32 0.24 0.06 3 0 0.19 0.38 0.33 0.10 4 0 0.13 0.38 0.44 0.05 5 0 0.07 0.48 0.34 0.10 6 0 0.11 0.42 0.37 0.11
Teaching Experience
Subclass 5 Yrs or Less 6-10 Yrs 11-20 Yrs 21 Yrs or
More 1 0.58 0.24 0.10 0.07 2 0.16 0.34 0.26 0.24 3 0.06 0.31 0.44 0.19 4 0.05 0.18 0.54 0.23 5 0.03 0.21 0.52 0.24 6 0.05 0.11 0.47 0.37
School Level
Subclass Elementary
(K-6) Secondary
(7-12) Combined
(K-12) No CCD Data
Available 1 0.19 0.46 0.34 0 2 0.44 0.34 0.22 0 3 0.35 0.27 0.38 0 4 0.36 0.31 0.33 0 5 0.59 0.24 0.17 0 6 0.68 0.21 0.11 0
School Locale Subclass Urban Suburban Town Rural
1 0.26 0.30 0.18 0.25 2 0.22 0.48 0.16 0.14 3 0.27 0.33 0.08 0.31 4 0.28 0.36 0.03 0.33 5 0.59 0.03 0 0.38 6 0.74 0.05 0 0.21
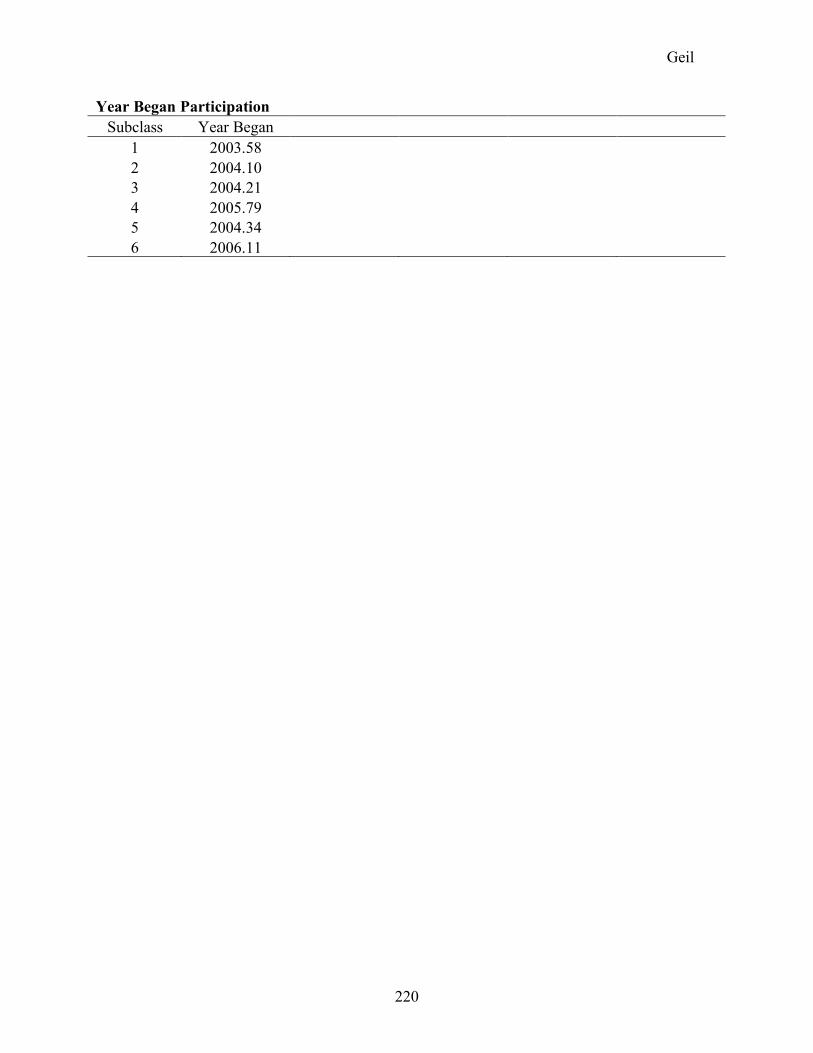
Geil
220
Year Began Participation Subclass Year Began
1 2003.58 2 2004.10 3 2004.21 4 2005.79 5 2004.34 6 2006.11

Geil
221
APPENDIX G. MOST COMMONLY CODED THEMES IN OPEN-ENDED RESPONSE QUESTIONS
Question #1: Briefly explain the effect that your participation in [CTT or NWP] has had on your decision to remain in, leave, or return to teaching.
CTT NWP Benefits That Affected Retention Decisions n % n % Rediscovered/affirmed teaching as a calling 37 25.7 12 4.3 Opportunities for inner work 34 23.6 4 1.4 Rejuvenation 30 20.8 75 27.2 Community and people 29 20.1 92 33.3 Opportunities for reflection 22 15.3 9 3.3 Learned to take better care of self 12 8.3 1 0.4 Increased confidence 7 4.9 25 9.1 Relationships improved 7 4.9 4 1.4 Became a better teacher 5 3.5 28 10.1 Became more student-focused 3 2.1 18 6.5 Took on leadership roles 2 1.4 18 6.5 Inspired to pursue advanced degrees 1 0.7 10 3.6 Personal writing and teaching of writing 1 0.7 38 13.8 New ideas for teaching 0 0.0 59 21.4

Geil
222
Question #2: As you look back on your [CTT retreat series or NWP Summer Institute] experience, what stands out as the most valuable part to you?
CTT NWP Most Valuable Part of PD Experience n % n % Community and people 57 39.6 131 47.5 Clearness committee & other CTT activities 55 38.2 1 0.4 Time 43 29.9 36 13.0 Reflection 41 28.5 7 2.5 Inner work & “Teaching who we are” 36 25.0 7 2.5 Deep conversations 17 11.8 4 1.4 Rejuvenation 16 11.1 5 1.8 Safe environment 10 6.9 11 4.0 Taking care of self 6 4.2 0 0.0 Validation/Confidence 6 4.2 13 4.7 Sharing ideas/Learning with others 4 2.8 55 19.9 New teaching ideas 1 0.7 82 29.7 Personal writing 0 0.0 84 30.4 NWP activities (teaching demos, writing groups) 0 0.0 34 12.3 Walking in students’ shoes 0 0.0 29 10.5 Research opportunities 0 0.0 17 6.2

Geil
223
APPENDIX H. LEVEL OF INVOLVEMENT SENSITIVITY ANALYSIS
Before Matching CTT (n=144) NWP (n=276) MBI Subscale Mean SD Mean SD
Mean Diff
Std Mean Diff
Emotional Exhaustion 20.87 10.56 20.01 10.39 0.86 0.08 Cynicism 4.15 4.22 4.33 4.15 -0.18 -0.04 Professional Efficacy 41.21 5.25 40.64 5.44 0.57 0.11 After Matching (Without Level of Involvement) Effect Size by Subclass
MBI Subscale
Subclass 1
Subclass 2
Subclass 3
Subclass 4
Subclass 5
Subclass 6
Weighted Effect Size*
Emotional Exhaustion
0.49 0.03 -0.49 0.06 0.06 0.81 0.12
Cynicism 0.13 -0.48 -0.19 0.33 0.67 0.8 0.18 Professional Efficacy
0.14 0.53 0.14 0.54 -0.07 -0.75 0.13
CTT n 20 19 20 19 20 13 111 NWP n 105 31 28 20 9 6 199 After Matching (With Level of Involvement) Effect Size by Subclass
MBI Subscale
Subclass 1
Subclass 2
Subclass 3
Subclass 4
Subclass 5
Subclass 6
Weighted Effect Size*
Emotional Exhaustion 0.47 0.07 -0.21 -0.05 0.68 0.70 0.25 Cynicism 0.16 -0.62 -0.03 0.08 0.66 0.80 0.14 Professional Efficacy -0.04 0.66 0.34 0.40 -0.72 -0.66 0.03 CTT n 20 19 20 19 20 13 111 NWP n 121 23 32 14 3 9 202 Note. Bold font indicates higher engagement on the part of the CTT respondents. *Weighted Effect Size is weighted by the number of cases in the treatment (CTT).