Embed Size (px)
Citation preview
1075-PI (12-2005) Replaces (2-2005) Issue
SANDIA REPORT SAND2011-6578 Unlimited Release Printed September 2011
Transformative Monitoring Approaches for Reprocessing
Benjamin B. Cipiti Prepared by Sandia National Laboratories Albuquerque, New Mexico 87185 and Livermore, California 94550
Sandia National Laboratories is a multi-program laboratory managed and operated by Sandia Corporation, a wholly owned subsidiary of Lockheed Martin Corporation, for the U.S. Department of Energy’s National Nuclear Security Administration under contract DE-AC04-94AL85000. Approved for public release; further dissemination unlimited.

2
Issued by Sandia National Laboratories, operated for the United States Department of Energy by
Sandia Corporation.
NOTICE: This report was prepared as an account of work sponsored by an agency of the
United States Government. Neither the United States Government, nor any agency thereof, nor any
of their employees, nor any of their contractors, subcontractors, or their employees, make any
warranty, express or implied, or assume any legal liability or responsibility for the accuracy,
completeness, or usefulness of any information, apparatus, product, or process disclosed, or
represent that its use would not infringe privately owned rights. Reference herein to any specific
commercial product, process, or service by trade name, trademark, manufacturer, or otherwise,
does not necessarily constitute or imply its endorsement, recommendation, or favoring by the
United States Government, any agency thereof, or any of their contractors or subcontractors. The
views and opinions expressed herein do not necessarily state or reflect those of the United States
Government, any agency thereof, or any of their contractors.
Printed in the United States of America. This report has been reproduced directly from the best
available copy.
Available to DOE and DOE contractors from
U.S. Department of Energy
Office of Scientific and Technical Information
P.O. Box 62
Oak Ridge, TN 37831
Telephone: (865)576-8401
Facsimile: (865)576-5728
E-Mail: [email protected]
Online ordering: http://www.osti.gov/bridge
Available to the public from
U.S. Department of Commerce
National Technical Information Service
5285 Port Royal Rd
Springfield, VA 22161
Telephone: (800)553-6847
Facsimile: (703)605-6900
E-Mail: [email protected]
Online order: http://www.ntis.gov/help/ordermethods.asp?loc=7-4-0#online

3
SAND2011-6578
Unlimited Release
Printed September 2011
Transformative Monitoring Approaches for Reprocessing
Benjamin B. Cipiti
Advanced Nuclear Fuel Cycle Technology
Sandia National Laboratory
P.O. Box 5800
Albuquerque, NM 87185-0747
Abstract The future of reprocessing in the United States is strongly driven by plant economics. With
increasing safeguards, security, and safety requirements, future plant monitoring systems must be
able to demonstrate more efficient operations while improving the current state of the art. The
goal of this work was to design and examine the incorporation of advanced plant monitoring
technologies into safeguards systems with attention to the burden on the operator. The
technologies examined include micro-fluidic sampling for more rapid analytical measurements
and spectroscopy-based techniques for on-line process monitoring. The Separations and
Safeguards Performance Model was used to design the layout and test the effect of adding these
technologies to reprocessing. The results here show that both technologies fill key gaps in
existing materials accountability that provide detection of diversion events that may not be
detected in a timely manner in existing plants. The plant architecture and results under diversion
scenarios are described. As a tangent to this work, both the AMUSE and SEPHIS solvent
extraction codes were examined for integration in the model to improve the reality of diversion
scenarios. The AMUSE integration was found to be the most successful and provided useful
results. The SEPHIS integration is still a work in progress and may provide an alternative
option.

4
Acknowledgement This work was funded through the Separations working group in the Fuel Cycle Technologies
program in the Department of Energy Nuclear Energy. The author would like to acknowledge
the help of Denise Lee at Oak Ridge National Laboratory for providing source files for the
SEPHIS code, and John Krebs, Jackie Copple, and Candido Pereira at Argonne National
Laboratory for developing the AMUSE SASPE code for integration in MATLAB.

5
Contents
Abstract ............................................................................................................................................3
Acknowledgement ...........................................................................................................................4
Contents ...........................................................................................................................................5
Figures..............................................................................................................................................6
Acronyms .........................................................................................................................................7
1.0 Introduction ................................................................................................................................9
2.0 Background ..............................................................................................................................10
2.1 Separations and Safeguards Performance Model (SSPM).................................................10
2.2 Process Monitoring Technologies Evaluated.....................................................................11
2.3 Solvent Extraction Codes ...................................................................................................12
3.0 Modeling of Advanced Measurement Technologies ...............................................................13
3.1 Diversion Scenario Results ................................................................................................15
3.2 Diversion Scenario Discussion ..........................................................................................18
4.0 Integration of Solvent Extraction Codes ..................................................................................19
4.1 SEPHIS ..............................................................................................................................19
4.2 AMUSE..............................................................................................................................19
4.2.1 AMUSE Results ........................................................................................................20
4.3.3 AMUSE Discussion ..................................................................................................25
5.0 Conclusion ...............................................................................................................................27
6.0 References ................................................................................................................................28
Appendix ........................................................................................................................................29
Distribution ....................................................................................................................................33

6
Figures
Figure 1: SSPM operation under a diversion scenario ...................................................................11
Figure 2: MBA2 with areas processing small and large quantities of plutonium ..........................14
Figure 3: Baseline system results ...................................................................................................16
Figure 4: Advanced NRTA system results ....................................................................................17
Figure 5: Uranium separation in UREX contactors using SASPE ................................................22
Figure 6: Plutonium separation in UREX contactors using SASPE ..............................................23
Figure 7: Technetium separation in UREX contactors using SASPE ...........................................24
Figure 8: Solvent output mass flow rates using SASPE ................................................................25

7
Acronyms AMUSE Argonne Model for Universal Solvent Extraction
CuSum ID Cumulative Sum of the Inventory Difference
MBA Material Balance Area
MPACT Material Protection, Accounting, and Control Technologies
NDA Non-Destructive Analysis
NRTA Near Real Time Accountability
PUREX Plutonium and Uranium Extraction
SASPE Stagewise Algorithm for Speciation and Partitioning Equilibrium
SASSE Spreadsheet Algorithm for Stagewise Solvent Extraction
SEPHIS Solvent Extraction Process Having Interaction Solvents
SSPM Separations & Safeguards Performance Model
TALSPEAK Rare Earth Fission Product Extraction
TBP Tributyl Phosphate
TRU Transuranics
TRUEX Transuranics Extraction
UREX Uranium Extraction
UV-Vis-NIR Ultraviolet-Visible-Near Infrared

8

9
1.0 Introduction
Nuclear fuel reprocessing plants face economic constraints due to their need for stringent safety,
safeguards, security, and environmental requirements. As such, one of the drivers of the Fuel
Cycle Technologies program is to develop designs that can significantly reduce the cost of
various systems in a future reprocessing plant. While these systems need to be efficient and
cost-effective, they also may face tighter requirements than those of existing plants in operation
around the world.
The goal of this work is to examine transformative plant monitoring approaches that use plant
data more efficiently, reduce the burden of accountancy systems on the operator, and reach a
new regime of complete plant awareness in near real time. This work utilizes a systems
approach to design and evaluate advanced plant monitoring systems. New technologies
developed in both the Separations and MPACT (Material Protection Accounting and Control
Technologies) working groups were used as the basis for this study.
The design and analysis was completed using the Separations and Safeguards Performance
Model (SSPM) which was developed at Sandia National Laboratories. The SSPM is a transient
aqueous reprocessing plant model that tracks mass flow rates through the various unit operations.
Materials accountancy and process monitoring measurements are modeled throughout the plant
to generate simulated data. This data is then used to calculate inventory differences to determine
how well the instrumentation responds to diversion events.
Parallel work in the MPACT working group has developed the architecture for the integration of
bulk process monitoring data with traditional materials accountancy [1]. In this work, the
technologies being developed in the Separations working group were also integrated. The UV-
Vis-NIR spectroscopic technique provides a method for continuous on-line monitoring of the
chemical signature of a processing solution [2]. The SSPM was used to determine the places
within the plant where this technology can make the greatest impact. In addition, current work at
Idaho National Laboratory is examining micro-fluidic sampling and more automation in the
analytical lab to significantly speed up precision measurements of actinides and other elements
in reprocessing samples [3,4]. The SSPM was used to determine how this technology can have
the greatest impact as well. The design and analysis will be presented.
As a tangent to this work, two solvent extraction codes were examined for integration into the
SSPM. Both the SEPHIS (Solvent Extraction Process Having Interaction Solutes) code [5] at
Oak Ridge National Laboratory and the AMUSE (Argonne Model for Universal Solvent
Extraction) code [6] at Argonne National Laboratory were evaluated for integration. Either of
these codes can provide a higher degree of detail in the plant model for more realistic diversion
scenario results. The initial results of the integration will be described.

10
2.0 Background
2.1 Separations and Safeguards Performance Model (SSPM)
The Separations and Safeguards Performance Model (SSPM) [1,7,8] is a transient reprocessing
plant model developed at Sandia National Laboratories for materials accountancy and process
monitoring analysis. The SSPM is constructed in MATLAB Simulink and tracks cold
chemicals, bulk fluid flow, solids, and mass flow rates of elements 1-99 on the periodic table.
The number of tracked species can be expanded to include cold chemicals or specific isotopes as
needed.
The SSPM contains a number of capabilities including:
Spent fuel source term library for user-defined runs with varying initial enrichment,
burnup, and cooling time.
Heat load and radioactivity tracking at any location in the plant.
Customizable measurement points with user-defined errors.
Automated calculation of inventory difference and error propagation in real-time,
including statistical modules for determining alarm conditions.
User-defined diversion scenarios.
Integration of process monitoring data, material measurements, material accountancy
procedures, and physical security data for complete plant monitoring.
The model is used for design and analysis of advanced plant monitoring systems. Recent work
has evaluated the integration of bulk process monitoring data (level measurements, mass flow
rates, volumetric flow rates, etc.) with traditional accounting [1]. The SSPM provides a platform
for testing new measurement technologies and evaluating the overall improvement to safeguards.
In general improvement may be measured as high sensitivity to diversion events or more timely
detection of diversion. The SSPM has also been evaluated for integration of safeguards and
security.
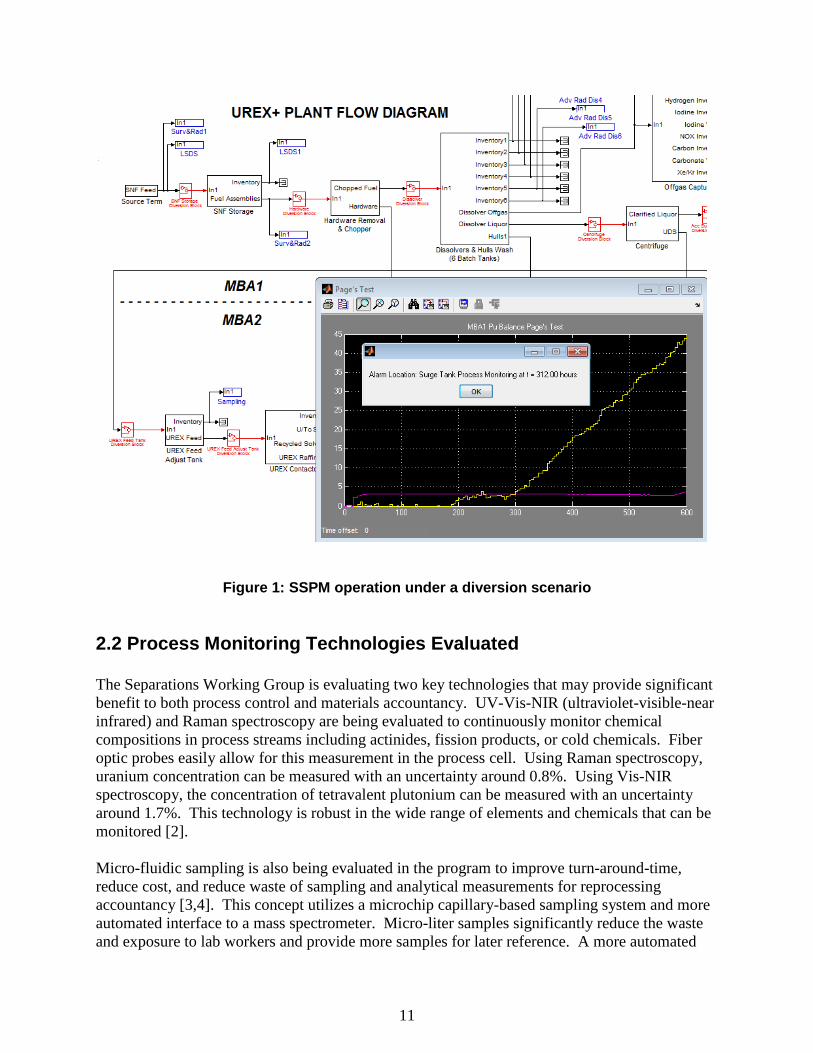
Figure 1 shows the model during operation. The underlying model is shown in the background.
Black blocks represent key unit functions, blue blocks are measurement points, and red blocks
are potential areas for setting up diversion scenarios. The scope shows an example of an alarm
condition being surpassed during a diversion scenario. The model is setup to automatically
calculate inventory differences and look for plant abnormalities that might represent material
loss.
Various versions of the model have been created. The baseline model is a UREX+ version that
includes the UREX, TRUEX, and TALSPEAK extraction steps. An alternative PUREX model
also exists. The UREX+ version is the most up-to-date and was used for the analyses presented
here.
11
Figure 1: SSPM operation under a diversion scenario
2.2 Process Monitoring Technologies Evaluated The Separations Working Group is evaluating two key technologies that may provide significant
benefit to both process control and materials accountancy. UV-Vis-NIR (ultraviolet-visible-near
infrared) and Raman spectroscopy are being evaluated to continuously monitor chemical
compositions in process streams including actinides, fission products, or cold chemicals. Fiber
optic probes easily allow for this measurement in the process cell. Using Raman spectroscopy,
uranium concentration can be measured with an uncertainty around 0.8%. Using Vis-NIR
spectroscopy, the concentration of tetravalent plutonium can be measured with an uncertainty
around 1.7%. This technology is robust in the wide range of elements and chemicals that can be
monitored [2].
Micro-fluidic sampling is also being evaluated in the program to improve turn-around-time,
reduce cost, and reduce waste of sampling and analytical measurements for reprocessing
accountancy [3,4]. This concept utilizes a microchip capillary-based sampling system and more
automated interface to a mass spectrometer. Micro-liter samples significantly reduce the waste
and exposure to lab workers and provide more samples for later reference. A more automated

12
interface will speed up the measurements to reduce overall cost and can provide the potential to
sample in more places in the reprocessing plant. In addition, a more rapid turn-around-time can
reduce the size of accountability tanks which saves capital cost for the plant.
The goal of this work was to determine where these technologies could make the greatest impact
in the reprocessing environment. Spectroscopic techniques may not have the low uncertainty
needed at accountability tanks, but they can provide tremendous value at other points in the
process. Micro-fluidic sampling enables more sampling for precise analytical measurements, but
its use will not make sense everywhere due to the impact on operations. The SSPM was used to
optimize how these technologies fit into the overall safeguards system.
2.3 Solvent Extraction Codes The development of advanced plant monitoring systems requires a model that is realistic of
actual process conditions in a reprocessing plant. While a significant amount of detail exists in
the SSPM for a majority of the process units, the separations modules originally were too
simplistic. Fortunately, other solvent extraction codes can be added to the SSPM to improve the
modeling of the contactor banks.
SEPHIS is an existing process model that predicts solute concentration profiles in aqueous and
organic phases throughout a solvent extraction process as a function of time. It has been
developed at Oak Ridge National Laboratory. The advantage of SEPHIS is that it provides
transient results. The SEPHIS model was originally designed as a simulation for the PUREX
process based on an idealized model for mixer-settlers [5]. However, other extraction steps have
been modeled in the years since its development [9]. SEPHIS has been used as the basis for
PUREX flowsheet designs at Y-12, SRNL and Hanford.
A rudimentary integration of SEPHIS into the SSPM was completed in past work, but this work
utilized a PUREX model [8,10]. A first start at the coupling of the two codes was completed and
provided transient plutonium and uranium flow rates that appeared consistent with what would
be expected. However, the coupling was not very elegant and was not designed to model UREX,
TRUEX, TALSPEAK or other extraction steps. One of the goals of this work was to examine if
a more seamless integration with the UREX+ version was possible.
AMUSE (Argonne Model for Universal Solvent Extraction) is a more recent code that originally
was developed for steady-state flow sheet design for the UREX+ suite of extraction steps [6].
The code has progressed and current work is developing a transient version. As an alternative to
the SEPHIS, AMUSE may provide another route to including solvent extraction in the SSPM.
The goal of this work was to integrate AMUSE to the SSPM and compare which code can be
more easily integrated directly into the model.

13
3.0 Modeling of Advanced Measurement Technologies Current and past work under the MPACT (Material Protection Accounting and Control
Technologies) campaign has examined the move toward near real time accountability (NRTA) of
actinides in reprocessing. NRTA requires actinide measurements at all points within a plant as
well as at the accountability tanks at the beginning and ends of a material balance area (MBA).
NRTA provides much more timely detection of material loss, so a plant operator could respond
more rapidly to any plant anomaly (which may include an intentional diversion or a leaking
vessel).
The NRTA approach is different for the two different MBAs that have been examined. MBA1
either contains spent fuel in solid form or in solution. Since no extractions have taken place yet,
every area of the front end has roughly equal importance to the MBA1 balance. In other words,
each area in MBA1 is processing large quantities of plutonium, so precision measurements are
needed throughout. These measurements depend highly on a plutonium measurement in spent
fuel, as it could be used to estimate plutonium content in most of the rest of MBA1. Sampling
and spectroscopic techniques are not appropriate here, so MBA1 will be ignored for the rest of
this section.
In MBA2, most of the areas in the plant are processing liquids, so sampling and spectroscopy
techniques may be applicable in many locations. A previous sensitivity study found which areas
within this MBA contribute the most to overall uncertainty [1]. Figure 2 shows the areas that
process large amounts of plutonium in yellow—these key tanks would need to be sampled and
measured with low uncertainty using analytical techniques for NRTA. The micro-fluidic
sampling technology could be useful in these locations since NRTA requires more measurements
as compared to traditional accounting. The areas shown in green are areas that process small
quantities of plutonium. This may be because either the plutonium has been separated or
because the amount of material in process at any one time is very small. For these areas, higher
measurement uncertainties (10-20%) are adequate. These areas may be ideal locations for
spectroscopic techniques.
The SSPM was used to test this overall safeguards architecture for MBA2. The goal was to
parametrically determine how these technology improvements would improve the overall
system. In the model, the areas shown in yellow were assumed to use micro-fluidic sampling
and analytical measurements to determine plutonium concentration to r (random error) = s
(systematic error) = 0.2%. The areas shown in green were assumed to utilize a spectroscopic or
other NDA technique to estimate total plutonium content to r = s = 2%. In reality, both
analytical sampling and spectroscopic techniques do not determine total plutonium content, but
rather they can determine concentration. Tank level measurements are used in parallel to
determine total plutonium content. The integration of the bulk process monitoring data will be
discussed in more detail later.

14
Figure 2: MBA2 with areas processing small (green) and large (yellow) quantities of plutonium
The effects of the above changes needed to be compared to a baseline that is representative of
what is done in existing plants. This was somewhat difficult to implement since existing
reprocessing plants use PUREX, and MBA2 is simpler than that shown here. Discussions with
an expert in the implementation of safeguards on Rokkasho were used to estimate how the
existing plants work [11]. The baseline assumed sampling and analytical measurements at the
accountability tank and the three key product tanks in MBA2 (uranium product, fission product
waste, and TRU product tanks). These areas were assumed to achieve plutonium concentration
measurements with r = s = 0.2%. The rest of the plant can only use bulk process data to
estimate plutonium content, but does not measure specific actinides. Actinide content can only
be estimated from measurements in the accountability tank. In addition, this estimating leads to
an uncertainty that was modeled as a 10% random error.
Four diversion scenarios were evaluated for both the baseline and advanced monitoring
strategies. Both abrupt and protracted diversions were modeled, as well as both direct and
substitution diversions. An abrupt diversion is an immediate removal of material (usually over a
day or less), while protracted diversions involve a gradual removal of material over weeks or
months. Direct diversion involves directly removing the material or processing solution;
substitution diversions involve removing material and replacing it with a surrogate (such as nitric
acid solution). The following section describes the results of the diversion scenarios.

15
3.1 Diversion Scenario Results
A total of 4 diversion scenarios were examined for both the baseline and advanced NRTA
system. These included the following:
Abrupt, direct diversion – Removal from the Stripper Tank before the TRUEX extraction
starting at hour 300 and ending at hour 324 for a total removal of 8 kg of plutonium.
Abrupt, substitution diversion – Same as the previous, except the removed material was
replaced with clean solution.
Protracted, direct diversion - Removal from the Stripper Tank before the TRUEX
extraction starting at hour 300 and ending at hour 1900 for a total removal of 8 kg of
plutonium.
Protracted, substitution diversion – Same as the previous, except the removed material
was replaced with clean solution.
The baseline system utilized the process monitoring balances and the Page’s Test to look for
bulk material loss in the Stripper Tank. On the other hand, the plutonium balance was not able to
use the Page’s Test due to the higher uncertainty of the baseline system. (This was not a
limitation of the test, but rather of the way the test was implemented in the model. In order to
run the Page’s Test as the model runs, a bias correction was first applied. With the higher
measurement uncertainties of the baseline system, the bias correction did not work well.)
Instead, the cumulative sum of the inventory difference (CuSum ID) was used to determine if the
diversion could be detected.
Figure 3 shows the results of the four diversion scenarios under the baseline system. In all cases,
the plutonium CuSum ID was not able to detect material loss. The scatter in the data due to the
uncertainty was high, and 8 kg of plutonium could easily be hidden. The error bars in the
CuSum ID plots grew very quickly due to the 10% uncertainty on the estimation. Even if a more
formal Page’s Test were applied to this data, the errors are too high to provide any level of
detectability. For the direct diversion scenarios, the process monitoring system was able to
detect both the abrupt and protracted diversions (as indicated by the alarm message windows),
but as expected, the substitution diversions were not detected. Therefore, the process monitoring
balances do provide some level of protection.
Figure 4 shows the results of the same four diversion scenarios under the advanced NRTA
system. With the much lower inventory measurement uncertainty, the Page’s Test on the
plutonium balance was able to detect all four diversion scenarios. Detection occurred before one
half of a significant quantity was removed, so this system would provide adequate time for a
security force to respond. Again, the process monitoring system was only able to detect direct
material loss, but the detection was quicker than for the plutonium balance for these two cases.
Combined, this new system is able to detect all four classes of diversion scenarios in a timely
manner. There will be a limit to the detectability of very long protracted diversions, but this
system is a significant improvement over current facilities.

16
Figure 3: Baseline system results (a) abrupt direct diversion, (b) abrupt substitution diversion, (c) protracted direct diversion, (d) protracted substitution diversion
b b
a a
c c
d d

17
Figure 4: Advanced NRTA system results (a) abrupt direct diversion, (b) abrupt substitution diversion, (c) protracted direct diversion, (d) protracted substitution
diversion
b b
a a
c c
d d

18
3.2 Diversion Scenario Discussion
The traditional accounting approach was not able to detect substitution diversions at all. Because
the traditional approach only uses bulk process data for all of the internal tanks/vessels along
with an assumption of actinide content from the accountability tank, a substitution diversion is
not realized. In reality, a substitution diversion may be detected at plant flushout when the sum
total of the inputs is balanced against the sum total of the outputs. However, material could be
long gone by that point. The 10% estimation error makes it very difficult to detect any type of
diversion using the plutonium balance alone.
The NRTA system is superior to the baseline system both because of the improvement in
measurement uncertainty at the key plutonium tanks internal to MBA2, and because the
measurements throughout the internal tanks provides protection against substitution diversions.
The micro-fluidic technique, or some similar technology, will be required to allow for rapid
sampling and analysis of these additional tanks. The UV-Vis-NIR technique, or similar, will be
required to provide protection against substitution diversion scenarios in the areas processing
smaller quantities of actinides.
In reality, the UV-Vis-NIR system cannot detect total plutonium, but rather the concentration in
the process stream. For direct material loss, UV-Vis-NIR will not show any change to the
concentration, but the bulk process monitoring balance will indicate the material loss. For a
substation diversion, the bulk material balance will not show any change, but UV-Vis-NIR will
show a drop off in concentration. The two systems must be integrated for full protection. It also
provides an advantage in that it tells the operator whether the material loss was abrupt or
substituted. This system can also be used to determine other plant anomalies such as problems
with the extraction steps or potential leaks in the system.

19
4.0 Integration of Solvent Extraction Codes Past work examined the integration of the ORNL SEPHIS code with the SSPM in order to
provide more realism of the contactor blocks in the plant model. However, this integration was
limited to PUREX and was a rough coupling between the codes. Part of the goal of the effort
this year was to examine if an alternative approach could be used. A SEPHIS version that was
designed for UREX, TRUEX, and TALSPEAK was examined for more efficient integration.
Also, the ANL AMUSE code was examined for integration.
4.1 SEPHIS
The past integration of a PUREX version of SEPHIS in the SSPM was limited in the number of
elements tracked. It also required many layers of integration which led to insights for future
improvements. The main drawback was that the code was written as an executable that had to be
called outside of MATLAB. Direct coding into MATLAB m-files or as embedded functions is
more ideal.
A recent version of SEPHIS was modified to include the UREX, FPEX, TRUEX, and
TALSPEAK extraction steps [9]. It was also converted into Fortran-90 to make a more current
code. The Fortran-90 source files (as developed at ORNL) were used as the starting point for
integration into MATLAB. An open-source matlab code [12] was used to convert the Fortran-90
files to MATLAB m-files.
The conversion was not completely straight-forward and led to a number of errors. These were
corrected by hand first with the goal to get the code to run. A larger effort was required to
examine the m-files to make sure the code was producing useful results. Unfortunately, due to
the limited amount of time spent on this conversion process, the analysis was not completed by
the end of the year. The code did compile and run in MATLAB, but it will take more time to
ensure that the code is producing correct results.
One of the insights of the past work with SEPHIS was that it is based on mixer-settler tanks.
These tanks are much larger by volume than contactors, and past plant designs may have used
lower flow rates. Therefore, the equilibrium times were on the order of hours. SEPHIS does
take into account time dependence, which is a key benefit, but the volumes and flow rates will
need to be examined for applicability to contactor banks. Since contactors have low volumes
and since the plant design of the SSPM has high flow rates, the equilibrium time is likely to be
on the order of minutes. More success was achieved with the AMUSE integration as described
in the next section.
4.2 AMUSE
The AMUSE model for solvent extraction uses two components. SASPE (Stagewise Algorithm
for Speciation and Partitioning Equilibrium) performs the calculation for distribution ratios and
SASSE (Spreadsheet Algorithm for Stagewise Solvent Extraction) performs the mass balance
[13]. Since the SSPM already performs a mass balance for each species, only the SASPE code

20
was needed for integration. Researchers at ANL developed a mex file (which is compatible with
MATLAB) for SASPE in a version that is universal for a number of aqueous extraction
processes. The extraction type, the important species and their concentrations, and the
extractants need to be specified.
SASPE determines the distribution ratio for the aqueous and organic outputs for a particular
centrifugal contactor. A contactor bank requires running SASPE a number of times for each
contactor and continuously updating the concentration profiles between each stage. A mass
balance is calculated for each stage as well.
The integration of SASPE in the Simulink model required the use of an embedded MATLAB
code block that pulls the concentration data from the input streams into a contactor bank. The
embedded code sets up the input variables needed for SASPE for that particular contactor bank.
The inputs for the SASPE calculation change for the three different sections of the contactor
bank, so three call functions are used. The distribution values are calculated, and then the mass
balance across each contactor is used to calculate the output concentrations. The calculation
takes into account the counter-flow of the aqueous and organic streams. This embedded code
along with the three SASPE call function m-files are shown in the appendix.
Working in the time dependence was one of the more tricky parts of the integration with SASPE.
SASPE calculates steady-state results and does not include any time dependence. In order to
estimate time dependence, the calculation was performed in discrete time increments based on
the contactor filling time. Initially during a startup condition, the concentrations of the species of
interest are all zero between all stages. Once the dissolver solution reaches the eighth contactor
(since the aqueous solution travels backwards from contactor 8 to 1), the first SASPE calculation
will only produce an output for contactor 8. The next calculation will produce outputs for 8 and
7, and so on until an output comes out of the first contactor. The contactor volume was simply
divided by the feed rate to determine the time increment.
This approximation for time dependence is not ideal, but probably a good approximation for this
model. The time to steady-state is on the order of a few minutes due to the small contactor
volumes and high flow rates. From the standpoint of safeguards, this equilibrium time is almost
negligible, so as long as the calculation is in the right order of magnitude, it satisfies the needs of
the SSPM. ANL is currently working on a time-dependent AMUSE model. In the future, it
might be best to directly integrate this version instead.
4.2.1 AMUSE Results
The SASPE integration was set up for the UREX contactor back to test the results. Uranium,
technetium, and plutonium were tracked through the calculations. A 24 stage contactor bank was
assumed. The aqueous feed from the adjustment tank enters stage 8 and leaves stage 1 as the
raffinate. The scrub enters stage 14, is added to the aqueous feed at stage 8 and leaves stage 1.
The strip enters stage 24 and leaves stage 15 as the U/Tc product. The organic TBP solvent
flows countercurrent and enters stage 1 and leaves stage 24 as cleaned solvent for recycle.
21
The inputs into the SASPE calculation from the model included the aqueous flow, scrub flow,
strip flow, and solvent flow rates; and the concentrations of uranium, technetium, and plutonium.
The calculation is set up so that these values can change from the model, but the results will be
directly calculated with a time step of 0.01 hours.
The following 4 figures show the results. All of the following figures are zoomed in the x-axis
to the startup condition to readily show the transient nature of the response. It takes about 30
hours for material to make it to the UREX contactors in the SSPM. Figure 5 shows the uranium
mass flow rates for the feed, raffinate, and strip product. As expected, the uranium ends up in
the strip solution, indicating that the SASPE model and calculation are behaving as expected.
The transient nature shows the buildup in the contactor bank with time—since this is mainly
driven by the contactor volumes, steady-state is reached on the order of minutes.
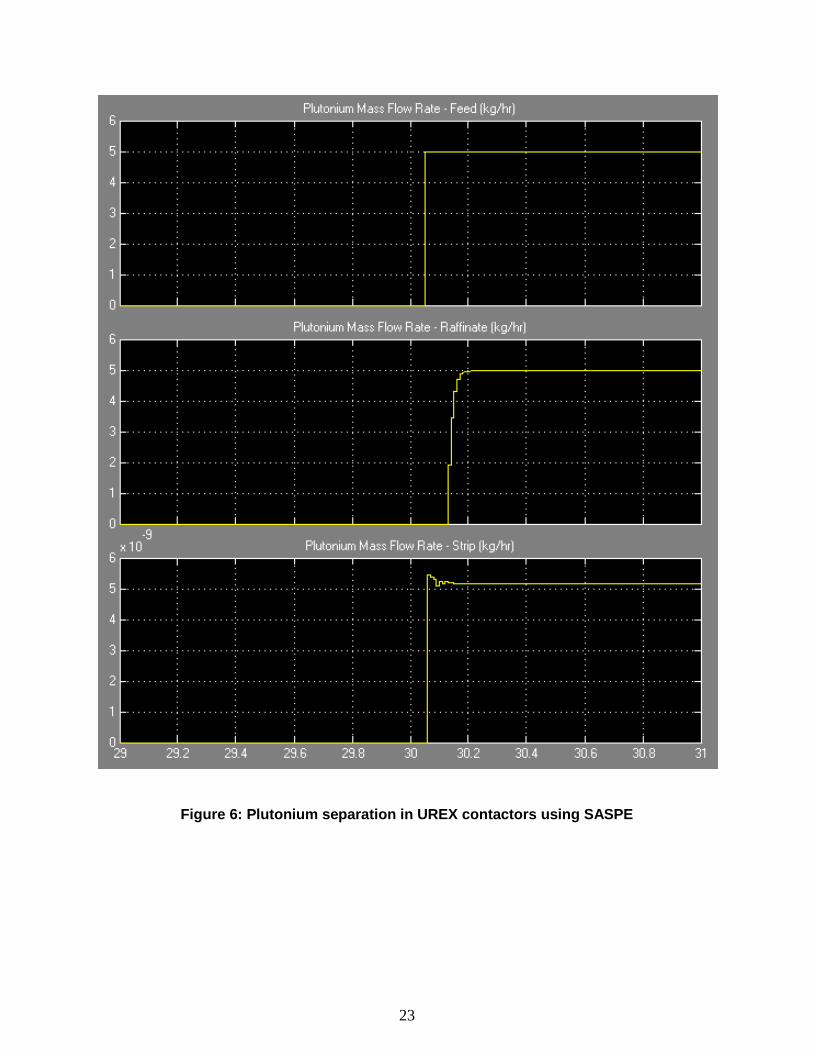
Figure 6 shows the plutonium mass flow rates. In this case, the plutonium ends up in the
raffinate stream. Figure 7 shows the technetium mass flow rate. Similarly to the uranium, the
technetium ends up in the strip product. In all cases, the output from the contactor banks
balances completely with the input after steady-state is achieved, which validates the mass
balance calculations. Figure 8 shows the uranium, plutonium, and technetium mass flow rates
coming out with the solvent, and these values are very small as expected.

22
Figure 5: Uranium separation in UREX contactors using SASPE
23
Figure 6: Plutonium separation in UREX contactors using SASPE

24
Figure 7: Technetium separation in UREX contactors using SASPE

25
Figure 8: Solvent output mass flow rates using SASPE
4.2.2 AMUSE Discussion
The AMUSE integration was successful with the one uncertainty about time dependence. One of
the key advantages of the SASPE mex file is that it can be used for any extraction process in the
SSPM, so integration with the other extraction steps should be straight-forward. The modeling
allows the user to know how the actinides are distributed in the contactor bank.

26
A disadvantage of the SASPE integration is that it slowed the model down considerably. Since
the time dependence was tied directly to the calculation update time, changing it to make the
model run more quickly will create a false time dependence. On the other hand, this work
showed that the equilibrium times for the contactor banks were small (on the order of minutes)
due to the small contactor volumes and large flow rates. From the safeguards perspective, these
transient times are almost negligible in the model. A work-around would be to calculate the
equilibrium directly without time dependence and run SASPE less often.

27
5.0 Conclusion
NRTA can be achieved for a vast majority of an aqueous reprocessing plant by utilizing
additional sampling at key plutonium tanks and by utilizing simple spectroscopic or other NDA
measurements at areas processing small quantities of plutonium. The micro-fluidic sampling
work at INL can speed up the measurement time, making it possible to sample in more locations
for the same operating cost. The UV-Vis-NIR spectroscopic techniques being investigated at
PNNL provide a simple and effective method for measuring areas processing small actinide
quantities. Coupled with process monitoring measurements that must be present in the plant
anyway, such an integrated system is unlikely to burden the operator more than with existing
monitoring systems. Diversion scenarios have shown that such a system is able to detect various
diversion events before half of a significant quantity is removed, as opposed to many months
later during a plant flushout.
The integration of solvent extraction codes was examined to add robustness to the model. The
AMUSE integration (through integration with SASPE) was completed with a modest amount of
time. Initial results show expected separation fractions, but time dependence is not inherent in
the model. A rough workaround was used for time-dependence. However, it was found that
equilibrium times were on the order of minutes, so transients are unlikely to affect diversion
scenarios which are typically on longer time scales. The integration with SEPHIS will take more
time to complete, and may be worthwhile to include time dependence. The initial results with
SASPE were more encouraging and easier to replicate throughout the plant for a number of
species.

28
6.0 References
1. B.B. Cipiti, ―Separations and Safeguards Performance Modeling for Advanced
Reprocessing Facility Design,‖ Journal of Nuclear Materials Management, 39/2 pp. 4-14
(January 2011).
2. L.M. Arrigo et al., ―FY 2009 Progress: Process Monitoring Technology at PNNL,‖ PNNL-
19136 (December 2009).
3. D. Bowers et al., ―Enhanced AFCI Sampling, Analysis, and Safeguards Technology
Review,‖ INL/EXT-09-16997 (September 2009).
4. D. Meikrantz and J. Svoboda, ―Enhanced Sampling and Analysis, Selection of Technology
for Testing,‖ INL/EXT-10-17919 (February 2010).
5. R.H. Rainey and S.B. Watson, ―Modification of the SEPHIS Computer Code for
Calculating the PUREX Solvent Extraction System,‖ ORNL-TM-5123, Oak Ridge
National Laboratory (1975).
6. M.C. Regalbuto et al., "Solvent Extraction Process Development for Partitioning and
Transmutation of Spent Fuel," Actinide and Fission Product Partitioning and
Transmutation, Eighth Information Exchange Meeting, Nuclear Energy Agency
Organization for Economic Co-operation and Development, Las Vegas, Nevada (2004).
7. B.B. Cipiti, ―Separations and Safeguards Performance Model,‖ SAND2009-4896 (August
2009).
8. B.B. Cipiti and O.R. Zinaman, ―Separations and Safeguards Model Integration,‖
SAND2010-5962 (September 2010).
9. J.A. Roberts and D.L. Schuh, ―Computation Model for UREX+1a in Support of a New
Reprocessing Plant in the United States,‖ University of Wisconsin-Madison Report
(August 2007).
10. B.B. Cipiti, V.F. de Almeida, I.C. Gauld, J.F. Birdwell, and D.W. DePaoli, ―Coupling a
Transient Solvent Extraction Module with the Separations and Safeguards Performance
Model,‖ SAND2009-6307, ORNL/TM-2009/205 (October 2009).
11. M. Ehinger, Oak Ridge National Laboratory, personal communication (2011).
12. F2matlab open source code, available at sourceforge.net/projects/f2matlab/ (2011).
13. J. Copple, K. Frey, J. Krebs, and C. Pereira, ―Integration of AMUSE with SafeSeps
Architecture,‖ Argonne National Laboratory, not yet published (2011).

29
Appendix
Embedded MATLAB function for calling SASPE:
function
[raffuout,raffpuout,rafftcout,stripuout,strippuout,striptcout,tbpuout,tbppuou
t,tbptcout] = fcn(aflow,oflow,uconc,puconc,tcconc) % This block supports the Embedded MATLAB subset. % The purpose of this embedded function is to call the Solvent Extraction
Unit m-file. % This block was specifically written for UREX, but it does not include the % scrub step
eml.extrinsic('callSASPE'); eml.extrinsic('callSASPE2'); eml.extrinsic('callSASPE3'); eml.extrinsic('disp');
dVals=[0;0;0;0;0]; %must be initialized first
persistent aquconc; persistent aqpuconc; persistent aqtcconc; persistent oruconc; persistent orpuconc; persistent ortcconc; persistent utemp; persistent putemp; persistent tctemp; persistent tem9u; persistent tem9pu; persistent tem9tc;
if isempty(oruconc) aquconc=zeros(1,25); aqpuconc=zeros(1,25); aqtcconc=zeros(1,25); oruconc=zeros(1,25); orpuconc=zeros(1,25); ortcconc=zeros(1,25); utemp=zeros(1,24); putemp=zeros(1,24); tctemp=zeros(1,24); tem9u=0; tem9pu=0; tem9tc=0; end
aquconc(9)=uconc/1.5+tem9u/3; %adds in the aq stream coming from scrub aqpuconc(9)=puconc/1.5+tem9pu/3; aqtcconc(9)=tcconc/1.5+tem9tc/3; aquconc(15)=0; %reset to zero since strip is pulled out here aqpuconc(15)=0; aqtcconc(15)=0;

30
aquconc(25)=0; aqpuconc(25)=0; aqtcconc(25)=0;
for i=1:8 % three scripts for the 3 different sections of the bank [dVals] = callSASPE(aquconc(i+1), aqpuconc(i+1), aqtcconc(i+1), oruconc(i),
orpuconc(i), ortcconc(i)); utemp(i)=dVals(2); putemp(i)=dVals(3); tctemp(i)=dVals(4); end
for i=9:14 [dVals] = callSASPE2(aquconc(i+1), aqpuconc(i+1), aqtcconc(i+1), oruconc(i),
orpuconc(i), ortcconc(i)); utemp(i)=dVals(2); putemp(i)=dVals(3); tctemp(i)=dVals(4); end
for i=15:24 [dVals] = callSASPE3(aquconc(i+1), aqpuconc(i+1), aqtcconc(i+1), oruconc(i),
orpuconc(i), ortcconc(i)); utemp(i)=dVals(2); putemp(i)=dVals(3); tctemp(i)=dVals(4); end
% Convention is that conc(i) is the concentration between contactors % i-1 and i. Also aqueous flows backwards so output of contactor 7 is % aqueous index 7 and organic index 8.
for i=1:8 aquconc(i)=(aflow*1.5*aquconc(i+1)+oflow*oruconc(i))/(aflow*1.5+utemp(i)*oflo
w); oruconc(i+1)=utemp(i)*aquconc(i); aqpuconc(i)=(aflow*1.5*aqpuconc(i+1)+oflow*orpuconc(i))/(aflow*1.5+putemp(i)*
oflow); orpuconc(i+1)=putemp(i)*aqpuconc(i); aqtcconc(i)=(aflow*1.5*aqtcconc(i+1)+oflow*ortcconc(i))/(aflow*1.5+tctemp(i)*
oflow); ortcconc(i+1)=tctemp(i)*aqtcconc(i); end
for i=9:14 aquconc(i)=(aflow/2*aquconc(i+1)+oflow*oruconc(i))/(aflow/2+utemp(i)*oflow); oruconc(i+1)=utemp(i)*aquconc(i); aqpuconc(i)=(aflow/2*aqpuconc(i+1)+oflow*orpuconc(i))/(aflow/2+putemp(i)*oflo
w); orpuconc(i+1)=putemp(i)*aqpuconc(i); aqtcconc(i)=(aflow/2*aqtcconc(i+1)+oflow*ortcconc(i))/(aflow/2+tctemp(i)*oflo
w); ortcconc(i+1)=tctemp(i)*aqtcconc(i); end

31
for i=15:24 aquconc(i)=(aflow*10*aquconc(i+1)+oflow*oruconc(i))/(aflow*10+utemp(i)*oflow)
; oruconc(i+1)=utemp(i)*aquconc(i); aqpuconc(i)=(aflow*10*aqpuconc(i+1)+oflow*orpuconc(i))/(aflow*10+putemp(i)*of
low); orpuconc(i+1)=putemp(i)*aqpuconc(i); aqtcconc(i)=(aflow*10*aqtcconc(i+1)+oflow*ortcconc(i))/(aflow*10+tctemp(i)*of
low); ortcconc(i+1)=tctemp(i)*aqtcconc(i); end
tem9u=aquconc(9); % required for adding above tem9pu=aqpuconc(9); tem9tc=aqtcconc(9);
raffuout=aquconc(1); raffpuout=aqpuconc(1); rafftcout=aqtcconc(1); stripuout=aquconc(15); strippuout=aqpuconc(15); striptcout=aqtcconc(15); tbpuout=oruconc(25); tbppuout=orpuconc(25); tbptcout=ortcconc(25);
end
callSASPE.m file (calculates D-ratios for stages 1-8):
function [dVals] = callSASPE(auc, apuc, atcc, ouc, opuc, otcc)
comps = {'H_(1)', 'UO2_(2)', 'Pu_(4)', 'TcO4_(-1)', 'CH3CONHOH_(0)'}; proc = 'UREX'; aConc = [0.87, auc, apuc, atcc, 0.33]; oConc = [0.0, ouc, opuc, otcc, 0.0]; vRatio = 2.0; temp = 25.0; exTBP = 1.3; exCMPO = 0.0; exCCD = 0.0; exPEG = 0.0; exCROWN = 0.0;
[dVals] =
SASPE_mx_140(comps,proc,aConc,oConc,vRatio,temp,exTBP,exCMPO,exCCD,exPEG,exCR
OWN);
end

32
callSASPE2.m file (calculates D-ratios for stages 9-14):
function [dVals] = callSASPE2(auc, apuc, atcc, ouc, opuc, otcc)
comps = {'H_(1)', 'UO2_(2)', 'Pu_(4)', 'TcO4_(-1)', 'CH3CONHOH_(0)'}; proc = 'UREX'; aConc = [0.3, auc, apuc, atcc, 0.5]; oConc = [0.0, ouc, opuc, otcc, 0.0]; vRatio = 6.2; temp = 25.0; exTBP = 1.3; exCMPO = 0.0; exCCD = 0.0; exPEG = 0.0; exCROWN = 0.0;
[dVals] =
SASPE_mx_140(comps,proc,aConc,oConc,vRatio,temp,exTBP,exCMPO,exCCD,exPEG,exCR
OWN);
End
callSASPE3.m file (calculates D-ratios for stages 15-24):
function [dVals] = callSASPE3(auc, apuc, atcc, ouc, opuc, otcc)
comps = {'H_(1)', 'UO2_(2)', 'Pu_(4)', 'TcO4_(-1)', 'CH3CONHOH_(0)'}; proc = 'UREX'; aConc = [0.1, auc, apuc, atcc, 0.0]; oConc = [0.0, ouc, opuc, otcc, 0.0]; vRatio = 0.31; temp = 25.0; exTBP = 1.3; exCMPO = 0.0; exCCD = 0.0; exPEG = 0.0; exCROWN = 0.0;
[dVals] =
SASPE_mx_140(comps,proc,aConc,oConc,vRatio,temp,exTBP,exCMPO,exCCD,exPEG,exCR
OWN);
end

33
Distribution
1 Terry Todd
Idaho National Laboratory
2525 Fremont Ave.
Idaho Falls, ID 83415
1 James Bresee
U.S. Department of Energy
1000 Independence Ave. SW
Washington, DC 20585
1 Candido Pereira
Argonne National Laboratory
9700 S. Cass Ave.
Argonne, IL 60439
1 John Krebs
Argonne National Laboratory
9700 S. Cass Ave.
Argonne, IL 60439
1 Jackie Copple
Argonne National Laboratory
9700 S. Cass Ave.
Argonne, IL 60439
1 Sam Bryan
Pacific Northwest National Laboratory
P.O. Box 999
Richland, WA 99352
1 Jack Law
Idaho National Laboratory
2525 Fremont Ave.
Idaho Falls, ID 83415
1 John Svoboda
Idaho National Laboratory
2525 Fremont Ave.
Idaho Falls, ID 83415
1 MS 0747 Ben Cipiti, 6223
1 MS 0474 Ken Sorenson, 6223
1 MS 0899 Technical Library, 9536 (electronic copy)