Embed Size (px)
Citation preview
University of San Diego University of San Diego
Digital USD Digital USD
Dissertations Theses and Dissertations
2016
Transformative Models in K-12 Education: The Impact of a Transformative Models in K-12 Education: The Impact of a
Blended Universal Design for Learning Intervention Blended Universal Design for Learning Intervention
Kai Monet Mathews University of San Diego
Follow this and additional works at: https://digital.sandiego.edu/dissertations
Part of the Educational Assessment, Evaluation, and Research Commons, and the Science and
Mathematics Education Commons
Digital USD Citation Digital USD Citation Mathews, Kai Monet, "Transformative Models in K-12 Education: The Impact of a Blended Universal Design for Learning Intervention" (2016). Dissertations. 53. https://digital.sandiego.edu/dissertations/53
This Dissertation: Open Access is brought to you for free and open access by the Theses and Dissertations at Digital USD. It has been accepted for inclusion in Dissertations by an authorized administrator of Digital USD. For more information, please contact [email protected].

Transformative Models in K-12 Education: The Impact of a Blended Universal Design for Learning Intervention
An Experimental Mixed Methods Study
by
Kai Monet Mathews
A dissertation submitted in partial fulfillment of the requirements for the degree of
Doctor of Philosophy
May 2016
Dissertation Committee
Lea Hubbard, Ph.D. Lee Williams, Ph.D.
Afsaneh Nahavandi, Ph.D.
University of San Diego

@ Copyright by Kai Monet Mathews All Rights Reserved 2016


ABSTRACT
Accountability measures, by way of standardized curriculum and assessments,
have played a large part in the attempt to ensure that students from all backgrounds
receive equal access to quality education. However, the inherent disadvantage of a
standardized system is the implied assumption that all students come in with the same
knowledge, learn at the same pace, and learn the same way. In the wake of an
increasingly diverse K-12 population, educational researchers, learning theorists, and
practitioners agree that the concept of the average student is, in fact, a myth. Students
come to school with different needs, norms, interests, cultural behavior, knowledge,
motivations, and skill sets. In order for education to properly address the issue of equity,
the issue of learner variance must first be attended to.
In 2010, the U.S. Department of Education released its educational plan
encouraging teachers to address student variance through more inclusive learning
environments. The report highlighted Blended Learning (BL) and Universal Design for
Learning (UDL) as promising practices in enabling, motivating, and inspiring all students
to achieve regardless of background, language, or disability. Research suggests that the
combination of these two approaches could lead to transformative teaching practices that
dramatically impact student learning. However, the efficacy of such a model has yet to be
tested.
This study tested the efficacy of a Blended Universal Design for Learning
(BUDL) model in improving student outcomes. An experimental design was used to
explore the impact of a two-week BUDL intervention in an accelerated 7th grade math
class. The effect on student achievement, engagement, and perception was measured.

Both quantitative and qualitative data were collected. Though results from the study were
statistically insignificant, possible positive associations between a BUDL intervention
and student achievement, engagement, and perception emerged. Considerations for
clinical significance, suggestions for improvement on the BUDL model, and implications
for future research are discussed.

DEDICATION
For my parents, Mark and Gail Mathews. Your relentless faith in my abilities, unyielding
support in my development, and unconditional love have brought me thus far. I am
grateful, blessed, and highly favored to have you two as parents. I love you.
vi
ACKNOWLEDGEMENTS
Thank you to my dissertation committee Dr. Hubbard, Dr. Williams, and Dr.
Nahavand for your guidance, support, and endless hours of advice. Lea you have and
continue to be my number one supporter and I am truly grateful and honored. Thank you
for pushing and advising me these past four years. I am a better woman because of it.
Thank you Lee for lending your academic and practical expertise to me and my work.
Your assistance on my quantitative analysis and the perspective you brought to my
committee was game-changing. Afsaneh, thank you for your guidance, encouragement
and leadership. You inspire me to be great and to do great work.
Lastly, I would like to thank Mariko for helping me stay sane through this
process, for listening when I needed to vent, for contributing when I need help, and for
supporting me in everything I want to do and become.

vii
TABLE OF CONTENTS
ACKNOWLEDGEMENTS .......................................................................................................... VI
LIST OF TABLES ........................................................................................................................ XI
LIST OF FIGURES ..................................................................................................................... XII
CHAPTER ONE: BACKGROUND AND PURPOSE OF THE STUDY ..................................... 1
INTRODUCTION ............................................................................................................................ 1
BLENDED LEARNING 101 ............................................................................................................. 1
UNIVERSAL DESIGN FOR LEARNING 101 ...................................................................................... 1
ADDRESSING STUDENT DIVERSITY .............................................................................................. 2
THE NEEDS OF A GLOBALIZED SOCIETY ...................................................................................... 4
SEMINAL LEARNING THEORIES .................................................................................................... 6
STATEMENT OF THE PROBLEM ..................................................................................................... 9
Gaps in Blended Learning Research ....................................................................................... 9
Gaps in Universal Design for Learning Research ................................................................... 9
CONCEPTUAL UNDERPINNINGS FOR THE STUDY ........................................................................ 11
PURPOSE OF THE STUDY ............................................................................................................. 14
GUIDING RESEARCH QUESTION ................................................................................................. 15
DEFINITION OF KEY TERMS ....................................................................................................... 15
SUMMARY .................................................................................................................................. 15
CHAPTER TWO: REVIEW OF THE LITERATURE ................................................................ 18
THE NEXT BIG THING ................................................................................................................ 18
BLENDED LEARNING .................................................................................................................. 18

viii
Conceptual Framework ......................................................................................................... 19
The Definition ....................................................................................................................... 19
Varying Models and Practices .............................................................................................. 20
Reported Instructional Outcomes ......................................................................................... 26
Reported Student Outcomes ................................................................................................. 30
UNIVERSAL DESIGN FOR LEARNING ........................................................................................... 33
Conceptual Framework ......................................................................................................... 33
The Definition ....................................................................................................................... 34
Varying Models and Practice ................................................................................................ 35
Reported Student Outcomes ................................................................................................. 37
SUMMARY .................................................................................................................................. 41
CHAPTER THREE: A PREFACE TO THE METHODOLOGY ................................................ 42
CHANGES IN THE PROPOSED STUDY ........................................................................................... 42
CHAPTER FOUR: METHODOLOGY ....................................................................................... 44
RESEARCH METHODS ................................................................................................................. 44
Site and Participant Selection ............................................................................................... 46
Power Sample ....................................................................................................................... 49
The Intervention .................................................................................................................... 50
Experimental Curriculum ...................................................................................................... 52
Data Collection ..................................................................................................................... 55
Data Analysis ........................................................................................................................ 58
POSITIONALITY .......................................................................................................................... 61
DESIGN LIMITATIONS ................................................................................................................. 62

ix
SUMMARY .................................................................................................................................. 64
CHAPTER FIVE: FINDINGS ...................................................................................................... 65
INTRODUCTION .......................................................................................................................... 65
IMPACT ON STUDENT ACHIEVEMENT ......................................................................................... 65
Quiz Results .......................................................................................................................... 65
Test Results ........................................................................................................................... 68
IMPACT ON STUDENT ENGAGEMENT .......................................................................................... 71
ATMI Results........................................................................................................................ 71
Classroom Observation Results ............................................................................................ 76
Teacher Interview Results ..................................................................................................... 81
IMPACT ON STUDENT PERCEPTION ............................................................................................. 82
Pre Student Focus Group Results ......................................................................................... 82
Post Student Focus Group Results ........................................................................................ 84
IMPACT ON ELL AND IEP .......................................................................................................... 86
Achievement Results ............................................................................................................ 86
Engagement & Perception Results ........................................................................................ 88
IMPACT ON TEACHER PERCEPTION ............................................................................................. 88
CHAPTER SIX: DISCUSSION AND IIMPLICATIONS ........................................................... 92
SUMMARY OF FINDINGS ............................................................................................................. 92
Student Achievement ............................................................................................................ 92
Student Engagement ............................................................................................................. 93
Student Perception ................................................................................................................ 94
ELL & IEP Students ............................................................................................................. 94

x
Teacher Perception ................................................................................................................ 95
INTERPRETATION OF STUDENT FINDINGS ................................................................................... 96
Quantitative Findings ............................................................................................................ 96
Qualitative Findings .............................................................................................................. 98
INTERPRETATION OF TEACHER FINDINGS ................................................................................. 100
LIMITATIONS OF STUDY ........................................................................................................... 102
IMPLICATIONS FOR FUTURE RESEARCH ................................................................................... 103
SIGNIFICANCE & CLOSING REMARKS ...................................................................................... 105
REFERENCES ........................................................................................................................... 107
APPENDIX A ............................................................................................................................. 115
TEACHER INTERVIEW GUIDE ................................................................................................... 115
APPENDIX B ............................................................................................................................. 118
CLASSROOM OBSERVATION PROTOCOL ................................................................................... 118
APPENDIX C ............................................................................................................................. 120
ATTITUDE TOWARDS MATH INVENTORY ................................................................................. 120
APPENDIX D ............................................................................................................................. 122
STUDENT FOCUS GROUP PROTOCOL ........................................................................................ 122

xi
LIST OF TABLES
Table 1. Site Demographics…………………………………………………………….47
Table 2. Control and Treatment Class Demographics………………………………….48
Table 3. Effect and Sample Sizes………………………………………………………50
Table 4. Experimental Learning Activities……………………………………………..54
Table 5. Research Questions and Data Collected………………………………………58
Table 6. Research Questions and Data Analysis……………………………………….59
Table 7. Quiz 4 Class Averages………………………………………………………...67
Table 8. Test 4 Class Averages…………………………………………………………70
Table 9. Pre ATMI Averages…………………………………………………………...73
Table 10. Post ATMI Averages………………………………………………………...74
Table 11. Pre & Post ATMI Averages………………………………………………….76
Table 12. IEP and ELL Students by Class………………………………………………86
Table 13. Class Averages for IEP & ELL………………………………………………87
xii
LIST OF FIGURES
Figure 1. The Blended Universal Design for Learning (BUDL) Model……………..…14 Figure 2. The Blended Learning taxonomy………………………………………….….24 Figure 3. Universal Design Education Models. …………………………………….…..36 Figure 4. Quiz 4 Score Distribution…………………………………………….……….66 Figure 5. Test 4 Score Distribution……………………………………………………...69 Figure 6. Control class during learning activity………………………………………...78 Figure 7. Experimental class during learning activity…………………………………...80 Figure 8. Experimental class during learning activity (different angle)…………………80

1
CHAPTER ONE: BACKGROUND AND PURPOSE OF THE STUDY
Introduction
In 2010, the U.S. Department of Education released a report, titled Transforming
American Education: Learning Powered by Technology, a detailed plan to create more
engaging, empowering, and personalized learning experiences (Atkins et al., 2010).
Throughout the seventy-five-page plan, the authors consistently referred to the concept of
teaching all students and addressing student variance by providing more inclusive
learning environments. The model put forth in the report highlighted both Blended
Learning and Universal Design for Learning as a means to enable, motivate, and inspire
all students to achieve regardless of background, language, or disabilities (Atkins et al.,
2010). Five years later, both of these approaches have garnered much attention and have
been touted as potentially transformative practices in the field of K-12 education. To
understand why, it is first necessary to understand what Blended Learning and Universal
Design for Learning are and how aspects of their framework could affect the teaching and
learning paradigm.
Blended Learning 101
In its simplest definition, Blended Learning (BL) is the merger of face-to-face and
technology driven instruction. Crafted by researchers at the Clayton Christensen Institute
for Disruptive Innovation, the elaborate and widely accepted definition is
A formal education in which a student learns at least in part through online
learning, with some element of student control over time, place, path,
and/or pace; at least in part in a supervised brick-and-mortar location away

2
from home; and the modalities along each student’s learning path within a
course or subject is connected to provide an integrated learning experience
(Christensen, Horn & Staker, 2013).
This definition of Blended Learning has three significant implications for
educators. First, technology becomes an integral part of the learning environment.
Second, students get some say or choice in various aspects of the learning. Third, the
different modalities inform each other to ensure the educational needs of each child are
being properly met (Christensen, Horn & Staker, 2013).
Although there are varying models of BL, the potential outcomes (when
implemented effectively) are positive across the spectrum. Blended Learning has been
credited with increasing classroom flexibility, student engagement, and access to
education (Bakia et al., 2012; Christensen & Horn, 2008; Lips, 2010; Watson and Gemin,
2008; Picciano & Dziuban, 2007). In addition, researchers and practitioners alike have
attributed the practice to increasing such desired outcomes as personalized learning,
thoughtful reflection, and differentiated instruction (Watson & Gemin, 2008).
Universal Design for Learning 101
Having evolved from the concepts of Universal Design in architecture, Universal
Design for Learning (UDL) is based off the ideal that the “design of products and
environments should be usable by all people to the greatest extent possible without the
need for adaptation or specialized design” (as cited in Mcguire, Scott, & Shaw, 2006).
The approach was seen as a potentially viable way for general education teachers to
implement more inclusionary practices that address the needs of students with
disabilities. Although UDL started as a promising pedagogical strategy in the field of

3
Special Education, in the past few years the approach has gained traction in the ever-
relevant debate of general education reform (Mcguire, Scott & Shaw, 2006).
The goal behind UDL is to significantly increase the flexibility and therefore,
accessibility of a classrooms’ curriculum by providing supports and alternatives that meet
the needs of a wide range of students. The three core principles of UDL are to provide:
• Multiple means of engagement (the “why” of learning)
• Multiple means of representation (the “what” of learning)
• Multiple means of action and expression (the “how” of learning) (Meyer, Rose, &
Gordon, 2014)
An example of UDL in practice is allowing students to choose how they will
demonstrate their knowledge. For instance, if the goal of the lesson is to have students
understand the thematic underpinnings of a novel, giving them the choice between doing
a PowerPoint presentation, writing an essay, or creating their own one act play that aligns
thematically to the story, is a way to address differences in students’ skills, interests, and
motivations. By intentionally creating a flexible curriculum, the promise of UDL is that it
accounts for and adequately addresses the differences in how and why students learn.
Through this approach student diversity is not only being supported, but also “proactively
being valued” (Edyburn, 2010).
As the next few sections detail, the need to implement an approach that can
address student variance and diversity through pedagogical practice is a timely one. With
the changes in our student demographics, and our social and workplace connections
exceeding the bounds of our country, the impact of such practices as Universal Design

4
for Learning and Blended Learning could very well be significant in improving
educational opportunities for all students.
Addressing Student Diversity
Today, the issue of learner variance in education has been brought to the forefront
due to the growing diversity of our student population. Carol Tomlinson, an expert in the
field of differentiation in learning and teaching, gives a rich description of the average K-
12 classroom in America today:
Seated side by side in classrooms that still harbor a myth of ‘homogeneity
by virtue of chronological age’ are students with identified learning
problems; highly advanced learners; students whose first language is not
English; students who underachieve for a complex array of reasons;
students from broadly diverse cultures, economic backgrounds, or both;
students of both genders; motivated and unmotivated students; students
who fit two or three of these categories; students who fall closer to the
template of grade-level expectation and norms; and students of widely
varying interests and preferred modes of learning. (Tomlinson et al., 2003,
p. 119-120).
In the wake of an increasingly diverse student population, the need for teachers to
provide a more flexible curriculum becomes apparent.
Learners come to school with different needs, motivations, and skill sets. The current
education system is not set up to support or foster this diversity between students
(Darling-Hammond, 2010; Tomlinson et al., 2003, Papert & Harel, 1991). Since Brown
vs. The Board of Education, the historic Supreme Court decision that proclaimed the

5
racial segregation of children in public schools violated the Equal Protection Clause of
the Fourteenth Amendment, the K-12 system has come a long way in providing equal
schooling for all students across the country. The Brown vs. Board decision upheld the
idea that “separate was not equal” and required changes in current policies and structures
to mend the disparity between white and black students. In addition to desegregating
school nationwide new standards were implemented to address issues of equality between
schools and classrooms. This began the start of the accountability movement.
Accountability measures, by way of standardized curriculum and assessment,
played a large part in the attempt to ensure that students from all backgrounds received
equal access to quality education. However, the inherent disadvantage of a standardized
accountability system is the implied assumption that all students come in with the same
knowledge, learn at the same pace, and learn the same way. It has become abundantly
clear in the years since Brown vs. The Board of Education that equality does not
necessarily yield equity. Equality requires that everyone receives the same thing, equity
requires that everyone receives what they need. In order for education to properly address
the issue of equity or fairness, the issue of learner variance must first be attended to.
Tomlinson et al., (2003) description highlights the concept that student diversity
extends beyond racial, ethnic, gender, and socioeconomic background to include student
variant factors like interest, motivation, and skill level. Demographic factors, as well as
student variant factors, can and do impact how and why a student learns. For this reason,
it is important for learning environments to accommodate diversity as it is broadly
defined by Tomlinson. For the purposes of this study, student variance and student
diversity are used interchangeably.

6
The Needs of a Globalized Society
In addition to addressing the growing diversity (or variance) of the K-12
population, public education has also been charged with the laborious task of preparing
students to enter a diverse, ever-expanding society and workforce. The Internet, expanded
free trade agreements, liberal immigration policies, and multi-billion dollar transnational
corporations have contributed to creating a globalized society. This shift has a profound
implication for schools, whose purpose is to prepare college and career ready individuals.
In his commentary to the AASA Journal of Scholarship and Practice, Christopher Tieken
speaks in support of fostering student diversity, stating, “The diversity of the U.S. is its
greatest strength. The U.S. economy is able to adapt to change because of the skill
diversity of the work force” (2011, p. 11). Given the dynamic world we live in, it seems
we would be remiss not to have an educational system that supports and nurtures the
variety and wide range of skills innate in our K-12 student population.
The onus is on educators to prepare individuals who are qualified to take on the
multi-dimensional jobs our society has to offer or will have to offer. Cathy Davidson, a
distinguished scholar on the history of technology and a recently appointed member of
the National Humanities Council, prophesized that 65% of today’s grade school kids will
end up at a job that has not been invented yet (Heffernan, 2011). The implication of this
statistic is that students must learn today how to continue learning for tomorrow. The
current practice of simple knowledge acquisition will not sufficiently educate our
students for the workforce or for the world that awaits them after high school. Students’
success will be based on their ability to continuously construct new knowledge, new
ways of learning, and new ways of thinking.
7
Seminal Learning Theories
Addressing student variance in instruction is not a new concept. In fact, though
the basis of UDL was not constructed until the late 1900s, the learning theories on which
this approach is based have been around for almost seventy years. For instance, Jean
Piaget promoted the theory of a developmentally appropriate education, which is “an
education with environments, curriculum, materials, and instruction that are suitable for
students in terms of their physical and cognitive abilities and their social and emotional
needs” (as cited in Slavin, 2000, pg. 41). Piaget believed that a child’s past experience
and existing knowledge contributes to how they learn and how they understand new
concepts. He also felt that in order for instruction to be effective it must be adapted to the
developmental status of the child.
Lev Vygotsky is another prominent theorist whose work supported the nurturing
of student diversity in educational settings. Vygotsky believed that learning took place
when children were working within their zone of proximal development (ZPD). The zone
of proximal development “describes tasks that a child has not yet learned but is capable
of learning at a given time” (Slavin, 2000, pg. 45). These tasks are just above a child’s
current ability, but are accessible with assistance. Because children can be in different
developmental stages, it is necessary for instructors to provide curriculum that supports
multiple zones of proximal development. Vygotsky’s theory on social learning has also
led to the paradigm of scaffolding. Scaffolding is the practice of providing student
support in the beginning of their learning, then progressively diminishing the support as
the student becomes more competent (Sawyer, 2014). Scaffolding can come in different
forms depending on the educational needs of the child. Providing appropriate levels of

8
entry to a problem or concept is another way to differentiate instruction to address student
variance.
Howard Gardner’s theory of multiple intelligences also lends credence to the idea
that students require different ways to engage with learning material or content. Gardner
believed that there were as many as eight intelligences, including linguistic, spatial, and
logical. The theory of multiple intelligences “implies that concepts should be taught a
variety of ways that call on many types of intelligence” (as cited in Slavin, 2000, pg.
130), which is reminiscent of UDL’s principle of providing multiple means of
engagement. Related to Gardner’s theory of multiple intelligences is the work of
American educational psychologist, David Kolb, on learning styles. Kolb believes that
people have different ways of learning and that teachers need to adapt their teaching
methods to address the learning styles of their students. Kolb’s theory closely aligns with
UDL’s principle of providing multiple means of representation.
Both Piaget and Vygotsky have been instrumental in framing constructivist
models of learning, which emphasize that learners should be allowed to personalize the
pace and type of information they receive. In constructivist classrooms students have
some control over their learning much like they do in Blended Learning classrooms.
Research shows that teachers who demonstrate more constructivist views and practices
are more likely to use technology to support higher order thinking skills (Baylor &
Ritchie, 2002; Levin & Wadmany, 2006; Hirumi, 2002). Given what we know about our
student population, the changed expectation in our workplace, and the highly regarded
beliefs of renowned learning and educational theorists, incorporating the practice of UDL
and BL in education seem worthy of consideration.

9
Statement of the Problem
The current education system fails to properly address and support student
variance. Blended Learning and Universal Design for Learning are two potential
practices that could assist teachers in creating more inclusive classrooms that enable and
motivate students regardless of background, language, and/or disability. This study tests
the efficacy of an education model that combines Blended Learning and Universal
Design for Learning, called Blended Universal Design for Learning. The study will
examine if a Blended Universal Design for Learning model improves student
achievement, engagement, and perception. Given the current state of public education,
research investigating the utility of these two practices could greatly benefit the field and
positively impact the teaching and learning paradigm. However, at present, research on
the effectiveness of BL and UDL is limited in scope, design, and empirical evidence. To
make significant contributions to the current knowledge base, future research would also
need to address the current gaps in literature surrounding these practices. The following
sections provide a gap analysis of the current research on Blended Learning and
Universal Design for Learning and highlight areas that should be considered when
researching the effectiveness of BL and UDL.
Gaps in Blended Learning Research
Researchers and practitioners have realized that Blended Learning integration can
vary. From the literature three categories of blends, or blended learning environments,
have emerged: enabling, enhancing, and transformative (Bonk & Graham, 2012; Graham,
2009). These categories are on somewhat of a continuum. Enabling blends are primarily
put in place to provide access and convenience to students who, without the technology,

10
would not receive that particular instruction (Graham, 2009). Two examples of this are:
Students who live in extreme rural areas who would only be able to go to school a few
days a week, and high school students taking Advanced Placement courses that are not
offered at their school site. Enhancing blends utilize the technology as a supplemental
resource or tool. An example of this is a primarily face-to-face instructional environment
where technology is used for in-class presentations, online research, and submitting
homework.
Transformative blends, however, tend to support learning that is focused on
individualization, differentiation, personalization, increased student engagement, real-
time feedback, immediate intervention, and student-centric learning (Christensen, Horn &
Johnson, 2008; Dziuban, Moskal, & Hartman, 2005; Garrison & Kanuka, 2004; Graham,
2009; Graham & Robinson, 2007; Staker et al., 2011; Watson and Gemin, 2008).
Although many schools are adopting a Blended Learning approach, few are reaching this
transformative level of integration (Sparks, 2015).
Addressing this issue back in 1995, the U.S. Office of Technology Assessment
stated, “It is becoming increasingly clear, that technology, in and of itself, does not
directly change teaching or learning. Rather the critical element is how technology is
incorporated into instruction” (1995, p. 57). How a teacher utilizes technology has a
major impact on its effectiveness in the classroom. Many scholars believe that effective
Blended Learning cannot occur unless its implementation is intentional, meaningful, and
purposeful (Garrison & Kanuka, 2004; Dziuban et al., 2005; Picciano, Seaman, Shea, &
Swan, 2012). For Blended Learning to be transformative, teachers must have a strategic
approach and purpose for integrating technology.

11
Though most studies focus on the physical attributes or structural elements of
Blended Learning, there are still a substantial lack of exploratory, explanatory, and
subsequently design research on pedagogical practices in Blended K-12 environments
(Drysdale et al., 2012; Graham, 2012; Picciano, Dziuban, & Graham, 2013; Halverson et
al., 2012). However, as previously mentioned, research has indicated that teachers with
more constructivist views and practices tend to not only use technology to support higher
order thinking skills, but also use technology more frequently, and to support more
student-centered curricula (An & Reigeluth, 2011; Baylor & Ritchie, 2002; Ertmer et al.
2012; Hirumi, 2006; Levin & Wadmany, 2006; Overbay et al. 2010).
In addition to limited studies on teacher practice, very few studies have sought to
“quantify the impact of BL on accessibility” (Graham, 2012). Underpinning these gaps is
the need for more theoretical development that would ground Blended Learning as a
valuable practice. According to Charles Graham “while some of the research in BL is
solidly grounded in theory, most of the existing research has sought to describe or solve
localized challenges without contributing to a coherent development of theory” (2012,
pg.13). To further the practice of Blended Learning, future research should include
investigations on teacher practice and its impact on student’s access to education. In
essence, future studies should also contribute to the development of a theory of practice
for Blended Learning.
Gaps in Universal Design for Learning Research
Though Universal Design for Learning was introduced over 25 years ago, it is
only now being realized to its full potential. At the center of UDL lies the use of
technology. “The reason UDL is possible today as oppose to the 1950s or even 1970s is

12
that digital technology provides a high degree of flexibility” (Edyburn, 2010, pg. 6). For
the past two decades the extent to which UDL could be introduced into the classroom
relied heavily on the extent to which modern technology was available and capable. Until
recently, the implementation of UDL required the use of specialized equipment that was
not readily available in the average classroom. Today, with the proliferation of devices
being purchased by schools and the implementation of such practices as Blended
Learning, the time is ripe for Universal Design for Learning to become a fundamental
practice in special and general education alike.
Research in the efficacy of the Universal Design for Learning framework is still
nascent. Though some have claimed otherwise, UDL has yet to be scientifically validated
through research (Edyburn, 2010; Rao, Ok, & Bryant, 2014). Many UDL studies focus on
the perception and experiences of students and teachers, but fail to examine whether a
UDL intervention “caused improved student outcomes in terms of content and/or skill
acquisition” (Rao et al., 2014, pg. 164). To show causality of increased favorable
outcomes through UDL, more experimental designed studies are needed.
The gaps in BL and UDL literature need to be empirically addressed. The design
of this study was heavily influenced by the results of this gap analysis. This study
considers the need for more experimental designs, the need to focus on teacher practice,
the need to build a concrete theory supporting the use of BL and UDL, and the need for
more non-anecdotal evidence.
Conceptual Underpinnings for the Study
Robert Erlandson describes teachers as “educational designers," stating that their
job is to “[design] educational activities, materials and curricula” (2002, pg. 2). He also

13
states that teachers or educational designers have “one simple goal: to create the best
possible design." Picciano et al., (2014) agree that the instructional design of every
classroom is composed of two layers, a physical layer and a pedagogical layer. The
physical layer is “the presentation of or delivery of instruction, while the pedagogical
layer is the strategy that enables learning to take place” (Picciano et al., 2014, pg. 28).
The physical layer can encompass tools, equipment, devices, hardware, and software. It is
usually a tangible artifact. The pedagogical layer can encompass teacher practice,
strategy, and lesson designs. It is often an intangible artifact. These layers interplay in
every lesson and in every classroom. Aspects of the physical layer can have an impact on
the availability and effectiveness of the pedagogical layer (Picciano et al., 2014) and
aspects of the pedagogical layer can have an impact on the necessity of the physical layer.
For this reason, it is imperative that instructional designers (teachers) integrate delivery
mechanisms that complement their pedagogical strategies and vice versa.
Keeping in mind that Blended Learning is the merger of technology and face-to-
face instruction, and that UDL is a teaching strategy for providing students with
alternative avenues for learning, BL would be the physical layer and UDL would be the
pedagogical layer in a classroom that is integrating both practices. True to theory, the
physical layer (BL) does affect the availability and effectiveness of the pedagogical layer
(UDL) and the pedagogical layer (UDL) necessitates the physical layer (BL). As
mentioned earlier, the effectiveness of Universal Design for Learning highly depends on
the availability of modern technology and Blended Learning requires a purposeful and
strategic approach (like UDL) to be transformative. As such, it is my belief that the
merger of these two practices could produce an exceptional instructional design. Given

14
the potential benefits these practices boast in isolation, the theoretical framework
underpinning this study is that the combination of these two practices could produce a
flexible learning and teaching model that supports the diverse needs of students and
improves upon traditional models of education. This study examines the efficacy of such
a model, one that I will be referring to as Blended Universal Design for Learning
(BUDL). Figure 1 depicts the formation of the Blended Universal Design for Learning
(BUDL) model.
Figure 1. Conceptual creation of the Blended Universal Design for Learning (BUDL) model from the merger of Blended Learning and Universal Design for Learning.
Purpose of the Study
The purpose of this study was to test the efficacy of a Blended Universal Design
for Learning model in improving student achievement, engagement, and perception.
Changes within a teacher’s perception of his practice are also explored. This research also
attempts to contribute to the body of knowledge on the effectiveness of both Blended
Learning and Universal Design for Learning on serving the needs of all learners.

15
Guiding Research Question
Through an experimental design and a mixed-method analysis the impact of
implementing a BUDL intervention in a classroom is explored. The guiding research
question is: How does a Blended Universal Design for Learning intervention impact an
accelerated 7th grade math class?
Definition of Key Terms
This study is embedded in the K-12 sector and frequently references terms or
acronyms commonly used in K-12 education and known by K-12 professionals and/or
researchers. To assist in the dissemination of this study, a list of key terms and
corresponding definitions are provided in this section.
21st Century Learning. A set of standards and/or skills that students are expected to
have in order to be successful in the Age of Information or Digital Age.
Achievement. In this study, achievement refers strictly to academic achievement and is
measured by the scores from teacher designed assessments.
Curriculum. Curriculum is generally considered the academic content taught in the
classroom. However, for this study, the definition of curriculum includes the instructional
goals, methods, materials, and assessments used in a classroom. This definition stems
from the work produced by the Center for Applied Special Technology (CAST).
Engagement. Engagement in this study refers specifically to student engagement. “In
education, student engagement refers to the degree of attention, curiosity, interest,
optimism, and passion that students show when they are learning or being taught, which
extends to the level of motivation they have to learn and progress in their education”

16
(edglossary.org, 2015). In this study, engagement is measured through observational data
and a student response survey on their attitude towards math.
English Language Learner (ELL). ELL refers to English Language Learner. ELLs are
students who speak limited English and/or have difficulty learning in English. These
students sometimes require specialized or modified curriculum.
Individualized Education Plan (IEP). A IEP is an Individualized Education Plan or
program that has been specifically designed to help meet the unique needs of a student
with disabilities (U.S. Department of Education, 2016). These students sometimes require
specialized or modified curriculum.
Pedagogy and Pedagogical. Pedagogy is the method or practice of teaching.
Perception. In this study perception refers to the way the teacher feels about the
curriculum and the way students feel or think about their class.
Summary
This chapter provided an overview of how the K-12 system is currently failing to
address student variance in the wake of an increasingly diverse student population and
globalized society. With the apparent need for teachers to provide a more flexible
curriculum, the U.S Department of Education has pushed two pedagogical strategies
(Blended Learning and Universal Design for Learning) as potential solutions. Evidence
suggests that individually these practices can positively effect student outcomes.
Conceptually, the merger of these two strategies would produce a more effective model
for learning and teaching, Blended Universal Design for Learning. However, the efficacy
of this model needs to be further researched. The purpose of this study is to examine the
viability of Blended Universal Design for Learning and assess its impact on student

17
achievement, engagement, and perception. Chapter Two takes a closer look at existing
research and practice on Blended Learning and Universal Design for Learning.

18
CHAPTER TWO: REVIEW OF THE LITERATURE
The Next Big Thing
In 2002, the American Society for Training and Development argued, “Blended
Learning was one of the top emerging trends in the knowledge delivery industry." Since
then, Blended Learning (BL) has indeed gained mainstream popularity and has become a
buzzword of sorts in the field of education (Dzuiban et al., 2005; Graham, 2009; Oliver &
Trigwell, 2005). It has been recognized for its transformative potential (Dziuban et al.,
2005; Garrison & Kanuka, 2004; Graham & Robison, 2007; Staker et al., 2011) and has
even been regarded as a “disruptive innovation “or a service that is simple in application
that starts at the bottom of the market, but eventually displaces established entities”
(Christensen, Horn & Johnson, 2008). In 2008, John Watson predicted that Blended
Learning was likely to emerge as the predominant teaching model of the future and
become far more common than either online or face-to-face learning alone.
While the concept has been around for over a decade and has made its mark in
other industries such as higher education and corporate training, the practice of Blended
Learning in K-12 settings is relatively new (Drysdale et al., 2013; Graham, 2012;
Halverson et al., 2012). With increased budget cuts, a demand for 21st Century learning,
and the transition to the technology imbued Common Core Standards, Blended Learning
has seemingly been thrust onto the main stage of K-12 education reform.
Rivaling Blended Learning’s fanfare, the practice of Universal Design for
Learning has also gained in popularity since its incorporation into the 2008 Higher
Education Opportunity Act. Through this policy the U.S. Department of Education has
committed to providing funds to pre-service teacher programs that include UDL in their

19
curricula (Vitelli, 2015). UDL has been encouraged as a promising practice to address not
only the needs of students with disabilities, but also as a way to confront the differences
of learners embedded in the general education system.
From its infancy, the Center for Applied Special Technology (CAST) has
described UDL “as a blueprint for creating a curriculum (instructional goals, methods,
materials, and assessments) that works for everyone - not a single, one-size-fits-all
solution, but rather flexible approaches that can be customized and adjusted for
individual needs” (udlcenter.org, 2015). This chapter takes an in-depth look at both of
these phenomena: exploring their definitions, examining their conceptual frameworks,
and reviewing current research.
Blended Learning
Conceptual Framework
In 2002, Margaret Driscoll identified four interpretations of Blended Learning
that were dominating the literature at the time. Due to its interdisciplinary use, BL holds
different meanings in different contexts (Driscoll, 2002; Drysdale et al., 2013; Graham,
2006; Graham, 2012; Oliver & Trigwell, 2005; Osguthorpe & Graham, 2003). Graham
(2012) simplified Driscoll’s definitions into three general concepts: (1) blending online
and face-to-face instruction, (2) blending instructional modalities (or delivery media), and
(3) blending instructional methods.
Though all of these conceptual practices show promise, it is the first concept that
is garnering the most attention. For the purpose of this study, Blended Learning is
identified as the blending of online and face-to-face instruction.

20
The Definition
The flexibility of its conceptual application and the versatility of its properties
have made the definition of Blended Learning as ambiguous as the practice. Though
most researchers agree that in its simplest form BL is the combination of face-to-face
instruction with computer-mediated instruction, there is no universally recognized
definition for Blended Learning (Driscoll, 2002; Drysdale et al., 2013; Graham, 2006;
Graham, 2012; Oliver & Trigwell, 2005; Osguthorpe & Graham, 2003). Over the years,
researchers have proposed more comprehensive definitions in an attempt to either
underscore the importance of implementation and structure, and/or feature its distinctive
characteristics.
In his seminal piece, Blended Learning: Uncovering It's Transformative Potential
in Higher Education, Randy Garrison describes Blended Learning as the “thoughtful
integration of classroom face-to-face learning experiences with online learning
experiences” (2004). Garrison includes in his definition what I call an impactful
stipulation on implementation. He asserts that true BL can only occur with thoughtful
integration, suggesting that the devices alone do not cause transformation. To him and
many others, Blended Learning is not just the merger of technology and education; it is a
methodology that supports deeper learning (Dziuban et al., 2005; Garrison & Kanuka,
2004; Picciano et al., 2012; Singh & Reed, 2001).
Similarly, in 2005 the Sloan Consortium defined BL as the integration of “online
with traditional face-to-face class activities in a planned, pedagogically valuable manner
in which a portion of (institutionally defined) face-to-face time is replaced by online

21
activity” (Picciano, p. 1). Again, this definition suggests that the integration of
technology in the classroom must be coupled with purpose.
Other stipulations that have been attached to BL are requirements on structure.
For instance, in the 2004 research brief for EDUCAUSE, Blended Learning was
described as “courses that combine face-to-face classroom instruction with online
learning and reduced classroom contact hours (reduced seat time)” (Dzuiban, Hartman, &
Moskal, 2004). Along the same lines the 2007 report by Elaine Allen et al., titled Blended
In: The Extent and Promise of Blended Education in the United States, claims that
Blended Learning only occurs when “30% to 79% of course content is delivered online”
(p.5).
More recently in 2012, the Clayton Christensen Institute for Disruptive
Innovation1 released a white paper stating multiple stipulations, describing Blended
Learning as a “formal education program in which a student learns at least in part through
online delivery of content and instruction with some element of student control over time,
place, path, and/or pace and at least in part at a supervised brick-and-mortar location
away from home (Staker, 2012). This definition gave stipulations on the medium
(online), location (brick and mortar, away from home) and control (student). It did three
things that the other definitions did not: It insisted that Blended Learning be a part of a
validated and recognized education system; it required that students at some point are
being supervised; and it placed the learner at the focal point, making it a student-driven
practice. Though the Institutes’ definition was just the latest in a long line of varying
1 Formerly known as Innosight Institute.

22
definitions, it gained widespread acceptance due to its comprehensive description and its
basis in K-12 education. But even this definition had its critics.
In its annual Keeping Pace report, after admitting to not having seen a better
definition of Blended Learning, the Evergreen Education Group recommended one key
element be added to the Institutes’ definition: data-driven decision-making. The report
states:
Although we like the definition, we also believe a further description can be
useful, and the key element we like to see described in a Blended Learning model is a
way in which students’ online work generates data that are used by the instructional
system (teacher, technology, or both) to personalize and improve instruction for each
student. (p.17)
In 2014, these suggestions were implemented into the Institute’s revised and
current definition for Blended Learning:
A formal education in which a student learns at least in part through online
learning, with some element of student control over time, place, path
and/or pace; at least in part in a supervised brick-and-mortar location away
from home; and the modalities along each student’s learning path within a
course or subject are connected to provide an integrated learning
experience (Christensen, Horn & Staker, 2013).
As the use of Blended Learning evolves, so do researchers attempt to adequately
describe this unique pedagogical and methodological practice. A common definition for
Blended Learning will most likely be debated for years. Some see this as a good thing,
suggesting that the lack of a formal definition exhibits Blended Learning’s “untapped

23
potential” (Driscoll, 2002), and that it allows for flexibility, giving practitioners the
ability “to adapt and use the term as they see fit” (Sharpe et al., 2006). Alternatively,
there are those who believe that having contrasting definitions make practicing and
researching Blended Learning almost impossible due to the inconsistencies in how it is
defined (Oliver & Trigwell, 2005).
Another issue is that Blended Learning is often labeled as something different.
Studies that focus on Information and Communications Technology (ICT), Hybrid
Learning, Technology-Rich environments and even just technology integration are
sometimes referring to some type of Blended Learning method, but fail to identify it as
such. Regardless of how it is defined, most researchers and practitioners do agree on two
things: One, the structure of Blended Learning can vary, and two, when implemented
properly, BL produces recognized benefits. The next two sections take a closer look at
these two axioms.
Varying Models and Practices
Leading the way on Blended Learning research in May 2011, the Clayton
Christensen Institute released a report, titled The Rise of K-12 Blended Learning. The
report profiled over forty K-12 programs and examined their use of technology in the
classroom. The investigation revealed six distinct models that were operating within the
Blended Learning framework. A year after this report was released and with feedback
from over one hundred researchers, educators, and practitioners from the field, the
Institute issued another report collapsing the six models into four (see Figure 2).

24
Figure 2. The Blended Learning taxonomy suggested by the Clayton Christensen Institute formerly Innosight Institute. Image taken from Staker, H. and Horn, M. (2012). Classifying K-12 Blended Learning, p.2. Copyright 2012 by Innosight Institute.
Rotation Model. The Rotational Model of Blended Learning (RMBL) is the most
commonly used model of BL in classrooms today. One theory behind this is that this
model requires the least amount of change to the current structure of education
(Christensen, Horn, & Staker, 2013). The Rotational Model consists of students rotating
on a fixed schedule or at the teacher’s discretion between learning modalities, at least one
of which is online learning” (Staker & Horn, 2012). Within this model there are four
sub-categories: Station Rotation, Lab Rotation, Flipped Classroom, and Individual
Rotation. With the exception of the Individual Rotation model, all other models under the
RMBL continue to emphasize teacher-driven activity and whole-class instruction with
little personalization. In the Individual Rotation model, students still rotate based on a
customized fixed schedule among learning modalities, but they are not required to rotate
to each available station or modality, giving students some control/choice in their
learning (Staker & Horn, 2012).

25
Flex Model. In the Flex Model of Blended Learning (FMBL), students receive
content and instruction primarily through the Internet. Students have their own
customized and fluid schedule. In this model, teachers and other adults provide face-to-
face support on a flexible and adaptive basis as needed (Staker & Horn, 2012). This
model allows for even more student control/choice in that students can determine when
they need extra support. FMBL also breaks out from the standard structure of K-12
education by providing the majority of instruction through online resources, allowing
students to progress through levels based on their competency and making age-based
cohorts and seat-time requirements inconsequential (Christensen, Horn, & Staker, 2013).
Enriched Virtual Model. The Enriched Virtual Model of Blended Learning
(EVMBL) is where students split their time between a traditional campus and learning
remotely through online content and instruction (Christensen, Horn, & Staker, 2013).
This model does not require students to attend the brick-and-mortar campus every day of
the week and is a whole-school experience, meaning the entire school splits their time
between onsite and offsite learning.
Self-Blend Model. In the Self-Blend Model, now referred to as the A La Carte
Model (Christensen, Horn, & Staker, 2013), students continue to have classes on a
physical campus, but supplement their education with one or more classes that are
delivered solely online. Students in this model can choose what classes they want to take
offsite or onsite, and are usually offered instructional support and mentoring in both
forums. This model differs from the Enriched Virtual Model because blending is done by
the student at the course level instead of by administration at the school-wide level.
These models vary in their structure, use of technology, and placement of teachers

26
and students, yet all have been generally cited as providing benefits beyond the
traditional classroom (Dziuban, Moskal, & Hartman, 2005; Garrison & Kanuka, 2004;
Graham, 2006; Graham, 2012; Graham & Robison, 2007; Osguthorpe & Graham, 2003;
Staker et al., 2011). These benefits are explored in the next section.
Reported Instructional Outcomes
Blended learning has been widely described as the “best of both worlds”,
combining the best elements of face-to-face instruction with the best elements of online
learning (Dzuiban, Moskal, & Hartman, 2005; Graham, 2006; Laumakis, Graham, &
Dziuban, 2009). It has been credited with increasing classroom flexibility, student
engagement, and access to education. In the same report where John Watson (2006)
predicted the inevitable rise of Blended Learning, he credited the practice to producing
such desired outcomes as personalized learning, thoughtful reflection, and
individualization.
In higher education, three major outcomes have been identified: 1) improved
learning effectiveness, 2) increased access and convenience, and 3) greater cost
effectiveness (Graham, 2006). In K-12 education where learners of all different abilities
and interests must be served in the same classroom, “improved learning effectiveness”
distills down to concepts such as differentiated instruction, real-time feedback, and
student-centered learning. The following sections examine a few of the reported
outcomes of Blended Learning and technology integration, in general. Examples of how
these outcomes have been realized in K-12 classrooms across the country are presented.
Individualized & Differentiated Instruction. Though these practices are
combined here, individualization and differentiation are very different outcomes. The

27
U.S. Department of Education (2010) defines individualization as instruction that is
paced to the different learning needs learners. Differentiation is instruction that is tailored
to the learning preferences of different learners. Research and practice have shown that
Blended Learning can give teachers the flexibility to provide these types of learning
environments for their students (Bakia et al., 2012; Christensen & Horn, 2008;
Haelermans, Ghysels, & Prince, 2015; Lips, 2010; Watson & Gemin, 2008). In these
environments, technology is used to broaden students’ access to content, provide multiple
avenues for creative production and help scaffold the progression of work. In 2015,
Haelermans et al. carried out an experimental study over 12 weeks involving 115
secondary students. The treatment group (58 students) received “digital differentiation,"
which helped determine what level of work students would focus on the following week.
The results of the study showed a significant effect on the posttest scores of the treatment
group. In the conclusion, the researchers implied that differentiation was possible and
beneficial to the degree that it was due to the integration of digital tools.
As an example of technology being used as delineated above, students at the
School of One in New York receives customized schedules that change daily depending
on their needs. A digital bulletin board displays their schedule, which is created by their
counselors who assess their performance data and individual progress through their
online learning work (Christensen, Horn, & Staker, 2013). The students rotate through
different modalities, such as virtual tutoring, small-group collaboration and instruction,
and independent practice. This program structure is designed to allow students to work at
their own pace and choose the learning modality that works best for them, the program
was both individualized and differentiated.
28
Real-Time Feedback. The increased ability for teachers to provide real-time
feedback is another reported outcome of Blended Learning. The premise behind real-time
feedback is that a computer can aggregate data in a timely and efficient manner, allowing
teachers to make data-driven instructional decisions in their classrooms. Formative online
assessments allow for teachers and students to receive real-time feedback, information
that can reveal how well the student understands the subject matter. Online assessments
make it easier for a teacher to test more frequently and provide feedback to the student
while the information is still relevant (Lips, 2010; Picciano & Dziuban, 2007). In his,
2008, book Visible Learning: A Synthesis of Over 800 Meta-Analysis relating to
Achievement, John Hattie, a notable educational researcher, revealed that out of hundreds
of pedagogical practices, individual feedback had the single most significant effect on
student achievement. Formative feedback, mediated through technology, has reportedly
increased student achievement and performance, elicited positive feelings from students,
and decreased boredom (Tempelaar, Rienties, Giesbers, 2015; Martinez, Valdivia, &
Ortiz, 2015; Muis et al., 2015, Thomas & Sondergeld, 2015).
Through the districtwide purchase of an adaptive learning software called
STMath, students in the Cajon Valley School District in San Diego, California, receive
ongoing formative feedback on their performance in math. As a requirement, students in
this elementary district interact with game-like software daily and get real-time feedback
on their mastery of skills and concepts through built-in program assessments. This
feedback is used by students to self-correct their work and by the teacher to identify
students for intervention purposes.
29
Student-Centered Environment. A student-centered (also known as a learner-
centered or personalized) environment is where students have opportunities to make
decisions, based on their own interest and preference, that directly impact their learning.
When a student has control over their learning, their invested interest, engagement, and
overall disposition towards school can positively increase. Some researchers believe that
through Blended Learning, schools have the potential to create more student-centered
environments by allowing students to take part in deciding their schedule, their pace
through content or classes, and/or by offering students choice in their preferred learning
modality (Atkins et al., 2010; Picciano & Dziuban, 2007;).
At High Tech High, a network of K-12 charter schools based in San Diego,
California, technology aided student-centered learning is realized through the use of
specialty labs which are equipped with a range of technology for student use (Moeller &
Reitzes, 2011). Through their tenure at High Tech High, students are required to compile
and present their work through digital portfolios that can take the form of movies, e-
books, power-points, cartoons and more. For the most part, students work on their
portfolios independently throughout the year. They have control over their pace, the
content included, and the form their portfolios take. Moeller and Reitzes assert that the
technology available in the specialty labs helps students to work independently and
allows them more opportunity to develop their own ideas and engage in their creativity.
The classroom or learning environment outcomes mentioned here have a
widespread influence, affecting not only the teacher and students, but also the curriculum,
classroom management, and even school structures. The research shows that the impact
of integrating technology can be advantageous, if done effectively. These outcomes give

30
credence to the idea that Blended Learning could dramatically enhance teacher practice
and the learning environment. The following section specifically highlights research on
the three main student outcomes being investigated in this study: student achievement,
engagement, and perception. The influence Blended Learning has on these outcomes is
examined.
As a note, much of the Blended Learning research lives at the higher education
level with very few statistically significant K-12 studies to pull from. In the celebrated
2009 Means et al. meta-analysis on online learning effects, twenty-three of the forty-five
studies used compared Blended Learning vs. face-to-face environments (the rest focused
on purely online vs. face-to-face), and of those twenty-three only five involved K-12
students. Though this comprehensive analysis was conducted almost eight years ago, the
lack of rigorous studies (ones that include random-assignment and a controlled
experimental design) is still an issue plaguing Blended Learning research today. As a
result, the following section includes Blended Learning research from both the K-12 and
higher education level. This section only references research that has specifically
identified Blended Learning.
Reported Student Outcomes
Student Achievement. Within the literature, the impact of Blended Learning on
student achievement is disparate. For every study that reports a positive impact, there are
two others that report negative or neutral outcomes. However, two highly regarded meta-
analysis on the issue report positive effects of technology on student achievement.
In 2009 Means et al. published their seminal 2009 U.S. Department of Education
sponsored meta-analysis on the effectiveness of online and Blended Learning. The

31
analysis, which included publish studies from 1996 to 2008, reported that students in
Blended Learning environments performed significantly better than students in face-to-
face environments. The analysis also revealed that Blended Learning environments
“tended to involve additional learning time, instructional resources, and course elements
that encouraged interactions among learners” (Means et al., 2014).
In their second order meta-analysis, What Forty Years of Research Says About the
Impact of Technology on Learning, Tamim et al. revealed that there is a “significant
positive small to moderate effect size favoring the utilization of technology” (2011, pg.
14). Moreover, the study found that students in technology rich classrooms performed
12% higher than the average student in a classroom that does not use technology (Tamim
et al., 2011). What made this study so significant to K-12 supporters of Blended Learning
is that this study includes 25 meta-analysis covering over forty years of research. Unlike
the Means et al. analysis, the majority of work used in this analysis involved K-12
applications of technology; 20 of the 25 studies were K-12 focused.
These two analyses reveal promising results for the impact of Blended Learning
on student achievement. The next section discusses research on the affect BL can have on
student engagement and perception.
Student Engagement and Perception. Some research suggests that technology
can stimulate a students’ engagement level (Bakia et al., 2012; Brown & Adler, 2008;
Picciano, 2007; Atkins et al., 2010; Watson & Gemin, 2008). Because technology can
broaden access, expand support, assist in scaffolding, and provide opportunities for more
complex interactions, students in Blended environments have more opportunities to
actively engage in the classroom. The reported instructional outcomes of a Blended

32
Learning environment also contribute to heightening of a students’ level of engagement.
In the 2010 National Technology Plan, experts claimed that when curriculum was
individualized, differentiated, and/or personalized, student engagement levels increased
(Atkins et al., 2010).
Like engagement, students’ perception of their learning can be influenced by a
variety of environmental factors. Student perception (which can also be characterized as
attitude) can be defined as the way students think about their classroom or understand the
curriculum, the learning activities, the subject matter, and/or the instruction. The quality
and clarity of instruction, and the availability of the learning content (is the content easy
for the learner to access, given their preferred method of learning and current level of
understanding) can all impact a students’ perception of their learning environment and
their ability to learn.
As with student engagement, the flexibility provided by technology can assist in
eliciting positive perceptions from students, who may prefer or fare better with,
alternative learning and teaching avenues. When examining satisfaction in over 1,400
students in a Blended-style accounting course, Lopez-Perez et al., (2011) discovered that
students rated items related to their Blended Learning experience fairly high. Students
noted that the Blended Learning aspects of the class proved useful in understanding and
learning the subject matter. Furthermore, students reported that BL “contributed to
increasing their motivation to study the subject” (Lopez-Perez et al., 2011, pg. 822).
The cited outcomes of Blended Learning have made it a recognized practice
among researchers and educators in enhancing classroom environments. Given the data
presented above, as the physical layer in the BUDL design model, Blended Learning

33
could further the impact of a teacher’s practice through the efficient delivery and
presentation of instruction. The next portion of this chapter focuses on Universal Design
for Learning research and what features this pedagogical practice adds to the BUDL
design model.
Universal Design for Learning
Conceptual Framework
Universal Design for Learning (UDL) was founded on the principles of Universal
Design in architecture. Pioneered in the 1980’s by Ron Mace, an environmental design
researcher at North Carolina State University, the Universal Design movement aimed to
“create places, structures, or products that are conceived and built to accommodate the
widest spectrum of uses without the need for subsequent adaptation of specialized
design” (Meyer et al., 2014). In the industry of architecture, an example of this theory in
practice is curbcuts. The rudimentary purpose of curb cuts is to allow people with
physical disabilities (wheelchair users, vision impaired, etc.,) easy access to cross street
intersections, yet this design is also beneficial to what would typically be the “average”
person: skateboarders, people with strollers or carts, a delivery person with a dolly, etc.
(Quaglia, 2015). Ron Mace and colleagues did not believe that a person’s ability should
negatively impact their access to the world around them. Their research proactively
focused on “reducing environmental barriers and providing increased access to the
physical environment” (Rao et al., 2014).
Approximately two decades after this movement started, it began to infiltrate its
way into the education sector. The Center for Applied Special Technology (CAST),
which focuses on inclusionary educational practices for students with disabilities, began

34
shifting their approach and way of thinking about the Universal Design movement.
CAST began centering their resources around addressing the “disabilities of schools,
rather than students” (Meyer et al., 2014). Universal Design for Learning was introduced
and coined by CAST in the late 1990’s after the reauthorization of the Individuals with
Disabilities Education Act (IDEA). UDL was born out of the idea that all students can
achieve if given the proper supports and that the failure was not innately in students, but
in the inaccessible nature of the learning environments they occupy.
The Definition
From its infancy, CAST2 has been at the forefront in developing the framework
and essential guidelines for Universal Design for Learning. Unlike Blended Learning
terminology, the terminology around UDL has been primarily fostered by only one
source, CAST, which means the definition of UDL has stayed consistent throughout the
years. CAST defines UDL as “a set of principles for curriculum development that give all
individuals equal opportunities to learn” (udlcenter.org, 2015). As mentioned in the
Definition of Terms, CAST defines curriculum as the instructional goals, methods,
materials, and assessments. The goal of UDL is to assist teachers in creating a curriculum
that works for everyone, “not a single, one-size-fits-all solution, but rather flexible
approaches that can be customized and adjusted for individual needs” (udlcenter.org,
2015).
2 Created by CAST, the National Center for Universal Design for Learning is now responsible for the continuous research and development of UDL.

35
Varying Models and Practice
There are three educational models built off the Universal Design concept3. The
first is Universal Design for Learning, which lives at the K-12 level and has been
championed by CAST and the National Center for Universal Design for Learning. The
other two are Universal Design for Instruction (UDI) and Universal Instructional Design
(UID), which live at the higher education level and have been spearheaded by various
researchers in postsecondary education. Though the models vary on their population and
institutional focus, their objectives remain similar: to expand teaching methodologies so
that all students have equal access to classroom teaching and learning, regardless of their
ability or learning needs (Pliner & Johnson, 2004). Though all the models are heavily
influenced by the work done at the National Center for Universal Design for Learning,
the principles guiding them differ. Figure 3 displays the various guiding principles of
Universal Instructional Design, Universal Design for Learning, and Universal Design for
Instruction.
The guiding principles for UID, UDL, and UDI are fluid, almost boundless,
allowing the practices to take shape any way an instructor deems appropriate. Unlike
Blended Learning, there are no definitive formats for how these models are organized or
constructed. In this way, it is very often the case that no two Universal Design Education
Models or UDEM are alike. Advocates for UDEMs argue that the principles are merely
guidelines and are ambiguous to allow instructors the maximum amount of flexibility.
After all, it is the uncompromising structure of the traditional classroom that UDEM’s
were conceived to combat. However, the lack of clarity on how these environments
3 Also know as Universal Design Education Models (UDEM)

36
operate has caused issues for researchers. Rao et al., note that there are “innumerable
ways that the principles can be applied to practice” (2014), which makes it difficult to
determine what actually constitutes a classroom as a UID, UDL, or UDI classroom.
As nebulous as the practice may seem, educational models of Universal Design
have begun to make their mark in classrooms around the country. The following section
highlights a few of the reported student outcomes of implementing such practices,
specifically Universal Design for Learning.
Figure 3. Universal Design Education Models. Image taken from Rao & Tanners (2011). Curb Cuts in Cyberspace: Universal Instructional Design for Online Courses. Journal of Postsecondary Education and Disability. 24(3), p.212.

37
Reported Student Outcomes
As students marked for special education begin to integrate more frequently into
general education classrooms, the push for teachers to experiment with inclusive
pedagogies has increased. Meyer et al. explains that with new technologies promising to
be “powerful agents of change” and the diversity of students continuing to increase,
Universal Design for Learning has the ability to “turn the aspiration of free and
appropriate education for all into a reality” (2014, pg.1). Since its’ introduction in the
90’s, the reported impact of integrating UDL has been favorable. UDL has been credited
with increasing student academic self-efficacy, student academic achievement, and
student engagement (Abell, Jung & Taylor, 2011; Kortering, McClannon, & Braziel,
2008; Meyer et al., 2014; Rappolt-Schlichtmann & Daley, 2013; Schelly, Davies &
Spooner, 2011)
As a note, the research on UDL has been heavily criticized for not possessing
enough empirically valid studies (Edyburn, 2010; Rao et al., 2014). Additional
experimental studies are more commonly found at the higher education level; this review
includes studies from both the K-12 and higher education sector. This section also
features studies that include both students with and without disabilities. Lastly, because
Universal Design for Learning is a pedagogical strategy, significant changes in
instruction that aligns to the UDL principles are assumed (i.e., increased flexibility,
increased options, etc.). As a result, studies on UDL do not frequently focus their
investigation on the impact of the practice to instruction. Therefore, unlike the outcomes
section on Blended Learning, the UDL outcomes section only focuses on student
outcomes.
38
Student Achievement. Much of the literature on UDL is anecdotal in nature
(Edyburn, 2010; Schelly, Davies, Spooner, 2011). However, of the few experimental
studies that do exist, outcomes for student achievement have been either neutral or very
positive. In their 2012 study on the effects of Literacy by Design, a UDL based literacy
program, Coyne et al., trained five out of nine K-12 teachers scaffolding strategies and
required them to implement differentiating software four to five times weekly. As a result
of the 10-month long intervention, students in the treatment classes showed “significant
gains” in reading comprehension (Coyne et al. 2012). Similar results came out of
Rappolt-Schlichtmann et al., 2013 study that tested the impact of implementing a UDL
designed a web-based science notebook in 28 different K-8 classrooms. Students in
classrooms that utilized the UDL science notebook experienced “improved science
content learning outcomes,” as compared with their counter-parts who utilized traditional
paper-and-pencil science notebooks (Rappolt-Schlichtmann et al., 2013).
Though positive, these two studies do not represent the norm. In 2015, King-Sears
et al. conducted an experimental study with four high school chemistry classrooms. The
classes were composed of a mix of students with high-incidence disabilities (HID) and
students without. After a two-week UDL intervention, featuring videos, self-management
strategies and various engagement methods, no significant difference was found between
the treatment and control group (King-Sears et al., 2015). Unfortunately, outcomes like
the one in this study are more frequent than the outcomes found in the first two studies
highlighted. Factors such as student demographics, the fidelity of model implementation,
and teacher pedagogical practices could all have accounted for these mixed results.

39
Student Engagement. The ability to increase student engagement is a
fundamental claim of Universal Design for Learning (Meyer et al. 2014), yet empirical
studies on this outcome for UDL are limited. As a meta-construct, true engagement is
often difficult to measure. That problem, combined with the already limited amount of
scientific studies on UDL interventions, may explain the lack of research on the topic.
One exception is the research of Dr. Jennifer Katz, founder of Manitoba Alliance for
Universal Design for Learning and creator of the Three-Block Model of UDL. Katz has
been studying the effects of UDL on student engagement in classrooms across Canada for
over five years. In her 2013 study, involving over 630 students from grades 1st to 12th
attending ten schools, Katz examined the impact of integrating a UDL intervention on
students’ academic and social engagement using several instruments to measure students’
engaged behavior.
The intervention included aspects of differentiated instruction, inquiry based
learning, and assessment for learning. Results from the study showed that post
intervention, students in the treatment group were significantly more actively engaged,
while students in the control group were more significantly passively and/or not engaged
(Katz, 2013). In fact, high school students in the UDL classes spent “44/60 minutes
actively engaged, while those in control classes spent 16/60 minutes actively engaged”
(Katz, 2013, pg. 176).
Student Academic Self-Efficacy (Student Perception). Academic self-efficacy
can be described as the “perceived confidence in one’s ability to execute actions for
attaining academic goals” (Schunk & Mullen, 2012, pg. 222). Because a students’ self-
efficacy is closely tied to their perceptions, research outcomes on these two concepts are
40
typically presented together. The impact of UDL on social factors such as engagement,
attitude, and perception has been well researched and documented. Most of the studies on
Universal Design for Learning are qualitative by design and focus on human effects
rather than academic. Unlike the research on student achievement, the majority of studies
on student perception have resulted in positive outcomes, focusing particularly on how
UDL has bolstered students’ confidence in their own capacity to learn.
Students in the UDL enriched classes for the Rappolt-Schlichtmann et al. study
not only scored better on their posttest than students in non-UDL enriched classes, but
also reported feeling more confident and competent in their work. In the focus groups,
students explicitly acknowledged that the support features embedded in the virtual
notebooks were useful in helping them understand how to accomplish the given tasks
(Rappolt-Schlichtmann, 2013). Similar results were concluded from a UDL intervention
conducted by Kumar & Wideman in 2014. The study focused on the impact of adding
UDL elements (such as allowing students options in completing assignments and
showing instruction and content in multiple formats) to a first-year undergraduate health
science course. On the open-ended portion of the post-survey, students commented on
aspects of the increased flexibility of the course (ability to choose due dates, assignments,
and group or individual work), stating that it was beneficial and positively contributing to
their learning (Kumar & Wideman, 20114). Students also mentioned they “felt more in
control of their learning,” feelings which have been reported to contributing to a students’
academic self-efficacy and success (Meyer et al., 2014).

41
Summary
This section looked at some of the literature regarding both Blended Learning and
Universal Design for Learning. Their conceptual frameworks, working definitions, and
various models were explored. Highlighted here were also some of the reported outcomes
from studies examining the implementation of BL and UDL interventions. It is important
to note that much of the literature presented positive evidence for the implementation of
these practices. This was done intentionally to showcase the potential of each method and
to highlight the reasons why BL and UDL have been chosen as my theories of practice
for this study. Although their potential may be great, the gaps in research and lack of
empirical data leave many questions. It is the goal of this study to help fill some of those
gaps and contribute scientific knowledge regarding the impact Blended Learning and
Universal Design for Learning have on students. In Chapter Four a detailed description of
the study and methodology are provided.

42
CHAPTER THREE: A PREFACE TO THE METHODOLOGY
Changes in the Proposed Study
Since the initial proposal of this study, significant changes have been made to the
methodology that I feel obliged to mention here. Originally this study was designed to
test the impact of integrating UDL principles into a BL classroom, making it solely a
UDL intervention. During the study’s conception, one teacher in particular had
influenced this design and structure. This teacher had been identified through her
previous involvement in another study I had conducted. Through this other work, I had
observed this teacher for approximately a year and purposefully chose her to participate
in the current study. This teacher was targeted due to her high level of technology
integration and the innate plasticity observed in her practices. To get a better
understanding of how UDL can impact teaching and learning in a BL environment it was
necessary to select a teacher who practiced Blended Learning to fidelity. Due to the short
timeframe it was also necessary to select a teacher who already had the capacity to
deliver lessons that showed accommodations for student variance. In addition, the
diversity within that teacher’s school population was beneficial for a study investigating
how BUDL addressed the needs of diverse learners.
Given the technical skill level, engagement level, and innate disposition of the
original teacher, a more involved and intricate intervention was planned that would have
allowed greater adherence to the principles of Blended Learning and Universal Design
for Learning. However, six weeks prior to the new school year, the teacher was offered
and accepted a position at the district office. The loss of this teacher had a ripple effect on
43
the entire study changing, not only the intervention design, but the student demographics,
the type of data collected, and the general research question.
The teacher who ended up participating in the study varied from the original
teacher in many ways. The student population this teacher served was homogenous in
race, socioeconomic status, and skill level. This shift in demographics made it difficult to
measure the impact of BUDL on diverse learners. However, the classrooms being more
homogenous in nature reduced the variance within groups, making it easier to isolate the
variance between groups and identify possible intervention effects. The teacher’s initial
engagement in and disposition toward the study was wary, which led to minor challenges
in the beginning stages of the intervention.
Though there was a class set of laptop devices, such technology was rarely
integrated into the lessons by the teacher. The new classrooms were not Blended
Learning environments, causing a revision in the research question and a rethinking of
the intervention design. Though BL was still incorporated through facets of the
intervention, it was not implemented to the standards referenced in the definition
provided by the Clayton Christensen Institute. Students did not have control over the
time, place, path, and/or pace. Moreover, data from the online component was not used to
change instructional practice. Instead, Blended Learning was integrated in its simplest
form, as the merger of computer mediated instruction and face-to-face instruction.
Lastly, due to strong parental and systemic influences, the proposition of
implementing alternative assessments, based on student choice, and alternative
homework was unwelcome. These points of contention and the potential affect they had

44
on the study are further discussed and examined in Chapter Six. The following chapter
covers the methodology implemented in the study with the new teacher, Mr. Martin4.
CHAPTER FOUR: METHODOLOGY
Research Methods
An experimental mixed methods design was used to answer the following guiding
question and subsequent research questions: How does a Blended Universal Design for
Learning intervention impact an accelerated 7th grade math class?
1. How does the intervention impact student achievement?
2. How does the intervention impact student engagement?
3. How does the intervention impact students’ perception of the classroom?
4. How does the intervention impact student with Individualized Educational Plans
(IEP)?
5. How does the intervention impact English Language Learners (ELL)?
6. How does the intervention impact teacher perception of the curriculum?
Experimental research is best when examining the effects of an intervention on a
specific group. The benefit of using experimental methods in the field of education is that
when “properly implemented, they allow for drawing causal conclusions such as the
conclusion that a particular instructional method causes better learning outcomes”
(Mayer, 2005, pg. 75). To be categorized as a true experiment, the research design must
encompass three elements: manipulation, control, and random assignment. Manipulation
entails “intervening in a situation to determine the impact of the manipulation” (Bryman,
4 Mr. Martin, and the forthcoming school and district name are pseudonyms and have been changed to protect the privacy of the participating teacher, students, and school.

45
2012, pg. 50). Control refers to the presence of a control group that does not receive the
intervention, and which can be used to compare performance against the experimental
group. Finally, in order to be labeled as an experiment, the participants must be randomly
assigned to ensure that there are no systemic differences between the groups that could
potentially affect the outcomes. The students in this study tested into the accelerated math
classes. This test was offered to the entire 7th grade population at the school. The students
were assigned to their teacher and their respective classroom through standard
organizational and administrative processes without the involvement of the teacher or
myself. Random placement of these students is assumed and the class chosen to receive
the intervention was randomly assigned.
The study is a standard field experiment involving one teacher and two
classrooms, where the effects of incorporating BUDL is measured and observed. BUDL
was introduced in one of the classrooms (the experimental class), while the other class
(the control classroom), received the standard curriculum. The class chosen to receive the
intervention was randomly selected. Besides the intervention, all other control variables
(the teacher, the classroom, and the school environment) remained consistent. Pre and
post data were collected from both classrooms in the form of classroom observations,
student focus groups, teacher interviews, student assessment scores, and student
responses on an attitudinal survey.

46
Site and Participant Selection
This study took place in two 7th grade math classes in a small suburban Southern
California K-12 district, Dillon Unified School District (DUSD)5. Dillon USD is situated
in a relatively small city made up of fewer than 25,000 people. The median household
income in the city is approximately $91,000 (U.S. Census Bureau, 2013). The district
itself serves approximately 3,100 students among seven schools. Table 1 displays further
important demographics of the district and the school site involved in the study.
A combination of purposeful and convenience sampling were used for the
study. Purposeful sampling involves selecting cases “in a strategic way, so that those
sampled are relevant to the research questions being posed” (Bryman, 2012, pg. 418).
Both of the participating classes were selected from Dillon Middle School. This school
was purposefully chosen due to its high involvement in 21st Century efforts. The school
has had a Bring Your Own Device (BYOD) program for almost 10 years and purchased
1:1 laptop carts for every classroom to ensure equitable access for all students.
The participating teacher, Mr. Martin was conveniently sampled, identified by his
principal as an effective educator and a willing volunteer for the study. Mr. Martin is a
white male, between the ages of 25-35 years old and has been a full-time teacher for 11
years.
5 The name of the school district and school are pseudonyms and have been changed to protect the privacy of the participating teacher, students, and school.

47
Table 1
Site Demographics
Dillon USD Dillon Middle School
2013 Growth API Score 897 923
District Size 3,169 750
Student Population
5.3% Asian or Filipino; 1.5% Black;
20.4% Hispanic or Latino; 4.1% Two or More Races;
67.7% White
4% Asian or Filipino; 1.8% Black;
18.9% Hispanic or Latino; 4.5% Two or More Races;
69.9% White
Free/Reduced Meals
221
54
English Language Learners 74 12
Title 1 Status Not a Title 1 district Not a Title 1 school
Note. Information taken from Eddata.org and is based on the 2014-2015 school year.
The two classes chosen for the intervention were purposefully selected out of the
four taught by Mr. Martin. These two classes were accelerated math classes, and similar
in student achievement scores and student demographics, as compared to the school
population. They both were also overwhelmingly white. Before the start of the school
year the students, who are the main subjects of this study, were assigned to their teacher
and their respective classroom through standard organizational and administrative
processes without the involvement of the teacher or myself. The class chosen to receive
the intervention was randomly assigned. The demographics of both the control class and
treatment class can be seen in Table 2.

48
Table 2
Control and Treatment Class Demographics
Control Treatment
Class Size 39 40
Student Population
2 - Asian or Filipino; 1 - Black;
1 - Decline to State; 7 - Hispanic or Latino;
2 - Two or More Races; 26 - White
5 - Asian or Filipino; 0 - Black;
2 - Decline to State; 2 - Hispanic or Latino;
0 - Two or More Races; 31 – White
Students with IEP’s
3
1
English Language Learners 3 3
Note. Information provided by the Dillon Middle School.
Mr. Martin’s pedagogical preferences contributed to the lack of student
technology use. Mr. Martin’s instructional practice was traditional in nature; the majority
of his classrooms followed a rigid, teacher-driven structure. Through pre-intervention
observations it was determined that the configuration of Mr. Martin’s classroom typically
went as follows:
• In the first 10-15 minutes of class students would work on warm-up problems
displayed on the Smartboard. During this time he would go around and check to
make sure students have their homework from the night before. He would not
check it for completion or accuracy.
• The next 15-20 minutes would be spent on reviewing the warm-up and the
homework from the night before. During this time he would answer students’
questions, physically demonstrate how to do certain problems on the Smartboard,

49
and at times allowed students to come up and demonstrate how they solved the
problem.
• Then 10-15 minutes are spent explaining a new concept that builds on or
reinforces old concepts that were learned earlier in the week. For this process, Mr.
Martin is at the front of the classroom working through example problems on the
Smartboard. He uses a call and response type method to check for understanding.
• Students are given the last 10-15 minutes of class to start working on their
homework. During this time the teacher walks around the classroom answering
individual students’ questions. If during this time, Mr. Martin notices the same
issue arising or question being asked he stops the whole class to address the issue.
Despite the timing varying day to day, the order of these activities stayed consistent
(unless it was a test day). According to Mr. Martin, the structure of these two classes was
necessary in order to get through all the content required each week. During the weeks of
the intervention, the control classroom continued to receive this format of instruction.
Power Sample
Since this study is limited to one teacher with two classrooms, the number of
students available to participate was fixed. To determine the sample size necessary to
achieve statistical significance, a power sample test was conducted. When conducting a
power sample there are three parameters that need to be identified: Alpha, power, and the
effect size. Alpha indicates the probability of finding significance where there is none; it
is usually set at .05. Power is the probability of finding true significance and is usually set
at .80. The effect size, or the expected effect, is usually determined from the literature or
a pilot study and can vary from small (.20), medium (.50), and large (.80). Since there is a

50
lack of literature and studies on UDL and BL interventions, all effect sizes are tested to
determine appropriate sample sizes. Table 3 displays the results of the power sample.
Table 3
Effect and Sample Sizes
Effect Size Sample Size
Small Effect (.2) 788 participants
Medium Effect (.5) 128 participants
Large Effect (.8) 52 participants
Given that this study used a set sample size of approximately 79 students, a large
effect size is needed in order for the study to have sufficient power and achieve statistical
significance. Though obtaining a large effect size was unlikely in a study of this nature,
potentially meaningful differences based on qualitative data may still be relevant.
The Intervention
In Mr. Martin’s class, student technology use was not a part of the daily, or
weekly curriculum. Though there was a class set of laptops available, the timing in class
rarely allowed him to utilize them. Mr. Martin only saw his students for approximately 55
minutes a day. In addition, the two classes chosen to participate in the study were 7th
grade accelerated math classes, as such, these two classes were required to cover 7th
grade and 8th grade content in one year. On average, students in these classes were
learning two to three math concepts a week, as compared to their regular math
counterparts, who learned on average one concept a week. These requirements left major
constraints on time and added to the basis of why Mr. Martin did not regularly use the

51
technology provided in his classroom. The task of allowing students to use the laptops to
complete classwork or homework is a timely one. The time it takes to pass out the
laptops, to boot them up, for students to access the desired content, to shut the down and
to properly store them can take approximately 15 to 20 minutes of class time.
Though willing to participate in the study, Mr. Martin was adamant about keeping
a similar structure to both classrooms. He still wanted to reserve time to go over the
homework and teach a new concept, but he was willing to forgo the warm-up and
allowed me to use the homework time to implement a learning activity related to the
concept taught in class that day. After meeting with Mr. Martin a few times, it was
decided that I would have approximately 30 minutes, three to four times a week over the
course of one math unit (polynomials) to implement learning activities in relation to the
study. This particular unit took 15 school days to cover; eight of those 15 days were
allocated for experimental learning activities. Due to the short timeframe allowed for the
intervention, I decided to forgo individual use of the laptops and subsequently the
opportunity to use online student data to inform teacher instruction. The implications of
this decision are discussed further in Chapter Six.
It was also decided that the intervention would not include alternative homework
options due to both his pedagogical preferences and the general concern over parent
opposition. At this particular school, parents are very active in their students’ education.
The idea of providing alternative homework for the treatment class arose as a potential
point of contention because of siblings in different sections receiving different
homework. However, keeping the homework the same added to the consistency of the

52
instruction, and again assisted in the analysis of the intervention by minimizing
measurement error.
Experimental Curriculum
As a reminder, the curriculum in this study is referring to the learning goals, the
means of assessment, the teaching methods, and the materials. Due to the aforementioned
restrictions on classroom structure and assessments, only the teaching methods and
materials are addressed in the intervention. After observing both classes for 6 days (12
hours) over a two-week period, I began curating alternative academic material from
various open educational resources (OER) such as CK-12.org, teacherspayteachers.com,
nextlesson.org, and letsgolearn.com. The lessons gathered from these sites were chosen
because of their alignment to one or more UDL principles. Table 4 provides a list of the
activities, along with a description, the student grouping used, and the UDL principle the
activity addressed.
The LetsGoLearn website was used for whole class instruction and activity. On
days where Mr. Martin would introduce a new concept, a corresponding video from the
LetsGoLearn repository was shown to reinforce the lesson. The videos were animated
and included songs to help students remember certain processes. The videos also
included two to three digital practice problems after each concept. Mr. Martin had all the
students solve the problems individually in their notebooks, then called on one student to
come up to his computer to solve the problem for the class. The LetsGoLearn videos,
which students watched twice a week for two weeks, were ultimately the only integration
of technology provided by the intervention.

53
As there is no explicit model for UDL, Mr. Martin and I worked as co-designers
in creating this enhanced curriculum. All materials and instructions necessary to carry out
the lessons were provided by me, but delivered in the classroom by him. Over 20 lessons
and resources were collected and given to Mr. Martin for review. From those 20, eight
lessons were chosen, considering Mr. Martins’ preference and comfort level. Ultimately,
no lesson was implemented without his approval.

54
Table 4
Experimental Learning Activities
Name Description Student Grouping
UDL Principle
Scientific Notation Puzzle
Math manipulative to visually solve scientific to standard notation conversions and vice versa
Small Groups
Alternative form engagement & action and expression
Let's Go Learn Instructional Videos Whole Class Alternative form of representation & engagement
Who Dunnit
Students solved 10 practice problems that increase in difficulty. After each answer they received a clue to a fictional "murder". The goal: to determine who, what and where.
Partners Alternative form of engagement & action and expression
Roll The Dice
Students rolled dice covered in terms and then flip a penny, based on the penny they must multiply or divide the terms.
Small Groups Alternative form of engagement & action and expression
Scavenger Hunt
Students solved problems that lead them to different math problems around the room, first team to finish received a pen.
Partners Alternative form of engagement & action and expression
CSI Review
Students worked in teams to investigate the culprit of six fictional thefts. The criminal has left six messages, layered with algebra. Teams worked to build a case and present their findings
Partners Alternative form of engagement & action and expression

55
Data Collection
Data was collected from October 2015 to December 2015, lasting a total of eight
weeks. Throughout the first three weeks, only baseline data was collected. Student
demographic data, along with data from teacher interviews, student focus groups, student
assessment scores, student survey responses, and classroom observations, were collected
both prior to and after the intervention.
Demographic Data. Student demographic data was collected at the onset of the
school year. Information was provided from the school with the permission of the
principal and district superintendent. The data indicated the participant students’ race,
Individual Educational Plan (IEP) status, and English Language Learner (ELL) status.
Teacher Interviews. A semi-structured interview protocol was used to give me
“latitude to ask further questions in response” (Bryman, 2012) to what was seen during
classroom observations. Teacher interviews took place before and at the end of the
intervention. The interviews were used to assess, among other things, perceived changes,
in student behavior and differences in classroom dynamics. The teachers’ pedagogical
beliefs on the efficacy of the intervention were also explored. The teacher interview
protocol can be found in Appendix A.
Classroom Observations. Classroom observations were used to obtain a visual
comparison of student behavior pre and post intervention. Observations took place two to
three days a week across six consecutive weeks. A daily observation protocol was used to
compare student behavioral engagement (see “Behavioral Engagement” in the Measuring
Engagement section). The classroom observation protocol can be found in Appendix B.
Attitude Towards Mathematics Inventory (ATMI). The Attitude Towards

56
Mathematics Inventory (ATMI) was used to measure student affective and cognitive
engagement (see “Emotional Engagement” and “Cognitive Engagement” in the
Measuring Engagement section). The ATMI is a 40 item, 5-point Likert scale
questionnaire designed to measure student’s attitudes towards mathematics. The scale
consists of four subscales, which measure enjoyment (the degree to which students enjoy
working on mathematics); motivation (student’s interest in mathematics); self-confidence
(confidence and self-concept in their performance in mathematics); and value (student’s
belief on the usefulness and worth of mathematics) (Tapia & Marsh, 2004). The scale has
been tested with middle school, high school, and college age students, with alpha
reliability coefficients that ranged from .95 to .97. The scale also produced high
Cronbach alpha coefficients of .89 for enjoyment, .88 for motivation, .95 for self-
confidence, and .89 for value (Tapia & Marsh, 2004). The test-retest reliability of the
scale over a 4-month period is .89, making the ATMI a reliable instrument. The
“correlations between the ATMI subscales, and their correlations with theoretically
related constructs (mathematics anxiety, ease, and achievement), were all in line with the
results of numerous other empirical studies and theoretical reasoning, and supported the
construct validity of the instrument” (Lim & Chapman, 2013). The survey was
administered pre and post intervention by the teacher. The ATMI can be found in
Appendix C.
Student Focus Groups. Pre and Post intervention focus groups, for both the
control and treatment class, were conducted to obtain student perceptions (see
“Measuring Student Perception”) of the lessons and classroom activities. These student
focus groups were also used as a way to better understand student responses on the
57
ATMI. The student focus group protocol can be found in Appendix D.
Student Test/Assessment Scores. Student quiz and test scores were collected to
measure student achievement (See “Measuring Student Achievement”). During the
intervention, the students completed one pop quiz (formative) and one chapter test
(summative). Both assessments were generated and graded by the teacher.
Analytical Memos. Though not included in the data analysis, I reflected and
wrote about emergent themes, concepts, inquiries, connections or any issues I had about
the students, teacher or the study itself. These memos were used to help me understand
what was occurring in the classroom and in the study more generally, and to interrogate
my initial assertions.
The data collected from the teacher interviews, classroom observations, and the
student focus group were used for triangulation purposes, giving further detail and
explanation of the quantitative results. Data was collected through a variety of sources
(data triangulation) and was analyzed using both quantitative and qualitative methods in
an effort to strengthen the credibility and validity of the findings (Patton, 1999). Patton
defines data triangulation as a “means [of] comparing and cross-checking the consistency
of information derived at different times and by different means within qualitative
methods” (Patton, 1999, pg. 1195). Two examples Patton gives are “comparing
observational data with interview data” and “comparing the perspectives of people from
different points of view” (1999, pg. 1195). In this study data was collected from four
different primary sources. The data was triangulated by examining various stakeholder
perspectives, which included the perspective of the researcher; teacher, and the students.
Table 5 depicts what data was collected to answer each research question.
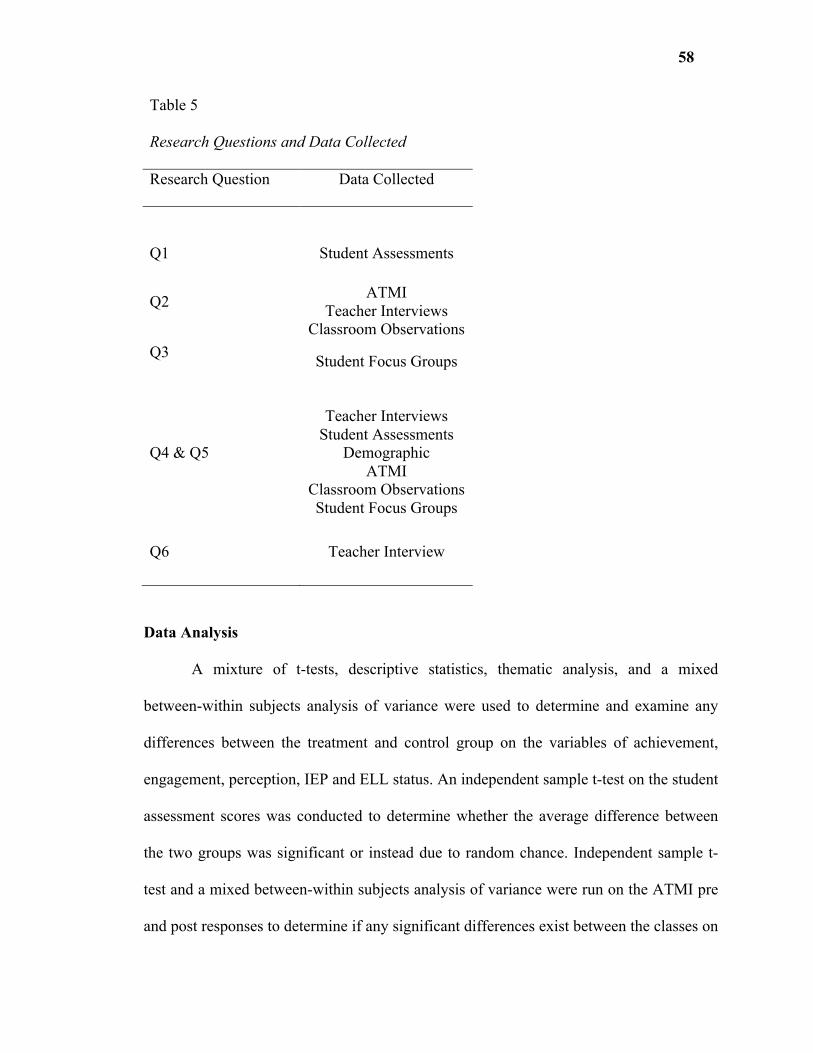
58
Table 5
Research Questions and Data Collected
Research Question Data Collected
Q1
Student Assessments
Q2 ATMI Teacher Interviews
Classroom Observations Q3 Student Focus Groups
Q4 & Q5
Teacher Interviews Student Assessments
Demographic ATMI
Classroom Observations Student Focus Groups
Q6 Teacher Interview
Data Analysis
A mixture of t-tests, descriptive statistics, thematic analysis, and a mixed
between-within subjects analysis of variance were used to determine and examine any
differences between the treatment and control group on the variables of achievement,
engagement, perception, IEP and ELL status. An independent sample t-test on the student
assessment scores was conducted to determine whether the average difference between
the two groups was significant or instead due to random chance. Independent sample t-
test and a mixed between-within subjects analysis of variance were run on the ATMI pre
and post responses to determine if any significant differences exist between the classes on

59
each subscale (value, enjoyment, motivation and self-confidence). Descriptive statistics
were used to describe and summarize the differences between groups in student test
scores and ATMI results. Thematic analysis was employed to characterize patterns and
themes within the teacher interview, classroom observations, and student focus groups.
Table 6 further illustrates which processes were used to answer each of the research
questions.
Table 6
Research Questions and Data Analysis
Research Question
T-test & Between-Within Subjects
Analysis of Variance
Thematic Analysis Descriptive Statistics
Q1 Do differences in achievement exist?
X What are the differences in achievement?
Q2
Do differences in engagement exist?
What observable differences in engagement exist?
What are the differences in engagement?
Q3
x
How do students perception
compare and contrast between groups?
What are the differences in perception?
Q4 & Q5 Do differences in achievement &
engagement exist?
How do students perception compare and contrast between IEP and ELL
groups?
What are the differences in perception?
Q6
x
In what ways, if any has the
intervention affected the teacher's perception?
x
SPSS and Dedoose were the analytical software used in the data analysis process.
In coding the qualitative data, a combination of protocol, process, and affective coding

60
(Saldana, 2013) was employed. Protocol codes were used from the three UDL principles:
multiple means of engagement, representation, and action and expression. Process
coding, also known as action coding, was used to describe what was happening in the
classroom, what subjects were doing and what interactions took place. Affective codes,
also known as emotion codes, were used to identify and name reactions, feelings, and
attitude. In addition to those three coding processes, emergent codes stemming from the
researchers’ analytical memos were also used to help identify significant events that may
occur.
Measures of Student Achievement. Student achievement was based on the
teacher generated assessments that were given to students to test their knowledge
acquisition of the material. All forms of assessments were graded solely by the teacher
and based on the students’ ability to demonstrate their understanding of the week’s lesson
or concept. Content acquisition and understanding of core concepts were the determinant
factor in the grading process.
Measures of Student Engagement. As a meta-construct, student engagement
was measured on three main dimensions: behavioral engagement, emotional or affective
engagement, and cognitive engagement.
Behavioral engagement. Behavioral engagement included time on task,
classroom participation, adherence to classroom rules and appropriate classroom
behavior, and perceived effort, among other things. Primarily measured through teacher
perception (captured by teacher interviews) and classroom observations, behavioral
engagement was measured at the classroom level. For an extensive list of behavioral
factors that are used to quantify engagement, please refer to the classroom observation

61
protocol (Appendix B) and the teacher interview protocol (Appendix A).
Emotional (affective) engagement. Emotional engagement included factors such
as interest in, perceived value of, attitude towards, and emotional reactions to
mathematics. Christenson and Reschly posit that self-reporting is the best method for
collecting information on student emotional engagement, stating that “their reports are
likely more accurate, or at a minimum, an important addition to the information obtained
form other sources (peers, adults, etc.)” (2012, pg.13). For this reason, emotional or
affective engagement was measured through the ATMI (Appendix C).
Cognitive Engagement. Cognitive engagement was measured by academic self-
efficacy. Academic self-efficacy is the “perceived confidence in one’s ability to execute
actions for attaining academic goals” (Schunk & Mullen, 2012, pg. 222). Research
indicates that a high sense of academic self-efficacy can positively influence effort,
persistence, motivation, and the use of effective learning strategies (Bandura, 1997,
Schunk & Mullen, 2012, Schunk & Pajares, 2009). Due to the personal nature of this
construct, it was also measured through items on the ATMI (Appendix C).
Measures of Student Perception. Student perception was analyzed through the
student focus groups. The open-ended questions in the focus group assisted in providing
insight on how student perceived the learning activities and their learning environment.
Emergent data was coded. The student focus protocol can be found in Appendix D.
Positionality
For transparency, it is important that I not only acknowledge any preconceptions
or predisposition I may have, but also illuminate how these may or may not have
influenced the study. The lens through which I approached this study resulted from my
62
experiences as a researcher, former Title 1 grant coordinator and being the daughter of a
former assistant superintendent. Though I have been immersed in K-12 education most of
my life, I have never been a teacher. Moreover, I do not consider myself math inclined.
As such, my positionality within this study is that of an insider-outsider (Banks, 1998).
As a result of my professional and personal experiences, I do have an intimate knowledge
of K-12 environments and classroom proceedings, allowing me to recognize typical and
atypical situations, behavior, and activities. However, due to my mild aversion to math, I
acknowledge that my ability to critically choose appropriate alternative content and
objectively evaluate math instruction is limited. To mitigate the issue of choosing
appropriate content, Mr. Martin (a content expert) worked as a co-designer on the
intervention, reviewing and essentially approving of all material used in the lessons.
Findings related to the critique of instruction were triangulated through at least three
sources of data to ensure objectivity.
Design Limitations
The design of this study is feasible, logical, and tenable, but it is not without
limitations. Ecological validity is sometimes difficult to ensure within classroom settings.
Ecological validity is the extent to which “social scientific findings are applicable to
people’s every day, natural social settings” (Bryman, 2012, pg. 48). For instance, the
findings derived from the student survey could be internally and externally valid and
have measurement validity, but the process of filling out a survey for students is
unnatural and could limit the ecological validity of the experiment. A similar limitation is
the Hawthorne effect, in which individuals alter their behavior in response to their
awareness of being observed. If students in the experimental group adjust their survey

63
responses to reflect more positive results because they know they are being monitored,
then the true significance and effect size of the intervention could be threatened. To
minimize these limitations, the student survey was introduced and distributed by the
teacher as part of students’ weekly assignments for the class.
The lack of generalizability is also a limitation due to the small sample size of
both the control and experimental group. The target population is all K-12 students,
however for time and management purposes, only 80 students, in one grade, at one
school, in one district participated in this study. In order to substantiate any significant
impact the intervention might have on student achievement and student engagement,
subsequent experiments with various grade levels, teachers and school are necessary. The
content specificity of the classrooms involved in the study also hinder its generalizability.
Findings may not be transferable to classrooms that focus on other content areas, such as
English, history or even science.
A two-week long intervention was chosen to coincide with the dissemination of
one math unit (i.e., polynomials) and during a stretch of uninterrupted school days (i.e.,
no holidays or vacation days). Though various components of the intervention were
delivered to the students multiple times a day and multiple days a week, it is uncertain if
the length of the intervention affected its impact on student outcomes.
Lastly, since the same teacher provided instruction to both the experimental and
control groups, there was a chance of cross-contamination. The teacher could have
consciously or unconsciously applied some of the UDL enhanced strategies in the control
classroom, thus potentially impacting results. To combat this issue, I closely monitored
the teacher’s practice in both classes at least two days a week to ensure that the control

64
group was given the standard curriculum. I was also able to meet with the teacher a few
days a week to address any issues or concerns about providing two classes with separate
curriculum. Of course, underlying dynamics such as social and cultural factors (such as
students’ relationship or historical feelings toward the teacher), that are not exposed in
the study may also have impacted student outcomes.
Summary
This chapter outlined the intervention, identified the participants, and described
the overall methodology for this study. The next chapter, Chapter Five, details the results
of the intervention.
65
CHAPTER FIVE: FINDINGS
Introduction
Through an experimental design, this study sought to determine the impact of a
Blended Universal Design for Learning intervention on students in an accelerated 7th
grade math class. Specifically, the interventions’ effect on student achievement,
engagement, and perception was examined. Differences in impact among English
Language Learners and students with Individualized Education Plans (IEP) were also
investigated. Finally, changes in the teachers’ perception as a result of the intervention
were documented. In this chapter, the findings will be organized by each research
question.
Impact on Student Achievement
In this study, student achievement was measured by the grade students received
on assessments. Over the course of the intervention two assessments were given to both
classes: a pop quiz and a chapter test. Both tests measured the students’ ability to add,
subtract, multiply and divide polynomials and convert standard notation to scientific
notation and vice versa, content that was covered extensively in class over a two-week
period. The assessments were generated and graded by the teacher.
Quiz Results
The quiz, which consisted of 10 questions, was given approximately one week
into the intervention. During this first week, students watched two LetsGoLearn videos,
completed the Scientific Notation Puzzle, and two Who Dunnit activities (for more
information about these activities please refer to Table 4). The pop quiz was the fourth
quiz taken in the class, but the students were not forewarned that they were going to be

66
taking this quiz. At first examination the impact of the intervention on the quiz scores of
the experimental group seemed significant. Of the 40 students in the experimental group,
21 of them received 100% or higher (extra credit) on the quiz, as compared to the control
group where only 13 of the 39 students received a 100% or higher. Figure 4 displays the
spread of scores across both the control and experimental class.
Figure 4. Quiz 4 Score Distribution.
As Figure 4 indicates, 73% of the students in the treatment group received an A or
better on the quiz. In the control group 64% of the students received an A or better on the
quiz.
The class average for the experimental group was 94.3% as compared to the class
average of 90.5% for the control group. To help assess if this 3.8% difference had been
due to the intervention or a normality of class variation, all prior quiz scores were
collected and examined. Prior scores revealed that the experimental class scored higher
than the control class on all quizzes. That is, the experimental group typically performs
higher than the control group. Therefore, the experimental groups’ higher average alone
can not necessarily be attributed to the intervention. However, there was a noticeable
1 3 10 12 13
1 1 1 8 8
21
0
10
20
30
40%+ 50%+ 60%+ 70%+ 80%+ 90%+ 100%+ Num
ber o
f Stu
dent
s
Grade Percentage
Quiz 4
Control (n=39) Experimental (n=40)

67
increase in the average difference between the two classes that may have been influenced
by the intervention. Typically, on quizzes, the experimental class averages 1.7% higher
than the control class, but on the polynomial quiz the experimental class averaged 3.8%
higher. That is a 2.1% increase of the experimental class scores post-intervention. Table 7
shows the experimental and control class average for each quiz taken that semester and
the difference between class scores. Quiz 4 is the polynomial quiz that was given during
the intervention.
Table 7 Quiz 4 Class Averages
Quiz 1 Quiz 2 Quiz 3 Quiz 4
Experimental (n=40) 89.7% 90.9% 90.7% 94.3%%
Control (n=39)
87.0%
88.9%
90.3%
90.5%
Difference 2.7% 2.0% 0.4% 3.8%
For 58% of the students in the treatment group, the score they received on their
polynomial quiz was one of the highest scores they had ever received on a quiz in that
class; this was true for 36% of the students in the control group6. Though these results are
positive, an independent-samples t-test was conducted to compare the Quiz 4 scores for
the control and experimental class. The results from the test indicate that there is no
statistically significant difference in scores for the experimental class (M = 94.25; SD =
13.85) and the control class (M = 90.46; SD = 10.97); t (77) = 1.345, p = .18, two-tailed).
6 This percentage includes students who had received the exact score on a previous test (i.e., they scored a 95% on quiz 4, but had also scored a 95% on quiz 2).

68
The magnitude of the differences in the means (mean difference = 3.8, 95% CI: -1.82 to
9.4) was small (d = .3). As mentioned in the limitations, the small sample size of 79
participants likely contributed to the non-significant result of the t-test. The implications
of these results will be discussed in Chapter Six.
Test Results
The students were given a culminating chapter test at the end of the two-week
intervention. The test, consisting of 25 questions, was the fourth test the students had
taken in the class. The students knew this test was going to be given and participated in
test preparation the day before. The experimental class received an altered lesson (CSI
Review, see Table 4), influenced by the intervention. Though not as considerable as the
results on the pop quiz, the scores on the chapter test were also revealed positive trends
for the experimental group. Only 1 student in the experimental group received a 100% or
higher (extra credit) on the test, whereas 3 students in the control group received a 100%
or higher. Though the control group had more students score 100%, 60% of the students
in the treatment group received a grade of an A or better on test, compared to 38% of
students in the control group. Figure 5 displays the distribution of scores for both the
control and experimental group for the Test 4.
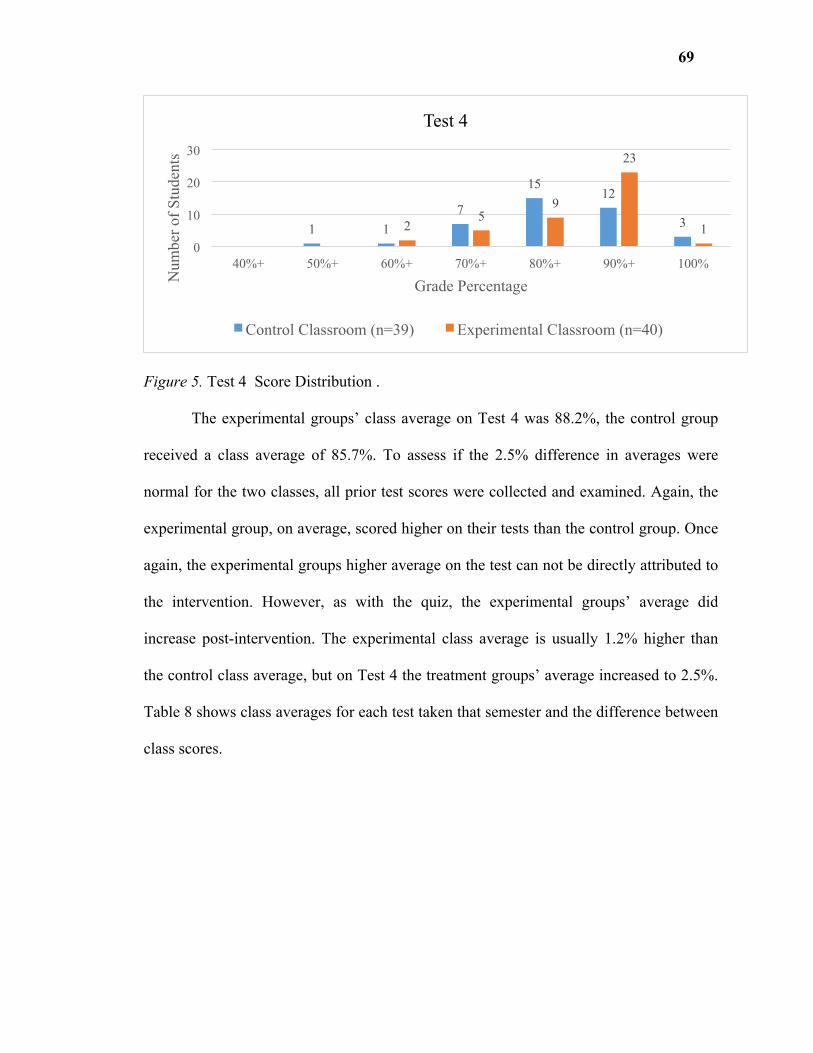
69
Figure 5. Test 4 Score Distribution .
The experimental groups’ class average on Test 4 was 88.2%, the control group
received a class average of 85.7%. To assess if the 2.5% difference in averages were
normal for the two classes, all prior test scores were collected and examined. Again, the
experimental group, on average, scored higher on their tests than the control group. Once
again, the experimental groups higher average on the test can not be directly attributed to
the intervention. However, as with the quiz, the experimental groups’ average did
increase post-intervention. The experimental class average is usually 1.2% higher than
the control class average, but on Test 4 the treatment groups’ average increased to 2.5%.
Table 8 shows class averages for each test taken that semester and the difference between
class scores.
1 1 7
15 12
3 2 5
9
23
1 0
10
20
30
40%+ 50%+ 60%+ 70%+ 80%+ 90%+ 100%
Num
ber o
f Stu
dent
s
Grade Percentage
Test 4
Control Classroom (n=39) Experimental Classroom (n=40)

70
Table 8
Test 4 Class Averages
Test 1 Test 2 Test 3 Test 4
Experimental (n=40)
87.7% 92.4% 90.8% 88.2%
Control (n=39)
86.6%
91.9%
88.8%
85.7%
Difference 1.1% 0.5% 2% 2.5%
The experimental class average went down 2.1% on the test. There are potentially
two explanations for this outcome. One explanation for this outcome may be attributed to
the intervention. Unlike the quiz, the test had problems on how to multiply polynomials,
a concept (according to the teacher) students, in both the experimental and control class,
had major trouble grasping. The main learning activity in the intervention for multiplying
polynomials was the dice game. The dice game included a pair of dice with polynomials
on each side and a penny. Students were put in groups and were required to roll the dice
and flip the penny. If the penny landed head up they would divide the two polynomials
facing up on the dice, if the penny landed tails up they would divide. The probability of
students working on a multiplication problem was, theoretically reduced by half during
this activity. If students had been given more dedicated time to practice multiplying
polynomials, such problems may not have caused such an issue for students on the test.
This would be a direct fault in the lesson. However, the other explanation is that the test,
in general, was harder than usual. In addition to the experimental group, the control group
also went down in their class average by 3.4%. That both classes scored below their usual

71
average could infer that the test (being the common denominator), and not the
intervention influenced the decrease in scores.
An independent-samples t-test was conducted to compare the Test 4 scores for the
control and experimental class. Again the results from the test indicate that there is no
statistically significant difference in scores for the experimental class (M = 88.18; SD =
10.11) and the control class (M = 85.67; SD = 10.95); t (77) = 1.058, p = .3, two-tailed).
The magnitude of the differences in the means (mean difference = 2.5, 95% CI: -2.21 to
7.23) was small (d = .24). As previously mentioned, the non-significant result may be due
to insufficient power as a result of the small sample. The implications of these results will
be discussed in Chapter Six.
Impact on Student Engagement
Student engagement refers to “the degree of attention, curiosity, interest,
optimism, and passion that students show when they are learning or being taught, which
extends to the level of motivation they have to learn and progress in their education”
(edglossary.org, 2015). As a meta-construct, student engagement was measured on three
dimensions: behavioral, emotional and cognitive. Data from the observation notes,
teacher interviews, and Attitude Towards Math Inventory (ATMI) were analyzed to
interpret the overall impact of the intervention on student engagement. The following
sections report the findings by data source.
ATMI Results
The ATMI is a 40-item questionnaire that measures students attitude towards
mathematics. Emotional and cognitive engagements were the constructs specifically
addressed through this measure. The questionnaire itself measures a student’s response

72
across four subscales: enjoyment (the degree to which students enjoy working on
mathematics); motivation (student’s interest in mathematics); self-confidence (confidence
in their performance in mathematics); and value (student’s belief on the usefulness and
worth of mathematics) (Tapia & Marsh, 2004). Combined, these subscales for this
particular study produced a high Cronbach Alpha of .97, indicating good internal
consistency. The ATMI was administered pre and post intervention to both the
experimental and the control group. A copy of the ATMI can be found in Appendix C.
The questionnaire was on a 5-point Likert scale with 1 being strongly disagree
and 5 being strongly agree. Negatively worded questions were reversed valued, resulting
in a ATMI score range of 40-200. There were 10 enjoyment items, 5 motivation items, 15
self-confidence items, and 10 value items. As such the scale for each subscale was within
the following ranges: enjoyment (10-50); motivation (5-25); self-confidence (15-75); and
value (10-50).
The administration of the ATMI, pre intervention, resulted in 33 submissions,
however, two were thrown out due to being incomplete. Thirteen of the 31 submissions
were from students in the control class, with the other 18 being from students in the
experimental group. Table 9 displays the class pre mean scores for the individual
subscales and the ATMI as a whole. An Independent-samples t-test was conducted to
compare the total attitude towards math scores for the two classes. There were no
significant differences in the scores for the control (M = 167.08, SD = 15.5) and
experimental class (M = 163.22, SD = 18.63; t(29) = .608, p = .65, two tailed). The
magnitude of the differences in the means (mean difference = 3.9, 95% CI: -9.12 to
16.83) was small (eta squared = .224).

73
Table 9
Pre ATMI Averages
Subscale Class Mean N
Value Pre Control 45.69 13
Experimental 43.89 18
Enjoyment Pre Control 39.62 13
Experimental 37.44 18
Motivation Pre Control 20.15 13
Experimental 20.72 18
Self Confidence Pre
Control 61.62 13
Experimental 61.17 18
Pre Attitude Towards Math
Control 167.08 13
Experimental 163.22 18
Though no statistical significance was found, it is important to note that before the
intervention, the control group self-reported higher scores than the experimental group.
These scores indicate that these students’ attitude towards math and general engagement
in math was already, (pre-intervention) fairly positive. Examining the subscales
separately led to similar outcomes. Both classes scored higher than average for each
subscale. The control class did report higher scores on their perceived value of math, their
enjoyment of math and their overall self-confidence doing math. Motivation was the only
subscale that the experimental group scored higher in than the control group.

74
The administration of the ATMI post intervention resulted in 60 responses; three
of which were not included in the analysis due to being incomplete. The increase in
ATMI responses from pre to post can most likely be attributed to one of two things: an
increase in parent permission slips allowing the child to take the survey and an improved
relationship with the researcher and a recognized association of the ATMI with the
researcher. Of the 57 complete surveys, 33 came from the control class and 24 came from
the experimental class. Table 10 displays the post class mean scores for the individual
subscales and the ATMI as a whole.
Table 10
Post ATMI Averages
Subscale Class Mean N
Value Post Control 42.36 33
Experimental 42.58 24
Enjoyment Post Control 37.67 33
Experimental 35.58 24
Motivation Post Control 18.91 33
Experimental 19.96 24
Self Confidence Post
Control 60.18 33
Experimental 60.17 24
Post Attitude Towards Math
Control 159.12 33
Experimental 158.29 24

75
An Independent-samples t-test was conducted to compare the total attitude
towards math scores for the two classes. Again there were no significant differences in
the post scores for the control (M = 159.12, SD =22.45) and experimental class (M =
158.29, SD = 25.65); t(55) = .730, p = .90, two tailed). The magnitude of the differences
in the means (mean difference = .83, 95% CI: -12 to 13.65) was very small (eta squared =
.034). Again the control group scored higher on their overall attitude towards math than
the experimental group. Interestingly, both groups’ post ATMI averages went down on
every subscale. The control group remained higher than the experimental group on the
self-confidence and enjoyment subscale, yet fell slightly below the experimental group on
the value subscale. The experimental group again averaged higher than the control group
on the motivation subscale.
It could be assumed that any ATMI score variation could be attributed to
sampling error. To possibly get a truer estimate of the impact of the intervention, a mixed
between-within subjects analysis of variance was conducted to assess the impact of the
intervention on participants who completed both the pre and post ATMI. Only students
who took both the pre and post ATMI were examined, therefore only 22 students were
included in this analysis. As expected, there was no significant interaction between the
class and time, Wilks’ Lambda = .1, F (1, 20) = .009, p = .93, partial eta squared = .000.
There was no substantial main effect for time, Wilks’ Lambda =.1, F (1, 20) =.034, p =
.86, partial eta squared = .002. The main effect of comparing the two classes was not
significant, F (1, 20) = 1.83, p = .19, partial eta squared = .084.

76
Table 11
Pre & Post ATMI Averages
Subscales Class Pre Mean Post Mean N
Value
Control 46 44.5 10
Experimental 43.1 44
12
Enjoyment
Control 37.6 38.5 10
Experimental 35.4 34.8
12
Motivation
Control 18.3 17.8 10
Experimental 18.2 18.1
12
Self Confidence Control 40.8 39.8 10
Experimental 40 39.6 12
Attitude Towards Math
Control 170.5 170 10 Experimental 161.67 161.5 12
As shown in Table 11, the total ATMI score for both the control and experimental
group did not change much from pre to post. Similar to the whole class analysis, the
ATMI score for students who took both pre and post decreased. Results from this
analysis suggest that there is no difference between the control group and group that
received the intervention. It also indicates that there was no significant difference in the
pre or post scores of these students. The implications of these statistics will be discussed
in Chapter Six.
Classroom Observation Results
Classroom observations were conducted specifically to examine student behavior
during the various learning activities. During the intervention, particular attention was
paid to verbal and nonverbal indicators of students’ engagement. The intervention
77
exposed the experimental class to alternative learning activities, however, the learning
objectives (e.g., learning how to divide polynomials) for both classes remained the same.
Comparisons were made between the control and experimental group on the way students
behaved during their respective learning activities. For a general idea of what verbal and
nonverbal indicators were documented, please refer to the observation protocol in
Appendix B.
Both classes were generally well behaved, which could have been assumed given
their achievement level, and their high scores for perceived value, enjoyment, and
motivation on the ATMI. Students, in both classes, followed along with teacher
instruction, adhered to basic classroom rules and regulations, and were on-task a majority
of the time. However, a thorough coding of the observation notes revealed that the
experimental class demonstrated higher levels of behavioral engagement and spent more
time actively learning than the control class. Active learning requires students
“participate in the learning process and do something besides passively listening”
(Bonwell & Eison, 1991, pg.5).
In the control classroom, where the learning activities were mostly teacher
directed, active learning was limited. Students spent the majority of their learning activity
time listening to teacher instruction, completing independent work, responding to queries
posed to the class, and asking for clarification on classwork or homework. Because these
activities did not require all students to be actively involved, many students did not
participate (e.g., they did not ask questions, they did not offer answers, and demonstrated
off-task behavior during instruction). Students in the control class were more frequently
seen engaging in off-task communication, off-task manipulation (e.g., drawing, poking

78
their neighbor, etc.,) and aimlessly gazing. Figure 6 is a picture of the control class
participating in their learning activity for adding and subtracting polynomials. During this
activity students are supposed to be working individually in their notebooks, but as the
picture shows some students are turned around in their seats, talking to their peers or even
have their head on their desks.
Figure 6. A picture of the control class engaged in a learning activity on adding and subtracting polynomials.
The snapshot presented in this picture is an accurate and consistent example of
students’ behavior in the control class during the learning activities. Though students
were on-task for the most part, their lack of active involvement, combined with their off-
task behavior, demonstrated an overall lower level of student engagement.
The experimental class, on the other hand, demonstrated considerably less off-
task behavior. The activities presented in this class required all students to be more

79
actively involved. In addition to listening to teacher instruction, responding to queries
posed to the class, and asking for clarification on classwork or homework, students in the
experimental class also had to demonstrate their learning, assist others in their learning,
communicate with their peers, manipulate learning materials, and cognitively connect
math concepts to bigger ideas. These activities required the active involvement of all
students. During these activities, though off-task communication was heard from time to
time, off-task manipulation, and aimless gazing were not apparent. Figure 7 and Figure 8
are pictures of students in the experimental class participating in a learning activity on
adding and subtracting polynomials.
As the pictures show, students are actively participating in the activity. They are
communicating with peers, searching for clues, problem solving, and manipulating lesson
materials. The lack of negative behavior, along with the multitude of positive behavior
displayed in the experimental class during intervention driven activities, connote higher
levels of interest and overall engagement. Though these conclusions were derived from
my own observations, when interviewed, the teacher gave similar accounts of the
students’ behavior. Results from the teachers’ interview in regard to student engagement
are highlighted in the next section.

80
Figure 7. A picture of the experimental class engaging in a learning activity on adding and subtracting polynomials.
Figure 8. A picture of the experimental class engaging in a learning activity on adding and subtracting polynomials (different angle).

81
Teacher Interview Results
Mr. Martin was interviewed twice, once at the beginning of the study and once at
the end. Each interview lasted roughly 45 minutes. His opinions on the temperament of
the two classes during the intervention, particularly questions about the students’
behavior, were solicited. When asked if there were any perceived differences between the
classes while students participated in the learning activities, the teacher acknowledged
that the experimental class reacted more positively to their lessons. He stated, “They had
a lot more fun doing what they were doing.”
Mr. Martin theorized that allowing the students to move around and partner with
their peers broke up the monotony of his typical classroom structure. He also believed
that embedding the math problems into game-like activities increased students interest in
and willingness to solve the problems.
When asked about the effects of the learning activities on students, Mr. Martin
explained, “Overall the activities where they were up, engaged, walking around the
classroom, having some sort of competition, I think definitely helped [with engagement]
a lot.” As part of the intervention, all three UDL principles (action and expression,
representation, and engagement) where addressed within the learning activities (see Table
4). When asked about the various principles and their impact on students, Mr. Martin
emphatically stated, “I think the engagement had the most impact. I think it helped with
student motivation.” Mr. Martin’s statement aligns with the theory that engagement
“extends to the level of motivation” (edglossary.org, 2015); students possess to progress
in their education.

82
Students in the experimental classroom displayed behavior indicating an increase
in attention and interest in what they were learning. Although the ATMI scores did not
reveal a positive or negative impact, the observational data and teacher account suggest
that giving students the opportunity to collaborate with peers, manipulate learning
material, and focus on an objective other solving the problem may have positively
influenced students’ behavioral engagement. The nuances and implications of this finding
will be further explored in Chapter Six.
Impact on Student Perception
In this study, perception refers to the way a students feel or thinks about the class.
To gauge any changes in students’ perceptions due to the intervention, pre and post
student focus groups were held for both classes. The findings from this data are discussed
in this section. As an aside, since the control class did not experience the intervention, the
data gathered from their focus groups will not be used for these findings.
Pre Student Focus Group Results
The first focus group was held during lunch, a week before the intervention was
to start. Thirteen students from the experimental class attended. Given the general high
ATMI scores of the experimental class, it was no surprise that the students in the focus
group felt very positively about the math class. All but one student commented that math
was either their first or second favorite class (not including electives) in school. Students
gave various reasons for liking the subject, from “I’m just good at it” and “It is just stress
free” to “It will come in handy in the future.” The latter comment is indicative of most of
the students’ fervent belief that math was necessary for their future success. From their
comments, it became evident that students did not necessarily enjoy math as much as

83
they valued it. They recognized it as an important subject to learn and enjoyed the ease in
which they understood it. However, when asked if any of them were interested in or
would like to pursue a career that involved math, only one student raised their hand.
Since the intervention explicitly addressed the methods and materials used within
a curriculum, the students were asked about Mr. Martin’s teaching practice and the tools
used in class. Students agreed that Mr. Martin was one of their favorite teachers. They
remarked that he was funny, and that he was good at explaining problems. However, all
13 students did express that they would like to change the structure of his class. As
previously mentioned, Mr. Martin’s classroom was fairly regimented and very teacher-
driven. Though many students liked “doing the same thing every day” because they
“knew what to expect” and it reduced their “anxiety,” all of them wanted him to “change
it up.” Students were vocal about wanting to do more activities and projects. They
complained that the “routine” of the classroom was boring and the lack of active
involvement made it hard to be engaged. One girl put it this way, “We are just sort of
sitting in our seats the whole time and yeah, we are learning, but we are not really
engaged.”
When asked, students unanimously stated that the learning activities would be the
one thing they would change about the class if they could. They desired more
opportunities to work with their peers and more opportunities to participate in activities
instead of book work. For these students, their perspective of the class was that it was too
predictable, too rigid, and “boring.” However, these perspectives changed after the
intervention was introduced.

84
Post Student Focus Group Results
The second focus group was held during lunch, three days after the intervention
ended. Eighteen students showed up; nine of which had been at the first focus group.
After experiencing the intervention activities over the past two weeks, students provided
very positive feelings towards the methods and materials used in the class. Students
described the new activities as being helpful, fun and interesting. One student commented
that the new lessons were “really helpful, because there was more of a goal to reach than
just doing the problem.” Another student said, “I think the activities were a lot more
engaging and we were interacting more, like, with each other and with the problems and
the unit.”
For many students, being able to move and actively participate was the best part
of the lesson. When asked what exactly they liked about the lesson, 14 out of the 18
students mentioned movement of some kind or the opportunity to get out of their seat.
Students were also fond of the chance to manipulate materials other than their pencil to
solve problems. One student insisted that the activities were way better than “sitting at
[their] desks and writing till [their] hands hurt.” Throughout the interview, students
continued to link their physical engagement to their mental engagement. In fact, the
majority of students believed the activities not only helped them learn the material, but
also made them feel more confident and more prepared to take their chapter test. One
student’s sentiments were adamantly agreed upon by others in the class, “If [Mr. Martin]
just goes over it with just a boring old lesson and we just sit there, we’re not going to
remember anything about it.”

85
Many in the focus group also enjoyed the collaborative nature of the activities.
Much of the work prior to the intervention was individually completed, so the act of
working with a partner or with a group was a novelty. A student shared, “Being able to
get up and talk with our partners was nice. We would like learn more about them and
how they would engage in solving the math question…just different ways to do it.”
Students describe the experience as “interesting,” “exciting,” and “helpful.” One student
even stated that, “It actually made [him] look forward to going to math class every day.”
Though students’ perceptions of the altered curriculum were generally positive, there was
one thing that students were ambivalent about, the videos. Students shared that they
equally liked and hated the videos. Many thought the videos were immature and “made
the lesson feel less intelligent.” However, they found them entertaining and realized that
the songs in the video “got stuck in their head” and helped them remember how to do a
problem. When asked if the videos should be taken out completely, if another
intervention were scheduled in their classroom, the majority of students were conflicted.
One thing that was made clear was that the videos were one of the least favorite aspects
of the intervention, though their benefit to students it was left undetermined.
Given the feedback provided by the students in the focus groups, the intervention
had a positive impact on their disposition towards the curriculum, specifically the
methods and materials. As one student put it, “I really like [Mr. Martin’s] lesson, but like
now it is less of him up on the board, doing the problems, and I really like that more. It’s
like I’m getting to be more hands on with the new version.” All but one student wanted
the teacher to continue with new curriculum. The student who did not want it to continue
stated that though he liked the activities, he would rather have that time to do homework

86
because he was involved in a lot of after school activities. Overall, students’ general
opinion of the intervention was very positive, which raises questions as to why the ATMI
scores went down instead of up. Thoughts on this incongruity will be shared in Chapter
Six.
Impact on ELL and IEP
The questions regarding English Language Learners and students with
Independent Education Plans were more suited for the school that I was originally going
to work in, as it was much more diverse than Dillon Middle School. Out of all 79
students who participated in the study, six were ELLs and 4 had IEPs. Table 11 displays
the distribution of these students. Due to their limited number, the results for ELL and
IEP students will be reported together by class.
Table 12
Number of IEP and ELL Students by Class
Class IEP ELL Control (n=6)
3
3
Experimental (n=4)
1 3
Total 4 6
Achievement Results
ELL and IEP students in the experimental class did perform better on test 4,
however, the intervention may not have had any impact on those outcomes. After
reviewing past quiz and test scores, the point differential between the two classes on Quiz
4 and Test 4 proved to be more typical of their normal scoring pattern than an effect of
the intervention. Table 12 shows the spread of quiz and test averages by class. As the

87
table displays, there was zero difference between the two classes on Quiz 4 and a 7.6-
point difference on Test 4, but as previously mentioned, the 7.6-point differential was not
atypical.
Table 13
Class Averages for IEP & ELL
Quiz 1
Test 1
Quiz 2
Test 2
Quiz 3
Test 3
Quiz 4
Test 4
Experimental 88.8 85.3 90.0 95.5 88.5 93.3 87.5 90.3
Control 82.3 75.5 85.8 87.7 88.0 92.3 87.5 82.7
Difference -6.4 -9.8 -4.2 -7.8 -0.5 -0.9 0.0 -7.6
To see if the intervention had any impact on individual students’ grades,
disaggregated quiz and test scores for the experimental group were examined. Three out
of the four students in the experimental group, scored within their normal grade range.
However, there was one ELL student who scored almost 20-points below their normal
scoring pattern on Quiz 4, but managed to bounce back within their regular range on Test
4. Unfortunately, it is impossible to tell if this temporary dip in scores had been due to the
intervention or just an anomaly. Regardless, the overall scores for the experimental class
did not indicate that the intervention had any effect on the achievement levels of IEP and
ELL students.

88
Engagement & Perception Results
The data on student engagement and perception for the ELL and IEP students was
sparse. Only nine of the 10 students completed a ATMI and out of those nine, only one
completed a pre and post ATMI. That one student was in the control classroom, so
measuring the effects of the intervention was not applicable. Student scores were
representative of the larger class. All but one student reported a higher than average
attitude towards math score. Other measures to indicate engagement were evaluated at
the classroom level and not on an individual basis, making it impossible to give an
account of these students’ behavioral engagement.
As for the student perception outcome, two ELL and IEP students attended a
focus group, however only one was in the experimental group. The status of this student
was not known until after the completion of the study. Distinguishing this student’s
opinion and voice from the group at large is unfeasible. Unfortunately, though efforts
were made, there is not enough data to indicate any effect of the intervention on IEP or
ELL students. The implications of this result will be further discussed in Chapter Six.
Impact on Teacher Perception
The question on teacher perception explores the impact of the intervention on how
the teacher views his curriculum, teaching practice and/or teaching philosophy. To
answer this question a pre and post interview with the teacher was conducted.
Prior to the intervention, Mr. Martin was satisfied with the curriculum he
provided in his class. He explained that he has been revising it for years, even making it a
center focus for a curriculum development class he took at a university. His current
curriculum is entirely based off the math textbook used in the class, which was published

89
in 1992. Though the textbook is almost two decades old, Mr. Martin suggests that it still
aligns with current common core standards. One particular aspect of his curriculum that
Mr. Martin was very proud of, were the notes he provided every student in his class. For
every chapter, a typed packet of notes is given to students to help guide them through the
chapter in their textbook. The notes included step-by-step instructions on how to solve
problems and included sample problems.
Highlighting the teacher’s contentment with the guided notes is important, as
these packets helped to sustain the more teacher-driven, individual work supported in the
classroom. Furthermore, Mr. Martin believed that the notes were enough to adequately
engage the students, stating, “These kids are at such a high level for the most part. When
you do teach it to them and you give them some practice problems, they got it. They
don’t have to sit there and explore or investigate things to put it to long-term memory.
It’s [his curriculum] working.” Because the intervention supported more nontraditional,
student-centered activities, it was assumed that Mr. Martin’s affinity for, opinion of,
and/or thoughts on his current curriculum would be challenged. To an extent this was
true.
In his post interview, Mr. Martin disclosed that he “really liked the intervention,”
so much so, that he had decided that next year he would do the activities with both
classes. He shared that “The group work and the activities that [they] did, by far, were
much more superior than them just doing individual work straight out of the book.” In
addition to using these practices with both classes next year, Mr. Martin even declared
that the intervention had “sparked ideas” for kids in his regular 7th grade math class and
for students in those classes that were struggling. He believed that the activities, would
90
have a “much bigger impact” on with students who struggle. Again the students in the
study were, in general, already highly motivated, self-confident and enjoyed doing math.
Students who struggle in the subject may not enjoy doing math or be as confident in their
abilities in the same manner and may benefit more from activities that offer new ways of
learning and presents information in different ways.
However, though he acknowledged the positive effects of the intervention on his
students’ achievement and behavior, he still favored his more traditional, teacher-driven
practices. For instance, when asked if the intervention impacted the way he will design
lessons in the future he stated, “As far as the notes and stuff, no, but I do want to, instead
of doing the textbook self test A, self test b and the reviews, I do want to do a lot more of
the scavenger hunts and the CSI type activities.” He also believed that not giving as much
instruction, in some capacity, negatively affected the students stating that, “If I did an
instructional lesson for even like 5 or 10 minutes longer I think [the experimental class]
would have scored slightly higher than they did.” Post intervention, Mr. Martin also
continued to believe that the students in his accelerated math class did not need such
activities, stating “In the 7A class, I’m teaching a year and half in a year, so it’s
compacted. Most of the time it is just teach a lesson, do some practice, and move on. And
you’ve seen how smart most of these kids are, most of them pick it up and get it and
that’s it. They don’t really need the intervention.” Mr. Martin’s point of “necessity”
raises interesting questions. Is it necessary for students to be motivated in order to
educate them? Does engagement matter if they are learning? How does one’s definition
of learning and engagement play into these beliefs? These questions and the implications

91
of Mr. Martins’ indifference towards the intervention for high achieving students will be
further explored in Chapter Six.
Summary
The findings in this chapter were a little mixed. Though not statistically
significant positive outcomes were produced for student achievement and student
perception, but slightly positive or neutral outcomes (in terms of intervention impact)
were revealed in regard to teacher perception and students’ attitude towards math. Why
the intervention had varying impact on the different measures will be discussed in
Chapter Six, along with the general implications of this study, given the findings.
Directions for future research will also be considered.

92
CHAPTER SIX: DISCUSSION AND IIMPLICATIONS
The purpose of this study was to test the efficacy of a Blended Universal Design
for Learning model in improving student achievement, engagement, and perception. The
impact on teacher perception, English Language Learners, and students with Individual
Education Plans was also explored. An experimental mixed methods design was
implemented to answer the guiding research question: How does a Blended Universal
Design for Learning intervention impact a 7th grade math class? The answer to this
question, as noted in Chapter Five, is up for debate and will be discussed here.
This chapter will start by summarizing the findings provided in Chapter Five. An
interpretation of the findings will be discussed, along with lingering questions brought
forth by the study itself. Finally, the chapter will conclude with the limitations,
implications for future research, the significance of the study and concluding remarks.
Summary of Findings
Student Achievement
As mentioned in Chapter Five, the experimental class did receive a better class
average than the control class on Quiz 4 and Test 4. Though the experimental group
typically scored higher than the control group, the percentage by which they outscored
the control group increased by 2.1% on Quiz 4 and by 1.3% on Test 4. On the pop quiz,
the experimental class average increased by 3.9% but decreased by 2.1% on the test. On
the quiz, 73% of students in the experimental group received an A or better, while only
64% of students in the control group did the same. On the test, 60% of students in the
experimental group received an A or better, while only 38% of students in the control

93
class received an A or better. Despite the disparity in these percentages, an individual
samples t-test proved that the differences in scores were not statistically significant.
Student Engagement
Student engagement was measured by responses on the Attitude Towards Math
Inventory, classroom observations and teacher testimony. Though evidence suggests that
the intervention had some positive influence on student engagement, the raw data from
the ATMI did not align with this argument. Pre and Post scores reveal that the class
means for all four subscales (motivation, enjoyment, value and self-confidence) went
down post intervention. However, this was true for both the experimental and control
group. The decrease in scores, across the board, could be attributed to the increase in the
number of students who completed the Post ATMI versus the Pre ATMI. The increase in
student responses may have led to an increase in response variation, impacting the mean
scores for both classes. When examining the data for students who took both the pre and
post ATMI, the results were the same; students’ overall attitude towards math decreased
over the course of the intervention. Though there was a decrease in scores, the point
differential is so small (.5 for the control group; .17 for the experimental group) that the
assumed impact of the intervention on student’s attitude towards math was ruled
infinitesimal.
The classroom observations and the teacher testimony provided more positive
results. Students in the experimental classroom had less off-task communication and
manipulation. These students demonstrated more on task verbal and nonverbal behavior
than their control classroom counterparts. Though the amounts of off-task behavior
(gazing, irrelevant communication and manipulation, head on desk, etc.,) were limited for

94
both classes, students in the experimental class spent more time actively learning (asking
relevant questions, providing relevant commentary, and analyzing and evaluating class
content).
Student Perception
Again student perception, in this study, refers to the way students feel or think
about the class. A students’ positive perception of their learning environment can not
only influence their behavior in class, but it can also encourage more positive attitudes
toward learning (Dorman, 2001; Wild, 2015). The association between positive
perception and positive attitude was made evident through many of the students’
comments in the focus group. Students stated that the activities made them “look forward
to math class every day” and that “The activities made [them] want to practice more.”
Students in the experimental group overwhelmingly preferred the altered curriculum
describing it as more “fun”, “exciting” and “engaging” than their traditional curriculum.
ELL & IEP Students
Of the 79 students involved in the study, only 10 students were identified as being
English Language Learners or students with Individual Education Plans. The
achievement differences between the control class and experimental class on Quiz 4 and
Test 4 were negligible, resulting in either zero difference (Quiz 4) or falling within the
normal scoring pattern (Test 4). No students in the experimental classroom completed the
pre and post ATMI (Attitude Towards Math Inventory), and identifying the comments of
the one qualifying student who participated in the focus group was not feasible.
Unfortunately, there was not enough data to discern if the intervention had any impact on
English Language Learners or students with Individual Education Plans.

95
Teacher Perception
In his post interview, Mr. Martin commented that he would do the learning
activities associated with the intervention next year for both classes. He recognized
having the students more involved in the learning process increased their engagement and
their general enthusiasm in his class. He acknowledged that the students’ behavior
positively changed when doing the intervention activities, and he believed that the
increase in test scores (though not statistically significant) was most likely due to the
altered curriculum.
Additionally, during the final interview, Mr. Martin admitted that not having the
experimental class do the alternative homework might have had a negative impact on
their outcomes. He stated, “[…] It probably had a lot to do with the fact that they had the
same homework; had we differentiated the homework I think the grades would have been
a much bigger difference.” The alternative homework would have extended the amount
of the intervention received by the experimental class. It would have provided more
opportunities to integrate technology, multiple forms of engagement and offered different
ways for students to demonstrate their knowledge, which could have (with the learning
activities) increased the effect of the intervention.
Mr. Martin’s willingness to repeat the activities and speak positively about his
experience is an indication that the invention positively impacted his perception of the
curriculum. However, even with his desire to repeat the intervention, Mr. Martin’s belief
about the necessity for an intervention for accelerated students remained unchanged. He
also continued to find his 15 to 20 minute lecture format essential in teaching his
students.

96
Interpretation of Student Findings
After reviewing the results, it is clear that the outcome of the study is rather
mixed. Though positive trends did emerge, two were found statistically insignificant and
the other two could not be empirically validated. There are a number of possible
interpretations for these findings; this section will illuminate a few.
Quantitative Findings
The quantitative findings in this study focused on achievement and engagement,
with the data sources coming from the assessment and ATMI scores. Both quantitative
findings were found to be statistically insignificant, possible explanations for these
outcomes are discussed below.
The first possible explanation is that the intervention was simply ineffective. The
positive shifts in student achievement and engagement may be due to nothing more than
sampling error. In this case, Blended Learning and Universal Design for Learning
principles had no tangible positive impact on student outcomes. This would explain why
the ATMI results decreased after the intervention and why the experimental group scored
below their normal class average on Test 4.
If the intervention, indeed, offered some real benefit, then the second explanation
for the inconclusive results could be that there was not enough statistical power to rule
out sampling error. This may explain why positive outcomes emerged, yet no statistical
significance was found. This is especially true in the case of the ATMI, which had an
even smaller response rate. It was known from the beginning, when the power analysis
was conducted, that due to the small sample size, a large effect would be needed in order
to reach statistical significance. If the sample or the effect of the intervention were larger
97
such significance may have been reached. Since significance was not reached a third
possibility arises.
A third explanation for the lack of significance, if the intervention was beneficial
and the sample size adequate, could be the diminished impact of the intervention due to
its implementation. The intervention, itself, was a limitation in that it was not
implemented to the degree originally proposed, which may have diminished its fidelity
and impact. Parent concern prohibited the use of alternative homework. Again, the
alternative homework would have provided more opportunities to integrate BL and UDL
principles, which would have essentially increased the extent of the intervention.
Technology was also not integrated to the desired degree. The potential impact of
Blended Learning (student control over content, differentiated instruction, etc.,) was
definitely hampered by the fact that students were not able to individually utilize
technology during class time. Teacher efforts and the duration of the intervention, which
are discussed in the forthcoming limitations section, may have also hindered the potential
impact of the intervention. Without these alterations, a more authentic BUDL
intervention would have been implemented and would perhaps have resulted in more
positive, and more significant outcomes.
A fourth and final explanation for the inconclusive results could be that the
intervention is effective in eliciting positive outcomes, but that it is not beneficial to the
particular participants in the study. Again, these students were in an accelerated math
class. They, as a whole, were high achieving and highly motivated. They saw an inherent
value in learning math, had high confidence in their ability to successful do math and
actually enjoyed solving math problems. With already such high scores and seemingly

98
strong, positive attitudes, these students had limited space to improve and seem to have
reached a ceiling effect or the point at which dependent variables (achievement and
ATMI scores) are no longer impacted by the independent variable (the intervention).
Questions arise as to how this intervention would have impacted lower achieving
students. Would the impact of the intervention have been more significant? Would
students with pre-existing, low scores, low motivation, and neutral/negative attitudes
have benefited more from this intervention?
These explanations are not mutually exclusive and can interplay with one another
in a variety of combinations, resulting in a myriad of possibilities. I believe that the lack
of power, the small sample size, and the particular demographics of the students in the
study resulted in findings that were insignificant. Though results from the study were
statistically insignificant, possible positive associations between a BUDL intervention
and student achievement and engagement still emerged. Considerations for the possible
clinical significance of these outcomes will be discussed in the Implications for Future
Research section.
Qualitative Findings
The qualitative findings in this study focused on engagement and perception, with
the data sources coming from classroom observations, student focus groups, and the
teacher interviews. Unlike the quantitative findings, the qualitative findings were fairly
positive, resulting in strong associations between the intervention and improved
engagement and perception. These findings are discussed below.
As a meta-construct engagement was measured on three dimensions: behavioral,
emotional or affective, and cognitive. Behavioral engagement was measured through

99
classroom observations and teacher testimony, both of which yielded positive outcomes.
Though students were not directly asked about engagement in the focus groups, the topic
still arose, thus, data from the focus groups was also used to support the findings.
Students in the experimental class demonstrated less off-task behavior (gazing,
irrelevant communication and manipulation, head on desk, etc.,) and spent more time
actively learning. Active learning, again, refers to students participating in the learning
process and doing something besides passively listening (Bonwell & Eison, 1991).
Active learning requires students to be engaged in their learning and not merely
recipients of information. This relates to what one student divulged when discussing her
classroom before the intervention, “We are just sort of sitting in our seats the whole time
and yeah, we are learning, but we are not really engaged.” In this study, students in the
experimental group were required to ask more relevant questions, provided relevant
commentary, and to analyze, synthesize, and evaluate class content more frequently than
the control group. As a result, these students spent more time actively learning and more
time engaged.
This finding also brings clarity as to why students in the experimental class
continuously linked their physical participation to their overall engagement. One student
commented, “[class during the intervention] was a lot more engaging and we were
interacting more, like, with each other and with the problems and the unit.” Another
stated, “We got to get up and walk around, instead of sitting at our desk the whole time,
that made it interesting.” Students’ behavioral engagement was a symptom of their
physical participation in the learning activities. When their physical participation
increased due to the intervention so did their engagement.

100
As evidenced by the student focus groups, the intervention had a strong positive
effect on students’ perception of the class. Students in the experimental group
overwhelmingly preferred the altered curriculum. Students stated that the activities made
them “look forward to math class every day” and that “the activities made [them] want to
practice more.” A majority of the literature on Blended Learning and Universal Design
for Learning is anecdotal in nature and focus on outcomes like student perception. The
positive findings revealed in this study corroborate findings in previous studies and
further support the theory that BL and UDL based educational models may attend to
students’ interest and satisfaction better than traditional models of schooling.
When taking into account the positive classroom observations, and the positive
teacher and student testimony, an overall positive association exists between the
intervention and student perception. Although qualitative results for student engagement
were positive, the overall outcomes for this measure are inconclusive given that the
ATMI results were statistically insignificant. The implications of these findings will be
explored in the Implications for Future Research section.
Interpretation of Teacher Findings
The teacher findings in this study focused on Mr. Martin’s perception of the
curriculum, with the main data source being the teacher interviews. Mr. Martin in the end
spoke very highly of the intervention and the curriculum and even mentioned the desire
to use the curriculum in the future. However, Mr. Martin questioned the utility of such an
intervention in a class where students were already high achieving. Mr. Martin’s
sentiments unearth some poignant questions. For instance, is it necessary for students to
be motivated in order to educate them? Does engagement matter if they are learning?

101
Though I never questioned Mr. Martin on his definition of educating and learning, upon
further reflection, I believe we may hold different understandings of the terms.
On one hand, educating students could simply mean the practice of teaching
students basic knowledge, skills, theories and norms. Within this definition, the only
requirement from students would be that they simply understand. Engagement as defined
as “the degree of attention, curiosity, interest, optimism, and passion that students show
when they are learning or being taught, which extends to the level of motivation they
have to learn and progress in their education” (edglossary.org, 2015) is not a prerequisite
for understanding. Though understanding is a prerequisite for learning, it is only the
beginning. In fact, on Benjamin Bloom’s famous taxonomy, which distinguishes learning
objectives into levels of complexity and mastery, understanding and comprehension
come only second on his six-tier model. More complex learning occurs beyond the realm
of understanding. The purpose of education is to have students not only understand, but
to also to analyze, create, and imagine. Educating students means facilitating the process
by which they learn how to learn. The former definition is static and finite, but the latter
is continuous and infinite, creating lifelong learners or students who seek willingly, their
own path towards learning. Creating lifelong learners requires that students be
psychologically invested in their learning; it requires them to be reflective, evaluative,
self-disciplined, and engaged.
Thus, in answering the questions posed above, if educating students is about
creating lifelong learners, then motivation is undoubtedly necessary. In order for learning
to be a continuous practice, students must have an invested interest in or be engaged in
their learning. Though these students were engaged in math, as evidenced by their high

102
ATMI scores, their investment was shallow, confined to the boundaries of the class. As
mentioned in Chapter Five, only one student in the experimental focus group expressed
that they wanted a math focus career. Students in this focus group also admitted that prior
to the intervention, they were not engaged in class, content yes, but not class. This
discussion evokes the question: If students were more engaged in class, would the interest
in math-focused careers increase? Though not answered in this study, this question does
elicit implications for future research.
Limitations of Study
This section highlights limitations that were not directly attributed to the design,
but were rather unearthed throughout the implementation of the study. One limitation was
the sample chosen to participate in the study. Students in the accelerated math class are a
unique group and not necessarily representative of the student population. These students
were also so high achieving and possessed such a high attitude towards math that the
outcomes were probably hindered by a ceiling effect.
This limitation corresponds to the next issue, which was the lack of IEP and ELL
students in the classrooms. One of the aims of this study was to test how a Blended
Universal Design for Learning (BUDL) curriculum would accommodate diversity within
the classroom, with IEP and ELL being the only two measures of diversity. The data
gathered in this study, from the small representation of these students, did not allow for a
proper analysis or subsequent interpretation of the interventions’ impact. As a result, the
question of whether BUDL could adequately address student variance or the learning
needs of all students remains unanswered.

103
Another limitation is regarding the response rate of the Attitude Towards Math
Inventory. The initial response rate of the ATMI was almost one-third the response rate
of the post ATMI, making it difficult to draw comparisons on class averages before and
after the intervention.
Teacher investment and effort were an unexpected limitation that surfaced at the
beginning of the study. Though I had curated and prepped the curriculum, Mr. Martin
was responsible for delivering it to the students. It was apparent that in the beginning Mr.
Martin would not read the instructor guides for the lesson before delivering it in class. As
a result, there were a few times he did not explain the lesson very well, which resulted in
students being confused; or called on me for assistance to explain to the lesson, which
involved me in the study in a way I did not initially intend. The delivery of this
curriculum could have negatively impacted the way students approached the lessons.
Even the smallest amount of initial confusion could have potentially affected students’
view and response to the activity. As the days progressed, Mr. Martin began reading the
guides prior to class, allowing him to present the material with authority and confidence,
which (I believe) may have impacted the fidelity of the lessons being delivered.
Implications for Future Research
Findings from this study offer the first experimental exploration into the Blended
Universal Design for Learning model. This section provides suggestions for future
research.
As noted in the previous section, one aim of this study was to determine if BUDL
could address student variance. Research on the two models that comprise BUDL suggest
that diverse populations would benefit from various components of the model (such as

104
alternative modes of representation). Unfortunately, there was not enough variance
between students to track impact. Future research should endeavor to test the efficacy of
BUDL in notably diverse populations. Alternative variant factors (in addition to IEP and
ELL) should also be explored.
Future research should focus on BUDL’s effect on real time engagement levels.
The ATMI, though suitable for gauging students’ long-term engagement and invested
interest, is not adequate in measuring real time fluctuations in engagement during
intervention activities. Alternative measurements for engagement should also be
considered.
Further iterations of BUDL should include more student technology use. As
previously mentioned, this study limited technology use due to teacher preference and
time. However, a more equitable representation of Blended Learning within the model
may contribute to a larger impact on student outcomes. Also, increasing the presence of
technology within the curriculum may lead to a more authentic BUDL model.
Future researchers should also consider increasing the length of the intervention.
The intervention in this study, which spanned approximately two weeks, may not have
been long enough to make a significant impact on the teacher or students. Moreover,
testing the BUDL model on various populations should be explored. In particular
populations with lower achievement and engagement levels should be considered to
prevent a ceiling effect.
Lastly, the findings in this study raise questions as to whether there exists clinical
significance within the outcomes. Clinical significance refers to the “practical or applied
value or importance of the effect of an intervention–that is, whether the intervention

105
makes a real (i.e., genuine, palpable, practical, noticeable) difference in everyday life to
the clients or to others with whom the clients interact” (Kazdin, 1999, pg. 1). While the
experimental group may have scored below their typical class average on Test 4, they
still managed to increase the percentage by which they outscored the control group. In
addition, over half of the students in the experimental group received a 100% or higher
(extra credit) on Quiz 4, while typically only 3-12 students receive such scores. In
education, doubling the normal number of students in a class to receive a perfect score on
a test is a practical, noticeable and genuine effect. However, due to sampling error, I
cannot say whether these results are correlated to the intervention or were derived by pure
happenstance. In the chance that the intervention did play a role, further research could
support and further develop BUDL to be an effective model for K-12 education.
Significance & Closing Remarks
The purpose of this study was to test the efficacy of a Blended Universal Design
for Learning model in improving student achievement, engagement, and perception. This
research also attempted to contribute to the body of knowledge on the effectiveness of
both Blended Learning and Universal Design for Learning on serving the needs of all
learners.
Despite the limitations of the study, as well as the limited application of Blended
Learning, this study introduced and tested the efficacy of a new teaching and learning
model, Blended Universal Design for Learning. Results from this study indicate positive
associations between a BUDL intervention and student perception. Though other results
were statistically insignificant, possible positive associations between a BUDL
intervention and student achievement and engagement also emerged. The heavy

106
implementation of UDL based principles adds to the body of research on the potential
effectiveness of Universal Design for Learning on improving student outcomes. To date,
this is one of the few empirical studies done on the effectiveness of UDL in K-12
classrooms.
Although the limitations in the design hindered the findings’ generalizability to
other students, classrooms, and content areas, the information presented herein can serve
as an example for practitioners to implement such a model in their classroom. In addition
to being used as an example, this study can also serve as a platform for further research
on Blended Universal Design for Learning.

107
REFERENCES
Abell, M. M., Jung, E., & Taylor, M. (2011). Students’ perceptions of classroom instructional environments in the context of ‘Universal Design for Learning’. Learning Environments Research, 14(2), 171-185.
Allen, I. E., Seaman, J., & Garrett, R. (2007). Blending in: The extent and promise of
blended education in the United States. Sloan Consortium. PO Box 1238, Newburyport, MA 01950.
An, Y.-J., & Reigeluth, C. (2011). Creating Technology-Enhanced, Learner-Centered
Classrooms. Journal of Digital Learning in Teacher Education, 28(2), 54–62. Atkins, D. E., Bennett, J., Brown, J. S., Chopra, A., Dede, C., & Fishman, B. (2010).
Transforming American education: Learning powered by technology. Learning, 114. Retrieved from: https://www.ed.gov/sites/default/files/NETP-2010-final-report.pdf
Bakia, M., Shear, L., Toyama, Y., & Lasseter, A. (2012). Understanding the Implications
of Online Learning for Educational Productivity. Office of Educational Technology, US Department of Education.Retrieved from: http://files.eric.ed.gov/fulltext/ED532492.pdf
Bandura A. 1997. Self-Efficacy: The Exercise of Control. New York: Freeman Banks, J. A. (1998). The lives and values of researchers: Implications for educating citizens in a multicultural society. Educational Researcher, 27(7), 4-17. Baylor, A. L., & Ritchie, D. (2002). What factors facilitate teacher skill, teacher morale,
and perceived student learning in technology-using classrooms?. Computers & Education, 39(4), 395-414. Retrieved from: http://www.motivationalexperience.com/PDF/factor.pdf
Bonk, C. J., & Graham, C. R. (2012). The handbook of blended learning: Global
perspectives, local designs. John Wiley & Sons. Bonwell, C. C., & Eison, J. A. (1991). Active Learning: Creating Excitement in the
Classroom. 1991 ASHE-ERIC Higher Education Reports. ERIC Clearinghouse on Higher Education, The George Washington University, One Dupont Circle, Suite 630, Washington, DC 20036-1183.
Brown, J. S., & Adler, R. (2008). Open education, the long tail, and learning 2.0.
Educause review, 43(1), 16-20. Bryman, A. (2012). Social research methods. New York: Oxford university press.

108
Christensen, C. M., & Horn, M. B. (2008). How do we transform our schools? Use technologies that compete against nothing. Education Next, 8(3), 12.
Christensen, C.M., Horn, M.B., & Johnson, C.W. (2008). Disrupting Class: How
Disruptive Innovation Will Change the Way the World Learns. New York: McGraw Hill.
Christensen, C., Horn, M. B., & Staker, H. (2013). Is K-12 blended learning disruptive:
An introduction of the theory of hybrids. Clayton Christensen Institute. Retrieved from: http://www.christenseninstitute.org/publications/hybrids/
Christenson, S. L., Reschly, A. L., & Wylie, C. (Eds.). (2012). Handbook of Research on
Student Engagement. New York: Springer. Coyne, P., Pisha, B., Dalton, B., Zeph, L. A., & Smith, N. C. (2012). Literacy by Design
A Universal Design for Learning Approach for Students With Significant Intellectual Disabilities. Remedial and Special Education, 33(3), 162-172.
Davies, P. L., Schelly, C. L., & Spooner, C. L. (2013). Measuring the Effectiveness of
Universal Design for Learning Intervention in Postsecondary Education. Journal of Postsecondary Education and Disability, 26(3), 195-220.
Darling-Hammond, L. (2010). The flat world and education: How America's commitment
to equity will determine our future. New York, New York: Teachers College Press.
Dorman, J. P. (2001). Associations between classroom environment and academic
efficacy. Learning Environments Research, 4(3), 243-257. Driscoll, M. (2002). Blended learning: Let’s get beyond the hype. E-learning, 1(4), 1-4. Drysdale, J. S., Graham, C. R., Spring, K. J., & Halverson, L. R. (2013). An analysis of
research trends in dissertations and theses studying blended learning. The Internet and Higher Education, 17, 90-100.
Dziuban, C. D., Hartman, J. L., & Moskal, P. D. (2004). Blended learning. EDUCAUSE
Center for Applied Research Bulletin, 7(1), 12. Dziuban, C., Moskal, P., & Hartman, J. (2005). Higher education, blended learning and
the generations: Knowledge is power-no more. In J. Bourne & J. C. Moore (Eds.), Elements of quality online education: Engaging communities (pp. 85-100). Needham, MA: Sloan Consortium.
Edglossary.org. (2016). Student Engagement. The Glossary of Educational Reform.
(n.d.). Retrieved from: http://edglossary.org/student-engagement/

109
Erlandson, R. F. (2002). Universal Design for Learning: Curriculum, Technology, and Accessibility. Retrieved from: http://files.eric.ed.gov/fulltext/ED477004.pdf
Edyburn, D. L. (2010). Would you recognize universal design for learning if you saw it?
Ten propositions for new directions for the second decade of UDL. Learning Disability Quarterly, 33(1), 33-41. Retrieved from: http://at4allspring10.pbworks.com/f/UDL2ndDecade.pdf
Ertmer, P. A., Ottenbreit-Leftwich, A. T., Sadik, O., Sendurur, E., & Sendurur, P. (2012).
Teacher beliefs and technology integration practices: A critical relationship. Computers & Education, 59(2), 423–435.
Graham, C. R. (2006). Blended learning systems. CJ Bonk & CR Graham, The handbook
of blended learning: Global perspectives, local designs. Pfeiffer. Graham, C. R. (2009). Blended learning models. Encyclopedia of Information Science
and Technology, 375-382. Graham, C. R. (2012). Emerging practice and research in blended learning. In M. G.
Moore (Ed.), Handbook of distance education (3rd ed., pp. 333–350). New York, NY: Routledge.
Graham, C. R., Henrie, C. R., & Gibbons, A. S. (2014). Developing models and theory
for blended learning research. Blended learning: Research perspectives, 2, 13-33. Garrison, D. R., & Kanuka, H. (2004). Blended learning: Uncovering its transformative
potential in higher education. The Internet and Higher Education, 7, 95–105. Graham, C. R., & Robison, R. (2007). Realizing the transformational potential of blended
learning: Comparing cases of transforming blends and enhancing blends in higher education. In A. G. Picciano & C. D. Dziuban (Eds.), Blended learning: Research perspectives (pp. 83–110). Needham, MA: Sloan Consortium.
Haelermans, C., Ghysels, J., & Prince, F. (2015). Increasing performance by
differentiated teaching? Experimental evidence of the student benefits of digital differentiation. British Journal of Educational Technology, 46(6), 1161-1174.
Halverson, L.R., Graham, C.R., Spring, K.J., & Drysdale, J.S. (2012). An analysis of
high impact scholarship and publication trends in blended learning. Distance Education, 33(3), 381-413.
Hattie, J. (2008). Visible learning: A synthesis of over 800 meta-analyses relating to
achievement. Routledge. Heffernan, V. (2011). Education needs a digital-age upgrade. Education, 8, 58. Retrieved
from:
110
http://opinionator.blogs.nytimes.com/2011/08/07/education-needs-a-digital-age-upgrade/?_r=0
Hirumi, A. (2002). Student-centered, technology-rich learning environments
(SCenTRLE): Operationalizing constructivist approaches to teaching and learning. Journal of Technology and Teacher Education, 10(4), 497-537.
Katz, J. (2013). The three block model of universal design for learning (UDL): Engaging
students in inclusive education. Canadian Journal of Education, 36(1), 153-194. Kazdin, A. E. (1999). The meanings and measurement of clinical significance. Journal of
Consulting and Clinical Psychology. Vol. 67(3), 332-339. King-Sears, M. E., Johnson, T. M., Berkeley, S., Weiss, M. P., Peters-Burton, E. E.,
Evmenova, A. S., ... & Hursh, J. C. (2015). An Exploratory Study of Universal Design for Teaching Chemistry to Students With and Without Disabilities. Learning Disability Quarterly, 38(2), 84-96.
Kortering, L. J., McClannon, T. W., & Braziel, P. M. (2008). Universal design for
learning a look at what algebra and biology students with and without high incidence conditions are saying. Remedial and Special Education, 29(6), 352-363.
Kumar, K. L., & Wideman, M. (2014). Accessible by design: Applying UDL principles
in a first year undergraduate course. The Canadian Journal of Higher Education, 44(1), 125.
Laumakis, M., Graham, C., & Dziuban, C. (2009). The Sloan-C Pillars and Boundary
Objects As a Framework for Evaluating Blended Learning. Journal of Asynchronous Learning Networks, 13(1), 75-87.
Levin, T., & Wadmany, R. (2006). Teachers’ beliefs and practices in technology-based
classrooms: A developmental view. Journal of Research on Technology in Education, 39(2), 157-181. Retrieved from: http://files.eric.ed.gov/fulltext/EJ768874.pdf
Lim, S. Y., & Chapman, E. (2013). Development of a short form of the attitudes toward
mathematics inventory. Educational Studies in Mathematics, 82(1), 145-164. Lips, D. (2010). How Online Learning Is Revolutionizing K-12 Education and Benefiting
Students. Backgrounder. No. 2356. Heritage Foundation. Retrieved from: http://files.eric.ed.gov/fulltext/ED509484.pdf
López-Pérez, M. V., Pérez-López, M. C., & Rodríguez-Ariza, L. (2011). Blended
learning in higher education: Students’ perceptions and their relation to outcomes. Computers & Education, 56(3), 818-826.

111
Martínez, M. L., Valdivia, I. M. Á., & Ortiz, A. R. (2015). Making learning more visible through e-assessment: implications for feedback. Journal of Computing in Higher Education, 27(1), 10-27.
Mayer, R. E. (2005). The failure of educational research to impact educational practice:
Six obstacles to educational reform. In G. D. Phye, D. H. Robinson, & J. Levin (Eds.), Empirical methods for evaluating educational interventions (pp. 67–81). San Diego: Elsevier Academic Press.
Mcguire, J. M., Scott, S. S., & Shaw, S. F. (2006). Universal design and its applications
in educational environments. Remedial and special education, 27(3), 166-175. Retrieved from: http://www.regent.edu/acad/schedu/pdfs/UD_Article_2006.pdf
Means, B., Toyama, Y., Murphy, R., Bakia, M., & Jones, K. (2009). Evaluation of
evidence-based practices in online learning: A meta-analysis and review of online learning studies. US Department of Education.
Meyer, A., Rose, D. H., & Gordon, D. (2014). Universal design for learning: Theory and
practice. CAST Professional Publishing. Moeller, B., & Reitzes, T. (2011). Integrating Technology with Student-Centered
Learning. A Report to the Nellie Mae Education Foundation. Education Development Center, Inc.
Muis, K. R., Ranellucci, J., Trevors, G., & Duffy, M. C. (2015). The effects of
technology-mediated immediate feedback on kindergarten students' attitudes, emotions, engagement and learning outcomes during literacy skills development. Learning and Instruction, 38, 1-13.
Office of Technology Assessment (1995) Teachers & Technology: Making the
connection. Washington: US Government Printing Office. Oliver, M., & Trigwell, K. (2005). Can ‘blended learning be redeemed?. E-learning and
Digital Media, 2(1), 17-26. Osguthorpe, R. T., & Graham, C. R. (2003). Blended Learning Environments:
Definitions and Directions. Quarterly Review of Distance Education, 4(3), 227-33.
Overbay, A., Patterson, A. S., Vasu, E. S., & Grable, L. L. (2010). Constructivism and
technology use: findings from the IMPACTing Leadership project. Educational Media International, 47(2), 103–120.
Patton, M. Q. (1999). Enhancing the quality and credibility of qualitative analysis. Health
services research, 34(5 Pt 2), 1189.

112
Papert, S., & Harel, I. (Eds.). (1991). Constructionism: research reports and essays, 1985-1990. Ablex Publishing Corporation.
Picciano, A. G. (2006). Blended learning: Implications for growth and access. Journal of
asynchronous learning networks, 10(3), 95-102. Picciano, A. G., & Dziuban, C. (Eds.). (2007). Blended Learning Research Perspectives.
The Sloan Consortium. Picciano, A. G., Dziuban, C. D., & Graham, C. R. (Eds.). (2014). Research Perspectives
in Blended Learning: Research Perspectives (Vol. 2). Routledge. Picciano, A. G., Seaman, J., Shea, P., & Swan, K. (2012). Examining the extent and
nature of online learning in American K–12 education: The research initiatives of the Alfred P. Sloan Foundation. The Internet and Higher Education, 15, 127–135.
Pliner, S. M., & Johnson, J. R. (2004). Historical, theoretical, and foundational principles
of universal instructional design in higher education. Equity & Excellence in Education, 37(2), 105-113.
Poisson, M. (1998). Education and globalization. IIEP Newsletter, 16(2), 1-2. Retrieved
from: http://www.iiep.unesco.org/sites/default/files/nl_1998-2_en.pdf Quaglia, B. W. (2015). Planning for student variability: Universal design for learning in
the music theory classroom and curriculum. Music Theory Online, 21(1). Rappolt‐Schlichtmann, G., & Daley, S. G. (2013). Providing access to engagement in
learning: The potential of Universal Design for Learning in museum design. Curator: The Museum Journal, 56(3), 307-321.
Rao, K., Ok, M. W., & Bryant, B. R. (2014). A review of research on universal design
educational models. Remedial and Special Education. Vol. 35(3) 153–166 Saldaña, J. (2015). The coding manual for qualitative researchers. Sage. Sawyer, K. (2014). The Cambridge Handbook of the Learning Sciences. NY: Cambridge
University Press. Schelly, C. L., Davies, P. L., & Spooner, C. L. (2011). Student Perceptions of Faculty
Implementation of Universal Design for Learning. Journal of Postsecondary Education and Disability, 24(1), 17-30.
Schunk, D. H., & Mullen, C. A. (2012). “Self-efficacy as an engaged learner.” pp. 219-
235 in Handbook of Research on Student Engagement, edited by Christenson, S. L., Reschly, A. L., & Wylie, C. New York: Springer.

113
Schunk, D. H., & Pajares, F. (2009). “Self-efficacy theory.” pp. 35-53 in Handbook of Motivation at School, edited Wentzel, K. & Wigfield, A. New York: Routledge.
Sharpe, R., Benfield, G., Roberts, G., & Francis, R. (2006). The undergraduate
experience of blended e-learning: a review of UK literature and practice. London: Higher Education Academy.
Singh, H., & Reed, C. (2001). A white paper: Achieving success with blended learning.
Centra software, 1. Slavin, R. (2000) Educational Psychology: Theory and Practice. MA: Pearson
Educational Company. Staker, H., Chan, E., Clayton, M., Hernandez, A., Horn, M. B., & Mackey, K. (2011).
The rise of K–12 blended learning: Profiles of emerging models. San Francisco, CA: Innosight Institute.
Staker, H., & Horn, M. B. (2012). Classifying K-12 Blended Learning. Innosight
Institute. Sparks, S. (2015) Blended learning yields limited results. Education Week. Retrieved
from: http://www.edweek.org/ew/articles/2015/04/15/blended-learning-research-yields-limited-results.html
Tamim, R. M., Bernard, R. M., Borokhovski, E., Abrami, P. C., & Schmid, R. F. (2011).
What forty years of research says about the impact of technology on learning a second-order meta-analysis and validation study. Review of Educational research, 81(1), 4-28.
Tapia, M., & Marsh, G. E. (2004). An instrument to measure mathematics attitudes.
Academic Exchange Quarterly, 8(2), 16. Tempelaar, D. T., Rienties, B., & Giesbers, B. (2015). In search for the most informative
data for feedback generation: Learning Analytics in a data-rich context. Computers in Human Behavior, 47, 157-167.
Thomas, A. F., & Sondergeld, T. (2015). Investigating the Impact of Feedback
Instruction: Partnering Preservice Teachers with Middle School Students to Provide Digital, Scaffolded Feedback. Journal of the Scholarship of Teaching and Learning, 15(4), 83-109.
Tienken, C. H. (2011). Common Core State Standards: An example of data-less decision
making. AASA Journal of Scholarship and Practice, 7(4), 3-18. Tomlinson, C. A., Brighton, C., Hertberg, H., Callahan, C. M., Moon, T. R., Brimijoin,
K., & Reynolds, T. (2003). Differentiating instruction in response to student

114
readiness, interest, and learning profile in academically diverse classrooms: A review of literature. Journal for the Education of the Gifted, 27(2-3), 119-145. Retrieved from: http://files.eric.ed.gov/fulltext/EJ787917.pdf
Udlcenter.org (2015) What is Universal Design for Learning. National Center On
Universal Design for Learning. (n.d.). Retrieved from http://www.udlcenter.org/aboutudl/whatisudl
Vitelli, E. M. (2015). Universal Design for Learning Are We Teaching It to Preservice
General Education Teachers?. Journal of Special Education Technology, 30(3), 166-178.
Watson, J., & Gemin, B. (2008). Using Online Learning for At-Risk Students and Credit
Recovery. Promising Practices in Online Learning. North American Council for Online Learning. Retrieved from: http://files.eric.ed.gov/fulltext/ED509625.pdf
Watson, J., Murin, A., Vashaw, L., Gemin, B., & Rapp, C. (2012). Keeping Pace with K-
12 Online Learning: An Annual Review of Policy and Practice, 2011. Evergreen Education Group.
Wild, A. (2015). Relationships between High School Chemistry Students’ Perceptions of
a Constructivist Learning Environment and their STEM Career Expectations. International Journal of Science Education, 37(14), 2284-2305.

115
APPENDIX A
Teacher Interview Guide

116
Teacher Interview Guide
Pre - Intervention
1. How long have you been: a. Teaching? b. In this district? c. At this school?
2. What is your philosophy on teaching? 3. What is your philosophy on student learning? 4. How do you usually go about designing a lesson? 5. Can you describe one of your favorite lessons you have done this year? 6. How do you currently address student diversity in your classroom?
a. Can you give examples? 7. How well do you think you address issues with student diversity? 8. What is the current make-up of your classrooms in terms of student diversity
(demographic, skill level, interest, motivation, learning disabilities, etc.)? 9. Are there significant differences that you currently notice between your two classes
(i.e. behavioral, cognitive, engagement)? a. If so, what are they? Please explain.
10. After working with UDL this summer what impact do you think it will have: a. On your students? b. On you as a teacher?
11. What concerns do you have about this study and/or the intervention? 12. Is there anything else you would like to add to help me better understand you as a
teacher or your students?
Post-Intervention
1. How did the intervention go? 1. What types of issues arose in implementation? Any concerns of UDL strategies being
used in the control classroom? 2. Are there significant differences that you currently notice between your two classes
(i.e. behavioral, cognitive, engagement)? a. If so, what are they? Please explain.
3. How do you think the intervention has impacted (give examples): a. Student achievement? b. Student engagement? c. Classroom culture? d. Students with IEPs?
4. What UDL strategies or principles seem to have the most impact? Please explain. 5. Thinking about UDL, how do you now go about designing lessons? Is it different
than before? 6. Can you describe one of your favorite lessons you have done since the intervention?
a. Can you describe how the lesson differed between the experimental class and the control class?

117
7. What is your overall opinion of the UDL intervention so far? 8. Has your philosophy on teaching or student learning changed as a result of this study? 9. Is UDL a practice you will continue after this study? Why or why not? 10. What was the biggest challenge in implementing UDL? 11. Is there anything else you would like to add to help me better understand the impact
of the intervention on you as a teacher or on your students?

118
APPENDIX B
Classroom Observation Protocol

119
Classroom Observation Protocol
Learning Activity
Nature of activity; what materials are being used?
What students are doing?
What teacher is doing?
Interactions? (i.e. teacher-student, student-student, student-software)
Student Verbal Behavior (i.e. Non-academic side talk? Asking questions? Active participation? Adding relevant commentary? Assisting others? Moaning? Verbal Excitement?) Student Non-Verbal Behavior (i.e. Head on desk? Inactive? Off-task manipulation? Looking around the room? Self-regulated?)

120
APPENDIX C
Attitude Towards Math Inventory

121
Attitude Towards Math Inventory
1.Mathematics is a very worthwhile and necessary subject. 2. I want to develop my mathematical skills. 3. I get a great deal of satisfaction out of solving a mathematics problem. 4. Mathematics helps develop the mind and teaches a person to think. 5. Mathematics is important in everyday life. 6. Mathematics is one of the most important subjects for people to study. 7. High school math courses would be very helpful no matter what I decide to study. 8. I can think of many ways that I use math outside of school. 9. Mathematics is one of my most dreaded subjects. 10. My mind goes blank and I am unable to think clearly when working with
mathematics. 11. Studying mathematics makes me feel nervous. 12. Mathematics makes me feel uncomfortable. 13. I am always under a terrible strain in a math class. 14. When I hear the word mathematics, I have a feeling of dislike. 15. It makes me nervous to even think about having to do a mathematics problem. 16. Mathematics does not scare me at all. 17. I have a lot of self-confidence when it comes to mathematics 18. I am able to solve mathematics problems without too much difficulty. 19. I expect to do fairly well in any math class I take. 20. I am always confused in my mathematics class. 21. I feel a sense of insecurity when attempting mathematics. 22. I learn mathematics easily. 23. I am confident that I could learn advanced mathematics. 24. I have usually enjoyed studying mathematics in school. 25. Mathematics is dull and boring. 26. I like to solve new problems in mathematics. 27. I would prefer to do an assignment in math than to write an essay. 28. I would like to avoid using mathematics in college. 29. I really like mathematics. 30. I am happier in a math class than in any other class. 31. Mathematics is a very interesting subject. 32. I am willing to take more than the required amount of mathematics. 33. I plan to take as much mathematics as I can during my education. 34. The challenge of math appeals to me. 35. I think studying advanced mathematics is useful. 36. I believe studying math helps me with problem solving in other areas. 37. I am comfortable expressing my own ideas on how to look for solutions to a
difficult problem in math. 38. I am comfortable answering questions in math class. 39. A strong math background could help me in my professional life. 40. I believe I am good at solving math problems.

122
APPENDIX D
Student Focus Group Protocol

123
Student Focus Group Protocol
Pre-Intervention
1. How do you all feel about Math? 2. How do you like to learn Math? 3. Are you currently taught the way you would like to learn Math? If not, what would
you like to change? 4. What was your favorite activity from this past unit? Why? 5. What was your least favorite activity from this past unit? Why? 6. What is the most challenging thing about learning Math? 7. What are some things that help you to learn Math?
Post-Intervention
1. How do you all feel about Math? Has anything changed since the last time we talked? 2. Are you currently taught the way you would like to learn Math? If not, what would
you like to change? 3. What was your favorite activity from this past unit? Why? 4. What was your least favorite activity from this past unit? Why? 5. What was the most challenging thing about learning this Math unit? 6. Where there some things in this unit that helped you to learn?
124
Office of the Executive Vice President and Provost Hughes Administration Center, Room 214 5998 Alcalá Park, San Diego, CA 92110-2492 Phone (619) 260-4553 • Fax (619) 260-2210 • www.sandiego.edu
Institutional Review Board Project Action Summary
Action Date: October 1, 2015 Note: Approval expires one year after this date. Type: __New Full Review ___New Expedited Review ___Continuation Review _X__Exempt Review ____Modification Action: _X__Approved ___Approved Pending Modification ___Not Approved
Project Number: 2015-0=10-022 Researcher(s): Kai Mathews Doc SOLES Lea Hubbard, PhD Fac SOLES Project Title: The Impact of Universal Design for Learning in a Blended Learning Classroom
Note: We send IRB correspondence regarding student research to the faculty advisor, who bears the ultimate responsibility for the conduct of the research. We request that the faculty advisor share this correspondence with the student researcher.
Modifications Required or Reasons for Non-Approval None The next deadline for submitting project proposals to the Provost’s Office for full review is N/A. You may submit a project proposal for expedited review at any time. Dr. Thomas R. Herrinton Administrator, Institutional Review Board University of San Diego [email protected] 5998 Alcalá Park San Diego, California 92110-2492