Embed Size (px)
Citation preview

Transformation well on track – FY positive net result
expectedAnalyst conference – Q3 2021
Commerzbank, Manfred Knof, CEO and Bettina Orlopp, CFO, Frankfurt All figures in this presentation are subject to rounding4 November 2021

Manfred KnofCEO
4 November 2021 Commerzbank, Manfred Knof, CEO, Frankfurt 1

Transformation progress in line with plan after 9M
4 November 2021 Commerzbank, Manfred Knof, CEO, Frankfurt 2
Transformation milestones on track
Development of transformation KPI largely in line with plan
Revenues of €6.4bn 3.3% above previous year
Low risk result of €257m – FY guidance improved to < €700m
Costs of €5.1bn in line with FY target of €6.5bn (excluding €200m write-off in Q2)
Good operating result of €1bn and net result of €9m despite restructuring charges
Capital with CET1 ratio at 13.5% better than planned
✓
Delivery at or above original expectation
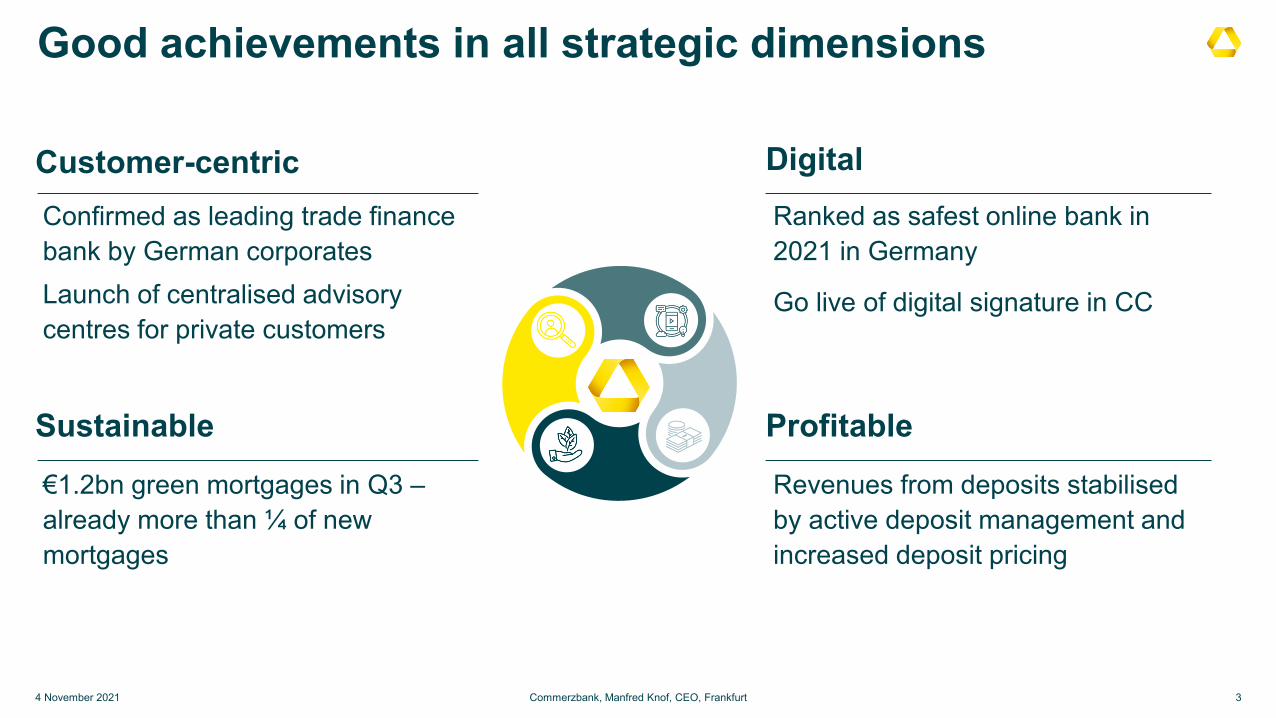
Good achievements in all strategic dimensions
4 November 2021 Commerzbank, Manfred Knof, CEO, Frankfurt
Customer-centric Digital
Sustainable Profitable
Confirmed as leading trade finance bank by German corporatesLaunch of centralised advisory centres for private customers
€1.2bn green mortgages in Q3 –already more than ¼ of new mortgages
Revenues from deposits stabilisedby active deposit management and increased deposit pricing
Ranked as safest online bank in 2021 in Germany
Go live of digital signature in CC
3

Half-way mark in personnel reduction already reached
Commerzbank, Manfred Knof, CEO, Frankfurt 44 November 2021
Gross FTE reduction
>50% of gross reduction of ~10,000 FTE
already ensured in a socially
responsible way
Contracted leavers incl. leavers due to retirement in 2022-
2024
~1,500
Leavers Jan 1 2022 from voluntary offer
Leavers YtD
~2,100
~5,200
~1,600
Total

Key transformation KPIs ahead of plan
4 November 2021 Commerzbank, Manfred Knof, CEO, Frankfurt
Operations & Head Office
IT capacity in nearshoring locations increased to 18% – ~1/3 of planned
increase already realised
PSBC
Customer and revenue churn so far lower than expected despite
accelerated branch closures and pricing initiatives
CC
Credit Risk Weighted Assets with efficiency <3% improved from 31% to
30%
Strategy implementation agenda 2021 on track
5
✓ ✓ ✓Highlights

Bettina OrloppCFO
4 November 2021 Commerzbank, Bettina Orlopp, CFO, Frankfurt 6

Q3 with good operating performance
4 November 2021 Commerzbank, Bettina Orlopp, CFO, Frankfurt 7
Operating result of €472m in Q3 and
€1,042m YtD
Net result of €403m includes booking of €76m restructuring
charges
Strong CET1 ratio at 13.5%
Buffer to MDA further improved to
~410bp
Financials developing in line with strategy
Stable underlying NII QoQ as expected
Increase in underlying NCI by 7% YoY
Increase in provisions for CHF mortgages by
€95m to €472m
Low risk result of €22m confirms high asset
quality
Overall level of Top Level Adjustment (TLA)
nearly unchanged at €496m
NPE ratio stable at 0.8%
Costs of €1,513m in line with target

Strong operating result and CET1 ratio in first 9 months
Revenues(€m)
Risk result(€m)
CET1 ratio2
(%)
4 November 2021 Commerzbank, Bettina Orlopp, CFO, Frankfurt
1) Consolidated result attributable to Commerzbank shareholders and investors in additional equity components2) Capital reduced by potential (fully discretionary) AT1 coupons
6,158
9M 2020 9M 2021
6,360
8
Operating result(€m)
-168
9
9M 2020 9M 2021
13.5
9M 2020 9M 2021
13.5
Net result1
(€m)
Costs(€m)
-257
9M 20219M 2020-1,067
200445
9M 2020
4025,061
9M 2021
4,551
4,996
4,458
94
9M 2020 9M 2021
1,042
One-time write-off (Q2)
Operating expenses
Compulsory contributions

Only minor exceptional revenue items in Q3
Commerzbank, Bettina Orlopp, CFO, Frankfurt 9
2020 (€m) Revenues
Q1 Hedging & valuation adjustments PPA Consumer Finance (PSBC)
-160-13
-172
Q2 Hedging & valuation adjustments PPA Consumer Finance (PSBC)Fine UK Financial Conduct Auth. (CC)
49-12-41
-5
Q3 Hedging & valuation adjustments PPA Consumer Finance (PSBC)
-51-11
-62
Q4 Hedging & valuation adjustments PPA Consumer Finance (PSBC)
-9-10
-19
FY -258
2021 (€m) Revenues
Q1 Hedging & valuation adjustments PPA Consumer Finance (PSBC)TLTRO benefit (O&C)
67-9
126
184
Q2 Hedging & valuation adjustments PPA Consumer Finance (PSBC)TLTRO benefit (O&C)Prov. re judgement on pricing of acc. (PSBC)
10-842
-66
-22
Q3 Hedging & valuation adjustments PPA Consumer Finance (PSBC)Prov. re judgement on pricing of acc. (PSBC)
32-8
-33
-9
9M 1534 November 2021

Group with solid revenues and improved risk result
4 November 2021 Commerzbank, Bettina Orlopp, CFO, Frankfurt
Group P&L
-278
205 168
-328
538
32
472
Q1Q1 Q3Q2 Q2Q4 Q3
2020 2021
Group operating result(€m)
Revenues from customer business on track
NFV in line with previous quarters
Other income mainly reflects provisions for CHF mortgages in Poland
10
Highlights Q3YoY increase in operating result driven by solid revenues and lower risk result
Restructuring charges increased by €76m to €1,052m with ~€90m still to be booked until YE 2022
Low Q3 tax rate based on 9M pre-tax loss
in €m Q3 2020 Q2 2021 Q3 2021 9M 2020 9M 2021Revenues 2,033 1,862 2,006 6,158 6,360 Exceptional items -62 -22 -9 -239 153 Revenues excl. exceptional items 2,095 1,884 2,015 6,397 6,207 o/w Net interest income 1,226 1,131 1,146 3,841 3,406 o/w Net commission income 813 860 873 2,482 2,692 o/w Net fair value result 117 115 129 146 537 o/w Other income -61 -222 -132 -73 -428 Risk result -272 -87 -22 -1,067 -257 Operating expenses 1,521 1,704 1,485 4,551 4,658 Compulsory contributions 72 39 27 445 402 Operating result 168 32 472 94 1,042 Restructuring expenses 201 511 76 201 1,052 Pre-tax profit discontinued operations -11 - - 40 - Pre-tax profit Commerzbank Group -43 -478 396 -67 -10 Taxes on income 3 40 -6 65 -49 Minority interests 15 8 -1 36 30 Net result -60 -527 403 -168 9
CIR (excl. compulsory contributions) (%) 74.8 91.5 74.0 73.9 73.2 CIR (incl. compulsory contributions) (%) 78.3 93.6 75.4 81.1 79.6 Net RoTE (%) -1.5 -9.3 5.8 -1.2 -0.7 Operating RoCET (%) 2.7 0.5 7.9 0.5 5.8

Strong NCI from securities business
Commerzbank, Bettina Orlopp, CFO, Frankfurt 11
Underlying net commission income(€m)
NCI in PSBC (+13% YoY) reflects strong securities business continuing to benefit from increased securities volume in custody
Good trading volume but below exceptional Q1
Commission income in CC stable YoY – increase QoQ from improvements in transaction banking and bonds business
Highlights Q3
4 November 2021
300 300 309 298 320 297 311
522 437 447 477568
495 504
85
Q4
64
-8Q2
873
Q1
959
-10 -11
65 67
Q3-8
71
-13Q1
-12
79860
-20Q2
78
Q3
878792 813 837
PSBC Germany
O&C
CC
mBank
2020 2021

Stable underlying net interest income in Q3
Commerzbank, Bettina Orlopp, CFO, Frankfurt 12
Underlying net interest income(€m)
QoQ increased NII in PSBC Germany with higher contributions from the loan business and also deposits due to increased deposit pricing
QoQ better NII in CC with higher contributions from deposits and stable contributions from loans
Highlights Q3
4 November 2021
433 443 429 425 418 403 421
479 451 469 460 454 443 479
214 190 179 179 170 180 185
195 210 150 90
Q1
106
Q2
1,1541,321
Q3 Q4
87
Q1 Q2
61
Q3
1,294 1,2261,129 1,131 1,146
O&CmBankPSBC GermanyCC
TLTRO benefits (€126m in Q1, €42m in Q2) reported as exceptional revenue items
2020 2021

Forward rates imply >€200m extra revenues vs. plan in 2024
4 November 2021 Commerzbank, Bettina Orlopp, CFO, Frankfurt
NII from EUR deposits (excl. NII from deposit pricing) (€m)
EUR interest rates(%)
Higher long-term rates would support NII from modelled deposits
Recent rate hike in PLN also not anticipated in Strategy 2024
13
Highlights
Higher short-term rates would benefit non-modelled deposits – stabilisation effects of deposit pricing while short-term rates stay low
~€300m lower revenues from deposits in 2024
Constant rates until 2024(Basis of Strategy 2024)
Forward curves 09/20212024 revenues from deposits on a
good way back to 2020 level
-0.6
-0.4
0.6
-0.2
0.0
0.2
0.4
6/2312/219/21 6/2412/226/22 12/23 12/24
10Y (constant rates Strategy 2024)
Deposit rate (constant rates Strategy 2024)
3M forwards (09/2021)
10Y forwards (09/2021)
Note: constant deposit volume assumed

Operating expenses excluding Q2 one-off on track
4 November 2021 Commerzbank, Bettina Orlopp, CFO, Frankfurt
Compulsory contributions(€m)
Operating expenses (excl. Q2 one-off)(€m)
4,551
9M 2020 9M 2021
4,458
1,954 1,856
2,597 2,602
-2.0% / -€93m
Administrative expensesPersonnel expenses
445 402
9M 20219M 2020
-9.6% / -€43m
14
Highlights
9M 20219M 2020
2005,0614,996
4,861
+1.3% / +€64m
Total expenses (€m)
Personnel expenses benefit from a ~1,200 net FTE reduction YoY to 38,432 – partly offset by wage adjustments and higher variable compensation
YtD ~€360m investment spending on digitalisation, IT infrastructure and regulatory topics
Decrease in administrative expenses for advertising, regular depreciation and travel
Total expenses burdened by one-time write-off for the stop of securities outsourcing project in Q2
One-time write-off (Q2)
Total Expenses

Resilient loan portfolio
4 November 2021 Commerzbank, Bettina Orlopp, CFO, Frankfurt
Risk result divisional split
2020 2021
Risk result(€m)
15
-326
-469
-272
-681
-149-87
-22
Q2Q1 Q2Q3 Q4 Q1 Q3
Highlights Q3
TLA -359
Risk result on a low level with few individual cases
NPE ratio stable at 0.8%
After review and inclusion of secondary effects, overall level of TLA nearly unchanged at €496m
In PSBC reduction of TLA in Germany offsets normal run-rate in mBank
Risk result of CC reflects net increase in TLA covering secondary effects of pandemic
Risk Result in €m Q3 2020 Q2 2021 Q3 2021 9M 2020 9M 2021Private and Small Business Customers -130 -62 1 -444 -125 Corporate Clients -120 13 -29 -575 -68 Others & Consolidation -22 -37 6 -49 -63 Group -272 -87 -22 -1,067 -257
NPE in €bnPrivate and Small Business Customers 2.0 2.0 1.9 2.0 1.9 Corporate Clients 2.3 2.2 2.2 2.3 2.2 Others & Consolidation 0.4 0.2 0.2 0.4 0.2 Group 4.7 4.5 4.3 4.7 4.3 Group NPE ratio (in %) 0.9 0.8 0.8 0.9 0.8 Group CoR (bps) 29 10 7 29 7 Group CoR on Loans (CoRL) (bps) 53 18 13 53 13

PSBC: continued growth & expansion of deposit pricing
4 November 2021 Commerzbank, Bettina Orlopp, CFO, Frankfurt
Deposits (Germany)(€bn eop)
Loan and securities volumes (Germany) (€bn eop)
Increase in securities volume from inflow of €3bn net new money
Successful reduction in deposit volumes to €146bn
16
Highlights Q3
110 112 115 116 119
310
161 177 192 203 206
Q3 2020
307
Q3 2021YE 2020 Q2 2021Q1 2021
290
YE 2021 target
271319 325
Loan
sSe
curit
ies
In August allowance for deposit pricing was reduced from €100k to €50k for new customers –existing customers are addressed on an individual basis
German mortgage business up 7% YoY to €90bn
Consumer finance book stable at €3.9bn
104 111 110 99
38 29 2532
13 16
Q2 2021
1507
YE 2020
10
Q3 2021Q1 2021
150 148 146
Above allowance (currently not priced)
Priced
Below allowance

Further revenue increase in PSBC
4 November 2021 Commerzbank, Bettina Orlopp, CFO, Frankfurt
Segmental P&L PSBC
2020 2021
Operating result(€m)
17
Highlights Q3
146108 83
32
250
138
299
Q3Q1 Q4Q2 Q3 Q1 Q2
YoY 5% increase in underlying revenues driven by 8% better revenues in the client group Private Customers with strong securities business and loan growth
YoY improvement in operating result additionally supported by risk result
Net reduction of customer base by 115k – customer and revenue churn below expectation
mBank YoY with growing NCI and NII nearly offsetting higher provisions for CHF loans (addition of €95m in Q3 2021 vs. €71m in Q3 2020) – outstanding volume of CHF loans at €2.4bn and legal reserves at €472m
in €m Q3 2020 Q2 2021 Q3 2021 9M 2020 9M 2021Revenues 1,153 1,129 1,176 3,644 3,634 Exceptional items -11 -71 -43 -38 -123 Revenues excl. exceptional items 1,163 1,200 1,219 3,682 3,757 o/w Private Customers 682 692 736 2,104 2,193 o/w Small Business Customers 207 204 209 622 623 o/w mBank 227 254 223 805 786 o/w Commerz Real 47 50 51 150 155 Risk result -130 -62 1 -444 -125 Operating expenses 872 866 850 2,596 2,568 Compulsory contributions 67 63 27 268 254 Operating result 83 138 299 337 687
RWA (end of period in €bn) 48.1 53.2 53.5 48.1 53.5 CIR (excl. compulsory contributions) (%) 75.7 76.7 72.3 71.2 70.7 CIR (incl. compulsory contributions) (%) 81.5 82.3 74.6 78.6 77.7 Operating return on equity (%) 5.8 8.9 18.8 7.9 15.0
Legal provisions on CHF loans of mBank -71 -55 -95 -116 -164 Operating result ex legal provisions on CHF loans 154 193 394 453 850

CC: ongoing increase in priced deposits
4 November 2021 Commerzbank, Bettina Orlopp, CFO, Frankfurt
Loan volume Corporates (quart. avg. €bn | Mittelstand and International Corporates)
Quarterly average loan volume largely stable Increase in deposits driven by high liquidity and less investment activity, however fully priced
Average RWA efficiency of corporates portfolio stable at 5.0%
18
55 54 53 54 53
34 30 29 28 27
8189
Q3 2020 YE 2020
82
Q2 2021Q1 2021 Q3 2021
84 82
Highlights Q3
International Corporates
Mittelstand
Deposits(quart. avg. €bn)
30 30 33 36
23 21 19 14
36 39 44 49
Q4 2020 Q1 2021 Q2 2021
9989
Q3 2021
9096
€ sight deposits (priced)
€ sight deposits (currently not priced)
FX and term deposits (priced)

Improved revenues in all CC client groups
4 November 2021 Commerzbank, Bettina Orlopp, CFO, Frankfurt
Segmental P&L CC
2020 2021
Operating result(€m)
Mittelstand and Institutionals with higher revenues YoY and QoQ benefitting from better transaction banking
International Corporates with lower revenues YoY in line with strategy – increase QoQ from improved capital markets business as well as better transaction banking
Positive YtD in Others reduced by valuation effects and restructuring of legacy positions in Q3
YoY €14bn lower RWA mainly driven by €9bn credit RWA efficiency measures and €4bn lower operational risk RWA
19
Highlights Q3
-105 -91
73
-338
98
242 221
Q4Q1 Q2 Q3 Q1 Q2 Q3
in €m Q3 2020 Q2 2021 Q3 2021 9M 2020 9M 2021Revenues 773 769 781 2,297 2,377 Exceptional items -21 11 15 -113 43 Revenues excl. exceptional items 794 758 766 2,410 2,333
o/w Mittelstand 430 431 437 1,303 1,310 o/w International Corporates 229 187 200 703 614 o/w Institutionals 116 115 138 401 388 o/w others 19 25 -10 3 22
Risk result -120 13 -29 -575 -68 Operating expenses 576 559 531 1,734 1,652 Compulsory contributions 4 -19 - 110 95 Operating result 73 242 221 -123 561
RWA (end of period in €bn) 93.2 83.1 79.5 93.2 79.5 CIR (excl. compulsory contributions) (%) 74.5 72.7 68.0 75.5 69.5 CIR (incl. compulsory contributions) (%) 75.0 70.2 68.0 80.3 73.5 Operating return on equity (%) 2.6 9.8 9.1 -1.4 7.5

O&C result in line with expectations
4 November 2021 Commerzbank, Bettina Orlopp, CFO, Frankfurt
Segmental P&L O&C
2020 2021
Operating result(€m)
20
Highlights Q3
-320
188
12
-21
190
-347
-49
Q3Q1Q3Q1 Q2 Q4 Q2
Operating result driven by lower valuations at CommerzVentures
Lower NII largely offset by better NFV YoY Other income reflects fluctuations in hedge accounting
in €m Q3 2020 Q2 2021 Q3 2021 9M 2020 9M 2021Revenues 107 -37 49 217 349 Exceptional items -31 38 19 -88 232 Revenues excl. exceptional items 138 -74 30 305 117 o/w Net interest income 150 106 61 555 253 o/w Net commission income -11 -12 -20 -29 -45 o/w Net fair value result -27 -13 46 -186 180 o/w Other income 26 -155 -56 -35 -271 Risk result -22 -37 6 -49 -63 Operating expenses 73 279 104 221 439 Compulsory contribution - -6 - 67 53 Operating result 12 -347 -49 -120 -206
RWA (end of period in €bn) 42.0 41.3 42.2 42.0 42.2

Robust CET1 ratio of 13.5% and buffer to MDA of ~410bp
4 November 2021 Commerzbank, Bettina Orlopp, CFO, Frankfurt
RWA development by risk types(€bn eop)
Credit RWA €1bn lower QoQ driven by reduced volumes, rating improvements and increased collateral in Corporate Clients
Increase in operational risk RWA due to switch from internal model to standardised approach formalised in Q4
Reduced market risk RWA from position changes
Stable capital in Q3, positive contribution from net result offset by increased regulatory deductions
21
Highlights Q3
Transition of CET1 ratio(%)
24 24 24 2417 18 19 19
80 73 72 70
33 34 33 34
19 17 19 20911
Q3 2020
12
Q1 2021 Q3 2021
11
Q2 2021
183 178 178 175
Operational riskMarket risk
Credit risk
O&C
CC
mBankPSBC Germany
Q2 2021
9.4
Q3 2020
0.1
RWA change
Q3 2021 MDA Q3 2021
13.5 13.4 13.5

Improved outlook 2021
4 November 2021 Commerzbank, Bettina Orlopp, CFO, Frankfurt 22
Note: Expectations are based on the assumption that there is no fundamental change affecting the CHF loan portfolio at mBank
Revenues will exceed those of the previous year
A CET1 ratio of around 13.5% is expected
We will achieve operational costs of around €6.5bn – additional €200m one-time write-off in Q2
Based on current development, a risk result <€700m is expected
We expect a positive operating result and a positive net result

Commerzbank, Bettina Orlopp, CFO, Frankfurt 234 November 2021

Appendix
Capital management
P&L tablesCommerzbank GroupCommerzbank financials at a glance 35Key figures Commerzbank share 36Loan and deposit volumes 37Scenario: NII sensitivity 38
IAS 19: Pension obligations 43FX impact on CET1 ratio 44Group equity composition 45
Capital markets funding 41Rating overview 42
Commerzbank Group 46Private and Small Business Customers 47mBank 48Corporate Clients 49Others & Consolidation 50Exceptional revenue items by segment 51
German economy 26
Glossary 52
Corporate responsibilityRenewable energy portfolio 33ESG ratings 34
Corona and risk related informationKfW loan demand 27Commerzbank’s risk provisions related to stages 28Retail, Travel related industries and Automotive & mechanical engineering 29-31Residential mortgage business 32
Funding & ratingCommerzbank’s MREL requirements 39Distance to MDA 40
4 November 2021 Commerzbank, Bettina Orlopp, CFO, Frankfurt 24
Contacts & Financial calendar 53
Disclaimer 54
2021 Strategy KPI 25

2021 Strategy KPI
4 November 2021 Commerzbank, Manfred Knof, CEO, Frankfurt 25
KPI YE 2020 Q1 2021 H1 2021 9M 2021 Target 2021
PSBC
Domestic locations (#)~800
(thereof ~600 open to customers)
~800 (thereof ~600 open
to customers)
~800 (thereof ~600 open
to customers)
~800 (550 expect. at YE) 600
Active digital banking users (%) 66 68 68 69 67
Loan and securities volumes (GER | €bn) 290 307 319 325 310
Net FTE reduction vs. YE 2020 (#) - 257 414 493(~1,700 locked in) 1,100
CC
International locations exited (#) - in preparation in preparation 4 3
Digital banking users activated (%) - launch in preparation launch in preparation in preparation 10
Portfolio with RWA efficiency < 3% (%) 34 33 31 30 32
Net FTE reduction vs. YE 2020 (#) - 105 145 244(~400 locked in) 300
Operations & Head Office
IT capacity in nearshoring locations (%) 14 15 17 18 20
Apps on cloud (%) 32 33 34 36 50(~6M delayed)
Reduction of external staff (#) Reduction starts in 2022
Net FTE reduction vs. YE 2020 (#) - 276 232 293(~450 locked in) 100

GDP
German economy 2021/2022 – Upswing stutters
Current development
The German economy has grown strongly again in the third quarter, as many service sectors continued to benefit from the extensive easing of the Corona restrictions. By contrast, the economy is being held back by the continuing bottlenecks in supply chains. Because of this, many manufacturers have cut back their production despite a very good order situation. As a result, many growth forecasts for this year have been lowered. We currently expect real GDP growth of 2.5%.The situation on the labor market has improved until recently, with many companies creating new jobs again. However, despite a decline in recent months, the seasonally adjusted number of unemployed is still around 250 thousand higher than before the crisis. In addition, there are probably still a good 600 thousand people on short-time work.
Our expectation for 2021 and 2022
In the final quarter of 2021 and the first quarter of the coming year, the German economy at best is likely to only slightly expand:• As the recovery is well advanced in many service
sectors, the respective growth rates are likely to return to normal. Some sectors are likely to suffer from the infection figures, which are expected to rise again, even though a renewed lockdown is unlikely.
• The bottlenecks in the supply chains are likely to continue to weigh on industrial production.
From the spring of next year we expect the problems in the supply chains to be gradually overcome and infection figures to fall with the warmer temperatures. This should give the economy renewed momentum, especially as monetary and fiscal policy remain largely expansionary. For Germany, we expect growth of 4.8% in 2022.One risk factor is the further development in China. Demand there is likely to weaken further in view of tighter monetary policy, thus slowing industrial activity worldwide.
4 November 2021 Commerzbank, Bettina Orlopp, CFO, Frankfurt 26
DAX(avg. p.a.)
(change vs. previous year | %)
GermanyEurozone
3m-Euribor(avg. p.a. | %)
2022e
4.8
2.2
20192016 2017
2.51.2
2021e
4.5
1.8
2018 2020
1.8 2.7
-4.6
2.61.1 1.1
-7.3
4.5
2016 20192015
10,957 10,19612,431 12,272
2017 2018
12,10312,335
2020
15,000
2021e
-0.02-0.26
20182015
-0.32
2016
-0.32
2017
-0.36
2019
-0.43
2020
-0.54
2021e
-0.46
2022e
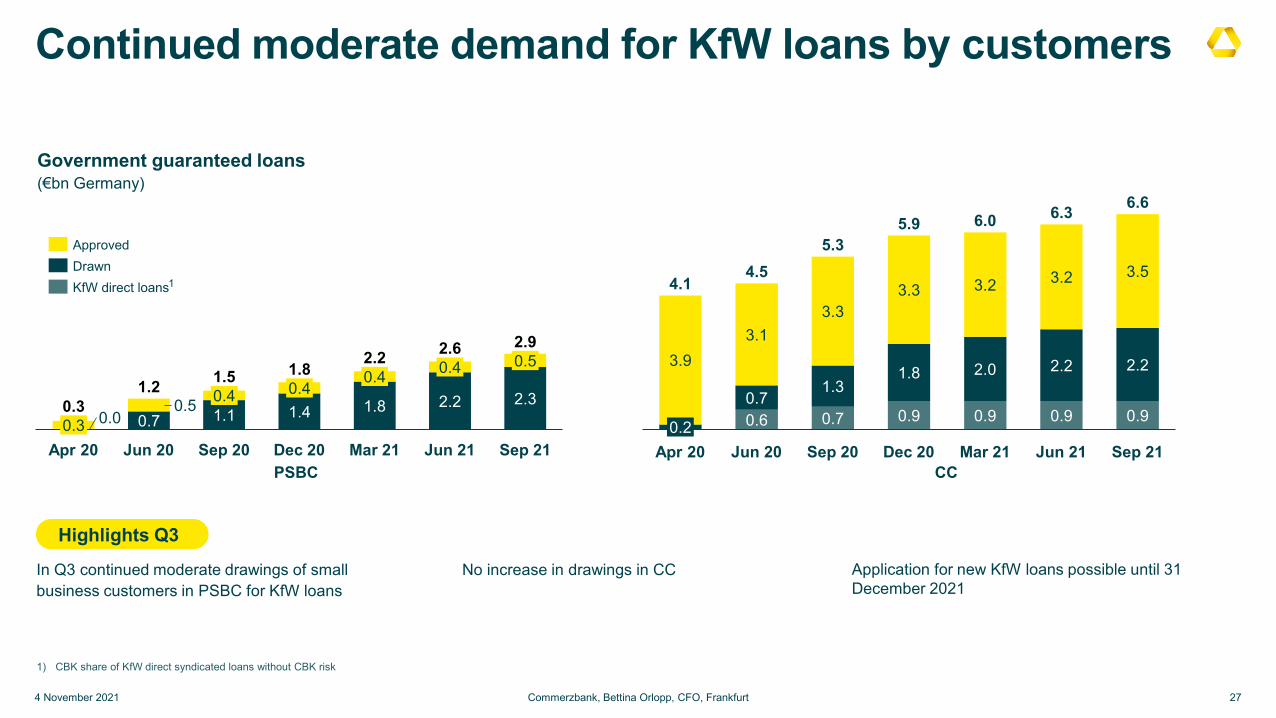
Continued moderate demand for KfW loans by customers
4 November 2021 Commerzbank, Bettina Orlopp, CFO, Frankfurt
Government guaranteed loans(€bn Germany)
In Q3 continued moderate drawings of small business customers in PSBC for KfW loans
No increase in drawings in CC Application for new KfW loans possible until 31 December 2021
0.4
0.31.8
Apr 20 Sep 20
0.5
Jun 20
2.20.4
0.5
Dec 20
0.4
Mar 21
2.31.1
0.4
Jun 21
1.2
Sep 21
0.3
1.5 1.82.2 2.6 2.9
0.0 0.7 1.4
Apr 20 Jun 20 Mar 21
0.7
Dec 20
0.9
Sep 20
2.2
Jun 21
3.2
Sep 21
0.9
2.0
4.1
0.9
4.5
0.2
5.9 6.0 6.3 6.6
3.13.9
0.70.6
1.3
3.33.3
1.8
3.2
2.2
0.9
3.55.3Approved
DrawnKfW direct loans
PSBC CC
27
1) CBK share of KfW direct syndicated loans without CBK risk
Highlights Q3
1
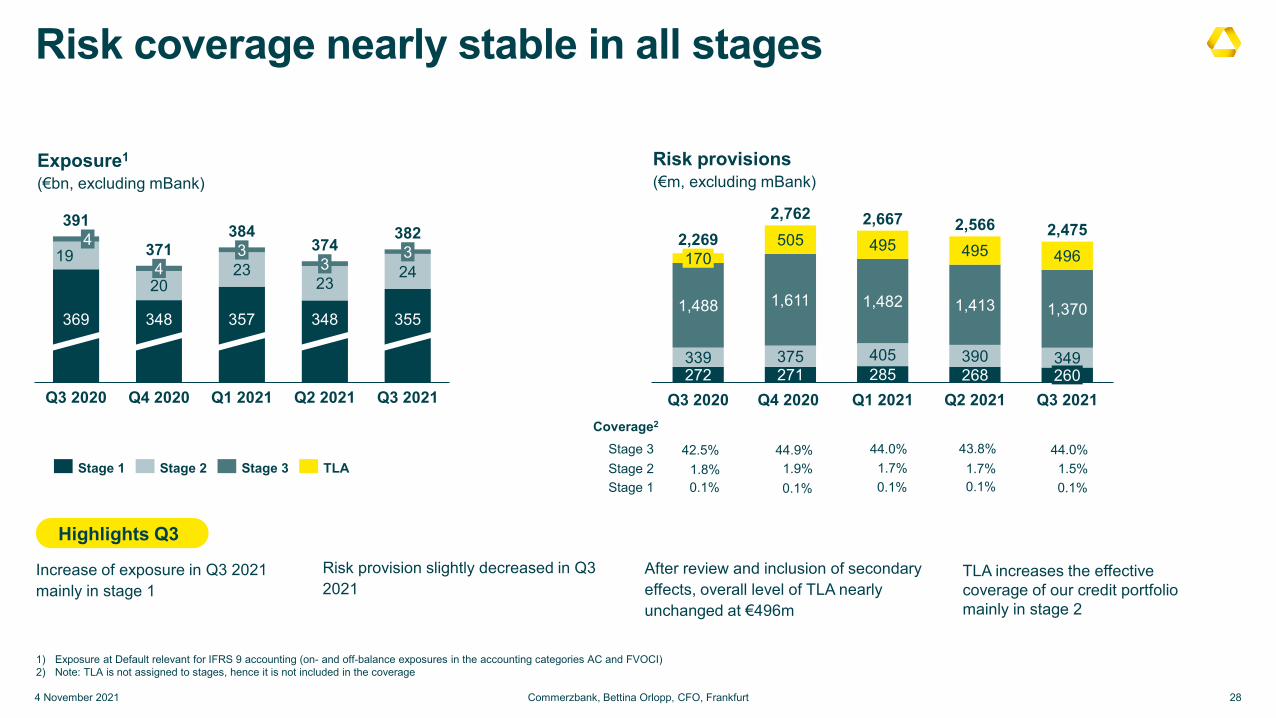
Risk coverage nearly stable in all stages
4 November 2021 Commerzbank, Bettina Orlopp, CFO, Frankfurt
Risk provisions(€m, excluding mBank)
Exposure1
(€bn, excluding mBank)
Increase of exposure in Q3 2021 mainly in stage 1
Risk provision slightly decreased in Q3 2021
28
Highlights Q3
19
2023
2324
4 371 374
Q3 2021
357369
Q2 2021Q3 2020
34
348
Q4 2020 Q1 2021
3
348
3
355
391 384 382
272 271 285 268339 375 405 390 349
505 495 495 496
Q1 2021Q4 2020
2,566
170
Q3 2021Q3 2020
2,269
Q2 2021
1,611
260
2,762 2,667 2,475
1,488 1,482 1,413 1,370
Stage 1 Stage 2 Stage 3 TLAStage 3 44.9% 44.0%
Stage 1 0.1% 0.1%Stage 2 1.9% 1.7%
42.5%
0.1%1.8%
Coverage2
43.8%
0.1%1.7%
1) Exposure at Default relevant for IFRS 9 accounting (on- and off-balance exposures in the accounting categories AC and FVOCI)2) Note: TLA is not assigned to stages, hence it is not included in the coverage
44.0%
0.1%1.5%
After review and inclusion of secondary effects, overall level of TLA nearly unchanged at €496m
TLA increases the effective coverage of our credit portfolio mainly in stage 2

Retail industry Portfolio reduced by €0.5bn in Q3 – share of 1.3% of overall portfolio
● Overall stable sector due to high proportion of food retailing and drugstores (food retailing with 10-15% non food revenues). Top 10 borrower units represent 59% of sector EaD
● Retail industry: fierce predatory competition in all segments by price and investments in shop modernisation. Online is gaining market share at the expense of the stationary retailers. Since we see the customers of the future as “hybrid”, omnichannel can be the answer to the concept question
● In crisis: food retailing winner due to stay-at-home effect and lockdown of competitors in non food. Fashion: most severely affected. The failure of the Christmas, winter and Easter business hits this sub-segment hard. Home improvement/DIY/ Consumer electronics/Sports benefit from “cocooning impact”, shift in consumer preferences and “home office”
● After lockdown: all segments with promising development
● Liquidity: still satisfactory
● Future risks are rising prices for raw materials, energy and logistics costs, interruption of the supply chain and cyber risk attacks
by sub-portfolios(€bn)
by region
by maturity
4 November 2021 Commerzbank, Bettina Orlopp, CFO, Frankfurt 29
6.1 2.7
0.6
1.8
1.1Food retailing
Mail order, fashion, clothing
Home improvement / furnitures
Specialists
57%26%
16%1% Germany
North America
Western Europe
Asia
34%
49%
18%< 1 year
1 to 5 years
> 5 years

2.0
0.8
0.7
0.4
Travel related industriesPortfolio reduced by €0.4bn in Q3 – share of only 0.8% of overall portfolio
● Airlines (€ 2.0bn): Portfolio consists of €1.7bn secured aircraft financing and €0.3bn corporate exposure. Corona has hit the airline industry in an unprecedented extent. The crisis has a sustainable impact, but the general global trend for travel and mobility should be intact once the situation has improved. Full recovery is uncertain, but currently expected to take until 2024
● Cruise liners (€0.8bn): After CDC lifted the no-sail order, cruise industry slowly restarted operations. The two industry leaders CCL and RCL are aiming to have 80% of their ships operating by the end of the year, NCL is expecting to have 66% running. The restart of the industry is causing increased ramp-up costs, which can be compensated with inflowing customer deposits for future cruises. The industry is expected to be at full capacity by mid 2022, which is underpinned by strong bookings for the upcoming season
● Hotels (€0.7bn): Most hotels have reopened since lift of lockdown. Recovery is expected through: 1) implementation of 2G/3G-concept and 2) increasing vaccination rates. Return to pre-Corona level seems realistic for leisure hotels, while business hotels will suffer longer from negative Corona impact and existing project pipeline (oversupply)
● Tour operators (€0.4bn): Mix of state support and use of KfW programs. Currently we see a slow restart of business. Achievement of pre-Corona level will take time
by sub-portfolios(€bn)
by region
by maturity
4 November 2021 Commerzbank, Bettina Orlopp, CFO, Frankfurt 30
3.9
Cruise liners
Airlines
Tour operators
Hotels
39%
37%
11%
9% 4%Germany
Western Europe
Asia
Rest of world
North America
18%
40%
43% > 5 years
< 1 year
1 to 5 years

5.7
3.61.1
8.0
Automotive & mechanical engineeringPortfolio reduced by €0.7bn in Q3 – share of 3.8% of overall portfolio
Automotive: Major share of complete automotive EaD is rated investment grade (84%).
● Despite ongoing recovery of demand very challenging market environment, high backlog in vehicle production and temporary plant shutdowns, mainly due to global supply shortages for automotive semiconductors, other pre-products and raw materials, leading to modified call-off orders.
● Vulnerable supply chains, rising material prices, increased freight rates and also energy costs are hitting profitability with significant impact on liquidity, mainly at car part supplier side. Requirements caused by strong transformation process (switch from combustion engine to e-mobility) are remaining meanwhile.
● Overall disrupting impact on production process threatens recovery of automotive sector, return to pre-crisis level not expected before 2023.
Mechanical engineering: Overall stable sector due to highly diversified portfolio with different impact of Corona induced crisis on portfolio subgroups. Biggest subgroup Machine Tools representing less than 10% of all client groups and top 10 clients approx. 20% of EaD
● Difficult market even before Corona in subsectors with high exposure to automotive sector but for sector as a whole no severe impact expected due to well-filled order books, improving order income in recent months and sufficient liquidity
● Market environment recovered from Q4/2020 onwards. However, shortage of raw materials are having a negative impact on the overall sector and threaten recovery
by sub-portfolios(€bn)
by region
by maturity
4 November 2021 Commerzbank, Bettina Orlopp, CFO, Frankfurt 31
18.5
46%
44%
10%1 to 5 years
< 1 year
> 5 years
Car parts supplier
Automotive OEM
Automotive wholesale & retail
Machinery
9%8%
25% 55%
1%Germany
Western Europe
North America
Asia
Middle & Eastern Europe

Residential mortgage business and property prices
German residential properties(index values)
Overall mortgage portfolio
● Due to risk-oriented selection very low RD
● As a consequence of low interest rates, repayment rates remain on a very high level
● Average “Beleihungsauslauf” (BLA) in new business of 84% in Q3 2021. German BLA is more conservative than the internationally used LtV definition due to the application of the strict German Pfandbrief law
4 November 2021 Commerzbank, Bettina Orlopp, CFO, Frankfurt 32
Risk parameters unchanged, impact of pandemic so far negligible
Prices of houses and flats, existing stock and newly constructed dwellings, averages
● Growing mortgage volume with unchanged risk quality:
− 12/17: EaD €75.2bn – RD 9bp− 12/18: EaD €81.0bn – RD 9bp− 12/19: EaD €86.6bn – RD 8bp− 12/20: EaD €95.1bn – RD 7bp− 03/21: EaD €98.4bn – RD 7bp− 06/21: EaD €99.1bn – RD 7bp− 09/21: EaD €101.4bn – RD 7bp
● Rating profile with a share of 92% in investment grade ratings
● Vintages of recent years developed more favorably so far and NPEs remain at a low level
2000 2005
150
2010 2015 2020 2025
100
200
Owner occupied housing CondominiumsSingle family houses Multi family houses

Development of renewable energy portfolio
Global footprint of Renewable Energy financing
Renewable Energies (RE) project finance portfolio(EaD, €bn eop)
201920172014 20202013 20162015 2018 Q3 21
3.5
4.63.8 4.0 4.1 4.2 4.2
4.5 4.6+30.1%
Renewable Energy portfolio
0.3%
21.6%61.5%
16.6%
Offshore: Commerzbank active globally as MLA1 and lender with offshore projects in Germany, France, Belgium, UK and Taiwan
International RE project finance: amongst others UK, France, Spain, US, Italy and Chile
Core market Germany:55% of portfolio in Germany
Wind onshore
OthersSolarWind offshore
€4.6bn
55%invested in Germany
45%invested globally
4 November 2021 Commerzbank, Bettina Orlopp, CFO, Frankfurt 33
1) MLA = Mandated Lead Arranger

4 November 2021 Commerzbank, Bettina Orlopp, CFO, Frankfurt 34
Climate Change Rating
● Commerzbank’s rating is above-average of the financial sector (C)
● Positioned as “Sector Leader Financials” in DACH region (ranked top 15% of financials in Germany, Austria and Switzerland)
E AD C B
ESG Risk Rating
● Commerzbank is at medium risk of experiencing material financial impacts from ESG factors (score of 24.1 / 100 with 0 being the best)
● Very well positioned above industry average on the 1st
quantile
Severe NegligibleMedium LowHigh
ESG Corporate Rating
● Rated in the ISS ESG Prime Segment – top 10% of industry group
● Excellent ratings especially in the categories environmental management, corporate governance and business ethics
D- A+C A- AD D+ C- C+ B- B B+
ESG QualityScores
● Commerzbank assigned with low ESG risks by ISS ESG QualityScores
● Social QualityScore 1, Environmental Score 2, Governance QualityScore 3
10 189 7 6 5 4 3
ESG Rating
● Double A rated in the upper part of the MSCI ESG rating scale
● Above-average positions in terms of private & data security, financial product safety, human capital and financing environmental impact
CCC AAAB BB BBB AAA 2
Above-average ESG ratings prove that we are on the right track

Commerzbank financials at a glance
4 November 2021 Commerzbank, Bettina Orlopp, CFO, Frankfurt 35
1) Capital reduced by potential (fully discretionary) AT1 coupons
Group Q3 2020 Q2 2021 Q3 2021 9M 2020 9M 2021 Total revenues €m 2,033 1,862 2,006 6,158 6,360 Risk result €m -272 -87 -22 -1,067 -257 Personnel expenses €m 877 862 886 2,597 2,602 Administrative expenses (excl. depreciation) €m 409 422 379 1,246 1,193 Depreciation €m 235 421 220 708 863 Compulsory contributions €m 72 39 27 445 402 Operating result €m 168 32 472 94 1,042 Net result €m -60 -527 403 -168 9
Cost/income ratio (excl. compulsory contributions) % 74.8 91.5 74.0 73.9 73.2 Cost/income ratio (incl. compulsory contributions) % 78.3 93.6 75.4 81.1 79.6
Accrual for potential AT1 coupon distribution current year €m -34 -42 -49 -68 -133 Net RoE % -1.3 -8.9 5.6 -1.1 -0.7 Net RoTE % -1.5 -9.3 5.8 -1.2 -0.7
Total assets €bn 544 544 541 544 541 Loans and advances (amortised cost) €bn 272 265 265 272 265 RWA €bn 183 178 175 183 175
CET1 ratio¹ % 13.5 13.4 13.5 13.5 13.5 Total capital ratio (with transitional provisions)¹ % 18.0 17.9 18.4 18.0 18.4 Leverage ratio (with transitional provisions)¹ % 4.9 4.6 4.6 4.9 4.6 NPE ratio % 0.9 0.8 0.8 0.9 0.8 Group CoR bps 29 10 7 29 7 Group CoR on Loans (CoRL) bps 53 18 13 53 13
Full-time equivalents excl. junior staff (end of period) 39,626 38,671 38,432 39,626 38,432
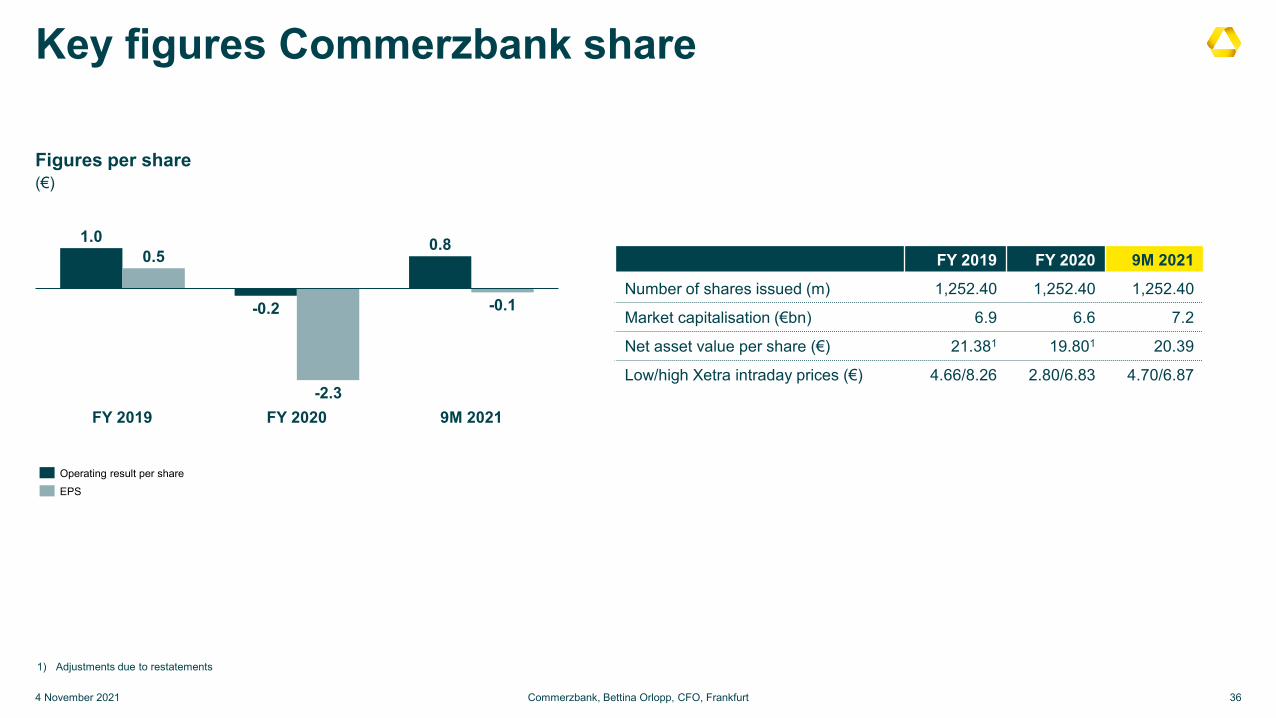
Key figures Commerzbank share
4 November 2021 Commerzbank, Bettina Orlopp, CFO, Frankfurt 36
Figures per share(€)
0.8
-2.3FY 2019
-0.2
0.5
9M 2021FY 2020
1.0
-0.1
Operating result per shareEPS
FY 2019 FY 2020 9M 2021
Number of shares issued (m) 1,252.40 1,252.40 1,252.40
Market capitalisation (€bn) 6.9 6.6 7.2
Net asset value per share (€) 21.381 19.801 20.39
Low/high Xetra intraday prices (€) 4.66/8.26 2.80/6.83 4.70/6.87
1) Adjustments due to restatements

Loan and deposit development
4 November 2021 Commerzbank, Bettina Orlopp, CFO, Frankfurt
Corporate Clients (monthly average €bn)
PSBC(monthly average €bn)
Loan growth in PSBC driven by residential mortgage business and investment loans in Germany
Decrease of deposit base in Germany while mBank shows slight increase
Decreased loan volumes in CC across all sub-segments, but mainly in International Corporates and Institutionals
Increase in deposits driven by Institutionals
37
Highlights
139 140
181 179
Jun 21 Sep 21Loan volume Deposit volume
89 8698 99
Jun 21 Sep 21Deposit volumeLoan volume

Significant NII potential in rising interest rate scenario
4 November 2021 Commerzbank, Bettina Orlopp, CFO, Frankfurt
Scenario impact on NII(€m)
100 bps parallel up-shift in rates yield curve (as of 30 September 2021, %)
Year 1 effect of ~€600-650m driven by short-end rates due to large stock of overnight (excess) deposits
Year 4 effect of ~€1,000 – 1,100m driven by higher reinvestment yield of modelled deposits used to refinance longer term loans
38
Highlights
Year 1 Year 4
Thereof ~1/2 stem from leaving the negative interest rate territory
-1
-0,5
0
0,5
1
0Y 2Y 4Y 6Y 8Y 10Y
~600-650
1,000

Comfortable fulfilment of RWA-based MREL requirement
4 November 2021 Commerzbank, Bettina Orlopp, CFO, Frankfurt 39
MREL ratio(% of RWA)
MREL requirement
● Based on data as of 30 June 2021, Commerzbank fulfils the MREL RWA requirement1 of 27.66% with a MREL ratio of 31.8% and the MREL subordination requirement of 15.82% with a ratio of 26.8% of RWA
● At 11.3% the MREL TLOF ratio is below the requirement of 12.01%
● The MREL subordination TLOF ratio of 9.5% is well above the requirement of 6.87% as of 30 June 2021
● The MREL requirements will in the near future be defined in RWA and leverage exposure terms under the BRRD II and SRMR II framework; currently they are derived from TLOF based requirements
● MREL requirement expected to be rebased on RWA and LRE in Q4 2021
1) In February 2020, Commerzbank AG received its current MREL requirement calibrated based on data as of 31 Dec 2017. The resolution approach is a multiple point of entry (MPE) with two separate resolution groups (resolution group A: Commerzbank Group without mBank subgroup; resolution group B: mBank subgroup). The legally binding MREL requirement is currently defined as a percentage of total liabilities and own funds (TLOF) based on data as of 31 Dec 2017.
2) Includes amortized amount (regulatory) of Tier 2 instruments with maturity > 1 year3) According to §46f KWG or non-preferred senior by contract 4) Non-covered / non-preferred deposits; preferred senior unsecured
19.5%
7.3%
5.0% MREL requirement 27.66% RWA
Own Funds instruments2
06/2021
Other MREL-eligible >1 year4
Non-preferred senior >1 year3
MREL subordinationrequirement15.82% RWA
31.8%

Commerzbank’s current MDA
Distance to MDA based on SREP requirement (transitional) for Q3 2021 (%)
4 November 2021 Commerzbank, Bettina Orlopp, CFO, Frankfurt 40
1) Based on RWAs of €175.2bn as of Q3 2021. AT1 requirement of 1.875% and Tier 2 requirement of 2.5%
Q3 2021 MDA1
CCB
Q3 2021 CET1 ratio
0.02 CCyBO-SII
4.50 CET1 Min.
P2R
13.51
9.40
1.13
2.50
1.25
411bp 411bp distance to MDA based on Q3 2021 CET1 ratio of 13.51% and SREP requirement for 2021
Further regulatory expirations throughout 2021:
● Regulatory phase-out of €226m grandfathered AT1 (0.13%1) at the beginning of 2022
● Tier 2 expiration of ~€0.4bn (~0.2%1)
AT1 issuance strategy continues in light of economical decisions and in relation to distance to MDA while goal for the Tier 2 layer is ≥ 2.5%
Highlights

Capital markets funding – funding plan nearly fulfilled
4 November 2021 Commerzbank, Bettina Orlopp, CFO, Frankfurt 41
Funding structure1
(as of 30 September 2021)
Covered bonds
~€62bn
Group issuance activities 9M 2021(nominal values)
Highlights
€2.3bn issued in 9M 2021:
● Additional Tier 1 capital: € 500m perp non-callApril 2028 (call period starts October 2027) with 4.25% p.a. coupon
● Tier 2: €500m benchmark transaction 1.375% p.a.10.25 non-call 5.25 years (call period starts September 2026)
● Preferred senior: €500m benchmark transaction with maturity September 2025
● mBank: €500m non-preferred green benchmark transaction 6 years non-call 5 years
● Low funding requirements in 2021 due to participation in ECB’s TLTRO III and RWA optimisation under new strategy
● Further funding activities in October: €250m2 tap of September 2025 preferred senior benchmark
Funding plan 2021 below €3bn
Subordinated debt
1) Based on balance sheet figures; senior unsecured bonds includes preferred and non-preferred senior bonds 2) not included in figures
Senior unsecured
funding
47%41%
12%
€59.1bn
Preferred senior
€0.5bn€0.5bn
Tier2
€0.5bn
Additional Tier1
€0.7bn
Non-preferred senior
€2.3bn

Rating overview Commerzbank
As of 4 November 2021
Bank Ratings S&P Moody’s
Counterparty Rating/Assessment1 A- A1/ A1 (cr)Deposit Rating2 BBB+ negative A1 stable
Issuer Credit Rating (long-term debt) BBB+ negative A1 negative
Stand-alone Rating (financial strength) bbb baa2
Short-term debt A-2 P-1
Product Ratings (unsecured issuances)
Preferred senior unsecured debt BBB+ negative A1 negativeNon-preferred senior unsecured debt BBB- Baa2Subordinated debt (Tier 2) BB+ Baa3Additional Tier 1 (AT1) BB- Ba2
No rating changes in 2021 so farS&P Global: Ratings have been confirmed in June 2021Moody´s: Ratings have been confirmed in July 2021
Highlights 2021
1) Includes parts of client business (i.e. counterparty for derivatives) 2) Includes corporate and institutional deposits
4 November 2021 Commerzbank, Bettina Orlopp, CFO, Frankfurt 42

IAS 19: Development of pension obligations
4 November 2021 Commerzbank, Bettina Orlopp, CFO, Frankfurt 43
Explanation
1) OCI effect driven by development of plan assets versus pension obligations, after tax, without minorities; cumulated since 1/1/2013 (new IAS19 standard) including possible restatements2) Discount rate for pension plans in Germany (represent 87% of total pension obligations); model change for discount rate in Q1 2021
Cumulated actuarial gains and losses(€m)
-875
-9,707
Q1
-10,367-9,671
-10,075
Q3Q2 Q3 Q4 Q1 Q2
-1,377
-9,026
-11,129
-9,714
-1,234 -1,422 -1,699-1,138 -1,017
1.8 1.2
Cumulated OCI effect1Pension obligations (gross)
Discount rate in %2
Discount rate increased significantly versus start of the year (partly due to rising market yields, partly due to model change for discount rate), producing a YtD valuation gain in pension obligations. On the asset side, the LDI hedges experienced under-proportional losses due to rising market yields. In total positive net effect (after tax) of +€823m in YtD OCI.
The discount rate is derived from an AA rated government bond basket, re-calibrated on corporate bond level, with average duration of 18 years.
Funding ratio (plan assets vs. pension obligations) is 106% across all Group plans.
0.5 1.31.0 1.3
2020 2021
1.3

FX impact on CET1 ratio
QoQ Change in FX capital position
Only marginal negative impact on CET1 ratio1: nearly stable currency translation reserve is overcompensated by slightly higher FX driven credit risk RWA
● Slight increase in credit risk RWA from FX effects, mainly due to opposing effects between stronger USD, weaker PLN and nearly unchanged GBP
● Nearly stable currency translation reserve due to opposite effects: stronger USD is offset by weaker PLN and nearly unchanged GBP (USD +€62m, PLN -€56m, GBP -€1m)
4 November 2021 Commerzbank, Bettina Orlopp, CFO, Frankfurt 44
Explanation
FX rates 06/21 09/21EUR / GBP 0.858 0.861EUR / PLN 4.520 4.620EUR / USD 1.188 1.158
Credit risk RWA2
(∆ QoQ in €m)
Currencytranslation reserve
(∆ QoQ in €m)Credit risk RWA
(Q3 2021 €bn)
14.8
95.3
5.1146.7
12.8
18.7
OtherGBP
USDPLN
EUR
-37
+487
-311-1
-56
+62
1) Based on current CET1 ratio2) Change in Credit Risk RWA solely based on FX not on possible volume effects since 06/21

Group equity composition
4 November 2021 Commerzbank, Bettina Orlopp, CFO, Frankfurt 45
1) Includes consolidated P&L reduced by accrual for potential (fully discretionary) AT1 coupons
Capital Capital Capital P&L P&L RatiosQ2 2021 Q3 2021 Q3 2021 Q3 2021
EoP EoP Average Q2 2021 Q3 2021€bn €bn €bn €m €m %
Common equity tier 1 capital 23.7 23.7 23.8 1 Operating Result 32 472 Op. RoCET 7.9%
DTA 0.5 0.5
Minority interests 0.4 0.4
Prudent Valuation 0.2 0.2
IRB shortfall 0.2 0.2
Instruments that are given recognition in AT1 Capital 3.1 3.1
Other regulatory adjustments 0.1 0.6
Tangible equity 28.3 28.7 28.6 1 Operating Result 32 472 Op. RoTE 6.6%
Goodwill and other intangible assets (net of tax) 1.0 1.0 1.0
IFRS capital 29.2 29.7 29.6 1
Subscribed capital 1.3 1.3
Capital reserve 11.5 11.5
Retained earnings 12.7 13.2
thereof consolidated P&L -0.4 0.0
thereof cumulated accrual for potential AT1 coupon distribution -0.0 -0.1
Currency translation reserve -0.5 -0.5
Revaluation reserve 0.0 0.0 Consolidated P&L -527 403
Cash flow hedges 0.0 -0.0 ./. accrual for potential AT1 coupon distribution current year -42 -49
IFRS capital attributable to Commerzbank shareholders 25.0 25.5 25.3 1 Consolidated P&L adjusted for RoE/RoTE -569 354 Net RoE 5.6%
Tangible equity attributable to Commerzbank shareholders 24.0 24.5 24.4 1 Net RoTE 5.8%
Additional equity components 3.1 3.1 2.2
Non-controlling interests 1.1 1.1 1.1

Commerzbank Group
4 November 2021 Commerzbank, Bettina Orlopp, CFO, Frankfurt 46
€mQ1
2020Q2
2020Q3
20209M
2020Q4
2020FY
2020Q1
2021Q2
2021Q3
20219M
2021
Total underlying revenues 2,024 2,278 2,095 6,397 2,047 8,444 2,308 1,884 2,015 6,207 Exceptional items -172 -5 -62 -239 -19 -258 184 -22 -9 153 Total revenues 1,851 2,273 2,033 6,158 2,029 8,186 2,492 1,862 2,006 6,360 o/w Net interest income 1,320 1,277 1,226 3,824 1,151 4,975 1,254 1,173 1,122 3,549 o/w Net commission income 877 791 812 2,481 837 3,317 951 852 889 2,692 o/w Net fair value result -304 163 25 -116 182 66 360 125 160 645 o/w Other income -42 42 -30 -30 -142 -172 -73 -288 -165 -527 o/w Dividend income 2 12 14 27 10 37 1 6 3 10 o/w Net income from hedge accounting -70 135 88 152 55 207 -48 -4 -32 -84 o/w Other f inancial result 13 2 -39 -24 -41 -65 19 -2 5 21 o/w At equity result 2 3 - 5 2 6 - 2 2 4 o/w Other net income 12 -109 -94 -191 -167 -357 -45 -290 -143 -478 Risk result -326 -469 -272 -1,067 -681 -1,748 -149 -87 -22 -257 Operating expenses 1,503 1,526 1,521 4,551 1,609 6,160 1,469 1,704 1,485 4,658 Compulsory contributions 301 73 72 445 67 512 336 39 27 402 Operating result -278 205 168 94 -328 -233 538 32 472 1,042 Impairments on goodw ill and other intangible assets - - - - 1,578 1,578 - - - - Restructuring expenses - - 201 201 614 814 465 511 76 1,052
Pre-tax result discontinued operations 44 6 -11 40 -10 30 - - - - Pre-tax result Commerzbank Group -234 211 -43 -67 -2,530 -2,597 73 -478 396 -10 Taxes on income 48 14 3 65 199 264 -83 40 -6 -49 Minority Interests 8 13 15 36 -26 9 23 8 -1 30 Consolidated Result attributable to Commerzbank shareholders and investors in additional equity components -291 183 -60 -168 -2,702 -2,870 133 -527 403 9
Total Assets 516,958 550,366 544,030 544,030 506,613 506,613 537,778 543,643 541,258 541,258 o/w Discontinued operations 4,752 2,179 2,167 2,167 2,040 2,040 2,143 1,809 1,368 1,368
Average capital employed 24,269 24,577 24,974 24,601 24,318 24,499 23,684 23,800 23,813 23,751 RWA credit risk (end of period) 153,812 157,215 153,082 153,082 147,849 147,849 149,314 148,183 146,691 146,691 RWA market risk (end of period) 11,113 11,208 11,260 11,260 12,191 12,191 12,467 10,850 8,731 8,731 RWA operational risk (end of period) 18,178 18,056 18,732 18,732 18,287 18,287 16,690 18,555 19,795 19,795
RWA (end of period) continued operations 183,102 186,478 183,073 183,073 178,327 178,327 178,471 177,588 175,217 175,217 RWA (end of period) discontinued operations 690 574 263 263 253 253 - - - - RWA (end of period) 183,792 187,051 183,337 183,337 178,581 178,581 178,471 177,588 175,217 175,217 Cost/income ratio (excl. compulsory contributions) (%) 81.2% 67.1% 74.8% 73.9% 79.3% 75.2% 59.0% 91.5% 74.0% 73.2% Cost/income ratio (incl. compulsory contributions) (%) 97.4% 70.4% 78.3% 81.1% 82.6% 81.5% 72.5% 93.6% 75.4% 79.6% Operating return on CET1 (RoCET) (%) -4.6% 3.3% 2.7% 0.5% -5.4% -1.0% 9.1% 0.5% 7.9% 5.8% Operating return on tangible equity (%) -4.1% 2.9% 2.3% 0.4% -4.6% -0.8% 7.8% 0.5% 6.6% 4.9% Return on equity of net result (%) -4.4% 2.3% -1.3% -1.1% -40.5% -10.7% 1.5% -8.9% 5.6% -0.7% Net return on tangible equity (%) -4.8% 2.6% -1.5% -1.2% -44.0% -11.7% 1.5% -9.3% 5.8% -0.7%

Private and Small Business Customers
4 November 2021 Commerzbank, Bettina Orlopp, CFO, Frankfurt 47
€mQ1
2020Q2
2020Q3
20209M
2020Q4
2020FY
2020Q1
2021Q2
2021Q3
20219M
2021
Total underlying revenues 1,329 1,190 1,163 3,682 1,142 4,824 1,337 1,200 1,219 3,757 Exceptional items -20 -7 -11 -38 -9 -47 -9 -71 -43 -123 Total revenues 1,309 1,183 1,153 3,644 1,133 4,777 1,329 1,129 1,176 3,634 o/w Net interest income 681 630 637 1,947 630 2,577 615 614 657 1,886 o/w Net commission income 586 502 515 1,603 548 2,151 653 575 582 1,810 o/w Net fair value result 32 66 58 156 75 232 58 69 55 183 o/w Other income 10 -15 -57 -62 -120 -182 2 -129 -118 -244 o/w Dividend income 1 11 12 24 2 26 1 4 3 7 o/w Net income from hedge accounting 1 - 1 2 -2 - -2 - -2 -3 o/w Other f inancial result 6 5 - 11 19 30 19 - - 20 o/w At equity result - - -1 -1 -1 -1 - - - - o/w Other net income 2 -32 -69 -99 -138 -237 -17 -133 -119 -269 Risk result -161 -152 -130 -444 -118 -562 -64 -62 1 -125 Operating expenses 864 859 872 2,596 920 3,515 851 866 850 2,568 Compulsory contributions 137 64 67 268 63 331 163 63 27 254 Operating result 146 108 83 337 32 369 250 138 299 687 Impairments on goodw ill and other intangible assets - - - - 1,578 1,578 - - - - Pre-tax result 146 108 83 337 -1,547 -1,210 250 138 299 687
Total Assets 155,201 158,780 158,667 158,667 153,547 153,547 158,318 161,641 165,238 165,238 Liabilities 186,485 194,287 195,332 195,332 198,372 198,372 200,420 202,304 201,007 201,007 Average capital employed 5,641 5,674 5,697 5,675 5,717 5,680 5,828 6,185 6,371 6,106
RWA credit risk (end of period) 40,476 40,754 40,959 40,959 40,019 40,019 41,759 42,687 42,820 42,820 RWA market risk (end of period) 964 1,075 1,029 1,029 1,072 1,072 1,180 1,116 929 929 RWA operational risk (end of period) 5,517 5,394 6,138 6,138 6,079 6,079 7,852 9,348 9,756 9,756
RWA (end of period) 46,958 47,223 48,126 48,126 47,170 47,170 50,791 53,151 53,504 53,504 Cost/income ratio (excl. compulsory contributions) (%) 66.0% 72.6% 75.7% 71.2% 81.2% 73.6% 64.1% 76.7% 72.3% 70.7% Cost/income ratio (incl. compulsory contributions) (%) 76.5% 78.0% 81.5% 78.6% 86.8% 80.5% 76.4% 82.3% 74.6% 77.7% Operating return on CET1 (RoCET) (%) 10.4% 7.6% 5.8% 7.9% 2.2% 6.5% 17.1% 8.9% 18.8% 15.0% Operating return on tangible equity (%) 10.3% 7.5% 5.8% 7.9% 2.2% 6.5% 17.1% 8.8% 18.5% 14.8%
Legal provisions on CHF loans of mBank -3 -42 -71 -116 -113 -229 -14 -55 -95 -164 Operating result ex legal provisions on CHF loans 149 150 154 453 145 598 264 193 394 850

mBank | Part of Segment Private and Small Business Customers
4 November 2021 Commerzbank, Bettina Orlopp, CFO, Frankfurt 48
€mQ1
2020Q2
2020Q3
20209M
2020Q4
2020FY
2020Q1
2021Q2
2021Q3
20219M
2021
Total underlying revenues 305 273 227 805 220 1,025 309 254 223 786 Exceptional items -7 5 - -2 1 -1 - 3 -2 1 Total revenues 299 278 227 803 221 1,024 309 257 220 786 o/w Net interest income 214 190 179 583 179 762 170 180 185 535 o/w Net commission income 64 65 67 197 71 268 85 79 78 242 o/w Net fair value result 27 57 52 136 67 203 55 58 52 164 o/w Other income -6 -34 -72 -112 -96 -208 -1 -60 -95 -156 o/w Dividend income - 1 - 1 - 1 - 1 - 1 o/w Net income from hedge accounting 1 - 1 2 -2 - -2 - -2 -3 o/w Other f inancial result -2 1 -1 -1 20 19 19 - - 20 o/w At equity result - - - - - - - - - - o/w Other net income -5 -37 -72 -114 -114 -228 -19 -61 -93 -173 Risk result -83 -77 -57 -217 -57 -274 -33 -50 -41 -124 Operating expenses 126 124 123 373 114 486 116 130 131 377 Compulsory contributions 75 38 38 151 36 187 64 38 40 142 Operating result 15 38 9 63 14 77 95 40 9 143
Total Assets 37,740 40,682 39,824 39,824 38,935 38,935 41,398 43,203 44,210 44,210 Liabilities 36,260 39,148 38,105 38,105 36,908 36,908 39,731 42,094 43,260 43,260 Average capital employed 2,303 2,292 2,319 2,308 2,291 2,302 2,361 2,620 2,754 2,564
RWA credit risk (end of period) 17,144 17,207 17,181 17,181 16,680 16,680 18,054 18,936 18,901 18,901 RWA market risk (end of period) 426 412 394 394 329 329 428 508 437 437 RWA operational risk (end of period) 1,384 1,562 1,753 1,753 1,805 1,805 2,652 3,544 3,774 3,774
RWA (end of period) 18,954 19,181 19,327 19,327 18,814 18,814 21,134 22,988 23,111 23,111 Cost/income ratio (excl. compulsory contributions) (%) 42.1% 44.7% 54.1% 46.4% 51.6% 47.5% 37.6% 50.5% 59.5% 47.9% Cost/income ratio (incl. compulsory contributions) (%) 67.3% 58.4% 70.7% 65.2% 67.8% 65.7% 58.4% 65.3% 77.6% 66.0% Operating return on CET1 (RoCET) (%) 2.6% 6.7% 1.6% 3.6% 2.5% 3.3% 16.1% 6.0% 1.3% 7.5% Operating return on tangible equity (%) 2.6% 6.8% 1.7% 3.7% 2.6% 3.4% 16.3% 6.0% 1.3% 7.4%

Corporate Clients
4 November 2021 Commerzbank, Bettina Orlopp, CFO, Frankfurt 49
€mQ1
2020Q2
2020Q3
20209M
2020Q4
2020FY
2020Q1
2021Q2
2021Q3
20219M
2021
Total underlying revenues 823 793 794 2,410 747 3,157 810 758 766 2,333 Exceptional items -81 -12 -21 -113 12 -101 17 11 15 43 Total revenues 743 781 773 2,297 759 3,056 827 769 781 2,377 o/w Net interest income 433 441 426 1,300 424 1,724 426 411 405 1,242 o/w Net commission income 300 300 309 909 298 1,207 312 289 327 928 o/w Net fair value result -33 71 67 105 49 154 104 73 40 218 o/w Other income 43 -31 -29 -17 -12 -29 -15 -5 9 -11 o/w Dividend income - 3 - 3 2 5 - 3 -1 2 o/w Net income from hedge accounting 6 4 1 11 1 12 -5 - 1 -4 o/w Other f inancial result -3 - -23 -27 -13 -39 -6 1 -2 -7 o/w At equity result 2 2 1 5 2 8 - 2 2 4 o/w Other net income 39 -40 -8 -9 -4 -14 -5 -10 9 -7 Risk result -165 -290 -120 -575 -505 -1,081 -52 13 -29 -68 Operating expenses 584 575 576 1,734 589 2,323 562 559 531 1,652 Compulsory contributions 99 7 4 110 2 113 114 -19 - 95 Operating result -105 -91 73 -123 -338 -461 98 242 221 561 Impairments on goodw ill and other intangible assets - - - - - - - - - - Pre-tax result discontinued operations 44 6 -11 40 -10 30 - - - - Pre-tax result (total) -61 -85 62 -83 -348 -431 98 242 221 561
Total Assets 186,617 179,681 172,080 172,080 159,001 159,001 161,850 152,251 150,067 150,067 o/w Discontinued operations 4,752 2,179 2,167 2,167 2,040 2,040 2,143 1,809 1,368 1,368
Liabilities 187,411 185,377 186,891 186,891 171,086 171,086 181,178 180,313 178,381 178,381 o/w Discontinued operations 5,364 3,878 3,066 3,066 2,051 2,051 2,162 1,847 1,432 1,432
Average capital employed 11,330 11,611 11,355 11,418 10,904 11,280 10,400 9,850 9,750 9,990 RWA credit risk (end of period) 82,315 84,102 79,500 79,500 74,261 74,261 73,190 72,386 70,369 70,369 RWA market risk (end of period) 4,693 5,314 5,793 5,793 6,748 6,748 6,599 6,685 5,229 5,229 RWA operational risk (end of period) 7,575 7,700 7,668 7,668 7,242 7,242 4,535 4,077 3,876 3,876
RWA (end of period) continued operations 94,583 97,115 92,961 92,961 88,252 88,252 84,323 83,147 79,474 79,474 RWA (end of period) discontinued operations 690 574 263 263 253 253 - - - - Cost/income ratio (excl. compulsory contributions) (%) 78.6% 73.6% 74.5% 75.5% 77.6% 76.0% 68.0% 72.7% 68.0% 69.5% Cost/income ratio (incl. compulsory contributions) (%) 91.9% 74.5% 75.0% 80.3% 77.9% 79.7% 81.8% 70.2% 68.0% 73.5% Operating return on CET1 (RoCET) (%) -3.7% -3.1% 2.6% -1.4% -12.4% -4.1% 3.8% 9.8% 9.1% 7.5% Operating return on tangible equity (%) -3.5% -3.0% 2.5% -1.4% -12.1% -3.9% 3.6% 9.2% 8.4% 7.0%

Others & Consolidation
4 November 2021 Commerzbank, Bettina Orlopp, CFO, Frankfurt 50
€mQ1
2020Q2
2020Q3
20209M
2020Q4
2020FY
2020Q1
2021Q2
2021Q3
20219M
2021
Total underlying revenues -128 295 138 305 159 464 161 -74 30 117 Exceptional items -72 14 -31 -88 -22 -110 176 38 19 232 Total revenues -200 310 107 217 137 354 337 -37 49 349 o/w Net interest income 206 206 163 576 98 673 213 148 61 421 o/w Net commission income -9 -11 -12 -31 -9 -40 -13 -12 -20 -45 o/w Net fair value result -302 25 -100 -377 58 -319 197 -18 65 244 o/w Other income -96 89 56 49 -10 39 -60 -155 -56 -271 o/w Dividend income - -2 2 1 6 7 - - 1 - o/w Net income from hedge accounting -77 131 85 140 56 195 -42 -5 -31 -77 o/w Other f inancial result 10 -4 -15 -9 -48 -56 5 -3 6 8 o/w At equity result - - - - - - - - - - o/w Other net income -29 -37 -17 -83 -24 -107 -23 -147 -33 -203 Risk result - -27 -22 -49 -57 -106 -32 -37 6 -63 Operating expenses 55 93 73 221 100 321 56 279 104 439 Compulsory contributions 65 2 - 67 1 68 59 -6 - 53 Operating result -320 188 12 -120 -21 -141 190 -347 -49 -206 Restructuring expenses - - 201 201 614 814 465 511 76 1,052 Pre-tax profit continued operations -320 188 -188 -320 -635 -956 -275 -858 -125 -1,258
Total Assets 175,139 211,904 213,283 213,283 194,064 194,064 217,610 229,751 225,953 225,953 Liabilities 143,062 170,702 161,807 161,807 137,155 137,155 156,180 161,026 161,870 161,870 Average capital employed 7,298 7,293 7,922 7,508 7,697 7,539 7,457 7,765 7,692 7,655
RWA credit risk (end of period) 31,021 32,359 32,622 32,622 33,569 33,569 34,365 33,110 33,503 33,503 RWA market risk (end of period) 5,455 4,819 4,437 4,437 4,370 4,370 4,688 3,049 2,573 2,573 RWA operational risk (end of period) 5,086 4,962 4,926 4,926 4,966 4,966 4,303 5,131 6,163 6,163
RWA (end of period) 41,562 42,140 41,986 41,986 42,905 42,905 43,356 41,290 42,238 42,238

Commerzbank Group | Exceptional Revenue Items
4 November 2021 Commerzbank, Bettina Orlopp, CFO, Frankfurt 51
1) From Q1 2021 onwards no longer reported as exceptional revenue items
€m Q12020
Q22020
Q32020
9M2020
Q42020
FY2020
Q12021
Q22021
Q32021
9M2021
Exceptional Revenue Items -172 -5 -62 -239 -19 -258 184 -22 -9 153 o/w Net interest income -1 -17 - -18 -3 -21 125 42 -24 143 o/w Net commission income - -1 - -2 - -2 -8 -8 16 - o/w Net fair value result -160 -10 -92 -262 -14 -276 67 10 32 109 o/w Other income -11 23 30 43 -1 41 - -66 -33 -99
o/w FVA, CVA / DVA, AT1 FX effect, Other former ACR valuations¹ (NII, NCI, NFVR) -160 49 -51 -162 -9 -172 67 10 32 109
PSBC -20 -7 -11 -38 -9 -47 -9 -71 -43 -123 o/w Net interest income -13 -12 -11 -35 -10 -45 -9 -8 -8 -25 o/w Net fair value result -7 5 - -3 1 -2 - 3 -2 1 o/w Other income - - - - - - - -66 -33 -99
o/w FVA, CVA / DVA (NII, NFVR) -7 5 - -3 1 -2 - 3 -2 1
CC -81 -12 -21 -113 12 -101 17 11 15 43 o/w Net interest income - -2 -2 -4 -1 -4 8 8 -16 - o/w Net commission income - - - - - - -8 -8 16 - o/w Net fair value result -81 31 -18 -68 13 -55 17 11 15 43 o/w Other income - -41 - -41 - -41 - - - -
o/w FVA, CVA / DVA (NII, NFVR) -81 30 -21 -72 12 -59 17 11 15 43
O&C -72 14 -31 -88 -22 -110 176 38 19 232 o/w Net interest income 11 -3 13 21 7 28 126 42 - 168 o/w Net commission income - -1 - -2 - -2 - - - - o/w Net fair value result -72 -46 -73 -192 -27 -219 50 -4 19 64 o/w Other income -11 65 30 84 -1 83 - - - -
o/w FVA, CVA / DVA, AT1 FX effect, Other former ACR valuations¹ (NII, NCI, NFVR) -72 14 -31 -88 -22 -110 50 -4 19 64
Description of Exceptional Revenue Items2020 €m 2021 €m 2021 €m Q1 PPA Consumer Finance (PSBC) -13 Q1 PPA Consumer Finance (PSBC) -9 Q2 NII change from consolidation of a securitisation (CC) 8 Q2 PPA Consumer Finance (PSBC) -12 Q1 TLTRO benefit (O&C) 126 Q2 NCI change from consolidation of a securitisation (CC) -8 Q2 Fine UK Financial Conduct Authority (CC) -41 Q1 NII change from consolidation of a securitisation (CC) 8 Q3 PPA Consumer Finance (PSBC) -8 Q3 PPA Consumer Finance (PSBC) -11 Q1 NCI change from consolidation of a securitisation (CC) -8 Q3 Prov. re judgement on pricing of accounts (PSBC) -33 Q4 PPA Consumer Finance (PSBC) -10 Q2 PPA Consumer Finance (PSBC) -8 Q3 NII change from consolidation of a securitisation (CC) -16
Q2 TLTRO benefit (O&C) 42 Q3 NCI change from consolidation of a securitisation (CC) 16 Q2 Prov. re judgement on pricing of accounts (PSBC) -66

Glossary – Key Ratios
4 November 2021 Commerzbank, Bettina Orlopp, CFO, Frankfurt 52
Key Ratio Abbreviation Calculated for Numerator Denominator
Group Private and Small Business Customers and Corporate Clients Others & Consolidation
Cost/income ratio (excl. compulsory contributions) (%) CIR (excl. compulsory contributions) (%)
Group as well as segmentsPSBC and CC
Operating expenses Total revenues Total revenues n/a
Cost/income ratio (incl. compulsory contributions) (%) CIR (incl. compulsory contributions) (%)
Group as well as segmentsPSBC and CC
Operating expenses and compulsory contributions
Total revenues Total revenues n/a
Operating return on CET1 (%) Op. RoCET (%) Group and segments (excl. O&C) Operating profit Average CET1¹12% ² of the average RWAs(YTD: PSBC €50.9bn, CC €83.3bn)
n/a(note: O&C contains the reconciliation to Group CET1)
Operating return on tangible equity (%) Op. RoTE (%) Group and segments (excl. O&C) Operating profitAverage IFRS capital after deduction of goodwill and other intangibleassets ¹
12% ² of the average RWAs plus average regulatory capital deductions (excluding goodwill and other intangible assets)(YTD: PSBC €0.1bn, CC €0.7bn)
n/a(note: O&C contains the reconciliation to Group tangible equity)
Return on equity of net result (%) Net RoE (%) Group
Consolidated Result attributable to Commerzbank shareholders and investors in additional equity components after deduction of potential (fully discretionary) AT1 coupon
Average IFRS capital without non-controlling interests and without additional equity components ¹
n/a n/a
Net return on tangible equity (%) Net RoTE (%) Group
Consolidated Result attributable to Commerzbank shareholders and investors in additional equity components after deduction of potential (fully discretionary) AT1 coupon
Average IFRS capital without non-controlling interests and without additional equity components after deduction of goodwill and other intangible assets (net of tax) ¹
n/a n/a
Non-Performing Exposure ratio (%) NPE ratio (%) Group Non-performing exposures Total exposures according to EBA Risk Dashboard
n/a n/a
Cost of Risk (bps) CoR (bps) Group Risk Result Exposure at Default n/a n/a
Cost of Risk on Loans (bps) CoRL (bps) Group Risk Result Loans and Advances[annual report note (25)]
n/a n/a
Key Parameter Calculated for Calculation
Total underlying revenues Group and segments Total revenues excluding exceptional revenue items
Underlying Operating Performance Group and segments Operating result excluding exceptional revenue items and compulsory contributions
1) reduced by potential dividend accrual and potential (fully discretionary) AT1 coupon2) charge rate reflects current regulatory and market standard

For more information, please contact our IR team
Mail: [email protected] / www.ir.commerzbank.com
Christoph WortigHead of Investor RelationsP: +49 69 136 52668M: [email protected]
Ansgar HerkertHead of IR CommunicationsP: +49 69 136 44083M: [email protected]
Investors and Financial Analysts
Michael H. KleinP: +49 69 136 24522M: [email protected]
Jutta MadjlessiP: +49 69 136 28696M: [email protected]
Dirk Bartsch Head of Strategic IR / Rating Agency Relations / ESGP: +49 69 136 22799 M: [email protected]
Financial calendar 2021/2022
4 November 2021 Commerzbank, Bettina Orlopp, CFO, Frankfurt 53
17 February 2022
Q4 2021 press conference
12 May 2022
Q1 2022 results
3 August 2022
Q2 2022 results
9 November 2022
Q3 2022 results
11 May 2022
AGM
1 March 2022
CMD

Disclaimer
This presentation contains forward-looking statements. Forward-looking statements are statements that are not historical facts; they include, inter alia, statements about Commerzbank’s beliefs and expectations and the assumptions underlying them. These statements are based on plans, estimates, projections and targets as they are currently available to the management of Commerzbank. Forward-looking statements therefore speak only as of the date they are made, and Commerzbank undertakes no obligation to update any of them in light of new information or future events. By their very nature, forward-looking statements involve risks and uncertainties. A number of important factors could therefore cause actual results to differ materially from those contained in any forward-looking statement. Such factors include, among others, the conditions in the financial markets in Germany, in Europe, in the United States and elsewhere from which Commerzbank derives a substantial portion of its revenues and in which it hold a substantial portion of its assets, the development of asset prices and market volatility, potential defaults of borrowers or trading counterparties, the implementation of its strategic initiatives and the reliability of its risk management policies.
In addition, this presentation contains financial and other information which has been derived from publicly available information disclosed by persons other than Commerzbank (“external data”). In particular, external data has been derived from industry and customer-related data and other calculations taken or derived from industry reports published by third parties, market research reports and commercial publications. Commercial publications generally state that the information they contain has originated from sources assumed to be reliable, but that the accuracy and completeness of such information is not guaranteed and that the calculations contained therein are based on a series of assumptions. The external data has not been independently verified by Commerzbank. Therefore, Commerzbank cannot assume any responsibility for the accuracy of the external data taken or derived from public sources.
Copies of this document are available upon request or can be downloaded from https://www.commerzbank.de/en/hauptnavigation/aktionaere/investor_relations.html
4 November 2021 Commerzbank, Bettina Orlopp, CFO, Frankfurt 54