Embed Size (px)
Citation preview

Energy for Europe Prof. Dr.-Ing. Alfred Voß 1
Transformation towards a
sustainable European Energy
System – Which Roadmaps?
Prof. Dr.-Ing. Alfred Voß Institut für Energiewirtschaft und Rationelle Energieanwendung
Universität Stuttgart
EUROPEAN ENERGY CONFERENCE 2012
Maastricht, 17.- 20. April 2012

Energy for Europe Prof. Dr.-Ing. Alfred Voß 1
What is an Energy Roadmap?
• A useful Roadmap is not a blue-print of a particular
technology pathway to a decarbonised energy system in the
future.
• A useful Energy Roadmap has to provide information for the
design of an energy policy framework
by exploring the technical and systems aspects as well
as the economic implications of a range of possible
transition paths to a low-carbon energy system
by making transparent the potential trade-offs between
the three objectives - decarbonisation, security of supply
and competitiveness – of the transition pathways

Prof. Dr.-Ing. Alfred Voß Energy for Europe
Energy in Europe – the situation
at the outset
3

Prof. Dr.-Ing. Alfred Voß Energy for Europe 4
Energy in the EU-27: Gross Inland Primary Energy
Consumption (by Fuel)
Source: EUROSTAT (2012)
Import Dependency
[%]
1990 45.3
+19%
2010 54.1
Energy Intensity
[toe/000 €2000]
1990 215
-23%
2009 165 0
10
20
30
40
50
60
70
80
1990 1992 1994 1996 1998 2000 2002 2004 2006 2008 2010
Pri
ma
ry e
ne
rgy c
on
su
mp
tio
n E
U-2
7 [
EJ
/a]
Solid fuels Oil Gas
Nuclear Renewables Others

Prof. Dr.-Ing. Alfred Voß Energy for Europe 5
Final Energy Consumption in the EU-27 (by Sector)
Source: EUROSTAT (2012)
0
5
10
15
20
25
30
35
40
45
50
1990 1992 1994 1996 1998 2000 2002 2004 2006 2008 2010
Fin
al E
ne
rgy C
on
su
mp
tio
n E
U-2
7 [
EJ
/a]
Industry
Services, Agriculture and Others
Households
Transport
Prof. Dr.-Ing. Alfred Voß Energy for Europe 7
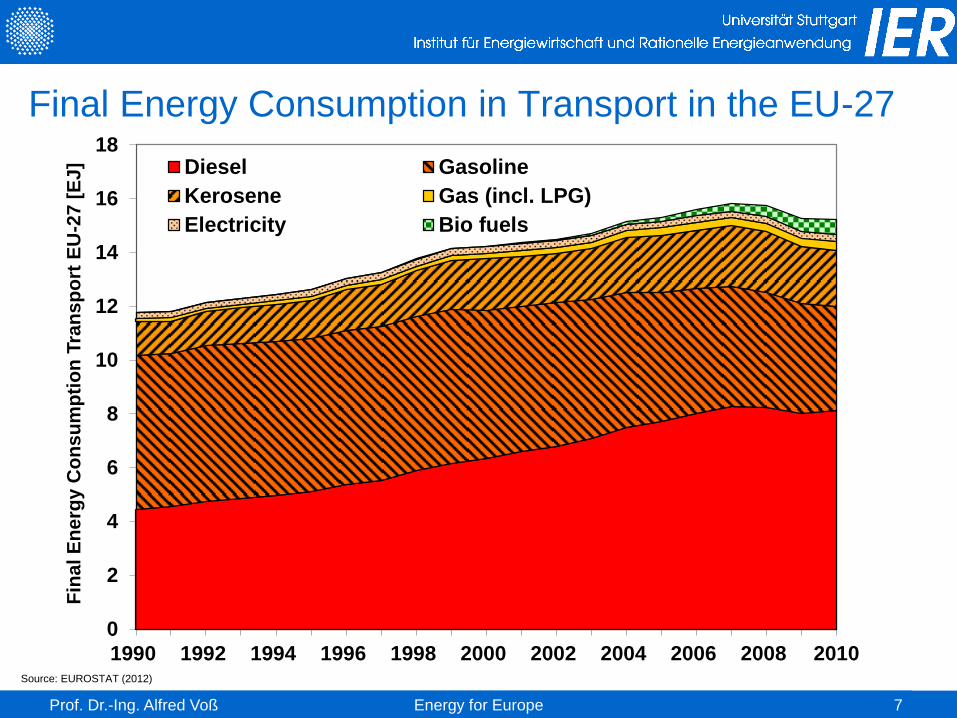
Final Energy Consumption in Transport in the EU-27
Source: EUROSTAT (2012)
0
2
4
6
8
10
12
14
16
18
1990 1992 1994 1996 1998 2000 2002 2004 2006 2008 2010
Fin
al E
ne
rgy C
on
su
mp
tio
n T
ran
sp
ort
EU
-27
[E
J] Diesel Gasoline
Kerosene Gas (incl. LPG)
Electricity Bio fuels

Prof. Dr.-Ing. Alfred Voß Energy for Europe
Electricity consumption in the EU-27 is increasing
8
0
500
1000
1500
2000
2500
3000
3500
Fin
al E
lectr
icit
y C
on
su
mp
tio
n E
U-2
7 [
TW
h]
Transport
Services, Agriculture, Others
Households
Industry
Source: EUROSTAT (2012)
Electricity
• is the fuel for lighting,
information and
communication as
well as stationary
drives
• can be produced from
all primary energy
sources
• offers an energy-
efficient substitution of
hydrocarbons (heat
pumps, electric
vehicles)

Prof. Dr.-Ing. Alfred Voß Energy for Europe 10
Electricity in the EU-27
Source: EUROSTAT (2012), EURELECTRIC (2011), own calculations
Electricity Generation Capacity
(EU-27) in 2010: 871 GW
Gross Electricity Generation (EU-
27) in 2010: 3346 TWh
0
500
1000
1500
2000
2500
3000
3500
1990 1992 1994 1996 1998 2000 2002 2004 2006 2008 2010
Gro
ss e
lectr
icit
y g
en
era
tio
n E
U-2
7 [
TW
h]
Others RenewablesNuclear Petroleum ProductsNatural Gas Solid fuels
Coal23%
Petroleum products
6%
Natural gas24%
Nuclear15%
Hydro 16%
Wind9%
Solar4%
Biomass 3%
Others 0%
Prof. Dr.-Ing. Alfred Voß Energy for Europe 11
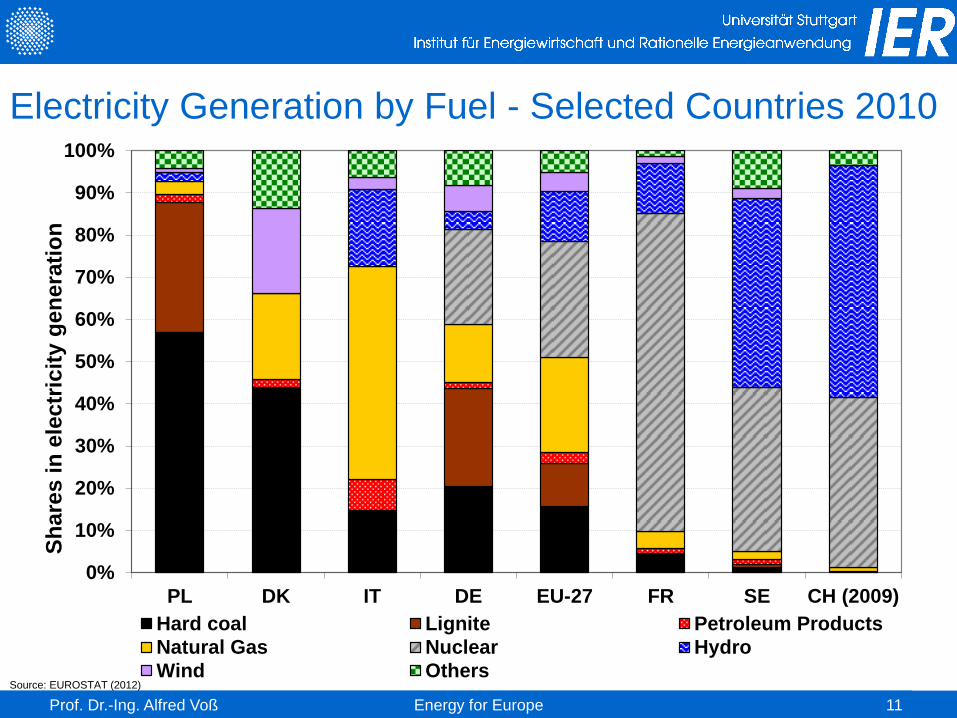
Electricity Generation by Fuel - Selected Countries 2010
Source: EUROSTAT (2012)
0%
10%
20%
30%
40%
50%
60%
70%
80%
90%
100%
PL DK IT DE EU-27 FR SE CH (2009)
Sh
are
s i
n e
lec
tric
ity g
en
era
tio
n
Hard coal Lignite Petroleum Products
Natural Gas Nuclear Hydro
Wind Others

Prof. Dr.-Ing. Alfred Voß Energy for Europe 12
Net Imports of Electricity of EU-27 Countries (2010)
Source: EUROSTAT (2012)
Italy
Finland
Greece
EU-27
Netherlands
United Kingdom
Ireland
Denmark
Poland
Spain
Bulgaria
Czech Republic
Germany
France
-40 -30 -20 -10 0 10 20 30 40 50
Net imports of electricity, 2010 [TWh]

Prof. Dr.-Ing. Alfred Voß Energy for Europe 13
Installed Capacity of Electricity Generation and
Electricity from Renewables in the EU-27
Source: EUROSTAT (2012)
7%
9%
11%
13%
15%
17%
19%
0
50
100
150
200
250
300
350
400
450
500
550
600
650
Sh
are
of
ren
ew
ab
les
in
gro
ss
ele
ctr
icit
y
co
ns
um
pti
on
Ele
ctr
icit
y g
en
era
tio
n f
rom
re
ne
wa
ble
s [
TW
h]
RES electricity
RES share
0
50
100
150
200
250
300
Ins
tall
ed
ca
pa
cit
y f
or
ele
ctr
icit
y g
en
era
tio
n [
GW
]
Others
Biomass
Solar
Wind
Hydro

Prof. Dr.-Ing. Alfred Voß Energy for Europe
0
500
1000
1500
2000
2500
3000
3500
4000
4500
En
erg
y r
ela
ted
CO
2 e
mis
sio
ns
[M
t]
Energy sector
Industry
Transport
Residential, Services and Agriculture
Others
15
Energy Related CO2 Emissions (by Sector)
Source: UNFCCC (2012)
Sum:
3527 Mt
40.0%
15.1%
26.4%
19.7%
0
500
1000
1500
2000
2500
3000
3500
4000
4500
2009
Secto
ral
sh
are
s i
n e
nerg
y
rela
ted
CO
2 e
mis
sio
ns [
%]

Prof. Dr.-Ing. Alfred Voß Energy for Europe 16
CO2 Emissions in Europe: Selected Countries
9.2 9.1
7.6
5.8
4.8
5.6
3.9 3.9
2.6
0.7 0.80.3
0
1
2
3
4
5
6
7
8
9
10
Denmark Germany EU-27 France Sweden Switzerland
CO
2 e
mis
sio
ns
pe
r c
ap
ita
[t/
inh
ab
ita
nt]
Energiebedingte CO2-Emissionen je Einwohner
CO2-Emissionen der Stromerzeugung je Einwohner
Energy related CO2 emissions per capita
CO2 emissions in electricity generation per capita
Source: UNFCCC (2010) and EUROSTAT (2010), own calculations;
CO2 in electricity generation comprises emissions from public electricity and heat production

Prof. Dr.-Ing. Alfred Voß Energy for Europe
Energy Outlook – Comparison of three
Pathways to a Low-carbon Energy System
19

Prof. Dr.-Ing. Alfred Voß Energy for Europe 20
Overview of Scenarios Current Policy Scenario CPS
• Includes policies adopted by 2011 e.g. RES and GHG reduction targets 2020;
Emission Trading Scheme (ETS) Targets; after Fukushima nuclear policy plans
Decarbonisation Scenarios: GHG-Red. 20% in 2020; 80% in 2050
Renewable Energy Pathway REP
• Increasing reliance on RES, 60% share in gross final energy and 65%share in
electricity consumption 2050
High Renewable Electricity HRE
• More renewables, 80% share in electricity comsumption 2050
Ressource Efficient Decarbonisation Pathway RDP
• Decarbonisation options compete on economic grounds
no specific support measures or political limitations for technologies

Prof. Dr.-Ing. Alfred Voß Energy for Europe
Primary Energy Consumption in the EU-27
21
-10000
0
10000
20000
30000
40000
50000
60000
70000
80000
900002
01
0
CP
S
RE
P
HR
E
RD
P
CP
S
RE
P
HR
E
RD
P
CP
S
RE
P
HR
E
RD
P
CP
S
RE
P
HR
E
RD
P
2020 2030 2040 2050
Pri
ma
ry e
ne
rgy c
on
su
mp
tio
n [
PJ
]
Net electricityimport
Waste (nonrenewable)
Otherrenewables
Hydro, wind,solar, Ocean
Nuclear
Natural gas
Oil
Lignite
Coal

Prof. Dr.-Ing. Alfred Voß Energy for Europe
Share of fossil fuel imports in total primary
energy consumption in EU-27
22
0%
10%
20%
30%
40%
50%
60%
70%
2010 2020 2030 2040 2050
Shar
e o
f im
po
rts
of
foss
il e
ne
rgie
s o
f to
tal p
rim
ary
en
erg
y co
nsu
mp
tio
n
CPS
REP
HRE
RDP

Prof. Dr.-Ing. Alfred Voß Energy for Europe
Final energy consumption in the EU27
23
0
10000
20000
30000
40000
50000
60000M
od
ell
CP
S
RE
P
HR
E
RD
P
CP
S
RE
P
HR
E
RD
P
CP
S
RE
P
HR
E
RD
P
CP
S
RE
P
HR
E
RD
P2010 2020 2030 2040 2050
To
tal
fin
al
en
erg
y c
on
su
mp
tio
n [
PJ
]
Others (Methanol,Hydrogen)
Waste
Renewables
Heat
Electricity
Gas
Petroleum products
Coal

Prof. Dr.-Ing. Alfred Voß Energy for Europe
25
0
2000
4000
6000
8000
10000
12000
14000
16000
18000M
od
ell
CP
S
RE
P
HR
E
RD
P
CP
S
RE
P
HR
E
RD
P
CP
S
RE
P
HR
E
RD
P
CP
S
RE
P
HR
E
RD
P
2010 2020 2030 2040 2050
Fin
al
en
erg
y c
on
su
mp
tio
n T
ran
sp
ort
[P
J]
Others (Methanol,Hydrogen, DME)
Waste
Renewables
Heat
Electricity
Gas
Petroleum products
Coal
Final energy consumption transport in the EU27
Prof. Dr.-Ing. Alfred Voß Energy for Europe
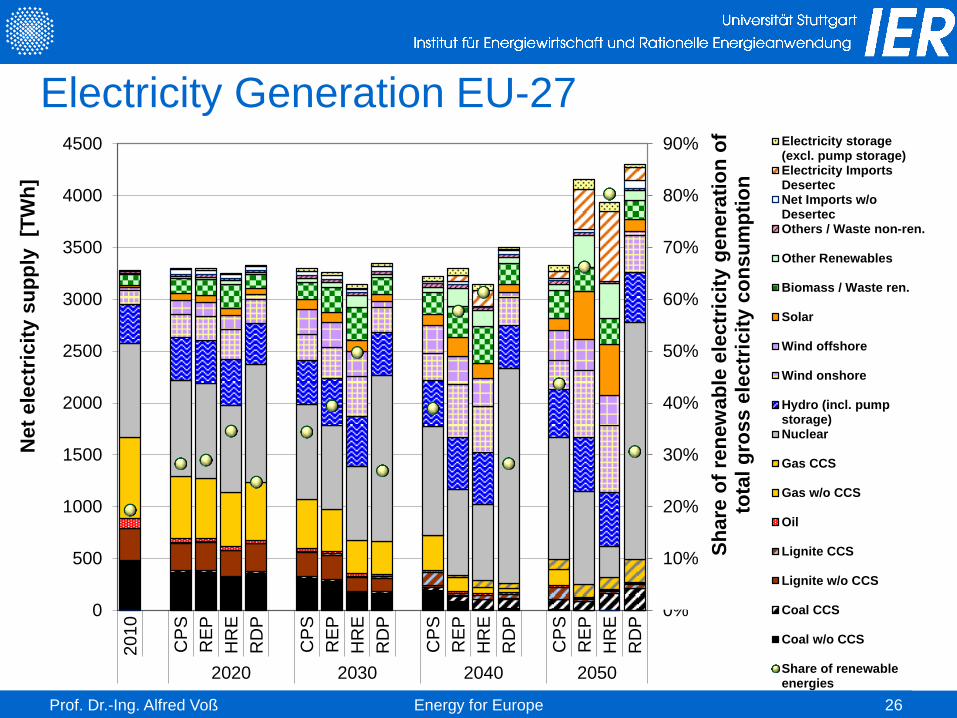
Electricity Generation EU-27
26
0%
10%
20%
30%
40%
50%
60%
70%
80%
90%
0
500
1000
1500
2000
2500
3000
3500
4000
45002010
CP
S
RE
P
HR
E
RD
P
CP
S
RE
P
HR
E
RD
P
CP
S
RE
P
HR
E
RD
P
CP
S
RE
P
HR
E
RD
P
2020 2030 2040 2050
Sh
are
of
ren
ew
ab
le e
lectr
icit
y g
en
era
tio
n o
f to
tal
gro
ss e
lectr
icit
y c
on
su
mp
tio
n
Net
ele
ctr
icit
y s
up
ply
[T
Wh
]
Electricity storage(excl. pump storage)Electricity ImportsDesertecNet Imports w/oDesertecOthers / Waste non-ren.
Other Renewables
Biomass / Waste ren.
Solar
Wind offshore
Wind onshore
Hydro (incl. pumpstorage)Nuclear
Gas CCS
Gas w/o CCS
Oil
Lignite CCS
Lignite w/o CCS
Coal CCS
Coal w/o CCS
Share of renewableenergies

Prof. Dr.-Ing. Alfred Voß Energy for Europe
Share of electricity generation in the EU-27
27
0%
10%
20%
30%
40%
50%
60%
70%
80%
90%
100%
20
10
CP
S
RE
P
HR
E
RD
P
CP
S
RE
P
HR
E
RD
P
CP
S
RE
P
HR
E
RD
P
CP
S
RE
P
HR
E
RD
P
2020 2030 2040 2050
Sh
are
of
net
ele
ctr
icit
y g
en
era
tio
n
Other
Renewables
Nuclear
Fossil CCS
Fossile non CCS

Prof. Dr.-Ing. Alfred Voß Energy for Europe
Electricity exchange
28
-400
-300
-200
-100
0
100
200
300
400S
tati
sit
ic
Mo
de
ll
CP
S
RE
P
HR
E
RD
P
CP
S
RE
P
HR
E
RD
P
CP
S
RE
P
HR
E
RD
P
CP
S
RE
P
HR
E
RD
P
CP
S
RE
P
HR
E
RD
P
2000 2010 2020 2030 2040 2045 2050
Ele
ctr
icit
y n
et
imp
ort
s [
TW
h]
East Europe
Baltic states
Scandinavia
Greece
Italy+Slovenia
Germany
Alps (AT, CH)
Benelux
France
Iberia
UK+Ireland

Prof. Dr.-Ing. Alfred Voß Energy for Europe
Generation Capacities in the EU-27
29
0
200
400
600
800
1000
1200
1400
16002010
CP
S
RE
P
HR
E
RD
P
CP
S
RE
P
HR
E
RD
P
CP
S
RE
P
HR
E
RD
P
CP
S
RE
P
HR
E
RD
P
2020 2030 2040 2050
Ne
t e
lectr
icit
y c
ap
acit
y
[GW
]
Electricity storage(excl. pump storage)
Others / Waste non-ren.
Other Renewables
Biomass / Waste ren.
Solar
Wind
Hydro incl. pumpstorage
Nuclear
Natural gas
Oil
Lignite
Coal

Prof. Dr.-Ing. Alfred Voß Energy for Europe
Electricity storage capacities in the EU-27
30
0
10000
20000
30000
40000
50000
60000
70000
80000
90000
1000002010
CP
S
RE
P
HR
E
RD
P
CP
S
RE
P
HR
E
RD
P
CP
S
RE
P
HR
E
RD
P
CP
S
RE
P
HR
E
RD
P
2020 2030 2040 2050
Net
ele
ctr
icit
y c
ap
acit
y [
MW
]
Vehicle Storage
CAES
Batteries
Pump Storage

Prof. Dr.-Ing. Alfred Voß Energy for Europe
Average cost of electricity generation
31
55
6268
49
68
79
88
56
90
100
112
67
0
20
40
60
80
100
120
CPS REP HRE RDP CPS REP HRE RDP CPS REP HRE RDP
2020 2030 2050
Avera
ge l
evelised
co
sts
of
gen
era
tin
g
ele
ctr
icit
y
[EU
R2
00
0/M
Wh
]

Prof. Dr.-Ing. Alfred Voß Energy for Europe
Annual energy system costs compared to CPS
32
-100
-50
0
50
100
150
200
250
300
2010
CP
S
RE
P
HR
E
RD
P
CP
S
RE
P
HR
E
RD
P
CP
S
RE
P
HR
E
RD
P
CP
S
RE
P
HR
E
RD
P
2020 2030 2040 2050
De
lta
sys
tem
co
sts
co
mp
. to
CP
S-2
01
0 [
Bln
EU
R2000]
TransboundaryCarbontransport/storage
Certificate costs
Biofuel Trade
Electricity TradeCosts
Investment Costs
Variable Costs
Fix Costs
Total costs
Prof. Dr.-Ing. Alfred Voß Energy for Europe
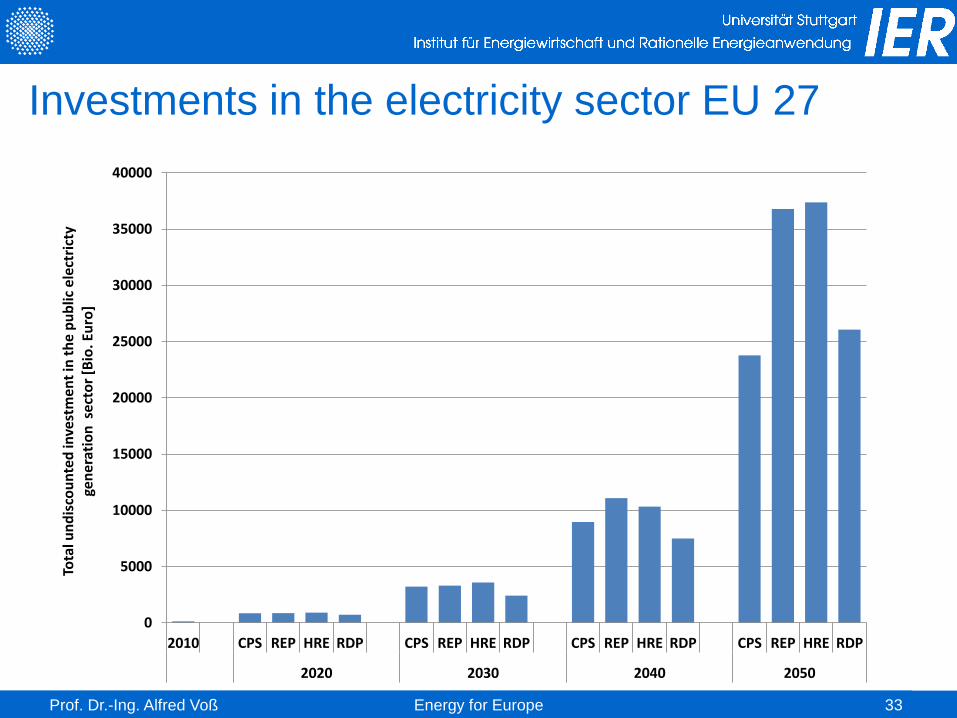
Investments in the electricity sector EU 27
33
0
5000
10000
15000
20000
25000
30000
35000
40000
2010 CPS REP HRE RDP CPS REP HRE RDP CPS REP HRE RDP CPS REP HRE RDP
2020 2030 2040 2050
Tota
l un
dis
cou
nte
d in
vest
me
nt
in t
he
pu
blic
ele
ctri
cty
gen
era
tio
n s
ect
or
[Bio
. Eu
ro]

Prof. Dr.-Ing. Alfred Voß Energy for Europe
Cumulated energy system costs EU 27
34
Cumulated system costs compared to CPS [Bln €2000]
2010 - 2030 2010 - 2050
REP: Renewable Energy Pathway
61 1625
HRE: High Renewable Electricity
95 1820
RDP: Ressource Efficient Decarbonisation Pathway
-558 -485
Absolute Difference to CPS

Prof. Dr.-Ing. Alfred Voß Energy for Europe
Thank you very much for
your attention!