Embed Size (px)
Citation preview
Transformation through Infrastructure
World Bank Group Infrastructure Strategy Update
Issues and Concept Note
June 6, 2011
1 Transformation through Infrastructure
Table of Contents
Executive Summary .................................................................................................................................... 3
A. Context .................................................................................................................................................. 4
B. Issues in Infrastructure and Recent Developments ............................................................................... 6
C. WBG‘s Track Record in Infrastructure – Preliminary Findings ......................................................... 10
D. Scope, Objectives and Methodology .................................................................................................. 14
E. Status of Preparation and Timeframe .................................................................................................. 17
Annex 1 – WBG Support for Infrastructure, FY03-10 ............................................................................... 19
Annex 2 – Lessons Learnt from WBG Experience with PPPs in the last 20 years .................................... 21
Annex 3 – Sector and Regional Strategies .................................................................................................. 23
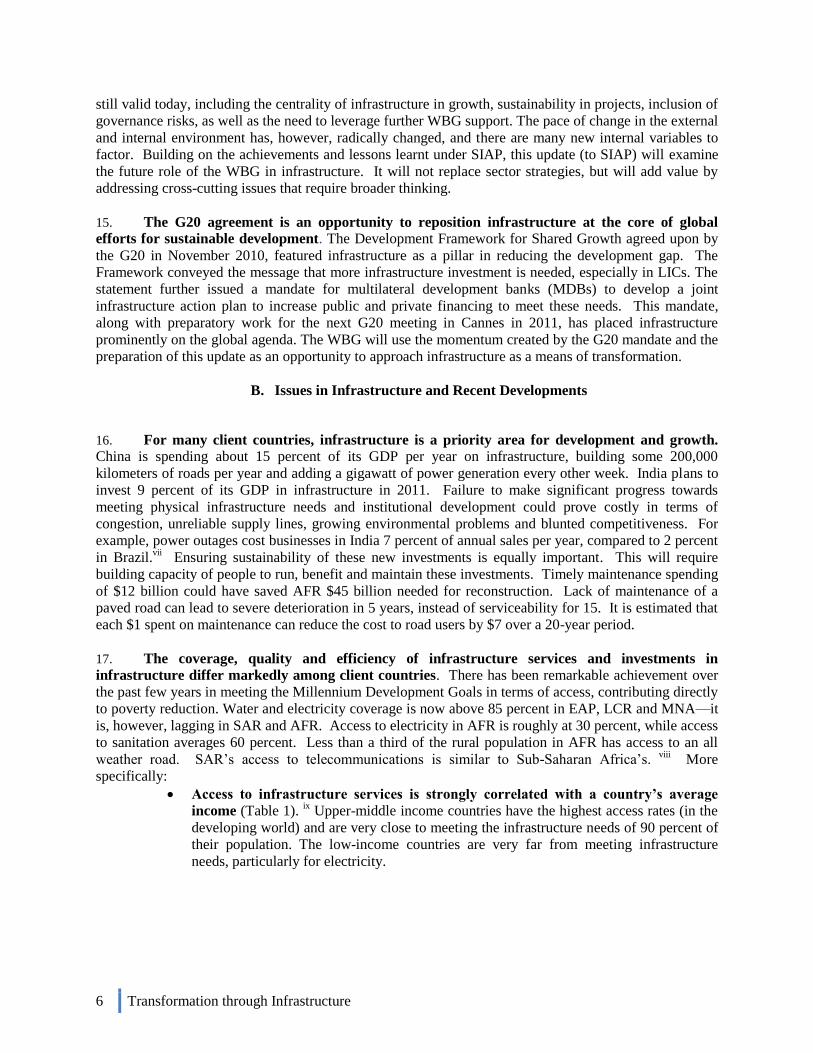
Annex 4 – Implementation of the Strategy Update – Scope ....................................................................... 24
Annex 5 – The WBG and the G20 .............................................................................................................. 28
Figures
Figure 1. WBG Infrastructure Commitments, FY00-FY14 .......................................................................... 4
Figure 2. Private investment in infrastructure (excl. ICT), FY94-09 ............................................................ 9
Figure 3. Direct leverage of IBRD/IDA projects in Energy, Transport, and ICT ....................................... 12
Tables
Table 1. Access to Utilities Services and Communication Technologies, by Income Group ....................... 7
Table 2. Crisis Severity and IBRD/IDA Lending Response in Infrastructure ............................................ 11
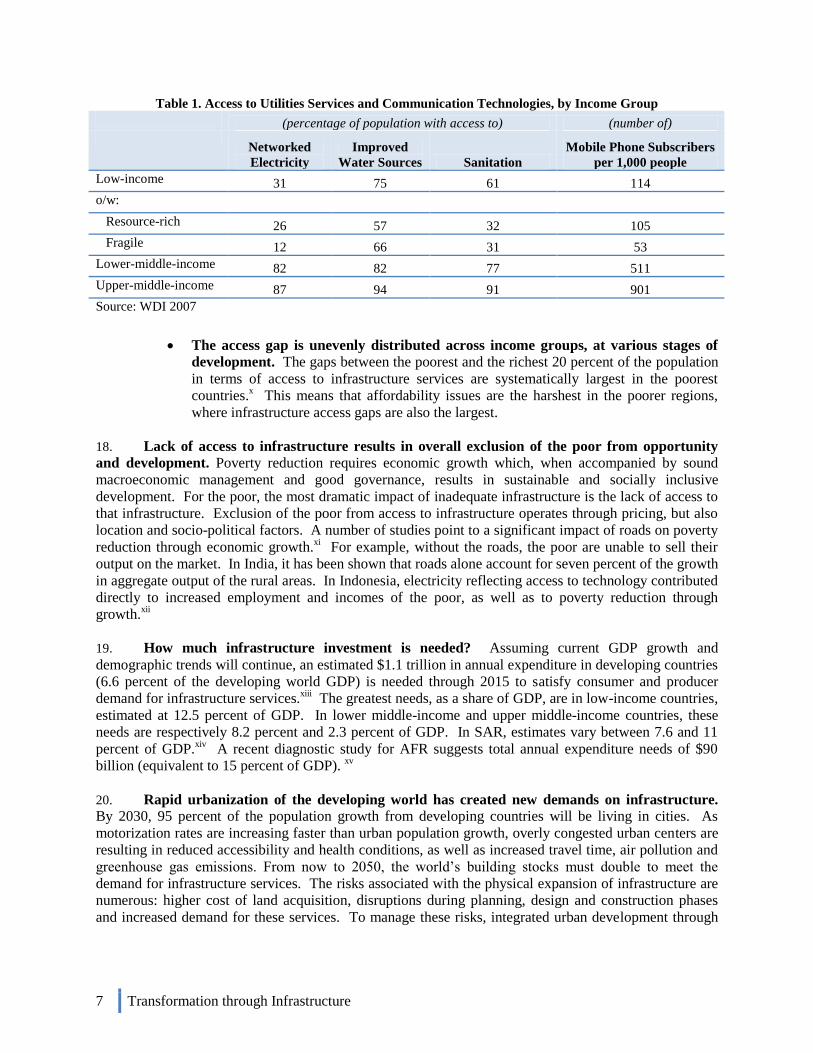
2 Transformation through Infrastructure
List of Acronyms
AAA Analytical and Advisory Assistance
ADB African Development Bank
AFD Agence Française de Développement
AFR Africa Region
CAS Country Assistance Strategy
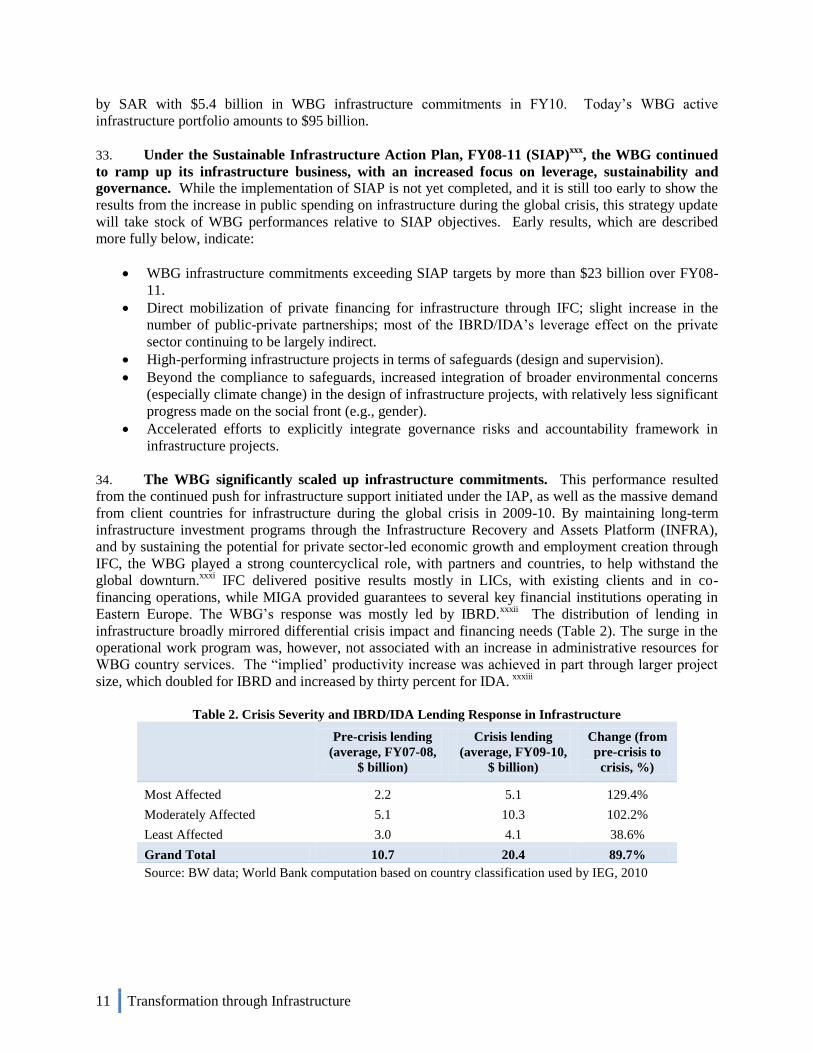
DPL Development Policy Loan
DTF Decade Trust Fund
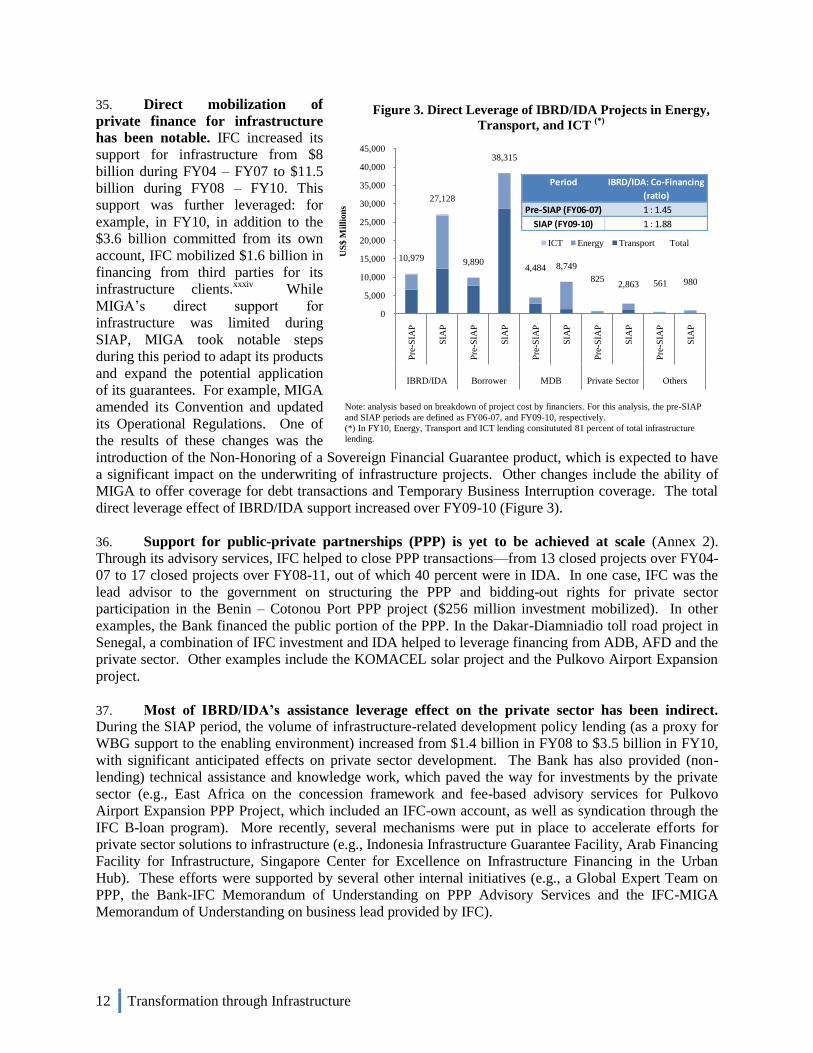
EAP East Asia & Pacific Region
GDP Gross Domestic Product
GAC Governance and Anticorruption
GEF Global Environment Facility
IBRD International Bank for Reconstruction and Development
ICT Information and Communication Technologies
IDA International Development Association
IEG Independent Evaluation Group
IFC International Finance Corporation
IFI International Finance Institutions
LCR Latin America & Caribbean Region
LIC Low-Income Countries
MDB Multilateral Development Bank
MIC Middle-Income Countries
MIGA Multilateral Investment Guarantee Agency
MNA Middle East & North Africa Region
ODA Official Development Assistance
OECD Organisation for Economic Co-operation and Development
PPP Public-Private Partnership
SAR South Asia Region
SDN Sustainable Development Network
SIAP Sustainable Infrastructure Action Plan
WBG World Bank Group
WBI World Bank Institute
WDI World Development Indicators
3 Transformation through Infrastructure
Executive Summary
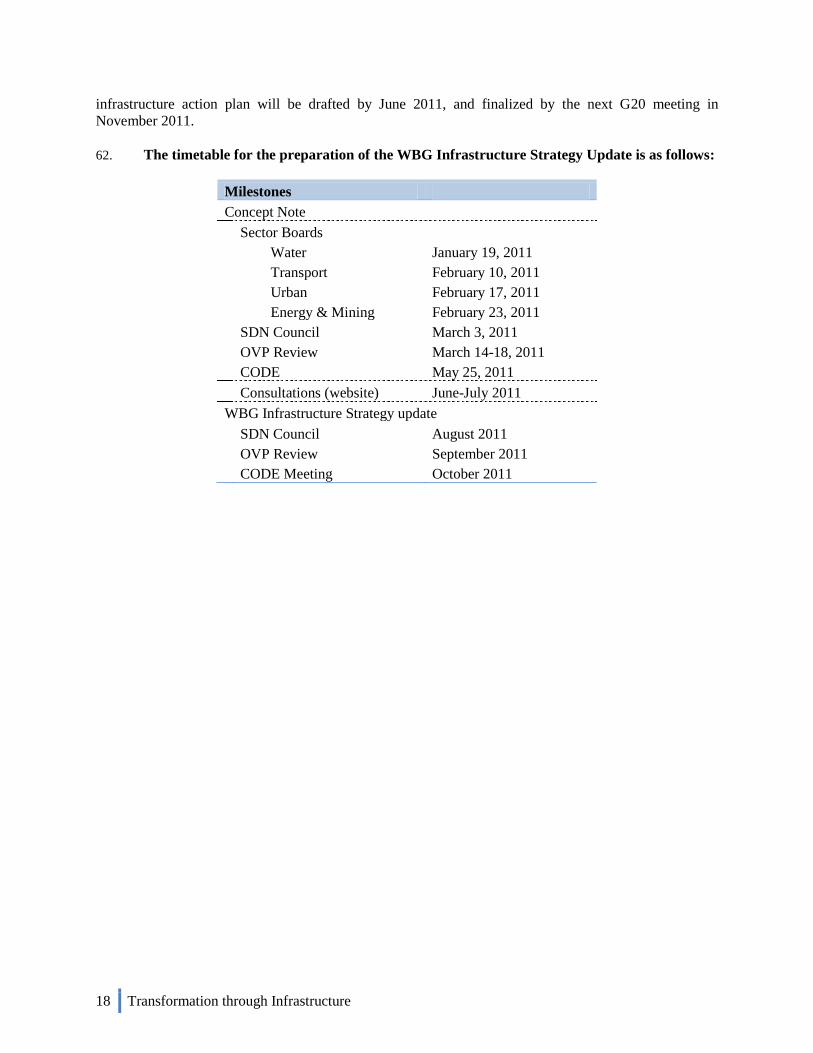
1. Infrastructure development is critical to delivering growth, reducing poverty and creating jobs.
Lessons learned from the recent global crisis also showed its significance as a powerful counter-cyclical
instrument for use by the public sector to withstand the global downturn.
2. Increasingly, infrastructure is seen as the vehicle for transforming low-income and middle-
income countries. The developmental challenges that these countries face are numerous, ranging from
rapid urbanization to catastrophic natural disasters, the threat of a changing climate and environmental
conservation goals. To address these challenges, the infrastructure sectors—water, transport, energy,
information and communications technology—have emerged as real agents of change.
3. Low- and middle-income countries share the vision that infrastructure should be scaled up, not
only with mono-sector interventions, but also with those that can and will radically transform their
economies. This vision requires shifting away from a focus on output and pure capital projects; it requires
a different mindset: for example, recognizing infrastructure as only one component of the solution;
looking at strategic synergies among infrastructure sectors, as well as other sectors, such as environment
and agriculture; utilizing a more comprehensive approach to infrastructure planning; focusing on
bottlenecks, and missing links; and looking at the whole spectrum offered by the ―how to‘s‖ in order to
optimize these investments. This vision will be encapsulated in the concept of ―transformational
infrastructure‖, which will be fully articulated in the Strategy Update.
4. Client countries continue to request support for infrastructure from the WBG; however, the nature
of their requests has become more complex, resulting in projects and engagements increasingly
sophisticated and risky (including governance). At the same time, the internal environment has been
changing: the WBG, which emerged in FY10 as the largest multilateral developmental financier in
infrastructure, faces a virtually used-up capital headroom during the global crisis and a flat administrative
budget envelope in the future.
5. Building infrastructure to create opportunities for growth, as well as to target the poor and
vulnerable, will contribute to the implementation of the WBG strategic priorities outlined in the Post-
Crisis Directions paper. Sustaining such an engagement will require leveraging the WBG‘s financial and
knowledge resources even more effectively, as well as relying more on our convening power. Moreover,
the size and complexity of the developmental challenges that infrastructure aims to address will require
looking at infrastructure financing more broadly. Pooling of resources, blending financial instruments and
capitalizing on the knowledge and new financing available from some middle-income countries will be
critical. Equally important will be working out infrastructure solutions with the private sector and other
sources, such as the Green Climate Fund.
6. By putting infrastructure back on the global agenda, the G20 meetings in Seoul and Cannes have
and will offer new opportunities to approach infrastructure as a means of transformation. The WBG was
given a prominent role in moving this agenda forward on the international scene—from coordinating the
preparation of the MDB Infrastructure Action Plan to engaging with the High-level Panel on
Infrastructure Investment established by the G20.
7. All these factors point towards the timeliness of a strategic effort aimed at examining the future
role of the WBG in infrastructure. Building on the WBG achievements under the Sustainable
Infrastructure Action Plan so far, this Concept and Issues Note will propose to continue to support the
core business of infrastructure to meet basic access needs, with an enhanced focus on transformational
infrastructure, mobilization of private capital and other sources of financing.
4 Transformation through Infrastructure
A. Context
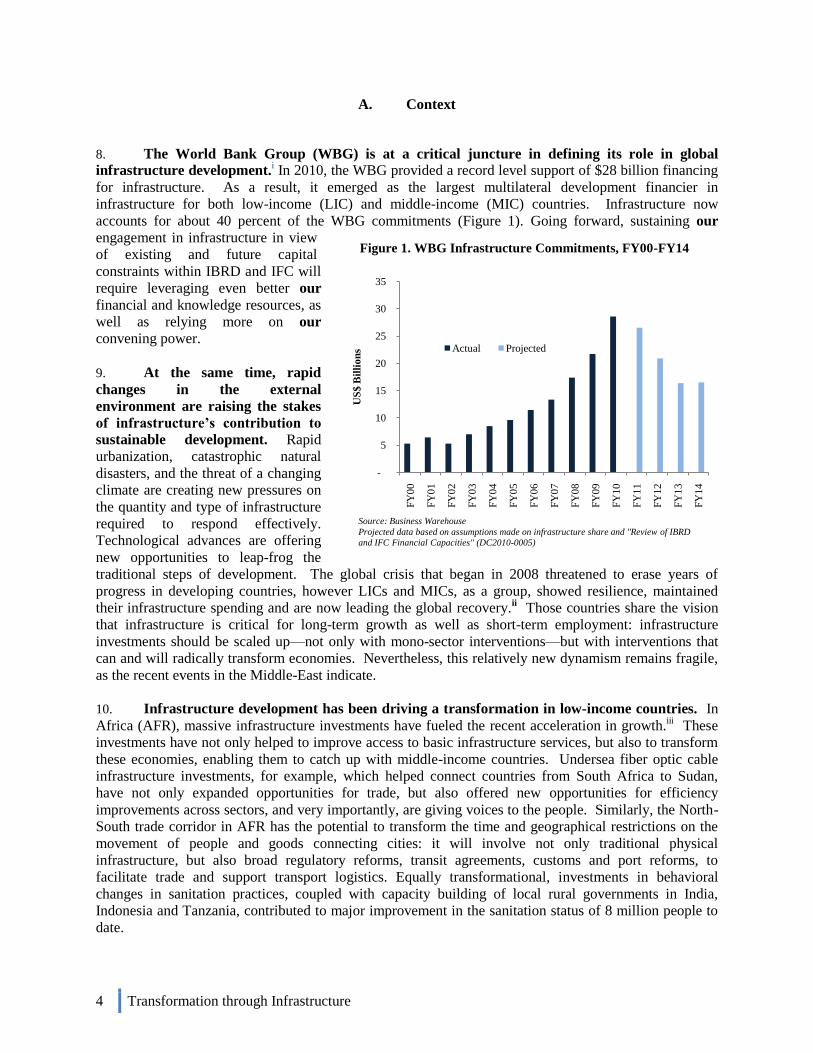
8. The World Bank Group (WBG) is at a critical juncture in defining its role in global
infrastructure development.i In 2010, the WBG provided a record level support of $28 billion financing
for infrastructure. As a result, it emerged as the largest multilateral development financier in
infrastructure for both low-income (LIC) and middle-income (MIC) countries. Infrastructure now
accounts for about 40 percent of the WBG commitments (Figure 1). Going forward, sustaining our
engagement in infrastructure in view
of existing and future capital
constraints within IBRD and IFC will
require leveraging even better our
financial and knowledge resources, as
well as relying more on our
convening power.
9. At the same time, rapid
changes in the external
environment are raising the stakes
of infrastructure’s contribution to
sustainable development. Rapid
urbanization, catastrophic natural
disasters, and the threat of a changing
climate are creating new pressures on
the quantity and type of infrastructure
required to respond effectively.
Technological advances are offering
new opportunities to leap-frog the
traditional steps of development. The global crisis that began in 2008 threatened to erase years of
progress in developing countries, however LICs and MICs, as a group, showed resilience, maintained
their infrastructure spending and are now leading the global recovery.ii Those countries share the vision
that infrastructure is critical for long-term growth as well as short-term employment: infrastructure
investments should be scaled up—not only with mono-sector interventions—but with interventions that
can and will radically transform economies. Nevertheless, this relatively new dynamism remains fragile,
as the recent events in the Middle-East indicate.
10. Infrastructure development has been driving a transformation in low-income countries. In
Africa (AFR), massive infrastructure investments have fueled the recent acceleration in growth.iii These
investments have not only helped to improve access to basic infrastructure services, but also to transform
these economies, enabling them to catch up with middle-income countries. Undersea fiber optic cable
infrastructure investments, for example, which helped connect countries from South Africa to Sudan,
have not only expanded opportunities for trade, but also offered new opportunities for efficiency
improvements across sectors, and very importantly, are giving voices to the people. Similarly, the North-
South trade corridor in AFR has the potential to transform the time and geographical restrictions on the
movement of people and goods connecting cities: it will involve not only traditional physical
infrastructure, but also broad regulatory reforms, transit agreements, customs and port reforms, to
facilitate trade and support transport logistics. Equally transformational, investments in behavioral
changes in sanitation practices, coupled with capacity building of local rural governments in India,
Indonesia and Tanzania, contributed to major improvement in the sanitation status of 8 million people to
date.
Figure 1. WBG Infrastructure Commitments, FY00-FY14
-
5
10
15
20
25
30
35
FY
00
FY
01
FY
02
FY
03
FY
04
FY
05
FY
06
FY
07
FY
08
FY
09
FY
10
FY
11
FY
12
FY
13
FY
14
US
$ B
illi
on
s Actual Projected
Source: Business Warehouse
Projected data based on assumptions made on infrastructure share and "Review of IBRD
and IFC Financial Capacities" (DC2010-0005)
5 Transformation through Infrastructure
11. Middle-income countries are bringing new perspectives on infrastructure solutions. For
example, China allocated 40 percent of its $584 billion fiscal stimulus package to rail, grids, water
infrastructure and environmental improvements. Several MICs, such as Brazil and Mexico, now have
Green Growth Strategies which support projects to transform how people travel, how the infrastructure
affects its environment and how communities, goods and locations are connected. Projects range from
public transit projects that support urban revitalization to roadway projects that increase ―location
efficiency‖, corridor efficiencies that convert single-use facilities to multiple-use corridors and smart
distribution networks. In Brazil, for example, the development of a multimodal transport corridor could
unlock the potential for private sector development by supporting a shift from road freight to combined
transport solutions. For these countries, infrastructure investments reap more than short-term political
benefits; they ensure long-term economic transformation.
12. The private sector active in infrastructure is adjusting its business model to create and
exploit synergies among sectors. The private sector has made tremendous progress in addressing
environmental stewardship and social responsibilityiv, as well as adopting integrity standards. For
example, 67 financial institutions adopted the Equator Principles, developed in 2003; international and
national protocols like the United Nations Convention against Corruption, OECD, the US Foreign
Corrupt Practices Act and the UK Anti-bribery Act, which impose higher integrity standards on
contractors, have become increasingly relevant to how international contractors conduct business. Even
more has happened recently: companies are adjusting their business model to better position themselves
to exploit synergies among sectors, and thereby develop new infrastructure solutions. Large companies,
which used to think mono-product, are diversifying their products and activities into multiple sectors. For
example, Veolia expanded its activities beyond water in transport and waste water management; Areva‘s
business no longer rests on a core nuclear pillar, it has expanded into large-scale bio-mass, wind farms
and micro-reactors. Engineering companies, such as CH2M Hill, are now offering multi-disciplinary
services that range from water, transportation and communications to nuclear and environmental areas.
13. The commonality among these three groups of WBG clients (low income countries, middle
income countries and the private sector) lies in the understanding that today’s problems are multi-
sectoral; they require a cross-cutting approach, and in some cases, integrated infrastructure
solutions. Pumping of water for irrigation, boiling water for safe drinking, recycling of waste and ICT
development, for example, are all affecting the demand for energy. Addressing this interconnectivity will
require a more comprehensive approach to project planning, supported by a long-term vision to ensure
that infrastructure solutions are sustainable. For example, hydropower development is not solely an
energy issue, but must be viewed in a river basin context and weighed against alternative uses of water.
Urban transport is not only about transport; it is also about energy efficiency and urban development.
Addressing these challenges may require looking at strategic complementarities among sectors (e.g.,
smart grid as an integrated solution where internet and energy management intersect; smart city
development combining traditional infrastructure with ICT, participatory governance, natural resources
and social capital management; green infrastructure integrating natural design into urban development).
Viewing infrastructure beyond traditional physical output towards a component connected to other
sectors, all of which can address broader development issues, will offer new opportunities for
transformational impact in our client countries.
14. This update will examine how the WBG can bring the infrastructure agenda to the next
level.v So far, the WBG‘s efforts in infrastructure have been guided by the WBG Sustainable
Infrastructure Action Plan (SIAP). vi
By providing an integrated platform for actions by the regions over
FY08-11, SIAP took more the form of a strategy than an action plan. It put infrastructure squarely at the
core of the agenda on sustainable development. The drivers of the infrastructure demand which were
identified in SIAP, such as climate change, rapid urbanization and technological change, continue to
remain relevant today. While it did not envision the global crisis, it established core principles that are
6 Transformation through Infrastructure
still valid today, including the centrality of infrastructure in growth, sustainability in projects, inclusion of
governance risks, as well as the need to leverage further WBG support. The pace of change in the external
and internal environment has, however, radically changed, and there are many new internal variables to
factor. Building on the achievements and lessons learnt under SIAP, this update (to SIAP) will examine
the future role of the WBG in infrastructure. It will not replace sector strategies, but will add value by
addressing cross-cutting issues that require broader thinking.
15. The G20 agreement is an opportunity to reposition infrastructure at the core of global
efforts for sustainable development. The Development Framework for Shared Growth agreed upon by
the G20 in November 2010, featured infrastructure as a pillar in reducing the development gap. The
Framework conveyed the message that more infrastructure investment is needed, especially in LICs. The
statement further issued a mandate for multilateral development banks (MDBs) to develop a joint
infrastructure action plan to increase public and private financing to meet these needs. This mandate,
along with preparatory work for the next G20 meeting in Cannes in 2011, has placed infrastructure
prominently on the global agenda. The WBG will use the momentum created by the G20 mandate and the
preparation of this update as an opportunity to approach infrastructure as a means of transformation.
B. Issues in Infrastructure and Recent Developments
16. For many client countries, infrastructure is a priority area for development and growth. China is spending about 15 percent of its GDP per year on infrastructure, building some 200,000
kilometers of roads per year and adding a gigawatt of power generation every other week. India plans to
invest 9 percent of its GDP in infrastructure in 2011. Failure to make significant progress towards
meeting physical infrastructure needs and institutional development could prove costly in terms of
congestion, unreliable supply lines, growing environmental problems and blunted competitiveness. For
example, power outages cost businesses in India 7 percent of annual sales per year, compared to 2 percent
in Brazil.vii
Ensuring sustainability of these new investments is equally important. This will require
building capacity of people to run, benefit and maintain these investments. Timely maintenance spending
of $12 billion could have saved AFR $45 billion needed for reconstruction. Lack of maintenance of a
paved road can lead to severe deterioration in 5 years, instead of serviceability for 15. It is estimated that
each $1 spent on maintenance can reduce the cost to road users by $7 over a 20-year period.
17. The coverage, quality and efficiency of infrastructure services and investments in
infrastructure differ markedly among client countries. There has been remarkable achievement over
the past few years in meeting the Millennium Development Goals in terms of access, contributing directly
to poverty reduction. Water and electricity coverage is now above 85 percent in EAP, LCR and MNA—it
is, however, lagging in SAR and AFR. Access to electricity in AFR is roughly at 30 percent, while access
to sanitation averages 60 percent. Less than a third of the rural population in AFR has access to an all
weather road. SAR‘s access to telecommunications is similar to Sub-Saharan Africa‘s. viii
More
specifically:
Access to infrastructure services is strongly correlated with a country’s average
income (Table 1). ix Upper-middle income countries have the highest access rates (in the
developing world) and are very close to meeting the infrastructure needs of 90 percent of
their population. The low-income countries are very far from meeting infrastructure
needs, particularly for electricity.
7 Transformation through Infrastructure
Table 1. Access to Utilities Services and Communication Technologies, by Income Group
(percentage of population with access to) (number of)
Networked
Electricity
Improved
Water Sources Sanitation
Mobile Phone Subscribers
per 1,000 people
Low-income 31 75 61 114
o/w:
Resource-rich 26 57 32 105
Fragile 12 66 31 53
Lower-middle-income 82 82 77 511
Upper-middle-income 87 94 91 901
Source: WDI 2007
The access gap is unevenly distributed across income groups, at various stages of
development. The gaps between the poorest and the richest 20 percent of the population
in terms of access to infrastructure services are systematically largest in the poorest
countries.x This means that affordability issues are the harshest in the poorer regions,
where infrastructure access gaps are also the largest.
18. Lack of access to infrastructure results in overall exclusion of the poor from opportunity
and development. Poverty reduction requires economic growth which, when accompanied by sound
macroeconomic management and good governance, results in sustainable and socially inclusive
development. For the poor, the most dramatic impact of inadequate infrastructure is the lack of access to
that infrastructure. Exclusion of the poor from access to infrastructure operates through pricing, but also
location and socio-political factors. A number of studies point to a significant impact of roads on poverty
reduction through economic growth.xi For example, without the roads, the poor are unable to sell their
output on the market. In India, it has been shown that roads alone account for seven percent of the growth
in aggregate output of the rural areas. In Indonesia, electricity reflecting access to technology contributed
directly to increased employment and incomes of the poor, as well as to poverty reduction through
growth.xii
19. How much infrastructure investment is needed? Assuming current GDP growth and
demographic trends will continue, an estimated $1.1 trillion in annual expenditure in developing countries
(6.6 percent of the developing world GDP) is needed through 2015 to satisfy consumer and producer
demand for infrastructure services.xiii
The greatest needs, as a share of GDP, are in low-income countries,
estimated at 12.5 percent of GDP. In lower middle-income and upper middle-income countries, these
needs are respectively 8.2 percent and 2.3 percent of GDP. In SAR, estimates vary between 7.6 and 11
percent of GDP.xiv
A recent diagnostic study for AFR suggests total annual expenditure needs of $90
billion (equivalent to 15 percent of GDP). xv
20. Rapid urbanization of the developing world has created new demands on infrastructure. By 2030, 95 percent of the population growth from developing countries will be living in cities. As
motorization rates are increasing faster than urban population growth, overly congested urban centers are
resulting in reduced accessibility and health conditions, as well as increased travel time, air pollution and
greenhouse gas emissions. From now to 2050, the world‘s building stocks must double to meet the
demand for infrastructure services. The risks associated with the physical expansion of infrastructure are
numerous: higher cost of land acquisition, disruptions during planning, design and construction phases
and increased demand for these services. To manage these risks, integrated urban development through
8 Transformation through Infrastructure
infrastructure planning will be critical to ensure that what is built and where it is built enables these cities
to function as efficient centers of growth.
21. With the global threat of climate change, there is an increasing demand for infrastructure
that is more resilient, less damaging to the environment and supportive of a sustainable
development path. The changing climate will exacerbate the intensity of natural disasters, with
immediate impact on the quantity and quality of infrastructure. At the same time, the climate change
agenda has given a new impetus to the infrastructure sectors by positioning them as vehicles to drive the
solution. This awareness has translated into a multitude of ―green‖ (e.g., MNA concentrating solar power
project, Egypt‘s wind power project) and adaptation projects (e.g., disaster risk management, construction
of artificial reefs, coastal zone management, relocation of sections of roads and rail lines inland). Other
projects have also helped support the transition towards a more sustainable development path (e.g.,
Mexico‘s urban transport transformation program). Yet challenges remain: they range from designing
and planning infrastructure projects under uncertainty to managing the costs and returns of alternative
technologies.xvi
22. Technological advances offer new opportunities to leap-frog. New mobile technologies, fiber
optics and satellite systems are all expected to make a significant difference in the search for efficiency
and improved demand management in infrastructure sectors; they will be used for the control of
electricity networks, remote metering of water use, road capacity utilization and better public transport
logistics.xvii
Other technologies also have significant potential: biotechnology in water treatment, fuel
technology in land transport and carbon sequestration in power generation. Research into multi-fuelled
vehicles, fuel cells, bio-fuels, hydrogen-based fuels and electric batteries will surely prove valuable as we
face shortages in more traditional fuels, and may also result in drastic reductions in the environmental
impact of road transport. Technological advances now allow small-scale renewable-based generation as
well as other forms of distributed generation, such as small-scale fossil-fuel-based co-generation plants
and fuel cells.
23. What is the cost of these new infrastructure solutions? In some cases, new technology will
contribute to reducing the cost of infrastructure solutions. For example, advances in desalination
technology have already brought the price of clean water to levels not too far removed from traditional
sources of waters (e.g., water pumped from rivers). Some analyses based on marginal cost abatement
curves also suggest that the bulk of the greenhouse gas emissions reduction can be achieved by
infrastructure solutions that are not dependent on new and costly technology (e.g., meter installation, CFL
installation, biogas and replacement of street light sensors). xviii
In other cases, however, the cost of new
infrastructure solutions, such as ―green‖ and ―clean‖ investments, may be much higher than that of
traditional infrastructure.xix
24. Traditionally, the bulk of infrastructure services is provided and funded by the public
sector. The global financial crisis in 2008 provided an additional impetus to public spending on
infrastructure. Lessons from previous crises (particularly in East Asia) highlighted the importance of
maintaining infrastructure public spending in times of crises.xx
In 2008, increased public spending on
infrastructure was seen as an important way of restoring short- to medium-term growth through public
works.xxi
In LICs and MICs, about half of the fiscal stimulus packages featured infrastructure
investments, compared to 15 percent in developed countries.xxii
Thanks to the robust domestic counter-
cyclical fiscal response, which allowed vital spending in infrastructure to be preserved, and their weaker
linkages to the global economy, the direct impact of the crisis was limited in LICs. Some MICs, such as
Mexico, were more affected, in fact, by the global crisis than LICs.
9 Transformation through Infrastructure
25. In many low-income countries, public infrastructure investments do not generate the
largest high growth dividends due to institutional deficiencies in the investment process.xxiii In spite
of concerted and accelerated efforts towards institutional, regulatory and administrative reform in
infrastructure over the last decade, the reform process is only halfway along in AFR.xxiv
Institutional
reforms are not only required to tackle utilities‘ operational inefficiencies, but also to strengthen the
planning functions of the line ministries and address serious deficiencies in the budgetary process. The
―efficiency gap‖ in infrastructure spending by the public sector has been estimated at 3 percent of GDP
(or $17 billion relative to estimated total infrastructure needs of $93 billion). In other terms, subsidies to
financing in the sector could be cut significantly if the public sector were better managed, less subject to
corruption and if users were charged for the cost of the services they receive. xxv
Other challenges in LICs
include:
Restoring the fiscal space and rebuilding reserves without compromising the need for
continued growth in real spending. Countries will have to be savvy about how they
continue to finance the scale-up in infrastructure.
In resource-rich countries, focusing infrastructure investments on broader
transformational developmental objectives, instead of short-term gains. Private extractive
industries can play a key role in financing the supporting infrastructure (e.g., Liberia,
with potential contribution of the mining industry to rail, power and ports development).
In 2008, extractive rents from oil, gas and selected minerals amounted to an estimated 4.3
trillion, representing over 7 percent of the global GDP, while annual extractive
investments only totaled 0.57 trillion.
26. Low-income countries, where the
investment needs are the largest have the
most difficulties attracting private capital. Private investments in infrastructure
(excluding ICT) declined over the past five
years (Figure 2). The quality of the enabling
environment, the lack of demand from client
countries for public-private partnerships
(PPPs) and capacity to handle the public-
private sector interface, are all seriously
impeding private sector investments. The
most immediate constraint, however, remains
the lack of a pipeline of technically ready and
financially viable projects. Multi-donor
efforts have helped establish various facilities
and funds to promote the development of
infrastructure projects with the private sector,
but their fragmented approach, coupled with poor and insufficient targeting of funds for project
preparation, are seriously undermining infrastructure investments (this applies equally to publicly and
privately funded projects).xxvi
27. Middle-income countries bring fresh experience and financing to meet infrastructure needs. MICs, such as China and Brazil, have knowledge to share in terms of planning to ensure the coherence
and sustainability of infrastructure investments and linking them up to maximize multiplier effects on
other sectors. For example, when building a port, they also build roads and railways leading to the port.
The challenges in infrastructure that MICs face range from reaching the remaining un-served population,
requiring a different approach than the one used to provide access to infrastructure services to the
majority of the population, to ensuring that projects actually transform their economies and enable them
0%
1%
2%
3%
4%
5%
6%
7%
8%
9%
0
10
20
30
40
50
60
70
80
90
100Total (MICs & LICs)
Commitments to LICs as % of Total
Source: World Bank, Private Participation in Infrastructure Project database
Figure 2. Private Investment in Infrastructure (excl.
ICT), FY94-09
10 Transformation through Infrastructure
to develop in a more sustainable way. Besides knowledge, these new development partners can offer
funding as well. For example, financing for infrastructure from China, India and the Arab funds
increased from $1 billion in 2004 to $8 billion in 2008 in resource-rich African countries.
28. Middle-income countries that experienced the fastest economic growth were also those most
capable of attracting private capital and other sources of financing (e.g., India, Brazil and the
Philippines). In 2010, MICs attracted eighty-five percent of private investments flows in infrastructure.
In some regions, new infrastructure funds and facilities backed by private capital (and government
guarantees) were established, emerging as important vehicles for infrastructure financing (e.g., India –
Infrastructure Finance Company Limited). Additionally, these countries were the primary beneficiaries of
climate-related funds (e.g., Clean Technology Funds, Climate Investment Funds), as well as new sources
of funding (e.g., pension and insurance companies in LCR). If non-public financing of infrastructure has
emerged as a critical component of the infrastructure provision in MICs, it is currently flowing to only a
few sectors (e.g., in LCR to telecommunications, electricity, some highways and ports, but very little in
terms of water, wastewater and urban mass transit).
29. Official Development Assistance (ODA) is likely to represent a smaller financing source for
infrastructure. Bilateral ODA for infrastructure financing accounted for $21 billion in 2008
(OECD/DAC). Fiscal austerity in donor countries will likely impact overall ODA, leading to a significant
shift in thinking about effective spending. All international financial institutions responded strongly to
the crisis and posted the largest-ever financial flows to the developing world, though the total amounts
from the IMF and WBG are much larger than those of other IFIs. Specifically for infrastructure, total
multilateral ODA amounted to $67 billion in FY09—a level that is unlikely to be sustained going
forward.
30. Going forward, the challenge in infrastructure will be to reconcile multiple opposing forces. On the one hand, it will be necessary to meet a growing demand for infrastructure which responds more
flexibly and rapidly to external pressures (e.g., climate change, disasters, urbanization, technological
change, with choices that can be sustained over the long term). On the other hand, the financial
architecture for infrastructure is rapidly evolving: the WBG is unlikely to sustain the level of
infrastructure commitments deployed during the last two years. Many countries are operating in a fiscally
constrained (and sometimes inefficient) public sector, and the private sector has been hesitant to take risks
in some sectors/countries. Non-traditional development partners—mostly from middle-income
countries—have emerged, bringing new perspectives to scaling up infrastructure.
C. WBG’s Track Record in Infrastructure – Preliminary Findings
31. In 2003, the World Bank committed to re-engage in infrastructure following its withdrawal
during the 1990s. At the end of the 1990s, infrastructure lending reached a low level of $5.2 billion.
This de-emphasis on infrastructure in the 1990s was in part deliberate—not only the result of pressures
from Non-Governmental Organizations to disengage from large and complex infrastructure projects and
the belief that the private sector could provide the bulk of the financing, but also the result of an
institutional shift towards poverty and social agendas. The Infrastructure Action Plan, FY03-07 (IAP)xxvii
provided a solid rationale for the World Bank to re-engage in transport, energy, water, ICT and urban
projects. xxviii
The surge in the operational work program was accompanied by a significant increase in
administrative resources for project preparation.
32. The increase in infrastructure commitments was sustained over the years, across all regions,
especially in AFR. In AFR, WBG infrastructure commitments increased from $1.5 billion in FY03 to
$8.1 billion in FY10 (Annex 1).xxix
LCR emerged as the second largest region with $6.5 billion, followed
11 Transformation through Infrastructure
by SAR with $5.4 billion in WBG infrastructure commitments in FY10. Today‘s WBG active
infrastructure portfolio amounts to $95 billion.
33. Under the Sustainable Infrastructure Action Plan, FY08-11 (SIAP)xxx
, the WBG continued
to ramp up its infrastructure business, with an increased focus on leverage, sustainability and
governance. While the implementation of SIAP is not yet completed, and it is still too early to show the
results from the increase in public spending on infrastructure during the global crisis, this strategy update
will take stock of WBG performances relative to SIAP objectives. Early results, which are described
more fully below, indicate:
WBG infrastructure commitments exceeding SIAP targets by more than $23 billion over FY08-
11.
Direct mobilization of private financing for infrastructure through IFC; slight increase in the
number of public-private partnerships; most of the IBRD/IDA‘s leverage effect on the private
sector continuing to be largely indirect.
High-performing infrastructure projects in terms of safeguards (design and supervision).
Beyond the compliance to safeguards, increased integration of broader environmental concerns
(especially climate change) in the design of infrastructure projects, with relatively less significant
progress made on the social front (e.g., gender).
Accelerated efforts to explicitly integrate governance risks and accountability framework in
infrastructure projects.
34. The WBG significantly scaled up infrastructure commitments. This performance resulted
from the continued push for infrastructure support initiated under the IAP, as well as the massive demand
from client countries for infrastructure during the global crisis in 2009-10. By maintaining long-term
infrastructure investment programs through the Infrastructure Recovery and Assets Platform (INFRA),
and by sustaining the potential for private sector-led economic growth and employment creation through
IFC, the WBG played a strong countercyclical role, with partners and countries, to help withstand the
global downturn.xxxi
IFC delivered positive results mostly in LICs, with existing clients and in co-
financing operations, while MIGA provided guarantees to several key financial institutions operating in
Eastern Europe. The WBG‘s response was mostly led by IBRD.xxxii
The distribution of lending in
infrastructure broadly mirrored differential crisis impact and financing needs (Table 2). The surge in the
operational work program was, however, not associated with an increase in administrative resources for
WBG country services. The ―implied‘ productivity increase was achieved in part through larger project
size, which doubled for IBRD and increased by thirty percent for IDA. xxxiii
Table 2. Crisis Severity and IBRD/IDA Lending Response in Infrastructure
Pre-crisis lending
(average, FY07-08,
$ billion)
Crisis lending
(average, FY09-10,
$ billion)
Change (from
pre-crisis to
crisis, %)
Most Affected 2.2 5.1 129.4%
Moderately Affected 5.1 10.3 102.2%
Least Affected 3.0 4.1 38.6%
Grand Total 10.7 20.4 89.7%
Source: BW data; World Bank computation based on country classification used by IEG, 2010
12 Transformation through Infrastructure
35. Direct mobilization of
private finance for infrastructure
has been notable. IFC increased its
support for infrastructure from $8
billion during FY04 – FY07 to $11.5
billion during FY08 – FY10. This
support was further leveraged: for
example, in FY10, in addition to the
$3.6 billion committed from its own
account, IFC mobilized $1.6 billion in
financing from third parties for its
infrastructure clients.xxxiv
While
MIGA‘s direct support for
infrastructure was limited during
SIAP, MIGA took notable steps
during this period to adapt its products
and expand the potential application
of its guarantees. For example, MIGA
amended its Convention and updated
its Operational Regulations. One of
the results of these changes was the
introduction of the Non-Honoring of a Sovereign Financial Guarantee product, which is expected to have
a significant impact on the underwriting of infrastructure projects. Other changes include the ability of
MIGA to offer coverage for debt transactions and Temporary Business Interruption coverage. The total
direct leverage effect of IBRD/IDA support increased over FY09-10 (Figure 3).
36. Support for public-private partnerships (PPP) is yet to be achieved at scale (Annex 2).
Through its advisory services, IFC helped to close PPP transactions—from 13 closed projects over FY04-
07 to 17 closed projects over FY08-11, out of which 40 percent were in IDA. In one case, IFC was the
lead advisor to the government on structuring the PPP and bidding-out rights for private sector
participation in the Benin – Cotonou Port PPP project ($256 million investment mobilized). In other
examples, the Bank financed the public portion of the PPP. In the Dakar-Diamniadio toll road project in
Senegal, a combination of IFC investment and IDA helped to leverage financing from ADB, AFD and the
private sector. Other examples include the KOMACEL solar project and the Pulkovo Airport Expansion
project.
37. Most of IBRD/IDA’s assistance leverage effect on the private sector has been indirect. During the SIAP period, the volume of infrastructure-related development policy lending (as a proxy for
WBG support to the enabling environment) increased from $1.4 billion in FY08 to $3.5 billion in FY10,
with significant anticipated effects on private sector development. The Bank has also provided (non-
lending) technical assistance and knowledge work, which paved the way for investments by the private
sector (e.g., East Africa on the concession framework and fee-based advisory services for Pulkovo
Airport Expansion PPP Project, which included an IFC-own account, as well as syndication through the
IFC B-loan program). More recently, several mechanisms were put in place to accelerate efforts for
private sector solutions to infrastructure (e.g., Indonesia Infrastructure Guarantee Facility, Arab Financing
Facility for Infrastructure, Singapore Center for Excellence on Infrastructure Financing in the Urban
Hub). These efforts were supported by several other internal initiatives (e.g., a Global Expert Team on
PPP, the Bank-IFC Memorandum of Understanding on PPP Advisory Services and the IFC-MIGA
Memorandum of Understanding on business lead provided by IFC).
10,979
27,128
9,890
38,315
4,484 8,749
8252,863 561 980
0
5,000
10,000
15,000
20,000
25,000
30,000
35,000
40,000
45,000
Pre
-SIA
P
SIA
P
Pre
-SIA
P
SIA
P
Pre
-SIA
P
SIA
P
Pre
-SIA
P
SIA
P
Pre
-SIA
P
SIA
P
IBRD/IDA Borrower MDB Private Sector Others
US
$ M
illi
on
s
ICT Energy Transport Total
Note: analysis based on breakdown of project cost by financiers. For this analysis, the pre-SIAP
and SIAP periods are defined as FY06-07, and FY09-10, respectively.
(*) In FY10, Energy, Transport and ICT lending consitututed 81 percent of total infrastructure
lending.
IBRD/IDA: Co-Financing
(ratio)
Pre-SIAP (FY06-07) 1 : 1.45
SIAP (FY09-10) 1 : 1.88
Period
Figure 3. Direct Leverage of IBRD/IDA Projects in Energy,
Transport, and ICT (*)
13 Transformation through Infrastructure
38. In terms of safeguards performance, infrastructure projects ranked higher than many
Bank projects. A recent IEG evaluation showed that the environmental and social impacts, and risks
associated with infrastructure projects (especially category A), were appropriately identified during
preparation and appraisal, and that resources were in most cases appropriately allocated at supervision to
mitigate the risks.xxxv
Nonetheless, evolving needs in WBG client countries mandate updating and
consolidating the environmental and social safeguard policies of IBRD and IDA, a task recently initiated
by WBG Management.
39. Beyond the compliance to safeguards, there has been notable progress on integrating the
environmental agenda in project design, but relatively less significant progress on the social
agenda.xxxvi
The strategic repositioning of the WBG around climate change percolated down to project
design. Infrastructure projects have increasingly integrated not only climate change mitigation and
adaptation considerations in their design, but also other environmental factors. For example, a larger
proportion of transport projects in FY10 relative to FY06 addressed considerations, such as water quality,
biodiversity loss and change in land use. In terms of the social agenda, more energy projects, for
example, have incorporated impact analysis on poverty, identified the income status of beneficiaries and
adopted a poverty-responsive monitoring and evaluation framework during the SIAP period than in
FY06-07. Gender-mainstreaming efforts in infrastructure sectors were recently accelerated with the
recent adoption of ambitious gender targets for IBRD and IDA projects—with, for example, a 100 percent
target for gender-responsive analysis over FY12-14 (compared to a current average of 30 percent over
FY07-09).
40. Support for sustainability is reflected in the composition of the WBG infrastructure
portfolio. The most notable structural shift in the composition of the WBG portfolio has been in ―low-
carbon‖ projects, which reached a record high of $5.5 billion in FY10 (40 percent of the energy portfolio),
with renewable energy accounting for 75 percent of IFC‘s power projects in FY10. While highways and
roads remain the dominant business line in transport, the biggest increase in business over the last three
years has been in railways, urban transport and port development. For example, in FY10, there was a
record high $4.9 billion committed by the WBG for urban transport projects, with a continued rise in the
number of projects using bus-rapid transit investments to address the green agenda. Another important
component of sustainability efforts has been the increased support for ex-ante disaster risk management
and ex-post reconstruction of infrastructure as well as cross-border projects for regional integration.xxxvii
41. Knowledge work also reflected a greater concern for environmental issues. The Bank has
produced several pieces on the impact of climate change (e.g., Transport and Climate Change, Water and
Climate Change). For example, seven low-carbon studies were produced over the past few years,
demonstrating the importance of a holistic approach to infrastructure, with a closer link to other sectors,
such as environment.
42. Progress on system-level thinking about infrastructure has appeared in WBG knowledge
work as well. Over the past few years, the Bank has produced a number of large, more holistic pieces on
infrastructure (e.g., EAP - Connecting East Asia - A New Framework for Infrastructure; AFR – A Time
of Transformation). Although costly, these large pieces often had a major transformational impact on the
dialogue with, or support to, client countries. For example, the EAP work provided the analytical
underpinning for a series of Infrastructure DPLs for Indonesia. The AFR work provided the first-ever
detailed information set on infrastructure needs and actual spending in AFR countries; its methodology is
now being used for a similar assessment in SAR. These findings will feed into the global assessment of
infrastructure needs and spending—a deliverable for the next G20. Finally, a clear lesson from the recent
global crisis is the vital importance of being up-to-date on country diagnostic work in key areas and
public expenditure on order to support the prioritization of sector interventions (e.g., infrastructure
diagnostic tools, power sector vulnerability assessments, urbanization review). While the knowledge
14 Transformation through Infrastructure
work is often seen as the Bank‘s comparative advantage, its cost-effectiveness and leverage effect can be
improved.
43. Lastly, efforts to tackle governance risks in infrastructure projects accelerated since the
endorsement of the 2008 Governance and Anticorruption Strategy. Large infrastructure projects are
especially vulnerable to rent-seeking opportunities and integrity risks, including procurement,
transparency and accountability. While fraud and corruption take on several forms, civil works are
particularly susceptible.xxxviii
An assessment of FY08 projects established a baseline for further
improvements – 29 percent of water projects were either ‗very responsive‘ or ‗somewhat responsive‘ to
the GAC agenda; 42 percent for transport, 46 percent for energy, compared to 46 percent Bank-wide.
Since 2008, support to task teams on governance was strengthened – 30 good practice notes were issued,
just-in-time technical assistance to task teams was provided to 9 projects and sourcebooks on GAC in
energy, transport and water sectors were issued. The Operational Risk Assessment Framework,
introduced in 2010, enhanced attention to sector governance risks and mitigation during appraisal.
44. More broadly, Bank support for ―soft infrastructure‖ doubled during the SIAP period (share of DPLs with infrastructure components in total Bank infrastructure commitments acts as a proxy).
A key constraint in infrastructure development has been the difficulty in achieving or maintaining policy
and institutional reforms. Improvement in the efficiency of pricing, along with effective and independent
regulators, can function as a powerful counterweight to governance problems stemming from exclusive
public sector control over important resources.xxxix
In practice, price reform has been one of the thorniest
issues for policy-makers. Reforms to maximize private sector participation in infrastructure (restructuring,
privatization, and deregulation) have often been critical to expedite service expansion in a variety of
sectors and countries. For example, regulatory reforms have played a key role in enabling private sector
investment in the ICT sector globally. Lessons learnt from Bank support show that support for physical
infrastructure has often been an easier entry point for dialogue with client countries than institutional
reforms (visibility and salability for politicians). Yet, an IFC-led survey of private companies showed
that eighty percent of the respondents viewed support for the enabling environment as the area where the
Bank and IFC‘s comparative advantage lies.
D. Scope, Objectives and Methodology
45. While client countries continue to request infrastructure support from the WBG, the nature
of some of those requests has become more complex. Building support for infrastructure will
contribute to the implementation of the Strategic Priorities outlined in the Post-Crisis Directions paper in
terms of creating opportunities for growth and targeting the poor and vulnerable.xl At the country level,
this has translated into a continued demand for basic infrastructure to meet access needs. In addition, for
a growing number of client countries, there has been an increasing demand for more sophisticated and
riskier infrastructure programs. For example, in the past, clients would ask the WBG to finance a line of a
mass transit system. They now look for guidance on how to drive demographic trends and land values,
and to reduce urban congestion and emissions through integrated mass transit programs. Clients who
formerly sought WBG assistance to finance power generation plants now in addition often ask for
guidance on greening their generation matrices by establishing regulatory incentives and accessing carbon
credits for renewable energy.
46. This evolution in the demand from client countries reflects a paradigm shift towards
infrastructure projects that transform economies to make them more sustainable. Traditionally,
infrastructure investments consisted of capital projects, which focus on outputs (e.g., building a road to
provide x number of kilometers or building a power plant to generate x number of kilowatts).
Increasingly, infrastructure projects aim to address much broader developmental issues (e.g., rapid
15 Transformation through Infrastructure
urbanization, mitigation of greenhouse gas emissions, resilience to disasters or environmental
conservation), and thus require a different mindset: addressing the ultimate issue requires looking at
connectivity among infrastructure sectors, as well as other sectors, such as environment and agriculture;
infrastructure being only one component of the solution; needing a more comprehensive approach to
infrastructure planning; designing infrastructure solutions for long-term sustainability. The strategy
update will label this approach ―transformational infrastructure‖. It is a departure from traditional
infrastructure projects; for example, from simple roads projects towards transportation programs that
place networks in the context of territorial development; towards transport projects that encourage the
shift towards lower emitting modes; designing energy efficiency projects that facilitate access;
transforming highway projects to ones that become more strategic/clean logistics projects; facilitating
urban transport projects to become urban sustainability programs; building urban structures more resilient
to flooding and earthquakes, or that are stretched to become green; and regional projects.
47. While the strategy update will refine the concept of transformational infrastructure, several
examples can be used to illustrate the concept. By addressing the challenges of risk allocation among
the public and private sector, institutional reforms for PPPs in India unlocked the potential for private
investment for infrastructure (Annex 2). By building the missing link between two roads, the Padma
Bridge in Bangladesh will reduce the distance to major urban centers like Dhaka, and transform the lives
of nearly 30 million people. By linking ICT investments with grid and demand management, commercial
and utility losses of the electricity company, NDPL in India will be dramatically cut, with a major impact
on the sustainability and quality of services. ICT will also be used to improve accountability in cities
(Open Government in Mexico). By transforming waste into energy with minimal environmental impacts
and using sub-products for road improvements, a ―green‖ project opens up new opportunities for the
construction of roads.
48. As a result of these new demands, the structure of the WBG response has been more
complex. Whereas in the past, the WBG response was often a loan that produced an asset, increasingly
the WBG is called upon to address infrastructure constraints through a blend of instruments, including
investment lending and credits, policy lending, carbon finance, GEF grants and technical and economic
advice. For example, the Mexico‘s urban transport transformation program will be financed by a $200
million IBRD loan, a $200 million CTF concessional loan and may receive $50 million revenue from
carbon markets. The private sector is another important source for infrastructure financing. New
development partners are also available to complement or substitute for more traditional financiers.
Although more complex, combining sources of financing and relying on a blend of financial instruments
will be required to address the sizeable challenges that ‗transformational‖ infrastructure aims to tackle.
49. The objective of this strategy update is three-fold: (1) to articulate further the WBG‘s vision
on infrastructure and the core messages on transformational infrastructure (and associated financing) for
both internal and external audiences, positioning the WBG on infrastructure in international fora such as
next G20 Summit and Rio plus 20; (2) to explore how the WBG can best support its client countries and
(3) to challenge the status quo, identify internal roadblocks and propose actions to support the
implementation of the strategy.
50. The strategy update will build on the solid strategic foundations established in every single
infrastructure sector. There are recent new or updated strategies for the major infrastructure sectors, as
well as for related sectors such as urban development and the environment. The WBG recently updated
its transport and water sector strategies, and is finalizing new energy and ICT strategies, as well as the
trade strategy (Annex 3). These strategies provide the platform for WBG‘s engagement at the sector
level.
16 Transformation through Infrastructure
51. This update will be more than the sum of individual sector strategies; it will highlight
external and internal issues that cut across sectors and cannot be easily handled at the sector level, such as
project preparation, mobilization of private capital and public-private partnerships, and procurement. The
update will be based on the premise that infrastructure investments should unlock synergies among
sectors.
52. The thrust of SIAP remains valid—Infrastructure must continue to be a prominent part of
the sustainable development agenda, whether for delivering growth, poverty reduction, job
opportunities or for addressing broader developmental challenges. Needs of our client countries are
of such nature, magnitude and growing complexity that the WBG will continue to play a role in the
provision of infrastructure in terms of financing, knowledge and convening power. The guiding
principles of the infrastructure business elaborated in SIAP remain relevant—sustainability, governance
and leverage. However, the internal environment in which this strategy update is being developed is
fundamentally different than the one for SIAP—IBRD and IFC face virtually used-up capital headroom
during the global crisis, and the WBG faces a flat administrative budget envelope in the future.xli
53. This update will complement the core infrastructure business with an enhanced focus on
three areas. The current business model in infrastructure is based on: (a) support for ―traditional‖
infrastructure engagements to meet basic access needs (e.g., building roads, expanding the water network,
adding transmission lines); and (b) funding provided predominately by the public sector (e.g., in AFR, it
is estimated that no more than 10 percent of infrastructure needs can be funded by the private sector).
While the current business model will remain the dominant model, this update will enhance the support in
three areas: (a) transformational engagements; (b) mobilization of private capital; and (c) mobilization of
other sources of knowledge and financing. The update will elaborate on these three areas where more
work is needed.
54. Part I of the update will articulate the vision and core messages of transformational
infrastructure. To clarify the concept of transformational infrastructure, a typology of client countries
will be created that links infrastructure development with the level of income. The literature shows a
strong correlation between infrastructure investments and development levels, with higher income
countries benefitting from stronger endowments in infrastructure than lower-income countries. In order to
catch up, LICs will have to invest relatively more than others. Part I will incorporate the concept of
transformational infrastructure into this investment framework. The notion of green infrastructure for
green growth will also be further explored.xlii
The concept of transformational infrastructure will be
equally relevant for MICs.
55. Part II will examine what the WBG will do to help client countries to deliver on this vision.
Building on the lessons learnt from past engagement in infrastructure, the update will focus on
implementation of the strategic principles in practice.xliii
For each region, WBG action plans will be
developed to address the following questions:
What is the core business of the WBG in infrastructure? Where should the WBG play a less
significant role?
Where are the new opportunities for ―transformational‖ engagements?
What will the WBG do to build the capacity required by client countries to support infrastructure
choices?
What will the WBG do to support public and private financing for infrastructure?
What support is required to enhance the quality and efficiency of public spending on
infrastructure?
17 Transformation through Infrastructure
Where are the opportunities for PPPs? A good PPP program allows client countries to attract
additional resources, and many countries clearly value support of the knowledge agenda on
PPPs.
What will the region do to help clients attract more private financing for infrastructure?
56. Part III will look at the existing WBG business model and internal actions required to move
the infrastructure agenda to the next level. In particular, this will involve: (a) increasing the
effectiveness of the current business model (core infrastructure engagements, predominantly publically-
funded); (b) defining how the WBG can take a more comprehensive approach to developmental issues,
and enhance its support for transformational infrastructure; (c) defining how the WBG can move the
frontier on public-private partnerships, taking into account sector specificities; and (d) exploring
opportunities in terms of knowledge and financing from other sources, including the Green Climate Fund,
carbon finance, private foundations and other bilateral and multilateral donors. Annex 4 outlines the
structure of this discussion.
57. Staffing and skills. Is the WBG organized to deliver transformational engagements in
infrastructure? How can the SDN experience shed light on challenges and opportunities for moving
forward? Does the WBG have the technical and strategic skills to deliver on this vision (e.g., financial
skills for PPP support)? How can the Infrastructure Panel support this vision?
58. Methodology. Several desk reviews will be conducted for this task, which include among others:
(a) a global assessment of infrastructure needs and funding requirements; (b) a review of external and
internal constraints to infrastructure lending and facilitation (including project preparation, risk
mitigation), with a special focus on transformational and PPP-type of projects; (c) an analysis of review
of project appraisal documents of infrastructure sectors for sustainability, governance and leverage; (d)
an analysis of the Bank‘s indirect leverage effect; (e) a review of Investment Completion Reports and
Impact Evaluations for results/lessons learnt; (f) a review of CAS and AAA work in infrastructure and the
contribution of global partnerships (e.g., GPOBA, PPIAF, WSP, ESMAP) and (d) an assessment of skills.
The strategy update will develop a monitoring and evaluation results framework.
59. Synergies exist with the G20 Initiative on infrastructure. In parallel with the preparation of
this update, the WBG will work with other MDBs to develop a joint MDB infrastructure action plan, as
requested by the G20 Seoul Communiqué (Annex 5). This request focused specifically on six areas: (a)
infrastructure needs assessment; (b) internal practices; (c) regional integration; (d) PPP in priority
countries; (e) sustainability and (f) transparency. By focusing on low-income countries, the MDB
infrastructure action plan will have a narrower focus than, but be consistent with, the strategy update.
E. Status of Preparation and Timeframe
60. A WBG Infrastructure Strategy Committeexliv
has been established to prepare this strategy
update. This committee includes representatives of the six regions, IFC, MIGA, WBI, and the SDN
anchor. Experts from the WBG and outside have been invited on a weekly basis to help the committee
brainstorm and articulate the relevant issues for the strategy update.
61. The initial timeline for the final product was realigned to ensure that the strategy update
benefits from and supports the preparatory work for the G20.xlv
The G20 Development Working
Group co-chairs mandated the WBG to play a ―coordinating role‖ in the preparation of the joint MDB
infrastructure action plan, as well as ―engaging with the High-Level Panel on Infrastructure Investment‖
(HLP) established by the Seoul communiqué, along this preparation process. The joint MDB
18 Transformation through Infrastructure
infrastructure action plan will be drafted by June 2011, and finalized by the next G20 meeting in
November 2011.
62. The timetable for the preparation of the WBG Infrastructure Strategy Update is as follows:
Milestones
Concept Note
Sector Boards
Water January 19, 2011
Transport February 10, 2011
Urban February 17, 2011
Energy & Mining February 23, 2011
SDN Council March 3, 2011
OVP Review March 14-18, 2011
CODE May 25, 2011
Consultations (website) June-July 2011
WBG Infrastructure Strategy update
SDN Council August 2011
OVP Review September 2011
CODE Meeting October 2011
19 Transformation through Infrastructure
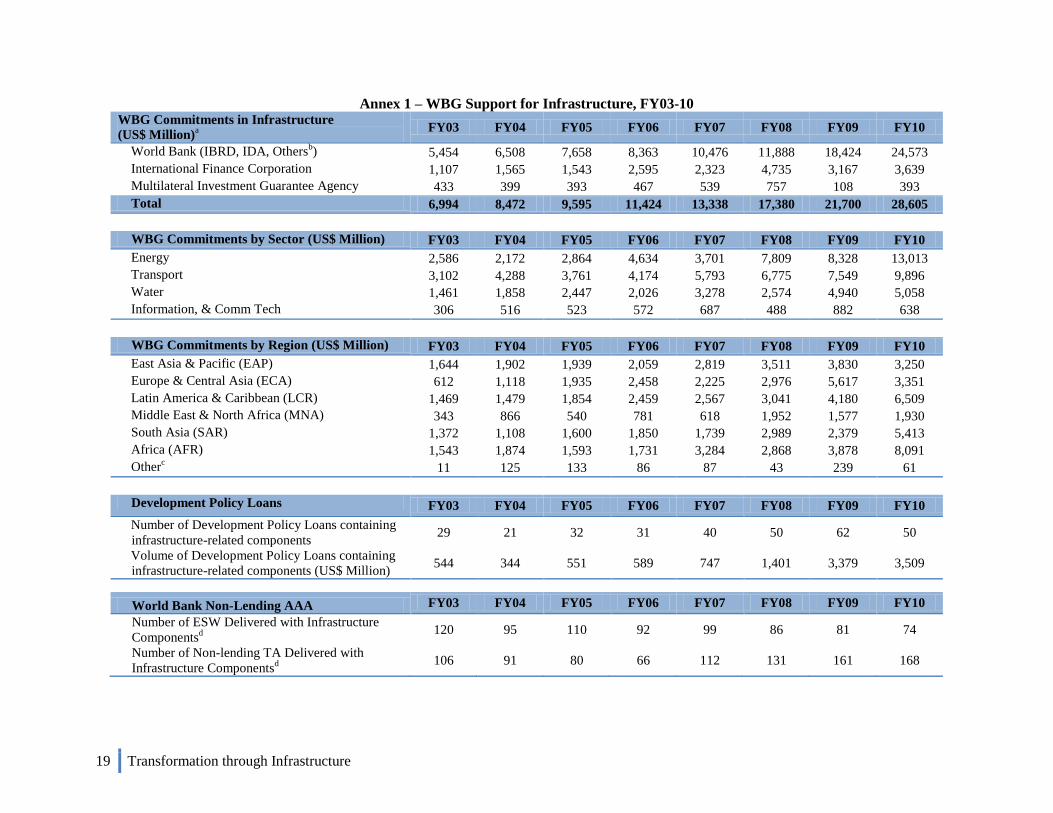
Annex 1 – WBG Support for Infrastructure, FY03-10 WBG Commitments in Infrastructure
(US$ Million)a
FY03 FY04 FY05 FY06 FY07 FY08 FY09 FY10
World Bank (IBRD, IDA, Othersb) 5,454 6,508 7,658 8,363 10,476 11,888 18,424 24,573
International Finance Corporation 1,107 1,565 1,543 2,595 2,323 4,735 3,167 3,639
Multilateral Investment Guarantee Agency 433 399 393 467 539 757 108 393
Total 6,994 8,472 9,595 11,424 13,338 17,380 21,700 28,605
WBG Commitments by Sector (US$ Million) FY03 FY04 FY05 FY06 FY07 FY08 FY09 FY10
Energy 2,586 2,172 2,864 4,634 3,701 7,809 8,328 13,013
Transport 3,102 4,288 3,761 4,174 5,793 6,775 7,549 9,896
Water 1,461 1,858 2,447 2,026 3,278 2,574 4,940 5,058
Information, & Comm Tech 306 516 523 572 687 488 882 638
WBG Commitments by Region (US$ Million) FY03 FY04 FY05 FY06 FY07 FY08 FY09 FY10
East Asia & Pacific (EAP) 1,644 1,902 1,939 2,059 2,819 3,511 3,830 3,250
Europe & Central Asia (ECA) 612 1,118 1,935 2,458 2,225 2,976 5,617 3,351
Latin America & Caribbean (LCR) 1,469 1,479 1,854 2,459 2,567 3,041 4,180 6,509
Middle East & North Africa (MNA) 343 866 540 781 618 1,952 1,577 1,930
South Asia (SAR) 1,372 1,108 1,600 1,850 1,739 2,989 2,379 5,413
Africa (AFR) 1,543 1,874 1,593 1,731 3,284 2,868 3,878 8,091
Otherc 11 125 133 86 87 43 239 61
Development Policy Loans FY03 FY04 FY05 FY06 FY07 FY08 FY09 FY10
Number of Development Policy Loans containing
infrastructure-related components 29 21 32 31 40 50 62 50
Volume of Development Policy Loans containing
infrastructure-related components (US$ Million) 544 344 551 589 747 1,401 3,379 3,509
World Bank Non-Lending AAA FY03 FY04 FY05 FY06 FY07 FY08 FY09 FY10
Number of ESW Delivered with Infrastructure
Componentsd
120 95 110 92 99 86 81 74
Number of Non-lending TA Delivered with
Infrastructure Componentsd
106 91 80 66 112 131 161 168
20 Transformation through Infrastructure
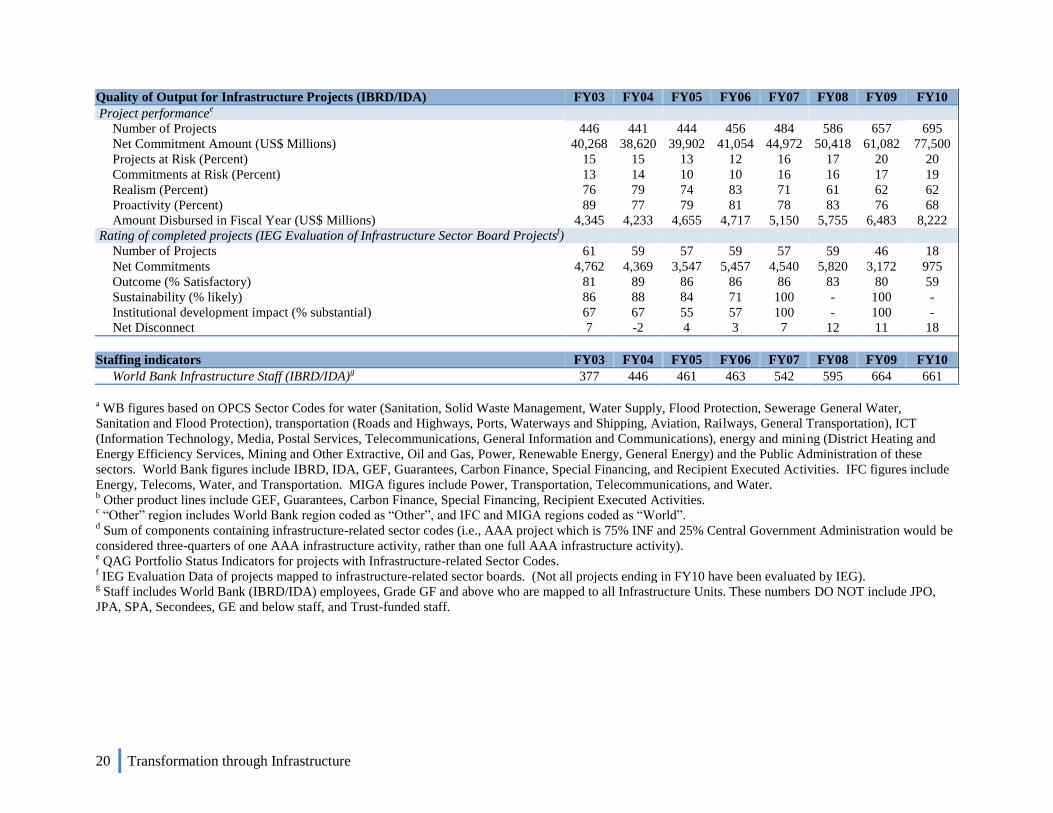
Quality of Output for Infrastructure Projects (IBRD/IDA) FY03 FY04 FY05 FY06 FY07 FY08 FY09 FY10
Project performancee
Number of Projects 446 441 444 456 484 586 657 695
Net Commitment Amount (US$ Millions) 40,268 38,620 39,902 41,054 44,972 50,418 61,082 77,500
Projects at Risk (Percent) 15 15 13 12 16 17 20 20
Commitments at Risk (Percent) 13 14 10 10 16 16 17 19
Realism (Percent) 76 79 74 83 71 61 62 62
Proactivity (Percent) 89 77 79 81 78 83 76 68
Amount Disbursed in Fiscal Year (US$ Millions) 4,345 4,233 4,655 4,717 5,150 5,755 6,483 8,222
Rating of completed projects (IEG Evaluation of Infrastructure Sector Board Projectsf)
Number of Projects 61 59 57 59 57 59 46 18
Net Commitments 4,762 4,369 3,547 5,457 4,540 5,820 3,172 975
Outcome (% Satisfactory) 81 89 86 86 86 83 80 59
Sustainability (% likely) 86 88 84 71 100 - 100 -
Institutional development impact (% substantial) 67 67 55 57 100 - 100 -
Net Disconnect 7 -2 4 3 7 12 11 18
Staffing indicators FY03 FY04 FY05 FY06 FY07 FY08 FY09 FY10
World Bank Infrastructure Staff (IBRD/IDA)g
377 446 461 463 542 595 664 661
a WB figures based on OPCS Sector Codes for water (Sanitation, Solid Waste Management, Water Supply, Flood Protection, Sewerage General Water,
Sanitation and Flood Protection), transportation (Roads and Highways, Ports, Waterways and Shipping, Aviation, Railways, General Transportation), ICT
(Information Technology, Media, Postal Services, Telecommunications, General Information and Communications), energy and mining (District Heating and
Energy Efficiency Services, Mining and Other Extractive, Oil and Gas, Power, Renewable Energy, General Energy) and the Public Administration of these
sectors. World Bank figures include IBRD, IDA, GEF, Guarantees, Carbon Finance, Special Financing, and Recipient Executed Activities. IFC figures include
Energy, Telecoms, Water, and Transportation. MIGA figures include Power, Transportation, Telecommunications, and Water. b Other product lines include GEF, Guarantees, Carbon Finance, Special Financing, Recipient Executed Activities.
c ―Other‖ region includes World Bank region coded as ―Other‖, and IFC and MIGA regions coded as ―World‖.
d Sum of components containing infrastructure-related sector codes (i.e., AAA project which is 75% INF and 25% Central Government Administration would be
considered three-quarters of one AAA infrastructure activity, rather than one full AAA infrastructure activity). e QAG Portfolio Status Indicators for projects with Infrastructure-related Sector Codes.
f IEG Evaluation Data of projects mapped to infrastructure-related sector boards. (Not all projects ending in FY10 have been evaluated by IEG).
g Staff includes World Bank (IBRD/IDA) employees, Grade GF and above who are mapped to all Infrastructure Units. These numbers DO NOT include JPO,
JPA, SPA, Secondees, GE and below staff, and Trust-funded staff.
21 Transformation through Infrastructure
Annex 2 – Lessons Learnt from WBG Experience with PPPs in the last 20 years
While the global financial crisis set back many infrastructure development plans in countries that
expected to rely on public-private partnership (PPP) arrangements, the conditions under which PPPs can
be developed remain pertinent. As a first principle, governments must recognize that infrastructure
funding still remains a mix of public and private resources, and governments should stay engaged, as
some of the risks associated with long-term investments are beyond the ability of the private sector to
manage.
Other important lessons have emerged out of the WBG‘s twenty year-long engagement in PPPs, including
the need to adopt an integrated approach to infrastructure development, develop a pipeline of projects
(instead of promoting a handful of projects) that will attract more investors and establish a track record to
reduce the country risk for future PPP engagements (e.g., Brazil and Mexico‘s road concessions).
Additional basic tenets include:
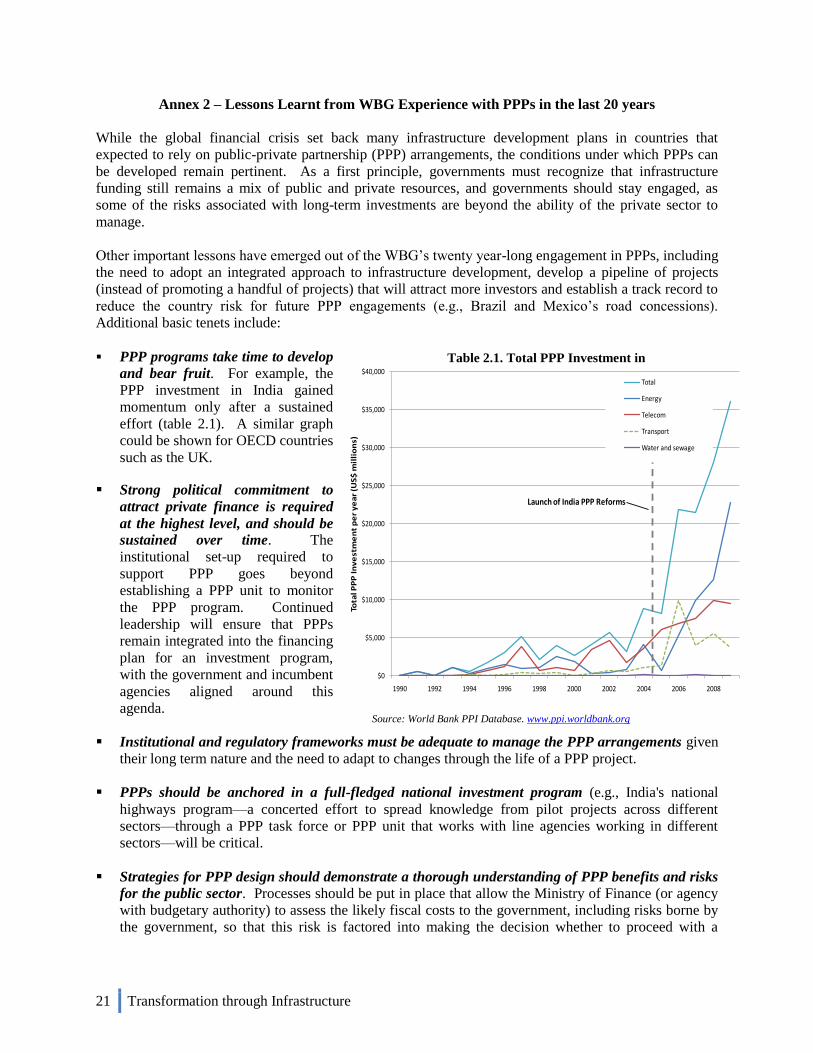
PPP programs take time to develop
and bear fruit. For example, the
PPP investment in India gained
momentum only after a sustained
effort (table 2.1). A similar graph
could be shown for OECD countries
such as the UK.
Strong political commitment to
attract private finance is required
at the highest level, and should be
sustained over time. The
institutional set-up required to
support PPP goes beyond
establishing a PPP unit to monitor
the PPP program. Continued
leadership will ensure that PPPs
remain integrated into the financing
plan for an investment program,
with the government and incumbent
agencies aligned around this
agenda.
Institutional and regulatory frameworks must be adequate to manage the PPP arrangements given
their long term nature and the need to adapt to changes through the life of a PPP project.
PPPs should be anchored in a full-fledged national investment program (e.g., India's national
highways program—a concerted effort to spread knowledge from pilot projects across different
sectors—through a PPP task force or PPP unit that works with line agencies working in different
sectors—will be critical.
Strategies for PPP design should demonstrate a thorough understanding of PPP benefits and risks
for the public sector. Processes should be put in place that allow the Ministry of Finance (or agency
with budgetary authority) to assess the likely fiscal costs to the government, including risks borne by
the government, so that this risk is factored into making the decision whether to proceed with a
Source: World Bank PPI Database. www.ppi.worldbank.org
Table 2.1. Total PPP Investment in
India
$0
$5,000
$10,000
$15,000
$20,000
$25,000
$30,000
$35,000
$40,000
1990 1992 1994 1996 1998 2000 2002 2004 2006 2008
Tota
l PP
P I
nv
est
me
nt
pe
r y
ea
r (U
S$
mil
lio
ns)
Total
Energy
Telecom
Transport
Water and sewage
Launch of India PPP Reforms
22 Transformation through Infrastructure
project. These processes should also emphasize transparency and competition to provide for good
governance of the PPP process. This should include reporting on the fiscal costs of PPPs.
Priority should be given to identifying PPP projects that fulfill minimum bankability requirements.
Projects that generate revenue in foreign currencies are generally considered more attractive than
projects with local currency revenues. Brownfield projects require limited investment, and are
therefore more bankable than a greenfield/new build, operate, transfer (BOT). Project preparation
complexity may also influence project selection.
Balanced and sustainable PPP deals require building and maintaining public sector capacities.
Building public sector capacity to work on par with the private sector will ensure PPP deals that are
balanced, and thereby sustainable. This will require: (a) providing the public sector with the skills
and resources to understand the public-private interface, and developing these transactions together;
and (b) making the public sector more attractive to the private sector (e.g. through governance and
transparency reforms, public sector management).
PPP projects require “patient capital”. PPP projects require ―patient capital‖. The reality of private
finance is that some transactions, especially in LICs, may not be funded if they do not support shorter
pay-back periods for the private sector. Moreover, utility projects require large up-front investments
that the private sector may not be ready to make if the political risk is perceived to be high. In these
cases, the public sector should undertake some of the early development work on projects and have
available a broad range of financing instruments (e.g., sovereign guarantees, loans and risk/credit
guarantees from MDBs, DFI financing) to complement private financing from project developers and
commercial lenders.
Procurement processes should allow for market change prior to financial close. Open, transparent
and fair procurement systems with adequate market consultation and testing reduce perceived market
risks. Strategic projects that are unattractive to the private sector may be good candidates for public
procurement.
Governments must show openness and flexibility to adjust to new circumstances, e.g., reprioritizing
PPP projects based on the level of support required and their potential economic and social impacts
ensuring adequate value for money.
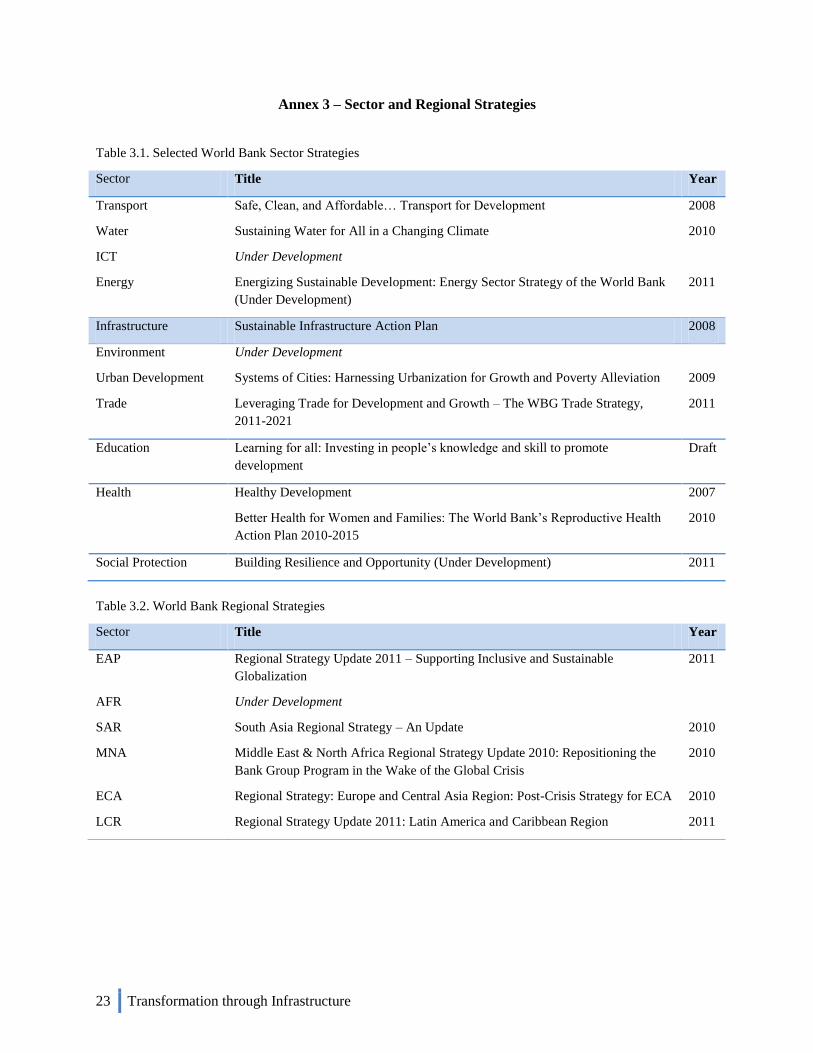
23 Transformation through Infrastructure
Annex 3 – Sector and Regional Strategies
Table 3.1. Selected World Bank Sector Strategies
Sector Title Year
Transport Safe, Clean, and Affordable… Transport for Development 2008
Water Sustaining Water for All in a Changing Climate 2010
ICT Under Development
Energy Energizing Sustainable Development: Energy Sector Strategy of the World Bank
(Under Development)
2011
Infrastructure Sustainable Infrastructure Action Plan 2008
Environment Under Development
Urban Development Systems of Cities: Harnessing Urbanization for Growth and Poverty Alleviation 2009
Trade Leveraging Trade for Development and Growth – The WBG Trade Strategy,
2011-2021
2011
Education Learning for all: Investing in people‘s knowledge and skill to promote
development
Draft
Health Healthy Development 2007
Better Health for Women and Families: The World Bank‘s Reproductive Health
Action Plan 2010-2015
2010
Social Protection Building Resilience and Opportunity (Under Development) 2011
Table 3.2. World Bank Regional Strategies
Sector Title Year
EAP Regional Strategy Update 2011 – Supporting Inclusive and Sustainable
Globalization
2011
AFR Under Development
SAR South Asia Regional Strategy – An Update 2010
MNA Middle East & North Africa Regional Strategy Update 2010: Repositioning the
Bank Group Program in the Wake of the Global Crisis
2010
ECA Regional Strategy: Europe and Central Asia Region: Post-Crisis Strategy for ECA 2010
LCR Regional Strategy Update 2011: Latin America and Caribbean Region 2011
24 Transformation through Infrastructure
Annex 4 – Implementation of the Strategy Update – Scope
1. Implementation of the current business model - core infrastructure business, predominantly
publically-funded
Financial and related arrangements
In view of the flat budget envelope, what can be done to address the size of project preparation
and supervision budgets, which have not kept pace with the recent increases in Bank lending?
How can this update benefit from on-going reform efforts by various MDB and WBG Working
Groups on safeguards and procurement?
Knowledge - Infrastructure is a complex, multi-dimensional object, which requires knowledge and
expertise from throughout the WBG.
How can the knowledge generated on infrastructure be better organized in the WBG (e.g., Global
Expert Teams, knowledge practices, etc.) in order to break down boundaries between high-
quality, but essentially separate communities of practice or ―silos‖ across sectors and networks?
How can the knowledge generated by projects be better captured for follow-up and lessons
learned?
How can the methodology developed by the recent study (AFR – A Time for Transformation) be
replicated at a lower cost (e.g., develop modules with price tags)?
How can the Bank leverage the experience and knowledge of other external groups (e.g.,
construction engineering and insurance industry to investigate the impact of climate change on
the design parameters of infrastructure projects)?
Convening power
How can new initiatives (e.g. Open Development agenda), and knowledge platforms, which
involve external stakeholders in co-producing knowledge, be used to provide a framework for
sustained collaboration around selected strategic issues (e.g., green development, urbanization,
ICT)?
What are the lessons learnt from the Construction Sector Transparency Initiative (CosT) pilots,
and the INT-led roads sector review?
2. Enhanced support for transformational engagements in infrastructure
What would it take for the WBG to take a more comprehensive approach to developmental issues and
increase its support for transformational infrastructure engagements?
Financial and related arrangements
What are the risks entailed for the WBG to engage in transformational projects (e.g., more
complex, longer gestation period, enhanced governance risks)? What are the mechanisms that
will mitigate these risks?
Does the WBG have the vehicles to prepare for transformational projects (e.g., IFC
Infraventures)? If not, what is needed in terms of financing to resource this project vehicle/
technical assistance window? How can these projects be taken out of the regular stream of
25 Transformation through Infrastructure
projects and be supported by a longer term commitment? What are the arrangements specifically
needed for IDA and IBRD countries (if any)?
Does the WBG have the financial instruments to promote adaptative engagements (e.g., Program
For Results, P4R, lending instrument) and leverage third-party resources (e.g., project-based bond
issuance, partial risk guarantee, project-based partial credit guarantee for IDA-only countries,
Non-Honoring of a Sovereign Financial Guarantee)?
How can on-going reforms efforts on safeguards and procurement promote transformational
engagements with client countries?
Knowledge
Which existing or new knowledge products are needed to support a holistic engagement with
client countries on infrastructure (e.g., urbanization review)?
What are the new capacity building instruments that are available to support client countries
choices in infrastructure (e.g., leadership and innovation programs, such as e-mapping; South-
South knowledge exchange)?
What new analytical tools are required for the WBG to stay relevant when providing solutions to
client countries through the technical lens (e.g., green financing analytical framework, cost-
benefit analysis with externalities, simulation model of spill-over effects)?
Convening power
How can the WBG use its convening power and the G20 momentum to garner support from the
international community around new and/or targeted earmarked resources for project preparation?
How can the WBG support increased pooling of resources for that purpose?
How can the WBG use its reputation and engagement at the country level to define a list of
transformational projects that the international community will support?
How can the WBG push the EITI initiative to the next level, signaling the need for the private
sector in the extractive industries to go beyond environment, local communities and transparency
into addressing the broader transformational impact of infrastructure on development?
3. Enhanced mobilization of private capital
Compared to Regional Development Banks, the WBG is uniquely positioned to also support ―private
sector‖ solutions to infrastructure. The WBG can work through the spectrum of activities—from the
upstream support for the right enabling environment, to training/capacity building in client countries, to
transaction advisory capacity and provision of guarantees to help mitigating specific project risks or
backstop certain government contractual obligations.
A major challenge in PPP engagement lies in the fact that PPP programs take time to develop and bear
fruit—much of this relates directly to identifying and establishing the right capacities and policy
frameworks. Thus, there is a strategic decision for WBG to make in terms of putting in the necessary
support on knowledge and capacity building without clear lending opportunities in the immediate future,
and ensuring that these PPP projects are properly funded throughout their long gestation period.
Moreover, while PPPs can be clearly regarded as lending opportunities on the IFC side, this is less true on
the Bank side, since countries undertake PPPs to reduce their reliance on public funds.
26 Transformation through Infrastructure
Financing
What should the WBG do internally to increase the focus on private sector participation in
infrastructure? What can the Bank learn from IFC to increase internal incentives to mobilize
private capital (e.g., performance measurement based on its own and syndicated loans, instead of
IFC volume)?
How can the WBG promote a more programmatic approach to PPPs, for example, successful
projects that provide a track record for the private sector to take more risks; a targeted approach
to develop a pipeline of projects in focus countries or sequential engagement, with initial projects
(e.g., drilling) that can be used to identify the risks and inform on risk allocation of subsequent
projects?
By how much could the WBG capital be leveraged and how far can the limit on the capital
headroom be pushed?
How can this update benefit from on-going efforts from MDB Working Group on Procurement
(including private/sovereign)?
Knowledge
How can synergies between the Bank, IFC and MIGA be better exploited, in particular in the
areas of investment planning and upstream work for PPPs?
What are the mechanisms that can be put in place in client countries to strengthen PPP planning
(e.g., India – Infrastructure planning with private and public financing sources; leadership and
coalition support programs)?
What are the new opportunities offered by the recent launch of the Singapore-based Infrastructure
Finance Center of Excellence? How can this Center be used to build client country capacity,
including from IDA countries? How can the WBG link this Center with IFC efforts on the
Global Infrastructure Fund?
Convening power
How can the WBG use its convening power and the G20 momentum to encourage more private
sector financing in IDA countries?
4. Increased mobilization of other sources of funding
The establishment of the Green Climate Fund (and associated finance) may add another $100 billion of
investment per annum by 2020 to implement transformational/green projects at scale. This funding will
come from many sources, including the public sector, carbon markets, the private sector, bilateral and
multilateral donors. These funds have the potential to support and enhance a transformation of
developing countries' extant infrastructure into climate resilient infrastructure. Carbon finance could
provide additional support to the development of transformational infrastructure in LICs and MICs. By
2008, the Kyoto instruments transactions reached $6.8 billion, with many of the transactions linked to
infrastructure investments in renewable energy (wind, biomass and hydro), waste management facilities
(e.g., landfills) and energy distribution. As climate negotiations continue, it is expected that carbon
markets will evolve and have a larger impact on the least developed countries. Finally, engaging with
private foundations and ―think tanks‖ active in infrastructure can open new opportunities for leveraging
knowledge and financial resources.
27 Transformation through Infrastructure
Financing
How can the WBG package and act as a ―preferred implementer‖ of these large-scale climate-
related projects?
Knowledge
What are the lessons learned from the pilot implementation of the Climate Investment Funds?
What can be done to address the fragmentation of funding sources?
Convening power
How can the WBG use its convening power to pool and blend multiple resources?
How can the linkages between the WBG, private foundations and ―think tanks‖ active in
infrastructure be strengthened?
28 Transformation through Infrastructure
Annex 5 – The WBG and the G20
Progress on the preparation of the MDB Infrastructure Action Plan (G20 Meeting, Seoul,
November 2010) and the next G20 Meeting (Cannes, November 2011)
The G20 Development Working Group co-chairs mandated the WBG to play a ―coordinating role‖ in the
preparation of the joint MDB infrastructure action plan, as well as engaging with the High-level Panel on
Infrastructure Investment (HLP), in advance of the next G20 Summit. The HLP is composed of 17 high-
profile private sector leaders and policy-makers. The Panel members‘ interaction with the private sector,
including financial markets, and top policy-makers places them in an ideal position to have a significant
impact on the infrastructure agenda.
At the G20 Finance Ministers and Central Bank Governors‘ Meeting in February 2011, the WBG put
forward several proposals on potential deliverables/outcomes of the next G20 (see table 1). While G20
members welcomed these proposals at the time, they have shown little desire to commit new funds or
create a trust fund for project preparation in IDA countries, both identified as key obstacles to move the
transformational agenda in AFR.
The MDBs will now be working with the HLP to move the agenda on transformational infrastructure,
pushing the envelope on PPPs, advancing on investment standards and building information systems for
smarter decisions.
In addition, and as requested by the Seoul communiqué, a joint report from all the multilateral
development banks (or ―MDB infrastructure action plan‖) is under preparation (Table 2). The first draft
is due to the HLP early June, 2011.
Table 5.1. G20 Deputies Ministers Meeting, February 17-18, 2011-WBG proposal for G20
Deliverables Ear-marking funding for project
preparation Regional transformational projects in SSA would require project
preparation efforts of the order of US$1.8 billion over several years. The
G20 support could complement IDA resources for this purpose.
To jumpstart project preparation in SSA, it may be necessary to establish a
Global Partnership, which will pull together new and already existing
resources from all parties for the preparation of bankable projects.
TA for capacity building
(preparation/implementation) Not only is project preparation and implementation costly, but it requires a
range of technical and project management skills (a team of professionals
working through the project cycle).
These skills are in short supply in some of the key regional and national
institutions. Major efforts are needed to transfer and develop these
competencies.
The Infrastructure Finance Center of Excellence (IFCOE) out of the
Singapore Hub is a good example of how the international community can
support project, financing and knowledge. This experience can be
duplicated to bring knowledge and innovation in financing in SSA.
Innovation to optimize financing Options to consider: project-based bond issuance and other forms of
financial intermediation. To achieve this, MDBs should expand the range of
credit enhancement instruments available (e.g., Project-Based Partial Credit
Guarantees in IDA-only countries, in addition to Partial Risk Guarantees).
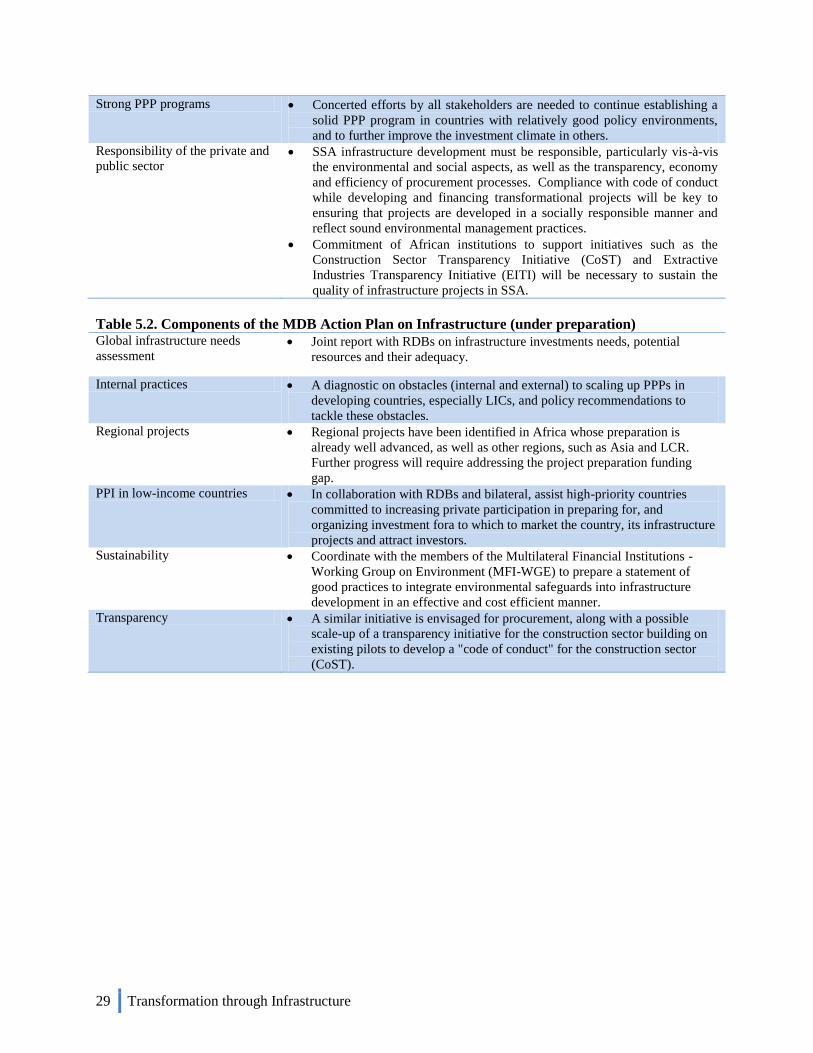
29 Transformation through Infrastructure
Strong PPP programs Concerted efforts by all stakeholders are needed to continue establishing a
solid PPP program in countries with relatively good policy environments,
and to further improve the investment climate in others.
Responsibility of the private and
public sector SSA infrastructure development must be responsible, particularly vis-à-vis
the environmental and social aspects, as well as the transparency, economy
and efficiency of procurement processes. Compliance with code of conduct
while developing and financing transformational projects will be key to
ensuring that projects are developed in a socially responsible manner and
reflect sound environmental management practices.
Commitment of African institutions to support initiatives such as the
Construction Sector Transparency Initiative (CoST) and Extractive
Industries Transparency Initiative (EITI) will be necessary to sustain the
quality of infrastructure projects in SSA.
Table 5.2. Components of the MDB Action Plan on Infrastructure (under preparation) Global infrastructure needs
assessment Joint report with RDBs on infrastructure investments needs, potential
resources and their adequacy.
Internal practices A diagnostic on obstacles (internal and external) to scaling up PPPs in
developing countries, especially LICs, and policy recommendations to
tackle these obstacles.
Regional projects Regional projects have been identified in Africa whose preparation is
already well advanced, as well as other regions, such as Asia and LCR.
Further progress will require addressing the project preparation funding
gap.
PPI in low-income countries In collaboration with RDBs and bilateral, assist high-priority countries
committed to increasing private participation in preparing for, and
organizing investment fora to which to market the country, its infrastructure
projects and attract investors.
Sustainability Coordinate with the members of the Multilateral Financial Institutions -
Working Group on Environment (MFI-WGE) to prepare a statement of
good practices to integrate environmental safeguards into infrastructure
development in an effective and cost efficient manner.
Transparency A similar initiative is envisaged for procurement, along with a possible
scale-up of a transparency initiative for the construction sector building on
existing pilots to develop a "code of conduct" for the construction sector
(CoST).
30 Transformation through Infrastructure
End Notes
i This paper adopts the definition of infrastructure used in the Sustainable Infrastructure Action Plan—transport,
water, energy and information and communications technology. ii See New World, New World Bank Group: Post-crisis Directions, Development Committee, April 2010.
iii See Calderon, 2009
iv See Nidumolu R., and al., Why Sustainability is now the key driver of innovation, Harvard Business Review,
September 2009, pp 57-64. v See commitment by Senior Management to CODE for a ―mid-cycle implementation update‖ type for infrastructure
Action Plan (CODE2008-0059/1, October 29, 2008). vi See World Bank Group Sustainable Infrastructure Action Plan, FY08-11 (CODE2008-0028, March 21, 2008).
vii See Ruiz-Nunez and Biller, 2009.
viii See Regional Study – Infrastructure Gap in South Asia: Concept Note, 2010, World Bank.
ix See Estache A. and Fay Marianne, 2009. Current Debates on Infrastructure Policy, Working Paper No 49,
Commission on Growth and Development. x See Briceno-Garmendia C., and Klytchnikova, 2006. Infrastructure and Poverty: What data are available for
impact evaluation. The World Bank, Washington DC. xi
See Infrastructure and Poverty, 2000 (draft), World Bank. xii
See Infrastructure and Poverty Reduction – What is the Connection?, 2003. ERB Policy Brief Series, 13, ADB xiii
See Estache A. and Fay Marianne, Current Debates on Infrastructure Policy, Working Paper No 49, Commission
on Growth and Development, 2009. xiv
See Regional Study – Infrastructure Gap in South Asia: Concept Note, 2010, World Bank. xv
See Foster V., and Briceno-Garmendia, 2010. Africa‘s Infrastructure: A Time for Transformation, AICD. xvi
Solar cells technology turns 11 percent of the light that hits the cells into electricity. xvii
See Infrastructure to 2030 – Volume 2. Mapping Policy for Electricity, Water and Transport, OECD, 2007. xviii
See Casillas and Kammen on bluefields in Nicaragua, Science, 2010; and Johnson, Alatorre, Roma and Lio on
Mexico, 2009. xix
As such, these solutions require looking into new sources of ―green‖ finance. See Green Finance: Developing
and Piloting and Analytical Framework for Green Investments in the East Asia Pacific Region – Concept Note. xx
New projects are facing higher cost of financing, and characterized by lower debt/equity ratio, shorter tenors, and
more conservative structures. The recent underperformance of clean energy companies relative to the market in
general suggest that they are suffering. The Wilderness Clean Energy Index collapsed from 296 to 59 following the
crisis, and substantially lags behind. xxi
See Schwartz J, Andres L., and Dragoiu, 2009. Crisis in Latin America Infrastructure Investment, Employment
and the Expectations of Stimulus. Journal of Infrastructure Development (JOI) 1 (2) 111-132. And Policy Research
Working Paper 5009. xxii
See Khatiwada S., 2009. Stimulus Packages to Counter the Global Economic Crisis: a review, Discussion Paper,
ILO. xxiii
See Dabla-Norris E., and al. Investing in Public Investment: An Index of Public Investment Efficiency. IMF,
Washington DC. xxiv
See Vagliasindi Maria and John Nellis, 2009. Evaluating Africa‘s Experience with Institutional Reform for the
Infrastructure Sectors. Working Paper 23, Africa Infrastructure Country Diagnostic, World Bank, Washington DC.. xxv
See Estache, A., 2010. Infrastructure Finance in developing countries: An Overview, EIB Papers. xxvi
See Infrastructure financing: An Overview. 2010 (draft). World Bank xxvii
See World Bank Infrastructure Action Plan, World Bank, 2003. xxviii
See Infrastructure at the Crossroads – Lessons from 20 Years of World Bank Experience, World Bank, 2006. xxix
At the G8 Gleanagles Summit in 2005, G8 members pledged to raise ODA to $50 billion in 2010 over FY04
level, out of which ODA to AFR would double to $25 billion in 2010. xxx
See World Bank Group Sustainable Infrastructure Action Plan, FY08-11 (CODE2008-0028, March 21, 2008) xxxi
See IEG, 2010. Phase 1 – The World Bank Group‘s Response to the Global Economic Crisis. xxxii
For example, Kazakhstan South West Roads project--$ 2.1 billion, South Africa Eskom Investment Support
project --$3.75 billion and India Powergrid V--$1 billion); Mexico Framework for Green Growth DPL--$1.5 billion.
Note an increase in the average size of infrastructure projects, from $27 million over FY04-08 to $45 million over
FY09-10.
31 Transformation through Infrastructure
xxxiii
IEG Outcome ratings have outperformed the Bank-wide average since FY02, with 81 percent of the project
exits having satisfactory outcomes, compared to 75 percent Bank-wide. Other indicators related to more recent
approvals point towards a slight deterioration in the quality, including portfolio riskiness, proactivity and share of
undisbursed balance. xxxiv
Total investment enabled by IFC commitments in infrastructure was in excess of $10 billion in FY10. xxxv
See IEG, 2010. Safeguards and Sustainability Policies in a Changing World. An independent Evaluation of
World Bank Group Experience. xxxvi
Results based on a review of all Project Appraisal Documents for infrastructure sectors over FY06-07 (pre-
SIAP) and FY09-10 (post-SIAP). Methodology based on a set of 25 environmental and social proxies/indicators. xxxvii
Over FY08-10, Bank-financed regional projects with infrastructure components amounted to $1.6 billion. xxxviii
A forthcoming INT review on fraud, collusion, and corruption in the roads sector finds significant problems
with collusion in the tender for roads projects, as well as fraud and corruption in contract execution. xxxix
See Kessides I. (ed.), 2004. Reforming Infrastructure: Privatization, Regulation , and Competition. World Bank. xl
See New World, New World Bank Group: Post-crisis Directions, Development Committee, April 2010 xli
This is especially important at the time of increased pressures for budget supervision of a now-larger stock of
cumulative commitments, and for lending preparation to rebuild the pipeline that has been depleted as part of the
crisis response. xlii
See Green Growth Report (draft PCN), SDN, April 2011 xliii
These plans will be introduced with the caveat that the WBG activities are the outcomes of a combination of
three factors: (a) the nature of the challenges in a country; (b) the country Assistance Strategy, in which the
government and the Bank/WBG agree on priorities and approaches; and (c) the sector strategies. xliv
The WBG Infrastructure Strategy Committee is composed of: Jose Luis Irigoyen (chair), Nancy Vandycke
(TWI, task manager), Jordan Schwartz and Jyoti Shukla (LCR); Aldo Baietti (EAP); Luis Andres and Dan Biller
(SAR); Vivien Foster and Cecilia Briceno-Garmendia (AFR); Olivier le Ber and Jaafar Fria (MNA); Omar Chaudry
(IFC), Peggy Walsh (MIGA). The Experts Advisory Committee is composed of: Andrew Steer, Dan Kammen,
Joachim Von Amsberg, Marianne Fay, James Bond, Bernie Sheahan, Laurence Carter, Pankaj Gupta, John Roome,
Laura Tuck, Jack Stein, Jamal Saghir, and Stephen Lintner. The Infrastructure anchor working group is composed
of: Nancy Vandycke (Task Manager), Michele Diez, Michael Dalesio, Peggy Johnston, Marcelino Madrigal,
Michael Tran, Peter O‘Neill, Isabela Manelici, Christine Quiang, Doyle Gallegos, Laurent Besancon, Marc Jean
Yves Lixi. xlv
Since the main pillars of the existing infrastructure strategy remain largely valid, this update will be vetted
through a more limited form of external consultations in line with CODE guidance to Senior Management
(CODE2009-0033, April 14, 2009).