Embed Size (px)
Citation preview
Transformation of Human Mesenchymal Cells and SkinFibroblasts into Hematopoietic CellsDavid M. Harris1, Inbal Hazan-Haley1, Kevin Coombes2, Carlos Bueso-Ramos3, Jie Liu1, Zhiming Liu1,
Ping Li1, Murali Ravoori4, Lynne Abruzzo3, Lin Han4, Sheela Singh4, Michael Sun5, Vikas Kundra4, Razelle
Kurzrock5, Zeev Estrov1*
1 Department of Leukemia, University of Texas MD Anderson Cancer Center, Houston, Texas, United States of America, 2 Department of Biostatistics, University of Texas
MD Anderson Cancer Center, Houston, Texas, United States of America, 3 Department of Hematopathology, University of Texas MD Anderson Cancer Center, Houston,
Texas, United States of America, 4 Department of Diagnostic Radiology, University of Texas MD Anderson Cancer Center, Houston, Texas, United States of America,
5 Department of Investigational Cancer Therapeutics, University of Texas MD Anderson Cancer Center, Houston, Texas, United States of America
Abstract
Patients with prolonged myelosuppression require frequent platelet and occasional granulocyte transfusions. Multi-donortransfusions induce alloimmunization, thereby increasing morbidity and mortality. Therefore, an autologous or HLA-matched allogeneic source of platelets and granulocytes is needed. To determine whether nonhematopoietic cells can bereprogrammed into hematopoietic cells, human mesenchymal stromal cells (MSCs) and skin fibroblasts were incubated withthe demethylating agent 5-azacytidine (Aza) and the growth factors (GF) granulocyte-macrophage colony-stimulating factorand stem cell factor. This treatment transformed MSCs to round, non-adherent cells expressing T-, B-, myeloid-, or stem/progenitor-cell markers. The transformed cells engrafted as hematopoietic cells in bone marrow of immunodeficient mice.DNA methylation and mRNA array analysis suggested that Aza and GF treatment demethylated and activated HOXB genes.Indeed, transfection of MSCs or skin fibroblasts with HOXB4, HOXB5, and HOXB2 genes transformed them intohematopoietic cells. Further studies are needed to determine whether transformed MSCs or skin fibroblasts are suitable fortherapy.
Citation: Harris DM, Hazan-Haley I, Coombes K, Bueso-Ramos C, Liu J, et al. (2011) Transformation of Human Mesenchymal Cells and Skin Fibroblasts intoHematopoietic Cells. PLoS ONE 6(6): e21250. doi:10.1371/journal.pone.0021250
Editor: Mauricio Rojas, University of Pittsburgh, United States of America
Received November 18, 2010; Accepted May 25, 2011; Published June 22, 2011
Copyright: � 2011 Harris et al. This is an open-access article distributed under the terms of the Creative Commons Attribution License, which permitsunrestricted use, distribution, and reproduction in any medium, provided the original author and source are credited.
Funding: This study was supported by a Multidisciplinary Research Program grant from M. D. Anderson Cancer Center. The funders had no role in study design,data collection and analysis, decision to publish, or preparation of the manuscript.
Competing Interests: The authors have declared that no competing interests exist.
* E-mail: [email protected]
Introduction
Prolonged thrombocytopenia and delayed immune reconstitu-
tion are major causes of morbidity and mortality in patients with
hematologic malignancies and life-threatening non-malignant
hematologic disorders. Platelet transfusion has reduced hemor-
rhagic death rate, and white blood cell transfusion has improved
the survival of patients with neutropenia-related opportunistic
infections [1,2]. However, multi-donor platelet transfusions
occasionally induce platelet refractoriness caused by anti-human
leukocyte antigen (HLA) alloimmunization [3] and multi-donor
white blood cell transfusions often cause life-threatening acute lung
injury [4] and infections transmitted by leukocytes carrying
pathogens such as cytomegalovirus [1]. Severe complications limit
the HLA-matched donor pool. Repeated apheresis platelet
donations adversely affect thrombopoiesis and bone mineraliza-
tion, and apheresis granulocyte donations occasionally induce
inflammatory reactions, thrombocytopenia, bleeding, splenic
rupture, capillary leak syndrome, and hepatocellular injury [5].
Thus, an alternative, preferentially autologous, source of hemato-
poietic cells is needed.
Somatic cells of an adult organism are thought to arise from an
irreversible sequential differentiation process in which undifferen-
tiated cells gradually transform into terminally differentiated
tissue-specific cells [6]. However, several studies have demonstrat-
ed that cells of one type are capable of transforming into cells of
another type [7,8,9,10]. For example, hematopoietic cells have
been shown to give rise to multiple types of non-hematopoietic
cells [11,12,13,14,15], neuronal cells to hematopoietic cells [16],
and dermal cells to neuronal cells, musculoskeletal cells, and
adipocytes [17]. Studies in human hematopoietic stem cell
transplantation (HSCT) patients support these observations
[9,18]. Donor-derived skin, liver- and gastrointestinal tract
tissue-specific cells were detected in biopsy tissues from blood or
bone marrow HSCT recipients months after transplantation [19].
However, contradictive data suggested that plasticity in adult stem
cells does not occur at an appreciable rate and, thereby, lacks any
in vivo developmental or physiological significance [20].
Several cellular reprogramming experiments have been con-
ducted during the past four decades. Somatic cell nuclear transfer
(SCNT) was performed in the 1960s [8,21] and the generation of
induced pluripotent stem (iPS) cells capable of forming cells of
different tissues has been reported in recent years [22,23,24,
25,26,27,28,29]. Alternative strategies to convert one cell type into
another directly, without the need to first revert to an
undifferentiated state, such as conversion of dermal fibroblasts
and retinal epithelial cells into muscle-like cells [30,31,32] or pro-B
cells [33] or of inner ear support cells into auditory hair cells [34]
PLoS ONE | www.plosone.org 1 June 2011 | Volume 6 | Issue 6 | e21250
brought to you by COREView metadata, citation and similar papers at core.ac.uk
provided by PubMed Central
have been reported during the past two decades. Recently,
pancreatic mature exocrine cells were reprogrammed into
functional insulin-producing beta cells by inserting three tran-
scription factors [35].
In addition to direct gene manipulation, tissue reprogramming
has also been achieved by pharmacological means. For example,
the demethylating agents 5-azacytidine (Aza) and 5-aza-deoxycy-
tidine, now known to inhibit DNA methyltransferases
[36,37,38,39], were used to induce differentiation of embryonic
cells into muscle cells and adipocytes [40,41] and of pre-B
lymphoma ABLS 8.1 cells into macrophages [42]. DNA
methylation is a biochemical modification that, in human cells,
primarily affects cytosines when they are part of the symmetrical
dinucleotide CpG. Methylation of promoter-associated CpG
islands is essential for maintaining the genes’ silenced state.
DNA methyltransferases induce CpG island methylation. Aza
inhibits DNA methyltransferases, and as a result, activates silenced
(methylated) genes [36,37,38,39]. Because Aza is routinely used in
clinical practice [39,43] and was successfully used to transform
cells of one lineage into cells of another lineage [40,41,42], we
sought to determine whether Aza could transform easily accessible
cells such as human mesenchymal stromal cells (MSCs) into
hematopoietic cells.
Mesenchymal cells are easily accessible, and a small number of
bone marrow or blood MSCs can be easily expanded [44].
Furthermore, allogeneic mesenchymal cells do not appear
immunogenic in non-human primate [45] and human sibling-
donor recipients [46,47,48]. Indeed, clinical trials with allogeneic
mesenchymal cells have been successfully conducted in recent
years [47,49,50,51,52]. Therefore, we reasoned that a hemato-
poietic progeny of mesenchymal cells might become a preferential
cellular source for transfusion therapy and cellular therapy.
Results
Transformation of HS-5 mesenchymal cells intohematopoietic cells
In order to induce mesenchymal-to-hematopoietic transition,
we incubated mesenchymal HS-5 cells with increasing concentra-
tions of Aza at different time points. Our goals were to obtain (1)
an optimal reduction in intracellular 5-methylcytidine without
compromising cell viability (as assessed by trypan blue staining)
and (2) induction of CD45 expression. We found that 2.5 mg/ml
Aza (added to HS-5 cells at day 1 and day 4 of culture) reduced the
level of intracellular 5-methylcytidine by an average of 21% at day
13 of culture (Figure S1A), and up to 21% of the total cellular
population expressed the hematopoietic CD45 antigen (Figure 1A).
Furthermore, 47% of the cells expressed the granulocyte-
macrophage colony-stimulating factor (GM-CSF) receptor (R)- aCD116, 37% expressed the GM-CSFR-b CD131, and 26%
expressed the stem cell factor (SCF) receptor CD117 (Figure S1B).
Both growth factors (GFs) have been found to stimulate normal
hematopoietic cells and have been used clinically.
We assumed that these GFs might contribute to the transfor-
mation of the mesenchymal HS-5 cells into hematopoietic cells,
and after determining the optimal dose and schedule, we added
50 ng/ml of both GM-CSF and SCF at days 7 and 10 of culture
and harvested the cells for analysis at day 13. Under these
conditions, 41.6% of the cells expressed CD45, as compared with
21.3% when the cells were treated with Aza alone (Figure 1A).
The transformed cells also expressed different levels of T-cell
(CD3), B-cell (CD19), and myeloid cell antigens (CD14, CD64)
and myeloperoxydase (MPO) (Figure 1B and S1C). However,
CD133, another stem/progenitor cell marker, was not detected in
the HS-5 transformed cells and, similarly, not all B-, T-, or
myeloid cell markers were upregulated by Aza and GF treatment
(Figure S1C). Notably, the MSC-specific markers CD73, CD90
and CD105 were significantly downregulated in the transformed
cells (Figure S1D). HS-5 cells treated with Aza plus GF became
round and small, as confirmed by morphological (Figure 1C) and
side- and forward-scattered flow cytometry analysis (Figure S1E).
Notably, a similar percentage of CD45 expression was detected in
both the gated small cells and the entire cellular population,
suggesting that CD45 expression preceded the morphological
changes (Figure S1E).In a two-color flow cytometry analysis of
viable cells, 21.2% of the entire Aza plus GF–treated population
expressed CD45 and 4.1% expressed both CD45 and CD34
antigens, suggesting that a subpopulation of the transformed cells
were early (stem/progenitor) hematopoietic cells. However, the
percent of cells expressing both CD45 and CD34 antigens might
be underestimated because of quenching [53] (Figure 1D). In
other experiments, a significant proportion of Aza plus GF-treated
HS-5 cells expressed CD45 (11%–41%; Figures 1A, 1B, and S1E)
or co-expressed CD45/CD34 (Figure S1F). Remarkably, Aza plus
GF-treated cells formed hematopoietic colonies in semisolid
culture medium (Figure 1D). A significant number of colony-
forming unit granulocyte-macrophage (CFU-GM), burst-forming
unit-erythroid (BFU-E), and CFU-granulocyte-erythroid-macro-
phage-megakaryocyte (CFU-GEMM) colonies were obtained from
2X10⁵ unfractionated and fractionated nonadherent cells in 5
different experiments (Table S1). As expected, the karyotype of
HS-5 cells was complex: 35,59, XXY, 22, 22, t(2;11), +3, 24, 26,
26, 27, 8, der(8)t(8;14), 10p+, 10q+, 213,der( 13;17), 214,215,
216, +17, 218, der(18;20), 19q+x2, 20, 21p+, +22, +1,2mar[cp6].
No additional cytogenetic abnormalities were detected in Aza plus
GF-treated HS-5 cells.
Engraftment of transdifferentiated HS-5 cells inimmunodeficient mice
Because a subpopulation of the HS-5 transformed cells
expressed the CD34 surface antigen and transformed HS-5 cells
formed hematopoietic colonies (Figure 1; Table S1), we wondered
whether transdifferentiated HS-5 cells would engraft in NOD-Scid
mice. To determine whether these cells home to hematopoietic
tissue sites such as the spine and long bones, we used the
somatostatin type 2 chimeric gene transfer system [54]. HS-5 cells,
stably transfected with hemagglutinin-A-tagged human somato-
statin receptor 2A (SSTR2A) gene, were transformed as described
above and 16105 untreated or Aza plus GF-treated HS-5 cells
were injected intravenously into 8-week-old NOD-Scid mice
4 hours after they had been exposed to 30 cGy total body
irradiation. Three days and 3 weeks later, all mice were injected
with 13 MBq (350 mCi) 111indium-octreotide and imaged
24 hours later with a gamma camera. As shown in Fig. 2A, three
days after injection clear signals were detected in the calvaria of all,
and the spine of two, of the mice that were injected with Aza plus
GF–transformed HS-5 cells but not in mice that were injected with
untreated, stably transfected HS-5 cells. Similarly, no signal was
detected in control mice. Significantly stronger signals were
detected in the limbs and/or spine of all Aza plus GF–transformed
HS-5 cell injected mice three weeks after injection, suggesting that
the injected cells engrafted and multiplied. Background signals
were seen in the spines of some the mice that were injected with
untreated stably transfected HS-5 cells but not in the control mice.
Next, we injected 16 NOD-Scid mice with Aza plus GF–treated
or untreated HS-5 cells. Three weeks later, the mice were
sacrificed, and their bone marrow was harvested, smeared onto
glass slides and stained by immunofluorescence with antibodies to
Nonhematopoietic to Hematopoietic Transformation
PLoS ONE | www.plosone.org 2 June 2011 | Volume 6 | Issue 6 | e21250

Nonhematopoietic to Hematopoietic Transformation
PLoS ONE | www.plosone.org 3 June 2011 | Volume 6 | Issue 6 | e21250
HLA A, B, and C, or suspended in PBS and analyzed by flow
cytometry or injected intravenously into another group of 6 sub-
lethally irradiated NOD-Scid mice. The second group of mice was
sacrificed 3 weeks thereafter, and their bone marrow cells analyzed
as described above. The injected Aza plus GF–treated HS-5 cells
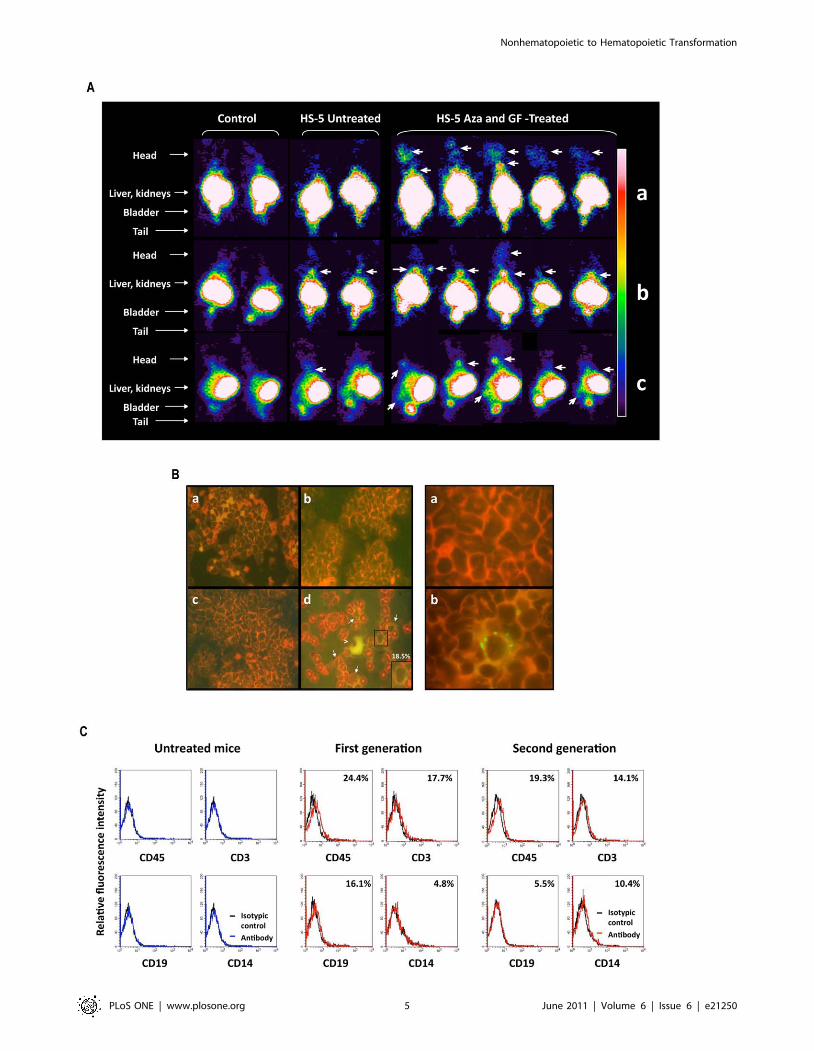
engrafted in all 8 mice. As shown in Figure 2B, 18.5% of bone
marrow cells harvested from mice that were injected with Aza plus
GF–treated HS-5 cells expressed HLA ABC, whereas marrow cells
of mice injected with untreated HS-5 cells did not expressed these
antigens. Furthermore, 24.4% of those cells expressed CD45,
17.7% expressed CD3, 16.1% expressed CD19, and 4.8%
expressed CD14 antigen (Figure 2C). Cells expressing CD45,
CD3, CD19, CD14, and HLA-ABC antigens were detected, both
by flow cytometry and/or immunofluoresecence, in bone marrow
cells, and human CD45 and HLA-ABC antigens by flow
cytometry in blood cells of all sub-lethally irradiated immunode-
ficient mice 3 weeks after intravenous injection of 16105 marrow
cells that were harvested from the bone marrow of mice
transplanted 3 weeks earlier with Aza plus GF–treated HS-5 cells
(Figures 2C and S2), suggesting that a subpopulation of the
transdifferentiated cells harbored a second-generation engraftment
capacity.
Transformation of normal bone marrow stroma cells intohematopoietic cells
In the previous experiments, we used a bone marrow-derived
mesenchymal cell line. Then, we wondered whether Aza together
with GF would also transform normal bone marrow MSCs into
hematopoietic cells. Again, we performed dose- and schedule-
finding studies. We increased the concentration of Aza to 5.0 mg/
ml and used a time schedule identical to that used for HS-5 cells.
After confirming that the adherent stroma layer contained
mesenchymal (CD338+) but not hematopoietic (CD45-) cells, we
incubated the MSCs with Aza, GF, or both and demonstrated that
Aza plus GF transformed normal bone marrow-derived mesen-
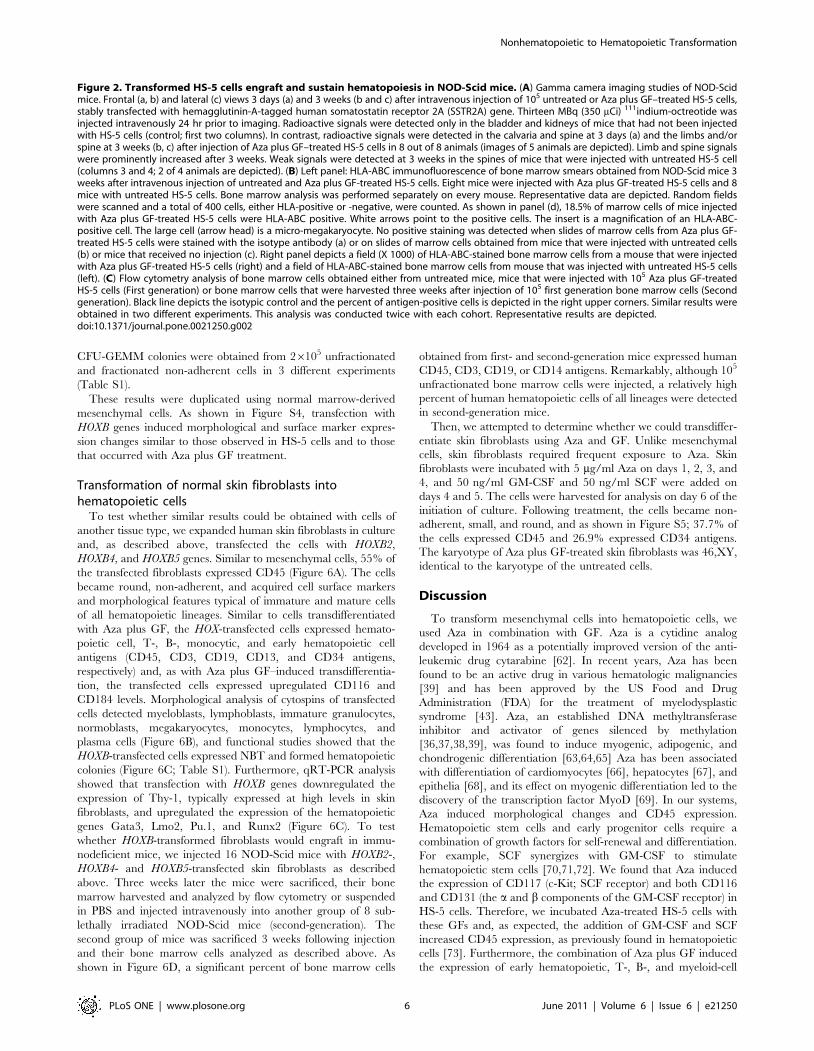
chymal cells into hematopoietic cells (Figure 3A). Similar
experiments were conducted using normal marrow cells from
three additional donors. In all experiments, Aza plus GF
transformed normal marrow MSCs into hematopoietic cells
expressing CD45. In 3 of the 5 experiments, Aza induced low-
level CD45 expression, and the effect of GF alone was negligible
(Figure 3B). The transformed cells were small, round, mostly non-
adherent, and formed hematopoietic colonies when cultured in
methylcellulose using a clonogenic assay (Figure 3C; Table S1).
Gene mRNA and DNA methylation array analysisSeveral studies have demonstrated that various genes and
transcription factors are capable of altering cell fate ([55], and
references therein). Our working hypothesis was that Aza would
hypomethylate lineage-restricting genes, enabling GF and culture
conditions to bring about transition into cells of the hematopoietic
lineage. Therefore, we performed an mRNA array analysis of HS-
5 and normal marrow mesenchymal cells following treatment with
Aza, GF, or GF plus Aza. Analysis of the array data suggested that
of all candidate genes that might be capable of inducing
mesenchymal-to-hematopoietic transition, HOX genes, particular-
ly those of the HOXB family, appeared to be upregulated following
Aza treatment. Indeed, a recent gene expression analysis of both
mouse and human bone marrow revealed that the majority of Hox
genes of the A, B, and C clusters are expressed in hematopoietic
cells, preferentially in hematopoietic stem cell-enriched popula-
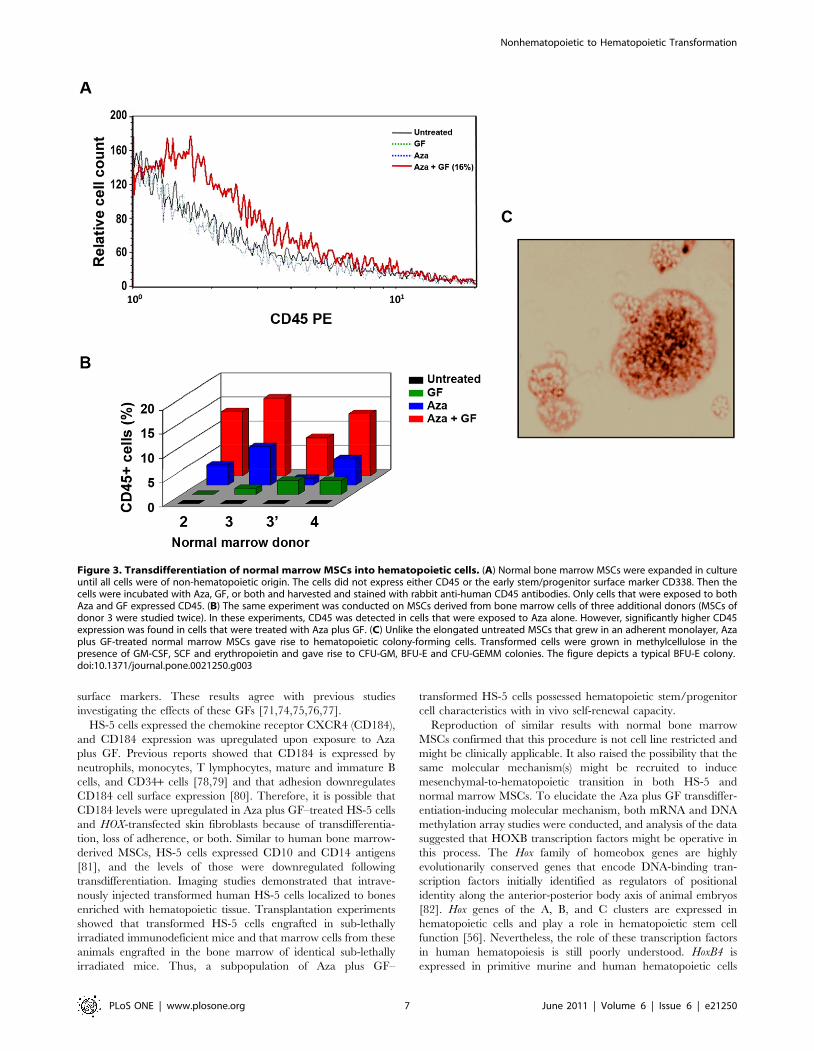
tions [56]. Because HOXB4 and HOXB5 mRNA levels were
upregulated following Aza and GF plus Aza treatment in HS-5
and, to a lesser extent, in normal marrow stroma cells (Figures 4A
and S3) and because Aza treatment unmethylated HOXB4 and
hypomethylated HOXB5 (Figure 4B), we concentrated on these
genes. In addition, since the expression of HOXB2 was slightly
upregulated in normal marrow mesenchymal cells (Figure 4A), we
included HOXB2 in the RT-PCR analysis. RT-PCR analysis of
Aza-treated and -untreated HS-5 cells confirmed the mRNA array
data (Figure 4C). Therefore, we proceeded by testing the effects of
these genes.
Transfection of mesenchymal cells with HOXB2, HOXB4,and HOXB5
Retroviral overexpression studies in mice suggest that Hox genes
play a role in hematopoietic stem cell function [reviewed in Ref.
[56]]. HOXB2 plays a role in the pathogenesis of a rare form of
retinoic acid-resistant acute promyelocytic leukemia. In this rare
leukemia, the promyelocytic leukemia zinc finger (PLZF) gene
activates HOXB2 by binding to its enhancer region [57]. HoxB4 is
expressed in primitive murine and human hematopoietic cells
[58,59], and HoxB5 is hypomethylated and upregulated in mouse
embryo hematopoietic tissue and hypermethylated in adult mice
[60,61]. Taken together, these reports supported our hypothesis
that overexpression of these HOX genes in mesenchymal cells
would enforce a hematopoietic phenotype. We first established
experimental conditions to achieve significant transfection effi-
ciency (Figure 5A, top panel). Similar transfection efficiencies were
obtained with each gene and gene combination. Then we tested
the effects of HOX gene transfection. As shown in the bottom
panel of Figure 5A, HOXB2 induced CD45 expression in only
3.7% of the cells, whereas HOXB4 and HOXB5 constitutively
induced CD45 expression in 15.5% and 17.9% of the cells,
respectively. We then transfected HS-5 cells with 1, 2, or 3 genes
and found that HOXB2 added to the effect of HOXB4 and HOXB5
and that transfection with all genes yielded the highest CD45
expression (Figure 5B). Moreover, the cells became round and
nonadherent, and a side- and forward-scattered analysis revealed
that the cells became smaller (Figure 5C) and a subset of the cells
gave rise to hematopoietic colonies in semisolid culture medium
(Figure 5D). A significant number of CFU-GM, BFU-E, and
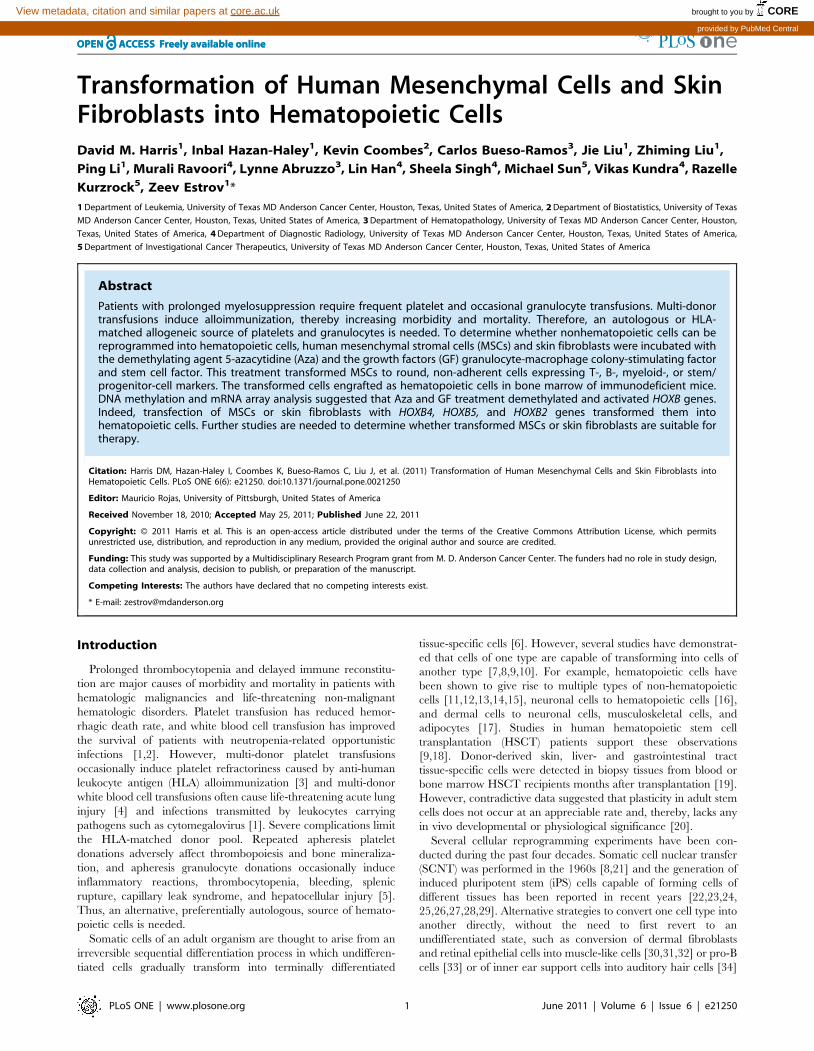
Figure 1. Aza and GF induce hematopoietic cell surface marker expression. (A) Incubation of HS-5 cells with Aza induced the expression ofCD45 in 21.3% of the cells, whereas incubation with Aza plus GF induced CD45 in 41.6% of the cells. Untreated cells did not express CD45, andincubation of HS-5 cells with GF alone did not affect CD45 expression. (B) In another experiment using the same culture conditions, 11.1% of the totalpopulation of Aza plus GF–treated HS-5 cells expressed CD45. In addition, a significant percentage of the total population of treated HS-5 cellsexpressed T-, myeloid-, and B-cell surface markers (CD3, CD14, and CD19, respectively). In addition, the levels of both the GM-CSF receptor (CD116)and the adhesion molecule (CD184) were upregulated. The curves of both untreated and treated cells stained with the isotype antibody overlapped.Therefore only one isotype control curve is depicted. (C) Aza plus GF–treated HS-5 cells became round and non-adherent. Untreated HS-5 cells (Write-Giemsa stain, X 100 magnification) show classical morphological features of elongated spindle like cells (a), a X10 magnification of the cells is shownin the insert (b), and panel (c) shows that Aza plus GF–treated HS-5 cells (Write-Giemsa stain of cytospun nonadherent cells, X 1000 magnification) areround, heterogeneous in size and some of them have cytoplasmic granules. (D) Left panel: a two-color flow cytometry analysis demonstrated that4.1% of viable HS-5 cells treated with Aza plus GF (assessed by side (SSC-H) and forward (FSC-H) scatter analysis; top panel) co-expressed CD45 andCD34 antigens. Right panel: a typical BFU-E colony derived from Aza plus GF–treated HS-5 cells grown in methylcellulose.doi:10.1371/journal.pone.0021250.g001
Nonhematopoietic to Hematopoietic Transformation
PLoS ONE | www.plosone.org 4 June 2011 | Volume 6 | Issue 6 | e21250
Nonhematopoietic to Hematopoietic Transformation
PLoS ONE | www.plosone.org 5 June 2011 | Volume 6 | Issue 6 | e21250
CFU-GEMM colonies were obtained from 26105 unfractionated
and fractionated non-adherent cells in 3 different experiments
(Table S1).
These results were duplicated using normal marrow-derived
mesenchymal cells. As shown in Figure S4, transfection with
HOXB genes induced morphological and surface marker expres-
sion changes similar to those observed in HS-5 cells and to those
that occurred with Aza plus GF treatment.
Transformation of normal skin fibroblasts intohematopoietic cells
To test whether similar results could be obtained with cells of
another tissue type, we expanded human skin fibroblasts in culture
and, as described above, transfected the cells with HOXB2,
HOXB4, and HOXB5 genes. Similar to mesenchymal cells, 55% of
the transfected fibroblasts expressed CD45 (Figure 6A). The cells
became round, non-adherent, and acquired cell surface markers
and morphological features typical of immature and mature cells
of all hematopoietic lineages. Similar to cells transdifferentiated
with Aza plus GF, the HOX-transfected cells expressed hemato-
poietic cell, T-, B-, monocytic, and early hematopoietic cell
antigens (CD45, CD3, CD19, CD13, and CD34 antigens,
respectively) and, as with Aza plus GF–induced transdifferentia-
tion, the transfected cells expressed upregulated CD116 and
CD184 levels. Morphological analysis of cytospins of transfected
cells detected myeloblasts, lymphoblasts, immature granulocytes,
normoblasts, megakaryocytes, monocytes, lymphocytes, and
plasma cells (Figure 6B), and functional studies showed that the
HOXB-transfected cells expressed NBT and formed hematopoietic
colonies (Figure 6C; Table S1). Furthermore, qRT-PCR analysis
showed that transfection with HOXB genes downregulated the
expression of Thy-1, typically expressed at high levels in skin
fibroblasts, and upregulated the expression of the hematopoietic
genes Gata3, Lmo2, Pu.1, and Runx2 (Figure 6C). To test
whether HOXB-transformed fibroblasts would engraft in immu-
nodeficient mice, we injected 16 NOD-Scid mice with HOXB2-,
HOXB4- and HOXB5-transfected skin fibroblasts as described
above. Three weeks later the mice were sacrificed, their bone
marrow harvested and analyzed by flow cytometry or suspended
in PBS and injected intravenously into another group of 8 sub-
lethally irradiated NOD-Scid mice (second-generation). The
second group of mice was sacrificed 3 weeks following injection
and their bone marrow cells analyzed as described above. As
shown in Figure 6D, a significant percent of bone marrow cells
obtained from first- and second-generation mice expressed human
CD45, CD3, CD19, or CD14 antigens. Remarkably, although 105
unfractionated bone marrow cells were injected, a relatively high
percent of human hematopoietic cells of all lineages were detected
in second-generation mice.
Then, we attempted to determine whether we could transdiffer-
entiate skin fibroblasts using Aza and GF. Unlike mesenchymal
cells, skin fibroblasts required frequent exposure to Aza. Skin
fibroblasts were incubated with 5 mg/ml Aza on days 1, 2, 3, and
4, and 50 ng/ml GM-CSF and 50 ng/ml SCF were added on
days 4 and 5. The cells were harvested for analysis on day 6 of the
initiation of culture. Following treatment, the cells became non-
adherent, small, and round, and as shown in Figure S5; 37.7% of
the cells expressed CD45 and 26.9% expressed CD34 antigens.
The karyotype of Aza plus GF-treated skin fibroblasts was 46,XY,
identical to the karyotype of the untreated cells.
Discussion
To transform mesenchymal cells into hematopoietic cells, we
used Aza in combination with GF. Aza is a cytidine analog
developed in 1964 as a potentially improved version of the anti-
leukemic drug cytarabine [62]. In recent years, Aza has been
found to be an active drug in various hematologic malignancies
[39] and has been approved by the US Food and Drug
Administration (FDA) for the treatment of myelodysplastic
syndrome [43]. Aza, an established DNA methyltransferase
inhibitor and activator of genes silenced by methylation
[36,37,38,39], was found to induce myogenic, adipogenic, and
chondrogenic differentiation [63,64,65] Aza has been associated
with differentiation of cardiomyocytes [66], hepatocytes [67], and
epithelia [68], and its effect on myogenic differentiation led to the
discovery of the transcription factor MyoD [69]. In our systems,
Aza induced morphological changes and CD45 expression.
Hematopoietic stem cells and early progenitor cells require a
combination of growth factors for self-renewal and differentiation.
For example, SCF synergizes with GM-CSF to stimulate
hematopoietic stem cells [70,71,72]. We found that Aza induced
the expression of CD117 (c-Kit; SCF receptor) and both CD116
and CD131 (the a and b components of the GM-CSF receptor) in
HS-5 cells. Therefore, we incubated Aza-treated HS-5 cells with
these GFs and, as expected, the addition of GM-CSF and SCF
increased CD45 expression, as previously found in hematopoietic
cells [73]. Furthermore, the combination of Aza plus GF induced
the expression of early hematopoietic, T-, B-, and myeloid-cell
Figure 2. Transformed HS-5 cells engraft and sustain hematopoiesis in NOD-Scid mice. (A) Gamma camera imaging studies of NOD-Scidmice. Frontal (a, b) and lateral (c) views 3 days (a) and 3 weeks (b and c) after intravenous injection of 105 untreated or Aza plus GF–treated HS-5 cells,stably transfected with hemagglutinin-A-tagged human somatostatin receptor 2A (SSTR2A) gene. Thirteen MBq (350 mCi) 111indium-octreotide wasinjected intravenously 24 hr prior to imaging. Radioactive signals were detected only in the bladder and kidneys of mice that had not been injectedwith HS-5 cells (control; first two columns). In contrast, radioactive signals were detected in the calvaria and spine at 3 days (a) and the limbs and/orspine at 3 weeks (b, c) after injection of Aza plus GF–treated HS-5 cells in 8 out of 8 animals (images of 5 animals are depicted). Limb and spine signalswere prominently increased after 3 weeks. Weak signals were detected at 3 weeks in the spines of mice that were injected with untreated HS-5 cell(columns 3 and 4; 2 of 4 animals are depicted). (B) Left panel: HLA-ABC immunofluorescence of bone marrow smears obtained from NOD-Scid mice 3weeks after intravenous injection of untreated and Aza plus GF-treated HS-5 cells. Eight mice were injected with Aza plus GF-treated HS-5 cells and 8mice with untreated HS-5 cells. Bone marrow analysis was performed separately on every mouse. Representative data are depicted. Random fieldswere scanned and a total of 400 cells, either HLA-positive or -negative, were counted. As shown in panel (d), 18.5% of marrow cells of mice injectedwith Aza plus GF-treated HS-5 cells were HLA-ABC positive. White arrows point to the positive cells. The insert is a magnification of an HLA-ABC-positive cell. The large cell (arrow head) is a micro-megakaryocyte. No positive staining was detected when slides of marrow cells from Aza plus GF-treated HS-5 cells were stained with the isotype antibody (a) or on slides of marrow cells obtained from mice that were injected with untreated cells(b) or mice that received no injection (c). Right panel depicts a field (X 1000) of HLA-ABC-stained bone marrow cells from a mouse that were injectedwith Aza plus GF-treated HS-5 cells (right) and a field of HLA-ABC-stained bone marrow cells from mouse that was injected with untreated HS-5 cells(left). (C) Flow cytometry analysis of bone marrow cells obtained either from untreated mice, mice that were injected with 105 Aza plus GF-treatedHS-5 cells (First generation) or bone marrow cells that were harvested three weeks after injection of 105 first generation bone marrow cells (Secondgeneration). Black line depicts the isotypic control and the percent of antigen-positive cells is depicted in the right upper corners. Similar results wereobtained in two different experiments. This analysis was conducted twice with each cohort. Representative results are depicted.doi:10.1371/journal.pone.0021250.g002
Nonhematopoietic to Hematopoietic Transformation
PLoS ONE | www.plosone.org 6 June 2011 | Volume 6 | Issue 6 | e21250
surface markers. These results agree with previous studies
investigating the effects of these GFs [71,74,75,76,77].
HS-5 cells expressed the chemokine receptor CXCR4 (CD184),
and CD184 expression was upregulated upon exposure to Aza
plus GF. Previous reports showed that CD184 is expressed by
neutrophils, monocytes, T lymphocytes, mature and immature B
cells, and CD34+ cells [78,79] and that adhesion downregulates
CD184 cell surface expression [80]. Therefore, it is possible that
CD184 levels were upregulated in Aza plus GF–treated HS-5 cells
and HOX-transfected skin fibroblasts because of transdifferentia-
tion, loss of adherence, or both. Similar to human bone marrow-
derived MSCs, HS-5 cells expressed CD10 and CD14 antigens
[81], and the levels of those were downregulated following
transdifferentiation. Imaging studies demonstrated that intrave-
nously injected transformed human HS-5 cells localized to bones
enriched with hematopoietic tissue. Transplantation experiments
showed that transformed HS-5 cells engrafted in sub-lethally
irradiated immunodeficient mice and that marrow cells from these
animals engrafted in the bone marrow of identical sub-lethally
irradiated mice. Thus, a subpopulation of Aza plus GF–
transformed HS-5 cells possessed hematopoietic stem/progenitor
cell characteristics with in vivo self-renewal capacity.
Reproduction of similar results with normal bone marrow
MSCs confirmed that this procedure is not cell line restricted and
might be clinically applicable. It also raised the possibility that the
same molecular mechanism(s) might be recruited to induce
mesenchymal-to-hematopoietic transition in both HS-5 and
normal marrow MSCs. To elucidate the Aza plus GF transdiffer-
entiation-inducing molecular mechanism, both mRNA and DNA
methylation array studies were conducted, and analysis of the data
suggested that HOXB transcription factors might be operative in
this process. The Hox family of homeobox genes are highly
evolutionarily conserved genes that encode DNA-binding tran-
scription factors initially identified as regulators of positional
identity along the anterior-posterior body axis of animal embryos
[82]. Hox genes of the A, B, and C clusters are expressed in
hematopoietic cells and play a role in hematopoietic stem cell
function [56]. Nevertheless, the role of these transcription factors
in human hematopoiesis is still poorly understood. HoxB4 is
expressed in primitive murine and human hematopoietic cells
Figure 3. Transdifferentiation of normal marrow MSCs into hematopoietic cells. (A) Normal bone marrow MSCs were expanded in cultureuntil all cells were of non-hematopoietic origin. The cells did not express either CD45 or the early stem/progenitor surface marker CD338. Then thecells were incubated with Aza, GF, or both and harvested and stained with rabbit anti-human CD45 antibodies. Only cells that were exposed to bothAza and GF expressed CD45. (B) The same experiment was conducted on MSCs derived from bone marrow cells of three additional donors (MSCs ofdonor 3 were studied twice). In these experiments, CD45 was detected in cells that were exposed to Aza alone. However, significantly higher CD45expression was found in cells that were treated with Aza plus GF. (C) Unlike the elongated untreated MSCs that grew in an adherent monolayer, Azaplus GF-treated normal marrow MSCs gave rise to hematopoietic colony-forming cells. Transformed cells were grown in methylcellulose in thepresence of GM-CSF, SCF and erythropoietin and gave rise to CFU-GM, BFU-E and CFU-GEMM colonies. The figure depicts a typical BFU-E colony.doi:10.1371/journal.pone.0021250.g003
Nonhematopoietic to Hematopoietic Transformation
PLoS ONE | www.plosone.org 7 June 2011 | Volume 6 | Issue 6 | e21250
[58,59], and HoxB5, expressed in mouse embryonic hematopoietic
tissue, is hypermethylated in adult mice [60,61]. HOXB2 likely
plays a role in human hematopoiesis because its activation
contributes to leukemogenesis [57]. Nevertheless, unlike with
HOXB4 or HOXB5, transfection of MSCs with the HOXB2 gene
did not significantly increase but rather enhanced CD45
expression induced by HOXB4 and HOXB5. Remarkably, similar
to Aza plus GF, transfection of HOXB2, 4, and 5 induced
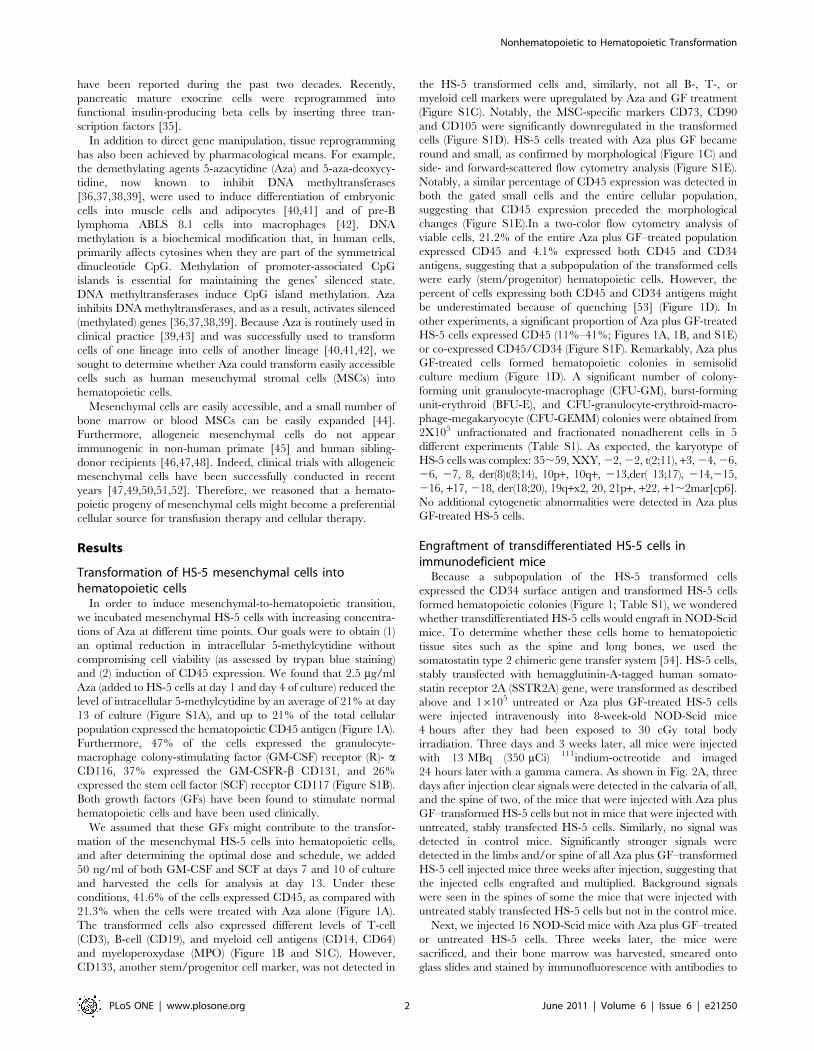
Figure 4. Transdifferentiated mesenchymal cell mRNA and DNA methylation analysis. (A) Heatmap of Agilent mRNA expression data.Both rows (genes) and columns (samples) are clustered using the Ward linkage rule and Pearson correlation to define similarity. Some genes wereevaluated using 2 or more probes. The dominant signal in the data is the split between HS-5 cells (left branch) and normal bone marrow MSCs (rightbranch). A secondary signal, particularly prevalent in the HS-5 cells, is driven by the effects of treatment with or without Aza. (B) Methylation status ofhematopoietic genes. The top portion shows genes that were completely unmethlyated in at least one sample (purple, hypomethylated; gray,methylated). The completely unmethylated genes were omitted before normalization. The bottom portion shows the normalized log ratios from themethylation arrays (blue, weakly methylated; red, strongly methylated). (C) RT-PCR studies detected a significant increase in the expression of HOXB4and HOXB5, but not HOXB2, genes following treatment of HS-5 cells with Aza plus GF. C, control (untreated) cells; T, Aza plus GF-treated cells.doi:10.1371/journal.pone.0021250.g004
Nonhematopoietic to Hematopoietic Transformation
PLoS ONE | www.plosone.org 8 June 2011 | Volume 6 | Issue 6 | e21250
Nonhematopoietic to Hematopoietic Transformation
PLoS ONE | www.plosone.org 9 June 2011 | Volume 6 | Issue 6 | e21250
mesenchymal-to-hematopoietic transition in both HS-5 cells and
normal bone marrow–derived MSCs. These observations prompt-
ed the question of whether HOXB gene transfection of a non-
mesoderm-derived cell could induce hematopoietic transforma-
tion.
To address this question, ectoderm-derived skin fibroblasts were
chosen. Dermal fibroblasts are easily accessible and expandable in
culture, and their morphological features and growth pattern
resemble those of MSCs. Skin is the first tissue that was
successfully transplanted in humans. Furthermore, fresh or frozen
in vitro expanded skin fibroblasts have been successfully used in
clinical trials [83,84,85], and references therein). Transfection of in
vitro expanded human skin fibroblasts with HOXB2, 4, and 5 at a
transfection efficiency similar to that achieved with MSCs yielded
similar results. The fibroblasts transformed into immature and
mature hematopoietic cells of all hematopoietic lineages. Similarly,
fibroblast-to-hematopoietic cell transition was achieved with Aza
plus GF, suggesting that Aza plus GF and HOX activate the same
molecular mechanism to transdifferentiate skin fibroblasts. Re-
markably, HOXB-transformed skin fibroblasts also engrafted in
immunodeficient mice and exhibited a second-generation engraft-
ment capacity. Whether mesenchymal cells or skin fibroblasts,
transformed by Aza plus GF or HoxB gene transfection, would
rescue lethally irradiated mice and reconstitute their entire
hematopoietic system to sustain a normal life span should be
determined in future mouse model studies.
The in vivo life span of platelets and granulocytes is short and,
unlike red blood cells, platelets and granulocytes cannot be
refrigerated for several days. Patients with myelosuppression
require frequent transfusion and, as a result, platelets and
granulocytes from HLA-unmatched donors have been usually
used. Transfusion of a mixed population of mature and immature
cells has prolonged the half-life of transfused granulocytes [1]. We
obtained both mature and immature hematopoietic cells from
transformed mesenchymal and skin cells. Transdifferetiation of
MSCs and skin fibroblasts generated a mixed population of
mature and immature cells such as megakaryocytes, myeloid
progenitor cells and stem/progenitor cells capable of engraftment
in a xenograft mouse model, suggesting that the transdifferentiated
cells might also be suitable for HSCT. As the number of HSCTs
has steadily increased during the past 20 years, a shortage of
suitable donors, particularly for African-American and other
minority group patients, has limited the number of patients to
whom HSCT can be offered. More than 11 million potential stem
cell donors have been registered worldwide (www.bmdw.org).
Nevertheless, only about 40% of all patients in need of an HSCT
from an unrelated donor find a donor with matching HLA-A, -B, -
C, and -DRB1 loci at the allele level [86]. Umbilical cord blood
may potentially emerge as a stem cell source for patients with
hematologic malignancies. However, the clinical use of cord blood
cells has been hampered by the relative paucity of stem cells per
sample [87,88,89] and the lack of an efficient ex vivo stem cell-
expansion protocol [90,91]. Another option, high-dose chemo-
therapy followed by autologous HSCT, has been used for the
treatment of hematologic cancers and several epithelial cancers.
Several graft-purging strategies to remove tumor cells yielded
modest results [92,93], however, and as a result, the use of
autologous HSCT in cancer patients has gradually declined.
Whether transdifferentiated cells from an easily accessible
nonhematopoietic cellular source, such as MSCs or skin
fibroblasts, might be suitable for HSCT remains to be determined.
Taken together, our data suggest that incubation with Aza and
GF, a drug and two hematopoietic growth factors approved for
clinical use, or transfection with HOXB genes, transforms both
human mesenchymal cells and skin fibroblasts into hematopoietic
cells. Further studies to determine whether the transformed cells
are safe for clinical application are warranted.
Materials and Methods
Ethics StatementThis study was approved by the M. D. Anderson Cancer Center
Institutional Review Board and the animal studies were approved
by the Institutional Animal Care and Use Committee at the M.D.
Anderson Cancer Center.
Cell lines and primary cellsThe human marrow-derived HPV-16 (E6/E7)-transformed
stroma cell line HS-5 was obtained from the American Type
Culture Collection (ATCC; Rockville, MD). HS-5 cells were
grown in DMEM a-medium (Gibco, Grand Island, NY)
supplemented with 10% bovine calf serum (BCS; Hyclone, Logan
UT). Leftover samples of bone marrow aspirates from hemato-
logically normal donors were acquired after obtaining informed
consent. Human marrow cells were fractionated using Ficol
Hypaque (Sigma, Saint Louis, MO), and the low-density cell
fraction was washed in culture medium and incubated in DMEM
a-medium supplemented with 20% BCS in T-75 (Becton
Dickinson, Franklin Lake, NJ) or T-25 (Corning, Corning, NY)
tissue culture flasks at 37uC in a humidified 5% CO2 atmosphere.
After 48 hours, non-adherent cells were removed and the
adherent cells were fed, maintained, and split when they reached
70% confluency for at least 8 weeks, until only adherent
mesenchymal stromal cells (MSCs; CD45-, CD14-, CD34-, and
CD338 [early stem/progenitor cell marker]-negative cells) were
present in culture. Human foreskin fibroblasts were obtained from
Lonza Walkersville, Inc. (Walkersville, MD) and maintained in the
media that was provided by the supplier. All cells were grown in
plastic tissue culture flasks at 37uC in a humidified 5% CO2
atmosphere, inspected daily, fed twice weekly, and split once or
twice weekly by using 0.25% trypsin (Gibco). Following trypsin-
ization, cells were washed in PBS (Gibco) and maintained in tissue
culture medium. In different experiments, cells were incubated in
the presence or absence of 2.5 or 5.0 mg/ml 5-azacytidine (Aza),
with or without 50 ng/ml GM-CSF and 50 ng/ml SCF, or
transfected with HOXB genes, as described below. For analysis,
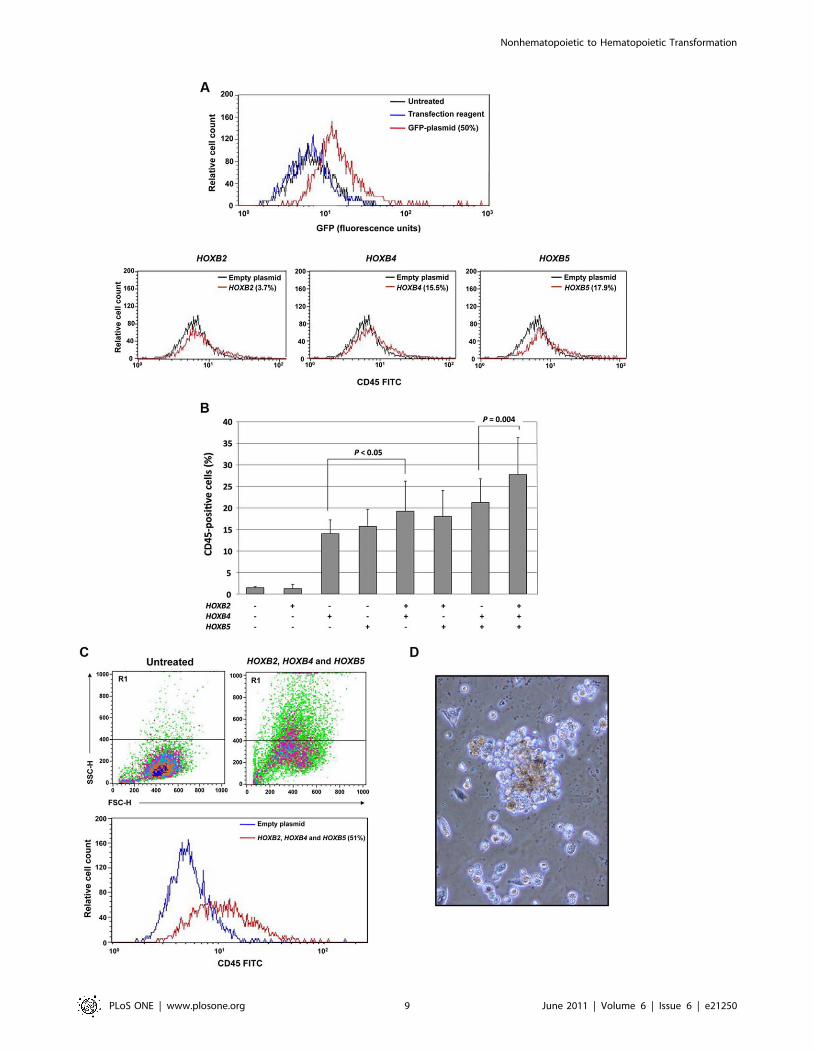
Figure 5. HOXB gene transfection transforms HS-5 cells into hematopoietic cells. (A) The top panel shows that a 50% transfectionefficiency with GFP-tagged plasmid. In all experiments, 40–50% transfection efficiency was obtained. The bottom panel shows that whereas only amarginal change in CD45 expression could be attained by transfection with HoxB2, transfection with HoxB4 and HoxB5 induced CD45 expression in15.5% and 17.9% of cells, respectively. (B) In three separate experiments, transfection of HS-5 cells with HOXB4 or HOXB5, but not HOXB2, inducedCD45 expression. However, co-transfection of HOXB2 with HOXB4, or HOXB2 with HOXB4 and HOXB5, both increased the percentage of cellsexpressing CD45. The figure depicts the means6S.D. of the percentage of CD45-positive cells. (C) Transfection with HOXB2, HOXB4, and HOXB5altered HS-5 cells. The transfected cells became round and small (top panel, right) as compared with untransfected cells (top panel, left) as assessedby side (SSC-H) and forward (FSC-H) scatter analysis, and 51% of the cells expressed CD45 (bottom panel). (D) HS-5 cells transfected with HOXB2,HOXB4, and HOXB5 formed hematopoietic colonies when grown in the CFU-GEMM colony culture assay. A mixed colony containing erythroid,granulocytic and monocyte-macrophage cells is depicted.doi:10.1371/journal.pone.0021250.g005
Nonhematopoietic to Hematopoietic Transformation
PLoS ONE | www.plosone.org 10 June 2011 | Volume 6 | Issue 6 | e21250
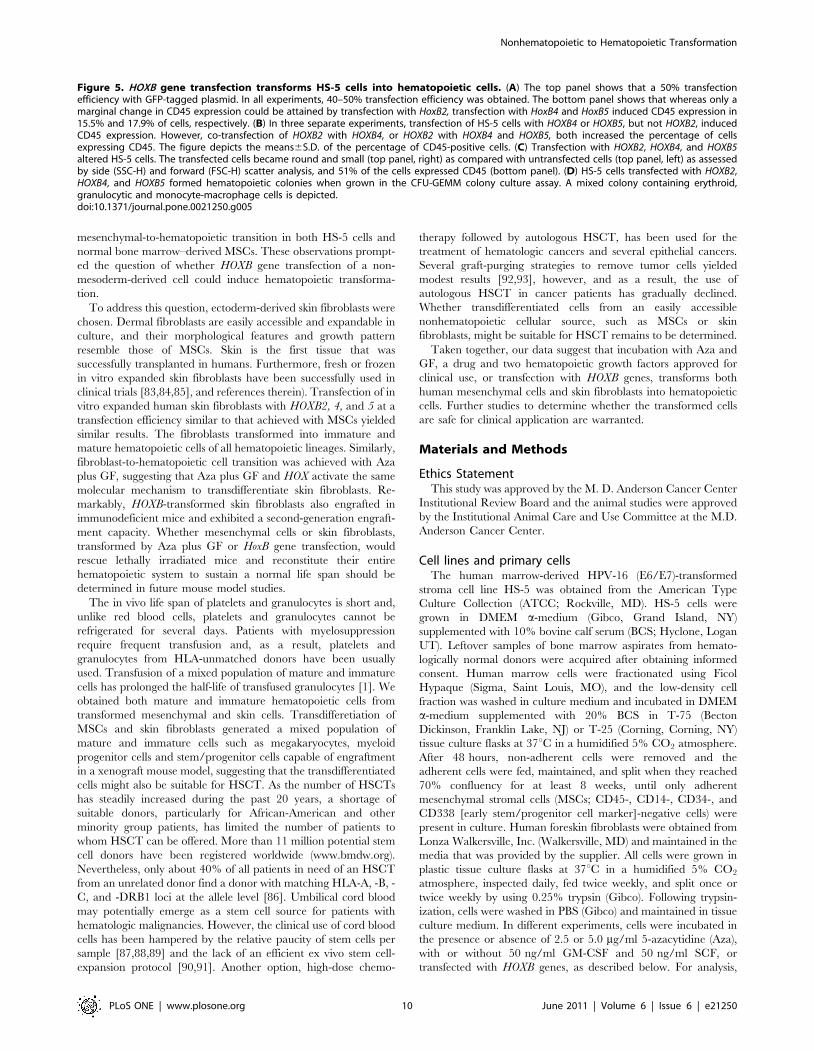
Figure 6. Transformation of skin fibroblasts into hematopoietic cells that engraft in NOD-Scid mice. (A) A 43% transfection efficiency offibroblasts was attained with GFP-tagged plasmid (left, upper panel). Following transfection with HOXB2, HOXB4, and HOXB5, 55% of the cellstransformed into CD45-positive cells (left, lower panel). The transformed cells became small and round (right, lower panel) as compared withuntransfected skin fibroblasts (right, upper panel). (B) Left panel: In a different experiment of co-transfection of skin fibroblasts with HOXB2, HOXB 4,and HOXB5 genes, flow cytometry analysis of transfected skin fibroblasts showed that a significant percentage of the total population of the cellsexpressed the hematopoietic CD45 surface antigen, T-, myeloid-, and B-cell surface markers (CD3, CD14, and CD19, respectively), the immaturehematopoietic cell marker CD34, the GM-CSF receptor CD116, and the adhesion molecule CD184 antigens. The percentage of positive cells isdepicted in the right upper corner of each figure. The curves of both untreated and transfected cells stained with the isotype antibody overlapped.Therefore only one isotype control curve is depicted. Right panel: Morphological analysis of transfected skin fibroblasts cytospun onto glass slidesand stained with Wright-Giemsa demonstrated typical hematologic cell characteristics: (a) cultured untreated skin fibroblasts (X 100 magnification);
Nonhematopoietic to Hematopoietic Transformation
PLoS ONE | www.plosone.org 11 June 2011 | Volume 6 | Issue 6 | e21250
cells were trypsinized, washed, and re-suspended in PBS. Bone
marrow samples were obtained with informed consent. These
studies were performed with the approval of the Institutional
Review Board of The University of Texas M. D. Anderson Cancer
Center.
Flow cytometry analysisCells were re-suspended in 100 ml PBS and split into duplicate
tubes. Twenty microliters antibody or its isotype were added, and
the tubes were incubated in the dark at room temperature for
30 min. After incubation, the cells were washed, re-suspended in
500 ml PBS, and analyzed using the FACSCalibur flow cytometer
(Becton Dickinson Immunocytometry Systems, San Jose, CA).
Data analysis was performed using the software programs
provided by the manufacturer. The cytometer was adjusted using
the isotypic antibody–treated cells to exclude background
fluorescence. A shift from the control curve was calculated as
percent shift beyond control. A previously described method was
used to detect 5-methylcytidine [94,95]. In brief, untreated or
treated cells were fixed and permeabilized using the BD Cytofix/
Cytoperm kit (BD Biosciences, San Diego, CA) in accordance with
the manufacturer’s instructions. After fixation and permeabiliza-
tion, the cells were stained with a mouse anti-human 5-
methylcytidine antibody (Serotec Inc., Raleigh, NC) for 30 min,
washed 3 times with Prewash buffer, and incubated with an RPE-
labeled rabbit anti-mouse IgG (Serotec) antibody for 30 min.
Then the cells were harvested, washed 3 times in buffer, re-
suspended in staining buffer, and analyzed using the FACSCalibur
flow cytometer for any decrease in 5-methylcytidine. The
appropriate isotype antibodies were used to exclude background
staining of untreated and treated cells. For other studies, the
following antibodies and their corresponding isotype controls were
used: mouse anti-human myeloperoxidase (MPO), mouse anti-
human leukocyte antigen (HLA)-ABC, and mouse anti-human
CD3, CD8, CD10, CD13, CD14, CD19, CD20, CD33, CD34,
CD38, CD41, CD45, CD64, CD 73, CD90, CD105, CD116,
CD117, CD131, CD133, CD184 (Becton Dickinson, San Diego,
CA), and CD338 (Biolegend, San Diego, CA). In some
experiments non-viable cells were excluded using the Miltenyi
dead cell removal kit (Miltenti Biotec Inc., Auburn, CA).
Morphological analysisCultured adherent or cytospun non-adherent cells were stained
with Write-Giemsa using a standard staining technique. Cyto-
chemistry with terminal deoxynucleotidyl transferase (TdT),
butyrate, and glycophorine A and immunocytochemistry staining
with anti-Kit antibodies were performed according to the M. D.
Anderson Cancer Center standard diagnostic laboratory proce-
dures. Nitroblue tetrazolium (NBT) staining was performed using
the NBT reduction kit (Sigma, St. Louis, MO) in accordance with
the manufacturer’s instructions.
Colony culture assayTo detect hematopoietic colonies, the colony-forming unit
granulocyte-erythroid-macrophage-megakaryocyte assay (CFU-
GEMM) was used [96]. Briefly, non-adherent or fractionated (by
using the Dead Cell Removal Kit; Miltenyi Biotec, Auburn, CA)
26105 cells were cultured in 0.8% methylcellulose in Iscove’s
modified Dulbecco’s medium supplemented with 10% FCS,
50 ng/ml SCF (Amgen Inc., Thousand Oaks, CA), 50 ng/ml
GM-CSF (Immunex Corp., Seattle, WA), and 1.0 units/ml
human erythropoietin (Amgen). One milliliter of the culture
mixture was placed in 35-mm Petri dishes in duplicate and
incubated at 37uC in a humidified atmosphere of 5% CO2 in air.
All cultures were evaluated after 14 days for the presence of burst-
forming units-erythroid (BFU-E) and colony-forming unit granu-
locyte-macrophage (CFU-GM). A BFU-E was defined as an
aggregate of .500 hemoglobinized cells or three or more
erythroid subcolonies, a CFU-GM was defined as a cluster of
.50 granulocyte and/or monocyte/macrophage cells whereas a
CFU-GEMM as defined as an aggregate of subcolonies containing
erythroid, granulocytes and monocyte-macrophage elements.
Cytogenetic analysisUntreated trypsinized cells and non-adherent transformed cells
were spun down and exposed to hypotonic solution (0.06 M, KC1)
for 10 minutes at room temperature. After centrifugation at
1,700 rpm for 5 minutes, the supernatant was discarded, the cell
pellet was fixed in a mixture of methanol and acetic acid (3:1 by
volume), and washed three times with a fixative. Fixed cells were
dropped on glass slides, and air-dried chromosome preparations
were made. Slides were G-banded following the routinely used
technique. At least 20 G-banded metaphase spreads from
untreated as well as transformed cells were microscopically
evaluated.
Xenograft studies in NOD-Scid miceAll animal work was done in accordance with a protocol
approved by the Institutional Animal Care and Use Committee.
Eight-week-old female NOD-Scid mice (strain NOD.CB17-
PRKDS SCID\J) were obtained from the Jackson Laboratory
(Bar Harbor, MI) and maintained in our institutional animal
facility. After exposure to 30 cGy sub-lethal whole-body radiation,
16105 untreated or transformed cells (either Aza plus GF-treated
or HoxB-transfected) HS-5 cells or skin fibroblasts were injected
intravenously. After 3 weeks, imaging studies were performed as
described below. The mice were sacrificed and marrow cells were
flushed out of both tibias. These cells were analyzed or injected
(b) immature myeloid and lymphoid blasts (insert shows TdT nuclear immunofluorescent staining). The red depicts DNA (propidium iodide stain) andthe bright green is nuclear TdT in lymphoblasts (X 1000); (c) mature granulocyte (X 1000). Insert shows an early granulocyte precursor immuno-stained with anti-Kit antibodies (X 1000); (d) a monocyte (X 500) insert shows a monocyte stained with butyrate; (e) a megakaryocyte with plateletmembrane demarcations (X 500); (f) normoblasts stained with glycophorine A (X 1000); (g) a lymphocyte (X 1000); (h) a plasma cell (X 1000) withcytoplasmic inclusions (Russell bodies). (C) Left panel: skin fibroblasts transfected with HoxB genes differentiate into functional myeloid cells. Threecells (X 100) expressing NBT (dark blue dots) are depicted. Middle panel: skin fibroblasts transfected with HoxB genes form hematopoietic colonies in4 different experiments. A BFU-E colony grown in the CFU-GEMM colony culture assay is depicted. Right panel: transfection of HoxB2, HoxB4 andHoxB5 genes alters skin fibroblast gene expression. Results of qRT-PCR analysis of Thy-1, gata3, Lmo2, Pu.1, and Runx2 gene levels are depicted asfold change (decrease or increase) relative to mRNA levels in empty plasmid-transfected cells. Data from three different experiments are depicted.The means6S.D. of changes in mRNA levels are shown. (D) Flow cytometry analysis of bone marrow cells obtained either from untreated NOD-Scidmice, NOD-Scid mice that were injected with 105 HOXB2-, HOXB4- and HOXB5-transfected skin fibroblasts (First generation), or bone marrow cells thatwere harvested three weeks after injection of 105 first generation bone marrow cells (Second generation). Black line depicts the isotypic control andthe percent of antigen-positive cells is depicted in the right upper corners. Human hematopoietic cells were detected in bone marrow cells of all firstand second generation mice. The Figure depicts a representative experiment.doi:10.1371/journal.pone.0021250.g006
Nonhematopoietic to Hematopoietic Transformation
PLoS ONE | www.plosone.org 12 June 2011 | Volume 6 | Issue 6 | e21250
into another batch of sub-lethally irradiated mice that were
sacrificed 3 weeks thereafter. The mice were sacrificed in
accordance with the experimental protocol when they became
moribund or unable to obtain food or water or if they lost .20%
of their body weight.
Mouse imaging studiesHS-5 cells were stably transfected with the hemagglutinin-A-
tagged human somatostatin receptor type 2A (hsstr2) gene [54].
Stably transfected HS-5 cells were incubated with or without Aza
plus GF, as described above, and 16105 transformed or
untransformed cells were injected intravenously into 2-month-
old NOD-Scid mice. Twenty four hours before imaging the mice
were anesthetized with 2% isofluorane and injected via tail vein
with 300 mCi of 111indium-octreotide (Mallinckrodt, St. Louis,
MO) and anesthetized and imaged the next day using a gamma
camera (mCAM; Siemens Medical Solutions, Hoffman Estates, IL)
fitted with a medium-energy parallel-hole collimator, as previously
described [97]. Planar imaging studies were performed 3 days and
3 weeks after injection of transfected HS-5 cells.
ImmunofluoresecenceGlass slides with cytospun mouse blood or bone marrow cells
were stored at 4uC. For analysis, the slides were incubated with
normal mouse serum (Sigma, St. Louis, MO) for 1 hr in a humid
environment and washed 3 times for 5 min in PBS (Gibco). Then,
20 ml of either rabbit anti-HLA-ABC, -CD45, -CD14, or -CD3
FITC-labeled antibodies or their isotype (Becton Dickinson) were
added, the glass slides were covered with a plastic coverslip, and
the slides were incubated in the dark at room temperature for 1 hr.
After incubation, the slides were counterstained with 0.1% Evan’s
blue solution (Sigma) washed 3 times in PBS, dried, and mounted
with Vectashield mounting media for fluorescence (Vector
Laboratories, Burlingame, CA). All slides were scanned, analyzed,
and photographed using a fluorescence microscope (Olympus,
Center Valley, PA).
mRNA and methylation gene arraysUntreated and GF-, Aza-, or GF+Aza-treated HS-5 cells or
normal marrow stroma cells were subjected to mRNA expression
array analysis, and untreated or Aza-treated HS-5 cells or normal
marrow stroma cells were subjected to a DNA methylation array
analysis. Hematopoietic gene microarrays were purchased from
Agilent Technologies (Santa Clara, CA). RNA was isolated and
amplified using standard procedure, and fluorescent cRNA was
synthesized from total RNA using the manufacturer’s low-input
RNA fluorescent linear amplification kit. The kit uses Cy5-CTP
(633 nm test channel) and Cy3-CTP (532 nm reference channel)
as the fluorescent dyes. One microgram of total RNA was used for
the amplification and labeling. For all hybridizations, 750 ng of
labeled cRNA sample was used for both Cy5 and Cy3 channels.
After hybridization, the arrays were scanned by the Agilent
Scanner, producing raw image files. Scanned images were
quantified using version 8.1.1.1 of the Agilent Feature Extractor
software. Quantification files were loaded into version 2.8.1 of the
R statistical software package for processing and analysis (http://
www.R-project.org). Median estimates of local background were
subtracted from the median estimates of foreground at all spots in
each channel of each array, and the data were transformed by
computing the base-two logarithm. Control spots were removed
before performing within-slide loess normalization between the
red and green channels. Between-array normalization was
performed by aligning the 75th percentiles. Preliminary analysis
to detect dye effects identified approximately 300 spots on the
44 K array that were affected by the dye. In most cases, the dye
effect could be attributed to saturation, which was more common
in the red channel than in the green channel. Saturated spots were
flagged and removed from further analyses. HS-5 and normal
marrow MSCs cells were analyzed separately using per-gene two-
way ANOVAs with interaction to estimate the effects of Aza
treatment or GF treatment. Multiple testing was accounted for by
fitting a b-uniform mixture model [98] to the P-values measuring
the overall significance of the ANOVA models.
The ChiP-GLAS technology for detection of methylated genes
(Aviva Systems Biology, San Diego, CA) was used. Briefly, DNA
was obtained using standard procedure and split into two
samples. One sample was used as the input control (total
genomic DNA; green Cy3 channel) and the other for enrichment
of methylated DNA (red Cy5 channel). The DNA was
biotinylated and annealed with oligos. Each oligo corresponded
to one half of each of the 40mers on the microarray. Excess (un-
annealed) oligos were removed using streptavidin magnetic
beads. Annealed adjacent (paired) oligos were ligated with Taq
ligase. Ligated oligos served as templates for amplification with
fluorescently labeled primers. Labeled samples were combined
and hybridized onto the ChiP-GLAS microarray, scanned, and
analyzed. Because standard microarray normalization methods
assume that the distributions are the same in the two channels, a
multi-step procedure to account for the expected differences was
developed. First, the distribution of background intensities over
the entire array was tested, and then spots whose foreground
intensity was below the 99th percentile of background in each
channel were flagged as ‘‘undetectable.’’ In the green channel
(total genomic DNA), between 603 and 675 spots were
undetectable in at least one array. Of those spots, 547, including
all 288 known blanks, were always undetectable. Moreover, 99%
of the spots that were undetectable in the green channel were
also undetectable in the methylation-enriched red channel. In
the red channel, there were between 1240 and 5876 undetect-
able spots, and these varied widely from one sample to another.
The 710 spots that were undetectable in at least one green
channel were designated as ‘‘Negative Controls,’’ and spots
undetectable in a red channel but not the corresponding green
channel were designated as ‘‘Hypomethylated.’’ For normaliza-
tion purposes, all spots that were Negative Controls or
‘‘Unmethylated’’ on at least one array were removed from
consideration. The remaining spots, which gave measurable
values in both channels of all arrays, were used for loess
normalization between the channels on an array. After
normalization, the only evidence of differential methylation
within an array came from a relatively small number of spots
whose mean log intensity was greater than 10 and which were
more than 4 times the median absolute deviation (MAD) away
from the identity line. In all cases, these spots were more highly
expressed in the methylation-enriched red channel, and so these
spots were flagged as ‘‘Hypermethylated’’.
Reverse transcriptase polymerase chain reaction (RT-PCR)Total RNA was extracted from treated or untreated cells using
the Total RNA purification kit (Norgen, Thorold, ON, Canada).
Reverse transcription reaction was performed with 500 ng of total
RNA in a final volume of 20 ml, using M-MuLV Reverse
Transcriptase (Roche, Mannheim, Germany) according to the
manufacturer-developed procedure. Two microliters of cDNA
templates were used for each 50-ml PCR reaction containing
0.5 mM of actin, HOXB2, HOXB4, or HOXB5 gene expression
primers that were provided by the manufacturer (Applied
Biosystems, Stockholm, Sweden). PCR was performed with Taq
Nonhematopoietic to Hematopoietic Transformation
PLoS ONE | www.plosone.org 13 June 2011 | Volume 6 | Issue 6 | e21250

DNA polymerase (Roche) in accordance with the manufacturer’s
instructions. The reaction mixture was heated for 1 min at 94uCand then run for 30 cycles of 94uC for 30 sec, 50uC for 1 min, and
72uC for 1 min, with a final extension of 10 min at 72uC. The
PCR products were detected on 2% agarose E-Gel (Invitrogen)
containing ethidium bromide. The gels were visualized using a
FluorChem 8900 imager (Alpha Innotech Corporation, San
Leandro, CA).
Gene transfectionThe GFP-tagged plasmid and DNA transfection-ready system
of HOXB2, HOXB4, and HOXB5 was obtained from Origene
(Rockville, MD). The DNA was diluted in water in accordance
with the manufacturer’s instructions. Six-hundred microliters of
serum-free Optimem (Gibco) was added to sterile tubes and
mixed with 2–6 ml (for each 1 mg of DNA) TurboFectin (Origene)
and incubated for 5–10 min. Then, 3 mg DNA was added and
the tube was incubated for 15–30 min at room temperature.
Tissue culture flasks containing cells at a confluence of 50% to
60% were washed with fresh medium, and the Optimem/
TurboFectin/DNA mix was carefully added drop-wise and the
flasks incubated for 48 hr. After 48 hr, fresh Optimem/
TurboFectin/DNA mix was prepared and added to the cells as
described above. After an additional 48 hr, the cells were
harvested for further study.
Quantitative real-time PCR (qRT-PCR)RNA was isolated using the RNeasy purification procedure
(Qiagen, Inc.). RNA quality and concentration were analyzed with
a NanoDrop spectrophotometer (ND-1000, NanoDrop technolo-
gies, Wilmington, Delaware). Ten micrograms of total RNA was
used in one-step RT-PCR (Applied Biosystems, Foster City, CA)
with the sequence detection system ABI Prism 7700 (Applied
Biosystems) using TaqMan gene expression assay for Thy1, Gata3,
Lmo2, Pu.1, Runx2, and 18S (house keeping gene control),
according to the manufacturer’s instructions. Samples were run in
triplicate, and relative quantification was performed by comparing
the values obtained at the fractional cycle number at which the
amount of amplified target reaches a fixed (CT) threshold.
Supporting Information
Figure S1 Demethylation efficiency and surface marker expres-
sion of Aza- or Aza plus GF-treated HS-5 cells. (A) To determine
demethylation efficacy, methylcytidine levels of untreated and
Aza-treated cells were determined by flow cytometry. The figure
depicts an experiment in which treatment with Aza reduced
methylcytidine levels from 71% to 50%. (B) Incubation of HS-5
cells with Aza induced the expression of CD116 (left panel),
CD131 (middle panel) and (CD117 right panel). (C) Cell surface
marker analysis of Aza plus GF-transformed HS-5 cells. As shown
in the figure, Aza plus GF treatment downregulated the expression
of CD10, CD13, CD20, and CD117 and upregulated the
expression of CD34, CD64, and MPO. (D) In addition, Aza plus
GF treatment significantly downregulated the expression of the
MSC markers CD73, CD90, and CD105. (E) Treatment of HS-5
cells with Aza plus GF induced morphological changes. The cells
became round and smaller, as assessed by forward- and side-
scattered FACS analysis (left panel). Thirty-four percent of the
cells became CD45 positive (right upper panel), and 39% of the
gated cells (R1, left lower panel) were CD45 positive (right lower
panel). (F) Co-expression of CD45/CD34 in Aza plus GF-
transformed HS-5 cells. Data from 11 different experiments are
depicted. The curves of both untreated and treated cells stained
with the isotype antibody overlapped. Therefore only one isotype
control curve is depicted.
(TIF)
Figure S2 Analysis of bone marrow cells from mice that were
injected with HS-5 cells. (A) Upper panel: bone marrow slides
obtained from mice 3 weeks following injection with untreated
(Untreated) or Aza plus GF-treated HS-5 cells (Treated) and
immunofluorescently stained with rabbit anti-human CD45,
CD14, or CD3 antibodies. Positively stained cells (white arrows)
were detected in marrow slides from Treated but not from
untreated mice. Bone marrow slides of treated mice did not stain
positively with isotype antibodies (not shown). (B) Lower panel:
bone marrow cells, harvested from NOD-Scid mice 3 weeks
following intravenous injection with untreated or Aza plus GF-
treated HS-5 cells were injected intravenously into sub-lethally
irradiated (30 cGy) NOD-Scid mice. Three weeks later, the mice
were sacrificed and their bone marrow was harvested, smeared
onto glass slides and stained with anti-HLA-ABC antibodies, and
their peripheral blood mononuclear cells were stained with anti-
HLA-ABC antibodies and analyzed using flow cytometry.
Arrows point to the HLA-ABC-positive cells of the mice that
were injected with bone marrow cells of mice treated with Aza
plus GF-treated HS-5 cells (Treated). (C) Flow cytometry
analysis of mononuclear peripheral blood cells obtained from 4
mice that were injected with bone marrow cells of mice treated
with Aza plus GF-treated HS-5 cells (second generation). The
Figure depicts the percent6S.D. of human CD45-positive and
HLA-ABC-positive mononuclear cells in mouse peripheral
blood.
(TIF)
Figure S3 Heatmap of Agilent mRNA expression data.
Heatmap of Agilent mRNA expression data, including all genes
whose standard deviation is at least 0.7. Both rows (genes) and
columns (samples) are clustered using the Ward linkage rule and
Pearson correlation to define similarity. The dominant signal in
the data is the split between HS-5 cells (left branch) and normal
bone marrow MSCs (right branch). A secondary signal, particu-
larly prevalent in the HS-5 cells, is driven by the effects of
treatment with or without Aza. The list of the analyzed genes is
provided at http://bioinformatics.mdanderson.org/Supplements/
Datasets/EstrovStemCell.
(TIF)
Figure S4 Transfection with HOXB2, HOXB4, and HOXB5
transforms normal bone marrow-derived MSCs into hematopoi-
etic cells. (A) Normal marrow MSCs transfected with HOXB2,
HOXB4, and HOXB5 became round and small (top panel, right) as
compared with untransfected cells (top panel, left), and 55% of the
cells expressed CD45 antigen. (B) Normal marrow MSCs
transfected with HOXB2, HOXB4, and HOXB5 give rise to
hematopoietic colonies when cultured in the CFU-GEMM colony
culture assay. A typical BFU-E is depicted.
(TIF)
Figure S5 Aza plus GF-treated skin fibroblasts transform into
hematopoietic cells. Skin fibroblasts were incubated with 5 mg/ml
Aza on days 1, 2, 3, and 4, and 50 ng/ml GM-CSF and 50 ng/ml
SCF were added on days 4 and 5. The cells were harvested for
analysis on day 6. As shown in the upper panel, Aza plus GF-
treated fibroblasts transformed into small, round cells. Flow
cytometry analysis, performed after exclusion of non-viable cells,
revealed that 37.7% of the cells expressed CD45 and 26.9%
expressed CD34 antigen (lower panel).
(TIF)
Nonhematopoietic to Hematopoietic Transformation
PLoS ONE | www.plosone.org 14 June 2011 | Volume 6 | Issue 6 | e21250
Table S1 The types and numbers of hematopoietic colonies
grown from transformed HS-5 cells, normal bone marrow MSCs,
HOX-transfected HS-5 cells, and HOX-transfected skin fibroblasts.
(PPTX)
Acknowledgments
We thank Dr. Gideon Strassman for critical review of our preliminary data
and for his intellectual input, Dr. Jeffrey Jorgensen for his contribution to
the initial cell surface marker analysis, and Dawn Chalaire for editing the
manuscript.
Author Contributions
Conceived and designed the experiments: DMH ZE. Performed the
experiments: IH-H JL ZL PL MR LH LA SS VK MS RK. Analyzed the
data: IH-H KC CB-R. Contributed reagents/materials/analysis tools: ZE.
Wrote the paper: ZE.
References
1. Freireich EJ (2000) Supportive care for patients with blood disorders.
Br J Haematol 111: 68–77.
2. Jendiroba DB, Freireich EJ (2000) Granulocyte transfusions: from neutrophil
replacement to immunereconstitution. Blood Rev 14: 219–227.
3. Rebulla P (2005) A mini-review on platelet refractoriness. Haematologica 90:
247–253.
4. Sachs UJ (2007) The pathogenesis of transfusion-related acute lung injury and
how to avoid this serious adverse reaction of transfusion. Transfus Apher Sci 37:
273–282.
5. Winters JL (2006) Complications of donor apheresis. J Clin Apher 21: 132–
141.
6. Weissman IL (2000) Stem cells: units of development, units of regeneration, and
units in evolution. Cell 100: 157–168.
7. Orkin SH, Zon LI (2008) Hematopoiesis: an evolving paradigm for stem cell
biology. Cell 132: 631–644.
8. Hochedlinger K, Jaenisch R (2006) Nuclear reprogramming and pluripotency.
Nature 441: 1061–1067.
9. Korbling M, Katz RL, Khanna A, Ruifrok AC, Rondon G, et al. (2002)
Hepatocytes and epithelial cells of donor origin in recipients of peripheral-blood
stem cells. N Engl J Med 346: 738–746.
10. Slack JM (2007) Metaplasia and transdifferentiation: from pure biology to the
clinic. Nat Rev Mol Cell Biol 8: 369–378.
11. Eglitis MA, Mezey E (1997) Hematopoietic cells differentiate into both microglia
and macroglia in the brains of adult mice. Proc Natl Acad Sci U S A 94:
4080–4085.
12. Gussoni E, Soneoka Y, Strickland CD, Buzney EA, Khan MK, et al. (1999)
Dystrophin expression in the mdx mouse restored by stem cell transplantation.
Nature 401: 390–394.
13. Brazelton TR, Rossi FM, Keshet GI, Blau HM (2000) From marrow to brain:
expression of neuronal phenotypes in adult mice. Science 290: 1775–1779.
14. Lagasse E, Connors H, Al-Dhalimy M, Reitsma M, Dohse M, et al. (2000)
Purified hematopoietic stem cells can differentiate into hepatocytes in vivo. Nat
Med 6: 1229–1234.
15. Krause DS, Theise ND, Collector MI, Henegariu O, Hwang S, et al. (2001)
Multi-organ, multi-lineage engraftment by a single bone marrow-derived stem
cell. Cell 105: 369–377.
16. Bjornson CR, Rietze RL, Reynolds BA, Magli MC, Vescovi AL (1999) Turning
brain into blood: a hematopoietic fate adopted by adult neural stem cells in vivo.
Science 283: 534–537.
17. Toma JG, Akhavan M, Fernandes KJ, Barnabe-Heider F, Sadikot A, et al.
(2001) Isolation of multipotent adult stem cells from the dermis of mammalian
skin. Nat Cell Biol 3: 778–784.
18. Okamoto R, Yajima T, Yamazaki M, Kanai T, Mukai M, et al. (2002) Damaged
epithelia regenerated by bone marrow-derived cells in the human gastrointes-
tinal tract. Nat Med 8: 1011–1017.
19. Korbling M, Estrov Z (2003) Adult stem cells for tissue repair - a new therapeutic
concept? N Engl J Med 349: 570–582.
20. Wagers AJ, Weissman IL (2004) Plasticity of adult stem cells. Cell 116: 639–648.
21. Gurdon JB (2006) From nuclear transfer to nuclear reprogramming: the reversal
of cell differentiation. Annu Rev Cell Dev Biol 22: 1–22.
22. Takahashi K, Yamanaka S (2006) Induction of pluripotent stem cells from
mouse embryonic and adult fibroblast cultures by defined factors. Cell 126:
663–676.
23. Takahashi K, Tanabe K, Ohnuki M, Narita M, Ichisaka T, et al. (2007)
Induction of pluripotent stem cells from adult human fibroblasts by defined
factors. Cell 131: 861–872.
24. Yu J, Vodyanik MA, Smuga-Otto K, Antosiewicz-Bourget J, Frane JL, et al.
(2007) Induced pluripotent stem cell lines derived from human somatic cells.
Science 318: 1917–1920.
25. Hanna J, Wernig M, Markoulaki S, Sun CW, Meissner A, et al. (2007)
Treatment of sickle cell anemia mouse model with iPS cells generated from
autologous skin. Science 318: 1920–1923.
26. Wernig M, Meissner A, Foreman R, Brambrink T, Ku M, et al. (2007) In vitro
reprogramming of fibroblasts into a pluripotent ES-cell-like state. Nature 448:
318–324.
27. Park IH, Zhao R, West JA, Yabuuchi A, Huo H, et al. (2008) Reprogramming
of human somatic cells to pluripotency with defined factors. Nature 451:
141–146.
28. Dimos JT, Rodolfa KT, Niakan KK, Weisenthal LM, Mitsumoto H, et al.(2008) Induced pluripotent stem cells generated from patients with ALS can be
differentiated into motor neurons. Science 321: 1218–1221.
29. Ebert AD, Yu J, Rose FF, Jr., Mattis VB, Lorson CL, et al. (2009) Induced
pluripotent stem cells from a spinal muscular atrophy patient. Nature 457:277–280.
30. Choi J, Costa ML, Mermelstein CS, Chagas C, Holtzer S, et al. (1990) MyoD
converts primary dermal fibroblasts, chondroblasts, smooth muscle, and retinalpigmented epithelial cells into striated mononucleated myoblasts and multinu-
cleated myotubes. Proc Natl Acad Sci U S A 87: 7988–7992.
31. Shen CN, Slack JM, Tosh D (2000) Molecular basis of transdifferentiation of
pancreas to liver. Nat Cell Biol 2: 879–887.
32. Xie H, Ye M, Feng R, Graf T (2004) Stepwise reprogramming of B cells into
macrophages. Cell 117: 663–676.
33. Cobaleda C, Jochum W, Busslinger M (2007) Conversion of mature B cells intoT cells by dedifferentiation to uncommitted progenitors. Nature 449: 473–477.
34. Izumikawa M, Minoda R, Kawamoto K, Abrashkin KA, Swiderski DL, et al.
(2005) Auditory hair cell replacement and hearing improvement by Atoh1 gene
therapy in deaf mammals. Nat Med 11: 271–276.
35. Zhou Q, Brown J, Kanarek A, Rajagopal J, Melton DA (2008) In vivoreprogramming of adult pancreatic exocrine cells to beta-cells. Nature 455:
627–632.
36. Jones PA (1985) Altering gene expression with 5-azacytidine. Cell 40: 485–486.
37. Bird A (2002) DNA methylation patterns and epigenetic memory. Genes Dev
16: 6–21.
38. Feinberg AP, Vogelstein B (1983) Hypomethylation of ras oncogenes in primary
human cancers. Biochem Biophys Res Commun 111: 47–54.
39. Issa JP (2007) DNA methylation as a therapeutic target in cancer. Clin CancerRes 13: 1634–1637.
40. Constantinides PG, Jones PA, Gevers W (1977) Functional striated muscle cellsfrom non-myoblast precursors following 5-azacytidine treatment. Nature 267:
364–366.
41. Constantinides PG, Taylor SM, Jones PA (1978) Phenotypic conversion of
cultured mouse embryo cells by aza pyrimidine nucleosides. Dev Biol 66: 57–71.
42. Boyd AW, Schrader JW (1982) Derivation of macrophage-like lines from thepre-B lymphoma ABLS 8.1 using 5-azacytidine. Nature 297: 691–693.
43. Kaminskas E, Farrell A, Abraham S, Baird A, Hsieh LS, et al. (2005) Approvalsummary: azacitidine for treatment of myelodysplastic syndrome subtypes. Clin
Cancer Res 11: 3604–3608.
44. Uccelli A, Moretta L, Pistoia V (2008) Mesenchymal stem cells in health anddisease. Nat Rev Immunol 8: 726–736.
45. Devine SM, Cobbs C, Jennings M, Bartholomew A, Hoffman R (2003)Mesenchymal stem cells distribute to a wide range of tissues following systemic
infusion into nonhuman primates. Blood 101: 2999–3001.
46. Horwitz EM, Prockop DJ, Fitzpatrick LA, Koo WW, Gordon PL, et al. (1999)
Transplantability and therapeutic effects of bone marrow-derived mesenchymalcells in children with osteogenesis imperfecta. Nat Med 5: 309–313.
47. Horwitz EM, Gordon PL, Koo WK, Marx JC, Neel MD, et al. (2002) Isolated
allogeneic bone marrow-derived mesenchymal cells engraft and stimulategrowth in children with osteogenesis imperfecta: Implications for cell therapy
of bone. Proc Natl Acad Sci U S A 99: 8932–8937.
48. Koc ON, Day J, Nieder M, Gerson SL, Lazarus HM, et al. (2002) Allogeneic
mesenchymal stem cell infusion for treatment of metachromatic leukodystrophy(MLD) and Hurler syndrome (MPS-IH). Bone Marrow Transplant 30: 215–222.
49. Lazarus HM, Haynesworth SE, Gerson SL, Rosenthal NS, Caplan AI (1995) Exvivo expansion and subsequent infusion of human bone marrow-derived stromal
progenitor cells (mesenchymal progenitor cells): implications for therapeutic use.Bone Marrow Transplant 16: 557–564.
50. Koc ON, Gerson SL, Cooper BW, Dyhouse SM, Haynesworth SE, et al. (2000)Rapid hematopoietic recovery after coinfusion of autologous-blood stem cells
and culture-expanded marrow mesenchymal stem cells in advanced breastcancer patients receiving high-dose chemotherapy. J Clin Oncol 18: 307–316.
51. Lazarus HM, Koc ON, Devine SM, Curtin P, Maziarz RT, et al. (2005)
Cotransplantation of HLA-identical sibling culture-expanded mesenchymal stem
cells and hematopoietic stem cells in hematologic malignancy patients. BiolBlood Marrow Transplant 11: 389–398.
52. Ball LM, Bernardo ME, Locatelli F, Egeler RM (2008) Potential role of
mesenchymal stromal cells in pediatric hematopoietic SCT. Bone Marrow
Transplant 42 Suppl 2: S60–66.
Nonhematopoietic to Hematopoietic Transformation
PLoS ONE | www.plosone.org 15 June 2011 | Volume 6 | Issue 6 | e21250
53. Wood B (2006) 9-color and 10-color flow cytometry in the clinical laboratory.
Arch Pathol Lab Med 130: 680–690.
54. Kundra V, Mannting F, Jones AG, Kassis AI (2002) Noninvasive monitoring ofsomatostatin receptor type 2 chimeric gene transfer. J Nucl Med 43: 406–412.
55. Zhou Q, Melton DA (2008) Extreme makeover: converting one cell into
another. Cell Stem Cell 3: 382–388.
56. Argiropoulos B, Humphries RK (2007) Hox genes in hematopoiesis and
leukemogenesis. Oncogene 26: 6766–6776.
57. Ivins S, Pemberton K, Guidez F, Howell L, Krumlauf R, et al. (2003) Regulation
of Hoxb2 by APL-associated PLZF protein. Oncogene 22: 3685–3697.
58. Sauvageau G, Lansdorp PM, Eaves CJ, Hogge DE, Dragowska WH, et al.
(1994) Differential expression of homeobox genes in functionally distinct CD34+subpopulations of human bone marrow cells. Proc Natl Acad Sci U S A 91:
12223–12227.
59. Pineault N, Helgason CD, Lawrence HJ, Humphries RK (2002) Differentialexpression of Hox, Meis1, and Pbx1 genes in primitive cells throughout murine
hematopoietic ontogeny. Exp Hematol 30: 49–57.
60. Sachan M, Raman R (2006) Developmental methylation of the regulatory
region of HoxB5 gene in mouse correlates with its tissue-specific expression.Gene 380: 151–158.
61. Hershko AY, Kafri T, Fainsod A, Razin A (2003) Methylation of HoxA5 and
HoxB5 and its relevance to expression during mouse development. Gene 302:65–72.
62. Sorm F, Piskala A, Cihak A, Vesely J (1964) 5-Azacytidine, a new, highly
effective cancerostatic. Experientia 20: 202–203.
63. Taylor SM, Jones PA (1979) Multiple new phenotypes induced in 10T1/2 and3T3 cells treated with 5-azacytidine. Cell 17: 771–779.
64. Chiu CP, Blau HM (1985) 5-Azacytidine permits gene activation in a previously
noninducible cell type. Cell 40: 417–424.
65. Konieczny SF, Emerson CP, Jr. (1984) 5-Azacytidine induction of stablemesodermal stem cell lineages from 10T1/2 cells: evidence for regulatory genes
controlling determination. Cell 38: 791–800.
66. Choi SC, Yoon J, Shim WJ, Ro YM, Lim DS (2004) 5-azacytidine induces
cardiac differentiation of P19 embryonic stem cells. Exp Mol Med 36: 515–523.
67. Enjoji M, Nakashima M, Honda M, Sakai H, Nawata H (1997) Hepatocyticphenotypes induced in sarcomatous cholangiocarcinoma cells treated with 5-
azacytidine. Hepatology 26: 288–294.
68. Darmon M, Nicolas JF, Lamblin D (1984) 5-Azacytidine is able to induce theconversion of teratocarcinoma-derived mesenchymal cells into epithelia cells.
Embo J 3: 961–967.
69. Lassar AB, Paterson BM, Weintraub H (1986) Transfection of a DNA locus thatmediates the conversion of 10T1/2 fibroblasts to myoblasts. Cell 47: 649–656.
70. Broxmeyer HE, Maze R, Miyazawa K, Carow C, Hendrie PC, et al. (1991) The
kit receptor and its ligand, steel factor, as regulators of hemopoiesis. Cancer Cells
3: 480–487.
71. McNiece IK, Langley KE, Zsebo KM (1991) Recombinant human stem cellfactor synergises with GM-CSF, G-CSF, IL-3 and epo to stimulate human
progenitor cells of the myeloid and erythroid lineages. Exp Hematol 19:226–231.
72. Lennartsson J, Shivakrupa R, Linnekin D (2004) Synergistic growth of stem cell
factor and granulocyte macrophage colony-stimulating factor involves kinase-dependent and -independent contributions from c-Kit. J Biol Chem 279:
44544–44553.
73. Broxmeyer HE, Lu L, Hangoc G, Cooper S, Hendrie PC, et al. (1991) CD45
cell surface antigens are linked to stimulation of early human myeloid progenitorcells by interleukin 3 (IL-3), granulocyte/macrophage colony-stimulating factor
(GM-CSF), a GM-CSF/IL-3 fusion protein, and mast cell growth factor (a c-kitligand). J Exp Med 174: 447–458.
74. McNiece IK, Langley KE, Zsebo KM (1991) The role of recombinant stem cell
factor in early B cell development. Synergistic interaction with IL-7. J Immunol
146: 3785–3790.
75. Hirohata S, Yanagida T, Tomita T, Yoshikawa H, Ochi T (2002) Bone marrowCD34+ progenitor cells stimulated with stem cell factor and GM-CSF have the
capacity to activate IgD- B cells through direct cellular interaction. J Leukoc Biol
71: 987–995.76. Sonderegger I, Iezzi G, Maier R, Schmitz N, Kurrer M, et al. (2008) GM-CSF
mediates autoimmunity by enhancing IL-6-dependent Th17 cell development
and survival. J Exp Med 205: 2281–2294.77. Ma F, Yang F, Kaneko A, Manabe A, Tanaka R, et al. (2000) Cytokine
requirement for the development of T-lymphoid lineage potential in clonallymphohaematopoietic progenitors in vitro. Br J Haematol 111: 1170–1179.
78. Bleul CC, Fuhlbrigge RC, Casasnovas JM, Aiuti A, Springer TA (1996) A highly
efficacious lymphocyte chemoattractant, stromal cell-derived factor 1 (SDF-1).J Exp Med 184: 1101–1109.
79. Murphy PM, Baggiolini M, Charo IF, Hebert CA, Horuk R, et al. (2000)International union of pharmacology. XXII. Nomenclature for chemokine
receptors. Pharmacol Rev 52: 145–176.80. Burger JA, Burger M, Kipps TJ (1999) Chronic lymphocytic leukemia B cells
express functional CXCR4 chemokine receptors that mediate spontaneous
migration beneath bone marrow stromal cells. Blood 94: 3658–3667.81. Jones EA, Kinsey SE, English A, Jones RA, Straszynski L, et al. (2002) Isolation
and characterization of bone marrow multipotential mesenchymal progenitorcells. Arthritis Rheum 46: 3349–3360.
82. Krumlauf R (1994) Hox genes in vertebrate development. Cell 78: 191–201.
83. Connell D, Datir A, Alyas F, Curtis M (2009) Treatment of lateral epicondylitisusing skin-derived tenocyte-like cells. Br J Sports Med.
84. Yamada N, Uchinuma E, Matsumoto Y, Kuroyanagi Y (2008) Comparativeevaluation of re-epithelialization promoted by fresh or cryopreserved cultured
dermal substitute. J Artif Organs 11: 221–224.85. Yu BD, Mukhopadhyay A, Wong C (2008) Skin and hair: models for exploring
organ regeneration. Hum Mol Genet 17: R54–59.
86. Schmidt AH, Stahr A, Baier D, Schumacher S, Ehninger G, et al. (2007)Selective recruitment of stem cell donors with rare human leukocyte antigen
phenotypes. Bone Marrow Transplant 40: 823–830.87. Gluckman E, Wagner JE (2008) Hematopoietic stem cell transplantation in
childhood inherited bone marrow failure syndrome. Bone Marrow Transplant
41: 127–132.88. Tse W, Bunting KD, Laughlin MJ (2008) New insights into cord blood stem cell
transplantation. Curr Opin Hematol 15: 279–284.89. Sauter C, Barker JN (2008) Unrelated donor umbilical cord blood transplan-
tation for the treatment of hematologic malignancies. Curr Opin Hematol 15:568–575.
90. Hai-Jiang W, Xin-Na D, Hui-Jun D (2008) Expansion of hematopoietic stem/
progenitor cells. Am J Hematol 83: 922–926.91. Haylock DN, Nilsson SK (2007) Expansion of umbilical cord blood for clinical
transplantation. Curr Stem Cell Res Ther 2: 324–335.92. Alvarnas JC, Forman SJ (2004) Graft purging in autologous bone marrow
transplantation: a promise not quite fulfilled. Oncology (Williston Park) 18:
867–876; discussion 876-868, 881, 884.93. Thirukkumaran CM, Russell JA, Stewart DA, Morris DG (2007) Viral purging
of haematological autografts: should we sneeze on the graft? Bone MarrowTransplant 40: 1–12.
94. Habib M, Fares F, Bourgeois CA, Bella C, Bernardino J, et al. (1999) DNAglobal hypomethylation in EBV-transformed interphase nuclei. Exp Cell Res
249: 46–53.
95. Milutinovic S, Zhuang Q, Niveleau A, Szyf M (2003) Epigenomic stressresponse. Knockdown of DNA methyltransferase 1 triggers an intra-S-phase
arrest of DNA replication and induction of stress response genes. J Biol Chem278: 14985–14995.
96. Fauser AA, Messner HA (1978) Granuloerythropoietic colonies in human bone
marrow, peripheral blood, and cord blood. Blood 52: 1243–1248.97. Yang D, Han L, Kundra V (2005) Exogenous gene expression in tumors:
noninvasive quantification with functional and anatomic imaging in a mousemodel. Radiology 235: 950–958.
98. Pounds S, Morris SW (2003) Estimating the occurrence of false positives and
false negatives in microarray studies by approximating and partitioning theempirical distribution of p-values. Bioinformatics 19: 1236–1242.
Nonhematopoietic to Hematopoietic Transformation
PLoS ONE | www.plosone.org 16 June 2011 | Volume 6 | Issue 6 | e21250