Embed Size (px)
Citation preview

Transcriptomic analysis of molecular
responses in Malus domestica ‘M26’ plants
affected by apple replant disease
Von der Naturwissenschaftlichen Fakultät der
Gottfried Wilhelm Leibniz Universität Hannover
zur Erlangung des Grades
Doktor der Naturwissenschaften (Dr. rer. nat.)
genehmigte Dissertation
von
Stefan Weiß, M. Sc.
2017

Referentin: Prof. Dr. rer. hort. Traud Winkelmann
Korreferent: Prof. Dr. rer. nat. Hans-Peter Braun
Korreferent: Prof. Dr. rer. nat. Ludger Beerhues
Tag der Promotion: 29.05.2017

I
Abstract
Apple is one of the most important fruits cultivated all around the world with a high economic but also
health beneficial value. Over the last 50 years, the high demand for apple and economical reasons
resulted in high-density orchards and tree nurseries where plants are frequently replanted. The long-
described worldwide phenomenon of apple replant disease (ARD) presents a significant difficulty in
maintaining yield in centers of production nowadays, as chemicals and fumigants which were effective
in controlling the disease are phased-out due to environmental concerns. ARD is thought to be caused
by detrimental microorganisms accumulating in the rhizosphere, mainly representing fungi and
oomycetes of the genera Rhizoctonia spp., Cylindrocarpon spp., Pythium spp. and Phytophthora spp.
but recently also allelochemicals have been reported to play an important role. Nevertheless, it can be
concluded that complex interactions between both biotic and abiotic factors lead to ARD. Affected
plants are diminished in their plant growth and yield, and they demonstrate delayed fruit production.
However, molecular reactions in planta are not well understood yet, only few studies have focused on
this aspect. To unravel disease etiology this study aimed to uncover transcriptomic responses of the
ARD susceptible apple rootstock ‘M26’ on different ARD soils and at several time points.
In 2010, the genome sequence of the apple cultivar ‘Golden Delicious’ was published. A new
technology in RNA sequencing, namely the massive analysis of cDNA ends (MACE) was employed
to accomplish the goal of this study. MACE sequencing data was complemented by RT-qPCR
experiments further supporting gene expression results. Gene expression was analyzed in the whole
root system and the three youngest fully developed leaves of plants cultivated in ARD and γ-irradiated
ARD soils differing in disease severity. Next to shoot and root growth depression, typical biotic stress
response genes involved in plant defense were observed to be differentially regulated in ARD affected
plants, also in a time-dependent pattern. This led to the conclusion that observed typical defense
reactions towards biotic stress were expressed, but not effective in ‘M26’.
Genes in secondary metabolite production as well as plant defense, regulatory and signaling
genes were upregulated in ARD roots, whereas for several genes involved in primary metabolism
lower expression was detected. Examined genes exhibited mostly conserved expression in ‘M26’ roots
cultivated on different ARD soils. Most interestingly, genes involved in phytoalexin (PA) biosynthesis
were consistently upregulated in ARD roots. In leaves of ARD challenged plants, different genes were
affected and in particular, there were hints at the occurrence of potential systemic oxidative stress. A
delayed systemic response on the transcriptomic level might be deduced from the increase in many PA
genes starting at days 10-14 whereas this reaction to ARD was already observed after 3-7 days in most
cases in roots.
PAs present a specialized form of defense mainly against fungi and the PA biosynthesis genes
biphenyl synthase, O-methyltransferase and biphenyl-4-hydroxylase were consistently upregulated in
ARD variants. The strong and early expression of these genes correlated with the very high
concentrations of actual products in root material, namely 3-hydroxy-5-methoxybiphenyl, aucuparin,
noraucuparin, 2-hydroxy-4-methoxydibenzofuran, 2'-hydroxyaucuparin and noreriobofuran. It was the
first time that these PAs were detected, identified and quantified in apple roots. In particular, 3-
hydroxy-5-methoxybiphenyl and aucuparin were exclusively found in ARD samples. Their
accumulation up to 1.9 mM led to the assumption that the impaired sequestration and/or exudation of
the potentially cytotoxic PAs and oxidative stress may lead to root damage in ARD soils, but
regarding the high PA contents, further tests have to be conducted.
Key words: Apple replant disease, phytoalexins, transcriptomic analysis

II
Zusammenfassung
Der Apfel ist mit seinen hohen ökonomischen, aber auch gesundheitsfördernden Eigenschaften eine
der wichtigsten Früchte, und wird weltweit angebaut. In den letzten 50 Jahren führten die hohe
Apfelnachfrage und ökonomische Gründe zu dichten und häufig neu bepflanzten Beständen in
Obstplantagen und Baumschulen. Das altbekannte, weltweite Phänomen der Apfel-Nachbaukrankheit
(ARD) stellt heutzutage ein großes Problem dar, gewünschte Erträge in Produktionszentren zu
erreichen, da die Nutzung bislang eingesetzter Chemikalien und Entseuchungsmittel aufgrund von
Umweltbedenken eingeschränkt wurde. ARD wird wahrscheinlich durch schädliche Mikroorganismen
in der Rhizosphäre verursacht, wobei vor allem Pilze und Oomyceten der Gattungen Rhizoctonia spp.,
Cylindrocarpon spp., Pythium spp. und Phytophthora spp. eine wichtige Rolle spielen, aber vor
kurzem wurde auch Allelochemikalien eine wichtige Rolle attestiert. Letztendlich führen komplexe
Wechselwirkungen zwischen biotischen und abiotischen Faktoren zu ARD. Betroffene Pflanzen
werden in ihrem Wachstum und ihrem Ertrag gemindert und zeigen eine verzögerte
Fruchtentwicklung. Allerdings sind molekulare Reaktionen in planta noch nicht gut erforscht. Um den
Krankheitsverlauf zu entschlüsseln, zielte diese Studie darauf ab, transkriptomische Reaktionen der
ARD-empfindlichen Apfelunterlage ‘M26’ auf verschiedenen ARD-Böden und zu verschiedenen
Zeitpunkten aufzudecken.
Im Jahr 2010 wurde die Genomsequenz der Apfelsorte ‘Golden Delicious’ veröffentlicht. Um
das Ziel dieser Studie zu erreichen, wurde die neue RNA-Sequenzierungstechnologie ‘massive
analysis of cDNA ends’ (MACE) eingesetzt. Genexpressionsergebnisse der MACE-
Sequenzierungsdaten wurden durch RT-qPCR Experimente unterstützt. Die Genexpression wurde im
gesamten Wurzelsystem und den drei jüngsten vollständig entwickelten Blättern von Pflanzen
untersucht, die in ARD- und γ-bestrahlten ARD-Böden kultiviert wurden. Neben der Spross- und
Wurzelwachstumsdepression wurde die differentielle, zeitabhängige Regulation biotischer
Stressreaktions-Gene in ARD-Pflanzen beobachtet. Dies führte zu der Schlussfolgerung, dass
Verteidigungsreaktionen gegen biotischen Stress stattfanden, aber nicht wirksam in ‘M26’ waren.
Gene in der Sekundärmetabolitproduktion und Signaltransduktion sowie
Pflanzenverteidigungs- und Regulierungsgene wurden in ARD-Wurzeln hochreguliert, während für
mehrere Gene, die am primären Metabolismus beteiligt waren, eine geringere Expression
nachgewiesen wurde. Die untersuchten Gene wurden auf verschiedenen ARD-Böden in ‘M26’-
Wurzeln konserviert exprimiert. Interessanterweise wurden Phytoalexin (PA) Biosynthese Gene in
ARD-Wurzeln konstant hochreguliert. In Blättern von ARD-Pflanzen waren andere Gene betroffen,
insbesondere gab es Hinweise auf das Auftreten von potentiell systemischem oxidativen Stress. Der
Anstieg vieler PA-Gene ab Tag 10-14 könnte als verzögerte systemische Reaktion auf
transkriptomischer Ebene gedeutet werden, während ARD-Wurzeln in den meisten Fällen bereits nach
3-7 Tagen diese Reaktion zeigten.
In ARD-Varianten wurden Biphenyl-Synthasen, O-Methyltransferasen und Biphenyl-4-
Hydroxylasen konstant hochreguliert. Im Wurzelmaterial korrelierte ihre Expression mit sehr hohen
Konzentrationen an 3-Hydroxy-5-Methoxybiphenyl, Aucuparin, Noraucuparin, 2-Hydroxy-4-
Methoxydibenzofuran, 2'-Hydroxyaucuparin und Noreriobofuran. Zum ersten Mal wurden diese PAs
in Apfelwurzeln detektiert, identifiziert und quantifiziert. 3-Hydroxy-5-Methoxybiphenyl und
Aucuparin wurden ausschließlich in ARD-Proben gefunden. Konzentrationen bis zu 1.9 mM führten
zu der Annahme, dass die beeinträchtigte Sequestrierung und/oder Exsudation der potentiell
zytotoxischen PAs und oxidativer Stress zu Wurzelschäden in ARD-Böden führen könnte, aber in
Bezug auf den hohen PA-Gehalt müssen weitere Tests durchgeführt werden.
Schlagwörter: Apfel-Nachbaukrankheit, Phytoalexine, Transkriptomanalyse

III
Contents
Abstract I
Zusammenfassung II
Abbreviations 1
1. General introduction 2
1.1. The worldwide importance of apple 2
1.2. Apple genetics 2
1.3. Definition of apple replant disease 3
1.4. ARD symptoms 3
1.5. Abiotic and biotic factors causing ARD 4
1.6. ARD counteractions 5
1.7. Biotic stress responses in general 7
1.8. Phytoalexin biosynthesis as a specialized biotic stress response 9
1.9. Thesis objectives 11
2. Transcriptomic analysis of molecular responses in Malus domestica ‘M26’ roots
affected by apple replant disease
12
2.1. Manuscript 13
2.2. Figures and tables 31
2.3. Supplementary data 39
3. Impaired defense reactions in apple replant disease-affected roots of Malus domestica
‘M26’
40
3.1. Manuscript 41
3.2. Figures and tables 57
3.3. Supplementary data 65
4. Transcriptome profiling in leaves representing aboveground parts of apple replant
disease affected Malus domestica ‘M26’ plants
69
4.1. Manuscript 70
4.2. Figures and tables 90
4.3. Supplementary data 98
5. General discussion 103
5.1. How do ARD affected ‘M26’ plants react to ARD on the transcriptomic level? 103
5.2. Does biotic stress by exposing the root system to ARD lead to a systemic response in
aboveground tissue?
104
5.3. Are ARD affected molecular reactions in the plant conserved among different ARD soils? 104
5.4. Is there a time-dependent effect on ARD affected molecular reactions? 105
5.5. Potential enhanced role of PAs in ARD 105
5.6. Conclusion and outlook 109
References 111
Curriculum vitae 117
Conference contributions 118
Acknowledgements 119

1
Abbreviations
γARD γ-irradiated apple replant disease
ABA abscisic acid
ABC ATP-binding cassette
ANOSIM analysis of similarities
ARD apple replant disease
ATP adenosine triphosphate
B4H biphenyl-4-hydroxlase
BAP benzylaminopurine
BIS biphenyl synthase
bHLH basic/helix-loop-helix
cDNA complementary DNA
CoA coenzyme A
CYP cytochrome P450 dependent hydroxylase
DAMP damage-associated molecular pattern
DNA deoxyribonucleic acid
ET ethylene
ETI effector-triggered immunity
FDR false discovery rate
GST glutathione S-transferase
HR hypersensitive response
HSP heat shock protein IBA indole-3-butyric acid
JA jasmonic acid
MACE massive analysis of cDNA ends
MAMP/PAMP microbe-associated molecular pattern
MAPK mitogen-activated protein kinase
mRNA messenger RNA
NBS-LRR nucleotide binding-site-leucine-rich repeat
NO nitric oxide
OMT O-methyltransferase
PA phytoalexin
PCA principal component analysis
PR pathogenesis-related
PRR pattern recognition receptor
PTI PAMP-triggered immunity
RLK receptor-like kinase
RLP receptor-like protein
RNA ribonucleic acid
ROS reactive oxygen species
RT-qPCR reverse transcriptase quantitative polymerase chain reaction
SA salicylic acid
UDP uridine diphosphate
UGT UDP-glucosyltransferase

2
1. General introduction
1.1. The worldwide importance of apple
Apple (Malus domestica) belongs to the Rosaceae family which includes other commercial fruits such
as apricot, cherry, peach, pear and strawberry but also ornamental plants like rose (Park et al. 2006).
The fruit tree is produced throughout the temperate zone but recently also in subtropical and tropical
zones (Velasco et al. 2010; Brown 2012). Worldwide, apple trails only bananas in total production
quantity with 84,630,275 t versus 114,130,151 t and was harvested on a total area of 5,051,851 ha
following grapes (7,124,512 ha, 74,499,859 t) and bananas (5,393,811 ha) in 2014 (FAOSTAT 2014).
By far, Asia produces the most apples with 62.7 % followed by Europe with 20.7 % (FAOSTAT
2014). In particular, China can be regarded as the main producer of apples, followed by the USA
where apple is the third most valuable fruit crop after grapes and oranges (Brown 2012).
Economically, in 2006, apple production was worth approximately $1.6 billion annually in the USA
(Park et al. 2006) and has increased to more than $2.5 billion dollars annually in 2012 (Brown 2012).
The reason for the high demand of apples next to its pleasant taste is their potential effect on improved
health in humans due to its phytochemical profile reducing risks of chronic diseases, exhibiting
antioxidant, antiproliferative and cell signaling effects (Hyson 2011).
The high demand for apple led to an increase of production over the last 50 years which was
achieved by establishing size-controlling rootstocks for improving orchard practices to maximize
precocity, quality and yield, therefore, leading to high-density orchards with higher economical value
(Zhu et al 2001; St. Laurent et al. 2010; Byrne 2012). Nowadays, fruit producing areas propagate
plants by grafting buds of a scion onto rootstocks which are propagated from rooted vegetative
cuttings in nursery layering beds (Gessler and Patocchi 2007; St. Laurent et al. 2010; Volk et al.
2015). Trees can remain in production for 30 or more years, but may be replanted on average every
12-16 years in high density orchards (Volk et al. 2015). Today, commercial orchards are uniform
which is covetable agronomically but it is fatal for resistance toward pests and ensuing diseases
(Gessler and Patocchi 2007; Mazzola et al. 2009).
1.2. Apple genetics
The domesticated apple is thought to be an offspring of M. sieversii which hybridized with European
and Asian species (Velasco et al. 2010; Brown 2012). In general, genetic diversity in apple is high
(Isutsa and Merwin 2000; Gessler and Patocchi 2007; Mazzola et al. 2009). The genus comprises a
variety of species which are closely related and easily crossable (Gessler and Patocchi 2007).
Although the highly heterozygous apple is an allopolyploid, it generally behaves like a diploid due to
sufficient diversity of the parental chromosomes with a haploid chromosome number of x = 17
(Velasco et al. 2010; Brown 2012) but it can also occur as tri- and tetraploids, with higher ploidy
levels concurring with increased sizes of pollen grains, stomata, flowers, fruits and leaves but
decreased pollen viability (Podwyszyńska et al. 2016). However, it displays self-incompatibility

3
leading to high heterozygosity (Gessler and Patocchi 2007) and requires cross-pollination (Byrne
2012). In 2010, the genome sequence of the diploid apple cultivar ‘Golden Delicious’ was published
(Velasco et al. 2010). This revealed a probable genome duplication in an ancestral 9-chromosome
genome event 50 million years ago resulting in a genome with 57,386 predicted genes (Velasco et al.
2010). The 17-chromosome karyotype was the consequence of interchromosomal reorganizations and
the ensuing loss of a single chromosome but it was suggested that the specific fruit type evolved after
the genome-wide duplication event (Velasco et al. 2010).
1.3. Definition of apple replant disease
Mazzola and Manici (2012) presented several terms for the observed diminished crop productivity at
production centers with intensive replanting practices. They listed soil sickness, soil exhaustion,
replant disorder, replant problem and replant disease as synonyms for weak tree growth and reduced
yields over time probably caused by detrimental soilborne microorganisms. Their definition of replant
disease, which focuses on biotic factors being responsible for the disease, will be used in this study.
Plant species that are affected by replant disease include apple, peach, citrus, grapes, cherries,
strawberry, black walnut and roses (Gur and Cohen 1989; Singh et al. 1999; Zhang et al. 2007; Manici
and Caputo 2010). Apple replant disease (ARD) in particular affects orchards of apple and is defined
as a consequence of replanting apple trees in the same field due to e.g., renewal because of age, or
rootstock production in tree nurseries leading to slow and diminished shoot growth shortening orchard
life (Mazzola and Manici 2012). Hereby, replanting after 1-2 years can already lead to plant growth
differences (Mazzola 1999). Although replant disease has been documented for more than 200 years
(Mai and Abawi 1981), the complex phenomenon has not been unraveled yet. Astonishingly, replant
disease persists in soils even after plants have been removed a long time ago (Mazzola and Mullinix
2005; Van Schoor et al. 2009; Tewoldemedhin et al. 2011c).
1.4. ARD symptoms
ARD is an important problem in the production of apple worldwide in all of the major fruit-growing
regions resulting in huge economic losses (Mazzola 1998; Yin et al. 2016). Profitability is reduced by
50 % throughout the life span of the orchard due to delayed production caused by ARD as affected
trees start bearing fruits 2-3 years later than unaffected trees and fail to yield amounts comparable to
their healthy counterparts (Mazzola 1998; Van Schoor et al. 2009). ARD affects young trees, results in
uneven growth and under severe disease pressure even death of trees can be observed (Mai and Abawi
1981; Mazzola 1998).
Symptoms are observed under field conditions shortly after planting within 1-3 months as
ARD affected plants are characterized by drastic stunting and shortened internodes as well as rosetted
leaves aboveground (Caruso et al. 1989; Mazzola 1998; Mazzola and Manici 2012). Under greenhouse
conditions symptoms can already be visualized within two to five weeks (Yim et al. 2013, 2015).
Belowground, ARD challenged plants exhibit general reduction in root biomass as well as small root

4
systems and decayed in addition to discolored roots, and it was reported that epidermal cells plus
cortical tissues are prematurely destroyed resulting in reduction of lateral root expansion and fewer
functional root hairs (Jaffee et al. 1982; Caruso et al. 1989; Mazzola 1998; Mazzola and Manici 2012;
Yim et al. 2013; Atucha et al. 2014; Shin et al. 2014; Henfrey et al. 2015). Eventually, productivity of
these plants is greatly diminished due to decrease in overall fruit yield and quality demonstrated by
undesirable texture, appearance and flavor of apple fruits (Mazzola 1998; Mazzola and Manici 2012;
Liu et al. 2014). In several studies it was shown that the apple rootstock ‘M26’ can be used as a
reliable indicator test plant to detect ARD in soils due to its high susceptibility towards the problem
(St. Laurent et al. 2010; Yim et al. 2013, 2015).
1.5. Abiotic and biotic factors causing ARD
Potential causes inciting ARD differed between geographic regions or between orchards in the same
region. Abiotic factors involving soil pH, structure and drainage, nutritional status, heavy metal
contamination, as well as cold or drought stress may contribute to plant growth inhibition in ARD
(Mai and Abawi 1981; Willett et al. 1994). Soil extracts and microbial toxins reduced plant growth
(Gur and Cohen 1989; Tagliavini and Marangoni 1992), furthermore, autotoxicity, a form of
intraspecific allelopathy, of apples was found in ARD where the release of toxic chemicals into the
soil inhibited plant growth (Singh et al. 1999). Moreover, in ARD the role of root exudates was
discussed (Börner 1959; Wittenmayer and Szabó 2000; Hofmann et al. 2009) and also in the citrus
replant disease, compounds were extracted causing severe growth reduction hinting at an important
role of allelopathy in replant disease (Burger and Small 1983; Hassan et al. 1989a, b). Recently, more
studies have been conducted in analyzing the role of allelochemicals and root exudates in ARD
(Manici et al. 2016; Yin et al. 2016, 2017). But Mazzola and Manici (2012) remarked that due to the
persistence of replant disease over a number of years (Mazzola and Mullinix 2005; Van Schoor et al.
2009; Tewoldemedhin et al. 2011c), toxins would have to exhibit very high stability and resiliency to
microbial degradation.
As soil fumigation or pasteurization is able to majorly improve apple plant growth (Mai and
Abawi 1981; Jaffee et al. 1982; Mazzola 1998; Isutsa and Merwin 2000), it was concluded that the
disease was primarily caused by biological stressors rather than it was the result of abiotic factors, but
potential causal agents of ARD can also differ between different regions or even orchards of the same
region (Mazzola 1998; Manici et al. 2003). Actinomycetes were found in ARD soils but they did not
show any pathogenicity towards apple plants (Tewoldemedhin et al. 2011c) whereas Acidobacteria
were found to be negatively correlated with plant growth in apple (Nicola et al. 2017). However,
Mazzola (1998) was able to show that bacteria did not play a major role in ARD etiology as
elimination of bacteria with chloramphenicol did not improve plant growth. In fact, elimination of
fungi improved apple plant growth and it was concluded that fungi play the dominant role in ARD
soils worldwide (Mazzola 1998).
5
Only a minor role was attributed to Fusarium spp. as solitary F. solani revealed low
pathogenicity towards apple plants (Manici et al. 2003; Van Schoor et al. 2009; Tewoldemedhin et al.
2011b). However, in ARD soils coming from locations all over the world, pathogenicity was found for
Rhizoctonia spp. with R. solani being most abundant (Jaffee et al. 1982; Mazzola 1998, 1999; Manici
et al. 2003, 2015; Van Schoor et al. 2009; Tewoldemedhin et al. 2011b). In addition, worldwide,
Cylindrocarpon spp. was consistently found in ARD soils and revealed pathogenicity towards plants
(Jaffee et al. 1982; Mazzola 1998; Manici et al. 2003, 2013, 2015; Van Schoor et al. 2009;
Tewoldemedhin et al. 2011a, c; Franke-Whittle et al. 2015). The oomycetes Pythium spp. (Mazzola
1998, 1999; Manici et al. 2003, 2013; Van Schoor et al. 2009; Tewoldemedhin et al. 2011b, c) and
Phytophthora spp. (Mazzola 1998, 1999; Tewoldemedhin et al. 2011b, c) were constantly found in
ARD soils all over the world as well. Pythium spp. and Cylindrocarpon spp. even showed a
synergistic interaction effect on apple growth inhibition highlighting complex interactions responsible
for causing ARD (Tewoldemedhin et al. 2011c). Although the importance of fungi and oomycetes in
the disease etiology of ARD was evident, the relative contribution of the different species of the
presented genera and also the comparative input of genera themselves differed among ARD soils of
different locations (Jaffee et al. 1982; Mazzola et al. 1998; Manici et al. 2003; Van Schoor et al. 2009;
Manici and Caputo 2010; Tewoldemedhin et al. 2011a, b).
Additionally, Pratylenchus spp. especially P. penetrans was found in ARD soils but they were
deemed to play, at the most, only a minor role in ARD etiology (Jaffee et al. 1982; Mazzola 1998; Van
Schoor et al. 2009). Interestingly, healthy apple plants were more often colonized by vesicular-
arbuscular mycorrhizal fungi possibly due to few functional root hairs presenting less penetration sites
for an infection in ARD affected plants and, therefore it was suggested that lack of endomycorrhizae
was associated with ARD (Caruso et al. 1989).
1.6. ARD counteractions
Counteractions to effectively alleviate or surmount ARD are of utmost importance in the sustainable
development of apple production (Tewoldemedhin et al. 2011b). In former times, the control of ARD
was mainly achieved by biologically broad-spectrum soil fumigants such as methyl bromide or
chloropicrin as they provided effective control (Covey et al. 1979; Mai and Abawi 1981; Gur et al.
1991; Willet et al. 1994; Mazzola and Gu 2002). However, they represent more than a few problems
including application intricacy, high cost as well as hazards to the environment and human health.
Furthermore, their efficacy greatly relies on soil moisture and temperature (Mazzola 1998; Mazzola
and Manici 2012). For ethylene dibromide, very high persistence up to 19 years was found under field
conditions and it could be a continuous source of groundwater contamination (Steinberg et al. 1987).
In addition, it was reported that soil fumigation sometimes led to decreased plant growth itself
possibly due to direct toxicity of remaining fumigant residues or elimination of beneficial
microorganisms like mycorrhizal fungi (Mai and Abawi 1981).

6
Alternative counteractions are the focus of newer research as preplant soil fumigation does not
constantly prevent ARD at all sites and the phase-out of widely used preplant fumigants instills a sense
of urgency (Mazzola et al. 2002; Porter et al. 2010). Compost application had an effect on soil
microbial communities but did not improve plant growth in New York, USA (Yao et al. 2006)
whereas better plant growth under ARD conditions was observed in South Africa (Van Schoor et al.
2009). But in South Tyrol, organic soil amendments even led to an enhancement in Rhizoctonia spp.
and Pythium spp. due to increases in organic carbon as a result of decaying crop debris (Manici et al.
2003). Mazzola et al. (2001) stated that negative side effects may be avoided by highly degraded or
humified composts. These divergent results indicate that compost application as an optional method to
avoid ARD is highly variable in its effectiveness.
Another approach was based on the fact that certain pathogenic soil microorganisms may be
suppressed via selective microbial community shifts as the introduction or enhancement of biological
antagonists to ARD inciting microorganisms was reported to induce soil suppressiveness and it could
be shown that Burkholderia cepacia and Pseudomonas putida were important in suppressing ARD due
to antagonistic effects towards R. solani and Pythium spp. (Mazzola 1999; Mazzola et al. 2002; Gu
and Mazzola 2003; Manici et al. 2015). Additionally, biofumigation via incorporation of Brassicaceae
plants or Brassicaceae seed meal containing high amounts of glucosinolates into soil was able to
suppress Rhizoctonia spp., Cylindrocarpon spp. as well as P. penetrans and improved apple plant
growth in ARD soil (Mazzola et al. 2001; Mazzola et al. 2002; Yim et al. 2016). However consistent
results were not achieved at different sites of ARD occurrence (Mazzola and Mullinix 2005; Mazzola
and Manici 2012; Mazzola et al. 2015). Furthermore, the method results in lost production of orchards
due to time-consuming generation of green manure crops (Mazzola and Manici 2012) and in some
cases phytotoxicity occurred even after the recommended delay of planting (Mazzola et al. 2001).
Hence, soil and site dependent differences make biofumigation an unreliable method as external
factors including temperature, precipitation and solar radiation as well as tissue disruption and soil
water content influence the efficacy (Yim et al. 2016).
Due to the economic importance of apple, additional alternative ARD counteractions have
been studied ranging from treatments for manipulation of rhizosphere microbial communities to
decrease detrimental and increase beneficial microorganisms (Manici et al. 2013, 2015; Caputo et al.
2015; Yim et al. 2015), over carbon source-dependent anaerobic soil disinfestation (Hewavitharana et
al. 2014; Hewavitharana and Mazzola 2016) to the application of biochar (Wang et al. 2014) as well as
intact glucosinolates (Hanschen et al. 2015), and arbuscular mycorrhiza or microbial (Guo et al. 2014;
Gastol and Domagala-Swiatkiewicz 2015) as well as seaweed fertilizers (Wang et al. 2016).
Furthermore, genotypic differences and orchard replant position were deemed more important
to influence tree growth and microbial communities than fumigation in ARD (Rumberger et al. 2004).
In previous tree rows, plants were severely affected and rhizosphere bacterial composition differed
significantly compared to plants of inter-row grass lanes (Mazzola 1999; Rumberger et al. 2004).

7
Therefore, another counteraction to reduce ARD was suggested to be avoiding the direct replanting in
tree holes of preceding plants (Granatstein and Mazzola 2001; Rumberger et al. 2004; Leinfelder and
Merwin 2006; Kelderer et al. 2012; Yin et al. 2016). In addition, soil microbial community
composition and the severity of ARD were influenced by rootstock genotype succession, and ARD
tolerance was attributed to a greater abundance of antagonistic bacteria in the rhizosphere (St. Laurent
et al. 2010), and in general it was remarked that host genetics is able to impact soil microbial
communities in bulk and rhizosphere soil leading to disease control mechanisms (Mazzola and Gu
2000; Mazzola and Zhao 2010; Mazzola and Manici 2012). Likewise, lesion nematode populations
were tolerated more by rootstocks of the Geneva series which then exhibited less susceptibility to root
infection by Pythium spp. than rootstocks from the Malling series (Mazzola et al. 2009).
The release of the genome sequence of apple already hinted at a large number of potential
resistance genes available (Velasco et al. 2010). It could be shown that some apple rootstocks of the
Cornell-Geneva rootstock breeding program which emphasized selection for genotypes with multiple
disease resistance were more tolerant towards the ARD complex and employing more tolerant
rootstocks might be a suitable counteraction (Isutsa and Merwin 2000; Leinfelder and Merwin 2006;
Yao et al. 2006; Mazzola et al. 2009; St. Laurent et al. 2010). Rootstock breeding (Volk et al. 2015)
plus evaluation of ARD tolerance have recently been described (Forge et al. 2016). Furthermore,
phenotypical information referring to root turnover (Atucha et al. 2014) as well as root development
(Emmett et al. 2014) have been linked to ARD tolerance mechanisms.
The use of up to date DNA-based breeding methods including genetic maps, identification of
trait associated markers and marker-assisted breeding can help in breeding improved cultivars (Zhu et
al. 2001; Gessler and Patocchi 2007). However, molecular reactions in planta have to be better
understood to unravel disease etiology for the development of ARD trait associated markers (Zhu et al.
2014). Data so far is scarce, but it could be shown that plants exposed to ARD reacted with higher
phenolic compound contents (Henfrey et al. 2015), probably involving phloridzin being exuded into
the soil (Hofmann et al. 2009; Emmett et al. 2014; Yin et al. 2016, 2017). More recently, Shin et al.
(2014, 2016) uncovered gene expression patterns in apple roots after infection with Pythium ultimum,
one of the many potential causal agents of ARD. Ethylene and jasmonate biosynthesis were
upregulated in infected root tissue but also cytokinin biosynthesis and signaling were induced next to
genes in secondary metabolite biosynthesis, cell wall fortification and plant defense (Shin et al. 2014,
2016; Zhu et al. 2014).
1.7. Biotic stress responses in general
Although the molecular biotic stress response of ARD challenged plants is not yet understood, in
general, responses towards pathogens including fungi, bacteria and nematodes result in biotic stress
and are diverse in nature (Dangl and Jones 2001). Plants possess the ability of passive protection
against pathogens via preformed antimicrobial compounds called phytoanticipins (Van Etten et al.

8
1995), but specific defense responses rely on pathogen detection via microbe-associated molecular
patterns (MAMP/PAMP, Boller and Felix 2009; De Coninck et al. 2014; Huot et al. 2014; Pandey et
al. 2016). Membrane-bound pattern recognition receptors (PRRs) such as receptor-like kinases (RLKs)
and receptor-like proteins (RLPs) are responsible for detecting MAMP molecules, lead to PAMP-
triggered immunity (PTI) and invoke further signaling molecules involved in PTI and other defense
responses like calcium influx, alkalinization of the extracellular space, generation of nitric oxide (NO)
and transcriptional reprogramming (Figure 1.1, Boller and Felix 2009; De Coninck et al. 2014; Huot et
al. 2014; Pandey et al. 2016).
Figure 1.1 Overview of biotic stress response signaling according to Boller and Felix (2009, modified). Microbe-associated molecular
patterns (MAMPs/PAMPS), damage-associated molecular patterns (DAMPs) and effectors are recognized as signals of danger by the plant
leading to PAMP-triggered immunity (PTI) and/or effector-triggered immunity (ETI). Pattern recognition receptors (PRRs) such as receptor-
like kinases (RLKs) and receptor-like proteins (RLPs) can detect MAMPs and DAMPs. Effectors can be perceived by resistance (R) proteins
with nucleotide binding-site-leucine-rich repeats (NB[S]-LRR). When MAMPs, DAMPs and effectors are recognized, a defense response
(defense syndrome) is induced resulting in the generation of Ca2+, reactive oxygen species (ROS), nitric oxide (NO) as well as mitogen-
activated protein kinase (MAPK) signaling and ethylene (ET), jasmonic acid (JA), and salicylic acid (SA) production ending, eventually, in
hypersensitive responses (HR).
Similar to MAMPs, damage-associated molecular patterns (DAMPs) invoked by the damage
caused by pathogens may occur from the plant itself, e.g. cell wall fragments, which are recognized by
PRRs as well (Boller and Felix 2009). Mitogen-activated protein kinase (MAPK)-dependent signaling
cascades, generation of reactive oxygen species (ROS) and transcription of defense-related genes are
subsequently activated (Figure 1.1, Scheel 1998; Dangl and Jones 2001; Boller and Felix 2009; De
Coninck et al. 2014; Zhu et al. 2014; Pandey et al. 2016). Especially, transcriptional reprogramming

9
can be observed quickly after infection through activation of defense genes via ROS, NO and MAPK
signaling-induced activation of transcription factors (Durrant et al. 2000; De Coninck et al. 2014;
Pandey et al. 2016). If pathogens are able to suppress this kind of defense via masking MAMPs with
effectors, plants can counter with highly specific effector-triggered immunity (ETI) recognizing
effectors via resistance gene products with nucleotide binding-site-leucine-rich repeats (NBS-LRR,
Boller and Felix 2009; De Coninck et al. 2014; Pandey et al. 2016). Overall, plants perceive MAMPs,
DAMPs and effectors all as signals of danger (Boller and Felix 2009) and resistance proteins exist
both as cytoplasmic and transmembrane classes in multiple types so that both secreted ligands and
surface components can be detected leading to the accumulation of inducible antimicrobial compounds
(Dangl and Jones 2001). This often results in hypersensitive responses (HRs) e.g., cell death to prevent
pathogen propagation and spread (Ding et al. 2007; Boller and Felix 2009; De Coninck et al. 2014;
Huot et al. 2014). Furthermore, defense associated genes result in complex interaction signaling
pathways leading to biosynthesis of ethylene (ET), jasmonic (JA) and salicylic acid (SA), cell wall
fortification and lignification (Scheel 1998; Lam et al. 2001; Boller and Felix 2009; Lee and Lu 2011;
De Coninck et al. 2014; Pandey et al. 2016).
1.8. Phytoalexin biosynthesis as a specialized biotic stress response
Major antimicrobial compounds produced against pathogen attacks are biosynthetically linked via the
shikimic acid pathway (Dixon et al. 2001). Whereas phytoanticipins are formed as antimicrobial
compounds under normal plant development, phytoalexin (PA) compounds are produced upon biotic
stress to protect the plant from disease, mainly from fungal attacks (Van Etten et al. 1995; Dixon et al.
2001; Ahuja et al. 2012). PAs present a specialized form of defense, and in Rosaceae species two
particular classes of PAs, namely biphenyls and dibenzofurans can be formed upon pathogen attack
(Kokubun and Harborne 1995; Dixon 2001; Chizzali and Beerhues 2012; Khalil et al. 2013, 2015). In
genera of this family 10 biphenyls and 17 dibenzofurans have been identified so far and elicitation was
limited to members of this family only (Kokubun et al. 1995; Hüttner et al. 2010; Chizzali and
Beerhues 2012). The simultaneous expression of these two classes of compounds with antibacterial
and antifungal properties suggested a biosynthetic relationship directed at inhibiting growth of
pathogens during plant-pathogen interactions (Hrazdina et al. 1997; Hüttner et al. 2010; Teotia et al.
2016). Biphenyls and dibenzofurans locally produced at infection sites acted in defense to inhibit
spore germination, germ-tube development and mycelial growth (Kokubun et al. 1995; Hrazdina et al.
1997). Also in cytological studies on the PA camalexin and its antimicrobial activity in Arabidopsis
thaliana in response to infection with Botrytis cinerea and Alternaria spp., PAs caused the disruption
of membrane integrity (Rogers et al. 1996), inhibition of conidial germination and germ-tube
elongation (Sellam et al. 2007) as well as the apoptotic-like programmed cell death of fungi
(Shlezinger et al. 2011; Ahuja et al. 2012). Rogers et al. (1996) mentioned a majority of cases showing
the correlation of host resistance and the level of PA accumulation in potato, Vicia fabia and
10
Phaseolus vulgaris. Likewise, in apple, fire-blight and scab tolerance was correlated to accumulation
of biphenyls and dibenzofurans whereas susceptible genotypes failed to produce these PAs (Borejsza-
Wysocki et al. 1999). However, it was also reported that Brassica spp. as well as various cruciferous
plants did not show this typical correlation, and PA accumulation even resulted in cytotoxicity (Rogers
et al. 1996).
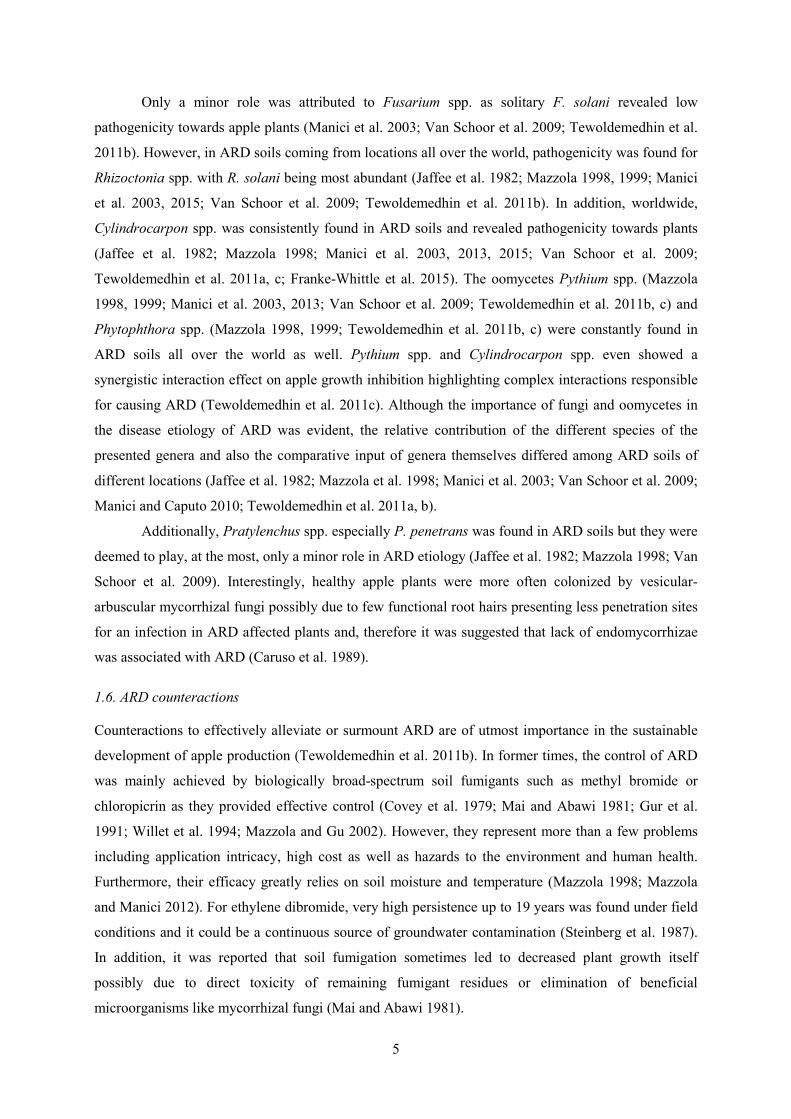
Aucuparin and noraucuparin were the most abundant biphenyls found in Rosaceae species
(Chizzali and Beerhues 2012). Regarding their biosynthesis, biphenyl synthase (BIS), a type III
polyketide synthase, was found to be the key enzyme in providing the carbon skeleton for both
biphenyls and dibenzofurans (Liu et al. 2004; Hüttner et al. 2010) which is expressed by a gene family
in apple (Chizzali and Beerhues 2012). It was found to be induced after elicitation at the
transcriptional level resulting in the enzyme catalyzing the iterative condensation of benzoyl-CoA with
three malonyl-CoAs (Figure 1.2; Hüttner et al. 2010; Chizzali and Beerhues 2012). The linear
tetraketide intermediate undergoes intramolecular aldol condensation and the loss of the terminal
carboxyl group results in 3,5-dihydroxybiphenyl (Hüttner et al. 2010; Chizzali and Beerhues 2012).
Response to fire-blight infection in apple trees resulted in differential regulation of four BIS genes and
their PA products. It was observed that the BIS protein was localized in the junctions between
neighboring cortical parenchyma cells suggesting an association of BIS with plasmodesmata (Chizzali
et al. 2012a, b). Next to BIS, so far, also O-methyltransferases (OMTs, Khalil et al. 2015) and
biphenyl-4-hydroxylases (B4Hs, Sircar et al. 2015) were identified as enzymes in PA biosynthesis for
the production of the antifungal defense compounds in apple (Figure 1.2).
Figure 1.2 Proposed biosynthetic pathway of phytoalexins in apple according to Khalil et al. (2015, modified). Solid arrows represent
identified enzymatic reactions whereas broken arrows mark unidentified enzymatic reactions. Biphenyl synthase (BIS) provides the carbon
skeleton for both biphenyls and dibenzofurans. O-methyltransferases (OMT) and biphenyl-4-hydroxylases (B4H) modify compounds for the
biosynthesis of the antifungal defense compounds in apple.
11
1.9. Thesis objectives
ARD represents an economic problem to apple producers around the world. Even though ARD has
long been recognized and numerous studies have tried to uncover the disease etiology, no complete
explanation has been found yet. As biotic stress is the main factor in causing ARD, identifying
potential causal agents has been the research focus. But also the development of counteractions against
ARD has been a major research question in previous studies. Nevertheless, studies have neglected the
very important question of which molecular reactions are actually involved in ARD challenged plants.
As mentioned above, only recently, starting from 2014, a minority of studies has been
conducted on molecular reactions in planta – this excludes earlier studies dealing with root exudates in
ARD which only made assumptions on which molecular reactions are actually involved in the plant.
Therefore, this study aimed to contribute to the elucidation of ARD etiology on a molecular level in
the plant by analyzing transcriptomic responses of both roots – which are in direct contact with the
biotic stressors – and leaves of the highly susceptible apple rootstock ‘M26’ to the presence or lack of
biotic causal agents of ARD in different ARD soils. A transcriptomic analysis was performed, enabled
by the availability of the apple genome sequence and it generates an overview of which genes are
differentially expressed at what level. Massive analysis of cDNA ends (MACE) was employed as the
method of choice because even low abundant transcripts can be effectively visualized at reduced costs
compared to the more often used RNA sequencing analyses (Kahl et al. 2012). Specifically, the
following questions – which will be presented in the subsequent chapters – were intended to be
answered:
1. How do ARD affected ‘M26’ plants react to ARD on the transcriptomic level?
2. Does biotic stress by exposing the root system to ARD lead to a systemic response in
aboveground tissue?
3. Are ARD affected molecular reactions in the plant conserved among different ARD soils?
4. Is there a time-dependent effect on ARD affected molecular reactions?

12
2. Transcriptomic analysis of molecular responses in Malus domestica ‘M26’ roots affected by
apple replant disease
Stefan Weiß1, Melanie Bartsch1, Traud Winkelmann1*
1Leibniz Universität Hannover, Institute of Horticultural Production Systems, Section of Woody Plant
and Propagation Physiology, Herrenhäuser Str. 2, D-30419 Hannover, Germany.
*Corresponding author. Traud Winkelmann, Leibniz Universität Hannover, Institute of Horticultural
Production Systems, Section of Woody Plant and Propagation Physiology, Herrenhäuser Straße 2, D-
30419 Hannover, Germany. Tel.: +49 (0) 511 / 762 3602; Fax: +49 (0) 511 / 762 3608; Email:
Type of authorship First author
Type of article Research article
Contribution to the article Performed the experiments, data analysis and wrote the manuscript
Co-authors contribution Melanie Bartsch assisted in design of RT-qPCR experiments
Traud Winkelmann conceived and coordinated the project,
participated in interpretation of data and in writing the manuscript
Journal Plant Molecular Biology
Impact factor 3.905
Date of publication April 19, 2017
DOI 10.1007/s11103-017-0608-6

13
2.1. Manuscript
Abstract
Apple replant disease (ARD) leads to growth inhibition and fruit yield reduction in replanted
populations and results in economic losses for tree nurseries and fruit producers. The etiology is not
well understood on a molecular level and causal agents show a great diversity indicating no definitive
cause, which applies to the majority of cases, has been found out yet. Hence, it is pivotal to gain a
better understanding of the molecular and physiological reactions of the plant when affected by ARD
and later to overcome the disease, for example by developing tolerant rootstocks.
For the first time, gene expression was investigated in roots of ARD affected plants employing
massive analysis of cDNA ends (MACE) and RT-qPCR. In reaction to ARD, genes in secondary
metabolite production as well as plant defense, regulatory and signaling genes were upregulated
whereas for several genes involved in primary metabolism lower expression was detected. For internal
verification of MACE data, candidate genes were tested via RT-qPCR and a strong positive
correlation between both datasets was observed. Comparison of apple ‘M26’ roots cultivated in ARD
soil or γ-irradiated ARD soil suggests that typical defense reactions towards biotic stress take place in
ARD affected plants but they did not allow responding to the biotic stressors attack adequately,
leading to the observed growth depressions in ARD variants.
Key words: Biotic stress response; gene expression; growth depression; MACE; plant defense;
quantitative real-time PCR
Acknowledgements
This work was funded by the “Deutsche Forschungsgemeinschaft” (DFG) and it was part of the
GRK1798 “Signaling at the Plant-Soil Interface”.
We thank the tree nursery Alves in Schleswig-Holstein and Dr. Andreas Wrede for the project
cooperation. Furthermore, we are thankful to Simon Richartz and Bunlong Yim for assistance in the
greenhouse experiment. We also acknowledge the cooperation with Prof. Dr. Ludger Beerhues and
Dennis Reckwell from the University of Braunschweig in analyzing phytoalexin compounds in root
material. In addition, we thank Dr. Frank Schaarschmidt for his statistical advice.

14
Introduction
The worldwide phenomenon apple replant disease (ARD) indicated by reduced shoot growth and fruit
yields represents a severe problem to be overcome. Especially in tree nurseries growing Rosaceae
species like apple this problem can be observed after replanting young trees (Yim et al. 2013).
Symptoms can already be visualized directly after planting (Mazzola and Manici 2012) and include
stunted growth, truncated internodes, rosetted leaves, small-sized root systems, rotten or discolored
roots and reduced fruit yields (Mazzola 1998) as well as a loss of fruit quality (Mazzola and Manici
2012). Regarding the root system it can be observed that epidermal cells and cortical tissues are
destroyed (Yim et al. 2013), root tip necrosis occur (Mazzola and Manici 2012), lateral root
development is reduced (Savory 1966; Hoestra 1968) and functional root hairs are almost completely
missing (Caruso et al. 1989). As a consequence, also the overall root biomass is generally reduced
(Mazzola and Manici 2012). Apple is one of the most important cultivated tree fruits worldwide. In
2011, 75.5 million tons equaling about 12 % of the overall fruit production worldwide was credited to
apples (FAOSTAT 2011) and apple production was estimated to account for 2.5 billion dollars per
year in the USA alone (Brown 2012). Thus, it is essential to develop counteractions against ARD.
Although many studies focused on examining the causal agents of ARD, no definitive cause,
which applies to the majority of cases, is identified up to now. Even though abiotic factors can hinder
apple tree growth, ARD is associated to biotic causes as soil disinfection via pasteurization (Hoestra
1968; Jaffee et al. 1982a) or fumigation (Mai and Abawi 1981; Slykhuis and Li 1985) restores plant
growth on replant soils. Jaffee et al. (1982a, b) and Mazzola (1998) reported on the causal agents
potentially responsible for ARD. The authors mentioned fungal genera such as Cylindrocarpon (Braun
1991, 1995) and Rhizoctonia (Mazzola 1997), oomycete genera like Phytophthora (Sutton et al. 1981)
and Pythium (Mazzola 1998) as well as the lesion nematode Pratylenchus penetrans (Gilles 1974; Mai
and Abawi 1981). Especially, Pythium ultimum was reported several times in literature to be found in
ARD affected soil (Mazzola 1997; Tewoldemedhin et al. 2011a, b) and recent studies dealing with
gene expression started to uncover the response of roots towards infection with P. ultimum (Shin et al.
2014, 2016). However, the diversity in microorganisms that are potentially linked to ARD makes it
difficult to effectively control the problem as broad-spectrum biocides have to be used, most of which
are outbound in many parts of the world (Mazzola 1998). Porter et al. (2010) reported concerns for
growers due to the phase out of soil fumigants which were successfully used for soil disinfection in
former times. Yim et al. (2016) mentioned the EU directive EC 128/2009 (2009) as a goal for the EU
to achieve a reduced and sustainable employment of pesticides, and recent studies investigating
biofumigation as an alternative mean to disinfect ARD affected soil support this view (Mazzola et al.
2015). However, results still vary due to external factors like differences in temperature, precipitation
and solar radiation as well as tissue disruption and soil water content playing a role in the effect of
these alternative methods (Yim et al. 2016).

15
Only recently, studies started to focus on unraveling what actually happens in planta to
examine affected molecular and physiological mechanisms involved in ARD. Higher contents of
phenolic compounds were recorded in plants exposed to ARD due to the accumulation of antioxidant
substances (Henfrey et al. 2015). Moreover, the flavonoid phloridzin was found to a higher extent in
root exudates of ARD plants (Hofmann et al. 2009). Furthermore, infecting plants with one of the
causal agents of ARD, P. ultimum, led to the upregulation of ethylene and jasmonate biosynthesis
genes in root tissue (Shin et al. 2014). Recently, using an RNA-sequencing approach, Shin et al.
(2016) presented a detailed picture of transcriptomic changes in apple roots in reaction to P. ultimum
inoculation. In addition to ethylene and jasmonate, also cytokinin biosynthesis and signaling were
found to be induced in the inoculated roots. Moreover, several genes involved in secondary metabolite
biosynthesis, cell wall fortification and plant defense were upregulated in roots exposed to the
pathogen.
Phytoalexins, another class of secondary metabolites, can have an impact on the defense
response towards biotic stress as shown by their accumulation in the transition zone of Erwinia
amylovora infected apple shoots (Chizzali et al. 2012). In phytoalexin biosynthesis, biphenyl
synthases (Chizzali et al. 2012), O-methyltransferases (Khalil et al. 2015) and biphenyl-4-
hydroxylases (Sircar et al. 2015) are responsible for the production of the antifungal defense
compounds in the form of biphenyls and dibenzofurans. Both of these compound classes were already
detected in Rosaceae species belonging to 14 genera including Malus, Pyrus and Sorbus (Chizzali and
Beerhues 2012; Khalil et al. 2013, 2015). Chizzali and Beerhues (2012) reported ten different
biphenyls and 17 dibenzofurans characterized in these plant species.
In biotic stress response, regulatory genes play an important role to maintain a balanced
metabolism or, regarding transcription factors, can regulate specific genes or invoke signals in plants
(Davletova et al. 2005; Li et al. 2014; Nuruzzaman et al. 2013; Yanagisawa 2002). It was shown that
biotic stress triggers internal defense reactions of affected plants by activating signal transduction
pathways (Dodds and Rathjen 2010; Tsuda and Katagiri 2010; Sato et al. 2010) in which ethylene
(Broekaert et al. 2006; Ruduś et al. 2013) and gibberellin (De Bruyne et al. 2014) but also kinases
(Afzal et al. 2008) can be involved.
This study aimed to better understand ARD effects on a molecular level in planta by analyzing
transcriptomic responses of affected roots. These insights will enable the identification of markers for
early reactions to ARD which might be used in the development of tolerant rootstocks for instance. As
a test object, the apple rootstock ‘M26’ was subjected to soil affected by ARD or disinfected ARD
soil. Recently, Yim et al. (2013) showed that ‘M26’ could be used as a reliable indicator test plant to
detect ARD in soils due to its high susceptibility towards the problem. Employing the rather new RNA
sequencing method “massive analysis of cDNA ends” – MACE (Kahl et al. 2012) – the fully
sequenced genome of apple (Velasco et al. 2010) was used to unravel molecular reactions involved in
ARD. MACE was applied, because the complexity of RNA samples is reduced by only 3’-end

16
sequencing and it allows the high resolution quantification of low expressed genes as well as the
possibility for generation of gene specific markers (Kahl et al. 2012). The objective of this study was
to analyze the transcriptomic response of apple rootstock ‘M26’ roots to the presence or lack of biotic
causal agents of ARD in soil. A selection of candidate genes which was based on a putative function
in biotic stress response was further studied in RT-qPCR experiments.
Material and methods
Soil origin and disinfection
In March 2014, soil for the biotest was obtained from a tree nursery in the area of Pinneberg,
Schleswig-Holstein, Germany (53° 42’ 18.81’’ N, 9° 48’ 16.74’’ E). The soil was taken at a depth of
0-25 cm from three field plots. Until 2009 apple rootstock plants were grown on site, followed by
Prunus domestica in 2010, Cydonia oblonga in 2011 and the apple rootstock ‘M4’ from 2012 (Yim et
al. 2015, 2016). After homogenizing, half of the soil volume was sent for disinfection via γ-irradiation
(BGS – Beta Gamma Service, Wiehl, Germany) at a minimum dose of 10 kGy by which
actinomycetes, fungi and invertebrates are eliminated (McNamara et al. 2003). The soil was packed in
autoclavable bags (Sarstedt, Nümbrecht, Germany) at a soil volume of 18-20 L and, after γ-irradiation,
stored at 4 °C until one day before the start of the experiment (total storage duration: 10 days).
Plant cultivation
Plantlets of the highly susceptible apple rootstock ‘M26’ (Kviklys et al. 2008; St. Laurent et al. 2010;
Yim et al. 2013, 2015) were propagated and rooted in vitro according to Yim et al. (2013) with the
exception of using ½ MS basal medium with 2 % sucrose and 4.92 µM IBA (indole-3-butyric acid)
without BAP (benzylaminopurine) for rooting. Afterwards rooted plants were acclimatized and in May
2014, four weeks after transfer to the greenhouse, potted into 1 L pots containing either γ-irradiated
replant soil (γARD) or replant soil (ARD), each supplied with 2 g L-1 of the slow release fertilizer
Osmocote Exact Standard 3-4 M (16-9-12+2MgO+TE, http://www.scottsprofessional.com). For the
transcriptomic analysis, 25 replicates (= individual plants) per variant were used in addition to 5
replicates for recording the shoot length over the course of the experiment (Supplementary Fig. S1).
Conditions in the greenhouse were as follows: 22 °C ± 2.5 °C, 60 % ± 8.7 % relative humidity and a
16 h photoperiod with additional light (if solar radiation fell below 25 klx, provided by SONT Philips
Master Agro 400W). Plants were watered by hand as required on a daily basis. In addition, plant
protection was performed by spraying against thrips and spider mites according to horticultural
practice. For RNA isolation plant material was harvested after seven days of cultivation in either
γARD or ARD soil. The whole root system was cut from the individual plants, washed with water, put
into 2 ml tubes (Sarstedt, Nümbrecht, Germany) and frozen in liquid nitrogen. Until homogenization
of plant material, samples were stored at -80 °C. Furthermore, the main shoot length of the remaining
5 plants was measured weekly.

17
RNA extraction
For each of the two variants (γARD or ARD), roots of 5 individual plantlets each were combined in a
liquid nitrogen cooled steel cup to form one pooled biological replicate (Supplementary Fig. S1). As a
criterion for the combination of different replicates, equal average shoot length of the plants in the
pool was used. In total five pools (= biological replicates) per variant were generated. The pools were
homogenized and cells were disrupted using a mixer mill (Mixer Mill MM400, Retsch, Haan,
Germany) by adding steel beads (ø 1.5 cm) cooled in liquid nitrogen to the cups which were then
subsequently shaken in the mixer mill for one minute at 30 Hz. RNA extraction of the samples was
achieved by using the InviTrap Spin Plant RNA Mini Kit (Stratec, Birkenfeld, Germany) with an
extraction buffer for phenol containing plants according to the manufacturer’s instructions. In total
100 mg of the homogenized material was weighed into 2 ml tubes (Sarstedt, Nümbrecht, Germany) to
obtain adequate RNA yield and quality, both measured by a spectrophotometer (Nanodrop 2000c,
Peqlab, Erlangen, Germany). Afterwards, genomic DNA was removed via in solution DNA digestion
using 1 µg of total RNA and DNase I (Thermo Scientific, Waltham, MA, USA) according to the
manufacturer’s instructions. The resulting RNA was checked for integrity on a 1 % agarose gel.
Aliquots of 1 µg total RNA were stored at -80 °C until further proceeding.
Massive analysis of cDNA ends (MACE)
Transcriptomic analysis of root samples was accomplished by means of the MACE technology (Kahl
et al. 2012). Extracted RNA of two biological replicates per variant (see section: RNA extraction and
Supplementary Fig. S1) was sent for analysis to GenXPro GmbH (Frankfurt am Main, Germany).
After sequencing raw data was processed using CLC Genomics Workbench 8 (Qiagen, Hilden,
Germany). Raw sequences obtained in this study have been submitted to the NCBI Sequence Read
Archive (SRA) under the accession number SRP077963. Using a poly-A adapter raw sequences were
trimmed to remove sequenced bases resulting from cDNA synthesis primers. In addition, the adapters
allowed a further quality check. Trimmed sequences of the MACE analysis were mapped to the Malus
x domestica.v1.0-primary.mRNA database obtained from https://www.rosaceae.org (11.11.2014).
Parameters for mapping were as follows: Mismatch cost = 2, insertion cost = 3, deletion cost = 3,
length fraction = 0.8, similarity fraction = 0.8, strand specific = both, maximum number of hits for a
read = 10 and expression values = total counts. CLC’s implemented Baggerley’s test – which accounts
for transcript reads (= counts) according to the sample specific total number of sequence reads (= total
counts) – was used to identify differentially expressed or unique genes with a false discovery rate
(FDR) corrected p value < 0.05 according to the ratio of ARD to γARD of trimmed read numbers
(ARD γARD-1). Ratios between 0 and 1 were transformed by multiplying with the negative reciprocal
value. Negative resulting values indicated a downregulation of specific transcripts in ARD samples
compared to γARD samples, whereas positive values specified an upregulation of transcripts in ARD
samples. All genes were processed in MapMan (Thimm et al. 2004) to classify affected metabolic
18
pathways. Corresponding sequences were blasted using default parameters for BLASTN of NCBI
(http://blast.ncbi.nlm.nih.gov/Blast.cgi?PROGRAM=blastn&PAGE_TYPE=BlastSearch&LINK_LOC
=blasthome) to obtain potential gene functions. From the list of differentially expressed or unique
genes with a FDR adjusted p value < 0.05 and at least 2-times regulation, candidate genes with
reported function in biotic stress response and plant defense were selected to be further evaluated in
subsequent experiments by RT-qPCR (Table 1). In addition, the phytoalexin biosynthesis genes
biphenyl synthase 2 and 4 (BIS2, BIS4) as well as the biphenyl hydroxylase P450 oxidase (B4Ha)
were included in RT-qPCR experiments as they belong to gene families (BIS3, B4Hb) identified here
for the first time in apple roots.
Primer design
Parameters for primer design included a primer length of 18-24 bp, a resulting fragment length of 100-
200 bp, TM of 57-63 °C, GC content of 40-60 %, no more than triple repeats (e.g. GGG), GC clamp at
the 3’ end but no more than two times GC in the last five base pairs, no dimers, no self-
complementarity and no hairpin structures. Potential primers were checked according to set
parameters using Clone Manager 9 Demo (Sci-Ed Software, Denver, CO, USA). To get reverse
primers GeneRunner (Gene Runner, http://www.generunner.net/) was used to obtain complementary
sequences. If all parameters met the criteria, primers were searched in the Malus x domestica.v1.0-
primary.mRNA database for specificity. Reference genes were selected according to Perini et al.
(2014) and Flachowsky et al. (2010). Primer sequences of genes which showed sufficient
amplification efficiency (see section below: RT-qPCR validation) are listed in Table 1 including their
respective MDP ID (Apple gene identification number).
First strand cDNA synthesis
RNA samples were used for first strand cDNA synthesis by employing the RevertAid First Strand
cDNA Synthesis Kit (Thermo Scientific, Waltham, MA, USA) according to the manufacturer’s
instructions with 1 µg RNA. Random hexamer primers were included in the reaction mix to reversely
transcribe the total RNA. After cDNA synthesis samples were aliquoted for subsequent RT-qPCR
experiments and stored at -80 °C.
RT-qPCR validation
Primer pairs of reference and candidate genes were tested in RT-qPCR efficiency tests to check for
sufficient amplification efficiency and specificity using a real-time PCR cycler (CFX Connect™, Bio-
Rad, Hercules, CA, USA). The efficiency tests were run by combining equal amounts of γARD and
ARD cDNA. Mixed cDNA samples were analyzed in a dilution series of 1:10, 1:50, 1:100, 1:500 and
1:1000. For each primer combination (200 nM for each forward/reverse primer) the dilution samples
were tested with two technical replicates using the iTaq Universal SYBR Green Supermix (Bio-Rad,
Hercules, CA, USA). All primer pairs were tested at 60 °C annealing temperature. The protocol for the

19
efficiency tests and subsequent RT-qPCRs was as follows: Three minutes at 95 °C, followed by 40
cycles of 10 s at 95 °C and 30 s at 60 °C. The program was ended after a melt curve analysis from
65 °C to 95 °C with an increment of 0.5 °C for 5 s at each step. Data was recorded with the Bio-Rad
CFX Manager 3.1 software (Bio-Rad, Hercules, CA, USA) and amplification efficiencies were
calculated. Primer pairs with amplification efficiencies of 90-110 % showing specific amplification
according to the melt curve analysis were used for ensuing experiments. The 1:10 cDNA dilution was
used and data was again recorded with the Bio-Rad CFX Manager 3.1 software (Bio-Rad, Hercules,
CA, USA) for individual samples using five biological replicates (as defined in section: RNA
extraction) and two technical replicates per variant. Relative normalized expression was calculated
using γARD as the denominator according to the ∆∆CT method (Livak and Schmittgen 2001). The
potential reference genes were tested according to their stability, based on the calculation of
Vandesompele et al. (2002). The following reference genes were selected for normalization: actin-7
(ACT7), tubulin beta chain (TUBB), ubiquitin-conjugating enzyme E2 10-like (UBE210), elongation
factor 1-alpha (EF1a) and elongation factor 1-beta 2-like (EF1b).
Statistical analysis
Statistical analysis was performed using the statistics program R 3.3.2 (R Development Core Team
2008). Means of parameters measured or calculated for γARD were compared to the means of ARD
using the Welch Two Sample t-Test (Welch 1947) at a p value level of 0.05. For internal verification,
MACE and RT-qPCR datasets were compared by calculating the Pearson product-moment correlation
coefficient (Pearson 1895) in Microsoft Excel 2010 to test for reliability of both methods.
Results
ARD soil affected shoot and root growth negatively
Cultivating apple rootstock ‘M26’ in either γARD soil or ARD soil led to significant shoot length
differences already after two weeks (Fig. 1a). Plants grown on ARD soil were 2.9 ± 0.4 cm in size at
this time point, whereas the shoot length of γARD plants measured 3.8 ± 0.5 cm. The differences
between the two variants increased over time so that γARD plants showed almost double the size of
ARD plants at the end of the experiment (Fig. 1a, c) with 28.3 ± 2.3 cm compared to 15.8 ± 2.3 cm. At
the final evaluation, also the root system of ARD plants was clearly affected not only in size but
displaying darker coloration, too (Fig. 1d). In contrast, plants harvested after one week of cultivation
for transcriptomic analysis of early molecular responses to ARD did not show any visual growth
differences (Fig. 1b).
Sequencing and mapping
MACE was employed to obtain a detailed view on molecular responses of apple roots in ARD soil.
For this, RNA was extracted from roots of plants cultivated in either disinfected replant soil (γARD)

20
or untreated replant soil (ARD). Samples of cDNA were analyzed and resulted in 12 to 22 million raw
reads with an average length of 92.0 to 92.4 bp per sample (Table 2). After trimming of adapter
sequences the average length of reads ranged from 86.2 to 87.9 bp. Mapping to the Malus domestica
sequence database resulted in roughly 32 % specifically mapped reads and about 2 % of reads
matching to more than one sequence per sample (Table 2). Reads mapped to more than one sequence
(non-specifically mapped reads) were not included in further analyses.
Transcriptomic response of apple ‘M26’ roots to ARD
In total 1874 differentially expressed or unique genes with a FDR corrected p value < 0.05 could be
mapped to the Malus domestica database but assigning gene functions was only successful for
1542 genes which are listed in Supplementary Table S1. For an overview of the affected metabolic
pathways, expressed transcripts were further analyzed using the MapMan software (Thimm et al.
2004) and the genes were ordered according to their function in the different metabolic pathways
(Fig. 2). Regarding all differentially expressed genes, transcripts that could be annotated to the RNA
and protein functional categories were most represented but also signaling, transport and stress
associated genes were higher represented in relation to the other functional categories (Fig. 2). More
transcripts were assigned to these MapMan functional categories in γARD samples in comparison to
ARD samples but ARD samples revealed a higher number of genes assigned to secondary metabolism
– especially flavonoid, phenylpropanoid and phenolic metabolism – redox reactions and development
(Fig. 2). In contrast, genes involved in the primary metabolism were observed to be of lower
abundance in ARD samples including genes attributed to cell, cell wall, minor CHO metabolism and
photosynthesis. In more detail, Table 3 lists genes with at least 3-times regulation (pFDR <0.05) or
which were found only in either γARD or ARD samples. Especially, genes which show the highest
upregulation under ARD conditions are interesting candidates to further characterize the reaction of
apple roots in ARD and a subset of those has been selected in this study for the RT-qPCR analyses.
Validation of MACE data via RT-qPCR
MACE was performed to generate an overview of ARD affected molecular responses that resulted in
the observed severe growth depression. Highly regulated genes might play a prominent role in ARD
response and the observed growth depressions in untreated ARD soil point to biotic stress reaction.
Hence, the selection of candidate genes to validate the MACE data via RT-qPCR and to analyze their
expression in further plant pools was mainly focused on metabolic pathways of stress responses as
well as the observed strong changes in secondary plant metabolites together with higher expression in
ARD samples.
Calculating the Pearson product-moment correlation coefficient was performed for internal
verification of MACE data and revealed a strong correlation between the two datasets with a
coefficient of correlation R value of 0.88 (p < 0.001). For RT-qPCR experiments actin-7 (ACT7),
tubulin beta chain (TUBB), ubiquitin-conjugating enzyme E2 10-like (UBE210), elongation factor 1-

21
alpha (EF1a) and elongation factor 1-beta 2-like (EF1b) were used as reference genes according to
their expression stability. The investigated genes were ordered according to the following classes:
Phytoalexin biosynthesis, plant defense, regulatory function and signaling (Table 4). After testing of
all genes in RT-qPCR experiments, two of the genes did not show a significant difference and were
expressed equally in both variants. These genes included the caffeic acid 3-O-methyltransferase-like
(OMT1a) gene involved in phytoalexin biosynthesis and the regulatory gene senescence-associated
carboxylesterase 101-like (SAG101).
Most interestingly, genes responsible for phytoalexin biosynthesis were 2.1 to 4.1 times
upregulated in ARD samples. Here, the biphenyl synthases 2 to 4 (BIS2 to BIS4) showed the highest
regulation ranging from 3.7 to 4.1, whereas the caffeic acid 3-O-methyltransferase-like (OMT1b) gene
was 2.1 times upregulated in ARD samples (Table 4). The biphenyl hydroxylase P450 oxidases (B4Ha
and B4Hb) were upregulated 2.6 to 2.8 times. The expression levels were highest for BIS3 and
OMT1b, whereas BIS2 and BIS4 showed the lowest expression levels among the phytoalexin
biosynthesis genes. Also two other genes functioning in overall plant defense, the acidic
endochitinase-like (CHIA) and the thaumatin-like protein 1a (TL1) were upregulated 2.8 and 4.3 fold,
respectively, but CHIA was higher expressed (Table 4). Similarly, another endochitinase was
upregulated 3.3 fold in ARD samples (Table 3).
Genes with regulatory functions showed diverse responses in transcription. The heat shock
protein genes 18.5 kDa class I heat shock protein-like as well as 17.1 kDa and 17.3 kDa class II heat
shock protein-like (HSP18.5, HSP17.1 and HSP17.3) were 3.4 to 3.9 times downregulated in ARD
samples with HSP17.3 showing the highest expression level, whereas the F-box/kelch-repeat protein
(KFB) gene was upregulated 6.3 fold in ARD samples but it displayed very low expression. Also
many other HSP genes were downregulated 3.1 to 5 fold in ARD samples (Table 3).
Differing regulation was also observed for the selected genes involved in signaling. The genes
for ethylene-responsive transcription factor RAP2-11-like (ERF RAP2.11: 12.9 times), the gibberellin-
regulated protein 1-like (GASA1: 2 times) and the LRR receptor-like serine/threonine-protein kinase
MRH1 (MRH1: 1.4 times) were all downregulated in ARD samples (Table 4). Likewise, several other
kinases were downregulated 3.1 to 5.8 fold as well, in addition to another ERF RAP2.11 gene which
was downregulated 3.6 fold (Table 3). In contrast, the genes for dof zinc finger protein DOF3.5-like
(DOF3.5: 1.4 times), the NAC transcription factor 25-like (NAC25: 2 times), the ethylene-responsive
transcription factor 1B-like (ERF1B: 3.3 times), the zinc finger protein ZAT12 (ZAT12: 4.1 times) and
the GATA zinc finger domain-containing protein 10-like (GATAD10: 15 times) were all upregulated
in ARD samples. Regardless of their high regulation, genes ERF RAP2.11 and GATAD10 showed very
low expression levels, and likewise, overall all upregulated genes in the category signaling displayed
minimal expression levels.

22
Discussion
This study aimed to uncover and investigate the molecular responses of apple roots when faced with
ARD soil. For this, the rootstock ‘M26’ was used as it was already established as a reliable indicator
test plant to detect ARD in soils due to its high susceptibility (Yim et al. 2013). The ARD sensitive
genotype ‘M26’ was employed rather than an ARD tolerant genotype such as ‘G41’ (Fazio et al.
2005). The reason behind this was to uncover ARD affected molecular reactions in roots of a
challenged genotype. The identified candidate genes should be analyzed in the next steps in a
comparison of sensitive and more tolerant genotypes. Thereby, in later stages mechanisms of tolerance
can be identified and molecular markers can be developed enabling breeding for ARD tolerance.
Although no differences in shoot length or plant biomass could be visualized after one week
of cultivation when roots were harvested for RNA isolation, plants showed significant growth
depressions already after two weeks of cultivation in ARD soil compared to the γ-irradiated ARD soil
(Fig. 1). Mazzola and Manici (2012) reported that replant disease symptoms can be observed on a
consistent basis one to three months after planting in the field. Under controlled, growth promotive
greenhouse conditions in smaller soil volumes symptoms can already be visualized within two to five
weeks (Yim et al. 2013, 2015). As we wanted on the one hand to identify early affected molecular
reactions before significant growth differences were observable and on the other hand the stress
reactions due to the repotting of the plants should not interfere with the reactions to the soil treatments,
the harvest time point was set to seven days after planting. If potential candidate genes can be used as
markers for replant disease the earlier time point can decrease the cost for breeders and tree nurseries
in either waiting to identify more tolerant genotypes or testing of soil for incidence of ARD,
respectively. In addition to stunted growth, a smaller sized root system and rotten roots were
monitored at the end of the experiment in ARD variants (Fig. 1d). In previous studies the effect of
ARD on root morphology was covered and it was observed that epidermal cells and cortical tissues are
destroyed (Yim et al. 2013), root tip necrosis occur (Mazzola and Manici 2012), lateral root
development is reduced (Savory 1966; Hoestra 1968) and functional root hairs are almost completely
missing (Caruso et al. 1989). As a consequence, the overall root biomass is reduced (Mazzola and
Manici 2012) indications for which were also observed in the present study (Fig. 1d). As shown by
several previous studies (Hoestra 1968; Jaffee et al. 1982a; Mai and Abawi 1981; Slykhuis and Li
1985), disinfection of ARD soil improved plant growth stressing the association of ARD with the soil
biome resulting in biotic stress. Mainly different soil microbial communities as well as higher amounts
of detrimental soil organisms in ARD soil compared to γARD soil must have led to the observed
reduced plant growth (Franke-Whittle et al. 2015; Mazzola et al. 2015; Yim et al. 2015).
Yim et al. (2015) assumed that damaged ARD roots invested more energy in defense reactions
because in a previous study (Yim et al. 2013) ARD roots showed stronger lignification which may be
due to oxidation of phenolic compounds, also an important part of defense responses in plants
(Vermerris and Nicholson 2008). The darker coloration of ARD roots (Fig. 1d) leads to the
23
assumption of higher phenolic concentrations in the root system. Likewise, Henfrey et al. (2015)
showed that phenolic compounds accumulated in plants exposed to ARD suggesting a function as
antioxidant substances. In addition, the flavonoid phloridzin was found to a higher extent in root
exudates of ARD plants (Hofmann et al. 2009). These findings correlate with the observed changes in
molecular responses of ARD roots (Fig. 2). Here, genes involved in secondary metabolism, especially
flavonoid, phenylpropanoid and phenolic metabolism were upregulated in ARD samples.
Overall, the MACE technology was successfully employed for the first time working with
apple root material. Parameters shown in Table 2 were within ranges already reported for other studies
using MACE: The number of reads with 12 to 22 millions was higher compared to data obtained for
tomato pollen with 3 to 6 million reads (Bokszczanin et al. 2015) and similar to tomato leaves with
12 to 15 million reads (Fragkostefanakis et al. 2015). In the aforementioned studies the percentage of
mapped reads ranged between 30 to 45 % for tomato pollen which is comparable to our study whereas
in tomato leaves only 10 to 11 % of all reads could be mapped. The average length of reads was in the
previously reported range of 50 to 100 bp (Kahl et al. 2012; Müller et al. 2014; Zajac et al. 2015).
Furthermore, the validation of MACE data via RT-qPCR revealed that all tested candidate genes at
least showed the same tendency of regulation in both methods and a good correlation (R = 0.88). A
first set of regulated genes identified by MACE which were selected for RT-qPCR experiments
comprised different classes. In particular, phytoalexin biosynthesis, plant defense, regulatory function
and signaling classes included genes with high differential regulations and were therefore investigated
in detail (Table 4). Furthermore, BIS2, BIS4 and B4Ha were included in RT-qPCR experiments as they
belong to gene families (BIS3, B4Hb) identified here for the first time in apple roots. All classes had
previously been reported in literature to play a role in biotic stress response (see below). Thus, this
study contributes to the knowledge of reactions of roots of woody plant species to biotic stressors
which is scarce compared to the well-studied responses of herbaceous species in aboveground tissues.
Interestingly, since not expected, the biphenyl synthases BIS2 to BIS4, the caffeic acid 3-O-
methyltransferase-like OMT1b gene and the biphenyl hydroxylase P450 oxidases B4Ha as well as
B4Hb were significantly upregulated in ARD roots (Table 4). The products of these genes function as
important enzymes in phytoalexin biosynthesis (Khalil et al. 2015). In cytological studies on the
phytoalexin camalexin and its antimicrobial mechanisms in Arabidopsis in response to infection with
Botrytis cinerea and Alternaria spp., scientists found that phytoalexins cause the disruption of
membrane integrity (Rogers et al. 1996), inhibition of conidial germination and germ-tube elongation
(Sellam et al. 2007), as well as the apoptotic-like programmed cell death of fungi (Shlezinger et al.
2011). The production of phytoalexins is one possibility for plants to cope with biotic stress (Ahuja et
al. 2012; Darvill and Albersheim 1984; Kokubun and Harborne 1995; Kuć 1995). Chizzali et al.
(2012) monitored the accumulation of the apple phytoalexins aucuparin and dibenzofuran in the
transition zone of Erwinia amylovora infected apple shoots. Higher expression of genes responsible
for the production of phytoalexins correlated with the overall higher amount of metabolites identified

24
(Chizzali et al. 2012). Interestingly, in the present study BIS3 showed the highest expression level
amongst the tested phytoalexin biosynthesis genes (Table 4), whereas the other genes involved in
phytoalexin biosynthesis showed comparable expression levels except for BIS4 with lower expression
levels. BIS3 was also the gene with the highest expression in the study of Chizzali et al. (2012),
although it must be taken into account that the genes were tested in aboveground tissue. Nevertheless,
the expression was observed close to the infection site, just as in this study in which the root system
was exposed to the biotic stress of ARD. Regarding BIS4, Shin et al. (2016) also found an
upregulation of this gene, annotated as chalcone synthase, already 24 hours after infection with P.
ultimum and with increasing time the gene was expressed even higher in infected roots. Due to the
potential relevance of this oomycete in ARD the finding of BIS genes seems to be enhanced. For the
first time, our study showed induced expression of genes involved in the biosynthesis of phytoalexins
in apple roots. Detailed biochemical analyses proving the presence of biphenyls and dibenzofurans in
roots are in progress (cooperation with L. Beerhues, University of Braunschweig) and revealed
increased levels of four different phytoalexins in ARD roots (data not shown). As phytoalexins act
predominantly against fungi the role of fungi in ARD seems to be enhanced as suggested in literature
(Franke-Whittle et al. 2015; Manici et al. 2013). Rogers et al. (1996) mentioned a majority of cases
showcasing the correlation of host resistance and the level of phytoalexin accumulation in potato,
Vicia fabia and Phaseolus vulgaris. Hence, the upregulation of phytoalexin biosynthesis genes
resulting in increased levels of phytoalexins was not expected due to the obvious lack of their effect.
Nevertheless, Rogers et al. (1996) also reported on Brassica spp. and various cruciferous plants that
did not show this typical correlation. In addition, the authors noted that phytoalexins in high
concentrations may lead to cytotoxicity. Therefore, another explanation may be that the production of
phytoalexins in roots of ‘M26’ in response to ARD led to a situation in which affected plants were not
able to handle the sequestration of potentially toxic molecules any longer, killing themselves in the
process of trying to respond with a well-established defense. Eventually, it is important to link found
gene expression results to the analysis of microbial communities in ARD soils to better understand the
etiology of the disease.
Ethylene can induce synthesis of phytoalexins derived from the phenylpropanoid pathway
(Chung et al. 2001; Ishigaki et al. 2004; Kamo et al. 2000). Also more generally, ethylene is often
reported to play an important role in defense reactions of plants towards biotic stress (Broekaert et al.
2006; Glazebrook 2005). Infecting plants with one of the causal agents of ARD, P. ultimum, led to the
upregulation of 1-aminocyclopropane-1-carboxylic acid synthases and ethylene responsive
transcription factors involved in ethylene biosynthesis in root tissue (Shin et al. 2014). In ARD roots,
two ERF RAP2.11 genes were downregulated while ERF1B showed an upregulation in ARD roots.
Other genes involved in ethylene biosynthesis and signaling as well as earlier time points need to be
investigated to gather a complete picture of their impact in the ARD response.

25
With regard to ethylene being an important signaling molecule to activate defense related
genes such as the pathogenesis-related chitinase gene (Lorenzo et al. 2003; Pré et al. 2008; Punja and
Zhang 1993; Shin et al. 2014; Solano et al. 1998), CHIA and another endochitinase were analyzed and
found upregulated in ARD roots. The same was true for the pathogenesis related gene thaumatin-like 1
(TL1) being related to thaumatin with reported antifungal function (Liu et al. 2010). In rice TL1 gene
expression was enhanced by microbial infection with Rhizoctonia solani and plant hormones such as
ethylene (Velazhahan et al. 1999). According to our transcriptomic data, the well-studied defense
mechanism of ethylene production and downstream signaling (e.g. defense gene activation) upon
pathogen attack does not seem to work properly in ‘M26’ plants subjected to ARD.
DNA-binding genes can play a role in defense mechanisms as regulators of defense gene
expression upon salicylic acid and oxidative stress signals (Chen et al. 1996; Kang and Singh 2000;
Yanagisawa 2002; Zhang et al. 1995). In our study, DOF3.5 showed an upregulation in ARD roots
(Table 4).
Biotic stress triggers internal defense reactions of affected plants by activating signal
transduction pathways (Dodds and Rathjen 2010; Tsuda and Katagiri 2010; Sato et al. 2010) often
involving transcription factors (Davletova et al. 2005; Li et al. 2014; Nuruzzaman et al. 2013). In rice,
zinc finger protein genes of the GATA family were repressed in the interaction with the pathogen
Magnaporthe oryzae. In contrast, we could show an increase of GATAD10 in ARD roots. Another zinc
finger protein gene, namely ZAT12, was upregulated in ARD roots as well. In previous studies it was
shown that this gene is, amongst other functions, associated with biotic stress response, especially
reactive oxygen signaling (Davletova et al. 2005). This form of signaling was highlighted by Baxter et
al. (2013) pointing to the importance of reactive oxygen signaling in diverse biological processes
including pathogen attacks. Also NAC transcription factors play a vital role in defense mechanisms as
they function in transcriptional reprogramming associated with plant immune responses (Nuruzzaman
et al. 2013). In their review, the authors also mentioned the upregulation of NAC genes in response to
attack by viruses, fungal elicitors and bacteria. Likewise, in ARD roots, NAC25 showed higher
expression levels (Table 4). Regardless of their upregulation, the analyzed transcription factors
obviously did not lead to a sufficient immune reaction.
The same applied to other signaling genes reported in literature. Zhu et al. (2005) implicated
gibberellin to be involved in plant immunity by regulating DELLA proteins and therefore modulating
the balance of salicylic and jasmonic acid signaling during plant immunity. The gibberellin-regulated
protein gene GASA1 was downregulated in roots cultivated in ARD soil (Table 4). Interestingly, there
are several studies that either observed increased resistance or susceptibility by altering DELLA
proteins (De Bruyne et al. 2014). MRH1 and several other kinases were downregulated in roots
cultivated in ARD soil as well (Table 3 and 4). Kinases such as MRH1 lead to further signal
transduction pathways including phytohormone and reactive oxygen signaling conferring disease
resistance (Afzal et al. 2008). The downregulation of these signaling genes in ARD roots might be an

26
indication of an impaired defense reaction in ‘M26’ plants being obviously not sufficient to protect the
plant from the biotic stress.
The last class of tested genes included regulatory genes which also play an important role in
biotic stress response to maintain a balanced metabolism even when faced with adverse situations.
These genes include F-box proteins (Ul Hassan et al. 2015) and heat shock proteins (Park and Seo
2015) that regulate overall protein function also upon biotic stress. Here, KFB was upregulated in
ARD samples whereas the heat shock protein genes HSP18.5, HSP17.1 and HSP17.3 as well as
several other HSP genes were downregulated (Table 4).
Ul Hassan et al. (2015) highlighted the functions of F-Box proteins and their involvement in
phytohormones signaling as well as pathogen defense. But it was also reported that F-Box proteins
interact with enzymes in the secondary metabolism, especially in the phenylpropanoid metabolism.
However, the authors also stated that KFB genes could actually promote successful infection of
pathogens in the plant. The upregulation of KFB in ARD roots therefore suggests either that it could
have had an influence on the higher expression of secondary metabolism genes (Fig. 2) and/or that
potential harmful microorganism established themselves in the root system more easily.
The investigated heat shock protein genes were downregulated in ARD samples. Due to their
function in protein stabilization and refolding of proteins under stressful conditions (Hüttner and
Strasser 2012; Sitia and Braakman 2003; Whitley et al. 1999) but also their involvement in innate
immunity (Li et al. 2009; Liu and Howell 2010; Nekrasov et al. 2009), their observed downregulation
again points to impaired biotic stress response under ARD conditions and highlights the importance of
these genes in maintaining metabolism and growth.
This lays a foundation on which future projects should gain valuable knowledge regarding
molecular effects in roots of ARD affected plants. It is the first time a study deals with the reaction to
the whole microorganism complex leading to ARD on the molecular level in planta. A different
approach was used in the most recent study by Shin et al. (2016) which investigated the interaction of
one potential causal agent of ARD, P. ultimum, with the plant root. Their approach showed the
specific molecular response of roots to this pathogen and identified genes involved in the early
pathogen detection as well as the infection-induced production of pathogenesis-related proteins and
several antimicrobial secondary metabolites. Moreover, it became obvious that ethylene, jasmonate
and cytokinin signaling seem to play a role in the defense response (Shin et al. 2016). Genes encoding
for enzymes involved in cell wall modification and antioxidant production were found upregulated in
apple roots inoculated with P. ultimum (Shin et al. 2016). Thus, several similar observations as in the
present study were reported in that one of Shin et al. (2016), but only relatively few differentially
expressed genes (e.g. BIS4) could be detected by both approaches. This is partly due to the different
genotypes and time points analyzed, but also points to the value of both approaches. The complex
interactions of the different causal agents and other microorganisms in ARD affected soil cannot be
covered by investigations involving single pathogens. From the synopsis of the reactions of roots to

27
particular pathogens on the one hand and the observed transcriptomic changes in reaction to proven
ARD soils (this study) should result in a better understanding and finally a complete picture of the
ARD problem.
To complement our experimental approach employing ARD soils detailed analyses of the
microbial communities in ARD soil and disinfected ARD soil are required. Since the ARD causes
were shown to differ between different sites and soil types future studies need to involve other ARD
soils to discriminate between site- or soil-specific and common ARD responses.
In conclusion, this study highlighted the importance of unraveling the molecular responses of
‘M26’ to ARD. For the first time, gene expression was investigated in roots of ARD affected plants
with a detailed investigation of genes involved in phytoalexin biosynthesis as well as plant defense,
regulatory functions and signaling. Further in depth analysis of these genes, particularly, those found
in the secondary metabolism also in a time course experiment should improve the understanding of
ARD and the physiological responses of plants towards ARD. The maximal number of differentially
expressed genes was observed 48 h after inoculation with P. ultimum (Shin et al. 2016). Therefore,
earlier time points should be included in future experiments. The novel finding of upregulated
phytoalexin biosynthesis genes raises future research questions addressing their effects on the
microorganisms involved in ARD. It will also be interesting to clarify if they are exuded by the roots
and thereby affecting the rhizosphere microbial community, since a recent study identified bacterial
degraders of phenolic compounds to be less abundant in ARD soils (Yim et al. 2015). Taking all the
findings into consideration, it seems that typical defense reactions towards biotic stress found in
literature take place in ARD affected plants as well, but they did not allow responding to the biotic
stressors attack adequately leading to the observed growth depressions in ARD variants. Furthermore,
other plant tissues in order to differentiate between local and systemic reactions as well as other ARD
soils and apple genotypes should be analyzed in order to better understand ARD on a molecular level
and assist in breeding.
References
Afzal AJ, Wood AJ, Lightfoot DA (2008) Plant Receptor-Like Serine Threonine Kinases: Roles in Signaling and Plant Defense. Mol Plant
Microbe In 5:507-517.
Ahuja I, Kissen R, Bones AM (2012) Phytoalexins in defense against pathogens. Trends Plant Sci 2:1360-1385.
Baxter A, Mittler R, Suzuki N (2013) ROS as key players in plant stress signaling. J Ex Bot:doi:10.1093/jxb/ert375.
Bokszczanin KL, Krezdorn N, Fragkostefanakis Set al (2015) Identification of novel small ncRNAs in pollen of tomato. BMC Genomics
16:714.
Braun PG (1991) The combination of Cylindrocarpon lucidum and Pythium irregulare as a possible cause of apple replant disease in Nova
Scotia. Can J Plant Pathol 13:291-297.
Braun PG (1995) Effects of Cylindrocarpon and Pythium species on apple seedlings and potential role in apple replant disease. Can J Plant
Pathol 17:336-341.
Broekaert WF, Delauré SL, De Bolle MFC, Cammue BPA (2006) The Role of Ethylene in Host-Pathogen Interactions. Annu Rev
Phytopathol 44:393-416.
Brown S (2012) Apple. In: Badenes ML, Byrne DH (eds) Fruit Breeding. Springer, Heidelberg, pp 329-368.
Caruso FL, Neubauer BF, Begin MD (1989) A histological study of apple roots affected by replant disease. Can J Botany 67:742-749.

28
Chen W, Chao G, Singh KB (1996) The promoter of an H2O2-inducible, Arabidopsis glutathione S-transferase gene contains closely linked
OBF and OBP1-binding sites. Plant J 10:955-966.
Chizzali C, Beerhues L (2012) Phytoalexins of the Pyrinae: biphenyls and dibenzofurans. Beilstein J Org Chem 8:613-620.
Chizzali C, Gaid MM, Belkheir AK, Hänsch R, Richter K, Flachowsky H, Peil A, Hanke MV, Liu B, Beerhues L (2012) Differential
expression of biphenyl synthase gene family members in fire blight-infected apple cv. ‘Holsteiner Cox’. Plant Physiol 158:864-
875.
Chung IM, Park MR, Rehman S, Yun SJ (2001) Tissue specific and inducible expression of resveratrol synthase gene in peanut plants. Mol
Cell 12:353-359.
Darvill AG, Albersheim P (1984) PHYTOALEXINS AND THEIR ELICITORS-A Defense Against Microbial Infection in Plants. Ann Rev
Plant Physiol 35:243-275.
Davletova S, Schlauch K, Coutu J, Mittler R (2005) The Zinc-Finger Protein Zat12 Plays a Central Role in Reactive Oxygen and Abiotic
Stress Signaling in Arabidopsis. Plant Physiol 139:847-856.
De Bruyne L, Höfte M, De Vleesschauwer D (2014) Connecting Growth and Defense: The Emerging Roles of Brassinosteroids and
Gibberellins in Plant Innate Immunity. Mol Plant 7:943-959.
Dodds PN, Rathjen JP (2010) Plant immunity: towards an integrated view of plant – pathogen interactions. Nat Rev Genet 11:539-548.
EC 128/2009 (2009) Directive 2009/128/EC of the European Parliament and of the Council of 21 October 2009 establishing a framework for
Community action to achieve the sustainable use of pesticides. Off J Eur Union L309:http://eur-lex.europa.eu/legal-
content/EN/TXT/HTML/?uri=CELEX:32009R 1107&from=EN.
FAOSTAT (2011) http://faostat.fao.org.
Fazio G, Aldwinckle HS, Robinson TL, Cummins J (2005) Geneva 41: a new fire blight resistant, dwarf apple rootstock. Hort Science
40:1027.
Flachowsky H, Szankowski I, Fischer TC et al (2010) Transgenic apple plants overexpressing the Lc gene of maize show an altered growth
habit and increased resistance to apple scab and fire blight. Planta 231:623-635.
Fragkostefanakis S, Simm S, Paul P, Bublak D, Scharf KD, Schleiff E (2015) Chaperone network composition in Solanum lycopersicum
explored by transcriptome profiling and microarray meta-analysis. Plant Cell Environ 38:693-709.
Franke-Whittle IH, Manici LM, Insam H, Stres B (2015) Rhizosphere bacteria and fungi associated with plant growth in soils of three
replanted apple orchards. Plant Soil 395:317-333.
Gilles GL (1974) The use of a biological test to measure “soil sickness” in cases of specific apple replant diseases. Agr Ecosyst Environ
1:221-226.
Glazebrook J (2005) CONTRASTING MECHANISMS OF DEFENSE AGAINST BIOTROPHIC AND NECROTROPHIC PATHOGENS.
Annu Rev Phytopathol 43:205-227.
Henfrey JL, Baab G, Schmitz M (2015) Physiological stress responses in apple under replant conditions. Sci Hortic-Amsterdam 194:111-
117.
Hoestra H (1968) Replant diseases of apple in the Netherlands. Dissertation, Wageningen University.
Hofmann A, Wittenmayer L, Arnold G, Schieber A, Merbach W (2009) Root exudation of phloridzin by apple seedlings (Malus x domestica
Borkh.) with symptoms of apple replant disease. J Appl Bot Food Qual 82:193-198.
Hüttner S, Strasser R (2012) Endoplasmic reticulum-associated degradation of glycoproteins in plants. Front Plant Sci 3:67.
Ishigaki E, Asamizu T, Arisawa M, Kurosaki F (2004) Cloning and expression of calmodulin genes regulating phytoalexin production in
carrot cells. Biol Pharm Bull 27:1308-1311.
Jaffee BA, Abawi GS, Mai WF (1982a) Role of soil microflora and Pratylenchus penetrans in an apple replant disease. Phytopathology
72:247-251.
Jaffee BA, Abawi GS, Mai WF (1982b) Fungi associated with roots of apple seedlings grown in soil from an apple replant site. Plant Dis
66:942-944.
Kahl G, Molina C, Rotter B, Jüngling R, Frank A, Krezdorn N, Hoffmeister K, Winter P (2012) Reduced representation sequencing of plant
stress transcriptomes. J Plant Biochem Biot 21:119-127.
Kamo T, Hirai N, Tsuda M, Fujioka D, Ohigashi H (2000) Changes in the content and biosynthesis of phytoalexins in banana fruit. Biosci
Biotech Bioch 64:2089-2098.
Kang HG, Singh K (2000) Characterization of salicylic acid-responsive, Arabidopsis Dof domain proteins: overexpression of OBP3 leads to
growth defects. Plant J 21:329-339.
Khalil MNA, Beuerle T, Müller A, Ernst L, Bhavanam VBR, Liu B, Beerhues L (2013) Biosynthesis of the biphenyl phytoalexin
aucuparinin Sorbus aucuparia cell cultures treated with Venturia inaequalis. Phytochemistry 96:101-109.

29
Khalil MNA, Brandt W, Beuerle T, Reckwell D, Groeneveld J, Hänsch R, Gaid MM, Liu B, Beerhues L (2015) O-Methyltransferases
involved in biphenyl and dibenzofuran biosynthesis. Plant J 83:263-276.
Kokubun T, Harborne JB (1995) PHYTOALEXIN INDUCTION IN THE SAPWOOD OF PLANTS OF THE MALOIDEAE
(ROSACEAE): BIPHENYLS OR DIBENZOFURANS. Phytochemistry 6:1649-1654.
Kuć J (1995) PHYTOALEXINS, STRESS METABOLISM, AND DISEASE RESISTANCE IN PLANTS. Annu Rev Phytopathol 33:275-
297.
Kviklys D, Lanauskas J, Sakalauskaitė J, Kviklienė N, Uselis N (2008) Soil exhaustion and rootstock effect on the growth of apple planting
material. Agronomy Research 6:511-516.
Li WT, Chen WL, Yang C et al (2014) Identification and network construction of zinc finger protein (ZFP) genes involved in the rice-
Magnaporthe oryzae interaction. Plant Omics 7:540-548.
Li J, Zhao-Hui C, Batoux M, Nekrasov V, Roux M, Chinchilla D, Zipfel C, Jones JD (2009) Specific ER quality control components
required for biogenesis of the plant innate immune receptor EFR. Proc Natl Acad Sci USA 106:15973-15978.
Liu JX, Howell SH (2010) Endoplasmic reticulum protein quality control and its relationship to environmental stress responses in plants.
Plant Cell 22:2930-2942.
Liu JJ, Sturrock R, Ekramoddoullah AKM (2010) The superfamily of thaumatin-like proteins: its origin, evolution, and expression towards
biological function. Plant Cell Rep 29:419-436.
Livak KJ, Schmittgen TD (2001) Analysis of Relative Gene Expression Data Using Real-Time Quantitative PCR and the 2-∆∆CT Method.
Methods 25:402-408.
Lorenzo O, Piqueras R, Sánchez-Serrano JJ, Solano R (2003) ETHYLENE RESPONSE FACTOR1 integrates signals from ethylene and
jasmonate pathways in plant defense. Plant Cell 15:165-178.
Mai WF, Abawi GS (1981) Controlling replant disease of stone fruits in northeastern United States by preplant fumigation. Plant Dis 65:859-
864.
Manici LM, Kelderer M, Franke-Whittle IH, Rühmer T, Baab G, Nicoletti F, Caputo F, Topp A, Insam H, Naef A (2013) Relationship
between root-endophytic microbial communities and replant disease in specialized apple growing areas in Europe. Applied Soil
Ecol 72:207-214.
Mazzola M (1997) Identification and pathogenicity of Rhizoctonia spp. isolated from apple roots and orchard soils. Phytopathology 87:582-
587.
Mazzola M (1998) Elucidation of the microbial complex having a causal role in the development of apple replant disease in Washington.
Phytopathology 88:930-938.
Mazzola M, Hewavitharana SS, Strauss SL (2015) Brassica Seed Meal Soil Amendments Transform the Rhizosphere Microbiome and
Improve Apple Production Through Resistance to Pathogen Reinfestation. Phytopathology 105:460-469.
Mazzola M, Manici LM (2012) Apple Replant Disease: Role of Microbial Ecology in Cause and Control. Annu Rev Phytopathol 50:45-65.
McNamara NP, Black HIJ, Beresford NA, Parekh NR (2003) Effect of acute gamma irradiation on chemical, physical and biological
properties of soils. Applied Soil Ecol 24:117-132.
Müller S, Rycak L, Afonso-Grunz F et al. (2014) APADB: a database for alternative polyadenylation and microRNA regulation events.
Database 2014:1-11.
Nekrasov V, Li J, Batoux M et al. (2009) Control of the pattern-recognition receptor EFR by an ER protein complex in plant immunity.
EMBO J 28:3428-3438.
Nuruzzaman M, Sharoni AM, Kikuchi S (2013) Roles of NAC transcription factors in the regulation of biotic and abiotic stress responses in
plants. Frontiers Microbiol 4:248.
Park CJ, Seo YS (2015) Heat Shock Proteins: A Review of the Molecular Chaperones for Plant Immunity. Plant Pathol J 31:323-333.
Pearson K (1895) Notes on regression and inheritance in the case of two parents. P Roy Soc A-Math Phy 58:240-242.
Perini P, Pasquali G, Margis-Pinheiro M, Dias de Oliviera PR, Revers LF (2014) Reference genes for transcriptional analysis of flowering
and fruit ripening stages in apple (Malus x domestica Borkh.). Mol Breeding 34:829-842.
Porter I, Pizano M, Besri M, Mattner SW, Fraser P (2010) Progress in the global phase out of methyl bromide and the relative effectiveness
of soil disinfestation strategies. Acta Hortic 883:59-66.
Pré M, Atallah M, Champion A, de Vos M, Pieterse CM et al (2008) The AP2/ERF domain transcription factor ORA59 integrates jasmonic
acid and ethylene signals in plant defense. Plant Physiol 147:1347-1357.
Punja ZK, Zhang YY (1993) Plant Chitinases and Their Roles in Resistance to Fungal Diseases. J Nematol 25:526-540.
R Development Core Team (2008) R: A language and environment for statistical computing. R Foundation for Statistical Computing,
Vienna, Austria. ISBN 3-900051-07-0, URL https://www.r-project.org.

30
Rogers EE, Glazebrook J, Ausubel M (1996) Mode of action of the Arabidopsis thaliana phytoalexin camalexin and its role in Arabidopsis-
pathogen interactions. Mol Plant Microbe In 9:748-757.
Ruduś I, Sasiak M, Kępczyński J (2013) Regulation of ethylene biosynthesis at the level of 1-aminocyclopropane-1-carboxylate oxidase
(ACO) gene. Acta Physiol Plant 35:295-307.
Sato M, Tsuda K, Wang L, Coller J, Watanabe Y, Glazebrook J, Katagiri F (2010) Network modeling reveals prevalent negative regulatory
relationships between signaling sectors in Arabidopsis immune signaling. Plos Pathog 6:e1001011.
Savory BM (1966) Studies on the occurrence and etiology of specific replant diseases of perennial fruit crops. Dissertation, University of
London.
Sellam A, Iacomi-Vasilescu B, Hudhomme P, Simoneau P (2007) In vitro antifungal activity of brassinin, camalexin and two isothiocyanates
against the crucifer pathogens Alternaria brassicicola and Alternaria brassicae. Plant Pathol 56:296-301.
Shin S, Lv J, Fazio G, Mazzola M, Zhu Y (2014) Transcriptional regulation of ethylene and jasmonate mediated defense response in apple
(Malus domestica) root during Pythium ultimum infection. Horticulture Research 1:14053.
Shin S, Zheng P, Fazio G, Mazzola M, Main D, Zhu Y (2016) Transcriptome changes specifically associated with apple (Malus domestica)
root defense response during Pythium ultimum infection. Physiol Mol Plant P 94:16-26.
Shlezinger N, Minz A, Gur Y, Hatam I, Dagdas YF, Talbot NJ, Sharon A (2011) Anti-apoptotic machinery protects the necrotrophic fungus
Botrytis cinerea from host-induced apoptotic-like cell death during plant infection, Plos Pathog 7:e1002185.
Sircar D, Gaid MM, Chizzali C et al. (2015) Biphenyl 4-Hydroxylases Involved in Aucuparin Biosynthesis in Rowan and Apple Are
Cytochrome P450 736A Proteins. Plant Physiol 168:428-442.
Sitia R, Braakman I (2003) Quality control in the endoplasmic reticulum protein factory. Nature 426:891-894.
Slykhuis JT, Li TSC (1985) Response of apple seedlings to biocides and phosphate fertilizers in orchard soils in British Columbia. Can J
Plant Pathol 7:294-301.
Solano R, Stepanova A, Chao Q, Ecker JR (1998) Nuclear events in ethylene signaling: a transcriptional cascade mediated by ETHYLENE-
INSENSITIVE3 and ETHYLENERESPONSE- FACTOR1. Gene Dev 12:3703-3714.
St. Laurent A, Merwin IA, Fazio G, Thies JE, Brown MG (2010) Rootstock genotype succession influences apple replant disease and root-
zone microbial community composition in an orchard soil. Plant Soil 337:259-272.
Sutton TB, Hayne DW, Sullivan WT, Nardacci JR, Klimstra DE (1981) Causes of apple tree death in Henderson County, North Carolina.
Plant Dis 65:330-332.
Tewoldemedhin YT, Mazzola M, Botha WJ, Spies CFJ, McLeod A (2011a) Characterization of fungi (Fusarium and Rhizoctonia) and
oomycetes (Phytophthora and Pythium) associated with apple orchards in South Africa. Eur J Plant Pathol 130:215-229.
Tewoldemedhin YT, Mazzola M, Mostert L, McLeod A (2011b) Cylindrocarpon species associated with apple tree roots in South Africa and
their quantification using real-time PCR. Eur J Plant Pathol 129:637-651.
Thimm O, Bläsing OE, Gibon Y, Nagel A, Meyer S, Krüger P, Selbig J, Müller LA, Rhee SY, Stitt M (2004) MAPMAN: a user-driven tool
to display genomics datasets onto diagrams of metabolic pathways and other biological processes. Plant J 37:914-939.
Tsuda K, Katagiri F (2010) Comparing signaling mechanisms engaged in pattern-triggered and effector immunity. Curr Opin Plant Biol
13:459-465.
Ul Hassan MN, Zainal Z, Ismail I (2015) Plant kelch containing F-box proteins: structure, evolution and functions. RSC Adv 5:42808.
Vandesompele J, De Preter K, Pattyn F, Poppe B, Van Roy N, De Paepe A, Speleman F (2002) Accurate normalization of real-time
quantitative RT-PCR data by geometric averaging of multiple internal control genes. Genome Biol 3:research0034.1-0034.11.
Velasco R, Zharkikh A, Affourtit J et al (2010) The genome of the domesticated apple (Malus × domestica Borkh.). Nat Genet 42:833-841.
Velazhahan R, Datta SK, Muthukrishnan S (1999) The PR-5 family: thaumatin-like proteins in plants. In: Datta SK, Muthukrishnan S (eds)
Pathogenesis-related proteins in plants. CRC Press, Boca Raton, pp 107-129.
Vermerris W, Nicholson R (2008) The Role of Phenols in Plant Defense. In: Vermerris W, Nicholson R (eds) Phenolic Compound
Biochemistry. Springer, Heidelberg, pp 211-234.
Welch BL (1947) The generalization of ‘Student’s’ problem when several different population variances are involved. Biometrika 34:28-35.
Whitley D, Goldberg SP, Jordan WD (1999) Heat shock proteins: a review of the molecular chaperones. J Vasc Surg 29:748-751.
Yanagisawa S (2002) The Dof family of plant transcription factors. Trends Plant Sci 12:555-560.
Yim B, Hanschen FS, Wrede A, Nitt H, Schreiner M, Smalla K, Winkelmann T (2016) Effects of biofumigation using Brassica juncea and
Raphanus sativus in comparison to disinfection using Basamid on apple plant growth and soil microbial communities at three
field sites with replant disease. Plant Soil 406:389-408.
Yim B, Smalla K, Winkelmann T (2013) Evaluation of apple replant problems based on different soil disinfection treatments—links to soil
microbial community structure? Plant Soil 366:617-631.
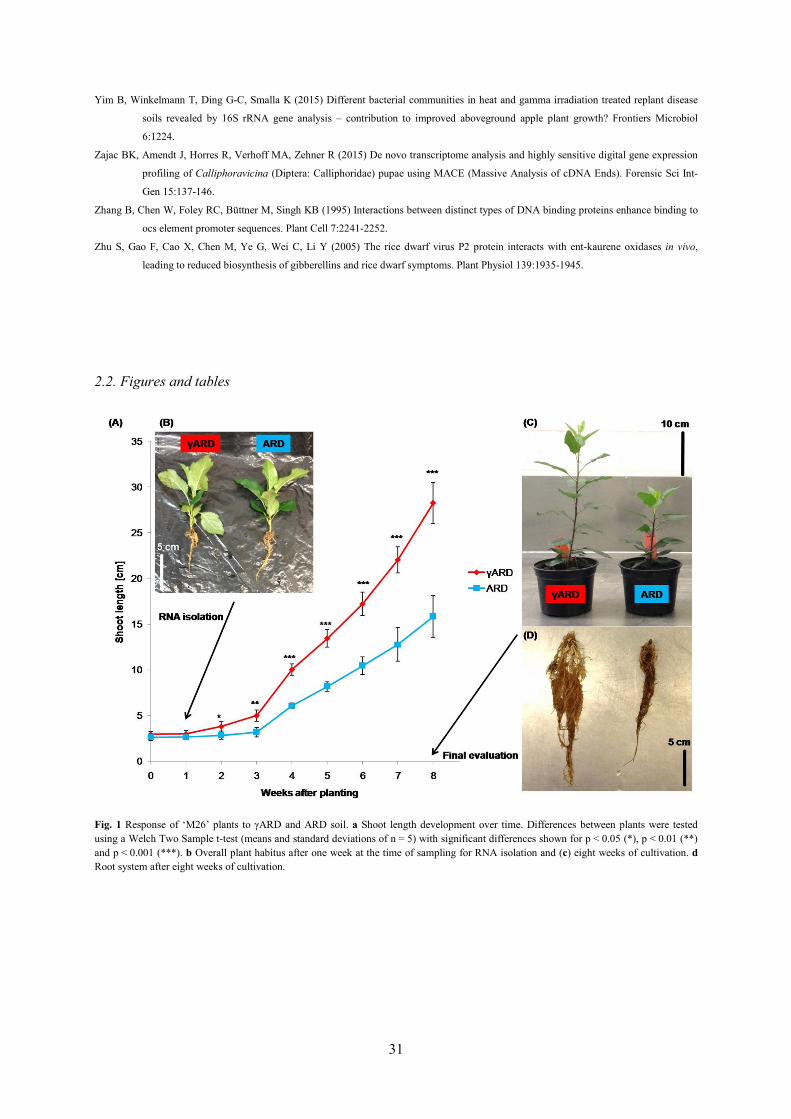
31
Yim B, Winkelmann T, Ding G-C, Smalla K (2015) Different bacterial communities in heat and gamma irradiation treated replant disease
soils revealed by 16S rRNA gene analysis – contribution to improved aboveground apple plant growth? Frontiers Microbiol
6:1224.
Zajac BK, Amendt J, Horres R, Verhoff MA, Zehner R (2015) De novo transcriptome analysis and highly sensitive digital gene expression
profiling of Calliphoravicina (Diptera: Calliphoridae) pupae using MACE (Massive Analysis of cDNA Ends). Forensic Sci Int-
Gen 15:137-146.
Zhang B, Chen W, Foley RC, Büttner M, Singh KB (1995) Interactions between distinct types of DNA binding proteins enhance binding to
ocs element promoter sequences. Plant Cell 7:2241-2252.
Zhu S, Gao F, Cao X, Chen M, Ye G, Wei C, Li Y (2005) The rice dwarf virus P2 protein interacts with ent-kaurene oxidases in vivo,
leading to reduced biosynthesis of gibberellins and rice dwarf symptoms. Plant Physiol 139:1935-1945.
2.2. Figures and tables
Fig. 1 Response of ‘M26’ plants to γARD and ARD soil. a Shoot length development over time. Differences between plants were tested
using a Welch Two Sample t-test (means and standard deviations of n = 5) with significant differences shown for p < 0.05 (*), p < 0.01 (**)
and p < 0.001 (***). b Overall plant habitus after one week at the time of sampling for RNA isolation and (c) eight weeks of cultivation. d
Root system after eight weeks of cultivation.

32
Fig. 2 Distribution of differentially expressed and unique genes with a FDR corrected p < 0.05 in γARD (red color) and ARD (blue color)
samples according to MapMan functional categories.

33
Tab
le 1
Pri
mer
seq
uen
ces
for
gen
es a
nal
yze
d b
y R
T-q
PC
R.*
Gen
e n
am
e (
MD
P I
D)
Ab
brevia
tio
n
Prim
er s
eq
uen
ce
(5’
- 3
’)
Frag
men
t le
ng
th [
bp
] A
mp
lifi
cati
on
eff
icie
ncy
[%
]
Co
effi
cien
t of
dete
rm
ina
tio
n R
²
acti
n (
MD
P0
000
921
834
) A
CT
f:
TA
CC
AT
GT
TC
CC
TG
GC
AT
TG
r: A
CC
TG
CT
GG
AA
AG
TG
CT
AA
G
156
92.7
0
.995
acti
n-7
(M
DP
000
07
742
88
) A
CT
7
f: T
GA
GT
CA
CA
CT
GT
GC
CA
AT
C
r: T
TT
CC
CG
TT
CA
GC
AG
TA
GT
G
147
93.3
0
.999
elon
gat
ion
fac
tor
1-a
lpha
(MD
P00
0030
414
0)
EF
1a
f: G
AA
CG
GA
GA
TG
CT
GG
TA
TG
G
r: C
CA
GT
TG
GC
TC
CT
TC
TT
CT
C
159
103
.0
0.9
98
elon
gat
ion
fac
tor
1-b
eta
2-l
ike
(MD
P0
000
903
484
) E
F1b
f: G
AG
AG
TG
GG
AA
AT
CC
TC
TG
r: A
CC
AA
CA
GC
AA
CC
AA
TT
TC
138
100
.6
0.9
98
gly
cera
ldeh
yd
e-3
-ph
osp
hat
e d
ehyd
rogen
ase
(MD
P00
006
458
28
) G
AP
DH
f:
TG
AG
AA
GG
CT
GC
AA
CC
TA
TG
r: G
AC
TC
CT
CC
CT
GT
TC
AT
GA
C
176
90.3
0
.998
ribu
lose
bis
ph
osp
hat
e ca
rboxyla
se/o
xygen
ase
acti
vas
e (M
DP
000
032
124
4)
RC
A
f: G
TG
AC
GG
TC
GT
AT
GG
AG
AA
G
r: C
CT
GG
GA
AG
GT
GT
CA
AC
AA
G
130
99.0
0
.997
tub
uli
n a
lph
a-2 c
hai
n (
MD
P0
000
832
10
5)
TU
BA
f:
AG
GA
AG
AC
GC
CG
CT
AA
TA
AC
r: C
AA
AC
GG
GA
AT
CA
AC
GG
AA
AG
121
105
.1
0.9
97
tub
uli
n b
eta
chai
n (
MD
P0
000
951
799
) T
UB
B
f: T
TC
TC
TG
GG
AG
GA
GG
TA
CT
G
r: G
TC
GC
AT
TG
TA
AG
GC
TC
AA
C
147
96.9
0
.997
ubiq
uit
in-c
on
jugat
ing e
nzy
me
E2
10
-lik
e (M
DP
0000
140
755
) U
BE
21
0
f: T
GC
CC
TC
GT
GT
AC
TG
AT
TT
G
r: G
CA
GA
TG
AT
GA
CG
GT
GT
TT
G
105
94.0
0
.998
17.1
kD
a cl
ass
II h
eat
shock
pro
tein
-lik
e (M
DP
000
070
038
3)
HS
P17
.1
f: C
GC
CG
AG
AA
GT
CA
TT
CA
AC
r: C
AC
GA
AC
AC
GT
AG
GA
GT
TA
G
109
92.8
0
.999
17.3
kD
a cl
ass
II h
eat
shock
pro
tein
-lik
e (M
DP
000
054
806
5)
HS
P17
.3
f: G
AC
AT
GC
CG
GG
AC
TG
AA
G
r: C
AT
TC
TC
CG
GC
AA
CA
CA
AA
C
169
94.7
0
.998
18.5
kD
a cl
ass
I h
eat
shock
pro
tein
-lik
e (M
DP
000
075
966
6)
HS
P18
.5
f: G
CT
TA
AG
AT
CA
GC
GG
AG
AG
r: C
TT
CG
GA
AC
AG
TG
AC
AC
TT
AG
175
98.2
0
.997
acid
ic e
nd
och
itin
ase-
lik
e (M
DP
0000
21
869
1)
CH
IA
f: C
TG
AG
TG
CT
GA
CA
TC
AG
AA
C
r: G
AC
TG
AC
CA
CC
TA
AG
AA
GT
TG
149
99.5
0
.999
bip
hen
yl
syn
thas
e 2 (
MD
P0
000
716
308
) B
IS2
f: C
TT
GT
GG
TT
TG
CG
CA
GA
G
r: G
TC
TG
CA
TG
CC
AC
GA
TT
TC
172
96.8
0
.997
bip
hen
yl
syn
thas
e 3 (
MD
P0
000
287
919
) B
IS3
f: G
GC
AA
GA
AG
CA
GC
AT
TG
AA
AG
r: C
AC
AA
CC
TG
GC
AT
GT
CA
AC
105
95.3
0
.998
bip
hen
yl
syn
thas
e 4 (
MD
P0
000
302
905
) B
IS4
f: C
AA
CA
AG
CA
GC
AC
TG
AA
AG
C
r: G
AT
GG
GT
TA
AG
GC
CA
AG
GA
G
140
102
.0
1.0
00
caff
eic
acid
3-O
-met
hylt
ran
sfer
ase-
lik
e (M
DP
0000
456
277
) O
MT
1a
f: C
AG
GC
GT
CA
GG
TG
AA
AG
AT
G
r: G
GG
TG
CT
AT
GG
TT
GA
AC
AT
TG
140
95.9
0
.999
caff
eic
acid
3-O
-met
hylt
ran
sfer
ase-
lik
e (M
DP
0000
745
475
) O
MT
1b
f: C
AT
CT
GA
GA
TC
GC
AG
CT
CA
C
r: G
TA
GA
GC
CT
CC
GG
AA
AC
AC
146
99.7
1
.000
cyto
chro
me
P4
50
CY
P73
6A
12
-lik
e (M
DP
00
002
053
06
) B
4H
a
f: G
AT
GT
GC
AC
GC
TC
GA
AT
TA
C
r: A
TT
GG
CG
TC
CT
CT
TG
AA
CA
G
106
99.1
0
.999

34
Gen
e n
am
e (
MD
P I
D)
Ab
brevia
tio
n
Prim
er s
eq
uen
ce
(5’
- 3
’)
Frag
men
t le
ng
th [
bp
] A
mp
lifi
cati
on
eff
icie
ncy
[%
]
Co
effi
cien
t of
dete
rm
ina
tio
n R
²
cyto
chro
me
P4
50
CY
P73
6A
12
-lik
e (M
DP
00
001
529
00
) B
4H
b
f: G
CT
GA
GT
AT
GG
CC
CG
TA
TT
G
r: A
GG
AA
CC
CG
TC
GA
TT
AT
TG
G
156
100
.0
0.9
99
dof
zin
c fi
nger
pro
tein
DO
F3
.5-l
ike
(MD
P00
003
088
63
) D
OF
3.5
f:
CT
TT
CA
GC
AT
CA
CA
AC
TC
AT
C
r: G
CA
AA
CA
CA
AC
AG
CC
AA
AT
C
105
98.7
1
.000
eth
yle
ne-
resp
on
sive
tran
scri
pti
on f
acto
r 1
B-l
ike
(MD
P00
001
271
34
) E
RF
1B
f:
GT
CA
CC
TG
AA
TC
TT
CG
TT
TG
r: G
GA
AA
TC
AG
AC
CG
TA
GA
GA
AG
121
99.7
0
.997
eth
yle
ne-
resp
on
sive
tran
scri
pti
on f
acto
r R
AP
2-1
1-l
ike
(MD
P00
001
775
47
) E
RF
RA
P2
.11
f: T
TC
CA
AC
AG
CC
GA
AG
CA
AG
r: C
TT
TG
AT
CT
CA
GC
AA
CC
CA
TC
TC
169
96.4
0
.997
F-b
ox/k
elch
-rep
eat
pro
tein
(M
DP
0000
708
634
) K
FB
f:
GA
CC
TT
GC
CC
AC
AA
TC
CT
C
r: G
GT
GG
GT
GT
AA
AG
GC
TG
AA
G
145
96.5
1
.000
GA
TA
zin
c fi
nger
dom
ain
-conta
inin
g p
rote
in 1
0-l
ike
(MD
P000
092
282
3)
GA
TA
D10
f: G
CT
CG
TT
TC
TG
GA
GG
AG
TC
r: G
AT
TC
CC
GC
TG
TC
GT
AG
AA
TC
153
99.6
0
.998
gib
ber
elli
n-r
egu
late
d p
rote
in 1
-lik
e (M
DP
00
001
400
78
) G
AS
A1
f: C
GT
TG
CA
GC
TG
TG
TT
CC
TC
r: C
AT
CT
GC
AT
GC
CC
GA
AT
AT
GA
G
156
101
.9
0.9
97
LR
R r
ecep
tor-
lik
e se
rin
e/th
reon
ine-
pro
tein
kin
ase
MR
H1
(M
DP
00
003
027
79
) M
RH
1
f: C
GA
GG
TT
TC
AT
GG
TT
GT
TG
r: C
GC
AG
AA
TG
AC
AA
CA
GA
AT
C
163
100
.1
0.9
98
NA
C t
ran
scri
pti
on
fac
tor
25
-lik
e (M
DP
0000
842
702
) N
AC
25
f: C
GT
TG
CC
AC
AA
CC
AC
TA
C
r: C
TC
CC
AT
GT
CA
TC
TG
AT
AT
TC
199
100
.8
0.9
95
sen
esce
nce
-ass
oci
ated
car
boxyle
ster
ase
101
-lik
e (M
DP
00
008
379
35
) S
AG
101
f: C
GT
AA
AC
TA
GC
GA
TG
CA
GA
AG
r: G
GA
CT
CC
TC
CT
TG
TA
CC
AT
TC
102
102
.1
0.9
99
thau
mat
in-l
ike
pro
tein
1a
(MD
P000
05
523
28
) T
L1
f: A
CG
GC
TT
CA
AC
TT
GC
CT
AT
G
r: G
CC
GC
TT
TC
AC
TT
GA
AG
TT
G
118
92.5
0
.992
zin
c fi
nger
pro
tein
ZA
T1
2 (
MD
P00
005
956
71
) Z
AT
12
f: C
AA
GA
AG
CC
GA
AG
CT
AA
TG
C
r: G
TC
CG
AC
CG
TG
AA
CT
CA
AG
125
99.2
0
.997
*A
ll p
rim
ers
(f:
forw
ard
, r:
rev
erse
) w
ere
eval
uat
ed i
n a
n a
mp
lifi
cati
on e
ffic
ien
cy t
est
at a
n a
nn
eali
ng t
emp
erat
ure
of
60 °
C.
Gre
y-s
had
ed g
enes
wer
e ex
amin
ed a
s p
ote
nti
al r
efer
ence
gen
es.
Tab
le 2
Seq
uen
cing r
esult
s of
the
MA
CE
anal
ysi
s fo
r b
oth
pools
of
γAR
D a
nd A
RD
sam
ple
s.*
Sa
mp
le
Nu
mb
er o
f raw
rea
ds
Averag
e l
en
gth
befo
re t
rim
min
g [
bp
] R
ea
ds
aft
er
trim
min
g
Averag
e l
en
gth
aft
er t
rim
min
g [
bp
]
No
n-s
peci
fica
lly m
ap
ped
rea
ds
[nu
mb
er | %
trim
med
rea
ds]
Un
iqu
e m
ap
ped
rea
ds
[nu
mb
er | %
trim
med
rea
ds]
γAR
D 1
1
2,3
43
,547
92.2
1
2,3
38
,086
87.6
2
66
,10
8
[2.1
6]
3,9
19
,21
4
[31
.77]
γAR
D 2
1
7,0
45
,051
92.0
1
7,0
34
,304
86.2
4
28
,16
5
[2.5
1]
5,2
14
,00
9
[30
.61]
AR
D 1
2
1,6
76
,247
92.4
2
1,6
68
,842
87.4
4
39
,67
2
[2.0
3]
6,8
67
,55
2
[31
.69]
AR
D 2
1
6,8
47
,113
92.4
1
6,8
40
,977
87.9
3
38
,23
4
[2.0
1]
5,3
29
,11
5
[31
.64]
*S
equ
ence
s w
ere
trim
med
em
plo
yin
g p
oly
-A a
dap
ter
seq
uen
ces
usi
ng C
LC
Gen
om
ics
Work
ben
ch 8
. T
rim
med
seq
uen
ces
wer
e m
app
ed t
o t
he
pre
dic
ted
tra
nsc
rip
tom
e of
Malu
s d
om
esti
ca.
Rea
ds
map
ped
to m
ore
than
on
e se
qu
ence
(n
on
-sp
ecif
ical
ly m
app
ed r
ead
s) w
ere
not
incl
ud
ed i
n f
urt
her
an
alyse
s.

35
Tab
le 3
Lis
t of
gen
es w
ith a
FD
R c
orr
ecte
d p
< 0
.05 a
nd a
t le
ast
3-f
old
reg
ula
tion o
r w
hic
h w
ere
found o
nly
in e
ither
γA
RD
or
AR
D s
amp
les.
*
Ma
pM
an
fu
ncti
on
al
cate
go
ry
MD
P I
D
Na
me
No
rm
ali
zed
tra
nsc
rip
t
ab
un
da
nce
γA
RD
± S
D
No
rm
ali
zed
tra
nsc
rip
t
ab
un
da
nce
AR
D ±
SD
Ra
tio (
AR
D/γ
AR
D)
Bio
deg
radat
ion
of
Xen
obio
tics
M
DP
00
002
679
76
gly
oxal
oxid
ase-
rela
ted
2
1.6
5 ±
5.4
1
6.9
7 ±
1.8
9
-3.1
1
Cel
l M
DP
00
001
580
89
pro
tein
bin
din
g /
str
uct
ura
l m
ole
cule
0
.22 ±
0.1
5
0.8
3 ±
0.3
3
3.7
8
Cel
l w
all
MD
P00
002
203
29
AD
PG
1;
poly
gal
actu
ron
ase
0.2
2 ±
0.1
9
0.0
5 ±
0.0
7
-4.6
9
Cel
l w
all
MD
P00
001
897
08
ph
yto
chel
atin
syn
thet
ase-
lik
e 0
.67 ±
0.1
4
0.1
7 ±
0.0
8
-3.8
1
Dev
elop
men
t M
DP
00
002
222
17
tran
sdu
cin f
amil
y p
rote
in
0.1
3 ±
0.0
7
0.0
2 ±
0.0
3
-5.5
7
Develo
pm
en
t M
DP
00
008
379
35
sen
esc
en
ce-a
sso
cia
ted
ca
rb
oxyle
ster
ase
10
1-l
ike
0.1
± 0
.03
0.3
6 ±
0.0
1
3.6
6
Develo
pm
en
t M
DP
00
008
427
02
NA
C t
ra
nsc
rip
tio
n f
acto
r 2
5-l
ike
0.1
6 ±
0.1
1
0.8
8 ±
0.0
1
5.6
0
Dev
elop
men
t M
DP
00
002
585
30
AT
AF
1;
tran
scri
pti
on a
ctiv
ator/
tra
nsc
ripti
on
fac
tor
0.0
3 ±
0.0
4
0.2
1 ±
0.0
4
7.1
9
Dev
elop
men
t M
DP
00
002
096
65
tran
sdu
cin f
amil
y p
rote
in
0.0
3 ±
0.0
4
0.2
5 ±
0.1
8
.54
DN
A
MD
P00
003
154
04
his
ton
e H
3.2
0
.26 ±
0.2
0
.83 ±
0.2
6
3.1
7
Fer
men
tati
on
MD
P00
003
748
85
AL
DH
2B
7;
3-c
hlo
roal
lyl
ald
ehyd
e d
ehyd
rogen
ase
1.2
3 ±
0.3
3
0.3
8 ±
0.2
1
-3.2
1
Horm
on
e m
etab
oli
sm
MD
P00
002
298
43
leu
coan
thocy
anid
in d
ioxyg
enas
e-li
ke
2
.38 ±
1.2
1
7.5
4 ±
1.0
9
3.1
6
Ho
rm
on
e m
eta
bo
lism
M
DP
00
001
271
34
eth
yle
ne-r
esp
on
sive t
ran
scrip
tio
n f
acto
r 1B
-lik
e
0.2
± 0
.05
1.1
2 ±
0.0
1
5.6
3
Lip
id m
etab
oli
sm
MD
P00
008
276
65
gly
cero
ph
osp
hod
iest
er p
hosp
hodie
ster
ase
GD
E1
-lik
e 0
.28 ±
0.0
6
0 ±
0
on
ly γ
AR
D
Mis
cell
aneo
us
MD
P00
006
162
65
TT
7 (
TR
AN
SP
AR
EN
T T
ES
TA
7)
0.1
3 ±
0.0
7
0 ±
0
on
ly γ
AR
D
Mis
cell
aneo
us
MD
P00
001
191
48
CY
P86
B1
; el
ectr
on
car
rier
0
.58 ±
0.0
1
0.1
3 ±
0.0
1
-4.4
9
Mis
cell
aneo
us
MD
P00
002
142
50
seco
isola
rici
resi
nol
deh
yd
rogen
ase-
lik
e 0
.57 ±
0.1
1
0.1
3 ±
0.0
1
-4.4
0
Mis
cell
aneo
us
MD
P00
002
659
42
14 k
Da
pro
lin
e-ri
ch p
rote
in D
C2
.15
-lik
e 1
.14 ±
0.1
1
0.2
9 ±
0.0
9
-3.8
7
Mis
cell
aneo
us
MD
P00
001
798
08
GD
SL
-moti
f li
pas
e/h
yd
rola
se f
amil
y p
rote
in
5.9
9 ±
0.2
5
1.6
3 ±
0.7
-3
.68
Mis
cell
aneo
us
MD
P00
006
244
44
dih
yd
rofl
avon
ol
4-r
edu
ctas
e fa
mil
y
1.2
6 ±
0.2
9
0.3
8 ±
0.1
4
-3.3
5
Mis
cell
aneo
us
MD
P00
001
633
87
GD
SL
-moti
f li
pas
e/h
yd
rola
se f
amil
y p
rote
in
0.9
2 ±
0.3
0
.3 ±
0.1
6
-3.0
6
Mis
cell
aneo
us
MD
P00
002
248
78
caff
eic
acid
3-O
-met
hylt
ran
sfer
ase
1-l
ike
0.8
1 ±
0.1
1
2.6
5 ±
0.8
7
3.2
9
Mis
cell
aneo
us
MD
P00
005
140
27
per
oxid
ase
5-l
ike
0.7
1 ±
0.0
8
2.9
± 0
.51
4.1
1
Mis
cell
aneo
us
MD
P00
009
267
93
2-m
eth
yle
ne-
fura
n-3
-on
e re
du
ctas
e-li
ke
0.7
± 0
.16
3 ±
0.4
6
4.2
9
Mis
cel
lan
eou
s M
DP
00
001
529
00
cy
toch
rom
e P
45
0 C
YP
736
A12
-lik
e
0.5
9 ±
0.4
2
3.2
3 ±
0.6
5
5.4
4
Mis
cell
aneo
us
MD
P00
001
271
22
blu
e co
pp
er p
rote
in p
recu
rsor
0.0
6 ±
0.0
8
0.5
1 ±
0.2
8
.71
Not
assi
gn
ed
MD
P00
003
631
76
acti
n-d
epoly
mer
izin
g f
acto
r 1
-lik
e 0
.07 ±
0.0
2
0 ±
0
on
ly γ
AR
D
Not
assi
gn
ed
MD
P00
003
257
81
chlo
rop
last
en
vel
op
e m
emb
ran
e 70
kD
a h
eat
shock
-rel
ated
pro
tein
-lik
e 0
.31 ±
0.0
2
0 ±
0
on
ly γ
AR
D
Not
assi
gn
ed
MD
P00
007
296
69
mag
nes
ium
tra
nsp
ort
er N
IPA
2-l
ike
1.9
6 ±
0.1
3
0.2
5 ±
0.1
-7
.82
Not
assi
gn
ed
MD
P00
002
353
35
seri
ne/
argin
ine-
rich
sp
lici
ng f
acto
r R
SZ
21
-lik
e 0
.47 ±
0.2
5
0.0
8 ±
0.0
2
-6.2
1
Not
assi
gn
ed
MD
P00
003
663
99
RN
A-b
ind
ing p
rote
in 2
4-A
-lik
e 1
.68 ±
0.5
4
0.3
2 ±
0.1
3
-5.1
8
Not
assi
gn
ed
MD
P00
009
511
90
pro
tein
DU
F6
07
1
.19 ±
0.2
7
0.2
8 ±
0.0
6
-4.2
4
Not
assi
gn
ed
MD
P00
002
345
79
QW
RF
moti
f-co
nta
inin
g p
rote
in 7
-lik
e 1
.26 ±
0.0
5
0.3
2 ±
0.0
6
-4.0
0
Not
assi
gn
ed
MD
P00
001
359
53
1-a
min
ocy
clop
rop
ane-
1-c
arb
oxyla
te s
yn
thas
e (A
CS
1)
0.6
8 ±
0.3
0
.2 ±
0.1
1
-3.4
4
Not
assi
gn
ed
MD
P00
001
473
58
absc
isic
aci
d r
ecep
tor
PY
L2
1
.35 ±
0.5
0
.39 ±
0.0
3
-3.4
4
Not
assi
gn
ed
MD
P00
005
697
55
alco
hol
acyl
tran
sfer
ase
(AA
T)
12.7
4 ±
3.0
7
3.7
1 ±
0.0
4
-3.4
3
No
t a
ssig
ned
M
DP
00
001
400
78
gib
ber
elli
n-r
egu
late
d p
ro
tein
1-l
ike
36.8
5 ±
7.7
5
10.8
8 ±
0.9
4
-3.3
9
Not
assi
gn
ed
MD
P00
002
392
64
ubiq
uit
in t
hio
lest
eras
e 1
.85 ±
1.0
5
0.6
± 0
-3
.11

36
Ma
pM
an
fu
ncti
on
al
cate
go
ry
MD
P I
D
Na
me
No
rm
ali
zed
tra
nsc
rip
t
ab
un
da
nce
γA
RD
± S
D
No
rm
ali
zed
tra
nsc
rip
t
ab
un
da
nce
AR
D ±
SD
Ra
tio (
AR
D/γ
AR
D)
Not
assi
gn
ed
MD
P00
007
232
86
erin
e/th
reon
ine-
pro
tein
kin
ase
kin
X
2.5
8 ±
0.2
5
0.8
4 ±
0.0
8
-3.0
8
Not
assi
gn
ed
MD
P00
001
646
83
tran
scri
pti
on
fac
tor
SP
AT
UL
A-l
ike
0.2
4 ±
0.0
1
0.7
6 ±
0.1
3
.19
Not
assi
gn
ed
MD
P00
001
943
36
UB
P13
(U
BIQ
UIT
IN-S
PE
CIF
IC P
RO
TE
AS
E 1
3)
1.3
2 ±
0.2
4
.33 ±
0.7
7
3.2
9
Not
assi
gn
ed
MD
P00
009
025
81
OX
S3
(O
XID
AT
IVE
ST
RE
SS
3)
0.3
2 ±
0.1
2
1.4
± 0
.3
4.3
8
No
t a
ssig
ned
M
DP
00
009
228
23
GA
TA
zin
c f
inger d
om
ain
-co
nta
inin
g p
rote
in 1
0-l
ike
0.2
3 ±
0.0
9
1.0
5 ±
0.3
7
4.5
9
Not
assi
gn
ed
MD
P00
008
842
39
PH
D f
inger
-lik
e d
om
ain
-conta
inin
g p
rote
in 5
A
0.1
9 ±
0.1
5
1 ±
0.1
8
5.3
5
Not
assi
gn
ed
MD
P00
002
956
06
Ag
glu
tin
in
0.1
1 ±
0.0
7
0.6
± 0
.07
5.4
7
Not
assi
gn
ed
MD
P00
007
724
51
Ag
glu
tin
in
0.1
± 0
.03
0.7
2 ±
0.0
9
7.2
4
Ph
oto
syn
thes
is
MD
P00
007
641
47
PP
L1
(P
sbP
-lik
e p
rote
in 1
) 0
.37 ±
0.0
6
0.0
5 ±
0.0
1
-6.9
7
Ph
oto
syn
thes
is
MD
P00
006
131
70
gly
cin
e cl
eavag
e sy
stem
H p
rote
in
2.0
6 ±
0.1
6
0.5
9 ±
0.2
5
-3.4
7
Pro
tein
M
DP
00
004
784
64
ME
E49
(m
ater
nal
eff
ect
emb
ryo a
rres
t 49
) 0
.18 ±
0.0
9
0 ±
0
on
ly γ
AR
D
Pro
tein
M
DP
00
007
850
92
AT
P-d
epen
den
t C
lp p
rote
ase
pro
teoly
tic
subu
nit
1
7.8
1 ±
5.4
2
1.0
8 ±
0.3
6
-16
.41
Pro
tein
M
DP
00
009
129
00
seri
ne
carb
oxyp
epti
das
e S
28 f
amil
y p
rote
in
0.4
7 ±
0.0
9
0.0
3 ±
0.0
4
-15
.72
Pro
tein
M
DP
00
003
027
79
LR
R r
ecep
tor-l
ike s
erin
e/th
reo
nin
e-p
ro
tein
kin
ase
MR
H1
1.6
4 ±
0.2
6
0.2
1 ±
0.2
2
-7.6
5
Pro
tein
M
DP
00
002
910
76
60
S r
iboso
mal
pro
tein
L1
9 (
RP
L1
9B
) 0
.72 ±
0.0
2
2.6
7 ±
0
3.7
3
Pro
tein
M
DP
00
002
645
32
met
allo
end
op
rote
inas
e 1
-lik
e 0
.07 ±
0.0
2
0.4
5 ±
0.0
4
6.3
7
Pro
tein
M
DP
00
000
530
83
60
s ac
idic
rib
oso
mal
pro
tein
P1
0.0
7 ±
0.0
2
0.6
± 0
8
.54
Pro
tein
M
DP
00
007
086
34
F-b
ox/k
elc
h-r
ep
eat
pro
tein
0
.21 ±
0.0
5
1.8
9 ±
0.0
7
9.0
1
Pro
tein
M
DP
00
002
078
38
MM
P (
MA
TR
IX M
ET
AL
LO
PR
OT
EIN
AS
E)
0 ±
0
0.3
± 0
.16
on
ly A
RD
Red
ox r
eact
ion
s M
DP
00
005
798
40
glu
tare
doxin
fam
ily p
rote
in
4.9
± 0
.87
1.5
8 ±
0.2
8
-3.0
9
RN
A
MD
P00
001
775
47
eth
yle
ne-r
esp
on
sive t
ran
scrip
tio
n f
acto
r R
AP
2-1
1-l
ike
2.6
8 ±
0.1
2
0.0
8 ±
0.0
2
-35
.29
RN
A
MD
P00
002
288
98
S-a
cylt
ran
sfer
ase
1
0.7
2 ±
0.0
2
0.1
6 ±
0.1
-4
.35
RN
A
MD
P00
005
259
33
eth
yle
ne-
resp
on
sive
tran
scri
pti
on f
acto
r R
AP
2-1
1-l
ike
2.3
± 0
.18
0.6
4 ±
0.1
4
-3.6
2
RN
A
MD
P00
001
424
94
NT
T (
NO
TR
AN
SM
ITT
ING
TR
AC
T)
1.1
± 0
.18
0.3
2 ±
0.0
6
-3.4
8
RN
A
MD
P00
002
160
27
pro
tein
NU
C173
1.5
7 ±
0.2
7
0.4
9 ±
0.2
3
-3.2
2
RN
A
MD
P00
003
193
31
LB
D1
1 (
LO
B D
OM
AIN
-CO
NT
AIN
ING
PR
OT
EIN
11
) 1
.06 ±
0.3
4
0.3
3 ±
0.0
5
-3.1
8
RN
A
MD
P00
001
886
37
ED
M2
; tr
ansc
ripti
on f
acto
r 4
.26 ±
0.6
3
1.3
8 ±
0.2
-3
.07
RN
A
MD
P00
001
625
92
U-b
ox d
om
ain
-con
tain
ing p
rote
in 2
1-l
ike
0.4
9 ±
0.1
1
1.4
7 ±
0.0
7
3.0
1
RN
A
MD
P00
001
538
66
deh
yd
rati
on
-res
pon
sive
elem
ent-
bin
din
g p
rote
in 2
A
1.0
4 ±
0.1
3
.22 ±
1.1
6
3.0
8
RN
A
MD
P00
001
981
16
bH
LH
09
3 (
bet
a H
LH
pro
tein
93
) 0
.44 ±
0.0
5
1.4
5 ±
0.2
9
3.3
2
RN
A
MD
P00
005
956
71
zin
c fi
nger
pro
tein
ZA
T12
0.9
4 ±
0.1
6
3.3
4 ±
0.7
4
3.5
6
RN
A
MD
P00
006
490
22
AP
2 d
om
ain
-conta
inin
g t
ran
scri
pti
on
fac
tor
0.1
2 ±
0.1
7
0.6
7 ±
0.2
3
5.7
0
RN
A
MD
P00
006
943
63
TG
AC
G-s
equ
ence
-sp
ecif
ic D
NA
-bin
din
g p
rote
in T
GA
-1A
0
.03 ±
0.0
4
0.3
6 ±
0.0
1
12.3
6
Sec
on
dar
y m
etab
oli
sm
MD
P00
002
729
76
ph
yto
ene
syn
thas
e (P
SY
) 0
.89 ±
0.3
5
0.1
5 ±
0.0
5
-5.8
7
Seco
nd
ary
meta
boli
sm
MD
P00
002
879
19
bip
hen
yl
syn
tha
se 3
1
4.1
3 ±
6.3
7
64.3
9 ±
18.6
1
4.5
6
Sig
nal
ing
MD
P00
002
160
54
L-t
yp
e le
ctin
-dom
ain c
onta
inin
g r
ecep
tor
kin
ase
S.4
0
.44 ±
0.0
5
0.0
8 ±
0.0
2
-5.7
7
Sig
nal
ing
MD
P00
001
695
30
LR
R r
ecep
tor-
lik
e se
rin
e/th
reon
ine-
pro
tein
kin
ase
0.5
6 ±
0.1
3
0.1
± 0
.06
-5.6
5
Sig
nal
ing
MD
P00
001
557
15
kin
ase
fam
ily p
rote
in
0.8
2 ±
0.0
1
0.2
2 ±
0.1
4
-3.6
9
Sig
nal
ing
MD
P00
002
792
87
LO
X2
(L
IPO
XY
GE
NA
SE
2)
1.5
6 ±
0.0
3
0.4
3 ±
0.1
1
-3.6
2
Sig
nal
ing
MD
P00
002
935
92
FR
S5
(F
AR
1-r
elat
ed s
equ
ence
5)
1.4
5 ±
0.4
4
0.4
3 ±
0.1
1
-3.3
5

37
Ma
pM
an
fu
ncti
on
al
cate
go
ry
MD
P I
D
Na
me
No
rm
ali
zed
tra
nsc
rip
t
ab
un
da
nce
γA
RD
± S
D
No
rm
ali
zed
tra
nsc
rip
t
ab
un
da
nce
AR
D ±
SD
Ra
tio (
AR
D/γ
AR
D)
Sig
nal
ing
MD
P00
002
722
46
kin
ase
fam
ily p
rote
in
1.7
± 0
.58
0.5
1 ±
0.1
3
-3.3
5
Str
ess
MD
P00
002
143
82
HS
P2
1 (
HE
AT
SH
OC
K P
RO
TE
IN 2
1)
3.1
9 ±
0.0
5
0.6
4 ±
0.4
4
-5.0
2
Str
ess
M
DP
00
007
003
83
17.1
kD
a c
lass
II
hea
t sh
ock
pro
tein
-lik
e
8.2
8 ±
1.4
1
.7 ±
0.1
9
-4.8
6
Str
ess
M
DP
00
005
480
65
17.3
kD
a c
lass
II
hea
t sh
ock
pro
tein
-lik
e
16.3
9 ±
1.0
1
3.8
2 ±
0.9
-4
.29
Str
ess
MD
P00
002
542
60
hea
t sh
ock
pro
tein
83
-lik
e 4
4.0
9 ±
0.9
2
12.0
9 ±
0.7
1
-3.6
5
Str
ess
MD
P00
001
721
08
18.1
kD
a cl
ass
I h
eat
shock
pro
tein
-lik
e 1
2.7
3 ±
2.1
8
3.5
2 ±
0.4
4
-3.6
2
Str
ess
M
DP
00
007
596
66
18.5
kD
a c
lass
I h
eat
sho
ck
pro
tein
-lik
e
0.3
7 ±
0.0
6
0.1
1 ±
0.0
2
-3.4
8
Str
ess
MD
P00
001
857
37
TM
V r
esis
tan
ce p
rote
in N
-lik
e 0
.47 ±
0.0
9
0.1
4 ±
0.0
6
-3.4
5
Str
ess
MD
P00
006
211
93
17.3
kD
a cl
ass
II h
eat
shock
pro
tein
-lik
e 5
3.5
7 ±
5.6
1
16.2
9 ±
3.0
7
-3.2
9
Str
ess
MD
P00
001
974
30
AT
ER
DJ2
A;
hea
t sh
ock
pro
tein
bin
din
g
1.0
1 ±
0.1
8
0.3
2 ±
0.1
3
-3.1
2
Str
ess
MD
P00
002
118
07
gly
cosy
l h
yd
rola
se f
amil
y 1
8 p
rote
in
1.2
1 ±
0.1
3
0.4
± 0
.11
-3.0
2
Str
ess
MD
P00
005
039
44
DN
AJ
hea
t sh
ock
pro
tein
5
.31 ±
1.2
1
16.9
5 ±
0.0
4
3.1
9
Str
ess
MD
P00
007
103
49
end
och
itin
ase-
lik
e 1
.47 ±
0.3
3
4.9
± 1
.05
3.3
4
Str
ess
MD
P00
005
672
68
DN
AJ
hea
t sh
ock
pro
tein
2
.31 ±
1.2
1
7.8
6 ±
0.5
5
3.4
0
Str
ess
M
DP
00
005
523
28
tha
um
ati
n-l
ike p
ro
tein
1a
2.8
8 ±
1.0
8
12.5
± 1
.64
4.3
4
Str
ess
M
DP
00
002
186
91
aci
dic
en
do
ch
itin
ase
-lik
e
0.0
7 ±
0.0
2
0.5
3 ±
0.1
7
7.6
5
Tra
nsp
ort
M
DP
00
001
732
07
KE
A3
; p
ota
ssiu
m i
on t
ran
smem
bra
ne
tran
sport
er
2.4
9 ±
0.9
5
0.7
3 ±
0.0
6
-3.4
0
Tra
nsp
ort
M
DP
00
001
738
64
TM
T2
(T
ON
OP
LA
ST
MO
NO
SA
CC
HA
RID
E T
RA
NS
PO
RT
ER
2)
0.7
8 ±
0.2
7
0.2
5 ±
0.1
-3
.11
*R
atio
s ar
e re
pre
sen
ted
by t
he
qu
oti
ent
of
AR
D/γ
AR
D w
ith
val
ues
bet
wee
n 0
an
d 1
bei
ng t
ran
sform
ed b
y u
sing t
he
neg
ativ
e re
cip
roca
l val
ue
of
the
qu
oti
ent.
Bold
pri
nti
ng i
ndic
ates
gen
es t
hat
wer
e an
alyze
d i
n R
T-
qP
CR
exp
erim
ents
. G
enes
are
ord
ered
acc
ord
ing t
o t
hei
r ra
tios
and
alp
hab
etic
ally
acc
ord
ing t
o t
hei
r M
apM
an f
unct
ion
al c
ateg
ory
. R
ed c
olo
r in
dic
ates
dow
nre
gu
lati
on
in
AR
D s
amp
les
and
blu
e co
lori
ng r
epre
sen
ts
up
regu
lati
on
in A
RD
sam
ple
s.
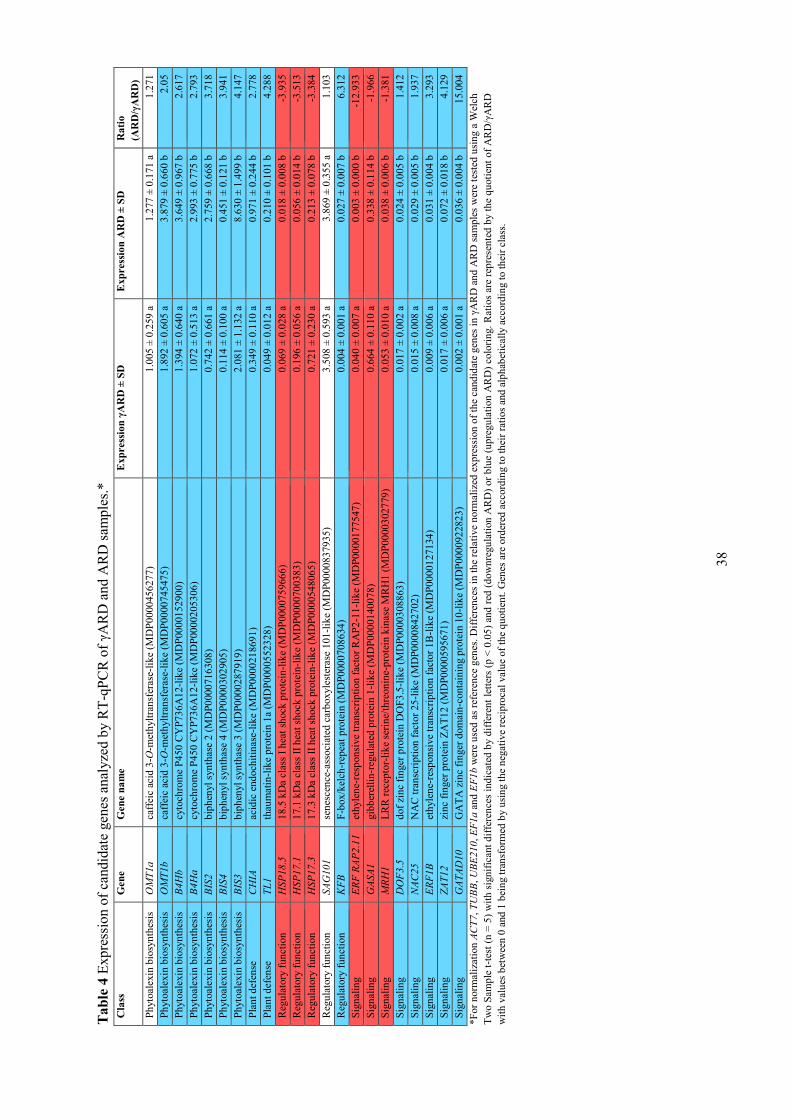
38
Tab
le 4
Exp
ress
ion o
f ca
ndid
ate
gen
es a
nal
yze
d b
y R
T-q
PC
R o
f γA
RD
and A
RD
sam
ple
s.*
Cla
ss
Gen
e G
en
e n
am
e
Exp
ress
ion
γA
RD
± S
D
Exp
ress
ion
AR
D ±
SD
R
ati
o
(AR
D/γ
AR
D)
Ph
yto
alex
in b
iosy
nth
esis
O
MT
1a
caff
eic
acid
3-O
-met
hylt
ran
sfer
ase-
lik
e (M
DP
0000
456
277
) 1
.005
± 0
.259
a
1.2
77
± 0
.171
a
1.2
71
Ph
yto
alex
in b
iosy
nth
esis
O
MT
1b
caff
eic
acid
3-O
-met
hylt
ran
sfer
ase-
lik
e (M
DP
0000
745
475
) 1
.892
± 0
.605
a
3.8
79
± 0
.660
b
2.0
5
Ph
yto
alex
in b
iosy
nth
esis
B
4H
b
cyto
chro
me
P4
50
CY
P73
6A
12
-lik
e (M
DP
00
001
529
00
) 1
.394
± 0
.640
a
3.6
49
± 0
.967
b
2.6
17
Ph
yto
alex
in b
iosy
nth
esis
B
4H
a
cyto
chro
me
P4
50
CY
P73
6A
12
-lik
e (M
DP
00
002
053
06
) 1
.072
± 0
.513
a
2.9
93
± 0
.775
b
2.7
93
Ph
yto
alex
in b
iosy
nth
esis
B
IS2
bip
hen
yl
syn
thas
e 2 (
MD
P0
000
716
308
) 0
.742
± 0
.661
a
2.7
59
± 0
.668
b
3.7
18
Ph
yto
alex
in b
iosy
nth
esis
B
IS4
bip
hen
yl
syn
thas
e 4 (
MD
P0
000
302
905
) 0
.114
± 0
.100
a
0.4
51
± 0
.121
b
3.9
41
Ph
yto
alex
in b
iosy
nth
esis
B
IS3
bip
hen
yl
syn
thas
e 3 (
MD
P0
000
287
919
) 2
.081
± 1
.132
a
8.6
30
± 1
.499
b
4.1
47
Pla
nt
def
ense
C
HIA
ac
idic
end
och
itin
ase-
lik
e (M
DP
0000
21
869
1)
0.3
49
± 0
.110
a
0.9
71
± 0
.244
b
2.7
78
Pla
nt
def
ense
T
L1
thau
mat
in-l
ike
pro
tein
1a
(MD
P000
05
523
28
) 0
.049
± 0
.012
a
0.2
10
± 0
.101
b
4.2
88
Reg
ula
tory
fu
nct
ion
HS
P18
.5
18.5
kD
a cl
ass
I h
eat
shock
pro
tein
-lik
e (M
DP
000
075
966
6)
0.0
69
± 0
.028
a
0.0
18
± 0
.008
b
-3.9
35
Reg
ula
tory
fu
nct
ion
HS
P17
.1
17.1
kD
a cl
ass
II h
eat
shock
pro
tein
-lik
e (M
DP
000
070
038
3)
0.1
96
± 0
.056
a
0.0
56
± 0
.014
b
-3.5
13
Reg
ula
tory
fu
nct
ion
HS
P17
.3
17.3
kD
a cl
ass
II h
eat
shock
pro
tein
-lik
e (M
DP
000
054
806
5)
0.7
21
± 0
.230
a
0.2
13
± 0
.078
b
-3.3
84
Reg
ula
tory
fu
nct
ion
SA
G101
sen
esce
nce
-ass
oci
ated
car
boxyle
ster
ase
101
-lik
e (M
DP
00
008
379
35
) 3
.508
± 0
.593
a
3.8
69
± 0
.355
a
1.1
03
Reg
ula
tory
fu
nct
ion
KF
B
F-b
ox/k
elch
-rep
eat
pro
tein
(M
DP
0000
708
634
) 0
.004
± 0
.001
a
0.0
27
± 0
.007
b
6.3
12
Sig
nal
ing
ER
F R
AP
2.1
1
eth
yle
ne-
resp
on
sive
tran
scri
pti
on f
acto
r R
AP
2-1
1-l
ike
(MD
P00
001
775
47
) 0
.040
± 0
.007
a
0.0
03
± 0
.000
b
-12
.93
3
Sig
nal
ing
GA
SA
1
gib
ber
elli
n-r
egu
late
d p
rote
in 1
-lik
e (M
DP
00
001
400
78
) 0
.664
± 0
.110
a
0.3
38
± 0
.114
b
-1.9
66
Sig
nal
ing
MR
H1
LR
R r
ecep
tor-
lik
e se
rin
e/th
reon
ine-
pro
tein
kin
ase
MR
H1
(M
DP
00
003
027
79
) 0
.053
± 0
.010
a
0.0
38
± 0
.006
b
-1.3
81
Sig
nal
ing
DO
F3
.5
dof
zin
c fi
nger
pro
tein
DO
F3
.5-l
ike
(MD
P00
003
088
63
) 0
.017
± 0
.002
a
0.0
24
± 0
.005
b
1.4
12
Sig
nal
ing
NA
C25
NA
C t
ran
scri
pti
on
fac
tor
25
-lik
e (M
DP
0000
842
702
) 0
.015
± 0
.008
a
0.0
29
± 0
.005
b
1.9
37
Sig
nal
ing
ER
F1B
et
hyle
ne-
resp
on
sive
tran
scri
pti
on f
acto
r 1
B-l
ike
(MD
P00
001
271
34
) 0
.009
± 0
.006
a
0.0
31
± 0
.004
b
3.2
93
Sig
nal
ing
ZA
T1
2
zin
c fi
nger
pro
tein
ZA
T1
2 (
MD
P00
005
956
71
) 0
.017
± 0
.006
a
0.0
72
± 0
.018
b
4.1
29
Sig
nal
ing
GA
TA
D10
GA
TA
zin
c fi
nger
dom
ain
-conta
inin
g p
rote
in 1
0-l
ike
(MD
P000
092
282
3)
0.0
02
± 0
.001
a
0.0
36
± 0
.004
b
15.0
04
*F
or
norm
aliz
atio
n A
CT
7,
TU
BB
, U
BE
21
0,
EF
1a
an
d E
F1
b w
ere
use
d a
s re
fere
nce
gen
es.
Dif
fere
nce
s in
th
e re
lati
ve
norm
aliz
ed e
xp
ress
ion
of
the
cand
idat
e gen
es i
n γ
AR
D a
nd
AR
D s
ample
s w
ere
test
ed u
sin
g a
Wel
ch
Tw
o S
amp
le t
-tes
t (n
= 5
) w
ith
sig
nif
ican
t d
iffe
ren
ces
ind
icat
ed b
y d
iffe
ren
t le
tter
s (p
< 0
.05
) an
d r
ed (
dow
nre
gu
lati
on
AR
D)
or
blu
e (u
pre
gu
lati
on
AR
D)
colo
rin
g.
Rat
ios
are
rep
rese
nte
d b
y t
he
qu
oti
ent
of
AR
D/γ
AR
D
wit
h v
alu
es b
etw
een
0 a
nd
1 b
ein
g t
ran
sform
ed b
y u
sin
g t
he
neg
ativ
e re
cip
roca
l val
ue
of
the
qu
oti
ent.
Gen
es a
re o
rder
ed a
ccord
ing t
o t
hei
r ra
tios
and
alp
hab
etic
ally
acc
ord
ing t
o t
hei
r cl
ass.

39
2.3. Supplementary data
Supplementary Fig. S1 Experimental setup and derived biological replicates. Thirty plants were cultivated in γARD or ARD soil. Five
plants per variant were used for shoot length recording and 25 plants per variant were harvested for transcriptomic analyses. In total five
pools containing roots derived from five plants each were generated per variant (= biological replicates). Two pools/biological replicates per
variant were analyzed with MACE; all replicates were tested in RT-qPCR experiments.
For Supplementary Table S1 see disk in the back of the thesis
Supplementary_Table_S1_Manuscript_I_Chapter_2.pdf
40
3. Impaired defense reactions in apple replant disease-affected roots of Malus domestica ‘M26’
Stefan Weiß1, Benye Liu2, Dennis Reckwell2, Ludger Beerhues2, Traud Winkelmann1*
1Leibniz Universität Hannover, Institute of Horticultural Production Systems, Section of Woody Plant
and Propagation Physiology, Herrenhäuser Str. 2, D-30419 Hannover, Germany.
2Technische Universität Braunschweig, Institute of Pharmaceutical Biology, Mendelssohnstrasse 1, D-
38106 Braunschweig, Germany.
*Corresponding author. Traud Winkelmann, Leibniz Universität Hannover, Institute of Horticultural
Production Systems, Section of Woody Plant and Propagation Physiology, Herrenhäuser Str. 2, D-
30419 Hannover, Germany. Tel.: +49 (0) 511 / 762 3602; Fax: +49 (0) 511 / 762 3608; Email:
Type of authorship First author
Type of article Research article
Contribution to the article Performed the experiments, data analysis and wrote the manuscript
Co-authors contribution Benye Liu analyzed the phytoalexin compounds in root material and
contributed to writing
Dennis Reckwell assisted in analysis of phytoalexin compounds
Ludger Beerhues construed phytoalexin data and contributed to
writing
Traud Winkelmann conceived and coordinated the project,
participated in interpretation of data and in writing the manuscript
Journal Tree Physiology
Impact factor 3.587
Date of submission February 20, 2017
Status Under revision

41
3.1. Manuscript
Abstract
A soil- and site-dependent complex of diverse microbial populations causes apple replant disease
(ARD), which leads to financial losses for tree nurseries and apple producers due to reduced plant
growth and diminished fruit yields. Soil fumigation has been widely used to mitigate ARD, but the use
of these chemicals is restricted in the EU. Hence, other counteractions have to be developed.
Genomics-based breeding may be used to select ARD tolerant genotypes; however, molecular
responses of ARD are not well understood. Recent studies revealed that biotic stress-associated genes
involved in typical defense reactions are activated but do not result in an adequate response to ARD.
The objective of this study was to analyze selected responsive genes in a time-course experiment to
test for expression kinetics and to compare ARD effects on the transcriptomic level between different
ARD soils with diverging cropping histories. Cultivating the ARD-susceptible apple rootstock
‘M26’on ARD-affected soil resulted in significantly reduced growth already 7 days after planting. The
majority of the analyzed genes showed similar transcriptomic responses towards ARD in two different
soils. Genes involved in phytoalexin biosynthesis were upregulated in ARD samples already 3 days
after planting and reached up to 26-fold changes at day 10, which resulted in high amounts of 3-
hydroxy-5-methoxybiphenyl, aucuparin, noraucuparin, 2-hydroxy-4-methoxydibenzofuran, 2'-
hydroxyaucuparin and noreriobofuran. For the first time, these phytoalexins were detected, identified
and quantified in apple roots. The lack of a sufficient defense response may be due to impaired
sequestration and/or exudation of the potentially cytotoxic phytoalexins and perturbed formation of
ROS, leading to root damage in ARD soils. The findings provide a basis for comparative studies of the
defense processes in more ARD-tolerant rootstocks.
Key words: Apple replant disease; biotic stress response; growth depression; Malus
domestica; plant defense; phytoalexins; quantitative real-time PCR; time-dependent gene expression
Funding
This work was funded by the “Deutsche Forschungsgemeinschaft” (DFG, grant number: GRK 1798/1)
and it was part of the GRK1798 “Signaling at the Plant-Soil Interface".
Acknowledgements
First of all, acknowledgements go to Prof. Dr. Kornelia Smalla for bringing both groups of the authors
in contact. We thank the tree nurseries Alves and Klei in Schleswig-Holstein for providing soils and
Dr. Andreas Wrede for the collection of the soils. Furthermore, we are thankful to Simon Richartz and
Bunlong Yim for assistance in the greenhouse experiment.

42
Introduction
Apple replant disease (ARD) describes a severe problem in commercial fruit orchards and tree
nurseries with high turnover rates in planting new trees in the same field. Symptoms of the worldwide
phenomenon can be detected within one to three months after planting in the field and include
diminished growth with restricted and condensed internodes (Mazzola and Manici 2012). In addition
to reduced aboveground growth, the biomass of roots is also negatively affected and discolorations as
well as root tip necrosis are observed (Mazzola and Manici 2012). Eventually, continuous cropping
leads to an adverse influence on fruit yield and quality, demonstrated by undesirable texture,
appearance and flavor of apple fruits (Liu et al. 2014).
Many studies established background knowledge concerning potential causal agents in ARD
etiology. Although no definitive cause was found, which applies to the majority of cases, parasitic
fungi of the genera Cylindrocarpon (Tewoldemedhin et al. 2011a; Mazzola and Manici 2012; Manici
et al. 2013, 2015; Franke-Whittle et al. 2015), Phytophthora (Tewoldemedhin et al. 2011b; Mazzola
and Manici 2012), Pythium (Tewoldemedhin et al. 2011b; Mazzola and Manici 2012; Manici et al.
2013) and Rhizoctonia (Tewoldemedhin et al. 2011b; Mazzola and Manici 2012; Manici et al. 2015)
were most often associated with the disease. Abiotic factors may impede apple tree growth but were
not found to strongly impact the disease (Spath et al. 2015). Due to the broad spectrum of diverse
microorganisms prospectively concomitant to ARD, effective control is nowadays almost not
conceivable since soil fumigants, which were successfully used for soil disinfection in former times,
are phased out because of environmental concerns (Porter et al. 2010). The EU adopted the directive
EC 128/2009 (2009) for the restricted and sustainable use of pesticides. Hence, studies dealing with
ARD have focused on finding alternative counteractions for plants to cope with ARD.
Accomplishing better growing conditions for plants faced with ARD was the main goal of
biofumigation studies, but results on disease control still vary as external factors like differences in
temperature, precipitation and solar radiation as well as tissue disruption and soil water content can
influence the effect of this method (Yim et al. 2016). Furthermore, the time needed for growing
biofumigation plants results in lost production (Mazzola and Manici 2012). Therefore, application of
Brassica juncea seed meal was deemed more efficient (Mazzola et al. 2007, 2009, 2015; Mazzola and
Zhao 2010; El-Sharouny 2015). Additional alternative means for disinfection of ARD soils were
proposed including the application of biochar (Wang et al. 2014), intact glucosinolates (Hanschen et
al. 2015), arbuscular mycorrhiza as well as microbial (Guo et al. 2014; Gastol and Domagala-
Swiatkiewicz 2015) and seaweed fertilizers (Wang et al. 2016), however, further tests have to be
conducted. Other cropping practices, which may potentially mitigate the disease outcome, involve
replanting in inter-rows (Kelderer et al. 2012), monitoring of soil urease activities (Sun et al. 2014),
treatments for manipulation of rhizosphere microbial communities to decrease detrimental and
increase beneficial microorganisms (Manici et al. 2013, 2015; Caputo et al. 2015; Yim et al. 2015),

43
and carbon source-dependent anaerobic soil disinfestation (Hewavitharana et al. 2014; Hewavitharana
and Mazzola 2016).
While the counteractions mentioned above aimed to assure stable growth of established apple
rootstocks, there is also the possibility of breeding more tolerant genotypes, which can better handle
the adverse circumstances presented by ARD. Rootstock breeding (Volk et al. 2015) plus evaluation of
ARD tolerance have recently been performed (Forge et al. 2016). Furthermore, phenotypical
information referring to root turnover (Atucha et al. 2014) as well as root development (Emmett et al.
2014) have been linked to ARD tolerance mechanisms but the possible exploitation of genomics-
assisted breeding relies on thorough understanding of ARD at the molecular level. It also depends on
suitable traits associated with ARD and the development of closely linked molecular markers (Zhu et
al. 2014).
So far, only few studies have been conducted in regard to the molecular responses of ARD-
affected plants. It has been shown that phenolic compounds possibly function as antioxidant
substances in response to ARD (Börner 1959; Emmett et al. 2014; Henfrey et al. 2015), especially, the
flavonoid phloridzin was detected to a higher degree in exudates of ARD roots (Hofmann et al. 2009;
Emmett et al. 2014). Correspondingly, first studies analyzed the transcriptomic response of apple
seedlings to an infection by Pythium ultimum, one of the potential causal agents of ARD, which
resulted in the upregulation of genes involved in secondary metabolism reactions next to differentially
expressed genes in hormone metabolism amongst others (Shin et al. 2014, 2016; Zhu et al. 2014).
Likewise, own previous results (Weiß et al. under revision) suggest the importance of secondary-
metabolism-associated genes in the ARD response, which facilitates using such genes as molecular
markers in genomics-assisted breeding.
Genes related to biphenyl and dibenzofuran phytoalexin biosynthesis could serve as such
(negative) molecular markers, given that first results indicated the upregulation of biphenyl synthases,
O-methyltransferases and biphenyl-4-hydroxylases in ARD roots after 7 days of cultivation in ARD
soil (Weiß et al. under revision). The biosynthesis of these antimicrobial defense compounds was
characterized using Erwinia amylovora-infected apple shoots and elicitor-treated Sorbus aucuparia
cell cultures (Chizzali et al. 2012a, b, 2013; Khalil et al. 2015; Sircar et al. 2015). So far, ten biphenyls
and 17 dibenzofurans were identified in Rosaceae, especially Malinae, species including Malus, Pyrus
and Sorbus (Chizzali and Beerhues 2012; Khalil et al. 2013, 2015). Detection of these phytoalexins in
roots is reported here for the first time.
Possible candidates for molecular markers have to be stably expressed in ARD-affected plants
even when faced with ARD soils of different locations, i.e. with different properties and cropping
history. Furthermore, candidates should show a strong expression for easy detection via RT-qPCR
techniques. For understanding their function, it is also interesting to monitor the expression of
candidates over time to obtain a better understanding of molecular responses in ARD challenged
plants. Therefore, in this study, we aimed to investigate defense-related genes that were identified to

44
be significantly differentially expressed in ARD soil compared to disinfected ARD soil when using a
RNA sequencing approach (Weiß et al. under revision) towards their time dependent response in ARD
soils of different origin. We hypothesize that genes involved in ARD response are conserved regarding
expression among ARD soils of different origin and can be distinguished from those being soil-
specifically expressed. This study also aimed to contribute knowledge to defense reactions in roots of
woody plants as much less information is available than for biotic stressors affecting aboveground
organs of herbaceous species. The ARD vulnerable genotype ‘M26’was employed due to its suitability
as a reliable indicator test plant to detect ARD in soils (Yim et al. 2013).
Materials and methods
Soil origin and disinfection
Soil at a depth of 0-25 cm was taken from three field plots in a tree nursery in the area of Pinneberg,
Schleswig-Holstein, Germany (53° 41’ 58.51’’ N, 9° 41’ 34.12’’ E) in September 2014. On this site
(later on referred to as soil K), rose rootstock plants were grown from 1980 to 2011, with crop rotation
with Tagetes starting from 2002 and annual replanting of the apple rootstock ‘M4’ started in 2012
(Yim et al. 2015, 2016). Amounts of 18-20 L of homogenized soil were packed in autoclavable bags
(Sarstedt, Nümbrecht, Germany) and 175 L soil of the 350 L totally obtained were disinfected via γ-
irradiation (BGS – Beta Gamma Service, Wiehl, Germany) at a minimum dose of 10 kGy, by which
actinomycetes, fungi and invertebrates are eliminated (McNamara et al. 2003). Afterwards, the soil
bags were stored at 4 °C for 10 days until one day before the start of the experiment.
Plant cultivation and harvest
In vitro propagation and rooting of the highly ARD susceptible apple rootstock ‘M26’ (Yim et al.
2013, 2015) was performed according to Weiß et al. (under revision). Acclimatization of rooted plants
lasted three and a half weeks in the greenhouse. In December 2014, acclimatized plants were potted
into 1 L pots containing either γ-irradiated replant soil (γARD) or untreated replant soil (ARD). The
slow release fertilizer Osmocote Exact Standard 3-4 M (16-9-12+2MgO+TE,
http://www.scottsprofessional.com) was added to the soils at a concentration of 2 g L-1 before potting
of plants. Plants were grown under the following conditions: 19.33 °C ± 1.01 °C, 57.73 % ± 6.18 %
relative humidity and a 16 h photoperiod with additional light (if solar radiation fell below 25 klx,
provided by SONT Philips Master Agro 400W). Irrigation was carried out by hand on a daily basis as
required. Weekly spraying against thrips and spider mites was performed as plant protection according
to horticultural practice. In total 350 plants were used for the biotest, 175 plants each for γARD and
ARD variants. Each soil variant included five different time points for harvest after 3, 7, 10, 14 and
56 days (end of experiment). For each time point, the shoot lengths of 35 plants were recorded. At the
time points 3, 7, 10 and 14 days, root material of 25 of these plants was harvested for RNA isolation
and subsequent gene expression analyses. Root material of the remaining 10 plants was used for the

45
analysis of phytoalexins. All plants cultivated for 56 days were used for weekly measuring shoot
length.
For RNA isolation at days 0 (acclimatized plants before potting), 3, 7, 10 and 14, the whole
root system was removed from the individual plants, rinsed with water, placed into 2 ml tubes
(Sarstedt, Nümbrecht, Germany) and frozen in liquid nitrogen. Samples were stored at -80 °C until
homogenization of plant material. Root material for the analysis of phytoalexins was treated similarly,
with the exception that root material after washing was freeze-dried for 3 days (Christ ALPHA 1-4
LSC, Osterode, Germany) and stored at -20 °C until homogenization of plant material.
RNA extraction and first strand cDNA synthesis
Root materials of five plants were combined to form a biological pool (= biological replicate) and a
total of five pools were generated for each time point and soil variant. The pools were homogenized as
described by Weiß et al. (under revision) and RNA extraction from 100 mg homogenized root material
was performed using InviTrap Spin Plant RNA Mini Kit (Stratec, Birkenfeld, Germany) according to
the manufacturer’s instructions for phenol containing plants. RNA yield and quality were assessed by
a spectrophotometer (Nanodrop 2000c, Peqlab, Erlangen, Germany). Subsequent genomic DNA
removal was achieved by in-solution DNA digestion using 1 µg of total RNA and DNase I (Thermo
Scientific, Waltham, MA, USA) according to the manufacturer’s instructions. Afterwards, random
hexamer primers were used in first strand cDNA synthesis to reversely transcribe total RNA,
employing the RevertAid First Strand cDNA Synthesis Kit (Thermo Scientific, Waltham, MA, USA)
according to the manufacturer’s instructions. Aliquoted cDNA samples were stored at -80 °C for
proceeding RT-qPCR experiments.
RT-qPCR gene expression analyses
Candidate and reference genes (EF1a, EF1b and TUBB according to expression stability;
Supplementary Table S2) found by Weiß et al. (under revision) were analyzed with a real-time PCR
cycler (CFX Connect™, Bio-Rad, Hercules, CA, USA). Primer combinations (200 nM for each
forward/reverse primer), iTaq Universal SYBR Green Supermix (Bio-Rad, Hercules, CA, USA) and
1:10 cDNA dilution were mixed and data was recorded with the Bio-Rad CFX Manager 3.1 software
(Bio-Rad, Hercules, CA, USA). The protocol for RT-qPCRs was as follows: 3 min at 95 °C, followed
by 40 cycles of 10 s at 95 °C and 30 s at 60 °C. The program was ended after a melt curve analysis
from 65 °C to 95 °C with an increment of 0.5 °C for 5 s at each step. Gene expression was measured
for five biological replicates and two technical replicates per soil variant and time point. Normalized
expression was calculated according to Pfaffl (2001).
Extraction and analysis of phytoalexins
By adding steel beads (ø 1.5 cm) to freeze-dried samples, root material was homogenized using a
mixer mill (Mixer Mill MM400, Retsch, Haan, Germany). Afterwards, homogenized powder from

46
each individual variant (γARD, ARD) and time point (0, 3, 7, 10 and 14 days) was combined to obtain
enough material for the analysis of phytoalexins. Phytoalexins were extracted from two technical
replicates according to Chizzali et al. (2012b) and analyzed by GC-MS (Hüttner et al. 2010).
Statistical analyses
Using the statistics program R 3.3.2 (R Development Core Team 2008), statistical analyses were
performed with log2 transformed data. Means of measured or calculated parameters between soil
variants (γARD, ARD) were compared using the Welch Two Sample t-Test (Welch 1947) at a P-value
level of 0.05. Different time points within one soil variant were compared using a Tukey multiple
comparisons test adjusted for heterogeneous variances if needed (Tukey 1949; Herberich et al. 2010)
at a P-value level of 0.05. For the test of correlation between gene expression data obtained at day 7 of
this study and data from Weiß et al. (under revision), the Pearson product-moment correlation
coefficient (Pearson 1895) was calculated in Microsoft Excel 2010.
For the expression data over time, the connection between the start point of the experiment
and day 3 is indicated in the graphs by a dotted line, because the plant material at day 0 represented
freshly uprooted acclimatized plantlets, which can only be partly compared to the freshly potted
plantlets at day 3.
Results
ARD soil had a negative effect on the shoot and root growth of ‘M26’
Plants of the apple rootstock ‘M26’ were negatively affected in their shoot growth over the course of
the experiment when grown in ARD soil (Figure 1). After 7 days, plants grown in γARD soil showed
significantly higher shoot length with 5.7 ± 1.1 cm compared to their counterparts cultivated in ARD
soil with 5 ± 1.1 cm (Figure 1a). The differences between the two variants got more pronounced with
increasing time, resulting in mean shoot lengths of 19.9 ± 5.3 cm and 7.9 ± 2.7 cm for γARD and
ARD, respectively, at the end of the experiment, which indicates a 2.5-fold increase in shoot length in
γARD plants. The habitus of the plants reflected these observations (Figure 1b). After 10 days of
cultivation, the root system was also affected in overall growth and it showed darker coloration.
Strikingly, shoot growth stagnated in both variants between days 10 and 21. Thereafter, only γARD
plants showed massive shoot growth.
Genes involved in ARD response demonstrated both conservation and soil-specific behavior
In a previous study (Weiß et al. under revision), several genes associated with biotic stress response
were found to be affected by ARD. To obtain more detailed information of the expression of these
genes over time, the present study reports a kinetic experiment, employing soil from a different tree
nursery with different properties and cropping history. For RT-qPCR experiments, the reference genes
used were elongation factor 1-alpha (EF1a), elongation factor 1-beta 2-like (EF1b) and tubulin beta

47
chain (TUBB). The data from Weiß et al. (under revision, hereafter referred to as soil A) were re-
calculated based on the three reference genes used in this study to compare expression levels with
results obtained in this study at day 7. Ratios between expression levels in ARD and γARD soils were
revealed to be comparable for the majority of genes at least in tendency (Table 1) and they showed a
positive relationship (Supplementary Figure S1). However, genes involved in phytoalexin biosynthesis
were even more affected in soil K, as emphasized by a higher upregulation in ARD samples compared
to soil A. For the caffeic acid 3-O-methyltransferase-like gene (OMTb), the biphenyl hydroxylase
genes (B4Ha and B4Hb) and especially the biphenyl synthase genes (BIS2 to BIS4), up to six times
higher upregulation in ARD samples was observed in soil K compared to soil A, although the
expression levels of γARD samples were almost equal in both soils (Supplementary Table S3).
Likewise, the ethylene-responsive transcription factor 1B-like gene (ERF1B) revealed an even
stronger upregulation in soil K with 12.03 higher expression in ARD samples compared to only 3.29
upregulation in soil A. Two additional noteworthy genes include the ethylene-responsive transcription
factor RAP2-11-like (ERF RAP2.11) and the GATA zinc finger domain-containing protein 10-like
(GATAD10). ERF RAP2.11 was 12.93-fold downregulated in ARD samples in soil A, whereas this
regulation was diminished in soil K to merely 2.07-fold. GATAD10 displayed a similar behavior,
showcasing a 15.06-fold upregulation in ARD samples in soil A but only 2.22-fold upregulation in soil
K. Nevertheless, it has to be noted that the expression levels of these three signaling genes, albeit
similar, were very low (Supplementary Table S3). Notwithstanding that 20 of the 27 analyzed genes
displayed similar fold-change ratios in tendency for both soils, some genes were soil-specifically
expressed in the roots of ‘M26’, such as the plant defense gene ankyrin-1-like (ANK1) being
upregulated only 1.9-fold in soil K. Furthermore, the heat shock protein genes HSP17.1, HSP17.3 and
HSP18.5 were only downregulated in ARD samples of soil A but either not regulated (HSP17.1 and
HSP18.5) or slightly upregulated (HSP17.3) in soil K. In the case of these three genes, the expression
in γARD samples of soil A was also higher compared to soil K (Supplementary Table S3).
Plant defense genes were only slightly affected by ARD
The plant defense genes for ankyrin-1-like (ANK1), acidic endochitinase-like (CHIA), disease
resistance protein At4g27190-like (DRP) and thaumatin-like protein 1a (TL1) exhibited diverse
expression behavior (Figure 2). Whereas all genes showed a decrease in expression in both variants
from the start of the experiment to day 3, the decrease was stronger in tendency for ANK1, CHIA and
TL1 in γARD samples. With the exception of ANK1 and DRP (Figure 2a, c), expression of the other
genes in γARD samples was more or less constant for the remaining time points. For ANK1, the
expression levels in ARD soil were significantly higher at days 3, 7 and 14 compared to γARD
samples. CHIA and TL1 revealed an increase in gene expression over time in ARD samples at least in
tendency but stable expression over time was observed for γARD samples (Figure 2b, d). In addition,
CHIA showed significant differences between soil variants starting from day 3, whereas TL1 was

48
significantly affected after 7 days of cultivation. Overall, significant upregulations in ARD samples
were recorded, which ranged from two to three times for ANK1 and CHIA, respectively, and up to nine
times for TL1. ANK1 and CHIA were expressed at the highest levels among the plant defense genes,
followed by TL1 and DRP, which were expressed lowest.
The selected genes with regulatory functions were negligibly expressed in ARD variants
The expression patterns of genes with regulatory functions also differed (Figure 3). While HSP17.1,
HSP18.5 and the F-box/kelch-repeat protein At4g12810 (KFB) and pectinesterase/pectinesterase
inhibitor 41 (PME41) genes were not significantly influenced in their expression by ARD, HSP 17.3
and the senescence-associated carboxylesterase 101-like gene (SAG101) were more highly expressed
in ARD than in γARD samples, although at most time points at only slightly higher levels (Figure 3).
Over time, expression of most genes declined during the first 3 days and thereafter did not show
drastic changes, except for PME41, whose expression increased until day 3 and decreased thereafter
(Figure 3e).
Signaling genes indicated diverse expression patterns
ERF RAP2.11, ERF1B, GATAD10 and the genes for 1-aminocyclopropane-1-carboxylate oxidase
homolog 1-like (ACO1), dof zinc finger protein DOF3.5-like (DOF3.5), gibberellin-regulated protein
1-like (GASA1), LRR receptor-like serine/threonine-protein kinase MRH1 (MRH1), NAC transcription
factor 25-like (NAC25), wound-induced protein 1-like (WIN1) and zinc finger protein ZAT12
(ZAT12), which are classified as genes involved in signaling, showed differing expression patterns and
low expression levels (Figure 4). ACO1, ERF RAP2.11, GASA1, MRH1 and WIN1 exhibited
significantly higher expression in γARD samples, at least at one time point during the experiment
(Figure 4a, c, e, g, i). Expression of these genes in ARD samples stayed on a consistent level, except
for WIN1 with higher expression at day 14 compared to the other time points. In γARD samples, the
genes were stably expressed until day 7 after an initial decrease from the start of the experiment to
day 3, except for ACO1, whose expression further decreased at day 7 and then did not differ for the
remaining time points (Figure 4a). ERF RAP2.11, GASA1, MRH1 and WIN1 increased in expression
after day 7, showing maximum expression at day 10 with significant differences compared to ARD
samples. They stayed on this level also at day 14. Expression of ERF1B, GATAD10 and ZAT12 was
significantly higher in ARD samples for all time points with the exception of day 3 for GATAD10
(Figure 4d, f, j).
Phytoalexin biosynthesis genes revealed a strong and early response to ARD
The phytoalexin biosynthesis genes BIS2, BIS3, BIS4, OMTb, B4Ha and B4Hb showed similar
expression profiles over time (Figure 5), although at different expression levels. These genes were
significantly upregulated in ARD samples already after 3 days and showed an increase in expression
compared to the start of the experiment. Expression did not significantly increase at day 7 but after

49
10 days a further rise in expression was measured for these genes at least in tendency. Afterwards,
expression levels stayed constant at day 14. Expression of these genes in γARD samples consistently
remained on a lower level with a slight decrease measured from the start of the experiment to day 3.
Only the caffeic acid 3-O-methyltransferase-like gene (OMTa) did not follow this expression pattern
(Figure 5d), but displayed hardly any differences between soil variants and time points. Regarding the
different expression levels, BIS2 and BIS3 were expressed highest in ARD samples with peak levels
reaching values of normalized expression of 26.48 ± 7.33 (21.18 times upregulated) and 57.27 ± 14.91
(11.36 times upregulated) at day 10, respectively (Figure 5a, b). In ARD samples at day 10, the
phytoalexin biosynthesis genes OMTb, B4Ha and B4Hb showed similar maximal normalized
expression values of 14.1 ± 4.26 (3.64 times upregulated), 7.66 ± 2.72 (6.47 times upregulated) and
10.42 ± 3.09 (6.71 times upregulated), respectively (Figure 5e-g). In contrast, BIS4 and OMTa were
expressed at day 10 at lower levels with maximal normalized expression values of 2.53 ± 0.72
(26.23 times upregulated) and 3.05 ± 0.39, respectively (Figure 5c, d).
High levels of phytoalexins were detected in ARD samples
Corresponding to the increased expression levels of phytoalexin biosynthesis genes, the total
phytoalexin content in ARD samples was found to be consistently higher than in γARD samples
(Figure 6). In ARD samples, the total content over time showed a trend upwards, reaching
1.7 ± 0.19 mg/g dry matter after 14 days. In contrast, contents in γARD samples stayed on the same
level at around 0.2 mg/g dry matter over time after an initial decrease from the start of the experiment.
Individual phytoalexin compounds revealed the same tendency of being present at higher
concentrations in ARD samples (Table 2). 3-Hydroxy-5-methoxybiphenyl, aucuparin, noraucuparin,
2-hydroxy-4-methoxydibenzofuran, 2'-hydroxyaucuparin and noreriobofuran were identified in ARD
samples. The compound 2-hydroxy-4-methoxydibenzofuran was found over all time points in γARD
samples but it was detected at higher concentrations in ARD samples. The other compounds were
either not detected or identified at low concentrations in γARD samples. 3-Hydroxy-5-
methoxybiphenyl and aucuparin were exclusively found in ARD samples. Noraucuparin was also
detected in γARD samples at day 3 but at a 13 times lower concentration than in ARD samples.
Figure 7 summarizes the kinetics on the accumulation of the detected phytoalexins and the expression
of the corresponding genes in a proposed biosynthetic pathway of phytoalexins found in ‘M26’.
Discussion
ARD rapidly affected the growth habitus of ‘M26’ plants
Molecular responses of apple plants affected by ARD are not yet well understood but progress has
recently been made in uncovering ARD in the plant on the molecular level (Shin et al. 2014, 2016;
Zhu et al. 2014; Henfrey et al. 2015; Weiß et al. under revision). The present study aimed to gather
more data to better comprehend ARD responses on the molecular level and to contribute knowledge to

50
defense reactions in roots of woody plants, for which much less information is available than for biotic
stressors affecting aboveground organs of herbaceous species. Based on the results of a preceding
study (Weiß et al. under revision), selected ARD-affected candidate genes were investigated over
time, using a soil of a different tree nursery and employing a time course expression analysis. The
conserved expression of genes between different soils might indicate their importance in ARD. Early-
reacting genes may be employed for early monitoring in order to estimate the ARD severity of soils.
In this study, shoot growth of the ARD susceptible apple rootstock ‘M26’ was affected
already after 7 days of cultivation in ARD soil, thus even earlier than in previous investigations (Yim
et al. 2015, Weiß et al. under revision). Since the cited reports also focus on the ARD prone apple
rootstock ‘M26’, the soil used in our study appears to be more severely affected by ARD. This is
probably due to differing cropping history (apple rootstock plants on soil A were repeatedly grown
until 2009, followed by Prunus domestica in 2010, Cydonia oblonga in 2011 and annual replanting of
the apple rootstock ‘M4’ since 2012; Yim et al. 2015, 2016) as well as different soil properties
(Supplementary Table S1), resulting in different microbial communities in these two soils (Yim et al.
2015).
While γ-irradiation of the soil majorly improved shoot growth, ARD plants barely showed an
increase in the measured parameter over time, indicating the connotation of ARD with detrimental
microorganisms. Yim et al. (2015) discussed the greater abundance of genera with possibly
advantageous characteristics in disinfected soil, leading to improved growth and thereby hinting at soil
microbial community shifts. Plants grown in γARD soil showed a 4.6-fold increase in shoot length
whereas ARD plants revealed only a 1.8-fold increase, resulting in a 2.5 times shoot length difference
between γARD and ARD plants. Growing ‘M26’ plants on ARD soil from a different tree nursery
resulted in a 1.8-fold shoot length difference (Weiß et al. under revision). Therefore, the soil used in
this study appeared to be more heavily affected by microorganisms leading to ARD, and γ-irradiation
was able to effectively disinfect ARD soil from detrimental microorganisms. Beside shoots, roots of
ARD-exposed plants were affected as well. After 10 days, roots cultivated in ARD soil demonstrated
diminished overall growth combined with darker coloration. Root discoloration of ARD-challenged
plants was frequently reported previously (Tewoldemedhin et al. 2011a; Mazzola and Manici 2012;
Yim et al. 2013; Atucha et al. 2014; Shin et al. 2014; Henfrey et al. 2015; Weiß et al. under revision).
Stronger lignification of ARD-affected roots, indicating oxidation of phenolic compounds, was found
in ‘M26’ (Yim et al. 2013). It may suggest that higher phenolic concentrations in the root system were
responsible for the color of roots in ARD samples. Phenolic compounds may play a role as antioxidant
substances in defense to ARD (Emmett et al. 2014; Henfrey et al. 2015). Especially, the flavonoid
phloridzin was found to a higher extent in root exudates of ARD plants (Hofmann et al. 2009; Emmett
et al. 2014). Transcriptomic data obtained for P. ultimum-infected apple roots and ARD-affected
‘M26’ roots also emphasize the involvement of phenolic metabolism, such as flavonoid and

51
phenylpropanoid pathways, in ARD due to the upregulation of associated genes (Shin et al. 2016;
Weiß et al under revision).
Diverse expression of biotic stress response genes in ‘M26’ advocates suppressed defense reactions
Genes functioning in ROS and antioxidant metabolism as well as kinase signaling have recently been
reported to be differentially expressed after infection of apple seedlings with P. ultimum (Shin et al.
2016). The authors concluded that ROS scavenging systems such as ascorbate and glutathione may
play a critical role in apple root tissues with high levels of ROS due to P. ultimum infection.
Interestingly, genes associated to the ascorbate and glutathione redox systems via MapMan were also
more often but only minimally upregulated in ARD samples cultivated in soil A (Weiß et al. under
revision), pointing to the possibility of a non-sufficient ROS scavenging system in the ARD
susceptible rootstock ‘M26’, leading to root cell death.
ACO1 plays an essential role in the biosynthesis of ethylene, which is often reported to act in
defense reactions towards biotic stress (Glazebrook 2005; Broekaert et al. 2006). Here, we could show
that ACO1 was consistently expressed at lower levels in ARD samples, indicating either a diminished
or a suppressed role in defense towards ARD. The same was true for ERF RAP2.11 but not ERF1B,
which showed an upregulation in ARD samples. In contrast, ACO1 and ethylene responsive
transcription factors were upregulated in the study of Shin et al. (2014), which deals with the infection
of apple plants with one of the causal agents of ARD, P. ultimum. Therefore, in our study, ethylene
signaling may have been suppressed in ARD samples. However, activation of downstream defense
related genes such as CHIA and TL1 was observed, despite the obvious lack of their reported effects in
defense towards biotic stress (Liu et al. 2010; Shin et al. 2014). For a complete picture, more genes
involved in ethylene biosynthesis and signaling need to be investigated.
While the signaling genes DOF3.5 and NAC25 showed hardly any response to ARD, contrary
to previous results indicating a soil-specific expression of these genes (Weiß et al. under revision), the
transcription factors GATAD10 and ZAT12 demonstrated higher expression over time in ARD samples
compared to γARD samples. The function of ZAT12 in biotic stress response is associated to ROS
signaling (Davletova et al. 2005), further highlighting the importance of ROS scavenging, as
mentioned earlier. The disturbed defense mechanisms of ARD susceptible rootstock ‘M26’ was also
shown by the downregulation over time of GASA1, MRH1 and WIN1, which are responsible for
regulating DELLA proteins and thereby modulate the balance of salicylic acid and jasmonic acid
signaling in plant immunity (Zhu et al. 2005; De Bruyne et al. 2014), disease resistance signal
cascades (Afzal et al. 2008) and wounding-induced signaling, which in turn lead to phytohormone and
ROS signaling (León et al. 2001). Also, genes with regulatory function, tested due to their role in
maintaining a balanced metabolism even when faced with the biotic stress of ARD, gave no clear
indication on why ‘M26’ showed typical defense reaction towards biotic stress with no adequate
visible response.

52
Compromised defense reactions in ARD-affected ‘M26’ roots suggest phytoalexin toxicity
The observation that plants grown on ARD soil used in this study (soil K) were more severely affected
by ARD than those in the previous study (soil A) may also be correlated to the higher upregulation of
phytoalexin biosynthesis genes at day 7 in this study. While soil A revealed 3.7 to 4.1 times
upregulation of BIS2, BIS3 and BIS4 in ARD roots, soil K resulted in upregulation of these genes in
ARD roots up to 24 times at day 7. Meanwhile, γARD samples demonstrated similar expression levels
in both soils. In addition, B4Ha and B4Hb were two times more highly expressed in ARD samples of
soil K than in soil A. In phytoalexin biosynthesis, the aforementioned genes are involved in the
production of biphenyls and dibenzofurans (Figure 7; Khalil et al. 2015). To deal with biotic stress,
reported to be the main cause of ARD incidence (Mazzola and Manici 2012), plants have the
opportunity to produce phytoalexins (Ahuja et al. 2012). In apple, biphenyls and dibenzofurans were
found in higher concentrations in the transition zone of Erwinia amylovora-infected shoots as a result
of higher biphenyl synthase gene expression, especially BIS3 (Chizzali et al. 2012a, b, 2013). In our
study, BIS3 was likewise the gene with the highest expression level whereas BIS2 and BIS4 showed
the highest upregulation of monitored candidate genes. This is in accordance with a previous study, in
which biphenyl synthase genes were also expressed at the highest level in ARD samples (Weiß et al.
under revision). The importance of these genes was also indicated by infection of apple roots with P.
ultimum, one of the potential causal agents of ARD, given the upregulation of BIS4 (annotated as
chalcone synthase) 24 hours post inoculation (Shin et al. 2016). The high expression of phytoalexin
biosynthesis genes under ARD conditions further supports the predominant role of fungi in causing
ARD (Manici et al. 2013; Franke-Whittle et al. 2015). Phytoalexins cause disturbance of membrane
integrity (Rogers et al. 1996), constraint of conidial germination and germ-tube prolongation (Sellam
et al. 2007) as well as apoptotic-like programmed cell death of fungi (Shlezinger et al. 2011). In
healthy plant materials phytoalexins are commonly not present (Morrissey and Osbourn1999), which
is also true for the biphenyls studied here (Figure 7). However, two dibenzofurans were detectable at
day 0. Either the physiological state of the plants was perturbed upon planting, as supported by the
decreasing levels of noreriobofuran in γARD samples, or the compounds may also function as
constitutive phytoanticipins, which is supported by the relatively constant levels of 2-hydroxy-4-
methoxydibenzofuran. Nevertheless, the important function of biphenyls and dibenzofurans as
phytoalexins is indicated by the rapid and strong upregulation of the associated biosynthetic genes
towards ARD, as shown for BIS2, BIS3, BIS4, OMTb, B4Ha and B4Hb, whose expression levels were
increased already after 3 days of cultivation in ARD soil. OMTa was the only gene not to be
upregulated after day 3, indicating that different isoforms of genes take over different roles in the
ARD response.
In potato, Vicia fabia and Phaseolus vulgaris, host resistance was correlated to the level of
phytoalexin accumulation but Brassica spp. and various cruciferous plants lacked this relationship and
high phytoalexin concentrations potentially led to cytotoxicity (Rogers et al. 1996). Dixon et al. (1994)

53
also assumed that the high accumulation of phytoalexins is toxic to the plant. The phytoalexin
phaseolin killed bean and beet cells, possibly due to the loss of tonoplast integrity, leading to the
release of toxic plant metabolites and hydrolytic enzymes (Glazener and Van Etten 1978; Hargreaves
1980). One may hypothesize that the ARD sensitive rootstock ‘M26’ cannot exploit the phytoalexin
defense mechanism. Rather, the observed response in roots of this genotype may have led to
conditions, under which either sequestration or exudation of potentially toxic molecules resulted in
killing of parts of the root system. This assumption might be supported by the early shoot length
differences observed in this study between γARD and ARD plants after 7 days, correlated to the early
and high expression of phytoalexin biosynthesis genes in ARD roots and the resulting elevated
phytoalexin content compared to γARD samples. The finding that the expression of phytoalexin
biosynthesis genes did not decrease over time but showed an additional peak after 10 days might be
due to the fact that newly developing lateral roots continuously get in contact with ARD. This
hypothesis is fostered by the observation of brown and non-viable roots or root parts in ARD soil. Due
to the responsibility of roots to provide the plant with nutrients and water, shoot growth was
negatively affected.
The biphenyl and dibenzofuran phytoalexins 3-hydroxy-5-methoxybiphenyl, aucuparin,
noraucuparin, 2'-hydroxyaucuparin and noreriobofuran, with high contents in ARD roots, were
previously detected in the transition zone of fire blight-infected shoots of ‘Holsteiner Cox’ (Chizzali et
al. 2012a, b, 2013). Likewise, noraucuparin, aucuparin and 2’-hydroxyaucuparin were found in fire
blight-infected shoots of ‘Golden Delicious’ (Sircar et al. 2015). The total content of biphenyls and
dibenzofurans after 42 days amounted to 0.43 ± 0.08 mg/g dry matter (Chizzali et al. 2012a, b, 2013),
although local concentrations within the transition zone may be much higher. In the present study, the
total phytoalexin content added up to approximately 1.7 mg/g dry matter in ARD samples after
14 days, whereas γARD samples accumulated only around 0.2 mg/g dry matter. Rogers et al. (1996)
demonstrated the cytotoxicity of the phytoalexin camalexin in Arabidopsis at concentrations of
0.5 mM and 2.5 mM, whereas phaseolin at 0.05 mM and 0.1 mM was able to kill bean and beet cells
(Glazener and Van Etten 1978; Hargreaves 1980). In our study, individual phytoalexins reached peak
concentrations of 1.9 mM (aucuparin, noraucuparin), hence, cytotoxicity of phytoalexins may play a
role in ARD-affected ‘M26’ plants. More tolerant genotypes may possess the ability to have either a
better control of the phytoalexin production, a different phytoalexin composition or a more potent
detoxification system, as proposed by Henfrey et al. (2015). 3-Hydroxy-5-methoxybiphenyl, aucuparin
and noraucuparin were almost exclusively found in ARD samples and may hence play a superior role
in this regard.
Conclusions
The expression of most analyzed candidate genes was conserved in ‘M26’ after a 7-day-cultivation on
ARD soils of different origin and cropping history, as highlighted by ratios comparable in tendency

54
between ARD and γARD. This supports the suitability of this genotype in testing soils for incidence of
ARD, but information about gene expression also has to be related to soil microbial communities in
ARD soils for full comprehension of the plant responses. Furthermore, this study emphasized the
importance of phytoalexin biosynthesis genes and their role in ARD. Microorganisms inciting the
biotic stress of ARD lead to accumulation of high amounts of phytoalexins in ‘M26’, whose potential
cytotoxicity may evoke cell death, in combination with possibly deadly levels of ROS, and possible
exudation into the soil may influence rhizosphere microbial communities affecting the ARD biome
(Figure 8). Future studies will focus on uncovering the potential toxic effect of these compounds on
the rootstock genotype ‘M26’ and the comparison of the present results with those obtained with other
more tolerant genotypes. Also, the hypotheses of controlled phytoalexin biosynthesis, different
phytoalexin compositions and more efficient detoxification systems in other genotypes have to be
considered, as this information can be used in genomics-assisted breeding for the selection of more
tolerant genotypes. Finally, the possibility of exudation of phytoalexins into the rhizosphere and the
resulting effects of the defense compounds on the microbial communities in the rhizosphere require
further investigations.
References
Ahuja I, Kissen R, Bones AM (2012) Phytoalexins in defense against pathogens. Trends Plant Sci 2:1360-1385.
Atucha A, Emmett B, Bauerle TL (2014) Growth rate of fine root systems influences rootstock tolerance to replant disease. Plant Soil
376:337-346.
Börner H (1959) The apple replant problem. I. The excretion of phloridzin from apple root residues. Contributions of the Boyce Thompson
Institute of Plant Research 20:39-56.
Broekaert WF, Delauré SL, De Bolle MFC, Cammue BPA (2006) The Role of Ethylene in Host-Pathogen Interactions. Annu Rev
Phytopathol 44:393-416.
Caputo F, Nicoletti F, De Luca Picione F, Manici LM (2015) Rhizospheric changes of fungal and bacterial communities in relation to soil
health of multi-generation apple orchards. Biol Control 88:8-17.
Chizzali C, Beerhues L (2012) Phytoalexins of the Pyrinae: biphenyls and dibenzofurans. Beilstein J Org Chem 8:613-620.
Chizzali C, Gaid MM, Belkheir AK, Hänsch R, Richter K, Flachowsky H, Peil A, Hanke MV, Liu B, Beerhues L (2012a) Differential
Expression of Biphenyl Synthase Gene Family Members in Fire-Blight-Infected Apple ‘Holsteiner Cox’. Plant Physiol 158:864-
875.
Chizzali C, Khalil MNA, Beuerle T, Schuehly W, Richter K, Flachowsky H, Peil A, Hanke MV, Liu B, Beerhues L (2012b) Formation of
biphenyl and dibenzofuran phytoalexins in the transition zones of fire blight-infected stems of Malus domestica cv. ‘Holsteiner
Cox’ and Pyrus communis cv. ‘Conference’. Phytochemistry 77:179-185.
Chizzali C, Gaid MM, Belkheir AK, Beuerle T, Hänsch R, Richter K, Flachowsky H, Peil A, Hanke MV, Liu B, Beerhues L (2013)
Phytoalexin formation in fire blight-infected apple. Trees 27:477-484.
Davletova S, Schlauch K, Coutu J, Mittler R (2005) The Zinc-Finger Protein Zat12 Plays a Central Role in Reactive Oxygen and Abiotic
Stress Signaling in Arabidopsis. Plant Physiol 139:847-856.
Dixon RA, Maxwell CA, Ni W, Oommen A, Paiva NL (1994) Genetic Manipulation of Lignin and Phenylpropanoid Compounds Involved in
Interactions with Microorganisms. In: Ellis BE, Kuroki GW, Stafford HA (eds) Genetic Engineering of Plant Secondary
Metabolism. Springer, New York, pp 153-178.
EC 128/2009 (2009) Directive 2009/128/EC of the European Parliament and of the Council of 21 October 2009 establishing a framework for
Community action to achieve the sustainable use of pesticides. Off J Eur Union L309 http://eur-lex.europa.eu/legal-
content/EN/TXT/HTML/?uri=CELEX:32009R1107&from=EN.
El-Sharouny EE (2015) Effect of different soil amendments on the microbial count correlated with resistance of apple plants towards
pathogenic Rhizoctonia solani AG-5. Biotechnol Biotec Eq 29:463-469.

55
Emmett B, Nelson EB, Kessler A, Bauerle TL (2014) Fine-root system development and susceptibility to pathogen colonization. Planta
239:325-340.
Forge T, Neilsen G, Neilsen D (2016) Organically acceptable practices to improve replant success of temperate tree-fruit crops. Sci Hortic-
Amsterdam 200:205-214.
Franke-Whittle IH, Manici LM, Insam H, Stres B (2015) Rhizosphere bacteria and fungi associated with plant growth in soils of three
replanted apple orchards. Plant Soil 395:317-333.
Gastol M, Domagala-Swiatkiewicz I (2015) Mycorrhizal inoculation of apple in replant soils – enhanced tree growth and mineral status. Acta
Sci Pol Hortorum Cultus 14:17-37.
Glazebrook J (2005) Contrasting mechanisms of defense against biotrophic and necrotrophic pathogens. Annu Rev Phytopathol 43:205-22.
Glazener JA, Van Etten HD (1978) Phytotoxicity of phaseollin to, and alteration of phaseollin by, cell suspension cultures of Phaseolus
vulgaris. Phytopathology 68:111-117.
Guo H, Mao Z, Jiang H, Liu P, Zhou B, Bao Z, Sui J, Zhou X, Liu X (2014) Community analysis of plant growth promoting rhizobacteria
for apple trees. Crop Prot 62:1-9.
Hanschen FS, Yim B, Winkelmann T, Smalla K, Schreiner M (2015) Degradation of Biofumigant Isothiocyanates and Allyl Glucosinolate in
Soil and Their Effects on the Microbial Community Composition. Plos One 10:e0132931.
Hargreaves JA (1980) A possible mechanism for the phytotoxicity of the phytoalexin phaseollin. Physiol Plant Pathol 16:351-357.
Henfrey JL, Baab G, Schmitz M (2015) Physiological stress responses in apple under replant conditions. Sci Hortic-Amsterdam 194:111-
117.
Herberich E, Sikorski J, Hothorn T (2010) A Robust Procedure for Comparing Multiple Means under Heteroscedasticity in Unbalanced
Designs. Plos One 5:e9788.
Hewavitharana SS, Ruddell D, Mazzola M (2014) Carbon source-dependent antifungal and nematicidal volatiles derived during anaerobic
soil disinfestation. Eur J Plant Pathol 140:39-52.
Hewavitharana SS, Mazzola M (2016) Carbon Source-Dependent Effects of Anaerobic Soil Disinfestation on Soil Microbiome and
Suppression of Rhizoctonia solani AG-5 and Pratylenchus penetrans. Phytopathology 106:1015-1028.
Hofmann A, Wittenmayer L, Arnold G, Schieber A, Merbach W (2009) Root exudation of phloridzin by apple seedlings (Malus x domestica
Borkh.) with symptoms of apple replant disease. J Appl Bot Food Qual 82:193-198.
Hüttner C, Beuerle T, Scharnhop H, Ernst L, Beerhues L (2010) Differential effect of elicitors on biphenyl and dibenzofuran formation in
Sorbus aucuparia cell cultures. J Agric Food Chem 58:11977-11984.
Kelderer M, Manici LM, Caputo F, Thalheimer M (2012) Planting in the ‘inter-row’ to overcome replant disease in apple orchards: a study
on the effectiveness of the practice based on microbial indicators. Plant Soil 357:381-393.
Khalil MNA, Beuerle T, Müller A, Ernst L, Bhavanam VBR, Liu B, Beerhues L (2013) Biosynthesis of the biphenyl phytoalexin aucuparin
in Sorbus aucuparia cell cultures treated with Venturia inaequalis. Phytochemistry 96:101-109.
Khalil MNA, Brandt W, Beuerle T, Reckwell D, Groeneveld J, Hänsch R, Gaid MM, Liu B, Beerhues L (2015) O-Methyltransferases
involved in biphenyl and dibenzofuran biosynthesis. Plant J 83:263-276.
Liu JJ, Sturrock R, Ekramoddoullah AKM (2010) The superfamily of thaumatin-like proteins: its origin, evolution, and expression towards
biological function. Plant Cell Rep 29:419-436.
Liu ET, Wang GS, Li YY, Shen X, Chen XS, Song FH, Wu SJ, Chen Q, Mao ZQ (2014) Replanting Affects the Tree Growth and Fruit
Quality of Gala Apple. Journal of Integrative Agriculture 13:1699-1706.
Manici LM, Kelderer M, Franke-Whittle IH, Rühmer T, Baab G, Nicoletti F, Caputo F, Topp A, Insam H, Naef A (2013) Relationship
between root-endophytic microbial communities and replant disease in specialized apple growing areas in Europe. Applied Soil
Ecol 72:207-214.
Manici LM, Kelderer M, Caputo F, Mazzola M (2015) Auxin-mediated relationships between apple plants and root inhabiting fungi: impact
on root pathogens and potentialities of growth-promoting populations. Plant Pathol 64:843-851.
Mazzola M, Brown J, Izzo AD, Cohen MF (2007) Mechanism of Action and Efficacy of Seed Meal-Induced Pathogen Suppression Differ in
a Brassicaceae Species and Time-Dependent Manner. Phytopathology 97:454-460.
Mazzola M, Brown J, Zhao X, Izzo AD, Fazio G (2009) Interaction of brassicaceous seed meal and apple rootstock on recovery of Pythium
spp. and Pratylenchus penetrans from roots grown in replant soils. Plant Dis 93:51-57.
Mazzola M, Zhao X (2010) Brassica juncea seed meal particle size influences chemistry but not soil biology-based suppression of individual
agents inciting apple replant disease. Plant Soil 337:313-324.
Mazzola M, Manici LM (2012) Apple Replant Disease: Role of Microbial Ecology in Cause and Control. Annu Rev Phytopathol 50:45-65.

56
Mazzola M, Hewavitharana SS, Strauss SL (2015) Brassica Seed Meal Soil Amendments Transform the Rhizosphere Microbiome and
Improve Apple Production Through Resistance to Pathogen Reinfestation. Phytopathology 105:460-469.
McNamara NP, Black HIJ, Beresford NA, Parekh NR (2003) Effect of acute gamma irradiation on chemical, physical and biological
properties of soils. Applied Soil Ecol24:117-132.
Morrissey JP, Osbourn AE (1999) Fungal Resistance to Plant Antibiotics as a Mechanism of Pathogenesis. Microbio Mol Biol R 63:708-724.
Pearson K (1895) Notes on regression and inheritance in the case of two parents. P Roy Soc A-Math Phy 58:240-242.
Pfaffl MW (2001) A new mathematical model for relative quantification in real-time RT-PCR. Nucleic Acids Res 29:e45.
Porter I, Pizano M, Besri M, Mattner SW, Fraser P (2010) Progress in the global phase out of methyl bromide and the relative effectiveness
of soil disinfestation strategies. Acta Hortic 883:59-66.
R Development Core Team (2008) R: A language and environment for statistical computing. R Foundation for Statistical Computing,
Vienna, Austria. ISBN 3-900051-07-0, URL https://www.r-project.org.
Rogers EE, Glazebrook J, Ausubel M (1996) Mode of action of the Arabidopsis thaliana phytoalexin camalexin and its role in Arabidopsis-
pathogen interactions. Mol Plant Microbe In 9:748-757.
Sellam A, Iacomi-Vasilescu B, Hudhomme P, Simoneau P (2007) In vitro antifungal activity of brassinin, camalexin and two isothiocyanates
against the crucifer pathogens Alternaria brassicicola and Alternaria brassicae. Plant Pathol 56:296-301.
Shin S, Lv J, Fazio G, Mazzola M, Zhu Y (2014) Transcriptional regulation of ethylene and jasmonate mediated defense response in apple
(Malus domestica) root during Pythium ultimum infection. Horticulture Research 1:14053.
Shin S, Zheng P, Fazio G, Mazzola M, Main D, Zhu Y (2016) Transcriptome changes specifically associated with apple (Malus domestica)
root defense response during Pythium ultimum infection. Physiol Mol Plant P 94:16-26.
Shlezinger N, Minz A, Gur Y, Hatam I, Dagdas YF, Talbot NJ, Sharon A (2011) Anti-apoptotic machinery protects the necrotrophic fungus
Botrytis cinerea from host-induced apoptotic-like cell death during plant infection, Plos Pathog 7:e1002185.
Sircar D, Gaid MM, Chizzali C, Reckwell D, Kaufholdt D, Beuerle T, Broggini GAL, Flachowsky H, Liu B, Hänsch R, Beerhues L (2015)
Biphenyl 4-Hydroxylases Involved in Aucuparin Biosynthesis in Rowan and Apple Are Cytochrome P450 736A Proteins. Plant
Physiol 168:428-442.
Spath M, Insam H, Peintner U, Kelderer M, Kuhnert R, Franke-Whittle IH (2015) Linking Soil Biotic and Abiotic Factors to Apple Replant
Disease: a Greenhouse Approach. J Pathol 163:287-299.
Sun J, Zhang Q, Zhou J, Wei Q (2014) Illumina Amplicon Sequencing of 16S rRNA Tag Reveals Bacterial Community Development in the
Rhizosphere of Apple Nurseries at a Replant Disease Site and a New Planting Site. Plos One 9:e111744.
Tewoldemedhin YT, Mazzola M, Mostert L, McLeod A (2011a) Cylindrocarpon species associated with apple tree roots in South Africa and
their quantification using real-time PCR. Eur J Plant Pathol 129:637-651.
Tewoldemedhin YT, Mazzola M, Botha WJ, Spies CFJ, McLeod A (2011b) Characterization of fungi (Fusarium and Rhizoctonia) and
oomycetes (Phytophthora and Pythium) associated with apple orchards in South Africa. Eur J Plant Pathol 130:215-229.
Tukey JW (1949) Comparing Individual Means in the Analysis of Variance. Biometrics 5:99-114.
Volk GM, Chao CT, Norelli J, Brown SK, Fazio G, Peace C, McFerson J, Zhong GY, Bretting P (2015) The vulnerability of US apple
(Malus) genetic resources. Genet Resour Crop Evol 62:765-794.
Wang Y, Pan F, Wang G, Zhang G, Wang Y, Chen X, Mao Z (2014) Effects of biochar on photosynthesis and antioxidative system of Malus
hupehensis Rehd. seedlings under replant conditions. Sci Hortic-Amsterdam 175:9-15.
Wang Y, Fu F, Li J, Wang G, Wu M, Zhan J, Chen X, Mao Z (2016) Effects of seaweed fertilizer on the growth of Malus hupehensis Rehd.
seedlings, soil enzyme activities and fungal communities under replant condition. Eur J Soil Biol 75:1-7.
Weiß S, Bartsch M, Winkelmann W (under revision) Transcriptomic analysis of molecular responses in Malus domestica ‘M26’ roots
affected by apple replant disease. Plant Mol Biol.
Welch BL (1947) The generalization of ‘Student’s’ problem when several different population variances are involved. Biometrika 34:28-35.
Yim B, Smalla K, Winkelmann T (2013) Evaluation of apple replant problems based on different soil disinfection treatments—links to soil
microbial community structure? Plant Soil 366:617-631.
Yim B, Winkelmann T, Ding GC, Smalla K (2015) Different bacterial communities in heat and gamma irradiation treated replant disease
soils revealed by 16S rRNA gene analysis – contribution to improved aboveground apple plant growth? Frontiers Microbiol
6:1224.
Yim B, Hanschen FS, Wrede A, Nitt H, Schreiner M, Smalla K, Winkelmann T (2016) Effects of biofumigation using Brassica juncea and
Raphanus sativus in comparison to disinfection using Basamid on apple plant growth and soil microbial communities at three
field sites with replant disease. Plant Soil 406:389-408.

57
Zhu Y, Fazio G, Mazzola M (2014) Elucidating the molecular responses of apple rootstock resistant to ARD pathogens: challenges and
opportunities for development of genomics-assisted breeding tools. Horticulture Research 1:14043.
3.2. Figures and tables
Figure 1. Response of ‘M26’ plants to γARD and ARD soils. (a) Shoot length development over time. Differences between treatments at one
time point were tested using a Welch Two Sample t-test (means and standard deviations of n0 = 175, n3;10;21;28;35;42;49;56 = 35, n7 = 140,
n14 = 70) with significant differences shown for P < 0.05 (*), P < 0.01 (**) and P < 0.001 (***). Using a Tukey multiple comparisons test,
differences between time points within one treatment were marked with different letters indicating significant differences (P < 0.05, red color
for γARD, blue color for ARD). (b) Overall habitus of plants cultivated in either γARD or ARD soils after 3, 7, 10, 14 and 56 days (end of
experiment) with corresponding root systems.

58
Figure 2. Expression of plant defense genes in γARD and ARD samples analyzed by RT-qPCR. Differences between treatments for ANK1
(a), CHIA (b), DRP (c) and TL1 (d) at one time point were tested using a Welch Two Sample t-test (means and standard deviations of n = 5)
with significant differences shown for P < 0.05 (*), P < 0.01 (**) and P < 0.001 (***). Using a Tukey multiple comparisons test, differences
between time points within one treatment were marked with different letters indicating significant differences (P < 0.05, red color for γARD,
blue color for ARD).
Figure 3. Expression of genes with regulatory functions in γARD and ARD samples analyzed by RT-qPCR. Differences between treatments
for HSP17.1 (a), HSP17.3 (b), HSP18.5 (c), KFB (d), PME41 (e) and SAG101 (f) at one time point were tested using a Welch Two Sample t-
test (means and standard deviations of n = 5) with significant differences shown for P < 0.05 (*), P < 0.01 (**) and P < 0.001 (***). Using a
Tukey multiple comparisons test, differences between time points within one treatment were marked with different letters indicating
significant differences (P < 0.05, red color for γARD, blue color for ARD).

59
Figure 4. Expression of signaling genes in γARD and ARD samples analyzed by RT-qPCR. Differences between treatments for ACO1 (a),
DOF3.5 (b), ERF RAP2.11 (c), ERF1B (d), GASA1 (e), GATAD10 (f), MRH1 (g) NAC25 (h) WIN1 (i) and ZAT12 (j) at one time point were
tested using a Welch Two Sample t-test (means and standard deviations of n = 5, GATAD10 day 3: n = 3) with significant differences shown
for P < 0.05 (*), P < 0.01 (**) and P < 0.001 (***). Using a Tukey multiple comparisons test, differences between time points within one
treatment were marked with different letters indicating significant differences (P < 0.05, red color for γARD, blue color for ARD).

60
Figure 5. Expression of phytoalexin biosynthesis genes in γARD and ARD samples analyzed by RT-qPCR. Differences between treatments
for BIS2 (a), BIS3 (b), BIS4 (c), OMTa (d), OMTb (e), B4Ha (f) and B4Hb (g) at one time point were tested using a Welch Two Sample t-test
(means and standard deviations of n = 5) with significant differences shown for P < 0.05 (*), P < 0.01 (**) and P < 0.001 (***). Using a
Tukey multiple comparisons test, differences between time points within one treatment were marked with different letters indicating
significant differences (P < 0.05, red color for γARD, blue color for ARD).
Figure 6. Total phytoalexin content in mg per g dry matter in γARD and ARD samples. Means and standard deviations of two technical
replicates of one pooled biological replicate are depicted.

61
Figure 7. Proposed biosynthetic pathway of phytoalexins in ‘M26’. Solid arrows represent identified enzymatic reactions whereas broken
arrows mark unidentified enzymatic reactions. Small graphs represent changes in gene expression (square: red color for γARD, blue color for
ARD) for corresponding enzymes (BIS, OMT, B4H) and in content of individual detected compounds (hexagon: dark red color for γARD,
dark blue color for ARD).
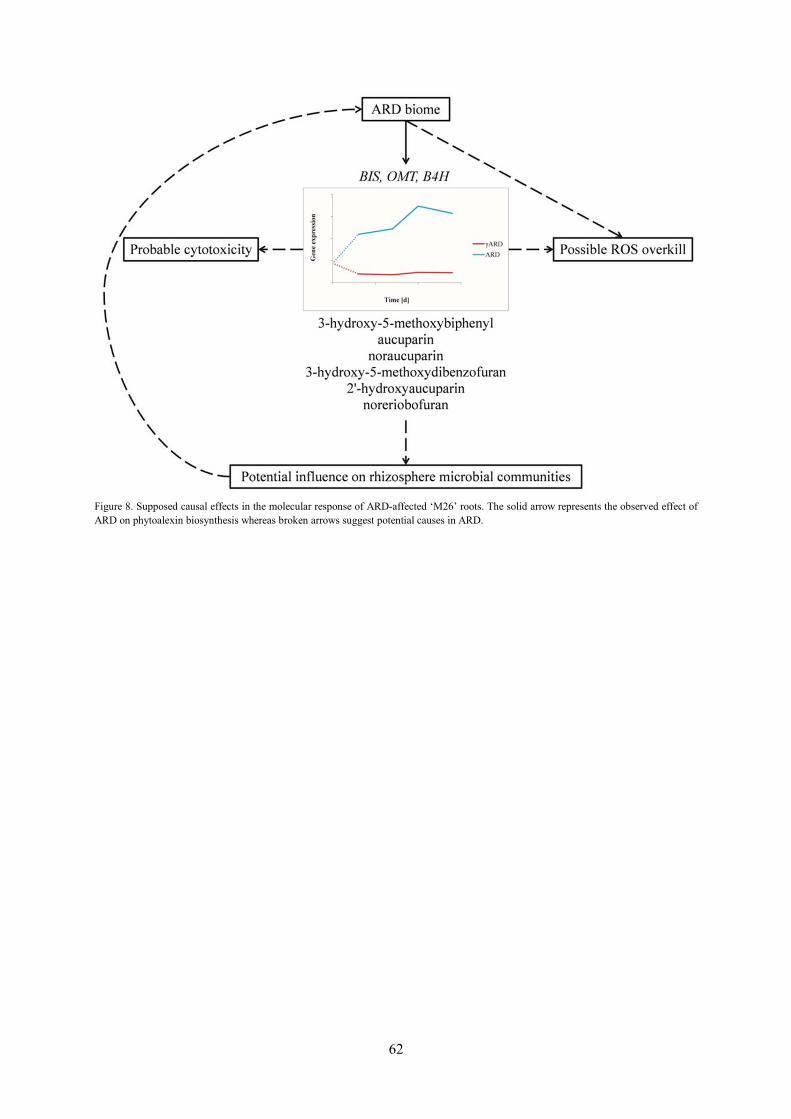
62
Figure 8. Supposed causal effects in the molecular response of ARD-affected ‘M26’ roots. The solid arrow represents the observed effect of
ARD on phytoalexin biosynthesis whereas broken arrows suggest potential causes in ARD.

63
Tab
le 1
. R
elat
ive
gen
e ex
pre
ssio
n l
evel
s an
alyze
d b
y R
T-q
PC
R i
n r
oots
cult
ivat
ed i
n s
oil
s fr
om
dif
fere
nt
nurs
erie
s at
day
7.*
Cla
ss
Gen
e G
en
e n
am
e
Ra
tio s
oil
A
Ra
tio s
oil
K
Ph
yto
ale
xin
bio
syn
thesi
s B
IS
2
bip
hen
yl
syn
tha
se 2
(M
DP
000
071
630
8)
3.6
7*
18.5
**
*
Ph
yto
ale
xin
bio
syn
thesi
s B
IS
3
bip
hen
yl
syn
tha
se 3
(M
DP
000
028
791
9)
4.1
1**
10.5
8*
**
Ph
yto
ale
xin
bio
syn
thesi
s B
IS
4
bip
hen
yl
syn
tha
se 4
(M
DP
000
030
290
5)
3.9
*
23.9
5*
**
Ph
yto
alex
in b
iosy
nth
esis
O
MT
a
caff
eic
acid
3-O
-met
hylt
ran
sfer
ase-
lik
e (M
DP
0000
456
277
) 1
.27
-1.0
9
Ph
yto
ale
xin
bio
syn
thesi
s O
MT
b
caff
eic a
cid
3-O
-meth
ylt
ra
nsf
era
se-l
ike (
MD
P0
000
745
475
) 2
.05**
2.9
6**
*
Ph
yto
ale
xin
bio
syn
thesi
s B
4H
a
cy
toch
rom
e P
45
0 C
YP
736
A12
-lik
e (
MD
P0
000
205
306
) 2
.78**
5.6
2**
*
Ph
yto
ale
xin
bio
syn
thesi
s B
4H
b
cy
toch
rom
e P
45
0 C
YP
736
A12
-lik
e (
MD
P0
000
152
900
) 2
.61**
5.8
3**
*
Pla
nt
def
ense
A
NK
1
ank
yri
n-1
-lik
e (M
DP
00
001
574
04
) -1
.08
1.9
***
Pla
nt
def
en
se
CH
IA
a
cid
ic e
nd
och
itin
ase
-lik
e (
MD
P0
0002
186
91
) 2
.8***
3.2
1**
*
Pla
nt
def
ense
D
RP
d
isea
se r
esis
tance
pro
tein
At4
g27
190
-lik
e (M
DP
000
046
316
6)
-1.1
7
1.0
2
Pla
nt
def
en
se
TL
1
tha
um
ati
n-l
ike p
ro
tein
1a (
MD
P0000
552
328
) 4
.32**
4.8
8*
Reg
ula
tory
fu
nct
ion
HS
P17
.1
17.1
kD
a cl
ass
II h
eat
shock
pro
tein
-lik
e (M
DP
000
070
038
3)
-3.4
9***
1.1
1
Reg
ula
tory
fu
nct
ion
HS
P17
.3
17.3
kD
a cl
ass
II h
eat
shock
pro
tein
-lik
e (M
DP
000
054
806
5)
-3.3
7***
1.7
2*
Reg
ula
tory
fu
nct
ion
HS
P18
.5
18.5
kD
a cl
ass
I h
eat
shock
pro
tein
-lik
e (M
DP
000
075
966
6)
-3.9
***
1.1
3
Reg
ula
tory
fu
nct
ion
KF
B
F-b
ox/k
elch
-rep
eat
pro
tein
At4
g12
810
(M
DP
00
007
086
34
) 6
.29
***
-1.0
8
Reg
ula
tory
fu
ncti
on
P
ME
41
pecti
nest
era
se/p
ecti
nest
era
se i
nh
ibit
or 4
1 (
MD
P0
000
798
70
5)
2.3
9*
3.8
2**
*
Reg
ula
tory
fu
nct
ion
SA
G101
sen
esce
nce
-ass
oci
ated
car
boxyle
ster
ase
101
-lik
e (M
DP
00
008
379
35
) 1
.11
1.7
5***
Sig
na
lin
g
AC
O1
1-a
min
ocy
clo
pro
pa
ne-1
-ca
rb
oxy
late
oxid
ase
ho
mo
log 1
-lik
e (
MD
P0
00
03
144
99
) -2
.35*
*
-1.4
4*
Sig
nal
ing
DO
F3
.5
dof
zin
c fi
nger
pro
tein
DO
F3
.5-l
ike
(MD
P00
003
088
63
) 1
.42
*
1.2
2
Sig
na
lin
g
ER
F1B
eth
yle
ne-r
esp
on
sive t
ran
scrip
tio
n f
acto
r 1B
-lik
e (
MD
P00
001
271
34
) 3
.29**
12.0
3*
**
Sig
na
lin
g
ER
F R
AP
2.1
1
eth
yle
ne-r
esp
on
sive t
ran
scrip
tio
n f
acto
r R
AP
2-1
1-l
ike (
MD
P0
00
017
7547
) -1
2.9
3***
-2.0
7*
*
Sig
na
lin
g
GA
SA
1
gib
ber
elli
n-r
egu
late
d p
ro
tein
1-l
ike (
MD
P0
000
140
078
) -1
.95*
*
-2.6
6*
*
Sig
na
lin
g
GA
TA
D1
0
GA
TA
zin
c f
inger d
om
ain
-co
nta
inin
g p
rote
in 1
0-l
ike (
MD
P0
00
092
2823
) 1
5.0
6*
**
2.2
2*
Sig
nal
ing
MR
H1
LR
R r
ecep
tor-
lik
e se
rin
e/th
reon
ine-
pro
tein
kin
ase
MR
H1
(M
DP
00
003
027
79
) -1
.37
*
-1.0
4
Sig
nal
ing
NA
C25
NA
C t
ran
scri
pti
on
fac
tor
25
-lik
e (M
DP
0000
842
702
) 1
.95
*
1.6
5
Sig
nal
ing
WIN
1
wou
nd
-indu
ced p
rote
in 1
-lik
e (M
DP
00
007
921
01
) -2
.44
***
-1.4
2
Sig
na
lin
g
ZA
T1
2
zin
c fi
nger
pro
tein
ZA
T12
(M
DP
000
059
567
1)
4.1
4**
*
4.7
7**
*
*F
or
norm
aliz
atio
n,
EF
1a
, E
F1
b a
nd
TU
BB
wer
e u
sed
as
refe
ren
ce g
enes
. R
atio
s ar
e re
pre
sen
ted
by t
he
qu
oti
ent
of
AR
D/γ
AR
D w
ith
val
ues
bet
wee
n 0
and
1 b
ein
g t
ran
sform
ed b
y u
sin
g t
he
neg
ativ
e re
cip
roca
l val
ue
of
the
qu
oti
ent.
Dat
a fr
om
Wei
ß e
t al
. (u
nd
er r
evis
ion
) w
as r
ecal
cula
ted
to o
bta
in c
om
par
able
exp
ress
ion
val
ues
and t
he
resu
ltin
g r
atio
s (R
atio
soil
A)
are
com
par
ed t
o r
atio
s at
day
7 f
rom
dat
a ob
tain
ed i
n t
his
stu
dy (
Rat
io
soil
K).
Dif
fere
nce
s b
etw
een
tre
atm
ents
wer
e te
sted
usi
ng a
Wel
ch T
wo S
amp
le t
-tes
t (n
= 5
) w
ith
sig
nif
ican
t dif
fere
nce
s sh
ow
n f
or
P <
0.0
5 (
*),
P <
0.0
1 (
**)
and P
< 0
.00
1 (
***).
Gen
es a
re a
lph
abet
ical
ly o
rder
ed
acco
rdin
g t
o t
hei
r cl
ass.
Bold
pri
nti
ng i
ndic
ates
con
sist
ent
exp
ress
ion b
ehav
ior
bet
wee
n t
he
two s
oil
s.

64
Tab
le 2
. C
han
ges
in p
hyto
alex
in c
onte
nts
(µ
g p
er g
dry
mat
ter)
.*
Co
mp
ou
nd
D
ay 0
D
ay 3
D
ay 7
D
ay 1
0
Da
y 1
4
γAR
D
AR
D
γAR
D
AR
D
γAR
D
AR
D
γAR
D
AR
D
3-h
yd
rox
y-5
-met
hox
yb
iph
enyl
n. d
. n
. d
. 1
1.9
2 ±
16.8
6
n. d
. 1
04
.6 ±
11.6
n
. d
. 9
4.5
6 ±
45.6
9
n. d
. 1
93
.73
± 1
3.5
5
aucu
par
in
n. d
. n
. d
. 5
8.1
3 ±
22.7
8
n. d
. 1
37
.97
± 7
.47
n. d
. 1
14
.41
± 3
9.3
4
n. d
. 4
26
.95
± 1
4.5
6
nora
ucu
par
in
n. d
. 6
.41 ±
9.0
7
79.6
± 3
9.4
n
. d
. 6
8.0
4 ±
96.2
3
n. d
. 9
6.5
8 ±
66.7
5
n. d
. 4
10
.54
± 5
.28
2-h
yd
rox
y-4
-met
hox
yd
iben
zofu
ran
137
.33
± 7
6.6
1
95.7
5 ±
13.3
7
166
.16
± 7
1.6
6
56.2
2 ±
7.5
2
341
.82
± 3
3.1
4
194
.82
± 1
0.5
3
287
.76
± 7
3.9
1
162
.3 ±
7.1
3
64
.82
± 1
8.4
7
2'-
hyd
rox
yau
cup
arin
n
. d
. n
. d
. n
. d
. n
. d
. n
. d
. n
. d
. n
. d
. n
. d
. 1
33
.78
± 1
26
.84
nore
riob
ofu
ran
199
.31
± 1
20
.59
96.8
8 ±
3.7
9
40.7
7 ±
11.7
6
29.8
1 ±
4.1
9
113
.16
± 1
1.7
3
45.6
3 ±
7.6
1
111
.2 ±
21.4
2
n. d
. 1
92
.14
± 5
0.6
7
*V
alu
es i
nd
icat
e m
ean
s an
d s
tand
ard d
evia
tion
s of
two t
ech
nic
al r
epli
cate
s; n
. d. n
ot
det
ecta
ble
.

65
3.3. Supplementary data
Supplementary Figure S1. Correlation of log2 ratios obtained for soil A and soil K at day 7. The log2 ratios of ARD/γARD are shown
(n = 30). Pearson product-moment correlation coefficient calculation with the 30 tested genes resulted in a coefficient of correlation of 0.66
and a coefficient of determination of 0.44 (P < 0.001).
Supplementary Table S1. Properties of soils A and K. Clay [%] Silt [%] Sand [%] Organic matter [%] Water content [%] pH
Soil A 7.4 13.9 78.7 3.7 13.5 3.9
Soil K 3.1 4.3 92.6 4.2 12.6 4.8
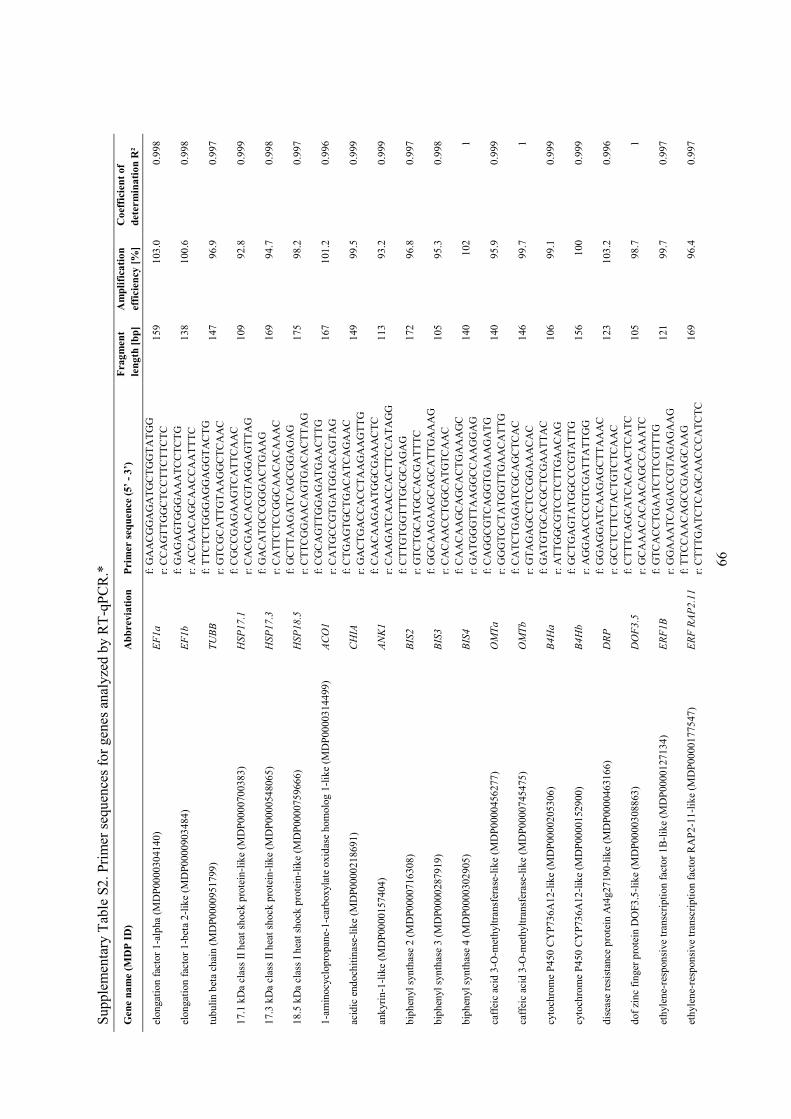
66
Supp
lem
enta
ry T
able
S2. P
rim
er s
equen
ces
for
gen
es a
nal
yze
d b
y R
T-q
PC
R.*
Gen
e n
am
e (
MD
P I
D)
Ab
brevia
tio
n
Prim
er s
eq
uen
ce
(5’
- 3
’)
Frag
men
t
len
gth
[b
p]
Am
pli
fica
tio
n
eff
icie
ncy
[%
]
Co
effi
cien
t of
dete
rm
ina
tio
n R
²
elon
gat
ion
fac
tor
1-a
lpha
(MD
P00
0030
414
0)
EF
1a
f: G
AA
CG
GA
GA
TG
CT
GG
TA
TG
G
r: C
CA
GT
TG
GC
TC
CT
TC
TT
CT
C
159
103
.0
0.9
98
elon
gat
ion
fac
tor
1-b
eta
2-l
ike
(MD
P0
000
903
484
) E
F1b
f: G
AG
AG
TG
GG
AA
AT
CC
TC
TG
r: A
CC
AA
CA
GC
AA
CC
AA
TT
TC
1
38
100
.6
0.9
98
tub
uli
n b
eta
chai
n (
MD
P0
000
951
799
) T
UB
B
f: T
TC
TC
TG
GG
AG
GA
GG
TA
CT
G
r: G
TC
GC
AT
TG
TA
AG
GC
TC
AA
C
147
96.9
0
.997
17.1
kD
a cl
ass
II h
eat
shock
pro
tein
-lik
e (M
DP
000
070
038
3)
HS
P17
.1
f: C
GC
CG
AG
AA
GT
CA
TT
CA
AC
r: C
AC
GA
AC
AC
GT
AG
GA
GT
TA
G
109
92.8
0
.999
17.3
kD
a cl
ass
II h
eat
shock
pro
tein
-lik
e (M
DP
000
054
806
5)
HS
P17
.3
f: G
AC
AT
GC
CG
GG
AC
TG
AA
G
r: C
AT
TC
TC
CG
GC
AA
CA
CA
AA
C
169
94.7
0
.998
18.5
kD
a cl
ass
I h
eat
shock
pro
tein
-lik
e (M
DP
000
075
966
6)
HS
P18
.5
f: G
CT
TA
AG
AT
CA
GC
GG
AG
AG
r: C
TT
CG
GA
AC
AG
TG
AC
AC
TT
AG
1
75
98.2
0
.997
1-a
min
ocy
clop
rop
ane-
1-c
arb
oxyla
te o
xid
ase
hom
olo
g 1
-lik
e (M
DP
00
003
144
99
) A
CO
1
f: C
GC
AG
TT
GG
AG
AT
GA
AC
TT
G
r: C
AT
GC
CG
TG
AT
GG
AC
AG
TA
G
167
101
.2
0.9
96
acid
ic e
nd
och
itin
ase-
lik
e (M
DP
0000
21
869
1)
CH
IA
f: C
TG
AG
TG
CT
GA
CA
TC
AG
AA
C
r: G
AC
TG
AC
CA
CC
TA
AG
AA
GT
TG
1
49
99.5
0
.999
ank
yri
n-1
-lik
e (M
DP
00
001
574
04
) A
NK
1
f: C
AA
CA
AG
AA
TG
GC
GA
AA
CT
C
r: C
AA
GA
TC
AA
CC
AC
TT
CC
AT
AG
G
113
93.2
0
.999
bip
hen
yl
syn
thas
e 2 (
MD
P0
000
716
308
) B
IS2
f: C
TT
GT
GG
TT
TG
CG
CA
GA
G
r: G
TC
TG
CA
TG
CC
AC
GA
TT
TC
1
72
96.8
0
.997
bip
hen
yl
syn
thas
e 3 (
MD
P0
000
287
919
) B
IS3
f: G
GC
AA
GA
AG
CA
GC
AT
TG
AA
AG
r: C
AC
AA
CC
TG
GC
AT
GT
CA
AC
1
05
95.3
0
.998
bip
hen
yl
syn
thas
e 4 (
MD
P0
000
302
905
) B
IS4
f: C
AA
CA
AG
CA
GC
AC
TG
AA
AG
C
r: G
AT
GG
GT
TA
AG
GC
CA
AG
GA
G
140
102
1
caff
eic
acid
3-O
-met
hylt
ran
sfer
ase-
lik
e (M
DP
0000
456
277
) O
MT
a
f: C
AG
GC
GT
CA
GG
TG
AA
AG
AT
G
r: G
GG
TG
CT
AT
GG
TT
GA
AC
AT
TG
1
40
95.9
0
.999
caff
eic
acid
3-O
-met
hylt
ran
sfer
ase-
lik
e (M
DP
0000
745
475
) O
MT
b
f: C
AT
CT
GA
GA
TC
GC
AG
CT
CA
C
r: G
TA
GA
GC
CT
CC
GG
AA
AC
AC
1
46
99.7
1
cyto
chro
me
P4
50
CY
P73
6A
12
-lik
e (M
DP
00
002
053
06
) B
4H
a
f: G
AT
GT
GC
AC
GC
TC
GA
AT
TA
C
r: A
TT
GG
CG
TC
CT
CT
TG
AA
CA
G
106
99.1
0
.999
cyto
chro
me
P4
50
CY
P73
6A
12
-lik
e (M
DP
00
001
529
00
) B
4H
b
f: G
CT
GA
GT
AT
GG
CC
CG
TA
TT
G
r: A
GG
AA
CC
CG
TC
GA
TT
AT
TG
G
156
100
0.9
99
dis
ease
res
ista
nce
pro
tein
At4
g27
190
-lik
e (M
DP
000
046
316
6)
DR
P
f: G
GA
GG
AT
CA
AG
AG
CT
TA
AA
C
r: G
CC
TC
TT
CT
AC
TG
TC
TC
AA
C
123
103
.2
0.9
96
dof
zin
c fi
nger
pro
tein
DO
F3
.5-l
ike
(MD
P00
003
088
63
) D
OF
3.5
f:
CT
TT
CA
GC
AT
CA
CA
AC
TC
AT
C
r: G
CA
AA
CA
CA
AC
AG
CC
AA
AT
C
105
98.7
1
eth
yle
ne-
resp
on
sive
tran
scri
pti
on f
acto
r 1
B-l
ike
(MD
P00
001
271
34
) E
RF
1B
f:
GT
CA
CC
TG
AA
TC
TT
CG
TT
TG
r: G
GA
AA
TC
AG
AC
CG
TA
GA
GA
AG
1
21
99.7
0
.997
eth
yle
ne-
resp
on
sive
tran
scri
pti
on f
acto
r R
AP
2-1
1-l
ike
(MD
P00
001
775
47
) E
RF
RA
P2
.11
f: T
TC
CA
AC
AG
CC
GA
AG
CA
AG
r: C
TT
TG
AT
CT
CA
GC
AA
CC
CA
TC
TC
1
69
96.4
0
.997

67
Gen
e n
am
e (
MD
P I
D)
Ab
brevia
tio
n
Prim
er s
eq
uen
ce
(5’
- 3
’)
Frag
men
t
len
gth
[b
p]
Am
pli
fica
tio
n
eff
icie
ncy
[%
]
Co
effi
cien
t of
dete
rm
ina
tio
n R
²
F-b
ox/k
elch
-rep
eat
pro
tein
At4
g12
810
(M
DP
00
007
086
34
) K
FB
f:
GA
CC
TT
GC
CC
AC
AA
TC
CT
C
r: G
GT
GG
GT
GT
AA
AG
GC
TG
AA
G
145
96.5
1
GA
TA
zin
c fi
nger
dom
ain
-conta
inin
g p
rote
in 1
0-l
ike
(MD
P000
092
282
3)
GA
TA
D10
f: G
CT
CG
TT
TC
TG
GA
GG
AG
TC
r: G
AT
TC
CC
GC
TG
TC
GT
AG
AA
TC
1
53
99.6
0
.998
gib
ber
elli
n-r
egu
late
d p
rote
in 1
-lik
e (M
DP
00
001
400
78
) G
AS
A1
f: C
GT
TG
CA
GC
TG
TG
TT
CC
TC
r: C
AT
CT
GC
AT
GC
CC
GA
AT
AT
GA
G
156
101
.9
0.9
97
LR
R r
ecep
tor-
lik
e se
rin
e/th
reon
ine-
pro
tein
kin
ase
MR
H1
(M
DP
00
003
027
79
) M
RH
1
f: C
GA
GG
TT
TC
AT
GG
TT
GT
TG
r: C
GC
AG
AA
TG
AC
AA
CA
GA
AT
C
163
100
.1
0.9
98
NA
C t
ran
scri
pti
on
fac
tor
25
-lik
e (M
DP
0000
842
702
) N
AC
25
f: C
GT
TG
CC
AC
AA
CC
AC
TA
C
r: C
TC
CC
AT
GT
CA
TC
TG
AT
AT
TC
1
99
100
.8
0.9
95
pec
tin
este
rase
/pec
tin
este
rase
inh
ibit
or
41
(M
DP
00
007
987
05
) P
ME
41
f: C
AA
AC
CC
TA
CA
TA
CT
GC
AA
CT
C
r: G
AT
AC
TT
GT
CC
AC
CA
AG
TT
AA
GG
1
26
99.5
0
.996
sen
esce
nce
-ass
oci
ated
car
boxyle
ster
ase
101
-lik
e (M
DP
00
008
379
35
) S
AG
101
f: C
GT
AA
AC
TA
GC
GA
TG
CA
GA
AG
r: G
GA
CT
CC
TC
CT
TG
TA
CC
AT
TC
1
02
102
.1
0.9
99
thau
mat
in-l
ike
pro
tein
1a
(MD
P000
05
523
28
) T
L1
f: A
CG
GC
TT
CA
AC
TT
GC
CT
AT
G
r: G
CC
GC
TT
TC
AC
TT
GA
AG
TT
G
118
92.5
0
.992
wou
nd
-indu
ced p
rote
in 1
-lik
e (M
DP
00
007
921
01
) W
IN1
f: G
AT
TC
CA
GC
CA
CA
CT
GA
CT
TC
r: C
TC
CC
TG
AA
CT
GA
GT
GA
TC
AA
C
150
96
0.9
99
zin
c fi
nger
pro
tein
ZA
T1
2 (
MD
P00
005
956
71
) Z
AT
12
f: C
AA
GA
AG
CC
GA
AG
CT
AA
TG
C
r: G
TC
CG
AC
CG
TG
AA
CT
CA
AG
1
25
99.2
0
.997
*A
ll p
rim
ers
(f:
forw
ard
, r:
rev
erse
) w
ere
eval
uat
ed i
n a
n a
mp
lifi
cati
on e
ffic
ien
cy t
est
at a
n a
nn
eali
ng t
emp
erat
ure
of
60 °
C (
modif
ied
aft
er W
eiß
et
al. un
der
rev
isio
n).

68
Supp
lem
enta
ry T
able
S3. G
ene
exp
ress
ion l
evel
s an
alyze
d b
y R
T-q
PC
R i
n r
oots
cult
ivat
ed i
n s
oil
s fr
om
dif
fere
nt
nurs
erie
s at
day
7.*
C
lass
G
en
e G
en
e n
am
e (
MD
P I
D)
Exp
ress
ion
γA
RD
±
SD
so
il A
Exp
ress
ion
AR
D ±
SD
soil
A
Exp
ress
ion
γA
RD
±
SD
so
il K
Exp
ress
ion
AR
D ±
SD
soil
K
Ra
tio s
oil
A
Ra
tio s
oil
K
Ph
yto
alex
in
bio
syn
thes
is
BIS
2
bip
hen
yl
syn
thas
e 2 (
MD
P0
000
716
308
) 0
.66 ±
0.6
2
.41 ±
0.5
6
1.1
8 ±
0.3
2
1.8
6 ±
5.7
8
3.6
7*
18.5
***
Ph
yto
alex
in
bio
syn
thes
is
BIS
3
bip
hen
yl
syn
thas
e 3 (
MD
P0
000
287
919
) 2
.18 ±
1.2
5
8.9
5 ±
1.4
4
3.8
2 ±
0.7
5
40.4
± 9
.95
4.1
1**
10.5
8***
Ph
yto
alex
in
bio
syn
thes
is
BIS
4
bip
hen
yl
syn
thas
e 4 (
MD
P0
000
302
905
) 0
.06 ±
0.0
5
0.2
2 ±
0.0
6
0.0
8 ±
0.0
3
1.9
8 ±
0.7
3
.9*
23.9
5***
Ph
yto
alex
in
bio
syn
thes
is
OM
Ta
caff
eic
acid
3-O
-met
hylt
ran
sfer
ase-
lik
e (M
DP
0000
456
277
) 0
.97 ±
0.2
7
1.2
4 ±
0.1
8
2.5
± 0
.45
2.2
9 ±
0.2
8
1.2
7
-1.0
9
Ph
yto
alex
in
bio
syn
thes
is
OM
Tb
caff
eic
acid
3-O
-met
hylt
ran
sfer
ase-
lik
e (M
DP
0000
745
475
) 1
.19 ±
0.4
2
.44 ±
0.3
8
2.8
9 ±
0.6
7
8.5
7 ±
2.1
2
2.0
5**
2.9
6***
Ph
yto
alex
in
bio
syn
thes
is
B4
Ha
cyto
chro
me
P4
50
CY
P73
6A
12
-lik
e (M
DP
00
002
053
06
) 0
.72 ±
0.3
6
2.0
2 ±
0.5
1
0.7
3 ±
0.0
5
4.0
9 ±
0.6
3
2.7
8**
5.6
2***
Ph
yto
alex
in
bio
syn
thes
is
B4
Hb
cyto
chro
me
P4
50
CY
P73
6A
12
-lik
e (M
DP
00
001
529
00
) 0
.85 ±
0.4
2
.22 ±
0.5
7
1.0
4 ±
0.2
1
6.0
5 ±
1.6
3
2.6
1**
5.8
3***
Pla
nt
def
ense
A
NK
1
ank
yri
n-1
-lik
e (M
DP
00
001
574
04
) 0
.54 ±
0.1
0
.5 ±
0.0
5
0.3
8 ±
0.0
6
0.7
2 ±
0.0
9
-1.0
8
1.9
***
Pla
nt
def
ense
C
HIA
ac
idic
end
och
itin
ase-
lik
e (M
DP
0000
21
869
1)
0.2
2 ±
0.0
7
0.6
3 ±
0.1
7
0.2
9 ±
0.1
3
0.9
2 ±
0.2
1
2.8
***
3.2
1***
Pla
nt
def
ense
D
RP
d
isea
se r
esis
tance
pro
tein
At4
g27
190
-lik
e (M
DP
000
046
316
6)
0.1
1 ±
0.0
3
0.1
± 0
.01
0.0
8 ±
0.0
2
0.0
8 ±
0.0
1
-1.1
7
1.0
2
Pla
nt
def
ense
T
L1
thau
mat
in-l
ike
pro
tein
1a
(MD
P000
05
523
28
) 0
.07 ±
0.0
2
0.3
± 0
.15
0.0
3 ±
0.0
3
0.1
4 ±
0.0
6
4.3
2**
4.8
8*
Reg
ula
tory
fu
nct
ion
HS
P17
.1
17.1
kD
a cl
ass
II h
eat
shock
pro
tein
-lik
e (M
DP
000
070
038
3)
0.2
7 ±
0.0
7
0.0
8 ±
0.0
2
0.0
2 ±
0
0.0
2 ±
0
-3.4
9***
1.1
1
Reg
ula
tory
fu
nct
ion
HS
P17
.3
17.3
kD
a cl
ass
II h
eat
shock
pro
tein
-lik
e (M
DP
000
054
806
5)
0.7
9 ±
0.2
3
0.2
4 ±
0.0
8
0.0
4 ±
0.0
1
0.0
7 ±
0.0
2
-3.3
7***
1.7
2*
Reg
ula
tory
fu
nct
ion
HS
P18
.5
18.5
kD
a cl
ass
I h
eat
shock
pro
tein
-lik
e (M
DP
000
075
966
6)
0.0
5 ±
0.0
2
0.0
1 ±
0.0
1
0 ±
0
0 ±
0
-3.9
***
1.1
3
Reg
ula
tory
fu
nct
ion
KF
B
F-b
ox/k
elch
-rep
eat
pro
tein
At4
g12
810
(M
DP
00
007
086
34
) 0
± 0
0
.02 ±
0.0
1
0 ±
0
0 ±
0
6.2
9***
-1.0
8
Reg
ula
tory
fu
nct
ion
PM
E4
1
pec
tin
este
rase
/pec
tin
este
rase
inh
ibit
or
41
(M
DP
00
007
987
05
) 0
± 0
0
.01 ±
0
0 ±
0
0.0
1 ±
0
2.3
9*
3.8
2***
Reg
ula
tory
fu
nct
ion
SA
G101
sen
esce
nce
-ass
oci
ated
car
boxyle
ster
ase
101
-lik
e (M
DP
00
008
379
35
) 1
.69 ±
0.3
2
1.8
6 ±
0.1
4
1.2
4 ±
0.1
6
2.1
7 ±
0.1
7
1.1
1
1.7
5***
Sig
nal
ing
AC
O1
1-a
min
ocy
clop
rop
ane-
1-c
arb
oxyla
te o
xid
ase
hom
olo
g 1
-lik
e (M
DP
00
003
144
99
) 0
.08 ±
0.0
3
0.0
3 ±
0.0
1
0.0
2 ±
0
0.0
2 ±
0
-2.3
5**
-1.4
4*
Sig
nal
ing
DO
F3
.5
dof
zin
c fi
nger
pro
tein
DO
F3
.5-l
ike
(MD
P00
003
088
63
) 0
.01 ±
0
0.0
2 ±
0
0.0
1 ±
0
0.0
1 ±
0
1.4
2*
1.2
2
Sig
nal
ing
ER
F1B
et
hyle
ne-
resp
on
sive
tran
scri
pti
on f
acto
r 1
B-l
ike
(MD
P00
001
271
34
) 0
.01 ±
0
0.0
2 ±
0
0.0
1 ±
0
0.1
1 ±
0.0
3
3.2
9**
12.0
3***
Sig
nal
ing
ER
F R
AP
2.1
1
eth
yle
ne-
resp
on
sive
tran
scri
pti
on f
acto
r R
AP
2-1
1-l
ike
(MD
P00
001
775
47
) 0
.04 ±
0.0
1
0 ±
0
0.0
6 ±
0.0
2
0.0
3 ±
0.0
1
-12
.93
***
-2.0
7**
Sig
nal
ing
GA
SA
1
gib
ber
elli
n-r
egu
late
d p
rote
in 1
-lik
e (M
DP
00
001
400
78
) 0
.32 ±
0.0
5
0.1
7 ±
0.0
6
0.0
3 ±
0.0
1
0.0
1 ±
0
-1.9
5**
-2.6
6**
Sig
nal
ing
GA
TA
D10
GA
TA
zin
c fi
nger
dom
ain
-conta
inin
g p
rote
in 1
0-l
ike
(MD
P000
092
282
3)
0 ±
0
0.0
2 ±
0
0 ±
0.0
1
0.0
1 ±
0
15.0
6***
2.2
2*
Sig
nal
ing
MR
H1
LR
R r
ecep
tor-
lik
e se
rin
e/th
reon
ine-
pro
tein
kin
ase
MR
H1
(M
DP
00
003
027
79
) 0
.03 ±
0.0
1
0.0
2 ±
0
0.0
1 ±
0
0.0
1 ±
0
-1.3
7*
-1.0
4
Sig
nal
ing
NA
C25
NA
C t
ran
scri
pti
on
fac
tor
25
-lik
e (M
DP
0000
842
702
) 0
.01 ±
0
0.0
2 ±
0
0.0
7 ±
0.0
3
0.1
1 ±
0.0
3
1.9
5*
1.6
5
Sig
nal
ing
WIN
1
wou
nd
-indu
ced p
rote
in 1
-lik
e (M
DP
00
007
921
01
) 0
.28 ±
0.0
5
0.1
1 ±
0.0
4
0.0
1 ±
0
0.0
1 ±
0
-2.4
4***
-1.4
2
Sig
nal
ing
ZA
T1
2
zin
c fi
nger
pro
tein
ZA
T1
2 (
MD
P00
005
956
71
) 0
.01 ±
0
0.0
5 ±
0.0
1
0.0
2 ±
0.0
1
0.0
8 ±
0.0
2
4.1
4***
4.7
7***
*F
or
norm
aliz
atio
n,
EF
1a,
EF
1b a
nd T
UB
B w
ere
use
d a
s re
fere
nce
gen
es.
Rat
ios
are
rep
rese
nte
d b
y t
he
qu
oti
ent
of
AR
D/γ
AR
D w
ith b
etw
een
0 a
nd
1 b
ein
g t
ransf
orm
ed b
y u
sin
g t
he
neg
ativ
e re
cip
roca
l val
ue
of
the
qu
oti
ent.
Dat
a fr
om
Wei
ß e
t al
. (u
nd
er r
evis
ion
) w
as r
ecal
cula
ted t
o o
bta
in c
om
par
able
exp
ress
ion
val
ues
. E
xp
ress
ion
val
ues
and
res
ult
ing r
atio
s (R
atio
soil
A)
are
com
par
ed t
o r
atio
s at
day
7 f
rom
dat
a ob
tain
ed i
n t
his
stud
y (
Rat
io s
oil
K).
Dif
fere
nce
s b
etw
een
tre
atm
ents
wer
e te
sted
usi
ng a
Wel
ch T
wo S
amp
le t
-tes
t (n
= 5
) w
ith
sig
nif
ican
t dif
fere
nce
s sh
ow
n f
or
P <
0.0
5 (
*),
P <
0.0
1 (
**)
and
P <
0.0
01
(***).
Gen
es a
re a
lph
abet
ical
ly
ord
ered
acc
ord
ing t
o t
hei
r cl
ass.

69
4. Transcriptome profiling in leaves representing aboveground parts of apple replant disease
affected Malus domestica ‘M26’ plants
Stefan Weiß1, Traud Winkelmann1*
1Leibniz Universität Hannover, Institute of Horticultural Production Systems, Section of Woody Plant
and Propagation Physiology, Herrenhäuser Str. 2, D-30419 Hannover, Germany.
*Corresponding author. Traud Winkelmann, Leibniz Universität Hannover, Institute of Horticultural
Production Systems, Section of Woody Plant and Propagation Physiology, Herrenhäuser Str. 2, D-
30419 Hannover, Germany. Tel.: +49 (0) 511 / 762 3602; Fax: +49 (0) 511 / 762 3608; Email:
Type of authorship First author
Type of article Research article
Contribution to the article Performed the experiments, data analysis and wrote the manuscript
Co-authors contribution Traud Winkelmann conceived and coordinated the project,
participated in interpretation of data and in writing the manuscript
Journal Scientia Horticulturae
Impact factor 1.538
Date of publication May 13, 2017
DOI 10.1016/j.scienta.2017.05.012

70
4.1. Manuscript
Abstract
Frequent replanting causes biotic stress due to an altered soil and rhizosphere biome and results in
apple replant disease (ARD). The disease is expressed by diminished growth and negatively affects
fruit yield and quality. Recent studies aiming at understanding ARD on a molecular level showed that
ARD affected plants suffer from oxidative stress. Genes involved in secondary metabolism reactions
play an important role in the molecular ARD response of roots. Although the root system has to
endure the biotic stress attack in the first place, severe symptoms of ARD can be visualized on
aboveground plant parts. The objective of this study was to examine the transcriptomic response of
leaves representing the metabolically active aboveground parts of ARD challenged apple plants and to
compare results with existing data for roots to generate a more complete picture of ARD affected
molecular reactions. For this, biotic stress response genes induced by ARD in roots were studied in
RT-qPCR analyses using leaves of ARD sensitive ’M26’ plants grown in two ARD soils, also in a
time-dependent approach. Furthermore, an RNA sequencing approach employing MACE (massive
analysis of cDNA ends) for transcriptome profiling was performed in order to identify further leaf
specific candidate genes. RT-qPCR analyses did not reveal major differences in root candidate gene
expression, but MACE indicated the upregulation of common biotic stress response genes. However,
potential systemic oxidative stress occurred and ‘M26’ plants did not develop an effective defense
response to ARD.
Key words: Apple replant disease; biotic stress response; gene expression; MACE (massive
analysis of cDNA ends); Malus domestica; oxidative stress; quantitative RT-PCR; RNA-Seq
Funding
This work was funded by the “Deutsche Forschungsgemeinschaft” (DFG, grant number: GRK 1798/1)
and it was part of the GRK1798 “Signaling at the Plant-Soil Interface".
Acknowledgements
We thank the tree nurseries Alves and Klei in Schleswig-Holstein as well as Dr. Andreas Wrede for
the project cooperation. Furthermore, we are thankful to Simon Richartz and Bunlong Yim as well as
Bärbel Ernst, Ewa Schneider and Friederike Schröder for assistance in the greenhouse experiment.
Anne Herwig, Iris Wienkemeier and Hartmut Wieland from the Institute of Plant Nutrition (Hannover,
Germany) are gratefully acknowledged for the technical support in nutrient analysis.

71
Introduction
Worldwide, replanting apple trees (Malus domestica) in fruit orchards and tree nurseries leads to the
phenomenon known as apple replant disease (ARD) which is expressed by diminished growth already
shortly after planting and negatively affects fruit yield and quality (Mazzola and Manici 2012; Liu et
al. 2014). Biotic stress in the form of soil-borne fungi or oomycetes of the genera Cylindrocarpon
(Tewoldemedhin et al. 2011a; Mazzola and Manici 2012; Manici et al. 2013, 2015; Franke-Whittle et
al. 2015), Rhizoctonia (Tewoldemedhin et al. 2011b; Mazzola and Manici 2012; Manici et al. 2015),
Phytophthora (Tewoldemedhin et al. 2011b; Mazzola and Manici 2012) and Pythium (Tewoldemedhin
et al. 2011b; Mazzola and Manici 2012; Manici et al. 2013) were discussed to be the main driver in
ARD while abiotic factors did not significantly influence the disease etiology (Spath et al. 2015). Due
to ARD, trees start bearing fruits 2-3 years later than unaffected trees and fail to yield amounts
comparable to their healthy counterparts leading to a 50 % reduced profitability throughout the life
span of the orchard (Mazzola 1998; Van Schoor et al. 2009). Mazzola (1998) mentioned that over a
10-year period ARD results in a $40,000-per-acre decrease in return of investment in Washington
State, USA. While the total value of apple production is valued at $2.5 billion in the USA alone
(Brown 2012), both North and South America account for 12.8 % of the worldwide apple production
whereas Europe’s apple production amounts to 20.7 % (FAOSTAT 2014). Hence, although no specific
numbers are available for Europe, ARD is responsible for huge economic losses in Europe as well
because examples of ARD incidences have been reported in Austria, Germany, Italy and Poland
(Manici et al. 2013; Franke-Whittle et al. 2015; Gastol and Domagala-Swiatkiewicz 2015).
Recent studies have shown that phenolic compounds act as antioxidant substances in response
to ARD (Emmett et al. 2014; Henfrey et al. 2015). Although the primary organs being in contact with
ARD are roots, oxidative stress even led to a systemic response of ARD affected plants and tolerant
genotypes may more efficiently detoxify reactive oxygen species (ROS; Henfrey et al. 2015). Roots of
apple seedlings demonstrated an upregulation of genes involved in the secondary metabolism and
differentially expressed genes in hormone metabolism after infection by Pythium ultimum, one of the
important components of ARD (Shin et al. 2014, 2016; Zhu et al. 2014). The importance of secondary
metabolism genes in ARD could also be shown for roots of ARD affected apple rootstock ‘M26’
plants (Weiß et al. 2017). Therein, we analyzed the reaction of apple roots (‘M26’) to ARD soil on the
transcriptomic level. Major differences compared to roots grown in disinfected ARD soil were
observed in terms of a downregulation of several genes in the primary metabolism and an upregulation
of genes involved in stress response, genes with signaling and regulatory function and genes of the
secondary metabolism. In more detail, transcripts of the phytoalexin biosynthesis genes biphenyl
synthases, O-methyltransferases and biphenyl-4-hydroxylases were detected in significantly higher
abundance in roots after 3-7 days of cultivation in ARD soils. Phytoalexin biosynthesis is one way for
plants to cope with biotic stress mainly provoked by fungi (Ahuja et al. 2012). However, we
hypothesized that the ARD sensitive rootstock ‘M26’ cannot exploit the phytoalexin defense

72
mechanism and, rather, results in detrimental conditions for the plant either due to potential toxic
levels of phytoalexins or to shaping of a detrimental microbial community if the phytoalexins were
excreted (Weiß et al. 2017). It was assumed that tolerant rootstocks may better cope with unfavorable
conditions as studies have shown differences in ARD susceptibility between apple rootstocks (St.
Laurent et al. 2010; Auvil et al. 2011).
Even though roots are in direct contact with the soil and the potentially harmful
microorganisms in ARD, severe visible symptoms of ARD can be detected aboveground. Hence, this
study aimed to analyze transcriptomic responses of ARD challenged apple plants in leaves which are
the metabolically active representatives of shoots and to compare the results with the existing data for
roots. The ARD susceptible genotype ‘M26’ was employed as a reliable indicator test plant to detect
ARD in soils (Yim et al. 2013). RT-qPCR analyses were performed with biotic stress response genes
induced by ARD in roots using leaves of plants grown in two ARD soils, also in a time-dependent
approach. The fully sequenced genome of apple (Velasco et al. 2010) enabled the application of
massive analysis of cDNA ends (MACE) for transcriptome profiling in order to detect additional
candidate genes. Hereby, the advantage of MACE compared to more traditional RNA-Seq lies in the
generation of exactly one read of each mRNA leading to accurate quantification (Afonso-Grunz et al.
2015; Afonso-Grunz and Müller 2015; Fondevilla et al. 2015; Simm et al. 2015; Zajac et al. 2015;
Bojahr et al. 2016). Furthermore, MACE exposes the expression of lower abundant transcripts which
cannot be detected by microarrays and RNA-Seq at similar sequence depth (Kahl et al. 2012;
Yakovlev et al. 2014; Zawada et al. 2014; Nold-Petry et al. 2015; Zajac et al. 2015).
Materials and methods
Soil origin and disinfection
Soil for the experiments was collected from two tree nurseries in the area of Pinneberg, Schleswig-
Holstein, Germany at a depth of 0-25 cm from three field plots each. In March 2014, soil A (53° 42’
18.81’’ N, 9° 48’ 16.74’’ E) was obtained for the transcriptomic profiling (TP) experiment. This soil
had the following characteristics: 7.4 % clay, 13.9 % silt, 78.7 % sand, 3.7 % organic matter, 13.5 %
water content and pH 3.9. Apple rootstock plants were grown on this site until 2009, succeeded by
Prunus domestica in 2010, Cydonia oblonga in 2011 and the apple rootstock ‘M4’ in 2012 and 2013
(Yim et al. 2015, 2016). For the time-dependent (TD) experiment, soil K (53° 41’ 58.51’’ N, 9° 41’
34.12’’ E) was acquired in September 2014 with the following characteristics: 3.1 % clay, 4.3 % silt,
92.6 % sand, 4.2 % organic matter, 12.6 % water content and pH 4.8. Cropping history comprised rose
rootstock plants from 1980 to 2011, with crop rotation with Tagetes starting from 2002 and annual
replanting of the apple rootstock ‘M4’ from 2012 (Yim et al. 2015, 2016). Volumes of 18-20 L of
homogenized soil were packed in autoclavable bags (Sarstedt, Nümbrecht, Germany) and half of the
respective soil volumes were sent for disinfection via γ-irradiation (BGS – Beta Gamma Service,
Wiehl, Germany) at a minimum dose of 10 kGy by which actinomycetes, fungi and invertebrates are

73
eliminated (McNamara et al. 2003). After disinfection soil bags were stored at 4 °C for 10 days until
one day before the start of the experiment.
Plant cultivation and harvest
The highly ARD susceptible apple rootstock ‘M26’ (Yim et al. 2013, 2015) was propagated and
rooted in vitro according to Weiß et al. (2017). For the TP experiment, acclimatization of rooted
plantlets lasted four weeks whereas plants for the TD experiment were fully acclimatized after three
and a half weeks. Acclimatized plants were potted in 1 L pots containing either γ-irradiated replant
soil (γARD) or untreated replant soil (ARD). Each pot was supplied with 2 g L-1 of the slow release
fertilizer Osmocote Exact Standard 3-4 M (16-9-12+2MgO+TE, http://www.scottsprofessional.com).
The TP experiment was started in May 2014 and the TD experiment was launched in December 2014.
In May, the conditions in the greenhouse were as follows: 22 °C ± 2.5 °C, 60 % ± 8.7 % relative
humidity and a 16 h photoperiod with additional light (if solar radiation fell below 25 klx, provided by
SONT Philips Master Agro 400W). Plants grown in December faced the following conditions:
19.3 °C ± 1 °C, 57.7 % ± 6.2 % relative humidity and a 16 h photoperiod with additional light (if solar
radiation fell below 25 klx, provided by SONT Philips Master Agro 400W). Irrigation was carried out
by hand on a daily basis as required. Furthermore, for plant protection purposes weekly spraying
against thrips and spider mites was performed according to horticultural practice. Thirty-five plants
per variant were cultivated in the TP experiment of which 25 replicates (= individual plants) per
variant were used for subsequent RNA isolation, five plants were used to record dry mass of shoot and
root material as well as nutrient analysis of shoot material after 7 days, and the remaining five plants
were measured weekly for 56 days to record the shoot length and later on to record dry mass of shoot
and root material as well as nutrient analysis of shoot material. In the TD experiment, five different
time points for RNA isolation were included, namely 0, 3, 7, 10 and 14 days, and for each time point
plant material of 25 replicates (= individual plants) per variant was taken. Together with 10 additional
plants the shoot length was measured. In addition, the dry mass of shoot and root material of five
plants was recorded at each time point as well as at the end of the experiment, plus 35 plants were
measured weekly over the duration of the experiment for a total of 56 days.
For RNA isolation plant material was harvested after 7 days of cultivation in either γARD or
ARD soil for the TP experiment whereas in the TD experiment harvest was performed at days 0
(acclimatized plants before potting), 3, 7, 10 and 14. The three youngest fully developed leaves were
collected from each plant, put into 2 ml tubes (Sarstedt, Nümbrecht, Germany) and frozen in liquid
nitrogen. Until homogenization of plant material, samples were stored at -80 °C.
Nutrient analysis
Nutrient analysis in shoot material of the TP experiment was performed after drying samples in a dry
oven at 70 °C for 3 days. Samples were homogenized using a mixer mill (Mixer Mill MM400, Retsch,
Haan, Germany) for 1 min at 30 Hz. For the analysis five biological replicates were used and 50 mg

74
per sample were weighed into small beakers. The samples were then dry-ashed over night at 480 °C.
After the samples were cooled down, 1 ml of 6 M HCl with 1.5 % (w/v) ClNH4O was added to the
samples for dissolving. After shaking and incubation at room temperature for 5 min, the solution was
diluted with 9 ml ddH2O. The dissolved samples were gently shaken and filtered through filter paper
with a pore diameter of 2 µm. Analysis was done employing an ICP-MS method (Führs et al. 2010).
To measure C, N and S in the samples, 10 to 15 mg of dried plant material was weighed into small tin
vessels and an equal amount of wolfram was added to the samples before they were analyzed with a
CNS method (Kowalenko 2001).
RNA extraction and first strand cDNA synthesis
Leaves of five plants were combined in a biological pool (= biological replicate). In sum, five pools
were analyzed for each soil, variant and time point. Homogenization and cell disruption in liquid
nitrogen cooled steel cups was performed using a mixer mill (Mixer Mill MM400, Retsch, Haan,
Germany) with liquid nitrogen cooled steel beads (ø 1.5 cm) for 1 min at 30 Hz.
Using the InviTrap Spin Plant RNA Mini Kit (Stratec, Birkenfeld, Germany) with an
extraction buffer for phenol containing plants according to the manufacturer’s instructions, RNA was
extracted from 50 mg homogenized leaf material weighed into 2 ml tubes (Sarstedt, Nümbrecht,
Germany). RNA yield and quality were checked by a spectrophotometer (Nanodrop 2000c, Peqlab,
Erlangen, Germany). Genomic DNA was removed via in solution DNA digestion using 1 µg of total
RNA and DNase I (Thermo Scientific, Waltham, MA, USA) according to the manufacturer’s
instructions and the resulting RNA was assessed for integrity on a 1 % agarose gel. Aliquoted RNA
was stored at -80 °C until further proceeding.
First strand cDNA synthesis to reversely transcribe total RNA was performed by employing
the RevertAid First Strand cDNA Synthesis Kit (Thermo Scientific, Waltham, MA, USA) according to
the manufacturer’s instructions with random hexamer primers. Aliquoted cDNA samples for RT-
qPCR analyses were stored at -80 °C.
Primer design and quality check
Primer design of TL1b, KFB1, EIL2, EIL3, IAA8 and PTI5 was comprised of the following
parameters: A primer length of 18-24 bp, a resulting fragment length of 100-200 bp, TM of 57-63 °C,
GC content of 40-60 %, no more than triple repeats (e.g. GGG), GC clamp at the 3’ end but no more
than two times GC in the last five base pairs, no dimers, no self-complementarity and no hairpin
structures. Clone Manager 9 Demo (Sci-Ed Software, Denver, CO, USA) was used to check primers
according to set parameters. Complementary sequences to get reverse primers were obtained from
GeneRunner (Gene Runner, http://www.generunner.net/). Specificity of primers was confirmed in the
Malus x domestica.v1.0-primary.mRNA database (https://www.rosaceae.org). Primer sequences of the
other tested genes were derived from Weiß et al. (2017). All primers were subjected to a quality check
via RT-qPCR efficiency tests to monitor sufficient amplification efficiency and specificity using a

75
real-time PCR cycler (CFX Connect™, Bio-Rad, Hercules, CA, USA). Mixed cDNA samples of equal
amounts of γARD and ARD cDNA were analyzed in a dilution series of 1:10, 1:50, 1:100, 1:500 and
1:1000. The dilution samples were tested with two technical replicates using the iTaq Universal SYBR
Green Supermix (Bio-Rad, Hercules, CA, USA) and 200 nM for each forward/reverse primer at 60 °C
annealing temperature. The protocol for the efficiency tests was as follows: 3 min at 95 °C, followed
by 40 cycles of 10 s at 95 °C and 30 s at 60 °C. The program was ended after a melt curve analysis
from 65 °C to 95 °C with an increment of 0.5 °C for 5 s at each step. Data was recorded with the Bio-
Rad CFX Manager 3.1 software (Bio-Rad, Hercules, CA, USA) and amplification efficiencies were
calculated. Primer pairs with amplification efficiencies of 90-110 % showing specific amplification
according to the melt curve analysis are listed in Table 1.
RT-qPCR gene expression analyses
Candidate genes and reference genes (EF1a, EF1b and TUBB according to expression stability) were
analyzed with a real-time PCR cycler (CFX Connect™, Bio-Rad, Hercules, CA, USA). The 1:10
cDNA dilution was mixed with primer combinations (200 nM for each forward/reverse primer) and
iTaq Universal SYBR Green Supermix (Bio-Rad, Hercules, CA, USA). Data was recorded with the
Bio-Rad CFX Manager 3.1 software (Bio-Rad, Hercules, CA, USA). The protocol for RT-qPCRs was
as follows: 3 min at 95 °C, followed by 40 cycles of 10 s at 95 °C and 30 s at 60 °C. The program was
ended after a melt curve analysis from 65 °C to 95 °C with an increment of 0.5 °C for 5 s at each step.
Five biological replicates and two technical replicates per soil, variant and time point were analyzed
for gene expression. Normalized expression was calculated according to Pfaffl (2001).
Transcriptomic analysis via MACE
MACE (Kahl et al. 2012) was employed for transcriptomic analysis of leaf material obtained in the TP
experiment. Three biological replicates per variant were analyzed after sending extracted RNA to
GenXPro GmbH (Frankfurt am Main, Germany). Data was examined using CLC Genomics
Workbench 8.5.1 (Qiagen, Hilden, Germany). Sequences have been submitted to the NCBI Sequence
Read Archive (SRA) under the accession number SRP097602. Removal of sequenced bases resulting
from cDNA synthesis primers was achieved by using a poly-A adapter (Nold-Petry et al. 2015). The
Malus x domestica.v1.0-primary.mRNA database obtained from https://www.rosaceae.org
(11.11.2014) was downloaded to map trimmed sequences. Parameters for mapping were as follows:
Mismatch cost = 2, insertion cost = 3, deletion cost = 3, length fraction = 0.8, similarity fraction = 0.8,
strand specific = both, maximum number of hits for a read = 10 and expression values = total counts.
Mapped genes present in all three biological replicates of either variant resulted in a data set (referred
to as L3P) which was later used for comparison with root data (genes that were present in both of the
analyzed biological replicates referred to as R2P; modified Weiß et al. 2017) to find shared genes. For
the filtered data set (referred to as FTP), CLC’s implemented Baggerley’s test was used to compare
mapped sequences with a false discovery rate (FDR) adjusted P < 0.05 according to the ratio of ARD

76
to γARD of trimmed read numbers (ARD γARD-1). Resulting ratios were log2 transformed and
mapped sequences were ordered according to their ratio in Excel 2010. In addition, for visualization
purposes ratios were also calculated using γARD as the denominator and values between 0 and 1 were
transformed by multiplying with the negative reciprocal value to attain similar results to a log2
transformation. Negative values indicated a downregulation of transcripts in ARD samples compared
to γARD samples, whereas positive values specified an upregulation of transcripts in ARD samples.
MapMan (Thimm et al. 2004) was used to assign functional categories to transcripts. Corresponding
sequences were blasted using default parameters for BLASTN of NCBI
(https://blast.ncbi.nlm.nih.gov/Blast.cgi?PROGRAM=blastn&PAGE_TYPE=BlastSearch&LINK_LO
C=blasthome) to obtain potential gene functions. MACE data was validated via RT-qPCR (see RT-
qPCR gene expression analyses) with biotic stress response genes induced by ARD in roots (Weiß et
al. 2017) in addition to TL1b, KFB1, EIL2, EIL3, IAA8 and PTI5.
Statistical analyses
The statistics program R 3.3.2 (R Development Core Team 2008) was used for statistical analyses
with log2 transformed data. At a P < 0.05 means of measured or calculated parameters between soil
variants (γARD, ARD) were compared using the Welch Two Sample t-Test (Welch 1947). Using a
Tukey multiple comparisons test adjusted for heterogeneous variances if needed (Tukey 1949;
Herberich et al. 2010) at a P < 0.05, different time points within one soil variant were compared. For
soil A (TP experiment), variables were scaled to unit variance and components were built according to
correlations among variables in a principal component analysis (PCA, Lê et al. 2008). Multivariate
differences between variables were tested using analysis of similarities (ANOSIM) employing
euclidean distance in a permutation test with 9999 permutations (Clarke 1993). Contribution to the
separation of groups by variables was expected at a value > 0.69 % according to R 3.3.2. Genes
exceeding this threshold were analyzed by Past 3.14 (Hammer et al. 2001) in a Pearson product-
moment correlation matrix (Pearson 1895) together with the shoot length of samples. Correlation
between gene expression data obtained at day 7 of the TP experiment (soil A) and the TD experiment
(soil K) was tested using the Pearson product-moment correlation coefficient (Pearson 1895) which
was calculated in Microsoft Excel 2010.
Results
ARD had a negative effect on‘M26’ shoot and root dry mass
Disinfection of ARD soil led to higher shoot and root dry mass of ‘M26’ plants at the end of the
experiment (Fig. 1). At day 56, plants cultivated in soil A had a shoot dry mass of 3.33 ± 0.4 g in
disinfected soil variants which was almost double the mass (= + 85 %) found in ARD variants with
1.8 ± 0.35 g. The root dry mass was also significantly affected as roots of γARD variants weighed
0.73 ± 0.17 g compared to ARD variants with 0.45 ± 0.11 g. Even stronger effects were observed for
plants grown in soil K as shoot dry mass for γARD variants was 3.53 ± 0.39 g (= + 123 %) compared

77
to 1.58 ± 0.23 g for untreated variants. Also the root dry mass differed in soil K with 1.03 ± 0.15 g
recorded for disinfected variants and 0.63 ± 0.14 g for ARD variants. While the dry mass did not differ
at day 7 for both soils the shoot length was already affected at this date in soil K, whereas soil A
revealed significant differences between the variants in their shoot length at day 14 (Supplementary
Table S1).
ARD hardly affected nutrient contents in ‘M26’ plants
Due to the diminished growth of plants cultured in ARD soil A, also a nutrient analysis of shoot
material was performed. The analysis did not demonstrate pronounced differences between plants
grown in either γARD or ARD soil (Table 2). At day 7, only Mg, Na and S were found in slightly
higher concentrations of ARD samples: Disinfected soil resulted in 1.68 ± 0.18 mg/g,
0.81 ± 0.17 mg/g and 3.23 ± 0.3 mg/g dry mass, respectively, whereas ARD samples exhibited
1.96 ± 0.14 mg/g, 1.18 ± 0.18 mg/g and 3.86 ± 0.37 mg/g dry mass, respectively. After 56 days of
cultivation ARD samples demonstrated marginally lower B (0.02 versus 0.03 mg/g dry mass), C
(25.38 versus 27.48 mg/g dry mass) and P (0.83 versus 0.97 mg/g dry mass) concentrations while Ca
(7.37 versus 5.43 mg/g dry mass) and Sr (0.04 versus 0.02 mg/g dry mass) were present in slightly
higher concentrations.
Expression analyses of selected genes by RT-qPCR
The selection of genes included in the RT-qPCR analyses in leaves included first biotic stress response
genes that had been shown to be induced by ARD in roots grown in soil A (Weiß et al. 2017).
Secondly, biotic stress response genes found to be differentially expressed in L3P transcriptomic data
of leaves of plants grown on soil A were added (TL1b, KFB1, EIL2, EIL3, IAA8 and PTI5). A time-
course experiment was performed in soil K to obtain more detailed information on the expression of
the chosen genes over time but also to test for potential conservation of gene expression among ARD
soils with different properties and cropping history at day 7. For RT-qPCR analyses, elongation factor
1-alpha (EF1a), elongation factor 1-beta 2-like (EF1b) and tubulin beta chain (TUBB) were used as
reference genes. Overall, the tested genes demonstrated low expression levels in soil K (Table 3).
Moreover, genes which were strongly affected over time in roots cultivated in soil K showed less
pronounced differences in expression behavior in leaves (Supplementary Fig. S1-2). However, most
phytoalexin biosynthesis genes, although being expressed at a much lower level than in roots, started
to increase in expression at day 14 (Supplementary Fig. S1). Calculating the Pearson product-moment
correlation coefficient showed a significant positive correlation between gene expression in leaves of
plants cultivated in soil A and soil K at day 7 with R = 0.65 and P < 0.01, but none of the selected
genes were significantly regulated at this time point in soil K (Table 3).

78
Transcriptomic profiling of leaves in ARD
Transcriptome profiling was performed via MACE to examine molecular reactions in leaves in
response to ARD in soil A at day 7. Samples were analyzed and resulted in 9 to 14 million reads with
an average length of 109 to 110 bp (Table 4). Approximately 30 % of all reads could be specifically
mapped (unique mapped reads) to the draft genome of apple (Velasco et al. 2010) while 2 % of all
reads matched to more than one sequence. These non-specifically mapped reads were excluded from
further analyses.
In a previous study (Weiß et al. 2017) ARD affected roots cultivated in soil A were analyzed
via MACE. The comparison of differentially expressed genes identified in both tissues (L3P vs. R2P,
see 2.7.) resulted in 40 genes (2.6 %) in γARD samples (of which 30 genes could be matched to NCBI
entries, Supplementary Table S2) and 36 genes (2.7 %) in ARD samples (of which 27 genes could be
matched to NCBI entries, Supplementary Table S3) that were higher expressed in both, roots and
leaves (Fig. 2). Interestingly, while in ARD samples almost the same amount of genes was higher
expressed in leaves and roots (46.6 % and 50.7 %, respectively; Fig. 2B), in root γARD samples
82.2 % of the identified genes were higher expressed compared to leaves with 15.3 % (Fig. 2A) but
none of the shared genes were part of the relevantly contributing genes in the PCA of leaves (Table 5)
and only few were part of the FTP data set (Supplementary Table S4).
To verify the leaf MACE data, the RT-qPCR data set of the selected genes of interest
(Table 1; Table 3) was used. There was a strong correlation between the MACE and RT-qPCR
datasets as indicated by the Pearson product-moment correlation coefficient at R = 0.83 and P < 0.001
pointing to the reliability of the MACE data.
FDR corrected filtering for differential expression at P < 0.05 resulted in 726 genes for further
consideration of which 642 genes could be matched to NCBI entries (FTP data set, Supplementary
Table S4). Compiling genes with at least 2-fold regulation or which were found exclusively in γARD
or ARD samples and which revealed a relevant contribution, spanning all dimensions, to the
separation of γARD and ARD samples in the PCA (ANOSIM: R = 1) resulted in a set of 30 genes
which were associated to MapMan functional categories (Table 5). Captivatingly, only 6 genes
showed relevant contributions and uniqueness in γARD samples or demonstrated high regulations
which included DNA topoisomerase 2-like (ratio: -11.76), heat shock protein 90-2-like (-3.59), protein
RETICULATA-RELATED 1 (-2.16), phospholipase A1-IIdelta-like (only γARD), anthocyanidin 3-O-
glucosyltransferase 5-like (only γARD) and heat shock factor protein HSF30-like (only γARD).
The remaining relevantly contributing genes were found in ARD samples. Here, UDP-glucose
flavonoid 3-O-glucosyltransferase 7-like (14.93) and major allergen Mal d 1-like (14.89) revealed very
high regulations whereas cyclin-D5-1-like and F-box protein SKIP2-like were only induced in ARD
samples. Protein processing genes involved elongation factor 1-gamma-like (2.01), AAA-ATPase
ASD, mitochondrial-like (2.44), mechanosensitive ion channel protein 6 (3.44) and ATP-dependent
zinc metalloprotease FTSH 9 (3.92). Transcription factor HEC2-like (2.08), two-component response

79
regulator ORR9-like (2.43), ethylene-responsive transcription factor ERF113 (2.60), major allergen
Mal d 1-like (3.01) and probable WRKY transcription factor 9 (5.71) mapped to RNA processing
genes. Furthermore, the signaling genes probable high-affinity nitrate transporter 3.2 (3.74), calcium-
binding protein CML27 (2.11) and cysteine-rich receptor-like protein kinase 10 (2.60) as well as the
stress associated gene putative disease resistance protein RGA3 (2.37) were relevantly contributing to
the separation of samples. Additional genes included GDSL esterase/lipase 5-like (2.08), caffeic acid
3-O-methyltransferase-like (2.76), translation initiation factor IF-3-like (2.20), mechanosensitive ion
channel protein 1 (2.23), ABA-inducible protein PHV A1-like (2.52), putative UPF0481 protein
At3g02645 (2.60) and transcription factor PRE6-like (5.69). Half of the contributing genes also
showed a significant correlation to the shoot length (Table 5, Supplementary Fig. S3).
Discussion
Due to the phase-out of fumigants controlling ARD, it has increasingly become more important to
better understand the complex mechanisms in plants suffering from this worldwide phenomenon. Our
recent studies uncovered molecular responses of apple roots dealing with ARD (Weiß et al. 2017).
Roots are in direct contact with the soil and the microorganisms leading to ARD, but the first
observable symptoms can be visualized aboveground as plants faced with ARD show diminished
growth compared to plants cultivated in disinfected ARD soil (Yim et al. 2013, 2015, 2016; Henfrey et
al. 2015; Weiß et al. 2017). Hence, besides probable limitations in water and nutrient uptake due to
root damage, early molecular and physiological changes in affected roots likely trigger signal cascades
leading to this detrimental early growth reduction. This study aimed to examine the transcriptomic
response in leaves of ARD affected apple ‘M26’ plants on ARD soils of different origins,
characteristics and cropping histories to generate a more detailed picture of molecular reactions in the
plant when faced with ARD. The ARD susceptible apple rootstock ‘M26’ was used due to its proven
strong reaction towards ARD (Yim et al. 2013, 2015; Weiß et al. 2017) as well as the need to
investigate molecular ARD reactions in a challenged genotype.
ARD induced growth reduction of apple rootstock ‘M26’
As shown in previous studies (Yim et al. 2013, 2015; Weiß et al. 2017), ARD affected apple rootstock
‘M26’ plants were shorter in shoot length (Supplementary Table S1) and, furthermore, revealed lower
biomass after 56 days of cultivation (Fig. 1). While plants grown on soil A showed significant shoot
length differences between variants after 14 days of cultivation, ‘M26’ plants cultivated in soil K were
already significantly affected after 7 days (Supplementary Table S1). This observation leads to the
conclusion that soil K was more severely affected by ARD. In addition, this point gets emphasized by
the observation that plants in soil K were taller in the beginning but smaller at the end of the
experiment compared to plants cultivated in soil A. However, it has to be noted that experiments
employing soil A were conducted in summer 2014 whereas soil K was used in winter 2014. Even
though plants were cultivated under greenhouse conditions, mean temperatures differed about 3 °K

80
between seasons. Nevertheless, γ-irradiation of soils was obviously able to effectively eliminate
unfavorable microorganisms from ARD soils as shown by majorly improved overall growth.
Microbial community shifts in disinfected soil can potentially improve growth via increasing genera
with conceivably beneficial features (Yim et al. 2015). Moreover, abiotic factors in the form of
changes in nutrient contents leading to the observed growth differences may be excluded as shoot
material grown in soil A did not show differences regarding nutrient contents between variants
(Table 2, ANOSIM: R = 0.048) which is in line with results reported earlier (Spath et al. 2015).
Comparison of ARD challenged ‘M26’ leaves in soil A and soil K
Genes that had been selected due to their regulation in ARD affected roots or their involvement in
biotic stress response were found to be expressed on a much lower level and only with minor
differences between ARD and disinfected ARD soil compared to roots (Table 3). In soil A, only
HSP17.1, HSP17.3 and HSP18.5 were significantly regulated. The same HSP genes were also
significantly downregulated in ARD affected roots of apple rootstock ‘M26’ plants (Weiß et al. 2017).
On the one hand, this could potentially highlight their importance in maintaining metabolism and
growth as they were positively correlated with the shoot length (Weiß et al. 2017) and it emphasizes
the significance of these genes in protein stabilization and refolding of proteins under stressful
conditions (Hüttner and Strasser 2012; Park and Seo 2015) as well as their contribution to innate
immunity (Liu and Howell 2010; Park and Seo 2015). However, on the other hand, it has to be
mentioned that plants for the TP experiment were collected in summer, and one day before harvest as
well as on the collection day temperatures were 3 to 5 K higher compared to the days before. This
could actually mean that the expression of HSP genes were indeed a reaction to heat stress, which
seemed to be impeded then under ARD conditions.
The candidate genes used here were involved in phytoalexin biosynthesis, plant defense,
regulatory function and signaling which are often related to biotic stress response and which showed
strong reactions in roots of ARD plants (Weiß et al. 2017). We were interested if these genes also were
expressed in a systemic response in leaves as ARD challenged plants react with a systemic response –
roots are in direct contact with the biotic stress but aboveground tissue is negatively affected as well –
however, this has to be negated for most cases based on the findings of our study. One indication for a
delayed systemic response might be deduced from the increase of many phytoalexin genes starting at
days 10-14 (Supplementary Fig. S1). Overall, the results point to the analyzed genes playing a major
role in ARD reaction of roots but not of leaves.
Gene expression in leaves was also compared for plants grown in soil A with those in soil K in
order to identify genes of conserved expression patterns among soils with differing origins, soil
characteristics and cropping histories. Results of gene expression analyses in root materials suggested
mostly a conservation of expression of these candidate genes between the same two soils, but few
genes were found to be soil-specifically expressed (Weiß et al. in preparation). At day 7, only a low

81
positive correlation between gene expression in leaves of plants cultivated in soil A and soil K
(R = 0.65 and P < 0.01) could be determined but it has to be noted that none of the selected genes was
significantly regulated at this time point in soil K (see above).
Transcriptomic response of ARD challenged ‘M26’ leaves in soil A
To identify early affected molecular reactions involved in ARD, the harvest time point for
transcriptomic profiling in soil A was set to 7 days after planting. In addition, stress reactions due to
repotting of plants after acclimatization should not impede reactions to soil treatments. Furthermore,
transcriptomic changes as a response to ARD could be detected already after 7 days in roots of ‘M26’
plants (Weiß et al. 2017) and therefore leaves were analyzed in the early stages of ARD as well.
MACE was employed as the method of choice, because it allows for exact quantification of transcripts
and detection of low abundant transcripts (see introduction). For example in human samples more than
200 million reads are prerequisite to identify a complete transcriptome with all potential isoforms
using RNA-Seq while MACE discovers all conceivable isoforms with less than 10 million reads and
therefore presents a resourceful deep-sequencing method for transcriptome profiling (Zajac et al.
2015). In this study, MACE generated parameters within ranges also reported for other studies: The
number of reads with 9 to 14 million (Table 4) was higher in comparison to tomato pollen with 3 to 6
million reads (Bokszczanin et al. 2015) and similar to tomato leaves with 12 to 15 million reads
(Fragkostefanakis et al. 2015) while in apple roots the number of reads ranged from 12 to 22 million
(Weiß et al. 2017). Hence, an appropriate coverage was achieved. Furthermore, the aforementioned
studies showed percentages of mapped reads for apple roots with 32 % and tomato pollen with 30 to
45 % which is similar to the reported 30 % in this study and higher compared to tomato leaves with 10
to 11 %. The average length of trimmed reads between 109 and 110 bp was higher compared to
previous reports stating a range of 50 to 100 bp (Kahl et al. 2012; Müller et al. 2014; Zajac et al.
2015).
RT-qPCR gene expression data validated MACE data as tested candidate genes were
regulated with the same tendency as indicated by the Pearson product-moment correlation coefficient
(R = 0.83, P < 0.001). A relatively small proportion of 2.6-2.7 % of all differentially expressed genes
found in roots of ARD affected apple rootstock ‘M26’ plants (Weiß et al. 2017) was also found in leaf
material (Fig. 2). Especially for genes with higher expression in γARD samples in leaf and root
material, it was striking that 16 out of 30 genes were HSP genes or transcription factors. Their
downregulation in ARD samples then would point to an impaired abiotic stress response as plants
were already occupied in dealing with biotic stress due to ARD. To exclude this possible abiotic stress
factor, future experiments should be performed in winter or in climate chambers where controlled
conditions can be better established. In this regard, also the presence of two multiprotein-bridging
factor 1c-like genes which were higher expressed in γARD samples of leaf and root material point to

82
this fact as it could be shown that transgenic plants expressing this gene were more tolerant to
environmental stress including biotic stress (Suzuki et al. 2005).
Impaired stress response and potential oxidative stress in ARD affected plants
In total 726 genes passed the filtering for false positives (FDR at P < 0.05, FTP data set,
Supplementary Table S4) and 30 genes of these showed a relevant PCA contribution and were used
for MapMan classification. Here, ARD samples involved genes in protein processing, RNA processing
and signaling (Table 5). These classes represent the oft-enunciated responses to biotic stress
(Broekaert et al. 2006; Sato et al. 2010; Tsuda and Katagiri 2010; Ahuja et al. 2012; Shin et al. 2014;
Zhu et al. 2014). In this regard, the 2.01 upregulation of elongation factor 1-gamma-like responsible
for protein synthesis is a first hint at stressful conditions for ARD plants but also the 2.08 times
upregulation of GDSL esterase/lipase 5-like which, due to its multifunctionality, also acts in biotic
stress response (Chepyshko et al. 2012). Also the stress associated gene putative disease resistance
protein RGA3 which was 2.37 times upregulated further hints at stressful conditions in ARD soils. It
has been reported that plants try to alleviate detrimental conditions by increased protein synthesis
(Kosová et al 2011) and the 2.20-fold upregulation of the translation initiation factor IF-3-like as well
as the induced F-box protein SKIP2-like gene which is involved in protein ubiquitination as part of
protein modification under biotic stress support this fact (Ul Hassan et al. 2015). Even the 3.92-fold
upregulation in ARD samples of ATP-dependent zinc metalloprotease FTSH 9 could hint at stress
responses in ARD soil as proteins could be degraded at a higher rate and it was discussed that protein
degradation is upregulated under stress due to protein modification as a reaction to oxidative stress
(Berlett and Stadtman 1997; Bartels and Sunkar 2005). AAA-ATPase ASD, mitochondrial-like which
has also been reported to act as a metalloprotease (Baek et al. 2011) was upregulated 2.44 times as
well but this gene also shows a response to abscisic acid (ABA) and acts in hypersensitive responses
(Baek et al. 2011) which would be in line as a typical response to biotic stress (Zhu et al. 2014).
Moreover, an ABA-inducible protein PHV A1-like was 2.52 times upregulated in ARD samples and
potentially hints at ABA being involved in the insufficient defense response in ‘M26’ plants. ABA is
reported commonly to play a role in biotic (as well as abiotic) stress responses (Zhu et al. 2014). This
already hints at the large amount of energy that ARD challenged ‘M26’ plants have to invest into
defense mechanisms, hence, less energy is available for plant growth resulting in the diminished
habitus of these plants compared to γARD variants. This so called immunity growth tradeoff implied
by either induced or constitutive resistance, which begs the question if the cost-benefit for growth
under induced resistance is better for the plant than constitutive resistance (Heil and Baldwin 2002),
obviously has no advantage for the induced non-working defense of the susceptible genotype ‘M26’.
An additional sign of biotic stress could be due to the upregulation of two mechanosensitive
ion channel protein genes. Increase of calcium ions is one of the early signaling mechanisms in plants
to respond to biotic stress (Kurusu et al. 2010). For transport through membranes, ion channels are

83
responsible and in our study we observed two genes being upregulated 2.23 and 3.44, respectively,
namely the mechanosensitive ion channel protein 1 and 6. It has been shown that cytosolic calcium
ions increased after elicitation with fungal elicitor Pep-25 in Arabidopsis thaliana which led to an
oxidative burst (Hu et al. 2009), and in our study we found the 2.11 upregulation of probable calcium-
binding protein CML27. Another sign of affected membranes in ARD samples is the 2.60 upregulation
of putative UPF0481 protein At3g02645 acting as transmembrane protein with unknown function
according to UniProt.
Another typical response to stress is nitrate reallocation from leaves to roots (Chen et al. 2012)
which in this study may be hinted at as well by the 3.74 times higher expression of high-affinity nitrate
transporter 3.2. Low nitrate concentrations can induce nitric oxide formation (Modolo et al. 2005)
which is a common signaling molecule in biotic stress response (Zhu et al. 2014). In addition, it could
be shown that the nitrate high affinity transport system is used for systemic signaling for
environmental sensing and signal transduction from roots to shoots to combine plant growth and
nutrient availability (Little et al. 2005; Krouk et al. 2010; Gojon et al. 2011).
WRKY transcription factors often are upregulated under biotic stress and play an important
role in the plant innate immune system (Rushton et al. 2010; Chi et al. 2013). Here, probable WRKY
transcription factor 9 was 5.71 times higher expressed in ARD samples. Higher transcript abundance
of WRKY transcription factors was also found in Erwinia amylovora infected apple plants (Kamber et
al. 2016). Just as kinases can be involved in signal transduction pathways triggered by biotic stress
(Afzal et al. 2008; Shin et al. 2016) – here, cysteine-rich receptor-like protein kinase 10 was
upregulated 2.60 times – WRKY transcription factors are also part of signal transduction pathways via
regulation of other WRKY transcription factors but also hormones that play a vital role in biotic stress
response such as ethylene – here, the ethylene-responsive transcription factor ERF113 was 2.60 times
upregulated – jasmonic and salicylic acid which in turn coincidences with the generation of ROS
(Bakshi and Oelmüller 2014). It could be shown that ARD affected apple plants suffer from oxidative
stress resulting in a systemic response towards ARD (Henfrey et al. 2015), which may be an
explanation of probable WRKY transcription factor 9 being higher expressed in leaves of this study.
The involvement of genes in ROS signaling was also highlighted by two major allergen Mal d
1-like genes which showed 3.01 and 14.89 times higher expression in ARD samples, respectively, and
belong to the class of genes responsible for the expression of pathogenesis-related (PR) proteins, in
particular PR-10 (Fernandes et al. 2013). PR-10 proteins are formed upon biotic stress response
amongst others and help in general defense mechanisms serving a protective role as they are invoked
and accumulate around infection sites by bacteria and fungi plus they are induced by oxidative stress
as well (Fernandes et al. 2013).
Transcriptomic results of ARD challenged roots suggested that phytoalexin biosynthesis may
potentially increase the overall oxidative stress provoked by ARD microorganisms as a failed defense
response which in turn may have led to other genes involved in scavenging ROS being higher

84
expressed under ARD conditions as well (Weiß et al. 2017). In this context, caffeic acid 3-O-
methyltransferase-like was upregulated 2.76 times in ARD leaf samples. It is potentially involved in
phytoalexin biosynthesis as an isoform leading to biphenyl and dibenzofuran production (Khalil et al.
2015). Since other phytoalexin biosynthesis genes were observed to be upregulated starting from
day 14 (Supplementary Fig. S1), analyses of phytoalexin contents in leaves of plants subjected to
ARD should be conducted starting at this time point.
Studies examining the transcriptomic response of apple seedling to the infection with P.
ultimum, which is one of the many potential causal agents of ARD, revealed genes functioning in ROS
and antioxidant metabolism as well as kinase signaling (Shin et al. 2016). It was suggested that
ascorbate and glutathione as part of ROS scavenging systems may potentially be involved in ARD as
well. In our previous studies working with the same soil and roots, it could be shown that genes
associated to the ascorbate and glutathione redox systems were upregulated in ARD samples leading
to the assumption that a non-sufficient ROS scavenging system in the ARD susceptible rootstock
‘M26’ might be participating in the strong negative response of plants in ARD soil (Weiß et al. 2017).
Henfrey et al. (2015) were able to show that ARD affected apple seedlings demonstrated a systemic
response regarding ROS scavenging as application of additional stress in leaves did not further
increase the level of oxidative stress which may serve as an explanation why leaves analyzed in this
study demonstrated upregulation of two major allergen Mal d 1-like genes in leaves when only roots
were in direct contact with biotic stressors. Furthermore, the 14.93 times upregulation of UDP-glucose
flavonoid 3-O-glucosyltransferase 7-like in ARD samples emphasizes this point. This gene is involved
in anthocyanin production and anthocyanins have been reported to act in defense against pathogens as
antimicrobial metabolites and exhibiting antioxidant activity (Vanderauwera et al. 2005; Shih et al.
2007; Hu et al. 2011). This further gets supported by the fact that RNA processing seemed to be
affected as well, as shown by the 2.08 and 5.69 upregulation of transcription factor HEC2-like and
transcription factor PRE6-like, respectively, as part of the bHLH (basic/helix-loop-helix) transcription
superfamily and its involvement in regulation of transcription (Toledo-Ortiz et al. 2003). One
prominent member of this family is the R gene product Lc which participates in anthocyanin synthesis
in maize (Ludwig et al. 1989). However, anthocyanidin 3-O-glucosyltransferase 5-like was only
induced in γARD samples which either shows the inconsistent response of ARD challenged ‘M26’
plants or points to possible misannotations of genes in the apple genome.
Interestingly, regulation of transcription could also be found for the 2.43 upregulated two-
component response regulator ORR9-like which is involved in the cytokinin-activated signaling
pathway according to UniProt. It was already discussed that cytokinin signaling may play an
exceptional role in the defense response in apple roots defending against P. ultimum which is also
involved in ARD (Shin et al. 2016). In regard of root to shoot signaling this represents an interesting
aspect of ARD reactions as cytokinin reportedly interacts with other signal transduction pathways in

85
regulatory networks including biotic stress responses involving salicylic acid signaling (Argueso et al.
2009; Choi et al. 2010, 2011; Hwang et al. 2012).
The diminished shoot length of ARD samples may already explain that protein
RETICULATA-RELATED 1 involved in differential development of bundle sheath and mesophyll
cell chloroplasts (Kinsman and Pyke 1998) was downregulated 2.16 times in ARD samples.
Additionally, a phospholipase A1-IIdelta-like gene was found to be expressed only in γARD samples.
Phospholipases participate in the phospholipid metabolism and are vital signaling molecules (Xu et al.
2016). Furthermore, phospholipases play a major role in jasmonic acid production through release of
linolenic acid from membrane lipids (Narváez-Vásquez et al. 1999; Ishiguro et al. 2001).
In addition, the transcriptional regulatory system of ARD plants may have been negatively
affected by ARD as DNA topoisomerase 2-like was 11.76 times downregulated and is involved in
DNA replication and transcription (Lodish et al. 2000). It has been reported that stress signals result in
blocking important metabolic processes including DNA replication, transcription, mRNA export and
translation until the cells recover (Biamonti and Caceres 2009). Moreover, topoisomerase activity
controls supercoil structures at the 3′ end of genes and thereby contributes to nucleosome disassembly
and efficient transcription termination while decreased activity leads to a less accessible chromatin
structure, hence, obstructing signals for transcript termination (Durand-Dubief et al. 2011). In this
regard it is interesting that cell division was affected as shown by the induction of cyclin-D5-1-like in
ARD samples. The function of the cell division cycle is to allocate copies of the genome to daughter
cells and genome instability would occur if cells initiate mitosis when chromosomes are only partially
replicated leading to cell death (Rhind and Russell 2012). Nevertheless, it was also reported that one
of the plant’s defense strategies is priming which is defined as the activation of faster and stronger
defense signals through potentiating the basal immune system which might be facilitated by chromatin
remodeling (Conrath 2011; Camañes et al. 2012). The downregulation of DNA topoisomerase 2 in
ARD samples, therefore, might indicate a suppression of this defense mechanism in ‘M26’ plants
faced with ARD.
In ARD samples the heat shock protein 90-2-like gene was downregulated 3.59 times and the
heat shock factor protein HSF30-like was only induced in γARD samples. As mentioned earlier, this
could emphasize the importance of HSP genes in maintaining metabolism and growth as well as
protein stabilization and refolding of proteins under stressful conditions (Hüttner and Strasser 2012;
Park and Seo 2015) plus their contribution to innate immunity (Liu and Howell 2010; Park and Seo
2015) but due to higher temperatures before and at harvest the expression of HSP genes could also
mean a reaction to heat stress.
Conclusion
This study aimed at a better understanding of ARD on a molecular level in the whole plant to get a
more complete picture of the disease etiology. Although plants react with a systemic response to ARD

86
as indicated by diminished shoot growth while the roots are in direct contact with the biotic stressors,
analyzed genes did not show a systemic response in below- and aboveground tissue of the same age.
However, phytoalexin biosynthesis genes hint at a delayed systemic response on the transcriptomic
level. Nevertheless, indications have been found that ARD challenged ‘M26’ plants react to the biotic
stress in the form of potential systemic oxidative stress. Many genes involved in biotic stress reactions
have been found but the obvious lack of their effect leads to the assumption that ARD challenged
‘M26’ plants cannot fully take advantage of the defense mechanisms leading to the observed growth
depressions in ARD variants as discussed in the aspect of immunity growth tradeoff. Future studies
should investigate the expression of the differentially regulated genes identified in the transcriptomic
analysis in more detail as they represent an interesting starting point to understand molecular data
found for ARD roots and leaves. Furthermore, testing the hypothesis of more efficient detoxification
systems in tolerant genotypes may later be used in marker-assisted breeding for more tolerant
genotypes.
References
Afonso-Grunz F, Hoffmeier K, Müller S, Westermann AJ, Rotter B, Vogel J, Winter P, Kahl G (2015) Dual 3’Seq using deepSuperSAGE
uncovers transcriptomes of interacting Salmonella enterica Typhimurium and human host cells. BMC Genomics 16:323.
Afonso-Grunz F, Müller S (2015) Principles of miRNA–mRNA interactions: beyond sequence complementarity. Cell Mol Life Sci 72:3127-
3141.
Afzal AJ, Wood AJ, Lightfoot DA (2008) Plant Receptor-Like Serine Threonine Kinases: Roles in Signaling and Plant Defense. Mol Plant
Microbe In 5:507-517.
Ahuja I, Kissen R, Bones AM (2012) Phytoalexins in defense against pathogens. Trends Plant Sci 2:1360-1385.
Argueso CT, Ferreira FJ, Kieber JJ (2009) Environmental perception avenues: the interaction of cytokinin and environmental response
pathways. Plant Cell Environ 32:1147-60.
Auvil TD, Schmidt TR, Hanrahan I, Castillo F, McFerson JR, Fazio G (2011) Evaluation of dwarfing rootstocks in Washington apple replant
sites. Acta Hort 903:265-271.
Baek K, Seo PJ, Park CM (2011) Activation of a Mitochondrial ATPase Gene Induces Abnormal Seed Development in Arabidopsis. Mol
Cells 31:361-369.
Bakshi M, Oelmüller R (2014) WRKY transcription factors. Plant Signaling & Behavior 9:e27700.
Bartels D, Sunkar R (2005) Drought and Salt Tolerance in Plants. CRC Cr Rev Plant Sci 24:23-58.
Berlett BS, Stadtman ER (1997) Protein Oxidation in Aging, Disease, and Oxidative Stress. J Biol Chem 272:20313-20316.
Biamonti G, Caceres JF (2009) Cellular stress and RNA splicing. Trends Biochem Sci 34:146-153.
Bojahr J, Nhengiwa O, Krezdorn N, Rotter B, Saal B, Ruge-Wehling B, Struck C, Winter P (2016) Massive analysis of cDNA ends (MACE)
reveals a co-segregating candidate gene for LpPg1 stem rust resistance in perennial ryegrass (Lolium perenne). Theor Appl Genet
129:1915-1932.
Bokszczanin KL, Krezdorn N, Fragkostefanakis S et al. (2015) Identification of novel small ncRNAs in pollen of tomato. BMC Genomics
16:714.
Broekaert WF, Delauré SL, De Bolle MFC, Cammue BPA (2006) The Role of Ethylene in Host-Pathogen Interactions. Annu Rev
Phytopathol 44:393-416.
Brown S (2012): Apple. In: Badenes ML, Byrne DH, eds. Fruit Breeding. Springer:329-367.
Camañes G, Pastor V, Cerezo M, García-Andrade J, Vicedo B, García-Agustín P, Flors V (2012) A Deletion in NRT2.1 Attenuates
Pseudomonas syringae-Induced Hormonal Perturbation, Resulting in Primed Plant Defenses. Plant Physiol 158:1054-1066.
Chen CZ, Lv XF, Li JY, Yi HY, Gong JM (2012) Arabidopsis NRT1.5 Is Another Essential Component in the Regulation of Nitrate
Reallocation and Stress Tolerance. Plant Physiol 159:1582-1590.
Chepyshko H, Lai CP, Huang LM, Liu JH, Shaw JF (2012) Multifunctionality and diversity of GDSL esterase/lipase gene family in rice
(Oryza sativa L. japonica) genome: new insights from bioinformatics analysis. BMC Genomics 13:309.

87
Chi Y, Yang Y, Zhou Y, Zhou J, Fan B, Yu JQ, Chen Z (2013) Protein–Protein Interactions in the Regulation of WRKY Transcription
Factors. Mol Plant 6:287-300.
Choi J, Huh SU, Kojima M, Sakakibara H, Paek KH, Hwang I (2010) The cytokinin-activated transcription factor ARR2 promotes plant
immunity via TGA3/NPR1-dependent salicylic acid signaling in Arabidopsis. Dev. Cell 19:284-95.
Choi J, Choi D, Lee S, Ryu CM, Hwang I (2011) Cytokinins and plant immunity: old foes or new friends? Trends Plant Sci.16:388-94.
Clarke KR (1993) Non-parametric multivariate analysis of changes in community structure. Aust J Ecol 18:117-143.
Conrath U (2011) Molecular aspects of defence priming. Trends Plant Sci 16:524-531.
Durand-Dubief M, Svensson JP, Persson J, Ekwall K (2011) Topoisomerases, chromatin and transcription termination. Transcription 2:66-
70.
Emmett B, Nelson EB, Kessler A, Bauerle TL (2014) Fine‑root system development and susceptibility to pathogen colonization. Planta
239:325-340.
Fernandes H, Michalska K, Sikorski M, Jaskolski M (2013) Structural and functional aspects of PR-10 proteins. FEBS J 280:1169-1199.
FAOSTAT (2014) http://www.fao.org/faostat/en/#data (accessed 02/09/2017).
Fondevilla S, Krezdorn N, Rotter B, Kahl G, Winter P (2015) In planta Identification of Putative Pathogenicity Factors from the Chickpea
Pathogen Ascochyta rabiei by De novo Transcriptome Sequencing Using RNA-Seq and Massive Analysis of cDNA Ends.
Frontiers Microbiol 6:1329.
Fragkostefanakis S, Simm S, Paul P, Bublak D, Scharf KD, Schleiff E (2015) Chaperone network composition in Solanum lycopersicum
explored by transcriptome profiling and microarray meta-analysis. Plant Cell Environ 38:693-709.
Franke-Whittle IH, Manici LM, Insam H, Stres B (2015) Rhizosphere bacteria and fungi associated with plant growth in soils of three
replanted apple orchards. Plant Soil 395:317-333.
Führs H, Behrens C, Gallien S, Heintz D, Van Dorsselaer A, Braun HP, Horst WJ (2010): Physiological and proteomic characterization of
manganese sensitivity and tolerance in rice (Oryza sativa) in comparison with barley (Hordeum vulgare). Ann Bot-London
105:1129-1140.
Gastol M, Domagala-Swiatkiewicz I (2015) Mycorrhizal inoculation of apple in replant soils – enhanced tree growth and mineral status. Acta
Sci Pol Hortorum Cultus 14:17-37.
Gojon A, Krouk G, Perrine-Walker F, Laugier E (2011) Nitrate transceptor(s) in plants. J Exp Bot 62:2299-2308.
Hammer Ø, Harper DAT, Ryan PD (2001) PAST: Paleontological statistics software package for education and data analysis. Palaeontologia
Electronica 4(1):1-9.
Heil M, Baldwin IT (2002) Fitness costs of induced resistance: emerging experimental support for a slippery concept. Trends Plant Sci 7:61-
67.
Henfrey JL, Baab G, Schmitz M (2015) Physiological stress responses in apple under replant conditions. Sci Hortic-Amsterdam 194:111-
117.
Herberich E, Sikorski J, Hothorn T (2010) A Robust Procedure for Comparing Multiple Means under Heteroscedasticity in Unbalanced
Designs. Plos One 5:e9788.
Hu XY, Neill S, Yang Y, Cai W (2009) Fungal elicitor Pep-25 increases cytosolic calcium ions, H2O2 production, and activates the
octadecanoid pathway in Arabidopsis thaliana. Planta 229:1201-1208.
Hu C, Gong Y, Jin S, Zhu Q (2011) Molecular analysis of a UDP-glucose: flavonoid 3-O-glucosyltransferase (UFGT) gene from purple
potato (Solanum tuberosum). Mol Biol Rep 38:561-567.
Hüttner S, Strasser R (2012) Endoplasmic reticulum-associated degradation of glycoproteins in plants. Front Plant Sci 3:67.
Hwang I, Sheen J, Müller B (2012) Cytokinin Signaling Networks. Annu Rev Plant Biol 63:353-380.
Ishiguro S, Kawai-Oda A, Ueda K, Nishida I, Okada K (2001) The DEFECTIVE IN ANTHER DEHISCENCE1 gene encodes a novel
phospholipase A1 catalyzing the initial step of jasmonic acid biosynthesis, which synchronizes pollen maturation, anther
dehiscence, and flower opening in Arabidopsis. Plant Cell 13:2191-2209.
Kahl G, Molina C, Rotter B, Jüngling R, Frank A, Krezdorn N, Hoffmeister K, Winter P (2012) Reduced representation sequencing of plant
stress transcriptomes. J Plant Biochem Biot 21:119-127.
Kamber T, Buchmann JP, Pothier JF, Smits THM, Wicker T, Duffy B (2016) Fire blight disease reactome: RNAseq transcriptional profile of
apple host plant defense responses to Erwinia amylovora pathogen infection. Scientific Reports 6:21600.
Khalil MNA, Brandt W, Beuerle T, Reckwell D, Groeneveld J, Hänsch R, Gaid MM, Liu B, Beerhues L (2015) O-Methyltransferases
involved in biphenyl and dibenzofuran biosynthesis. Plant J 83:263-276.
Kinsman EA, Pyke KA (1998) Bundle sheath cells and cell-specific plastid development in Arabidopsis leaves. Development 125:1815-
1822.

88
Kosová K, Vítámvás P, Prášil IT, Renaut J (2011) Plant proteome changes under abiotic stress – contribution of proteomics studies to
understanding plant stress response. J Proteomics 74:1301-1322.
Kowalenko CG (2001) Assessment of Leco CNS-2000 analyzer for simultaneously measuring total carbon, nitrogen and sulphur in soil.
Commun Soil Sci Plan 32:2065-2078.
Krouk G, Crawford NM, Coruzzi GM, Tsay YF (2010) Nitrate signaling: adaptation to fluctuating environments. Curr Opin Plant Biol
13:266-273.
Kurusu T, Hamada J, Nokajima H et al. (2010) Regulation of microbe-associated molecular pattern-induced hypersensitive cell death,
phytoalexin production, and defense gene expression by calcineurin B-like protein-interacting protein kinases, OsCIPK14/15, in
rice cultured cells. Plant Physiol 153:678-692.
Lê S, Josse J, Husson F (2008) FactoMineR: An R Package for Multivariate Analysis. J Stat Softw 25:1-18.
Little DY, Rao H, Oliva S, Daniel-Vedele F, Krapp A, Malamy JE (2005) The putative high-affinity nitrate transporter NRT2.1 represses
lateral root initiation in response to nutritional cues. Proc Natl Acad Sci USA 102:13693-13698.
Liu JX, Howell SH (2010) Endoplasmic reticulum protein quality control and its relationship to environmental stress responses in plants.
Plant Cell 22:2930-2942.
Liu ET, Wang GS, Li YY, Shen X, Chen XS, Song FH, Wu SJ, Chen Q, Mao ZQ (2014) Replanting Affects the Tree Growth and Fruit
Quality of Gala Apple. Journal of Integrative Agriculture 13:1699-1706.
Lodish H, Berk A, Zipursky SL et al. (2000) Molecular Cell Biology. 4th edition. New York: W. H. Freeman; 2000. Section 12.3, The Role
of Topoisomerases in DNA Replication. Available from: https://www.ncbi.nlm.nih.gov/books/NBK21703/ (accessed
12/29/2016).
Ludwig SR, Habera LF, Dellaporta SL, Wessler SR (1989) Lc, a member of the maize R gene family responsible for tissue specific
anthocyanin production, encodes a protein similar to transcriptional activators and contains a myc-homology region. Proc Natl
Acad Sci USA 86:7092-7096.
Manici LM, Kelderer M, Franke-Whittle IH, Rühmer T, Baab G, Nicoletti F, Caputo F, Topp A, Insam H, Naef A (2013) Relationship
between root-endophytic microbial communities and replant disease in specialized apple growing areas in Europe. Applied Soil
Ecol 72:207-214.
Manici LM, Kelderer M, Caputo F, Mazzola M (2015) Auxin-mediated relationships between apple plants and root inhabiting fungi: impact
on root pathogens and potentialities of growth-promoting populations. Plant Pathol 64:843-851.
Mazzola M (1998) Elucidation of the microbial complex having a causal role in the development of apple replant disease in Washington.
Phytopathology 88:930-938.
Mazzola M, Manici LM (2012) Apple Replant Disease: Role of Microbial Ecology in Cause and Control. Annu Rev Phytopathol 50:45-65.
McNamara NP, Black HIJ, Beresford NA, Parekh NR (2003) Effect of acute gamma irradiation on chemical, physical and biological
properties of soils. Applied Soil Ecol24:117-132.
Modolo LV, Augusto O, Almeida IMG, Magalhaes JR, Salgado I (2005) Nitrite as the major source of nitric oxide production by
Arabidopsis thaliana in response to Pseudomonas syringae. FEBS Lett 579:3814-3820.
Müller S, Rycak L, Afonso-Grunz F et al. (2014) APADB: a database for alternative polyadenylation and microRNA regulation events.
Database 2014:1-11.
Narváez-Vásquez J, Florin-Christensen J, Ryan CA (1999) Positional specificity of a phospholipase A activity induced by wounding,
systemin, and oligosaccharide elicitors in tomato leaves. Plant Cell 11:2249-2260.
Nold-Petry CA, Lo CY, Rudloff I et al. (2015) IL-37 requires the receptors IL-18Rα and IL-1R8 (SIGIRR) to carry out its multifaceted anti-
inflammatory program upon innate signal transduction. Nat Immunol 16:354-365.
Park CJ, Seo YS (2015) Heat Shock Proteins: A Review of the Molecular Chaperones for Plant Immunity. Plant Pathol J 31:323-333.
Pearson K (1895) Notes on regression and inheritance in the case of two parents. P Roy Soc A-Math Phy 58:240-242.
Pfaffl MW (2001) A new mathematical model for relative quantification in real-time RT-PCR. Nucleic Acids Res 29:e45.
R Development Core Team (2008) R: A language and environment for statistical computing. R Foundation for Statistical Computing,
Vienna, Austria. ISBN 3-900051-07-0, URL https://www.r-project.org.
Rhind N, Russell P (2012) Signaling Pathways that Regulate Cell Division. Cold Spring Harb Perspect Biol 4:a005942.
Rushton PJ, Somssich IE, Ringler P, Shen QJ (2010) WRKY transcription factors. Trends Plant Sci 15:247-258.
Sato M, Tsuda K, Wang L, Coller J, Watanabe Y, Glazebrook J, Katagiri F (2010) Network modeling reveals prevalent negative regulatory
relationships between signaling sectors in Arabidopsis immune signaling. Plos Pathog 6:e1001011.
Shih PH, Yeh CT, Yen GC (2007) Anthocyanins Induce the Activation of Phase II Enzymes through the Antioxidant Response Element
Pathway against Oxidative Stress-Induced Apoptosis. J Agric Food Chem 55:9427-9435.

89
Shin S, Lv J, Fazio G, Mazzola M, Zhu Y (2014) Transcriptional regulation of ethylene and jasmonate mediated defense response in apple
(Malus domestica) root during Pythium ultimum infection. Horticulture Research 1:14053.
Shin S, Zheng P, Fazio G, Mazzola M, Main D, Zhu Y (2016) Transcriptome changes specifically associated with apple (Malus domestica)
root defense response during Pythium ultimum infection. Physiol Mol Plant P 94:16-26.
Simm S, Fragkostefanakis S, Paul P, Keller M, Einloft J, Scharf KD, Schleiff E (2015) Identification and Expression Analysis of Ribosome
Biogenesis Factor Co-orthologs in Solanum lycopersicum. Bioinformatics and Biology Insights 9:1-17.
Spath M, Insam H, Peintner U, Kelderer M, Kuhnert R, Franke-Whittle IH (2015) Linking Soil Biotic and Abiotic Factors to Apple Replant
Disease: a Greenhouse Approach. J Pathol 163:287-299.
St. Laurent A, Merwin IA, Fazio G, Thies JE, Brown MG (2010) Rootstock genotype succession influences apple replant disease and root-
zone microbial community composition in an orchard soil. Plant Soil 337:259-72.
Suzuki N, Rizhsky L, Liang H, Shuman J, Shualev V, Mittler R (2005) Enhanced Tolerance to Environmental Stress in Transgenic Plants
Expressing the Transcriptional Coactivator Multiprotein Bridging Factor 1c. Plant Physiol 139:1313-1322.
Tewoldemedhin YT, Mazzola M, Mostert L, McLeod A (2011a) Cylindrocarpon species associated with apple tree roots in South Africa and
their quantification using real-time PCR. Eur J Plant Pathol 129:637-651.
Tewoldemedhin YT, Mazzola M, Botha WJ, Spies CFJ, McLeod A (2011b) Characterization of fungi (Fusarium and Rhizoctonia) and
oomycetes (Phytophthora and Pythium) associated with apple orchards in South Africa. Eur J Plant Pathol 130:215-229.
Thimm O, Bläsing OE, Gibon Y, Nagel A, Meyer S, Krüger P, Selbig J, Müller LA, Rhee SY, Stitt M (2004) MAPMAN: a user-driven tool
to display genomics datasets onto diagrams of metabolic pathways and other biological processes. Plant J 37:914-939.
Toledo-Ortiz G, Huq E, Quail PH (2003) The Arabidopsis Basic/Helix-Loop-Helix Transcription Factor Family. Plant Cell 15:1749-1770.
Tsuda K, Katagiri F (2010) Comparing signaling mechanisms engaged in pattern-triggered and effector immunity. Curr Opin Plant Biol
13:459-465.
Tukey JW (1949) Comparing Individual Means in the Analysis of Variance. Biometrics 5:99-114.
Ul Hassan MN, Zainal Z, Ismail I (2015) Plant kelch containing F-box proteins: structure, evolution and functions. RSC Adv 5:42808-42814.
Vanderauwera S, Zimmermann P, Rombauts S, Vandenabeele S, Langebartels C, Gruissem W, Inzé D, Van Breusegem F (2005) Genome-
Wide Analysis of Hydrogen Peroxide-Regulated Gene Expression in Arabidopsis Reveals a High Light-Induced Transcriptional
Cluster Involved in Anthocyanin Biosynthesis. Plant Physiol 139:806-821.
Van Schoor L, Denman S, Cook NC (2009) Characterisation of apple replant disease under South African conditions and potential biological
management strategies. Sci Hortic 119:153-162.
Velasco R, Zharkikh A, Affourtit J et al. (2010) The genome of the domesticated apple (Malus × domestica Borkh.). Nat Genet 42:833-841.
Weiß S, Bartsch M, Winkelmann T (2017) Transcriptomic analysis of molecular responses in Malus domestica ‘M26’ roots affected by apple
replant disease. Plant Mol Biol doi:10.1007/s11103-017-0608-6.
Welch BL (1947) The generalization of ‘Student’s’ problem when several different population variances are involved. Biometrika 34:28-35.
Xu W, Lv H, Zhao M, Li Y, Qi Y, Peng Z, Xia G, Wang M (2016) Proteomic comparison reveals the contribution of chloroplast to salt
tolerance of a wheat introgression line. Scientific Reports6:32384.
Yakovlev IA, Lee YK, Rotter B, Olsen JE, Skrøppa T, Johnsen Ø, Fossdal CG (2014) Temperature-dependent differential transcriptomes
during formation of an epigenetic memory in Norway spruce embryogenesis. Tree Genet Genomes10:355-366.
Yim B, Smalla K, Winkelmann T (2013) Evaluation of apple replant problems based on different soil disinfection treatments—links to soil
microbial community structure? Plant Soil 366:617-631.
Yim B, Winkelmann T, Ding G-C, Smalla K (2015) Different bacterial communities in heat and gamma irradiation treated replant disease
soils revealed by 16S rRNA gene analysis – contribution to improved aboveground apple plant growth? Frontiers Microbiol
6:1224.
Yim B, Hanschen FS, Wrede A, Nitt H, Schreiner M, Smalla K, Winkelmann T (2016) Effects of biofumigation using Brassica juncea and
Raphanus sativus in comparison to disinfection using Basamid on apple plant growth and soil microbial communities at three
field sites with replant disease. Plant Soil 406:389-408.
Zajac BK, Amendt J, Horres R, Verhoff MA, Zehner R (2015) De novo transcriptome analysis and highly sensitive digital gene expression
profiling of Calliphora vicina (Diptera: Calliphoridae) pupae using MACE (Massive Analysis of cDNA Ends). Forensic Sci Int-
Gen 15:137-146.
Zawada AM, Rogacev KS, Müller S, Rotter B, Winter P, Fliser D, Heine GH (2014) Massive analysis of cDNA Ends (MACE) and miRNA
expression profiling identifies proatherogenic pathways in chronic kidney disease. Epigenetics 9:161-172.
Zhu Y, Fazio G, Mazzola M (2014) Elucidating the molecular responses of apple rootstock resistant to ARD pathogens: challenges and
opportunities for development of genomics-assisted breeding tools. Horticulture Research 1:14043.

90
4.2. Figures and tables
Fig. 1. Per plant dry mass of shoot (green color) and root material (brown color) 7 and 56 days after transfer to γARD or ARD soil of site A
or K. Differences between treatments at one time point and soil were tested using a Welch Two Sample t-test (means and standard deviations
of n = 5) with significance indicated by different letters at P < 0.05.

91
Fig. 2. Venn diagram of genes being exclusively or higher expressed in γARD (A) or ARD samples (B) found in leaves (green color) and
roots (brown color) at day 7 of soil A analyzed by MACE (L3P vs. R2P). Genes found to be higher expressed in both tissues (leaves and
roots) of one sampling (γARD or ARD) were shared by overlapping circles (olive color). Forty exclusively/higher expressed genes were
shared by γARD samples between both tissues whereas ARD samples had 36 mutual exclusively/higher expressed genes present in both
tissues. Detailed lists of shared genes are presented in Supplementary Tables S2-3.

92
Tab
le 1
Pri
mer
seq
uen
ces
for
gen
e ex
pre
ssio
n a
nal
yse
s via
RT
-qP
CR
.*
Gen
e n
am
e (
MD
P I
D)
Ch
ro
mo
som
al
loca
tio
n o
f
MD
P I
D
Ab
brevia
tio
n
Prim
er s
eq
uen
ce
(5’
- 3
’)
Frag
men
t
len
gth
[b
p]
Am
pli
fica
tio
n
eff
icie
ncy
[%
]
Co
effi
cien
t of
dete
rm
ina
tio
n R
²
elo
nga
tio
n f
acto
r 1
-alp
ha
(M
DP
00
00
304
140
) ch
r11
:10
,82
4,5
88
..10
,826
,02
9
EF
1a
f: G
AA
CG
GA
GA
TG
CT
GG
TA
TG
G
159
90.7
0
.999
r: C
CA
GT
TG
GC
TC
CT
TC
TT
CT
C
elo
nga
tio
n f
acto
r 1
-beta
2-l
ike (
MD
P00
009
034
84
) ch
r2:3
1,1
12
,380
..31
,11
3,2
06
EF
1b
f: G
AG
AG
TG
GG
AA
AT
CC
TC
TG
138
94.5
0
.998
r: A
CC
AA
CA
GC
AA
CC
AA
TT
TC
tub
uli
n b
eta
ch
ain
(M
DP
000
095
1799
) ch
r4:1
4,5
95
,834
..14
,59
7,7
58
TU
BB
f:
TT
CT
CT
GG
GA
GG
AG
GT
AC
TG
147
93.9
0
.999
r: G
TC
GC
AT
TG
TA
AG
GC
TC
AA
C
17.1
kD
a cl
ass
II h
eat
shock
pro
tein
-lik
e (M
DP
000
070
038
3)
chr6
:5,7
78
,67
2..5
,779
,14
2
HS
P17
.1
f: C
GC
CG
AG
AA
GT
CA
TT
CA
AC
109
98.8
0
.999
r: C
AC
GA
AC
AC
GT
AG
GA
GT
TA
G
17.3
kD
a cl
ass
II h
eat
shock
pro
tein
-lik
e (M
DP
000
054
806
5)
chr1
5:4
6,2
32,1
57
..46
,232
,62
7
HS
P17
.3
f: G
AC
AT
GC
CG
GG
AC
TG
AA
G
169
90.6
1
r: C
AT
TC
TC
CG
GC
AA
CA
CA
AA
C
18.5
kD
a cl
ass
I h
eat
shock
pro
tein
-lik
e (M
DP
000
075
966
6)
chr1
1:7
,597
,407
..7,5
97
,889
HS
P18
.5
f: G
CT
TA
AG
AT
CA
GC
GG
AG
AG
175
97.9
0
.998
r: C
TT
CG
GA
AC
AG
TG
AC
AC
TT
AG
1-a
min
ocy
clop
rop
ane-
1-c
arb
oxyla
te o
xid
ase
hom
olo
g 1
-lik
e
(MD
P00
003
144
99
)
chr1
:19,1
79
,184
..19
,18
0,7
12
AC
O1
f: C
GC
AG
TT
GG
AG
AT
GA
AC
TT
G
167
107
.4
0.9
96
r: C
AT
GC
CG
TG
AT
GG
AC
AG
TA
G
acid
ic e
nd
och
itin
ase-
lik
e (M
DP
0000
21
869
1)
chr1
:27,5
31
,001
..27
,53
1,8
94
CH
IA
f: C
TG
AG
TG
CT
GA
CA
TC
AG
AA
C
1
49
93.6
0
.998
r: G
AC
TG
AC
CA
CC
TA
AG
AA
GT
TG
ank
yri
n-1
-lik
e (M
DP
00
001
574
04
) ch
r15
:20
,05
4,3
12
..20
,055
,25
9
AN
K1
f: C
AA
CA
AG
AA
TG
GC
GA
AA
CT
C
113
93.9
0
.999
r: C
AA
GA
TC
AA
CC
AC
TT
CC
AT
AG
G
auxin
-res
pon
sive
pro
tein
IA
A8
-lik
e (M
DP
00
000
902
81
) ch
r15
:39
,37
4,3
62
..39
,376
,78
0
IAA
8
f: A
TC
CT
GC
AA
AT
CA
AT
GA
AC
C
176
92.1
0
.995
r: A
CT
GA
TG
GC
CC
TA
AT
CT
TC
C
bip
hen
yl
syn
thas
e 2 (
MD
P0
000
716
308
) ch
r15
:6,5
27
,251
..6,5
27
,937
BIS
2
f: C
TT
GT
GG
TT
TG
CG
CA
GA
G
172
107
0.9
93
r: G
TC
TG
CA
TG
CC
AC
GA
TT
TC
bip
hen
yl
syn
thas
e 3 (
MD
P0
000
287
919
) ch
r15
:6,4
82
,023
..6,4
83
,582
BIS
3
f: G
GC
AA
GA
AG
CA
GC
AT
TG
AA
AG
1
05
103
.3
0.9
94
r: C
AC
AA
CC
TG
GC
AT
GT
CA
AC
bip
hen
yl
syn
thas
e 4 (
MD
P0
000
302
905
) ch
r14
:22
,43
1,1
66
..22
,432
,73
8
BIS
4
f: C
AA
CA
AG
CA
GC
AC
TG
AA
AG
C
140
110
.6
0.9
87
r: G
AT
GG
GT
TA
AG
GC
CA
AG
GA
G
caff
eic
acid
3-O
-met
hylt
ran
sfer
ase-
lik
e (M
DP
0000
745
475
) ch
r7:1
9,7
54
,179
..19
,75
5,9
23
OM
Tb
f: C
AT
CT
GA
GA
TC
GC
AG
CT
CA
C
146
103
.8
0.9
97
r: G
TA
GA
GC
CT
CC
GG
AA
AC
AC
cyto
chro
me
P4
50
CY
P73
6A
12
-lik
e (M
DP
00
002
053
06
) ch
r11
:24
,82
5,8
65
..24
,827
,63
7
B4
Ha
f: G
AT
GT
GC
AC
GC
TC
GA
AT
TA
C
106
108
0.9
98
r: A
TT
GG
CG
TC
CT
CT
TG
AA
CA
G
cyto
chro
me
P4
50
CY
P73
6A
12
-lik
e (M
DP
00
001
529
00
) ch
r11
:24
,89
8,0
86
..24
,899
,85
2
B4
Hb
f: G
CT
GA
GT
AT
GG
CC
CG
TA
TT
G
156
94.1
0
.996
r: A
GG
AA
CC
CG
TC
GA
TT
AT
TG
G

93
Gen
e n
am
e (
MD
P I
D)
Ch
ro
mo
som
al
loca
tio
n o
f
MD
P I
D
Ab
brevia
tio
n
Prim
er s
eq
uen
ce
(5’
- 3
’)
Frag
men
t
len
gth
[b
p]
Am
pli
fica
tio
n
eff
icie
ncy
[%
]
Co
effi
cien
t of
dete
rm
ina
tio
n R
²
dis
ease
res
ista
nce
pro
tein
At4
g27
190
-lik
e (M
DP
000
046
316
6)
chr1
0:9
,979
,125
..9,9
81
,620
DR
P
f: G
GA
GG
AT
CA
AG
AG
CT
TA
AA
C
123
105
.9
0.9
99
r: G
CC
TC
TT
CT
AC
TG
TC
TC
AA
C
eth
yle
ne
inse
nsi
tive
3 c
lass
tra
nsc
ripti
on
fac
tor
(EIL
2)
(MD
P00
002
831
97
)
chr7
:4,2
02
,19
4..4
,204
,61
3
EIL
2
f: T
AT
TG
CC
AA
GA
TC
CA
GA
AG
C
171
104
.4
0.9
96
r: G
CG
AA
AG
AC
TC
AC
TC
CA
AA
G
eth
yle
ne
inse
nsi
tive
3 c
lass
tra
nsc
ripti
on
fac
tor
(EIL
3)
(MD
P00
002
128
81
)
chr8
:29,2
41
,428
..29
,24
2,5
46
EIL
3
f: G
AG
CT
CG
AG
AA
GA
GG
AT
GT
G
105
97.2
0
.999
r: C
TG
TG
AT
TG
AC
GC
TG
TC
TT
G
F-b
ox/k
elch
-rep
eat
pro
tein
At3
g06
240
-lik
e (M
DP
0000
612
137
) ch
r9:9
,486
,12
1..9
,487
,81
0
KF
B1
f: G
AG
CC
TA
TG
CA
CT
GG
AA
AT
G
160
97.4
0
.999
r: A
TC
GC
CA
AG
AG
AA
AC
AA
GG
gib
ber
elli
n-r
egu
late
d p
rote
in 1
-lik
e (M
DP
00
001
400
78
) ch
r12
:21
,21
9,5
68
..21
,220
,19
8
GA
SA
1
f: C
GT
TG
CA
GC
TG
TG
TT
CC
TC
156
104
.3
0.9
98
r: C
AT
CT
GC
AT
GC
CC
GA
AT
AT
GA
G
LR
R r
ecep
tor-
lik
e se
rin
e/th
reon
ine-
pro
tein
kin
ase
MR
H1
(MD
P00
003
027
79
)
chr1
0:2
7,3
82,3
69
..27
,386
,55
9
MR
H1
f: C
GA
GG
TT
TC
AT
GG
TT
GT
TG
163
92.7
0
.989
r: C
GC
AG
AA
TG
AC
AA
CA
GA
AT
C
pat
hogen
esis
-rel
ated
gen
es t
ran
scri
pti
on
al a
ctiv
ator
PT
I5-l
ike
(MD
P00
008
054
22
)
chr5
:4,8
59
,77
0..4
,860
,34
2
PT
I5
f: A
GC
TG
AA
AT
CC
GT
GA
CT
CT
G
128
91.2
0
.998
r: T
AA
GC
AT
GG
CC
TT
AG
TA
CC
G
sen
esce
nce
-ass
oci
ated
car
boxyle
ster
ase
101
-lik
e
(MD
P00
008
379
35
)
chr1
:10,1
38
,107
..10
,13
9,2
79
SA
G101
f: C
GT
AA
AC
TA
GC
GA
TG
CA
GA
AG
1
02
94.5
0
.998
r: G
GA
CT
CC
TC
CT
TG
TA
CC
AT
TC
thau
mat
in-l
ike
pro
tein
1a
(MD
P000
05
523
28
) ch
r9:2
8,4
18
,285
..28
,41
9,4
11
TL
1
f: A
CG
GC
TT
CA
AC
TT
GC
CT
AT
G
118
91.9
0
.998
r: G
CC
GC
TT
TC
AC
TT
GA
AG
TT
G
thau
mat
in-l
ike
pro
tein
1b (
MD
P0
0007
826
42
) ch
r9:1
4,5
76
,503
..14
,57
7,5
13
TL
1b
f: G
TC
CC
TA
AC
CT
CC
GA
TC
AA
C
159
96.1
0
.999
r: G
TG
GC
AC
AA
CT
GA
AC
TT
TC
C
wou
nd
-indu
ced p
rote
in 1
-lik
e (M
DP
00
007
921
01
) ch
r12
:25
,38
1,4
23
..25
,381
,84
5
WIN
1
f: G
AT
TC
CA
GC
CA
CA
CT
GA
CT
TC
1
50
92.5
0
.997
r: C
TC
CC
TG
AA
CT
GA
GT
GA
TC
AA
C
zin
c fi
nger
pro
tein
ZA
T1
2 (
MD
P00
005
956
71
) ch
r3:8
,838
,08
7..8
,838
,60
8
ZA
T1
2
f: C
AA
GA
AG
CC
GA
AG
CT
AA
TG
C
125
94.9
0
.972
r: G
TC
CG
AC
CG
TG
AA
CT
CA
AG
*A
ll p
rim
ers
(f:
forw
ard
, r:
rev
erse
) w
ere
eval
uat
ed i
n a
n a
mp
lifi
cati
on e
ffic
ien
cy t
est
at a
n a
nn
eali
ng t
emp
erat
ure
of
60 °
C. B
old
pri
nti
ng i
nd
icat
es r
efer
ence
gen
es.

94
Table 2
Identified nutrients [mg/g dry mass] in shoot material of γARD and ARD samples at day 7 and 56 in
soil A.* Nutrient Day 7 Day 56
γARD ARD γARD ARD
Al 0.28 ± 0.08 0.27 ± 0.11 0.12 ± 0.09 0.19 ± 0.2
B 0.02 ± 0 0.02 ± 0 0.03 ± 0* 0.02 ± 0
Ba 0.03 ± 0.02 0.03 ± 0.02 0.03 ± 0.01 0.02 ± 0.01
C 28.76 ± 3.97 27.75 ± 2.88 27.48 ± 1.18* 25.38 ± 1.33
Ca 7.55 ± 1.33 8.24 ± 0.54 5.43 ± 0.64** 7.37 ± 0.53
Fe 0.52 ± 0.17 0.43 ± 0.19 0.17 ± 0.11 0.3 ± 0.31
K 10.38 ± 1.07 9.02 ± 0.96 14.08 ± 4.09 11.89 ± 2.38
Mg 1.68 ± 0.18* 1.96 ± 0.14 1.54 ± 0.05 1.45 ± 0.12
Mn 0.08 ± 0.02 0.06 ± 0.01 0.21 ± 0.02 0.24 ± 0.03
N 464.08 ± 4.18 465.66 ± 3 476.32 ± 7.7 474.39 ± 4.01
Na 0.81 ± 0.17* 1.18 ± 0.18 0.77 ± 0.66 0.45 ± 0.23
P 2.52 ± 0.25 2.58 ± 0.24 0.97 ± 0.08* 0.83 ± 0.07
S 3.23 ± 0.3* 3.86 ± 0.37 2.83 ± 0.12 2.75 ± 0.36
Sr 0.03 ± 0.01 0.03 ± 0 0.02 ± 0*** 0.04 ± 0
Zn 0.05 ± 0.02 0.05 ± 0.02 0.08 ± 0.12 0.05 ± 0.01
*Differences between treatments at one time point were tested using a Welch Two Sample t-test (means and standard deviations of n = 5) with significant differences shown for P < 0.05 (*), P < 0.01 (**) and P < 0.001 (***).

95
Tab
le 3
Com
par
ison o
f gen
e ex
pre
ssio
n a
nal
yze
d b
y R
T-q
PC
R i
n l
eaves
of
pla
nts
cult
ivat
ed i
n s
oil
com
ing f
rom
dif
fere
nt
site
s (s
oil
A a
nd s
oil
K)
at d
ay 7
lin
ked
to
root
dat
a.*
Cla
ss
Gen
e
Na
me
Lea
ves
exp
ress
ion
γA
RD
± S
D s
oil
A
Lea
ves
exp
ress
ion
AR
D ±
SD
soil
A
Lea
ves
exp
ress
ion
γA
RD
± S
D s
oil
K
Lea
ves
exp
ress
ion
AR
D ±
SD
soil
K
Lea
ves
rati
o
(AR
D/γ
AR
D)
soil
A
Lea
ves
rati
o
(AR
D/γ
AR
D)
soil
K
Ro
ots
ra
tio
(AR
D/γ
AR
D)
soil
A
Ro
ots
ra
tio
(AR
D/γ
AR
D)
soil
K
Ph
yto
alex
in b
iosy
nth
esis
B
IS2
0 ±
0
0.0
1 ±
0.0
2
0 ±
0
0 ±
0
8.6
8
2.3
1
3.6
7*
18.5
***
Ph
yto
alex
in b
iosy
nth
esis
B
IS3
0.0
1 ±
0
0.0
3 ±
0.0
3
0 ±
0
0 ±
0
4.1
2
1.9
3
4.1
1**
10.5
8***
Ph
yto
alex
in b
iosy
nth
esis
B
IS4
0 ±
0
0 ±
0
0 ±
0
0 ±
0
1.5
7
1.4
7
3.9
*
23.9
5***
Ph
yto
alex
in b
iosy
nth
esis
O
MT
b
0 ±
0
0.0
1 ±
0.0
1
0 ±
0
0 ±
0
2.9
1
.03
2.0
5**
2.9
6***
Ph
yto
alex
in b
iosy
nth
esis
B
4H
a
0 ±
0
0.0
1 ±
0.0
1
0 ±
0
0 ±
0
2.8
4
1.4
3
2.7
8**
5.6
2***
Ph
yto
alex
in b
iosy
nth
esis
B
4H
b
0.0
5 ±
0.0
3
0.1
± 0
.1
0.0
1 ±
0
0.0
2 ±
0.0
1
2.1
3
1.5
4
2.6
1**
5.8
3***
Pla
nt
def
ense
T
L1
0.6
± 0
.37
1.8
7 ±
2.1
1
0.2
± 0
.05
0.1
4 ±
0.0
3
3.0
9
-1.3
6
4.3
2**
4.8
8*
Pla
nt
def
ense
T
L1
b
0.6
3 ±
0.1
7
1.3
6 ±
1.6
5
0.8
± 0
.25
0.9
7 ±
0.1
8
2.1
4
1.2
1
n. a.
n
. a.
Reg
ula
tory
fu
nct
ion
HS
P17
.1
1.0
7 ±
0.8
4
0.2
5 ±
0.2
4
0.0
1 ±
0
0.0
1 ±
0
-4.2
3*
1.0
8
-3.4
9***
1.1
1
Reg
ula
tory
fu
nct
ion
HS
P17
.3
14.0
2 ±
7.5
4
1.3
9 ±
1.0
1
0.0
6 ±
0.0
2
0.0
4 ±
0.0
1
-10
.12
**
-1.5
-3
.37
***
1.7
2*
Reg
ula
tory
fu
nct
ion
HS
P18
.5
1.1
9 ±
0.5
6
0.1
1 ±
0.0
3
0.0
3 ±
0
0.0
3 ±
0
-11
.16
***
-1.0
6
-3.9
***
1.1
3
Reg
ula
tory
fu
nct
ion
KF
B1
0.0
3 ±
0
0.0
3 ±
0.0
1
0.0
1 ±
0
0.0
1 ±
0
-1.0
2
1.2
7
n. a.
n
. a.
Sig
nal
ing
EIL
2
0 ±
0
0 ±
0
0 ±
0
0 ±
0
1.2
1
1.1
6
n. a.
n
. a.
Sig
nal
ing
EIL
3
1.4
8 ±
0.3
1
1.4
9 ±
0.4
6
1.2
5 ±
0.3
1
1.4
3 ±
0.2
1
1
1.1
4
n. a.
n
. a.
Sig
nal
ing
IAA
8
0.0
3 ±
0.0
1
0.0
3 ±
0.0
1
0.0
2 ±
0
0.0
2 ±
0
-1.0
5
-1
n. a.
n
. a.
Sig
nal
ing
PT
I5
0.1
± 0
.04
0.1
9 ±
0.1
4
0.0
3 ±
0.0
1
0.0
4 ±
0.0
1
1.9
3
1.3
n
. a.
n
. a.
*F
or
norm
aliz
atio
n E
F1
a,
EF
1b
and
TU
BB
wer
e u
sed
as
refe
ren
ce g
enes
. R
atio
s ar
e re
pre
sen
ted
by t
he
qu
oti
ent
of
AR
D/γ
AR
D w
ith v
alu
es b
etw
een
0 a
nd 1
bei
ng t
ran
sform
ed b
y u
sin
g t
he
neg
ativ
e re
cip
roca
l val
ue
of
the
qu
oti
ent.
Dif
fere
nce
s b
etw
een
tre
atm
ents
wer
e te
sted
usi
ng a
Wel
ch T
wo
Sam
ple
t-t
est
(n =
5)
wit
h s
ignif
ican
t dif
fere
nce
s sh
ow
n f
or
P <
0.0
5 (
*),
P <
0.0
1 (
**)
and
P <
0.0
01
(***).
Corr
elat
ion
bet
wee
n M
AC
E
dat
a an
d R
T-q
PC
R o
f so
il A
was
R =
0.8
3 a
nd P
< 0
.001
, co
rrel
atio
n b
etw
een
lea
f R
T-q
PC
R d
ata
of
soil
A a
nd s
oil
K w
as R
= 0
.65 a
nd
P <
0.0
1. R
atio
of
roots
was
ob
tain
ed f
rom
Wei
ß e
t al
. (i
n p
repar
atio
n).
Tab
le 4
Seq
uen
cing r
esult
s of
the
MA
CE
anal
ysi
s fo
r γA
RD
and A
RD
sam
ple
s of
soil
A.*
Sa
mp
le
Nu
mb
er o
f
raw
rea
ds
Averag
e l
en
gth
bef
ore
trim
min
g [
bp
] R
ea
ds
aft
er
trim
min
g
Averag
e l
en
gth
aft
er
trim
min
g [
bp
]
No
n-s
peci
fica
lly m
ap
ped
rea
ds
[nu
mb
er | %
trim
med
rea
ds]
Un
iqu
e m
ap
ped
rea
ds
[nu
mb
er | %
trim
med
rea
ds]
γAR
D 1
1
2,1
23
,247
109
.2
12,1
23
,114
109
.1
211
,49
1
[1.7
4]
3,6
40
,90
7
[30
.03]
γAR
D 2
1
2,4
13
,200
110
.1
12,4
13
,056
110
222
,79
7
[1.7
9]
3,7
90
,00
6
[30
.53]
γAR
D 3
1
3,5
19
,267
109
.9
13,5
19
,110
109
.8
250
,50
2
[1.8
5]
4,2
12
,35
1
[31
.16]
AR
D 1
1
4,4
03
,565
109
.4
14,4
03
,387
109
.3
237
,57
2
[1.6
5]
4,4
23
,59
3
[30
.71]
AR
D 2
1
0,5
76
,129
109
.7
10,5
76
,001
109
.6
167
,42
1
[1.5
8]
3,2
65
,08
2
[30
.87]
AR
D 3
9
,450
,84
4
110
9,4
50
,74
1
109
.9
145
,23
4
[1.5
4]
2,8
82
,85
9
[30
.5]
*S
equ
ence
s w
ere
trim
med
em
plo
yin
g p
oly
-A a
dap
ter
seq
uen
ces
usi
ng C
LC
Gen
om
ics
Work
ben
ch 8
. T
rim
med
seq
uen
ces
wer
e m
app
ed t
o t
he
pre
dic
ted
tra
nsc
rip
tom
e of
Malu
s d
om
esti
ca.
Rea
ds
map
ped
to m
ore
than
on
e se
qu
ence
(n
on
-sp
ecif
ical
ly m
app
ed r
ead
s) w
ere
not
incl
ud
ed i
n f
urt
her
an
alyse
s.

96
Tab
le 5
Lis
t of
gen
es w
ith a
FD
R c
orr
ecte
d P
-val
ue
< 0
.05,
a co
ntr
ibuti
on v
alue
> 0
.69 %
and a
t le
ast
2-f
old
reg
ula
tion o
r w
hic
h w
ere
found o
nly
in e
ither
γA
RD
or
AR
D s
amp
les.
*
Ma
pM
an
fun
cti
on
al
ca
tego
ry
Gen
e C
hro
mo
som
al
loca
tio
n o
f
MD
P I
D
No
rm
ali
zed
tra
nsc
rip
t a
bu
nd
an
ce
γA
RD
± S
D
No
rm
ali
zed
tra
nsc
rip
t a
bu
nd
an
ce
AR
D ±
SD
Ra
tio
Co
ntr
ibu
tio
n
[%]
DN
A p
roce
ssin
g
DN
A t
op
ois
om
eras
e 2
-lik
e (M
DP
00
00
211
904
) ch
r2:3
5,2
66
,329
..35
,26
9,6
18
0.5
4 ±
0.2
1
0.0
5 ±
0.0
8
-11
.76
2.3
4
Lip
id m
etab
oli
sm
ph
osp
holi
pas
e A
1-I
Idel
ta-l
ike
(MD
P00
001
279
30
) ch
r17
:23
,16
8,9
30
..23
,170
,24
6
0.0
3 ±
0.0
5
0 ±
0
on
ly γ
AR
D
2.2
2
Mis
cell
aneo
us
anth
ocy
anid
in 3
-O-g
luco
sylt
ran
sfer
ase
5-l
ike
(MD
P0
000
24
494
6)
chr2
:13,3
99
,641
..13
,40
0,8
28
0.0
3 ±
0.0
5
0 ±
0
on
ly γ
AR
D
2.5
4
Mis
cel
lan
eou
s G
DS
L e
ster
ase
/lip
ase
5-l
ike (
MD
P00
002
446
07
) ch
r16
:5,7
86
,28
7..5
,791
,158
1.9
1 ±
0.5
1
3.9
6 ±
0.6
2
2.0
8
0.7
3
Mis
cell
aneo
us
caff
eic
acid
3-O
-met
hylt
ran
sfer
ase-
lik
e (M
DP
0000
657
537
) ch
r1:2
8,7
23
,194
..28
,72
4,5
42
0.3
6 ±
0.1
8
1 ±
0.3
5
2.7
6
0.7
9
Mis
cell
aneo
us
UD
P-g
luco
se f
lavon
oid
3-O
-glu
cosy
ltra
nsf
eras
e 7
-lik
e (M
DP
00
000
125
41
) ch
r7:6
69
,35
8..6
70
,77
3
0.0
2 ±
0.0
4
0.3
7 ±
0.1
4
14.9
3
2.2
8
Not
assi
gn
ed
pro
tein
RE
TIC
UL
AT
A-R
EL
AT
ED
1 (
MD
P00
005
713
56
) ch
r8:2
8,1
68
,746
..28
,17
3,4
36
2.3
8 ±
0.4
9
1.1
± 0
.6
-2.1
6
0.8
7
No
t a
ssig
ned
tr
an
sla
tio
n i
nit
iati
on
fa
cto
r I
F-3
-lik
e (
MD
P000
033
784
5)
ch
r2
:1,3
73,1
24
..1
,373
,51
7
1.2
3 ±
0.4
4
2.7
± 0
.45
2.2
0
1.1
5
No
t a
ssig
ned
m
ech
an
ose
nsi
tive i
on
ch
an
nel
pro
tein
1 (
MD
P000
035
980
9)
ch
r11
:27,2
73
,243
..27
,273
,37
8
0.7
1 ±
0.1
6
1.5
9 ±
0.3
1
2.2
3
0.8
3
No
t a
ssig
ned
A
BA
-in
du
cib
le p
ro
tein
PH
V A
1-l
ike (
MD
P000
042
921
8)
ch
r5
:4,5
38,7
31
..4
,539
,55
2
0.6
1 ±
0.2
4
1.5
3 ±
0.3
4
2.5
2
0.9
3
Not
assi
gn
ed
puta
tive
UP
F0
481
pro
tein
At3
g02
645 (
MD
P000
016
133
2)
chr5
:19,0
75
,194
..19
,07
6,8
76
0.4
5 ±
0.2
1
1.1
8 ±
0.5
5
2.6
0
0.9
7
Not
assi
gn
ed
tran
scri
pti
on
fac
tor
PR
E6
-lik
e (M
DP
00
001
743
88
) ch
r16
:3,2
81
,914
..3,2
82
,592
0.1
± 0
.09
0.5
9 ±
0.0
4
5.6
9
2.2
9
No
t a
ssig
ned
cy
clin
-D5
-1-l
ike (
MD
P0
00
021
367
7)
ch
r8
:12
,108
,02
3..1
2,1
08,6
51
0 ±
0
0.2
9 ±
0.1
9
on
ly A
RD
1
.09
Pro
tein
pro
cess
ing
elon
gat
ion
fac
tor
1-g
amm
a-li
ke
(MD
P0
000
701
209
) ch
r15
:45
,89
2,0
60
..45
,892
,90
0
0.2
6 ±
0.0
3
0.5
2 ±
0.2
1
2.0
1
0.7
5
Pro
tein
process
ing
AA
A-A
TP
ase
AS
D, m
ito
ch
on
dri
al-
lik
e (
MD
P0
000
676
693
) ch
r17
:2,9
24
,00
6..2
,926
,952
1.1
4 ±
0.3
5
2.7
7 ±
1.1
8
2.4
4
0.7
6
Pro
tein
process
ing
mech
an
ose
nsi
tive i
on
ch
an
nel
pro
tein
6 (
MD
P000
074
864
2)
ch
r10
:7,0
42
,50
2..7
,055
,407
0.1
6 ±
0.0
8
0.5
5 ±
0.1
5
3.4
4
0.8
0
Pro
tein
process
ing
AT
P-d
ep
en
den
t zin
c m
eta
llo
pro
tea
se F
TS
H 9
(M
DP
0000
468
286
) ch
r11
:7,0
83
,36
8..7
,088
,664
0.1
6 ±
0.0
8
0.6
3 ±
0.2
9
3.9
2
0.9
7
Pro
tein
process
ing
F-b
ox p
rote
in S
KIP
2-l
ike (
MD
P0
000
415
972
) ch
r8
:13
,916
,19
1..1
3,9
17,1
05
0 ±
0
0.0
6 ±
0.0
5
on
ly A
RD
1
.19
RN
A p
roce
ssin
g
hea
t sh
ock
fac
tor
pro
tein
HS
F3
0-l
ike
(MD
P00
004
898
86
) ch
r8:8
,198
,43
0..8
,199
,82
7
1.2
2 ±
0.5
0
± 0
on
ly γ
AR
D
2.4
5
RN
A p
ro
cess
ing
tra
nsc
rip
tio
n f
acto
r H
EC
2-l
ike (
MD
P0
000
249
405
) ch
r15
:2,4
02
,08
9..2
,402
,841
0.7
3 ±
0.2
8
1.5
1 ±
0.1
7
2.0
8
1.1
3
RN
A p
ro
cess
ing
two
-co
mp
on
en
t resp
on
se r
eg
ula
tor
OR
R9
-lik
e (
MD
P0
000
585
643
) ch
r10
:12,6
76
,869
..12
,683
,72
8
0.9
8 ±
0.2
7
2.3
7 ±
0.5
9
2.4
3
0.7
6
RN
A p
roce
ssin
g
eth
yle
ne-
resp
on
sive
tran
scri
pti
on f
acto
r E
RF
113
(M
DP
0000
316
694
) ch
r4:7
,197
,13
4..7
,203
,92
2
0.4
8 ±
0.1
5
1.2
4 ±
0.5
2
.60
0.7
2
RN
A p
ro
cess
ing
ma
jor a
ller
gen
Ma
l d
1-l
ike (
MD
P00
001
162
44
) ch
r16
:11,4
33
,701
..11
,434
,30
5
0.3
4 ±
0.1
9
1.0
4 ±
0.4
1
3.0
1
1.0
8
RN
A p
roce
ssin
g
pro
bab
le W
RK
Y t
ran
scri
pti
on
fac
tor
9 (
MD
P00
001
377
04
) ch
r15
:43
,86
5,6
69
..43
,869
,89
4
0.1
1 ±
0.0
9
0.6
2 ±
0.1
5
.71
1.9
8
RN
A p
roce
ssin
g
maj
or
alle
rgen
Mal
d 1
-lik
e (M
DP
00
00
260
110
) ch
r13
:14
,51
4,4
76
..14
,514
,95
5
0.0
2 ±
0.0
4
0.3
7 ±
0.2
4
14.8
9
2.4
0

97
Ma
pM
an
fun
cti
on
al
ca
tego
ry
Gen
e C
hro
mo
som
al
loca
tio
n o
f
MD
P I
D
No
rm
ali
zed
tra
nsc
rip
t a
bu
nd
an
ce
γA
RD
± S
D
No
rm
ali
zed
tra
nsc
rip
t a
bu
nd
an
ce
AR
D ±
SD
Ra
tio
Co
ntr
ibu
tio
n
[%]
Sig
na
lin
g
pro
ba
ble
ca
lciu
m-b
ind
ing
pro
tein
CM
L27
(M
DP
0000
330
029
) ch
r14
:28,3
14
,468
..28
,315
,04
1
0.9
1 ±
0.2
4
1.9
2 ±
0.7
2
2.1
1
0.7
2
Sig
na
lin
g
cy
stei
ne-r
ich
rec
ep
tor-l
ike p
ro
tein
kin
ase
10
(M
DP
00
001
213
05
) ch
r6
:23
,096
,14
9..2
3,1
00,6
40
1.6
6 ±
0.5
4
4.3
3 ±
0.6
3
2.6
0
0.7
0
Sig
na
lin
g
hig
h-a
ffin
ity n
itra
te t
ra
nsp
orte
r 3
.2 (
MD
P00
002
779
26
) ch
r6
:19
,059
,16
6..1
9,0
60,7
29
0.4
9 ±
0.3
5
1.8
2 ±
0.4
9
3.7
4
0.7
7
Str
ess
hea
t sh
ock
pro
tein
90
-2-l
ike
(MD
P000
085
363
8)
chr9
:238
,47
6..2
38
,91
3
0.7
2 ±
0.2
4
0.2
± 0
.17
-3.5
9
1.8
7
Str
ess
puta
tive
dis
ease
res
ista
nce
pro
tein
RG
A3
(M
DP
0000
142
781
) ch
r8:1
2,8
17
,214
..12
,82
0,1
23
0.0
2 ±
0.0
4
0.0
6 ±
0.0
5
2.3
7
1.7
8
*R
atio
s ar
e re
pre
sen
ted
by t
he
qu
oti
ent
of
AR
D/γ
AR
D w
ith v
alu
es b
etw
een
0 a
nd 1
bei
ng t
ran
sform
ed b
y u
sin
g t
he
neg
ativ
e re
cip
roca
l val
ue
of
the
qu
oti
ent.
Gen
es a
re o
rder
ed i
n a
lphab
etic
al o
rder
acc
ord
ing t
o t
hei
r
Map
Man
fun
ctio
nal
cat
egory
an
d t
hei
r ra
tio f
rom
low
est
to h
igh
est
val
ue.
Con
trib
uti
on g
ives
th
e val
ue
of
the
gen
e in
th
e P
CA
wh
ere
a val
ue
> 0
.69 %
is
con
sid
ered
rel
evan
t fo
r co
ntr
ibu
tion
in s
epar
atin
g t
he
gro
up
s
(AN
OS
IM:
R =
1, P
= 0
.1).
Bold
pri
nti
ng i
nd
icat
es s
ignif
ican
t co
rrel
atio
n (
P <
0.0
5)
to t
he
shoot
len
gth
acc
ord
ing t
o S
up
ple
men
tary F
ig. S
3.

98
4.3. Supplementary data
Supplementary Fig. S1. Expression of phytoalexin biosynthesis genes in γARD and ARD leaf samples analyzed by RT-qPCR. Differences
between treatments for BIS2 (a), BIS3 (b), BIS4 (c), OMTb (d), B4Ha (e) and B4Hb (f) at one time point were tested using a Welch Two
Sample t-test (means and standard deviations of n = 5) with significant differences shown for P < 0.05 (*), P < 0.01 (**) and P < 0.001
(***). Using a Tukey multiple comparisons test, differences between time points within one treatment were tested with different letters
indicating significant differences (P < 0.05, red color for γARD, blue color for ARD). The connection from the start of the experiment and
day 3 is indicated by a dotted line, because the plant material at day 0 represented freshly uprooted acclimatized plantlets which can only be
partly compared to the freshly potted plantlets at day 3.

99
Supplementary Fig. S2. Expression of plant defense genes, genes with regulatory functions and signaling genes in γARD and ARD leaf
samples analyzed by RT-qPCR. Differences between treatments for TL1 (a), TL1b (b), HSP17.1 (c), HSP17.3 (d), HSP18.5 (e), KFB1 (f),
EIL2 (g), EIL3 (h), IAA8 (i) and PTI5 (j) at one time point were tested using a Welch Two Sample t-test (means and standard deviations of
n = 5) with significant differences shown for P < 0.05 (*), P < 0.01 (**) and P < 0.001 (***). Using a Tukey multiple comparisons test,
differences between time points within one treatment were tested with different letters indicating significant differences (P < 0.05, red color
for γARD, blue color for ARD). The connection from the start of the experiment and day 3 is indicated by a dotted line, because the plant
material at day 0 represented freshly uprooted acclimatized plantlets which can only be partly compared to the freshly potted plantlets at
day 3.

100
Supplementary Fig. S3. Correlation matrix of shoot length and gene expression in leaf samples at day 7 in soil A. Blue color indicates a
positive correlation between variables whereas red color stands for a negative correlation between variables. The intensity of the color shows
the level of correlation between variables with darker colors representing stronger correlations (n = 3). Diagonally, values equal X = 1 as the
variables represent a correlation with themselves plus along this diagonal axis values are mirrored. Genes were ordered from top to bottom
according to their correlation with the shoot length. Bold printing indicates significant correlations among shoot length and genes.

101
Supplementary Table S1
Shoot growth response given as shoot length of ‘M26’ plants to γARD and ARD soil of two different
sites (A and K).* Time Site A Site K
γARD [cm] ARD [cm] γARD [cm] ARD [cm]
Day 0 3 ± 0.3 a 2.6 ± 0.3 a 4.3 ± 1.1 a 4.4 ± 1.1 a
Day 3 n. a. n. a. 4.5 ± 0.8 a 5.1 ± 1.2 abc
Day 7 3 ± 0.4 a 2.7 ± 0.3 a 5.7 ± 1.1 *** b 5 ± 1.1 b
Day 10 n. a. n. a. 6.5 ± 1.1 ** c 5.6 ± 0.8 cd
Day 14 3.8 ± 0.5 *a 2.9 ± 0.4 a 6.6 ± 1.3 *** c 5.5 ± 1.2 c
Day 21 5 ± 0.6 ***b 3.2 ± 0.5 a 7.1 ± 1.6 *** c 5.4 ± 1.1 bc
Day 28 10 ± 0.6 ***c 6.1 ± 0.3 b 9.2 ± 2.1 *** d 5.6 ± 0.9 cd
Day 35 13.4 ± 1 ***d 8.2 ± 0.5 bc 11.3 ± 2.8 *** de 6 ± 0.9 cde
Day 42 17.2 ± 1.3 ***de 10.5 ± 1 cd 13.9 ± 3.8 *** ef 6.3 ± 1 df
Day 49 22 ± 1.4 ***e 12.8 ± 1.8 de 16.6 ± 4.6 *** fg 6.6 ± 1.6 ef
Day 56 28.3 ± 2.3 ***f 15.8 ± 2.3 e 19.9 ± 5.3 *** g 7.9 ± 2.7 f
*Differences between treatments at one time point were tested using a Welch Two Sample t-test (means and standard deviations of n = 5 for
soil A and n0 = 175, n3;10;21;28;35;42;49;56 = 35, n7 = 140, n14 = 70 for soil K) with significant differences shown for P < 0.05 (*), P < 0.01 (**)
and P < 0.001 (***). Using a Tukey multiple comparisons test, differences between time points within one treatment were tested with
different letters indicating significant differences (P < 0.05). n. a. not available.
Supplementary Table S2
List of genes shared among leaves and roots with higher expression in γARD samples.* MapMan functional category MDP ID Name
Hormone metabolism MDP0000565846 multiprotein-bridging factor 1c-like
Hormone metabolism MDP0000303198 multiprotein-bridging factor 1c-like
Major CHO metabolism MDP0000285388 16.6 kDa heat shock protein-like
Not assigned MDP0000150261 conserved oligomeric Golgi complex subunit 7
Not assigned MDP0000849143 desumoylating isopeptidase 1
Not assigned MDP0000192271 molybdate-anion transporter-like
Not assigned MDP0000652797 pentatricopeptide repeat-containing protein At3g16010-like
Not assigned MDP0000247769 protein EXECUTER 1, chloroplastic-like
Not assigned MDP0000657396 protein FAM32A-like
Protein processing MDP0000190008 10 kDa chaperonin-like
Protein processing MDP0000336201 CDPK-related kinase 3-like
Protein processing MDP0000142577 subtilisin-like protease SBT2.2
Protein processing MDP0000570186 ubiquitin-like protein 5
RNA processing MDP0000243895 heat shock factor protein HSF30
RNA processing MDP0000155667 heat shock transcription factor 4 (HSF4)
RNA processing MDP0000174161 heat stress transcription factor A-3-like
RNA processing MDP0000228898 protein S-acyltransferase 1
Stress MDP0000291831 17.1 kDa class II heat shock protein-like
Stress MDP0000700383 17.1 kDa class II heat shock protein-like
Stress MDP0000548065 17.3 kDa class II heat shock protein-like
Stress MDP0000621193 17.3 kDa class II heat shock protein-like
Stress MDP0000172108 18.1 kDa class I heat shock protein-like
Stress MDP0000759666 18.5 kDa class I heat shock protein
Stress MDP0000795157 dnaJ homolog subfamily B member 1-like
Stress MDP0000254260 heat shock protein 83-like
Stress MDP0000161691 hsp70-Hsp90 organizing protein 3-like
Stress MDP0000145097 MLO-like protein 11
Stress MDP0000214382 small heat shock protein
Transport MDP0000280043 cation/H(+) antiporter 15-like
Transport MDP0000173864 TMV resistance protein N-like
*List corresponds to Fig. 2. Genes are ordered in alphabetical order according to their MapMan functional category.
Bold printing indicates genes also part of the FTP data set (Supplementary Table S4).
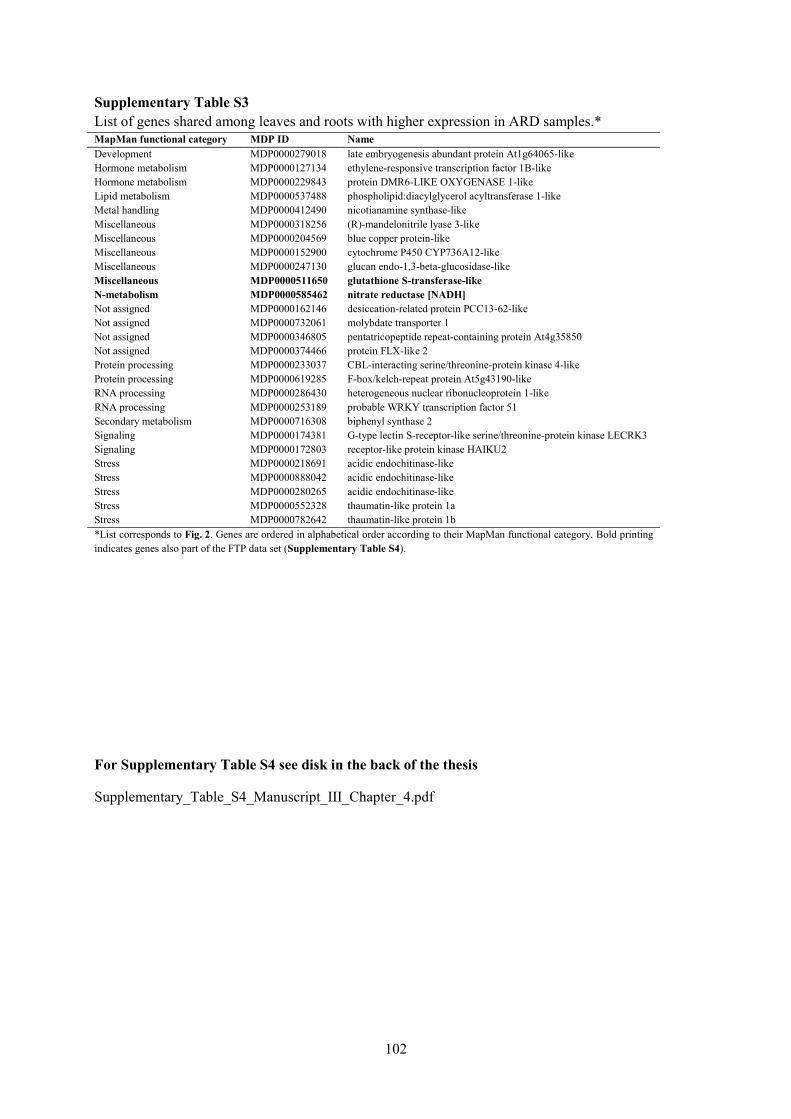
102
Supplementary Table S3
List of genes shared among leaves and roots with higher expression in ARD samples.* MapMan functional category MDP ID Name
Development MDP0000279018 late embryogenesis abundant protein At1g64065-like
Hormone metabolism MDP0000127134 ethylene-responsive transcription factor 1B-like
Hormone metabolism MDP0000229843 protein DMR6-LIKE OXYGENASE 1-like
Lipid metabolism MDP0000537488 phospholipid:diacylglycerol acyltransferase 1-like
Metal handling MDP0000412490 nicotianamine synthase-like
Miscellaneous MDP0000318256 (R)-mandelonitrile lyase 3-like
Miscellaneous MDP0000204569 blue copper protein-like
Miscellaneous MDP0000152900 cytochrome P450 CYP736A12-like
Miscellaneous MDP0000247130 glucan endo-1,3-beta-glucosidase-like
Miscellaneous MDP0000511650 glutathione S-transferase-like
N-metabolism MDP0000585462 nitrate reductase [NADH]
Not assigned MDP0000162146 desiccation-related protein PCC13-62-like
Not assigned MDP0000732061 molybdate transporter 1
Not assigned MDP0000346805 pentatricopeptide repeat-containing protein At4g35850
Not assigned MDP0000374466 protein FLX-like 2
Protein processing MDP0000233037 CBL-interacting serine/threonine-protein kinase 4-like
Protein processing MDP0000619285 F-box/kelch-repeat protein At5g43190-like
RNA processing MDP0000286430 heterogeneous nuclear ribonucleoprotein 1-like
RNA processing MDP0000253189 probable WRKY transcription factor 51
Secondary metabolism MDP0000716308 biphenyl synthase 2
Signaling MDP0000174381 G-type lectin S-receptor-like serine/threonine-protein kinase LECRK3
Signaling MDP0000172803 receptor-like protein kinase HAIKU2
Stress MDP0000218691 acidic endochitinase-like
Stress MDP0000888042 acidic endochitinase-like
Stress MDP0000280265 acidic endochitinase-like
Stress MDP0000552328 thaumatin-like protein 1a
Stress MDP0000782642 thaumatin-like protein 1b
*List corresponds to Fig. 2. Genes are ordered in alphabetical order according to their MapMan functional category. Bold printing
indicates genes also part of the FTP data set (Supplementary Table S4).
For Supplementary Table S4 see disk in the back of the thesis
Supplementary_Table_S4_Manuscript_III_Chapter_4.pdf

103
5. General discussion
ARD is not well understood on the molecular level in planta. This work aimed to contribute to uncover
involved mechanisms in the disease etiology. The results of the three submitted studies were already
covered and discussed in the manuscripts. Here, main findings will be summarized and additional
aspects will be emphasized based on the objectives (see 1.9.). Furthermore, a conclusion and outlook
on future research based on these studies will be given.
5.1. How do ARD affected ‘M26’ plants react to ARD on the transcriptomic level?
Unraveling the responses of ARD affected ‘M26’ plants on the transcriptomic level was the main
driver of this study (see 2., 3. and 4.). The use of MACE and coupled RT-qPCR analyses resulted for
the first time in an overview of molecular reactions in the highly ARD-sensitive apple rootstock
‘M26’. Taking all the findings into consideration it is justified in saying that strong biotic stress
responses take place on the transcriptomic level in both root and leaf material but the reaction towards
ARD was not adequate as ARD-challenged plants still demonstrated severe growth inhibition. The
growth inhibition was incited by biotic factors in ARD soils because disinfection improved plant
growth tremendously. Most interestingly, PA biosynthesis genes and corresponding products were
found to be differentially regulated and their possible role in ARD will be further discussed (see 5.5.).
Next to the obvious lack of effect from PAs, surprisingly, the often reported function of
phytohormones in biotic stress responses was also potentially suppressed or impaired in this study
based on gene expression data, and first experiments dealing with the quantification of jasmonic acid
(JA) in roots did not reveal differences between variants either (group of Prof. Winkelmann,
Hannover, unpublished data). Next to JA, ethylene (ET) usually plays an important role in defense
responses but in this study diverse behavior of ET genes were detected, therefore future studies would
have to test more genes in more detail to make definitive conclusions about the role of ET, JA and
other phytohormones in ARD responses. Nevertheless, the role of phytohormones in root-shoot
signaling may have been affected as Shin et al. (2016) reported about the possibly unique role of
cytokinin in ARD, and the upregulation of a two-component response regulator involved in the
cytokinin-activated signaling pathway was higher expressed in ARD samples of this study as well (see
4.) which presents an interesting starting point for additional gene expression analyses including more
cytokinin related genes. Furthermore, root-shoot signaling may have been hinted at by the
upregulation of a high-affinity nitrate transporter involved in NO signaling as discussed before (see
4.). In sum, ‘M26’ plants possibly reacted with inefficient defense reactions to ARD causal agents and
defense responses presumably also may have been suppressed by the biotic stressors. Functional
analysis of discussed genes may help in further understanding affected molecular reactions in ARD-
challenged ‘M26’ plants, in particular root-shoot communication seems to present an interesting
starting point for future experiments as roots are in direct contact with the biotic stress but shoots show
first observable ARD symptoms in the form of diminished shoot growth.

104
5.2. Does biotic stress by exposing the root system to ARD lead to a systemic response in aboveground
tissue?
Roots are in direct contact with the soil and therefore have to endure the biotic stress presumably in
form of microorganisms located in the rhizosphere continuously. Nevertheless, first striking symptoms
of ARD can be observed aboveground as shoots will be diminished in their potential growth whereas
roots show a delayed effect regarding biomass. Yim et al. (2013) stated that root dry mass was not as
severely affected by ARD as shoot dry mass because roots needed to grow more to counterbalance
damages in the root system. Hence, in regard of the actual effect of ARD, plants react to the problem
with a systemic response. Based on the results obtained in this work, it may be even concluded that
also on the transcriptomic level there is a systemic response to biotic stress as outlined by the
simultaneous expression of many – albeit differing – biotic stress associated genes. However,
candidate genes – identified in roots – analyzed in this study did not show a systemic response and in
general only a small portion of genes were simultaneously expressed in both tissues (see 4.). Only PA
biosynthesis genes showed a delayed systemic response to ARD. Genes of the BIS, OMT and B4H
gene families revealed an upregulation in ARD variants starting from days 10-14. However, compared
to their counterparts in roots, the expression was extremely low. Based on the transcriptomic analysis
it can be concluded that plants possibly suffered from systemic oxidative stress as demonstrated by the
upregulation of many genes involved in ROS induced reactions both in roots and leaves. These results
are in line with observations in ARD affected apple seedlings where ARD led to systemic oxidative
stress (Henfrey et al. 2015).
5.3. Are ARD affected molecular reactions in the plant conserved among different ARD soils?
It was of utmost interest if identified genes showed a similar behavior in ‘M26’ plants grown on ARD
soils differing in cropping history and soil properties because next to better understanding ARD on a
molecular level in planta, genes with conserved expression among different soils could be used as
indicator genes for using the highly susceptible apple rootstock ‘M26’ in testing soils for ARD
incidence which would represent a further improvement of the biotest system established by Yim et al.
(2013). Possible candidates for indicator genes have to be stably expressed in ARD-affected plants
even when faced with different ARD soils and they should show a strong and early expression for easy
detection via RT-qPCR techniques.
In this work, it could be shown that the employed ARD soils differed in ARD severity which
was shown by different shoot growth rates in soil A and soil K, and the conserved but higher
regulation of PA biosynthesis genes in roots of ARD variants cultivated in soil K (see 3.). Especially,
BIS genes showed the highest expression led by BIS3 which may be used as a potential indicator gene.
But potential indicator genes will have to be tested in additional different ARD soils to collect more
data points. Nevertheless, the very early induction of PA biosynthesis genes in ‘M26’ is a promising
result for using these candidates as indicators of ARD severity in soils. However, not all genes were

105
conserved in their expression in ‘M26’ among different soils, e.g. heat shock protein genes, hinting at
soil specific reactions induced by diverse biotic stressors in ARD soils or at indeed heat stress.
5.4. Is there a time-dependent effect on ARD affected molecular reactions?
A time-dependent expression of candidate genes could be observed but was also dependent on the
candidate gene as well as tissue analyzed (see 3. and 4.). The most impressive results were once again
obtained for PA biosynthesis genes which showed a very high expression and regulation already after
3 days in roots. Whereas BIS genes stayed on the same expression level afterwards, OMT and B4H
revealed an additional peak after 10 days. As the actual products, biphenyls and dibenzofurans. were
found in elevated concentrations corresponding to the expression of genes, PAs must play a vital role
in ARD (see 5.5.) as also in leaves PA biosynthesis genes revealed an upregulation in ARD variants
starting from days 10-14. Other genes in leaves which were analyzed by RT-qPCR sometimes showed
a time-dependent expression pattern but variants rarely revealed significant differences at one time
point, hence genes that were found in the leaf MACE analysis (see 4.) would present additional
starting points to better understand ARD in regard of affected molecular reactions in the whole plant.
5.5. Potential enhanced role of PAs in ARD
Biotic factors play a predominant role in causing ARD and amongst them fungi were considered most
important (Manici et al. 2013; Franke-Whittle et al. 2015). This was also highlighted by the high
expression of PA biosynthesis genes under ARD conditions in this work. Gene expression was
coupled with the extraordinary high amounts of biphenyls and dibenzofurans found in root material.
Nevertheless, abiotic factors cannot be excluded totally and lately, more studies have been conducted
in analyzing the role of allelochemicals and root exudates in ARD (Manici et al. 2016; Yin et al. 2016,
2017; Zhu et al. 2017).
Phenolic compounds belong to the rich group of secondary metabolites in plants and they are
indicated by hydroxylated aromatic rings involved in disease resistance (Singh et al. 1999; Wu et al.
2001). They may be released by plants through leaching, root exudation, volatilization or decay of
plant materials (Gur and Cohen 1989; Kuiters 1990; Wu et al. 2000; Politycka and Adamska 2003;
Weir et al. 2004; Zhang et al. 2007; Baerson et al. 2008). They can enhance ROS production and
damage the plant’s antioxidant system under replant conditions (Yin et al. 2016; Zhu et al. 2017)
ending with augmented membrane leakage in addition to disruption of amino acid and hormone
metabolism (Weir et al. 2004; Gao et al. 2010) but on the other hand they can act as ROS scavengers
as well (Henfrey et al. 2015).
It could be shown that phenols exuded by roots and decomposed roots of preceding cultures
are one of the causes of ARD (Börner 1959; Bai et al. 2009; Gao et al. 2010; Nicola et al. 2016; Yin et
al. 2016, 2017), pointing to phloretin, phloridzin and amygdalin inhibiting apple growth even in low
concentrations and affecting microbial communities in soils (Börner 1959; Baerson et al. 2008; Jilani
et al. 2008; Hofmann et al. 2009; Nicola et al. 2016; Yin et al. 2016, 2017). This may also be true for

106
the PAs found in this work as Yim et al. (2015) – working with the same soil – found bacterial
degraders of phenolic compounds to be less abundant in ARD soils pointing to detrimental soil
microbial community shifts. Fungi which are able to use the identified PAs as a recognition compound
may therefore be activated or promoted as also suggested by other studies (Börner 1959; Hofmann et
al. 2009; Cesco et al. 2012; Nicola et al. 2016). Phloridzin was found to promote growth of Fusarium
spp. (Yin et al. 2017) which were found to produce allelochemicals negatively affecting plant growth
possibly due to synergistic interaction of fusaric acid with other toxins suppressing development and
biomass via reduced transpiration and photosynthesis rates (Bacon et al. 1996; Wu et al. 2008; Manici
et al. 2016).
Moreover, phenols also react with the soil through ligand exchange reactions, oxidation and
incorporation into organic matter in addition to soil sorption (Makino et al. 1996; Blum 1998; Blum et
al. 1999; Jilani et al. 2008). Whereas the half-life of free phenols in soils is rather short, sorption to
soil particles could lead to the build-up of increasing phytotoxic concentrations in the soil (Blum 1998;
Blum et al. 1999). For PAs in particular it could be shown that biphenyl-degrading bacteria are
environmentally omnipresent (Hernandez et al. 1995), and Pseudomonas putida as well as
Rhodococcus erythropolis were able to process soil-sorbed biphenyls (Feng et al. 2000). This would
hint at PAs having a potential long-term effect on plants by serving as a carbon source for
microorganisms in ARD soils. Incidence of citrus replant disease could still be found after 10 years
without growing citrus on site which led to the suggestion that allelopathic compounds involved in
disease etiology could exist in a subsoil environment (Burger and Small 1983). Furthermore, it was
concluded that due to a decline in beneficial fungi like Trichoderma viride which are capable of
breaking down phenolic compounds, toxins would be able to accumulate resulting in plant growth
reduction under sufficient concentrations (Burger and Small 1983). Hence, PAs may play a role as
allelochemicals in the long-term effect on orchards via nurturing disadvantageous microbial
community shifts.
Obviously, based on obtained results in this work it is not known if identified PAs are also
exuded into the soil but in vitro experiments eliciting PAs from ‘M26’ have shown that PAs were
excreted into the medium (cooperation Prof. Winkelmann and Prof. Beerhues,
Hannover/Braunschweig, unpublished data). Hence, theoretically it is possible for ‘M26’ to exude PAs
also into the soil and therefore leading to potential microbial community shifts.
Regardless, if the PAs were exuded into the soil, they were found in high concentrations in the
roots of ARD variants. As discussed above (see 3.), PAs may have led to a state of cytotoxicity due to
possible missing detoxification systems. Likewise, related phenols like phtalic acid in M. prunifolia
induced oxidative stress that resulted in cellular damage as well as growth inhibition (Bai et al. 2009).
Studies in A. thaliana have shown that the PA camalexin can be induced via PRR detection of
MAMPs like peptidoglycan, flagellin and chitin plus ethylene, jasmonic and salicylic acid, MAPKs as
well as ROS, often in interaction dependent pathways (Qutob et al 2006; Gust et al. 2007; Ahuja et al.

107
2012; Pandey et al. 2016). PTI might defend the plant from biotic stress in this regard but the cell wall
based host defense might be tuned down by pathogens secreting effector proteins directly into the
plant cells (Chizzali et al. 2012a). ETI could then be responsible for recognition of pathogens leading
to defense reactions (Lee and Lu 2011). Chizzali et al. (2012a) concluded that cellular borders would
have to be congested to block diffusion of toxins produced by infected cells or pathogens into
neighboring cells (Lee and Lu 2011).
It was shown that ethylene can induce synthesis of PAs derived from the phenylpropanoid
pathway (Kamo et al. 2000; Chung et al. 2001; Ishigaki et al. 2004). Further elicitation was observed
for Phytophthora spp. which produced parasiticein and cryptogein in tobacco which activated a
salicylate responsive kinase and other defense associated genes inducing PA production, stimulating
an oxidative burst, proton influx and HR cell death (Zhang et al. 1998). Whereas, in potato, Vicia fabia
and Phaseolus vulgaris, host resistance was correlated to the level of PA accumulation, Brassica spp.
and various cruciferous plants lacked this relationship and high PA concentrations can potentially lead
to cytotoxicity (Dixon et al. 1994; Rogers et al. 1996). Loss of tonoplast integrity leading to the release
of toxic plant metabolites and hydrolytic enzymes was attributed to the PA phaseolin killing bean and
beet cells (Glazener and Van Etten 1978; Hargreaves 1980) and also in A. thaliana the PA camalexin
led to cytotoxicity (Rogers et al. 1996). As PAs were higher in ARD variants and for aucuparin and 3-
hydroxy-5-methoxybiphenyl exclusively found in this variant, PTI must have worked for ‘M26’
plants. However, in a second step, it is probable that ETI did not work and biotic stressors were able to
suppress the effect of PAs in stopping pathogens probably by the release of effectors or toxins as some
fungi and oomycetes develop haustoria from which they can release such substances into the plant cell
(De Coninck et al. 2014). Interestingly, resistance genes possibly responsible for the detection of such
molecules were found in this study as well but they were not discussed in the submitted manuscripts.
Twenty-one NBS-LRR genes with a FDR (false discovery rate) adjusted p < 0.05 were detected in
roots (see 2. Manuscript I, Supplementary Table S1). Although, only two of these genes showed at
least a 2-fold downregulation in ARD samples (MDP0000185737 and MDP0000276078), in total
15 genes were of lower expression in ARD roots, while six genes were slightly upregulated. The
higher amount of genes with lower expression in ARD variants supports the view that ETI might not
work properly in ARD challenged ‘M26’ plants as genes for the potential detection of detrimental
effectors were only expressed on a lower level in ARD roots.
Interestingly, ROS-triggered HRs leading to cell death or PA-induced cytotoxicity would
favor the colonization of the root system by necrotrophic fungi (Pandey et al. 2016) which play an
elevated role in causing ARD (Manici et al. 2013; Franke-Whittle et al. 2015). In addition, it was
suggested that the recognition of MAMPs in roots would lead to a continuous activation of inducible
defense responses which would cost the plant a lot of energy that could not be used for plant growth
(De Coninck et al. 2014). The plant’s fitness would be negatively affected as suggested by the
proposed immunity-growth tradeoff which states that plants have to make a decision on how much

108
energy they are willing to sacrifice from growth related processes to defense against pathogens (Heil
and Baldwin 2002; Huot et al. 2014).
Oxidation, hydroxylation, dealkylation and glutathione conjugation have been discussed in
detoxification via glutathione S-transferases (GSTs), malonyltransferases, UDP-glucosyltransferases
(UGTs) and cytochrome P450 dependent hydroxylases (CYPs). These general detoxification processes
and involved enzymes were proposed to play a major role in the formation of non-toxic glycosides as
well as glutathione and malonyl conjugates which can be deposited in vacuoles or associated with cell
wall material (Kuiters 1990; Cole 1994; Singh et al. 1999; Inderjit and Duke 2003; Baerson et al.
2005; Gosch et al. 2010). H+-gradient-dependent transport and ATP-binding cassette (ABC)
transporters are reported to be involved in the vacuolar sequestration of such glucosides (Yazaki
2005). Corresponding genes were not discussed in the submitted manuscripts, however, in total
10 GSTs, 15 UGTs and 21 CYPs with a FDR adjusted p < 0.05 were found in roots (see 2. Manuscript
I, Supplementary Table S1). Three GSTs were of lower expression in ARD whereas seven GSTs were
upregulated in ARD samples but only one of these GSTs was upregulated more than 2-times
(MDP0000161016; 2.59). Five UGTs were higher expressed in γARD samples, of which one showed
a relevant fold change (MDP0000423529; -2.78), compared to 10 UGTs in ARD samples, of which
one showed a fold change greater two (MDP0000160578; 2.59). Of the 21 CYPs, seven were
downregulated in ARD samples – four were regulated more than 2-fold (MDP0000119148,
MDP0000166337, MDP0000149604 and MDP0000215936) – whereas 14 showed higher expression
in ARD samples, of which three revealed at least 2-times regulation (MDP0000184534,
MDP0000879787 and MDP0000152900). In sum, this reveals a diverse expression behavior of genes
with possible detoxification characteristics and it is fascinating to speculate about presumably
impaired detoxification systems in ‘M26’ under ARD conditions but functional analysis of these genes
is necessary to draw any definitive conclusions.
OMTs may play an important role in distributing PAs to the apoplastic space because
alkylation of hydroxyl groups leads to changes in solubility impacting localization and biological
activity of metabolites (Ibrahim et al. 1987; Zubieta et al. 2001; Berim et al. 2012). In this regard,
glucosylation increases the water solubility of a compound, then accumulating in vacuoles whereas
methylation decreases the water solubility and leads to the transport of a metabolite from the cell into
the apoplastic space (Grotewold 2004; Yazaki 2005; Marinova et al. 2007). The sequestration or
release into the apoplast via exocytosis is mediated by ABC membrane-associated transporters
(Baerson et al. 2005). Chizzali et al. (2012a) speculated that BIS3 protein is associated with
plasmodesmata due to its detection at the junctions between cortical parenchyma cells. The authors
pointed to the importance of plasmodesmata in symplastic communication between neighboring cells
as well as translocation of signaling molecules being involved in the coordination of growth and
development and serving as potential gateways to spread infection from pathogens from cell to cell
(Maule 2008; Lucas et al. 2009; Lee and Lu 2011). Seven ABC transporters with a FDR adjusted

109
p < 0.05 were found in roots (see 2. Manuscript I, Supplementary Table S1) but none of them showed
a regulation greater two, five were downregulated and two were upregulated in ARD samples.
Interestingly, so far, no glycosides of biphenyls and dibenzofurans were detected in intact
plants of apple (Chizzali and Beerhues 2012; Chizzali et al. 2012b) and also in this study no glucosyl
transformation of PAs could be detected on the metabolic level. Therefore, also probable
compartmentation in vacuoles is unlikely and hints at the possibility of impaired detoxification
systems in ARD susceptible ‘M26’ plants. To better understand the involvement of PAs in ARD,
experiments should be performed in locating the expression of PA biosynthesis enzymes. When plants
produce high amounts of PAs and are not able to detoxify the compounds, they probably kill
themselves trying to defend against the biotic stressors.
Nevertheless, PAs cannot be regarded as the primary cause for ARD as disinfection of ARD
soil resulted in improved apple plant growth. Biotic stressors in the rhizosphere are the main culprit
for ARD. It now remains to be seen which microorganisms in particular trigger the PA biosynthesis in
the ARD-susceptible apple rootstock ‘M26’. Experiments testing the interaction of microorganisms
with PA biosynthesis should be conducted. However, experimental designs will not be trivial as many
potential causal agents have been reported in ARD and even the often reported genera of
Cylindrocarpon spp., Pythium spp. and Phytophthora spp. include many different species.
Nonetheless, Shin et al. (2014, 2016) infected apple seedlings with one of the potential ARD causal
agents, namely Pythium ultimum and they were able to show differential regulation of several genes.
These studies could serve as a blueprint in testing different reported ARD causal agents which could
probably reduce the complexity of ARD inciting microorganisms majorly if differential regulation of
PA biosynthesis genes could be observed.
5.6. Conclusion and outlook
Taking all the findings of this work into consideration together with results already reported in ARD,
PAs seem to play an enhanced role in the disease etiology of the susceptible apple rootstock ‘M26’.
While leaves seemed to suffer from systemic oxidative stress mediated via biotic stress in roots, the
accumulation of biphenyl and dibenzofuran PAs in the root system – for the first time reported in
apple roots – may hint at impaired biotic stress responses in ARD challenged ‘M26’ plants. In this
study it was clearly shown that biotic stressors affected the plant growth of ‘M26’ because γ-
irradiation majorly improved the plants’ habitus. Figure 5.1 presents an overview of the potential
reactions involving PAs in ARD and resulting future research requirements. Most likely ARD causal
agents led to the induction of PA biosynthesis genes (1) which requires the further elucidation of the
specific ARD causal agents being responsible for the induction of PAs. The resulting products
accumulated in the root system and reached concentrations that were extraordinary high compared to
other studies (2). In addition, localized concentrations can be assumed to be even higher resulting in a
possible state of cytotoxicity for plants as the detoxification of compounds was not possible either

110
because of insufficient/lacking systems or suppression via detrimental ARD microorganisms which
has to be tested in future experiments. In addition, it remains to be seen if PAs may be excreted into
the soil solution via exudation or leeching (3), and if potential sorption of PAs to soil particles is
possible (4) presenting the microbiome with a possible long-term carbon supply for detrimental
microbial community shifts (5) which also should be further investigated. Tolerant genotypes may
possess the ability of efficiently using the well-established defense response of PA production, either
through controlled induction or differing PA composition, plus they may inhabit potent detoxification
systems which presents additional research questions to be followed as well.
Figure 5.1 Hypothetical proposed reactions in ARD affected ‘M26’ roots and resulting future research requirements (1-5, see text).
Microorganisms in ARD soil try to infect the root system which leads to the subsequent induction of PA biosynthesis genes encoding
amongst others BIS, OMT and B4H enzymes (1). This results in the production of biphenyls and dibenzofuran PAs (red spheres) in high
concentrations which could end in potential cytotoxicity (2). PAs might be exuded or leeched into the soil (3) where they could possibly bind
to soil particles for long-term sorption (4) and might potentially be used by microorganisms being able to employ PAs as a carbon source
leading to likely detrimental microbial community shifts further aggravating ARD (5).
The results obtained in this work demonstrate for the first time molecular reactions in ARD
affected ‘M26’ plants. However, they can only serve as a base for further studies as the conclusions
drawn from results are highly speculative at this point, even if they are fundamentally sound. First of
all, future experiments have to test the hypothesis of potential PA cytotoxicity in ‘M26’ plants. This
will be prevalent in determining the role of PAs in ARD. Furthermore, PAs should be studied in
regard of potential detoxification, localization and exudation. Clearly, the obtained results have to be
tested in other genotypes to better understand ARD in planta. Comparing more tolerant genotypes
could eventually help in determining molecular markers for breeding and selection processes.
Additionally, functional analysis of discussed genes may help in further understanding affected
molecular reactions in ARD-challenged ‘M26’ plants. Finally, it should be mentioned that studies
dealing with biotic stress should always link results obtained for plants with the biotic stressors
themselves. Hence, inoculation experiments with certain ARD pathogens correlated to PA
biosynthesis gene expression and metabolite accumulation as well as effects of PAs on microbial

111
characteristics could present an interesting option. As discussed in 5.5., it will also be interesting to see
which microorganisms actually cause the high upregulation of PA biosynthesis genes.
References
Ahuja I, Kissen R, Bones AM (2012) Phytoalexins in defense against pathogens. Trends Plant Sci 2:1360-1385.
Atucha A, Emmett B, Bauerle TL (2014) Growth rate of fine root systems influences rootstock tolerance to replant disease. Plant Soil
376:337-346.
Bacon CW, Porter JK, Norred WP, Leslie JF (1996) Production of fusaric acid by Fusarium species. Appl Environ Microbiol 62:4039-4043.
Baerson SR, Sánchez-Moreiras A, Pedrol-Bonjoch N, Schulz M, Kagan IA, Agarwal AK, Reigosa MJ, Duke SO (2005) Detoxification and
Transcriptome Response in Arabidopsis Seedlings Exposed to the Allelochemical Benzoxazolin-2(3H)-one. J Biol Chem
280:21867-21881.
Baerson SR, Dayan FE, Rimando AM et al. (2008) A functional genomics investigation of allelochemical biosynthesis in Sorghum bicolor
root hairs. J Biol Chem 283:3231-3247.
Bai R, Ma FW, Liang D, Zhao X. (2009) Phthalic acid induces oxidative stress and alters the activity of some antioxidant enzymes in roots
of Malus prunifolia. J Chem Ecol 35:488-494.
Berim A, Hyatt DC, Gang DR (2012) A set of regioselective O-methyltransferases gives rise to the complex pattern of methoxylated
flavones in sweet basil. Plant Physiol 160:1052-1069.
Blum U (1998) Effects of microbial utilization of phenolic acids and their phenolic acid breakdown products on allelopathic interactions. J
Chem Ecol 24:685-708.
Blum U, Shafer SR, Lehman ME (1999) Evidence for inhibitory allelopathic interactions involving phenolic acids in field soils: Concepts vs.
an experimental model. Crit Rev Plant Sci 18:673-693.
Börner H (1959) The apple replant problem. I. The excretion of phloridzin from apple root residues. Contributions of the Boyce Thompson
Institute of Plant Research 20:39-56.
Boller T, Felix G (2009) A Renaissance of Elicitors: Perception of Microbe-Associated Molecular Patterns and Danger Signals by Pattern-
Recognition Receptors. Annu Rev Plant Biol 60:379-406.
Borejsza-Wysocki W, Lester C, Attygalle AB, Hrazdina G (1999) Elicited cell suspension cultures of apple (Malus x domestica) cv. Liberty
produce biphenyl phytoalexins. Phytochemistry 50:231-235.
Brown S (2012): Apple. In: Badenes ML, Byrne DH, eds. Fruit Breeding. Springer:329-367.
Burger WP, Small JGC (1983). Allelopathy in citrus orchards. Sci Hort 20:361-375.
Byrne DH (2012): Trends in Fruit Breeding. In: Badenes ML, Byrne DH, eds. Fruit Breeding. Springer:3-36.
Caputo F, Nicoletti F, De Luca Picione F, Manici LM (2015) Rhizospheric changes of fungal and bacterial communities in relation to soil
health of multi-generation apple orchards. Biol Control 88:8-17.
Caruso FL, Neubauer BF, Begin MD (1989) A histological study of apple roots affected by replant disease. Can J Bot 67:742-749.
Cesco S, Mimmo T, Tonon G et al. (2012) Plant-borne flavonoids released into the rhizosphere: impact on soil bio-activities related to plant
nutrition. A review. Biol Fertil Soils 48:123-149.
Chizzali C, Beerhues L (2012) Phytoalexins of the Pyrinae: biphenyls and dibenzofurans. Beilstein J Org Chem 8:613-620.
Chizzali C, Gaid MM, Belkheir AK, Hänsch R, Richter K, Flachowsky H, Peil A, Hanke MV, Liu B, Beerhues L (2012a) Differential
Expression of Biphenyl Synthase Gene Family Members in Fire-Blight-Infected Apple ‘Holsteiner Cox’. Plant Physiol 158:864-
875.
Chizzali C, Khalil MNA, Beuerle T, Schuehly W, Richter K, Flachowsky H, Peil A, Hanke MV, Liu B, Beerhues L (2012b) Formation of
biphenyl and dibenzofuran phytoalexins in the transition zones of fire blight-infected stems of Malus domestica cv. ‘Holsteiner
Cox’ and Pyrus communis cv. ‘Conference’. Phytochemistry 77:179-185.
Chung IM, Park MR, Rehman S, Yun SJ (2001) Tissue specific and inducible expression of resveratrol synthase gene in peanut plants. Mol
Cell12:353-359.
Cole JD (1994) Detoxification and activation of agrochemicals in plants. Pestic Sci 42:209-222.
Covey R, Benson NR, Haglund WA (1979) Effects of soil fumigation on the apple replant disease in Washington. Phytopathology 69:684-
686.
Dangl JL, Jones JDG (2001) Plant pathogens and integrated defence responses to infection. Nature 411:826-833.
De Coninck B, Timmermans P, Vos C, Cammue BPA, Kazan K (2014) What lies beneath: belowground defense strategies in plants. Trends
Plant Sci 20:91-101.

112
Ding J, Sun Y, Xiao, CL, Yan KS, Zhou H, Yu JQ (2007) Physiological basis of different allelopathic reactions of cucumber and figleaf
gourd plants to cinnamic acid. J Exp Bot 58:3765-3773.
Dixon RA, Maxwell CA, Ni W, Oommen A, Paiva NL (1994) Genetic Manipulation of Lignin and Phenylpropanoid Compounds Involved in
Interactions with Microorganisms. In: Ellis BE, Kuroki GW, Stafford HA (eds) Genetic Engineering of Plant Secondary
Metabolism. Springer, New York, pp 153-178.
Dixon RA (2001) Natural products and plant disease resistance. Nature 411:843-847.
Durrant WE, Rowland O, Piedras P, Hammond-Kossak KE, Jones JDG (2000) cDNA-AFLP reveals a striking overlap in the race-specific
resistance and wound response expression profiles. Plant Cell 12:963-977.
Emmett B, Nelson EB, Kessler A, Bauerle TL (2014) Fine-root system development and susceptibility to pathogen colonization. Planta
239:325-340.
FAOSTAT (2014) http://www.fao.org/faostat/en/#data (accessed 02/09/2017).
Feng Y, Park JH, Voice TC, Boyd SA (2000) Bioavailability of Soil-Sorbed Biphenyl to Bacteria. Environ Sci Technol 34:1977-1984.
Forge T, Neilsen G, Neilsen D (2016) Organically acceptable practices to improve replant success of temperate tree-fruit crops. Sci Hortic-
Amsterdam 200:205-214.
Franke-Whittle IH, Manici LM, Insam H, Stres B (2015) Rhizosphere bacteria and fungi associated with plant growth in soils of three
replanted apple orchards. Plant Soil 395:317-333.
Gao XB, Zhao FX, Shen X, Hu YL, Hao YH, Yang SQ, Su LT, Mao ZQ (2010) Effects of Cinnamon Acid on Respiratory Rate and Its
Related Enzymes Activity in Roots of Seedlings of Malus hupehensis Rehd. Agr Sci China 9:833-839.
Gastol M, Domagala-Swiatkiewicz I (2015) Mycorrhizal inoculation of apple in replant soils – enhanced tree growth and mineral status. Acta
Sci Pol Hortorum Cultus 14:17-37.
Gessler C, Patocchi A (2007) Recombinant DNA Technology in Apple. Adv Biochem Engin/Biotechnol 107:113-132.
Glazener JA, Van Etten HD (1978) Phytotoxicity of phaseollin to, and alteration of phaseollin by, cell suspension cultures of Phaseolus
vulgaris. Phytopathology 68:111-117.
Gosch C, Halbwirth H, Stich K (2010) Phloridzin: biosynthesis, distribution and physiological relevance in plants. Phytochemistry 71:838-
843.
Granatstein D, Mazzola M (2001) Alternatives to fumigation for control of apple replant disease in Washington state orchards. Integr Fruit
Prod 24:265-271.
Grotewold E (2004) The challenges of moving chemicals within and out of cells: insights into the transport of plant natural products. Planta
219:906-909.
Gu YH, Mazzola M (2003) Modification of fluorescent pseudomonad community and control of apple replant disease induced in a wheat
cultivar–specific manner. Appl Soil Ecol 24:57-72.
Guo H, Mao Z, Jiang H, Liu P, Zhou B, Bao Z, Sui J, Zhou X, Liu X (2014) Community analysis of plant growth promoting rhizobacteria
for apple trees. Crop Prot 62:1-9.
Gur A, Cohen Y (1989) The peach replant problem: some causal agents. Soil Biol Biochem 21:829-834.
Gur A, Cohen Y, Katan J, Barkai Z (1991) Preplant application of soil fumigants and solarization for treating replant diseases of peaches and
apples. Sci Hortic 45:215-224.
Gust AA, Biswas R, Lenz HD et al. (2007) Bacteria-derived peptidoglycans constitute pathogen-associated molecular patterns triggering
innate immunity in Arabidopsis. J Biol Chem 282:32338-32348.
Hanschen FS, Yim B, Winkelmann T, Smalla K, Schreiner M (2015) Degradation of Biofumigant Isothiocyanates and Allyl Glucosinolate in
Soil and Their Effects on the Microbial Community Composition. Plos One 10:e0132931.
Hargreaves JA (1980) A possible mechanism for the phytotoxicity of the phytoalexin phaseollin. Physiol Plant Pathol 16:351-357.
Hassan MS, Behadli AH, Alsaadawi IS (1989a). Citrus replant problem in Iraq: Possible role of allelopathy. Plant Soil 116:157-160.
Hassan MS, Behadli AH, Alsaadawi IS (1989b). Citrus replant problem in Iraq: Interactive effect of soil fungi and allelopathy. Plant Soil
116:161-166.
Heil M, Baldwin IT (2002) Fitness costs of induced resistance: emerging experimental support for a slippery concept. Trends Plant Sci 7:61-
67.
Henfrey JL, Baab G, Schmitz M (2015) Physiological stress responses in apple under replant conditions. Sci Hortic-Amsterdam 194:111-
117.
Hernandez BS, Arensdorf JJ, Focht DD (1995) Catabolic characteristics of biphenyl-utilizing isolates which cometabolize PCBs.
Biodegradation 6:75-82.

113
Hewavitharana SS, Ruddell D, Mazzola M (2014) Carbon source-dependent antifungal and nematicidal volatiles derived during anaerobic
soil disinfestation. Eur J Plant Pathol 140:39-52.
Hewavitharana SS, Mazzola M (2016) Carbon Source-Dependent Effects of Anaerobic Soil Disinfestation on Soil Microbiome and
Suppression of Rhizoctonia solani AG-5 and Pratylenchus penetrans. Phytopathology 106:1015-1028.
Hofmann A, Wittenmayer L, Arnold G, Schieber A, Merbach W (2009) Root exudation of phloridzin by apple seedlings (Malus x domestica
Borkh.) with symptoms of apple replant disease. J Appl Bot Food Qual 82:193-198.
Hrazdina G, Borejsza-Wysocki W, Lester C (1997) Phytoalexin production in an apple cultivar resistant to Venturia inaequalis.
Phytopathology 87:868-876.
Hüttner C, Beuerle T, Scharnhop H, Ernst L, Beerhues L (2010) Differential effect of elicitors on biphenyl and dibenzofuran formation in
Sorbus aucuparia cell cultures. J Agric Food Chem 58:11977-11984.
Huot B, Yao J, Montgomery BL, He SY (2014) Growth–Defense Tradeoffs in Plants: A Balancing Act to Optimize Fitness. Mol Plant
7:1267-1287.
Hyson DA (2011) A Comprehensive Review of Apples and Apple Components and Their Relationship to Human Health. Adv Nutr 2:408-
420.
Ibrahim RK, De Luca V, Khouri H, Latchinian L, Brisson L, Charest PM (1987) Enzymology and compartmentation of polymethylated
flavonol glucosides in Chrysosplenium americanum. Phytochemistry 26:1237-1245.
Inderjit, Duke SO (2003) Ecophysiological aspects of allelopathy. Planta 217:529-539.
Ishigaki E, Asamizu T, Arisawa M, Kurosaki F (2004) Cloning and expression of calmodulin genes regulating phytoalexin production in
carrot cells. Biol Pharm Bull 27:1308-1311.
Isutsa D K and Merwin I A (2000) Malus germplasm varies in resistance or tolerance to apple replant disease in a mixture of New York
orchard soils. Hortscience 35:262-268.
Jaffee BA, Abawi GS, Mai WF (1982) Role of soil microflora and Pratylenchus penetrans in an apple replant disease. Phytopathology
72:247-251.
Jilani G, Mahmood S, Chaudhry AN, Hassan I, Akram M (2008) Allelochemicals: sources, toxicity and microbial transformation in soil - a
review. Ann Microbiol 58:351-357.
Kahl G, Molina C, Rotter B, Jüngling R, Frank A, Krezdorn N, Hoffmeister K, Winter P (2012) Reduced representation sequencing of plant
stress transcriptomes. J Plant Biochem Biot 21:119-127.
Kamo T, Hirai N, Tsuda M, Fujioka D, Ohigashi H (2000) Changes in the content and biosynthesis of phytoalexins in banana fruit. Biosci
Biotech Bioch64:2089-2098.
Kelderer M, Manici LM, Caputo F, Thalheimer M (2012) Planting in the ‘inter-row’ to overcome replant disease in apple orchards: a study
on the effectiveness of the practice based on microbial indicators. Plant Soil 357:381-393.
Khalil MNA, Beuerle T, Müller A, Ernst L, Bhavanam VBR, Liu B, Beerhues L (2013) Biosynthesis of the biphenyl phytoalexin aucuparin
in Sorbus aucuparia cell cultures treated with Venturia inaequalis. Phytochemistry 96:101-109.
Khalil MNA, Brandt W, Beuerle T, Reckwell D, Groeneveld J, Hänsch R, Gaid MM, Liu B, Beerhues L (2015) O-Methyltransferases
involved in biphenyl and dibenzofuran biosynthesis. Plant J 83:263-276.
Kuiters AT (1990) Role of phenolic substances from decomposing forest litter in plant-soil interactions. Acta Bot Neer 39:329-348.
Kokubun T, Harborne JB (1995) Phytoalexin induction in the sapwood of plants of the Maloideae (Rosaceae): biphenyls or dibenzofurans.
Phytochemistry 40:1649-1654.
Kokubun T, Harborne JB, Eagles J, Waterman PG (1995) Dibenzofuran phytoalexins from the sapwood tissue of Photinia, Pyracantha and
Crataegus species. Phytochemistry 39:1033-1037.
Lam E, Kato N, Lawton M (2001) Programmed cell death, mitochondria and the plant hypersensitive response. Nature 411:848-853.
Lee JY, Lu H (2011) Plasmodesmata: the battleground against intruders. Trends Plant Sci 16:201-210.
Leinfelder M, Merwin IA (2006) Rootstock selection, pre-plant soil treatments, and tree planting positions as factors in managing apple
replant disease. Hort Science 41:394-401.
Liu B; Beuerle T; Klundt T; Beerhues L (2004) Biphenyl synthase from yeast extract-treated cell cultures of Sorbus aucuparia. Planta
218:492-496.
Liu ET, Wang GS, Li YY, Shen X, Chen XS, Song FH, Wu SJ, Chen Q, Mao ZQ (2014) Replanting Affects the Tree Growth and Fruit
Quality of Gala Apple. Journal of Integrative Agriculture 13:1699-1706.
Lucas WJ, Ham BK, Kim JY (2009) Plasmodesmata-bridging the gap between neighboring plant cells. Trends Cell Biol 19:495-503.
Mai WF, Abawi GS (1981) Controlling replant disease of stone fruits in northeastern United States by preplant fumigation. Plant Dis 65:859-
864.

114
Makino T, Takahashi Y, Sakurai Y, Nanzyo M (1996) Influence of soil chemical properties on adsorption and oxidation of phenolic acids in
soil suspension. Soil Sci Plant Nutr 42:867-879.
Manici LM, Ciavatta C, Kelderer M, Erschbaumer G (2003) Replant problems in South Tyrol: role of fungal pathogens and microbial
population in conventional and organic apple orchards. Plant Soil 256:315-324.
Manici LM, Caputo F (2010) Soil fungal indicators for replanting new peach orchards in intensively cultivated areas. Eur J Agron 33:188-
196.
Manici LM, Kelderer M, Franke-Whittle IH, Rühmer T, Baab G, Nicoletti F, Caputo F, Topp A, Insam H, Naef A (2013) Relationship
between root-endophytic microbial communities and replant disease in specialized apple growing areas in Europe. Applied Soil
Ecol 72:207-214.
Manici LM, Kelderer M, Caputo F, Mazzola M (2015) Auxin-mediated relationships between apple plants and root inhabiting fungi: impact
on root pathogens and potentialities of growth-promoting populations. Plant Pathol 64:843-851.
Manici LM, Caputo F, Saccà ML (2016) Secondary metabolites released into the rhizosphere by Fusarium oxysporum and Fusarium spp. as
underestimated component of nonspecific replant disease. Plant soil:DOI 10.1007/s11104-016-3152-2.
Marinova K, Kleinschmidt K, Weissenböck G, Klein M (2007) Flavonoid biosynthesis in barley primary leaves requires the presence of the
vacuole and controls the activity of vacuolar flavonoid transport. Plant Physiol 144:432-444.
Maule AJ (2008) Plasmodesmata: structure, function and biogenesis. Curr Opin Plant Biol 11:680-686.
Mazzola M (1998) Elucidation of the microbial complex having a causal role in the development of apple replant disease in Washington.
Phytopathology 88:930-938.
Mazzola M (1999) Transformation of soil microbial community structure and Rhizoctonia-suppressive potential in response to apple roots.
Phytopathology 89:920-927.
Mazzola M, Gu YH (2000) Impact of wheat cultivation on microbial communities from replant soils and apple growth in greenhouse trials.
Phytopathology 90:114-119.
Mazzola M, Granatstein DM, Elfving DC, Mullinix K (2001) Suppression of specific apple root pathogens by Brassica napus seed meal
amendment regardless of glucosinolate content. Phytopathology 91:673-679.
Mazzola M, Granatstein D M, Elfving D C, Mullinix K, Gu YH (2002) Cultural management of microbial community structure to enhance
growth of apple in replant soils. Phytopathology 92:1363-1366.
Mazzola M, Gu YH (2002) Wheat genotype–specific induction of soil microbial communities suppressive to disease incited by Rhizoctonia
solani anastomosis group (AG)-5 and AG-8. Phytopathology 92:1300-1307.
Mazzola M, Mullinix K (2005) Comparative field efficacy of management strategies containing Brassica napus seed meal or green manure
for the management of apple replant disease. Plant Dis 89:1207-1213.
Mazzola M, Brown J, Zhao X, Izzo AD, Fazio G (2009) Interaction of brassicaceous seed meal and apple rootstock on recovery of Pythium
spp. and Pratylenchus penetrans from roots grown in replant soils. Plant Dis 93:51-57.
Mazzola M, Zhao X (2010) Brassica juncea seed meal particle size influences chemistry but not biology based suppression of individual
agents inciting apple replant disease. Plant Soil 337:313-324.
Mazzola M, Manici LM (2012) Apple Replant Disease: Role of Microbial Ecology in Cause and Control. Annu Rev Phytopathol 50:45-65.
Mazzola M, Hewavitharana SS, Strauss SL (2015) Brassica Seed Meal Soil Amendments Transform the Rhizosphere Microbiome and
Improve Apple Production Through Resistance to Pathogen Reinfestation. Phytopathology 105:460-469.
Nicola L, Vrhovsek U, Soini E, Insam H, Pertot I (2016) Phlorizin released by apple root debris is related to apple replant disease.
Phytopathologia Mediterranea 55:432-442.
Nicola L, Turco E, Albanese D, Donati C, Thalheimer M, Pindo M, Insam H, Cavalieri D, Pertot I (2017) Fumigation with dazomet modifies
soil microbiota in apple orchards affected by replant disease. Appl Soil Ecol 113:71-79.
Pandey D, Rajendran SRCK, Gaur M, Sajeesh PK, Kumar A (2016) Plant Defense Signaling and Responses Against Necrotrophic Fungal
Pathogens. J Plant Growth Regul 35:1159-1174.
Park S, Sugimoto N, Larson MD, Beaudry R, van Nocker S (2006) Identification of Genes with Potential Roles in Apple Fruit Development
and Biochemistry through Large-Scale Statistical Analysis of Expressed Sequence Tags. Plant Physiol 141:811-824.
Podwyszyńska M, Kruczyńska D, Machlańska A, Dyki B, Sowik W (2016) Nuclear DNA Content and Ploidy Level of Apple Cultivars
Including Polish Ones in Relation to Some Morphological Traits. Acta Biol Cracov Bot 58:81-93.
Politycka B, Adamska D (2003) Release of phenolic compounds from apple residues decomposing in soil and the influence of temperature
on their degradation. Pol J Environ Stud 12:95-98.
Porter I, Pizano M, Besri M, Mattner SW, Fraser P (2010) Progress in the global phase out of methyl bromide and the relative effectiveness
of soil disinfestation strategies. Acta Hortic 883:59-66.

115
Qutob D, Kemmerling B, Brunner F et al. (2006) Phytotoxicity and innate immune responses induced by Nep1-like proteins. Plant Cell
18:3721-3744.
Rogers EE, Glazebrook J, Ausubel M (1996) Mode of action of the Arabidopsis thaliana phytoalexin camalexin and its role in Arabidopsis-
pathogen interactions. Mol Plant Microbe In 9:748-757.
Rumberger A, Yao SR, Merwin IA, Nelsom EB, Thies JE (2004) Rootstock genotype and orchard replant position rather than soil
fumigation or compost amendment determine tree growth and rhizosphere bacterial community composition in an apple replant
soil. Plant Soil 264:247-260.
Scheel D (1998) Resistance response physiology and signal transduction. Curr Opin Plant Biol 1:305-310.
Sellam A, Iacomi-Vasilescu B, Hudhomme P, Simoneau P (2007) In vitro antifungal activity of brassinin, camalexin and two isothiocyanates
against the crucifer pathogens Alternaria brassicicola and Alternaria brassicae. Plant Pathol 56:296-301.
Shin S, Lv J, Fazio G, Mazzola M, Zhu Y (2014) Transcriptional regulation of ethylene and jasmonate mediated defense response in apple
(Malus domestica) root during Pythium ultimum infection. Horticulture Research 1:14053.
Shin S, Zheng P, Fazio G, Mazzola M, Main D, Zhu Y (2016) Transcriptome changes specifically associated with apple (Malus domestica)
root defense response during Pythium ultimum infection. Physiol Mol Plant P 94:16-26.
Shlezinger N, Minz A, Gur Y, Hatam I, Dagdas YF, Talbot NJ, Sharon A (2011) Anti-apoptotic machinery protects the necrotrophic fungus
Botrytis cinerea from host-induced apoptotic-like cell death during plant infection, Plos Pathog 7:e1002185.
Singh HP, Batish DR, Kohli RK (1999) Autotoxicity: Concept, Organisms, and Ecological Significance. Crit Rev Plant Sci 18:757-772.
Sircar D, Gaid MM, Chizzali C et al. (2015) Biphenyl 4-Hydroxylases Involved in Aucuparin Biosynthesis in Rowan and Apple Are
Cytochrome P450 736A Proteins. Plant Physiol 168:428-442.
Steinberg SM, Pignatello JJ, Sawhney BL (1987) Persistence of 1,2-Dibromoethane in Soils: Entrapment in Intraparticle Micropores.
Environ Sci Technol 21:1201-1208.
St. Laurent A, Merwin IA, Fazio G, Thies JE, Brown MG (2010) Rootstock genotype succession influences apple replant disease and root-
zone microbial community composition in an orchard soil. Plant Soil 337:259-72.
Tagliavini M, Marangoni B (1992) Growth of peach as affected by decomposition of own root residues in soil. Plant Soil 145:253-260.
Teotia D, Saini SS, Gaid M, Beuerle T, Beerhues L, Sircar D (2016) Development and Validation of a New HPLC Method for the
Determination of Biphenyl and Dibenzofuran Phytoalexins in Rosaceae. J Chromatorgr Sci 54:918-922.
Tewoldemedhin YT, Mazzola M, Mostert L, McLeod A (2011a) Cylindrocarpon species associated with apple tree roots in South Africa and
their quantification using real-time PCR. Eur J Plant Pathol 129:637-651.
Tewoldemedhin YT, Mazzola M, Botha WJ, Spies CFJ, McLeod A (2011b) Characterization of fungi (Fusarium and Rhizoctonia) and
oomycetes (Phytophthora and Pythium) associated with apple orchards in South Africa. Eur J Plant Pathol 130:215-229.
Tewoldemedhin YT, Mazzola M, Labuschagne I, McLeod A (2011c) A multi-phasic approach reveals that apple replant disease is caused by
multiple biological agents, with some agents acting synergistically. Soil Biol Biochem 43:1917-1927.
Van Etten HD, Sandrock RW, Wasmann CC, Soby SD, McCluskey K, Wang P (1995) Detoxification of phytoanticipins and phytoalexins by
phytopathogenic fungi. Can J Bot 73:518-525.
Van Schoor L, Denman S, Cook NC (2009) Characterisation of apple replant disease under South African conditions and potential biological
management strategies. Sci Hortic 119:153-162.
Velasco R, Zharkikh A, Affourtit J et al (2010) The genome of the domesticated apple (Malus x domestica Borkh.). Nat Genet 42:833-841.
Volk GM, Chao CT, Norelli J, Brown SK, Fazio G, Peace C, McFerson J, Zhong GY, Bretting P (2015) The vulnerability of US apple
(Malus) genetic resources. Genet Resour Crop Evol 62:765-794.
Wang Y, Pan F, Wang G, Zhang G, Wang Y, Chen X, Mao Z (2014) Effects of biochar on photosynthesis and antioxidative system of Malus
hupehensis Rehd. seedlings under replant conditions. Sci Hortic-Amsterdam 175:9-15.
Wang Y, Fu F, Li J, Wang G, Wu M, Zhan J, Chen X, Mao Z (2016) Effects of seaweed fertilizer on the growth of Malus hupehensis Rehd.
seedlings, soil enzyme activities and fungal communities under replant condition. Eur J Soil Biol 75:1-7.
Weir TL, Park SW, Vivanco JM (2004) Biochemical and physiological mechanisms mediated by allelochemicals. Curr Opin Plant Biol
7:472-479.
Willett M, Smith TJ, Peterson AB, Hinman H, Stevens RG, Ley T, Tvergyak P, Williams KM, Maib, KM, Watson JW (1994) Growing
profitable apple orchards in replant sites: An interdisciplinary team approach in Washington state. HortTechnology 4:175-181.
Wittenmayer L, Szabó K (2000). The role of root exudates in specific apple (Malus x domestica Borkh.) replant disease (SARD). J Plant
Nutr Soil Sci. 163:399-404.
Wu HW, Haig T, Pratley J, Lemerle D, An M (2000) Allelochemicals in Wheat (Triticum Aestivum L.): Variation of Phenolic Acids in Root
Tissues. J Agric Food Chem 48:5321-5325.

116
Wu HW, Haig T, Pratley J, Lemerle D, An M (2001) Allelochemicals in wheat (Triticum aestivum L.): Variation of phenolic acids in shoot
tissues. J Chem Ecol 27:125-135.
Wu HS, Bao W, Liu DY, Ling N, Ying RR, Raza W, Shen QR (2008) Effect of fusaric acid on biomass and photosynthesis of watermelon
seedlings leaves. Caryologia 61:258–268.
Yazaki K (2005) Transporters of secondary metabolites. Curr Opin Plant Biol 8:301-307.
Yao S, Merwin IA, Abawi GS, Thies JE (2006) Soil fumigation and compost amendment alter soil microbial community composition but do
not improve tree growth or yield in an apple replant site. Soil Biol Biochem 38:587-599.
Yim B, Smalla K, Winkelmann T (2013) Evaluation of apple replant problems based on different soil disinfection treatments-links to soil
microbial community structure? Plant Soil 366:617-631.
Yim B, Winkelmann T, Ding GC, Smalla K (2015) Different bacterial communities in heat and gamma irradiation treated replant disease
soils revealed by 16S rRNA gene analysis – contribution to improved aboveground apple plant growth? Frontiers Microbiol
6:1224.
Yim B, Hanschen FS, Wrede A, Nitt H, Schreiner M, Smalla K, Winkelmann T (2016) Effects of biofumigation using Brassica juncea and
Raphanus sativus in comparison to disinfection using Basamid on apple plant growth and soil microbial communities at three
field sites with replant disease. Plant Soil 406:389-408.
Yin C, Xiang L, Wang G, Wang Y, Shen X, Chen X, Mao Z (2016) How to Plant Apple Trees to Reduce Replant Disease in Apple Orchard:
A Study on the Phenolic Acid of the Replanted Apple Orchard. Plos One 12:e0167347.
Yin C, Xiang L, Wang G, Wang Y, Shen X, Chen X, Mao Z (2017) Phloridzin promotes the growth of Fusarium moniliforme (Fusarium
verticillioides). Sci Hortic-Amsterdam 214:187-194.
Zhang S, Du H, Klessig DF (1998) Activation of the tobacco SIP kinase by both a cell wall-derived carbohydrate elicitor and purified
proteinaceous elicitins from Phytophthora spp. Plant Cell 10:435-449.
Zhang JH, Mao ZQ, Wang LQ, Shu HR (2007) Bioassay and identification of root exudates of three fruit tree species. J Integr Plant Biol
49:257-261.
Zhu LH, Ahlman A, Li XY, Welander M (2001) Integration of the rolA gene into the genome of the vigorous apple rootstock A2 reduced
plant height and shortened internodes. J Hortic Sci Biotech 76:758-763.
Zhu Y, Fazio G, Mazzola M (2014) Elucidating the molecular responses of apple rootstock resistant to ARD pathogens: challenges and
opportunities for development of genomics-assisted breeding tools. Horticulture Research 1:14043.
Zhu W, Liu J, Ye J, Li G (2017) Effects of phytotoxic extracts from peach root bark and benzoic acid on peach seedlings growth,
photosynthesis, antioxidance and ultrastructure properties. Sci Hort-Amsterdam 215:49-58.
Zubieta C, He XZ, Dixon RA, Noel JP (2001) Structures of two natural product methyltransferases reveal the basis for substrate specificity
in plant O-methyltransferases. Nat Struct Biol 8:271-279.

117
Curriculum vitae
Name Stefan Weiß
Date of birth February 4, 1989
Place of birth Peine, Germany
Citizenship German
Academic education
October 2013 – today Ph. D. student at the Gottfried Wilhelm Leibniz Universität
Hannover, Institute of Horticultural Production Systems,
Section of Woody Plant and Propagation Physiology
Ph. D. thesis in the group of Prof. Dr. Traud Winkelmann
October 2011 – September 2013 M. Sc. student at the Gottfried Wilhelm Leibniz Universität
Hannover
M. Sc. Plant Biotechnology
Thesis: “The role of leaf apoplastic peroxidases for the
manganese tolerance of rice recombinant inbred lines” (Prof.
Dr. Walter Horst)
October 2008 – September 2011 B. Sc. student at the Gottfried Wilhelm Leibniz Universität
Hannover
B. Sc. Plant Biotechnology
Thesis “Effect of excess manganese on the apoplastic
proteome of rice recombinant inbred lines differing in
manganese tolerance” (Prof. Dr. Walter Horst)
School education
August 2001 – June 2008 Secondary school Lehrte
August 1999 – July 2001 Middle school Hämelerwald
August 1995 – July 1999 Elementary school Arpke

118
Conference contributions
Oral presentations
3. Fachgespräch Bodenmüdigkeit, Gartenbauzentrum Ellerhoop, July 14, 2015
“Erste Analyse der Genexpression (Transkriptom) von Apfel bei Kultur auf nachbaukrankem Boden”
German Plant Breeding Conference 2016, University of Bonn, March 8 – 10, 2016
“Transcriptomic response of Malus x domestica M26 roots to soil affected by apple replant disease”
Poster presentations
2nd Doctoral Researcher’s Conference of GRK1798 “Signaling at the Plant-Soil Interface”, Goslar,
September 30 – October 2, 2015
“Transcriptomic analysis of plant reactions in apple rootstocks (M26) to soils with replant problems”
3rd Doctoral Researcher’s Conference of GRK1798 “Signaling at the Plant-Soil Interface”, Bad
Salzdetfurth, September 14 – 16, 2016
“Time response of biotic stress associated genes in apple replant disease affected apple (Malus
domestica M26) plants”
119
Acknowledgements
I thank Prof. Dr. Traud Winkelmann for offering me the research topic, the opportunity to conduct this
study in the section of Woody Plant and Propagation Physiology and the excellent support.
Furthermore, I thank Prof. Dr. Hans-Peter Braun for resuming duties as the second examiner and
supervision in the GRK1798 program.
Likewise, I thank Prof. Dr. Ludger Beerhues for reviewing my thesis and for the cooperation in
phytoalexin analysis. In this regard, I also thank Dr. Benye Liu and Dennis Reckwell from the
University of Braunschweig for the collaboration.
In addition, I thank Prof. Dr. Georg Guggenberger for chairing the examination committee and
supervision in the GRK1798 program.
Special thanks go to Bunlong Yim who always shared his knowledge and experience in ARD and
statistics with me.
Additionally, thanks to Dr. Melanie Bartsch for introducing me into the nuances of primer design and
RT-qPCR analyses, and thanks to Annmarie-Deetja Rohr for helpful PCR discussions.
Thanks to Johanna Buse who assisted in soil analyses and thanks to Bärbel Ernst, Ewa Schneider and
Friederike Schröder who introduced me to in vitro propagation, as well as Ulrike Pieper from the
Institute of Soil Science who assisted in additional soil analyses.
Moreover, I thank Ute Meisel and Sabine Reinecke for helping me with administrative
responsibilities.
I also thank all other co-workers in the section of Woody Plant and Propagation Physiology for the
enjoyable working atmosphere and support.
Finally, a big thank you goes to my family, semper fidelis.