Embed Size (px)
Citation preview
COP1/DET1/ETS axis regulates ERKtranscriptome and sensitivity to MAPKinhibitors
Yuanyuan Xie, … , Ping Chi, Yu Chen
J Clin Invest. 2018;128(4):1442-1457. https://doi.org/10.1172/JCI94840.
Aberrant activation of MAPK signaling leads to the activation of oncogenic transcriptomes.How MAPK signaling is coupled with the transcriptional response in cancer is not fullyunderstood. In 2 MAPK-activated tumor types, gastrointestinal stromal tumor andmelanoma, we found that ETV1 and other Pea3-ETS transcription factors are criticalnuclear effectors of MAPK signaling that are regulated through protein stability. Expressionof stabilized Pea3-ETS factors can partially rescue the MAPK transcriptome and cellviability after MAPK inhibition. To identify the players involved in this process, we performeda pooled genome-wide RNAi screen using a fluorescence-based ETV1 protein stabilitysensor and identified COP1, DET1, DDB1, UBE3C, PSMD4, and COP9 signalosomemembers. COP1 or DET1 loss led to decoupling between MAPK signaling and thedownstream transcriptional response, where MAPK inhibition failed to destabilize Pea3factors and fully inhibit the MAPK transcriptome, thus resulting in decreased sensitivity toMAPK pathway inhibitors. We identified multiple COP1 and DET1 mutations in humantumors that were defective in the degradation of Pea3-ETS factors. Two melanoma patientshad de novo DET1 mutations arising after vemurafenib treatment. These observationsindicate that MAPK signaling–dependent regulation of Pea3-ETS protein stability is a keysignaling node in oncogenesis and therapeutic resistance to MAPK pathway inhibition.
Research Article Oncology Therapeutics
Find the latest version:
http://jci.me/94840/pdf
The Journal of Clinical Investigation R E S E A R C H A R T I C L E
1 4 4 2 jci.org Volume 128 Number 4 April 2018
IntroductionThe MAPK/ERK signaling pathway is aberrantly hyperactivated in multiple malignancies via prevalent mutations in BRAF, NF1, vari-ous Ras isoforms, KIT, and other receptor tyrosine kinases. Molec-ularly targeted therapies that inhibit hyperactive MAPK signaling in cancer, such as RAF and MEK inhibitors for BRAFV600-mutant melanoma (1, 2) and KIT inhibitors for KIT/PDGFRA-mutant gas-trointestinal stromal tumors (GISTs) (3, 4), have revolutionized cancer treatment. Yet, targeted therapies are hampered by het-erogeneity in the depth and duration of the response and eventual drug resistance. The mechanisms of resistance are heterogeneous. Approximately 50% of resistant cases harbor secondary genetic lesions, such as mutations in RAF, MEK, NF1, Ras isoforms in mel-anoma, and secondary KIT mutations in GISTs, that reactivate the MAPK pathway (5–7). Additionally, adaptive and reversible alter-ations that alter gene expression have been shown to modulate therapeutic sensitivity without detectable genetic alterations (8, 9).
Physiologically, the MAPK signaling pathway couples extra-cellular signals to a multitude of intracellular responses, includ-ing critical transcriptional changes. Cancers with constitutively
activated MAPK signaling exhibit elevated ERK-dependent tran-scriptional output, and inhibition of this output is correlated with a therapeutic response to targeted therapies (10, 11). While one characterized mode of transcriptional regulation is direct ERK- mediated phosphorylation of transcription factors (12–14), other mechanisms that dynamically couple ERK activity and modulate the nuclear transcriptional output response in ERK-dependent cancers have not been elucidated.
In GISTs, the ETS factor ETV1 is a lineage-specific master regulator that cooperates with KIT- and PDGFRA-activating mutations in pathogenesis (15–19). In cutaneous melanoma, ETV1 is recurrently amplified and cooperates with the BRAFV600E- activating mutation in oncogenesis (20, 21). The cooperative onco-genic effects of ETV1 with KIT- or BRAF-activating mutations is in part through ETV1 protein stabilization. Therefore, MAPK path-way inhibition with either KIT or MEK inhibitors leads to rapid ETV1 degradation (15–17). This implicates the dynamic regulation of ETV1 protein stability as a critical mechanism to couple ERK activity to a downstream nuclear transcriptional response in GISTs and melanoma. Previously, COP1 has been shown to be an E3 ligase that mediates the degradation of Pea3 transcription factors, and in prostate cancer, COP1 loss is an alternative mechanism for overexpressing ETS factors in genomic translocation (22–25).
Here, we demonstrate that ETV1 and other Pea3 family mem-bers are critical downstream transcriptional mediators of MAPK signaling in GISTs and melanoma. To identify genes involved in
Aberrant activation of MAPK signaling leads to the activation of oncogenic transcriptomes. How MAPK signaling is coupled with the transcriptional response in cancer is not fully understood. In 2 MAPK-activated tumor types, gastrointestinal stromal tumor and melanoma, we found that ETV1 and other Pea3-ETS transcription factors are critical nuclear effectors of MAPK signaling that are regulated through protein stability. Expression of stabilized Pea3-ETS factors can partially rescue the MAPK transcriptome and cell viability after MAPK inhibition. To identify the players involved in this process, we performed a pooled genome-wide RNAi screen using a fluorescence-based ETV1 protein stability sensor and identified COP1, DET1, DDB1, UBE3C, PSMD4, and COP9 signalosome members. COP1 or DET1 loss led to decoupling between MAPK signaling and the downstream transcriptional response, where MAPK inhibition failed to destabilize Pea3 factors and fully inhibit the MAPK transcriptome, thus resulting in decreased sensitivity to MAPK pathway inhibitors. We identified multiple COP1 and DET1 mutations in human tumors that were defective in the degradation of Pea3-ETS factors. Two melanoma patients had de novo DET1 mutations arising after vemurafenib treatment. These observations indicate that MAPK signaling–dependent regulation of Pea3-ETS protein stability is a key signaling node in oncogenesis and therapeutic resistance to MAPK pathway inhibition.
COP1/DET1/ETS axis regulates ERK transcriptome and sensitivity to MAPK inhibitorsYuanyuan Xie,1 Zhen Cao,1,2 Elissa W.P. Wong,1 Youxin Guan,1 Wenfu Ma,3 Jenny Q. Zhang,1 Edward G. Walczak,1 Devan Murphy,1 Leili Ran,1 Inna Sirota,1 Shangqian Wang,1 Shipra Shukla,1 Dong Gao,1 Simon R.V. Knott,4,5 Kenneth Chang,4 Justin Leu,1 John Wongvipat,1 Cristina R. Antonescu,6 Gregory Hannon,4,5,7 Ping Chi,1,2,8 and Yu Chen1,2,8
1Human Oncology and Pathogenesis Program, Memorial Sloan Kettering Cancer Center (MSKCC), New York, New York, USA. 2Weill Cornell Graduate School of Medical Sciences, Cornell University, New York,
New York, USA. 3Structural Biology Program, MSKCC, New York, New York, USA. 4Watson School of Biological Sciences, Cold Spring Harbor Laboratory, Cold Spring Harbor, New York, USA. 5CRUK Cambridge
Institute, University of Cambridge, Cambridge, United Kingdom. 6Department of Pathology, MSKCC, New York, New York, USA. 7Howard Hughes Medical Institute, Chevy Chase, Maryland, USA. 8Department
of Medicine, MSKCC, New York, New York, USA.
Authorship note: YX and ZC contributed equally to this work.Conflict of interest: The authors have declared that no conflict of interest exists.Submitted: May 1, 2017; Accepted: January 18, 2018.Reference information: J Clin Invest. 2018;128(4):1442–1457. https://doi.org/10.1172/JCI94840.
The Journal of Clinical Investigation R E S E A R C H A R T I C L E
1 4 4 3jci.org Volume 128 Number 4 April 2018
greater transcriptome changes with PD325901 than with imati-nib treatment in GIST48 cells, greater transcriptome changes with imatinib than with PD325901 treatment in GIST-T1 cells, and sim-ilar transcriptome changes with imatinib and PD325901 treatment in GIST882 cells (Supplemental Figure 1, D–F). This indicates that in GISTs, the transcriptional output downstream of KIT mutation is primarily through MAPK.
To determine whether ETV1 is a transcriptional effector of MAPK signaling in GISTs and melanoma, we performed inte-grative analysis of the MAPK transcriptome, the ETV1 transcrip-tome, and the ETV1 cistrome in the 3 GIST cell lines and in 2 BRAFV600E-mutant melanoma cell lines (A375 and Colo800). We generated the MAPK signaling–dependent transcriptome by pro-filing cells treated with PD325901 in GIST48 and GIST882, ima-tinib in GIST-T1 (see Supplemental Figure 1, D–F), and the RAF inhibitor vemurafenib in A375 and Colo800 cells (26). We next generated gene sets of ETV1-dependent genes by comparing cells infected with 2 independent ETV1-specific shRNAs (ETV1sh1 and ETV1sh2) with a scrambled control shRNA (shSCR) for all 5 cell lines. For GIST48, we added an additional gene set of siRNA- mediated ETV1 knockdown as an orthogonal knockdown meth-od. We supplemented these with custom gene sets of GIST- specific genes, mouse interstitial cells of Caja within the plane of the myenteric plexus–specific (ICC-MY–specific) genes, and MAPK-regulated genes (Supplemental Table 1).
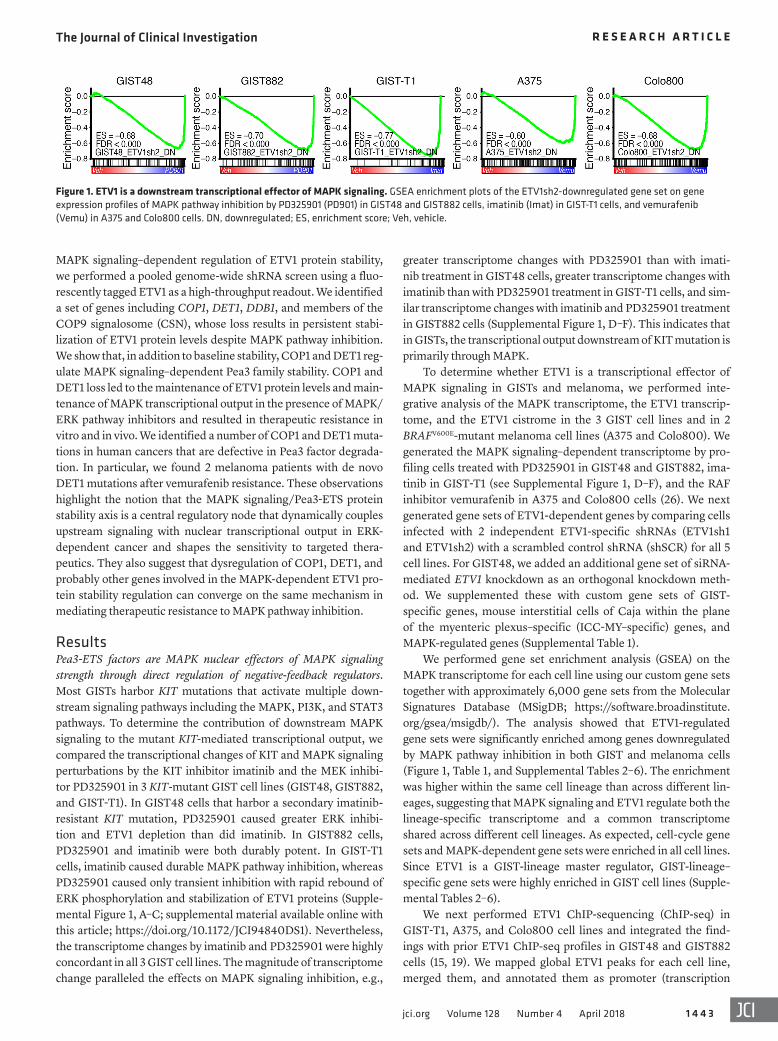
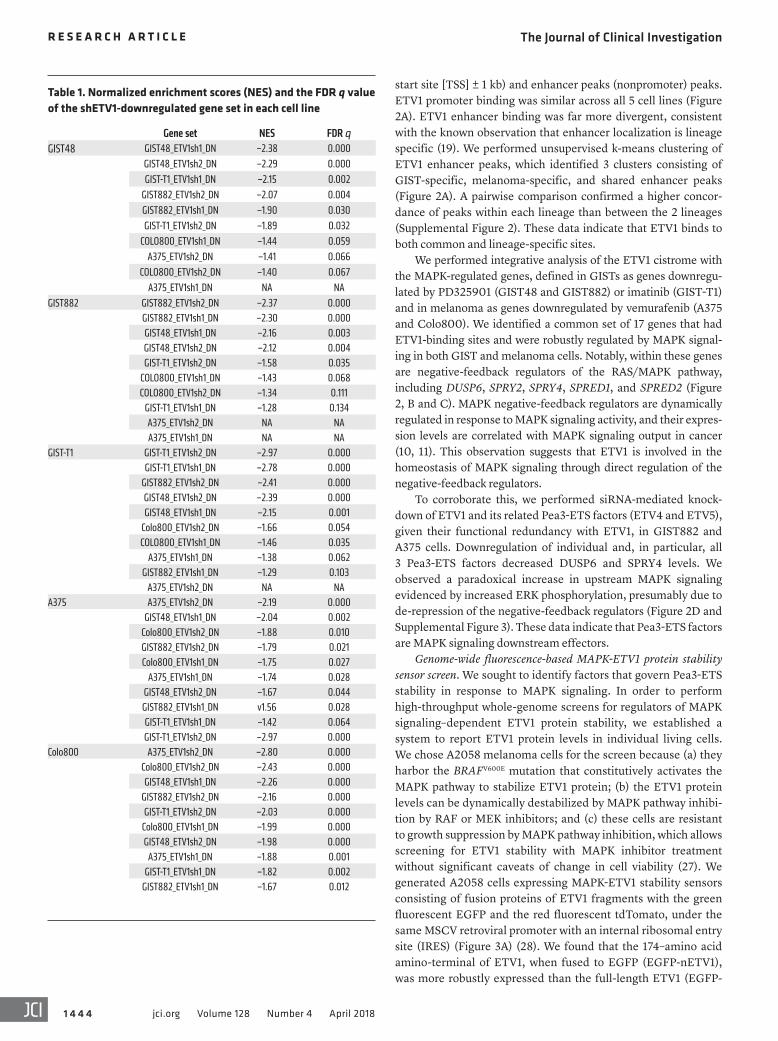
We performed gene set enrichment analysis (GSEA) on the MAPK transcriptome for each cell line using our custom gene sets together with approximately 6,000 gene sets from the Molecular Signatures Database (MSigDB; https://software.broadinstitute.org/gsea/msigdb/). The analysis showed that ETV1-regulated gene sets were significantly enriched among genes downregulated by MAPK pathway inhibition in both GIST and melanoma cells (Figure 1, Table 1, and Supplemental Tables 2–6). The enrichment was higher within the same cell lineage than across different lin-eages, suggesting that MAPK signaling and ETV1 regulate both the lineage-specific transcriptome and a common transcriptome shared across different cell lineages. As expected, cell-cycle gene sets and MAPK-dependent gene sets were enriched in all cell lines. Since ETV1 is a GIST-lineage master regulator, GIST-lineage– specific gene sets were highly enriched in GIST cell lines (Supple-mental Tables 2–6).
We next performed ETV1 ChIP-sequencing (ChIP-seq) in GIST-T1, A375, and Colo800 cell lines and integrated the find-ings with prior ETV1 ChIP-seq profiles in GIST48 and GIST882 cells (15, 19). We mapped global ETV1 peaks for each cell line, merged them, and annotated them as promoter (transcription
MAPK signaling–dependent regulation of ETV1 protein stability, we performed a pooled genome-wide shRNA screen using a fluo-rescently tagged ETV1 as a high-throughput readout. We identified a set of genes including COP1, DET1, DDB1, and members of the COP9 signalosome (CSN), whose loss results in persistent stabi-lization of ETV1 protein levels despite MAPK pathway inhibition. We show that, in addition to baseline stability, COP1 and DET1 reg-ulate MAPK signaling–dependent Pea3 family stability. COP1 and DET1 loss led to the maintenance of ETV1 protein levels and main-tenance of MAPK transcriptional output in the presence of MAPK/ERK pathway inhibitors and resulted in therapeutic resistance in vitro and in vivo. We identified a number of COP1 and DET1 muta-tions in human cancers that are defective in Pea3 factor degrada-tion. In particular, we found 2 melanoma patients with de novo DET1 mutations after vemurafenib resistance. These observations highlight the notion that the MAPK signaling/Pea3-ETS protein stability axis is a central regulatory node that dynamically couples upstream signaling with nuclear transcriptional output in ERK- dependent cancer and shapes the sensitivity to targeted thera-peutics. They also suggest that dysregulation of COP1, DET1, and probably other genes involved in the MAPK-dependent ETV1 pro-tein stability regulation can converge on the same mechanism in mediating therapeutic resistance to MAPK pathway inhibition.
ResultsPea3-ETS factors are MAPK nuclear effectors of MAPK signaling strength through direct regulation of negative-feedback regulators. Most GISTs harbor KIT mutations that activate multiple down-stream signaling pathways including the MAPK, PI3K, and STAT3 pathways. To determine the contribution of downstream MAPK signaling to the mutant KIT-mediated transcriptional output, we compared the transcriptional changes of KIT and MAPK signaling perturbations by the KIT inhibitor imatinib and the MEK inhibi-tor PD325901 in 3 KIT-mutant GIST cell lines (GIST48, GIST882, and GIST-T1). In GIST48 cells that harbor a secondary imatinib- resistant KIT mutation, PD325901 caused greater ERK inhibi-tion and ETV1 depletion than did imatinib. In GIST882 cells, PD325901 and imatinib were both durably potent. In GIST-T1 cells, imatinib caused durable MAPK pathway inhibition, whereas PD325901 caused only transient inhibition with rapid rebound of ERK phosphorylation and stabilization of ETV1 proteins (Supple-mental Figure 1, A–C; supplemental material available online with this article; https://doi.org/10.1172/JCI94840DS1). Nevertheless, the transcriptome changes by imatinib and PD325901 were highly concordant in all 3 GIST cell lines. The magnitude of transcriptome change paralleled the effects on MAPK signaling inhibition, e.g.,
Figure 1. ETV1 is a downstream transcriptional effector of MAPK signaling. GSEA enrichment plots of the ETV1sh2-downregulated gene set on gene expression profiles of MAPK pathway inhibition by PD325901 (PD901) in GIST48 and GIST882 cells, imatinib (Imat) in GIST-T1 cells, and vemurafenib (Vemu) in A375 and Colo800 cells. DN, downregulated; ES, enrichment score; Veh, vehicle.
The Journal of Clinical Investigation R E S E A R C H A R T I C L E
1 4 4 4 jci.org Volume 128 Number 4 April 2018
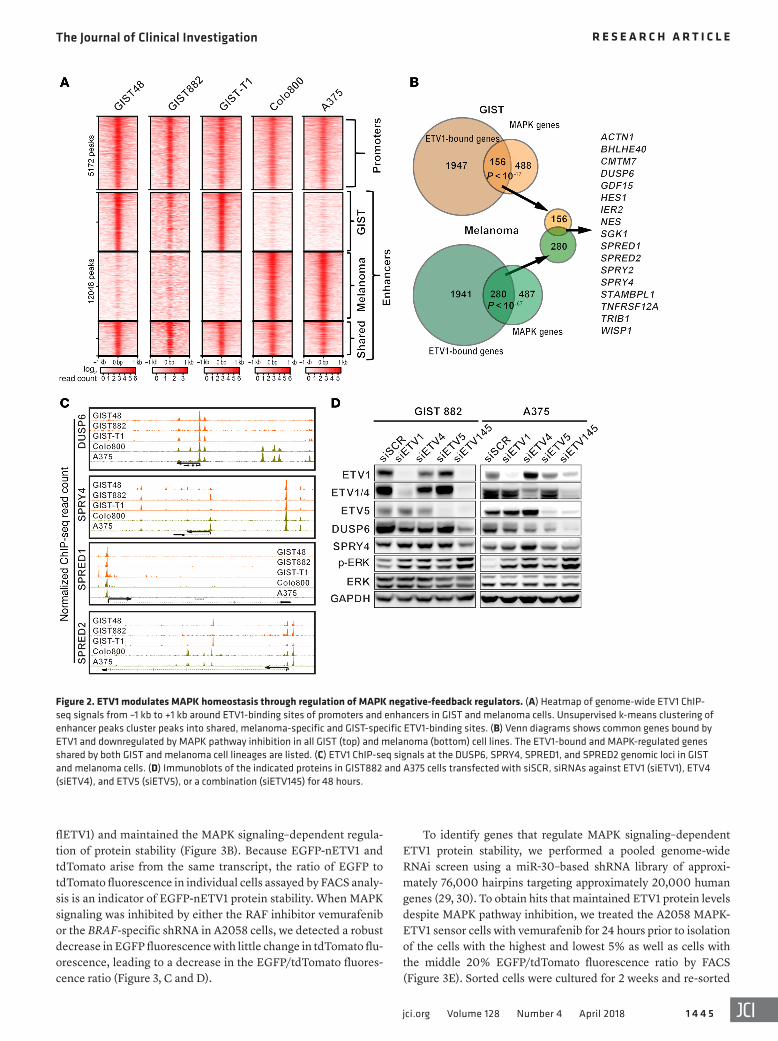
start site [TSS] ± 1 kb) and enhancer peaks (nonpromoter) peaks. ETV1 promoter binding was similar across all 5 cell lines (Figure 2A). ETV1 enhancer binding was far more divergent, consistent with the known observation that enhancer localization is lineage specific (19). We performed unsupervised k-means clustering of ETV1 enhancer peaks, which identified 3 clusters consisting of GIST-specific, melanoma-specific, and shared enhancer peaks (Figure 2A). A pairwise comparison confirmed a higher concor-dance of peaks within each lineage than between the 2 lineages (Supplemental Figure 2). These data indicate that ETV1 binds to both common and lineage-specific sites.
We performed integrative analysis of the ETV1 cistrome with the MAPK-regulated genes, defined in GISTs as genes downregu-lated by PD325901 (GIST48 and GIST882) or imatinib (GIST-T1) and in melanoma as genes downregulated by vemurafenib (A375 and Colo800). We identified a common set of 17 genes that had ETV1-binding sites and were robustly regulated by MAPK signal-ing in both GIST and melanoma cells. Notably, within these genes are negative-feedback regulators of the RAS/MAPK pathway, including DUSP6, SPRY2, SPRY4, SPRED1, and SPRED2 (Figure 2, B and C). MAPK negative-feedback regulators are dynamically regulated in response to MAPK signaling activity, and their expres-sion levels are correlated with MAPK signaling output in cancer (10, 11). This observation suggests that ETV1 is involved in the homeostasis of MAPK signaling through direct regulation of the negative-feedback regulators.
To corroborate this, we performed siRNA-mediated knock-down of ETV1 and its related Pea3-ETS factors (ETV4 and ETV5), given their functional redundancy with ETV1, in GIST882 and A375 cells. Downregulation of individual and, in particular, all 3 Pea3-ETS factors decreased DUSP6 and SPRY4 levels. We observed a paradoxical increase in upstream MAPK signaling evidenced by increased ERK phosphorylation, presumably due to de-repression of the negative-feedback regulators (Figure 2D and Supplemental Figure 3). These data indicate that Pea3-ETS factors are MAPK signaling downstream effectors.
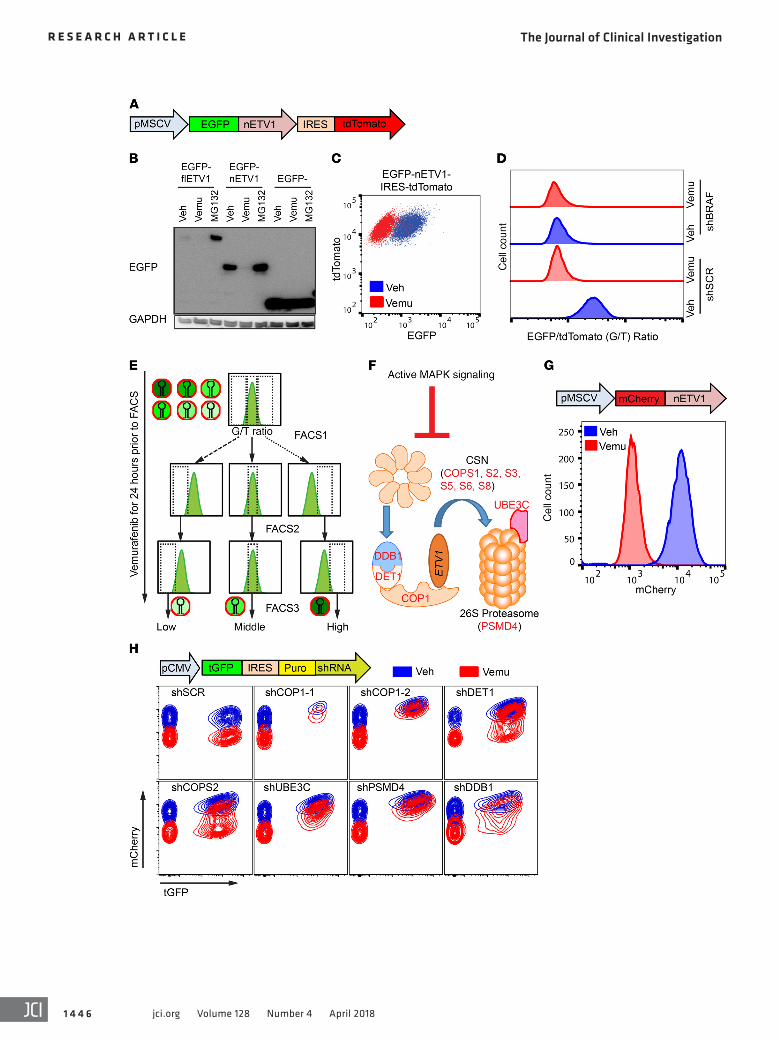
Genome-wide fluorescence-based MAPK-ETV1 protein stability sensor screen. We sought to identify factors that govern Pea3-ETS stability in response to MAPK signaling. In order to perform high-throughput whole-genome screens for regulators of MAPK signaling–dependent ETV1 protein stability, we established a system to report ETV1 protein levels in individual living cells. We chose A2058 melanoma cells for the screen because (a) they harbor the BRAFV600E mutation that constitutively activates the MAPK pathway to stabilize ETV1 protein; (b) the ETV1 protein levels can be dynamically destabilized by MAPK pathway inhibi-tion by RAF or MEK inhibitors; and (c) these cells are resistant to growth suppression by MAPK pathway inhibition, which allows screening for ETV1 stability with MAPK inhibitor treatment without significant caveats of change in cell viability (27). We generated A2058 cells expressing MAPK-ETV1 stability sensors consisting of fusion proteins of ETV1 fragments with the green fluorescent EGFP and the red fluorescent tdTomato, under the same MSCV retroviral promoter with an internal ribosomal entry site (IRES) (Figure 3A) (28). We found that the 174–amino acid amino-terminal of ETV1, when fused to EGFP (EGFP-nETV1), was more robustly expressed than the full-length ETV1 (EGFP-
Table 1. Normalized enrichment scores (NES) and the FDR q value of the shETV1-downregulated gene set in each cell line
Gene set NES FDR qGIST48 GIST48_ETV1sh1_DN –2.38 0.000
GIST48_ETV1sh2_DN –2.29 0.000GIST-T1_ETV1sh1_DN –2.15 0.002
GIST882_ETV1sh2_DN –2.07 0.004GIST882_ETV1sh1_DN –1.90 0.030GIST-T1_ETV1sh2_DN –1.89 0.032
COLO800_ETV1sh1_DN –1.44 0.059A375_ETV1sh2_DN –1.41 0.066
COLO800_ETV1sh2_DN –1.40 0.067A375_ETV1sh1_DN NA NA
GIST882 GIST882_ETV1sh2_DN –2.37 0.000GIST882_ETV1sh1_DN –2.30 0.000GIST48_ETV1sh1_DN –2.16 0.003GIST48_ETV1sh2_DN –2.12 0.004GIST-T1_ETV1sh2_DN –1.58 0.035
COLO800_ETV1sh1_DN –1.43 0.068COLO800_ETV1sh2_DN –1.34 0.111
GIST-T1_ETV1sh1_DN –1.28 0.134A375_ETV1sh2_DN NA NAA375_ETV1sh1_DN NA NA
GIST-T1 GIST-T1_ETV1sh2_DN –2.97 0.000GIST-T1_ETV1sh1_DN –2.78 0.000
GIST882_ETV1sh2_DN –2.41 0.000GIST48_ETV1sh2_DN –2.39 0.000GIST48_ETV1sh1_DN –2.15 0.001
Colo800_ETV1sh2_DN –1.66 0.054COLO800_ETV1sh1_DN –1.46 0.035
A375_ETV1sh1_DN –1.38 0.062GIST882_ETV1sh1_DN –1.29 0.103
A375_ETV1sh2_DN NA NAA375 A375_ETV1sh2_DN –2.19 0.000
GIST48_ETV1sh1_DN –2.04 0.002Colo800_ETV1sh2_DN –1.88 0.010GIST882_ETV1sh2_DN –1.79 0.021Colo800_ETV1sh1_DN –1.75 0.027
A375_ETV1sh1_DN –1.74 0.028GIST48_ETV1sh2_DN –1.67 0.044GIST882_ETV1sh1_DN v1.56 0.028GIST-T1_ETV1sh1_DN –1.42 0.064GIST-T1_ETV1sh2_DN –2.97 0.000
Colo800 A375_ETV1sh2_DN –2.80 0.000Colo800_ETV1sh2_DN –2.43 0.000GIST48_ETV1sh1_DN –2.26 0.000
GIST882_ETV1sh2_DN –2.16 0.000GIST-T1_ETV1sh2_DN –2.03 0.000
Colo800_ETV1sh1_DN –1.99 0.000GIST48_ETV1sh2_DN –1.98 0.000A375_ETV1sh1_DN –1.88 0.001
GIST-T1_ETV1sh1_DN –1.82 0.002GIST882_ETV1sh1_DN –1.67 0.012
The Journal of Clinical Investigation R E S E A R C H A R T I C L E
1 4 4 5jci.org Volume 128 Number 4 April 2018
To identify genes that regulate MAPK signaling–dependent ETV1 protein stability, we performed a pooled genome-wide RNAi screen using a miR-30–based shRNA library of approxi-mately 76,000 hairpins targeting approximately 20,000 human genes (29, 30). To obtain hits that maintained ETV1 protein levels despite MAPK pathway inhibition, we treated the A2058 MAPK-ETV1 sensor cells with vemurafenib for 24 hours prior to isolation of the cells with the highest and lowest 5% as well as cells with the middle 20% EGFP/tdTomato fluorescence ratio by FACS (Figure 3E). Sorted cells were cultured for 2 weeks and re-sorted
flETV1) and maintained the MAPK signaling–dependent regula-tion of protein stability (Figure 3B). Because EGFP-nETV1 and tdTomato arise from the same transcript, the ratio of EGFP to tdTomato fluorescence in individual cells assayed by FACS analy-sis is an indicator of EGFP-nETV1 protein stability. When MAPK signaling was inhibited by either the RAF inhibitor vemurafenib or the BRAF-specific shRNA in A2058 cells, we detected a robust decrease in EGFP fluorescence with little change in tdTomato flu-orescence, leading to a decrease in the EGFP/tdTomato fluores-cence ratio (Figure 3, C and D).
Figure 2. ETV1 modulates MAPK homeostasis through regulation of MAPK negative-feedback regulators. (A) Heatmap of genome-wide ETV1 ChIP-seq signals from –1 kb to +1 kb around ETV1-binding sites of promoters and enhancers in GIST and melanoma cells. Unsupervised k-means clustering of enhancer peaks cluster peaks into shared, melanoma-specific and GIST-specific ETV1-binding sites. (B) Venn diagrams shows common genes bound by ETV1 and downregulated by MAPK pathway inhibition in all GIST (top) and melanoma (bottom) cell lines. The ETV1-bound and MAPK-regulated genes shared by both GIST and melanoma cell lineages are listed. (C) ETV1 ChIP-seq signals at the DUSP6, SPRY4, SPRED1, and SPRED2 genomic loci in GIST and melanoma cells. (D) Immunoblots of the indicated proteins in GIST882 and A375 cells transfected with siSCR, siRNAs against ETV1 (siETV1), ETV4 (siETV4), and ETV5 (siETV5), or a combination (siETV145) for 48 hours.
The Journal of Clinical Investigation R E S E A R C H A R T I C L E
1 4 4 6 jci.org Volume 128 Number 4 April 2018
The Journal of Clinical Investigation R E S E A R C H A R T I C L E
1 4 4 7jci.org Volume 128 Number 4 April 2018
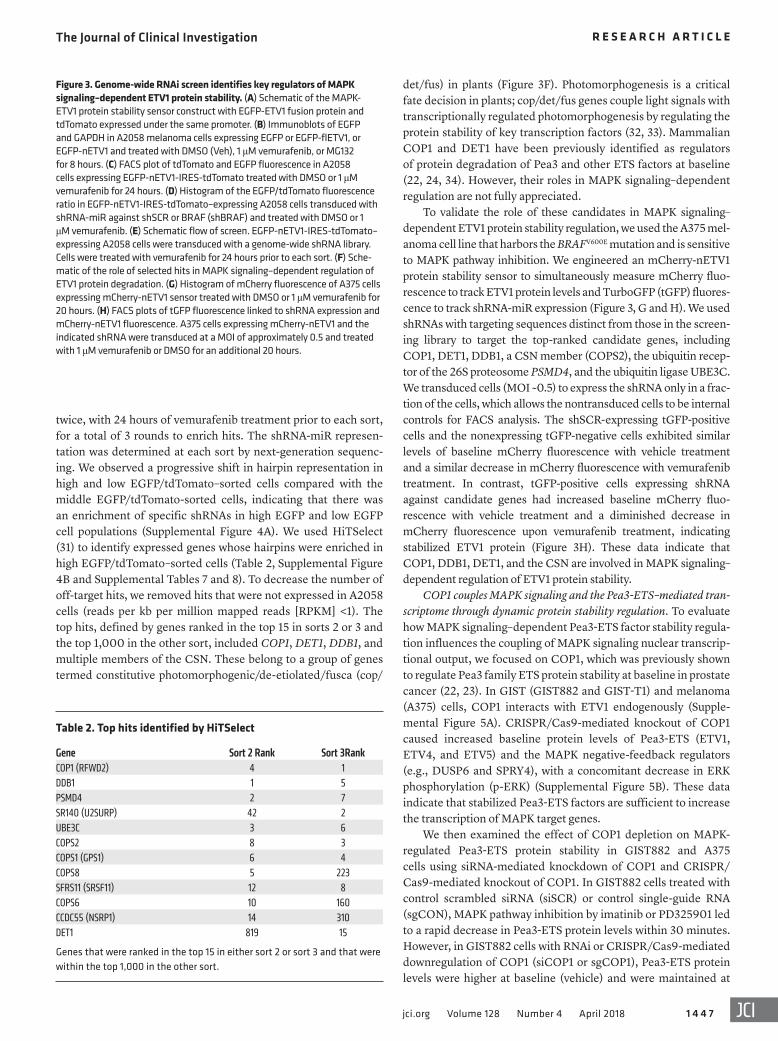
twice, with 24 hours of vemurafenib treatment prior to each sort, for a total of 3 rounds to enrich hits. The shRNA-miR represen-tation was determined at each sort by next-generation sequenc-ing. We observed a progressive shift in hairpin representation in high and low EGFP/tdTomato–sorted cells compared with the middle EGFP/tdTomato-sorted cells, indicating that there was an enrichment of specific shRNAs in high EGFP and low EGFP cell populations (Supplemental Figure 4A). We used HiTSelect (31) to identify expressed genes whose hairpins were enriched in high EGFP/tdTomato–sorted cells (Table 2, Supplemental Figure 4B and Supplemental Tables 7 and 8). To decrease the number of off-target hits, we removed hits that were not expressed in A2058 cells (reads per kb per million mapped reads [RPKM] <1). The top hits, defined by genes ranked in the top 15 in sorts 2 or 3 and the top 1,000 in the other sort, included COP1, DET1, DDB1, and multiple members of the CSN. These belong to a group of genes termed constitutive photomorphogenic/de-etiolated/fusca (cop/
det/fus) in plants (Figure 3F). Photomorphogenesis is a critical fate decision in plants; cop/det/fus genes couple light signals with transcriptionally regulated photomorphogenesis by regulating the protein stability of key transcription factors (32, 33). Mammalian COP1 and DET1 have been previously identified as regulators of protein degradation of Pea3 and other ETS factors at baseline (22, 24, 34). However, their roles in MAPK signaling–dependent regulation are not fully appreciated.
To validate the role of these candidates in MAPK signaling–dependent ETV1 protein stability regulation, we used the A375 mel-anoma cell line that harbors the BRAFV600E mutation and is sensitive to MAPK pathway inhibition. We engineered an mCherry-nETV1 protein stability sensor to simultaneously measure mCherry fluo-rescence to track ETV1 protein levels and TurboGFP (tGFP) fluores-cence to track shRNA-miR expression (Figure 3, G and H). We used shRNAs with targeting sequences distinct from those in the screen-ing library to target the top-ranked candidate genes, including COP1, DET1, DDB1, a CSN member (COPS2), the ubiquitin recep-tor of the 26S proteosome PSMD4, and the ubiquitin ligase UBE3C. We transduced cells (MOI ~0.5) to express the shRNA only in a frac-tion of the cells, which allows the nontransduced cells to be internal controls for FACS analysis. The shSCR-expressing tGFP-positive cells and the nonexpressing tGFP-negative cells exhibited similar levels of baseline mCherry fluorescence with vehicle treatment and a similar decrease in mCherry fluorescence with vemurafenib treatment. In contrast, tGFP-positive cells expressing shRNA against candidate genes had increased baseline mCherry fluo-rescence with vehicle treatment and a diminished decrease in mCherry fluorescence upon vemurafenib treatment, indicating stabilized ETV1 protein (Figure 3H). These data indicate that COP1, DDB1, DET1, and the CSN are involved in MAPK signaling– dependent regulation of ETV1 protein stability.
COP1 couples MAPK signaling and the Pea3-ETS–mediated tran-scriptome through dynamic protein stability regulation. To evaluate how MAPK signaling–dependent Pea3-ETS factor stability regula-tion influences the coupling of MAPK signaling nuclear transcrip-tional output, we focused on COP1, which was previously shown to regulate Pea3 family ETS protein stability at baseline in prostate cancer (22, 23). In GIST (GIST882 and GIST-T1) and melanoma (A375) cells, COP1 interacts with ETV1 endogenously (Supple-mental Figure 5A). CRISPR/Cas9-mediated knockout of COP1 caused increased baseline protein levels of Pea3-ETS (ETV1, ETV4, and ETV5) and the MAPK negative-feedback regulators (e.g., DUSP6 and SPRY4), with a concomitant decrease in ERK phosphorylation (p-ERK) (Supplemental Figure 5B). These data indicate that stabilized Pea3-ETS factors are sufficient to increase the transcription of MAPK target genes.
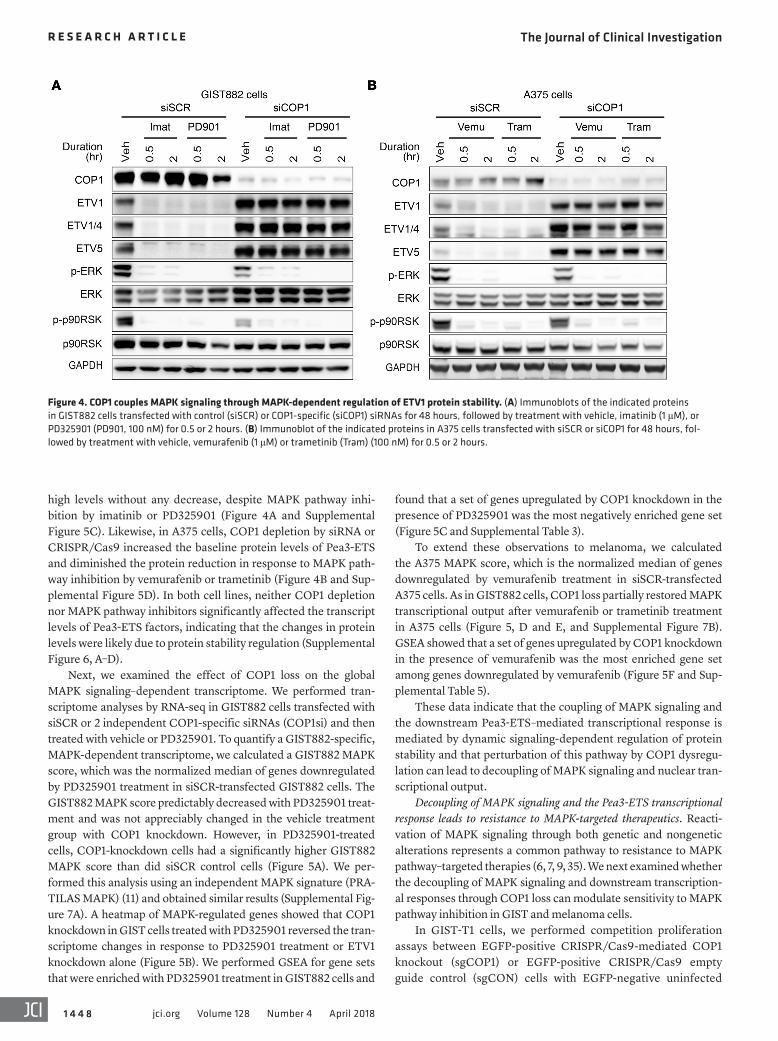
We then examined the effect of COP1 depletion on MAPK- regulated Pea3-ETS protein stability in GIST882 and A375 cells using siRNA-mediated knockdown of COP1 and CRISPR/Cas9-mediated knockout of COP1. In GIST882 cells treated with control scrambled siRNA (siSCR) or control single-guide RNA (sgCON), MAPK pathway inhibition by imatinib or PD325901 led to a rapid decrease in Pea3-ETS protein levels within 30 minutes. However, in GIST882 cells with RNAi or CRISPR/Cas9-mediated downregulation of COP1 (siCOP1 or sgCOP1), Pea3-ETS protein levels were higher at baseline (vehicle) and were maintained at
Figure 3. Genome-wide RNAi screen identifies key regulators of MAPK signaling–dependent ETV1 protein stability. (A) Schematic of the MAPK-ETV1 protein stability sensor construct with EGFP-ETV1 fusion protein and tdTomato expressed under the same promoter. (B) Immunoblots of EGFP and GAPDH in A2058 melanoma cells expressing EGFP or EGFP-flETV1, or EGFP-nETV1 and treated with DMSO (Veh), 1 μM vemurafenib, or MG132 for 8 hours. (C) FACS plot of tdTomato and EGFP fluorescence in A2058 cells expressing EGFP-nETV1-IRES-tdTomato treated with DMSO or 1 μM vemurafenib for 24 hours. (D) Histogram of the EGFP/tdTomato fluorescence ratio in EGFP-nETV1-IRES-tdTomato–expressing A2058 cells transduced with shRNA-miR against shSCR or BRAF (shBRAF) and treated with DMSO or 1 μM vemurafenib. (E) Schematic flow of screen. EGFP-nETV1-IRES-tdTomato–expressing A2058 cells were transduced with a genome-wide shRNA library. Cells were treated with vemurafenib for 24 hours prior to each sort. (F) Sche-matic of the role of selected hits in MAPK signaling–dependent regulation of ETV1 protein degradation. (G) Histogram of mCherry fluorescence of A375 cells expressing mCherry-nETV1 sensor treated with DMSO or 1 μM vemurafenib for 20 hours. (H) FACS plots of tGFP fluorescence linked to shRNA expression and mCherry-nETV1 fluorescence. A375 cells expressing mCherry-nETV1 and the indicated shRNA were transduced at a MOI of approximately 0.5 and treated with 1 μM vemurafenib or DMSO for an additional 20 hours.
Table 2. Top hits identified by HiTSelect
Gene Sort 2 Rank Sort 3RankCOP1 (RFWD2) 4 1DDB1 1 5PSMD4 2 7SR140 (U2SURP) 42 2UBE3C 3 6COPS2 8 3COPS1 (GPS1) 6 4COPS8 5 223SFRS11 (SRSF11) 12 8COPS6 10 160CCDC55 (NSRP1) 14 310DET1 819 15
Genes that were ranked in the top 15 in either sort 2 or sort 3 and that were within the top 1,000 in the other sort.
The Journal of Clinical Investigation R E S E A R C H A R T I C L E
1 4 4 8 jci.org Volume 128 Number 4 April 2018
high levels without any decrease, despite MAPK pathway inhi-bition by imatinib or PD325901 (Figure 4A and Supplemental Figure 5C). Likewise, in A375 cells, COP1 depletion by siRNA or CRISPR/Cas9 increased the baseline protein levels of Pea3-ETS and diminished the protein reduction in response to MAPK path-way inhibition by vemurafenib or trametinib (Figure 4B and Sup-plemental Figure 5D). In both cell lines, neither COP1 depletion nor MAPK pathway inhibitors significantly affected the transcript levels of Pea3-ETS factors, indicating that the changes in protein levels were likely due to protein stability regulation (Supplemental Figure 6, A–D).
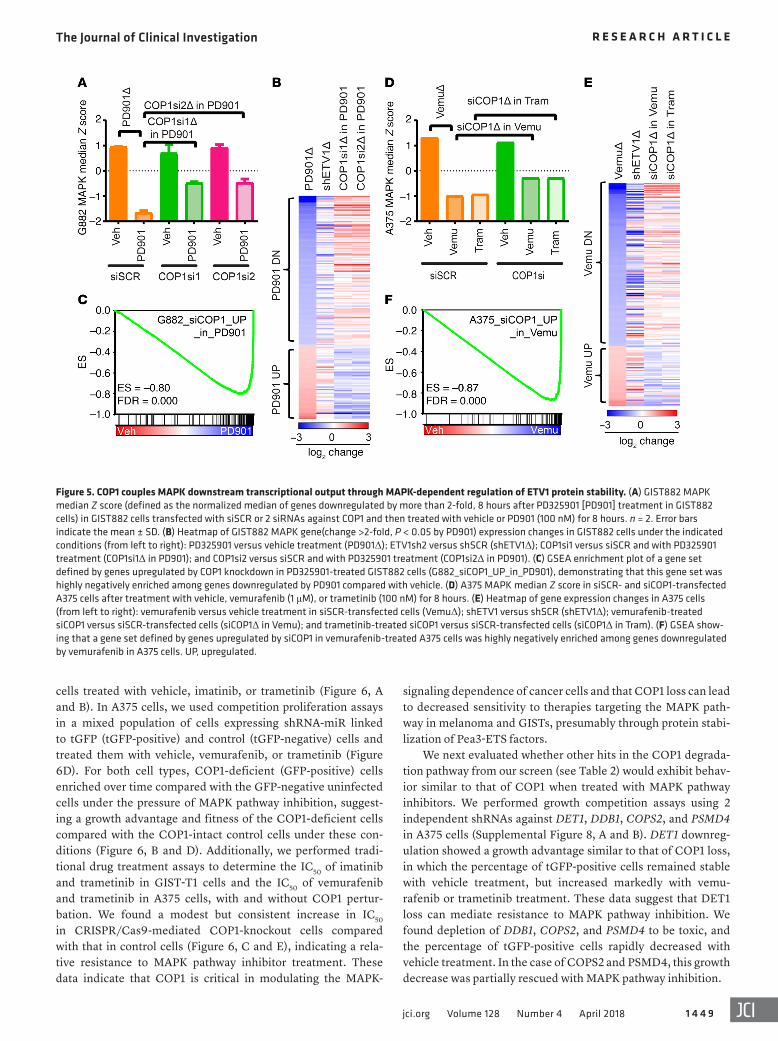
Next, we examined the effect of COP1 loss on the global MAPK signaling–dependent transcriptome. We performed tran-scriptome analyses by RNA-seq in GIST882 cells transfected with siSCR or 2 independent COP1-specific siRNAs (COP1si) and then treated with vehicle or PD325901. To quantify a GIST882-specific, MAPK-dependent transcriptome, we calculated a GIST882 MAPK score, which was the normalized median of genes downregulated by PD325901 treatment in siSCR-transfected GIST882 cells. The GIST882 MAPK score predictably decreased with PD325901 treat-ment and was not appreciably changed in the vehicle treatment group with COP1 knockdown. However, in PD325901-treated cells, COP1-knockdown cells had a significantly higher GIST882 MAPK score than did siSCR control cells (Figure 5A). We per-formed this analysis using an independent MAPK signature (PRA-TILAS MAPK) (11) and obtained similar results (Supplemental Fig-ure 7A). A heatmap of MAPK-regulated genes showed that COP1 knockdown in GIST cells treated with PD325901 reversed the tran-scriptome changes in response to PD325901 treatment or ETV1 knockdown alone (Figure 5B). We performed GSEA for gene sets that were enriched with PD325901 treatment in GIST882 cells and
found that a set of genes upregulated by COP1 knockdown in the presence of PD325901 was the most negatively enriched gene set (Figure 5C and Supplemental Table 3).
To extend these observations to melanoma, we calculated the A375 MAPK score, which is the normalized median of genes downregulated by vemurafenib treatment in siSCR-transfected A375 cells. As in GIST882 cells, COP1 loss partially restored MAPK transcriptional output after vemurafenib or trametinib treatment in A375 cells (Figure 5, D and E, and Supplemental Figure 7B). GSEA showed that a set of genes upregulated by COP1 knockdown in the presence of vemurafenib was the most enriched gene set among genes downregulated by vemurafenib (Figure 5F and Sup-plemental Table 5).
These data indicate that the coupling of MAPK signaling and the downstream Pea3-ETS–mediated transcriptional response is mediated by dynamic signaling-dependent regulation of protein stability and that perturbation of this pathway by COP1 dysregu-lation can lead to decoupling of MAPK signaling and nuclear tran-scriptional output.
Decoupling of MAPK signaling and the Pea3-ETS transcriptional response leads to resistance to MAPK-targeted therapeutics. Reacti-vation of MAPK signaling through both genetic and nongenetic alterations represents a common pathway to resistance to MAPK pathway–targeted therapies (6, 7, 9, 35). We next examined whether the decoupling of MAPK signaling and downstream transcription-al responses through COP1 loss can modulate sensitivity to MAPK pathway inhibition in GIST and melanoma cells.
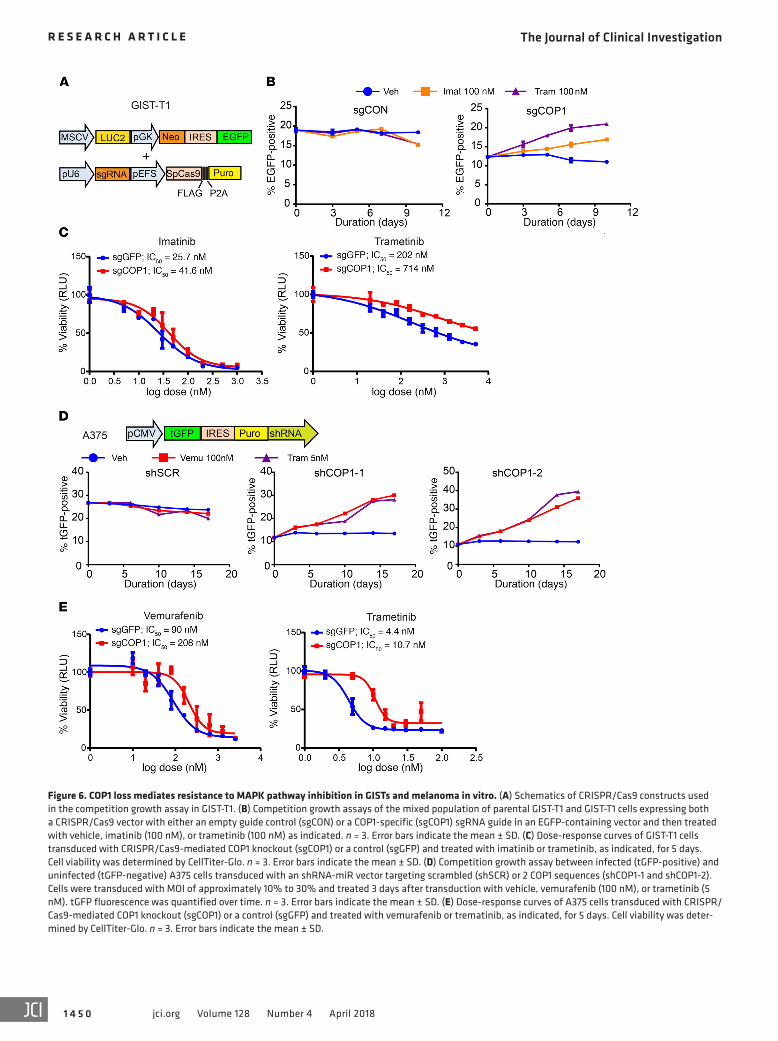
In GIST-T1 cells, we performed competition proliferation assays between EGFP-positive CRISPR/Cas9-mediated COP1 knockout (sgCOP1) or EGFP-positive CRISPR/Cas9 empty guide control (sgCON) cells with EGFP-negative uninfected
Figure 4. COP1 couples MAPK signaling through MAPK-dependent regulation of ETV1 protein stability. (A) Immunoblots of the indicated proteins in GIST882 cells transfected with control (siSCR) or COP1-specific (siCOP1) siRNAs for 48 hours, followed by treatment with vehicle, imatinib (1 μM), or PD325901 (PD901, 100 nM) for 0.5 or 2 hours. (B) Immunoblot of the indicated proteins in A375 cells transfected with siSCR or siCOP1 for 48 hours, fol-lowed by treatment with vehicle, vemurafenib (1 μM) or trametinib (Tram) (100 nM) for 0.5 or 2 hours.
The Journal of Clinical Investigation R E S E A R C H A R T I C L E
1 4 4 9jci.org Volume 128 Number 4 April 2018
signaling dependence of cancer cells and that COP1 loss can lead to decreased sensitivity to therapies targeting the MAPK path-way in melanoma and GISTs, presumably through protein stabi-lization of Pea3-ETS factors.
We next evaluated whether other hits in the COP1 degrada-tion pathway from our screen (see Table 2) would exhibit behav-ior similar to that of COP1 when treated with MAPK pathway inhibitors. We performed growth competition assays using 2 independent shRNAs against DET1, DDB1, COPS2, and PSMD4 in A375 cells (Supplemental Figure 8, A and B). DET1 downreg-ulation showed a growth advantage similar to that of COP1 loss, in which the percentage of tGFP-positive cells remained stable with vehicle treatment, but increased markedly with vemu-rafenib or trametinib treatment. These data suggest that DET1 loss can mediate resistance to MAPK pathway inhibition. We found depletion of DDB1, COPS2, and PSMD4 to be toxic, and the percentage of tGFP-positive cells rapidly decreased with vehicle treatment. In the case of COPS2 and PSMD4, this growth decrease was partially rescued with MAPK pathway inhibition.
cells treated with vehicle, imatinib, or trametinib (Figure 6, A and B). In A375 cells, we used competition proliferation assays in a mixed population of cells expressing shRNA-miR linked to tGFP (tGFP-positive) and control (tGFP-negative) cells and treated them with vehicle, vemurafenib, or trametinib (Figure 6D). For both cell types, COP1-deficient (GFP-positive) cells enriched over time compared with the GFP-negative uninfected cells under the pressure of MAPK pathway inhibition, suggest-ing a growth advantage and fitness of the COP1-deficient cells compared with the COP1-intact control cells under these con-ditions (Figure 6, B and D). Additionally, we performed tradi-tional drug treatment assays to determine the IC50 of imatinib and trametinib in GIST-T1 cells and the IC50 of vemurafenib and trametinib in A375 cells, with and without COP1 pertur-bation. We found a modest but consistent increase in IC50 in CRISPR/Cas9-mediated COP1-knockout cells compared with that in control cells (Figure 6, C and E), indicating a rela-tive resistance to MAPK pathway inhibitor treatment. These data indicate that COP1 is critical in modulating the MAPK-
Figure 5. COP1 couples MAPK downstream transcriptional output through MAPK-dependent regulation of ETV1 protein stability. (A) GIST882 MAPK median Z score (defined as the normalized median of genes downregulated by more than 2-fold, 8 hours after PD325901 [PD901] treatment in GIST882 cells) in GIST882 cells transfected with siSCR or 2 siRNAs against COP1 and then treated with vehicle or PD901 (100 nM) for 8 hours. n = 2. Error bars indicate the mean ± SD. (B) Heatmap of GIST882 MAPK gene(change >2-fold, P < 0.05 by PD901) expression changes in GIST882 cells under the indicated conditions (from left to right): PD325901 versus vehicle treatment (PD901Δ); ETV1sh2 versus shSCR (shETV1Δ); COP1si1 versus siSCR and with PD325901 treatment (COP1si1Δ in PD901); and COP1si2 versus siSCR and with PD325901 treatment (COP1si2Δ in PD901). (C) GSEA enrichment plot of a gene set defined by genes upregulated by COP1 knockdown in PD325901-treated GIST882 cells (G882_siCOP1_UP_in_PD901), demonstrating that this gene set was highly negatively enriched among genes downregulated by PD901 compared with vehicle. (D) A375 MAPK median Z score in siSCR- and siCOP1-transfected A375 cells after treatment with vehicle, vemurafenib (1 μM), or trametinib (100 nM) for 8 hours. (E) Heatmap of gene expression changes in A375 cells (from left to right): vemurafenib versus vehicle treatment in siSCR-transfected cells (VemuΔ); shETV1 versus shSCR (shETV1Δ); vemurafenib-treated siCOP1 versus siSCR-transfected cells (siCOP1Δ in Vemu); and trametinib-treated siCOP1 versus siSCR-transfected cells (siCOP1Δ in Tram). (F) GSEA show-ing that a gene set defined by genes upregulated by siCOP1 in vemurafenib-treated A375 cells was highly negatively enriched among genes downregulated by vemurafenib in A375 cells. UP, upregulated.
The Journal of Clinical Investigation R E S E A R C H A R T I C L E
1 4 5 0 jci.org Volume 128 Number 4 April 2018
Figure 6. COP1 loss mediates resistance to MAPK pathway inhibition in GISTs and melanoma in vitro. (A) Schematics of CRISPR/Cas9 constructs used in the competition growth assay in GIST-T1. (B) Competition growth assays of the mixed population of parental GIST-T1 and GIST-T1 cells expressing both a CRISPR/Cas9 vector with either an empty guide control (sgCON) or a COP1-specific (sgCOP1) sgRNA guide in an EGFP-containing vector and then treated with vehicle, imatinib (100 nM), or trametinib (100 nM) as indicated. n = 3. Error bars indicate the mean ± SD. (C) Dose-response curves of GIST-T1 cells transduced with CRISPR/Cas9-mediated COP1 knockout (sgCOP1) or a control (sgGFP) and treated with imatinib or trametinib, as indicated, for 5 days. Cell viability was determined by CellTiter-Glo. n = 3. Error bars indicate the mean ± SD. (D) Competition growth assay between infected (tGFP-positive) and uninfected (tGFP-negative) A375 cells transduced with an shRNA-miR vector targeting scrambled (shSCR) or 2 COP1 sequences (shCOP1-1 and shCOP1-2). Cells were transduced with MOI of approximately 10% to 30% and treated 3 days after transduction with vehicle, vemurafenib (100 nM), or trametinib (5 nM). tGFP fluorescence was quantified over time. n = 3. Error bars indicate the mean ± SD. (E) Dose-response curves of A375 cells transduced with CRISPR/Cas9-mediated COP1 knockout (sgCOP1) or a control (sgGFP) and treated with vemurafenib or trematinib, as indicated, for 5 days. Cell viability was deter-mined by CellTiter-Glo. n = 3. Error bars indicate the mean ± SD.
The Journal of Clinical Investigation R E S E A R C H A R T I C L E
1 4 5 1jci.org Volume 128 Number 4 April 2018
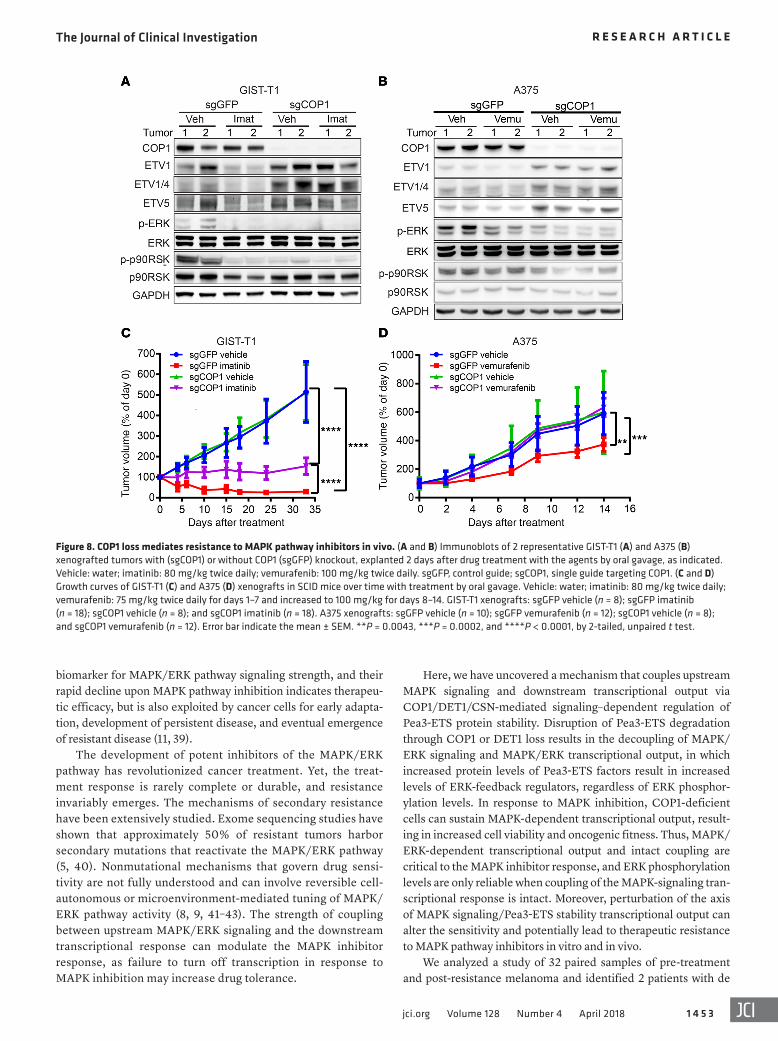
To determine whether COP1 loss modulates sensitivity to MAPK pathway inhibition in GISTs and melanoma in vivo, we treated GIST and melanoma xenografts with and without CRIS-PR/Cas9-mediated COP1 knockout. Short-term treatment of both GIST-T1 and A375 tumors recapitulated the in vitro observation and demonstrated that COP1-knockout xenografted tumors had increased baseline Pea3-ETS protein levels and diminished protein degradation in response to MAPK pathway inhibition (Figure 8, A and B). In GIST-T1 xenografted tumors, COP1 knockout did not affect in vivo growth when treated with vehicle, but showed a diminished response to imatinib with development of early resistance compared with controls (Figure 8C). Similarly, COP1 knockout significantly diminished the growth-suppressive effects by vemurafenib com-pared with that seen in controls in A375 xenografted tumors (Figure 8D). These data indicate that perturbation of the MAPK signaling–dependent Pea3-ETS protein stability regulatory axis can modulate sensitivity and lead to resistance to MAPK pathway inhibitors in vivo.
Characterization of COP1 and DET1 mutations in patients’ tumor samples. To study the clinical relevance of the Pea3-ETS protein sta-
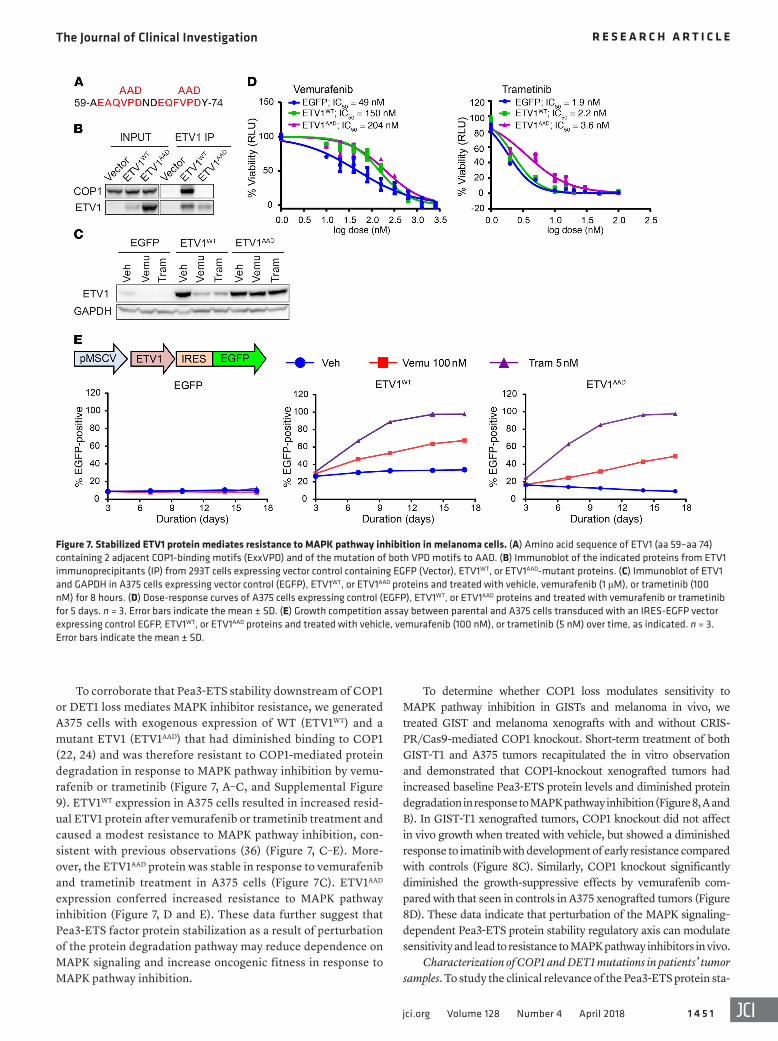
To corroborate that Pea3-ETS stability downstream of COP1 or DET1 loss mediates MAPK inhibitor resistance, we generated A375 cells with exogenous expression of WT (ETV1WT) and a mutant ETV1 (ETV1AAD) that had diminished binding to COP1 (22, 24) and was therefore resistant to COP1-mediated protein degradation in response to MAPK pathway inhibition by vemu-rafenib or trametinib (Figure 7, A–C, and Supplemental Figure 9). ETV1WT expression in A375 cells resulted in increased resid-ual ETV1 protein after vemurafenib or trametinib treatment and caused a modest resistance to MAPK pathway inhibition, con-sistent with previous observations (36) (Figure 7, C–E). More-over, the ETV1AAD protein was stable in response to vemurafenib and trametinib treatment in A375 cells (Figure 7C). ETV1AAD expression conferred increased resistance to MAPK pathway inhibition (Figure 7, D and E). These data further suggest that Pea3-ETS factor protein stabilization as a result of perturbation of the protein degradation pathway may reduce dependence on MAPK signaling and increase oncogenic fitness in response to MAPK pathway inhibition.
Figure 7. Stabilized ETV1 protein mediates resistance to MAPK pathway inhibition in melanoma cells. (A) Amino acid sequence of ETV1 (aa 59–aa 74) containing 2 adjacent COP1-binding motifs (ExxVPD) and of the mutation of both VPD motifs to AAD. (B) Immunoblot of the indicated proteins from ETV1 immunoprecipitants (IP) from 293T cells expressing vector control containing EGFP (Vector), ETV1WT, or ETV1AAD-mutant proteins. (C) Immunoblot of ETV1 and GAPDH in A375 cells expressing vector control (EGFP), ETV1WT, or ETV1AAD proteins and treated with vehicle, vemurafenib (1 μM), or trametinib (100 nM) for 8 hours. (D) Dose-response curves of A375 cells expressing control (EGFP), ETV1WT, or ETV1AAD proteins and treated with vemurafenib or trametinib for 5 days. n = 3. Error bars indicate the mean ± SD. (E) Growth competition assay between parental and A375 cells transduced with an IRES-EGFP vector expressing control EGFP, ETV1WT, or ETV1AAD proteins and treated with vehicle, vemurafenib (100 nM), or trametinib (5 nM) over time, as indicated. n = 3. Error bars indicate the mean ± SD.
The Journal of Clinical Investigation R E S E A R C H A R T I C L E
1 4 5 2 jci.org Volume 128 Number 4 April 2018
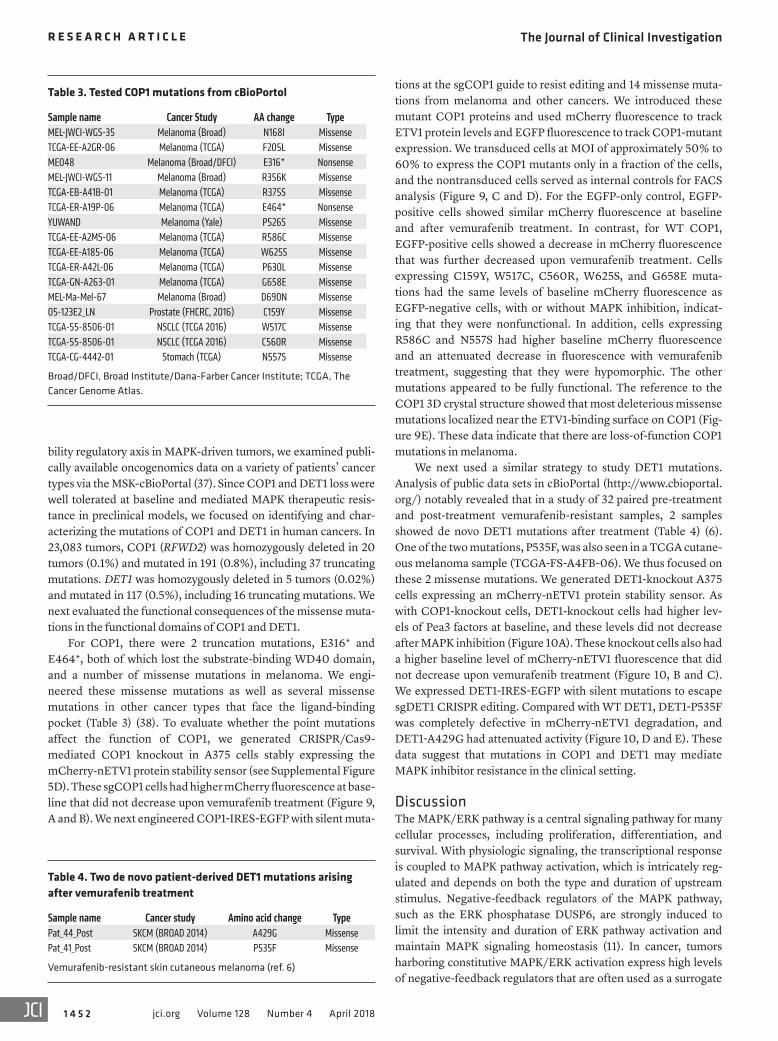
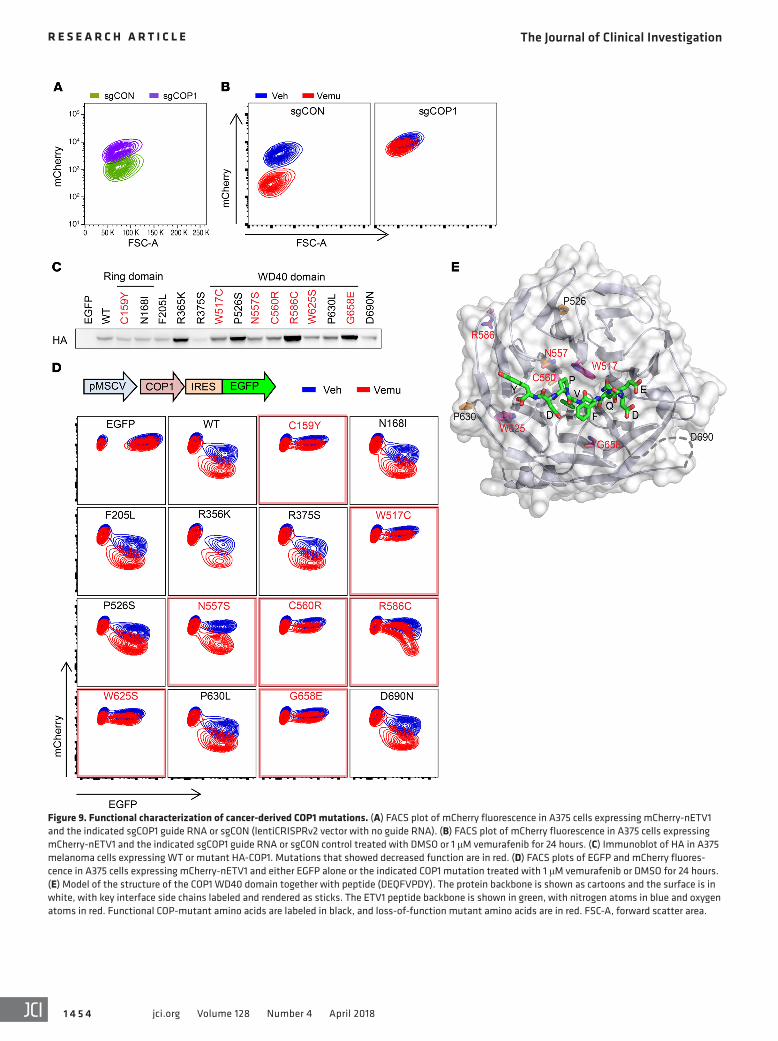
tions at the sgCOP1 guide to resist editing and 14 missense muta-tions from melanoma and other cancers. We introduced these mutant COP1 proteins and used mCherry fluorescence to track ETV1 protein levels and EGFP fluorescence to track COP1-mutant expression. We transduced cells at MOI of approximately 50% to 60% to express the COP1 mutants only in a fraction of the cells, and the nontransduced cells served as internal controls for FACS analysis (Figure 9, C and D). For the EGFP-only control, EGFP- positive cells showed similar mCherry fluorescence at baseline and after vemurafenib treatment. In contrast, for WT COP1, EGFP-positive cells showed a decrease in mCherry fluorescence that was further decreased upon vemurafenib treatment. Cells expressing C159Y, W517C, C560R, W625S, and G658E muta-tions had the same levels of baseline mCherry fluorescence as EGFP-negative cells, with or without MAPK inhibition, indicat-ing that they were nonfunctional. In addition, cells expressing R586C and N557S had higher baseline mCherry fluorescence and an attenuated decrease in fluorescence with vemurafenib treatment, suggesting that they were hypomorphic. The other mutations appeared to be fully functional. The reference to the COP1 3D crystal structure showed that most deleterious missense mutations localized near the ETV1-binding surface on COP1 (Fig-ure 9E). These data indicate that there are loss-of-function COP1 mutations in melanoma.
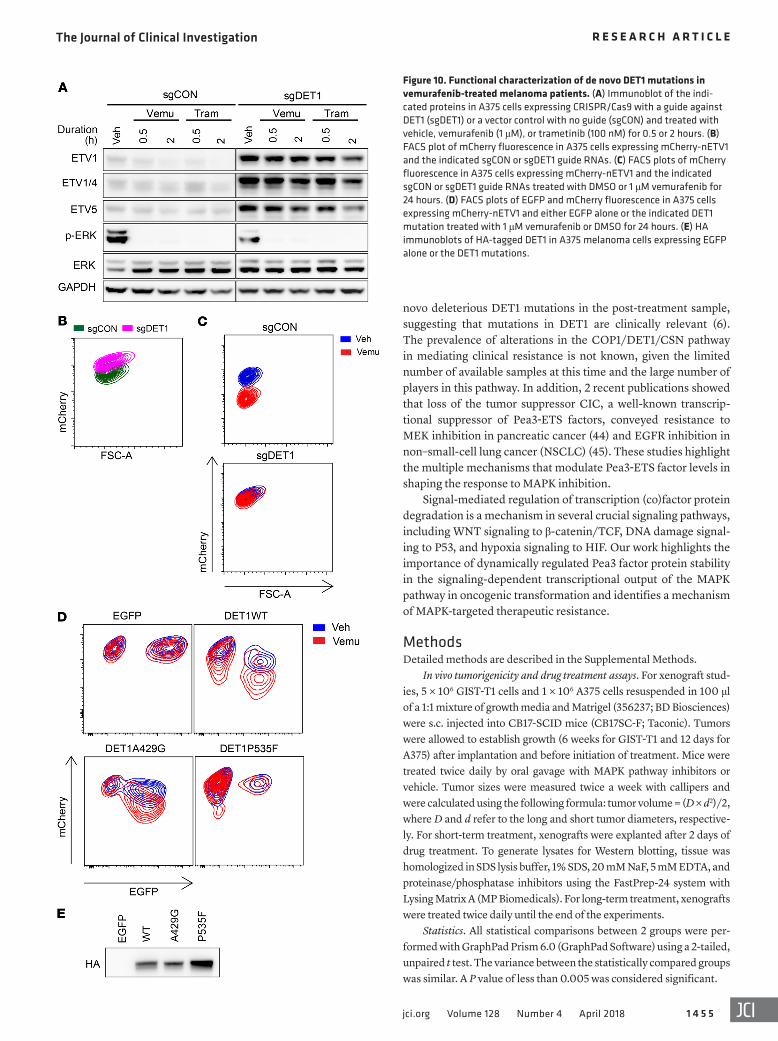
We next used a similar strategy to study DET1 mutations. Analysis of public data sets in cBioPortal (http://www.cbioportal.org/) notably revealed that in a study of 32 paired pre-treatment and post-treatment vemurafenib-resistant samples, 2 samples showed de novo DET1 mutations after treatment (Table 4) (6). One of the two mutations, P535F, was also seen in a TCGA cutane-ous melanoma sample (TCGA-FS-A4FB-06). We thus focused on these 2 missense mutations. We generated DET1-knockout A375 cells expressing an mCherry-nETV1 protein stability sensor. As with COP1-knockout cells, DET1-knockout cells had higher lev-els of Pea3 factors at baseline, and these levels did not decrease after MAPK inhibition (Figure 10A). These knockout cells also had a higher baseline level of mCherry-nETV1 fluorescence that did not decrease upon vemurafenib treatment (Figure 10, B and C). We expressed DET1-IRES-EGFP with silent mutations to escape sgDET1 CRISPR editing. Compared with WT DET1, DET1-P535F was completely defective in mCherry-nETV1 degradation, and DET1-A429G had attenuated activity (Figure 10, D and E). These data suggest that mutations in COP1 and DET1 may mediate MAPK inhibitor resistance in the clinical setting.
DiscussionThe MAPK/ERK pathway is a central signaling pathway for many cellular processes, including proliferation, differentiation, and survival. With physiologic signaling, the transcriptional response is coupled to MAPK pathway activation, which is intricately reg-ulated and depends on both the type and duration of upstream stimulus. Negative-feedback regulators of the MAPK pathway, such as the ERK phosphatase DUSP6, are strongly induced to limit the intensity and duration of ERK pathway activation and maintain MAPK signaling homeostasis (11). In cancer, tumors harboring constitutive MAPK/ERK activation express high levels of negative-feedback regulators that are often used as a surrogate
bility regulatory axis in MAPK-driven tumors, we examined publi-cally available oncogenomics data on a variety of patients’ cancer types via the MSK-cBioPortal (37). Since COP1 and DET1 loss were well tolerated at baseline and mediated MAPK therapeutic resis-tance in preclinical models, we focused on identifying and char-acterizing the mutations of COP1 and DET1 in human cancers. In 23,083 tumors, COP1 (RFWD2) was homozygously deleted in 20 tumors (0.1%) and mutated in 191 (0.8%), including 37 truncating mutations. DET1 was homozygously deleted in 5 tumors (0.02%) and mutated in 117 (0.5%), including 16 truncating mutations. We next evaluated the functional consequences of the missense muta-tions in the functional domains of COP1 and DET1.
For COP1, there were 2 truncation mutations, E316* and E464*, both of which lost the substrate-binding WD40 domain, and a number of missense mutations in melanoma. We engi-neered these missense mutations as well as several missense mutations in other cancer types that face the ligand-binding pocket (Table 3) (38). To evaluate whether the point mutations affect the function of COP1, we generated CRISPR/Cas9- mediated COP1 knockout in A375 cells stably expressing the mCherry-nETV1 protein stability sensor (see Supplemental Figure 5D). These sgCOP1 cells had higher mCherry fluorescence at base-line that did not decrease upon vemurafenib treatment (Figure 9, A and B). We next engineered COP1-IRES-EGFP with silent muta-
Table 3. Tested COP1 mutations from cBioPortol
Sample name Cancer Study AA change TypeMEL-JWCI-WGS-35 Melanoma (Broad) N168I MissenseTCGA-EE-A2GR-06 Melanoma (TCGA) F205L MissenseME048 Melanoma (Broad/DFCI) E316* NonsenseMEL-JWCI-WGS-11 Melanoma (Broad) R356K MissenseTCGA-EB-A41B-01 Melanoma (TCGA) R375S MissenseTCGA-ER-A19P-06 Melanoma (TCGA) E464* NonsenseYUWAND Melanoma (Yale) P526S MissenseTCGA-EE-A2MS-06 Melanoma (TCGA) R586C MissenseTCGA-EE-A185-06 Melanoma (TCGA) W625S MissenseTCGA-ER-A42L-06 Melanoma (TCGA) P630L MissenseTCGA-GN-A263-01 Melanoma (TCGA) G658E MissenseMEL-Ma-Mel-67 Melanoma (Broad) D690N Missense05-123E2_LN Prostate (FHCRC, 2016) C159Y Missense TCGA-55-8506-01 NSCLC (TCGA 2016) W517C Missense TCGA-55-8506-01 NSCLC (TCGA 2016) C560R MissenseTCGA-CG-4442-01 Stomach (TCGA) N557S Missense
Broad/DFCI, Broad Institute/Dana-Farber Cancer Institute; TCGA, The Cancer Genome Atlas.
Table 4. Two de novo patient-derived DET1 mutations arising after vemurafenib treatment
Sample name Cancer study Amino acid change Type Pat_44_Post SKCM (BROAD 2014) A429G MissensePat_41_Post SKCM (BROAD 2014) P535F Missense
Vemurafenib-resistant skin cutaneous melanoma (ref. 6)
The Journal of Clinical Investigation R E S E A R C H A R T I C L E
1 4 5 3jci.org Volume 128 Number 4 April 2018
Here, we have uncovered a mechanism that couples upstream MAPK signaling and downstream transcriptional output via COP1/DET1/CSN-mediated signaling–dependent regulation of Pea3-ETS protein stability. Disruption of Pea3-ETS degradation through COP1 or DET1 loss results in the decoupling of MAPK/ERK signaling and MAPK/ERK transcriptional output, in which increased protein levels of Pea3-ETS factors result in increased levels of ERK-feedback regulators, regardless of ERK phosphor-ylation levels. In response to MAPK inhibition, COP1-deficient cells can sustain MAPK-dependent transcriptional output, result-ing in increased cell viability and oncogenic fitness. Thus, MAPK/ERK-dependent transcriptional output and intact coupling are critical to the MAPK inhibitor response, and ERK phosphorylation levels are only reliable when coupling of the MAPK-signaling tran-scriptional response is intact. Moreover, perturbation of the axis of MAPK signaling/Pea3-ETS stability transcriptional output can alter the sensitivity and potentially lead to therapeutic resistance to MAPK pathway inhibitors in vitro and in vivo.
We analyzed a study of 32 paired samples of pre-treatment and post-resistance melanoma and identified 2 patients with de
biomarker for MAPK/ERK pathway signaling strength, and their rapid decline upon MAPK pathway inhibition indicates therapeu-tic efficacy, but is also exploited by cancer cells for early adapta-tion, development of persistent disease, and eventual emergence of resistant disease (11, 39).
The development of potent inhibitors of the MAPK/ERK pathway has revolutionized cancer treatment. Yet, the treat-ment response is rarely complete or durable, and resistance invariably emerges. The mechanisms of secondary resistance have been extensively studied. Exome sequencing studies have shown that approximately 50% of resistant tumors harbor secondary mutations that reactivate the MAPK/ERK pathway (5, 40). Nonmutational mechanisms that govern drug sensi-tivity are not fully understood and can involve reversible cell- autonomous or microenvironment-mediated tuning of MAPK/ERK pathway activity (8, 9, 41–43). The strength of coupling between upstream MAPK/ERK signaling and the downstream transcriptional response can modulate the MAPK inhibitor response, as failure to turn off transcription in response to MAPK inhibition may increase drug tolerance.
Figure 8. COP1 loss mediates resistance to MAPK pathway inhibitors in vivo. (A and B) Immunoblots of 2 representative GIST-T1 (A) and A375 (B) xenografted tumors with (sgCOP1) or without COP1 (sgGFP) knockout, explanted 2 days after drug treatment with the agents by oral gavage, as indicated. Vehicle: water; imatinib: 80 mg/kg twice daily; vemurafenib: 100 mg/kg twice daily. sgGFP, control guide; sgCOP1, single guide targeting COP1. (C and D) Growth curves of GIST-T1 (C) and A375 (D) xenografts in SCID mice over time with treatment by oral gavage. Vehicle: water; imatinib: 80 mg/kg twice daily; vemurafenib: 75 mg/kg twice daily for days 1–7 and increased to 100 mg/kg for days 8–14. GIST-T1 xenografts: sgGFP vehicle (n = 8); sgGFP imatinib (n = 18); sgCOP1 vehicle (n = 8); and sgCOP1 imatinib (n = 18). A375 xenografts: sgGFP vehicle (n = 10); sgGFP vemurafenib (n = 12); sgCOP1 vehicle (n = 8); and sgCOP1 vemurafenib (n = 12). Error bar indicate the mean ± SEM. **P = 0.0043, ***P = 0.0002, and ****P < 0.0001, by 2-tailed, unpaired t test.
The Journal of Clinical Investigation R E S E A R C H A R T I C L E
1 4 5 4 jci.org Volume 128 Number 4 April 2018
Figure 9. Functional characterization of cancer-derived COP1 mutations. (A) FACS plot of mCherry fluorescence in A375 cells expressing mCherry-nETV1 and the indicated sgCOP1 guide RNA or sgCON (lentiCRISPRv2 vector with no guide RNA). (B) FACS plot of mCherry fluorescence in A375 cells expressing mCherry-nETV1 and the indicated sgCOP1 guide RNA or sgCON control treated with DMSO or 1 μM vemurafenib for 24 hours. (C) Immunoblot of HA in A375 melanoma cells expressing WT or mutant HA-COP1. Mutations that showed decreased function are in red. (D) FACS plots of EGFP and mCherry fluores-cence in A375 cells expressing mCherry-nETV1 and either EGFP alone or the indicated COP1 mutation treated with 1 μM vemurafenib or DMSO for 24 hours. (E) Model of the structure of the COP1 WD40 domain together with peptide (DEQFVPDY). The protein backbone is shown as cartoons and the surface is in white, with key interface side chains labeled and rendered as sticks. The ETV1 peptide backbone is shown in green, with nitrogen atoms in blue and oxygen atoms in red. Functional COP-mutant amino acids are labeled in black, and loss-of-function mutant amino acids are in red. FSC-A, forward scatter area.
The Journal of Clinical Investigation R E S E A R C H A R T I C L E
1 4 5 5jci.org Volume 128 Number 4 April 2018
novo deleterious DET1 mutations in the post-treatment sample, suggesting that mutations in DET1 are clinically relevant (6). The prevalence of alterations in the COP1/DET1/CSN pathway in mediating clinical resistance is not known, given the limited number of available samples at this time and the large number of players in this pathway. In addition, 2 recent publications showed that loss of the tumor suppressor CIC, a well-known transcrip-tional suppressor of Pea3-ETS factors, conveyed resistance to MEK inhibition in pancreatic cancer (44) and EGFR inhibition in non–small-cell lung cancer (NSCLC) (45). These studies highlight the multiple mechanisms that modulate Pea3-ETS factor levels in shaping the response to MAPK inhibition.
Signal-mediated regulation of transcription (co)factor protein degradation is a mechanism in several crucial signaling pathways, including WNT signaling to β-catenin/TCF, DNA damage signal-ing to P53, and hypoxia signaling to HIF. Our work highlights the importance of dynamically regulated Pea3 factor protein stability in the signaling-dependent transcriptional output of the MAPK pathway in oncogenic transformation and identifies a mechanism of MAPK-targeted therapeutic resistance.
MethodsDetailed methods are described in the Supplemental Methods.
In vivo tumorigenicity and drug treatment assays. For xenograft stud-ies, 5 × 10⁶ GIST-T1 cells and 1 × 10⁶ A375 cells resuspended in 100 μl of a 1:1 mixture of growth media and Matrigel (356237; BD Biosciences) were s.c. injected into CB17-SCID mice (CB17SC-F; Taconic). Tumors were allowed to establish growth (6 weeks for GIST-T1 and 12 days for A375) after implantation and before initiation of treatment. Mice were treated twice daily by oral gavage with MAPK pathway inhibitors or vehicle. Tumor sizes were measured twice a week with callipers and were calculated using the following formula: tumor volume = (D × d2)/2, where D and d refer to the long and short tumor diameters, respective-ly. For short-term treatment, xenografts were explanted after 2 days of drug treatment. To generate lysates for Western blotting, tissue was homologized in SDS lysis buffer, 1% SDS, 20 mM NaF, 5 mM EDTA, and proteinase/phosphatase inhibitors using the FastPrep-24 system with Lysing Matrix A (MP Biomedicals). For long-term treatment, xenografts were treated twice daily until the end of the experiments.
Statistics. All statistical comparisons between 2 groups were per-formed with GraphPad Prism 6.0 (GraphPad Software) using a 2-tailed, unpaired t test. The variance between the statistically compared groups was similar. A P value of less than 0.005 was considered significant.
Figure 10. Functional characterization of de novo DET1 mutations in vemurafenib-treated melanoma patients. (A) Immunoblot of the indi-cated proteins in A375 cells expressing CRISPR/Cas9 with a guide against DET1 (sgDET1) or a vector control with no guide (sgCON) and treated with vehicle, vemurafenib (1 μM), or trametinib (100 nM) for 0.5 or 2 hours. (B) FACS plot of mCherry fluorescence in A375 cells expressing mCherry-nETV1 and the indicated sgCON or sgDET1 guide RNAs. (C) FACS plots of mCherry fluorescence in A375 cells expressing mCherry-nETV1 and the indicated sgCON or sgDET1 guide RNAs treated with DMSO or 1 μM vemurafenib for 24 hours. (D) FACS plots of EGFP and mCherry fluorescence in A375 cells expressing mCherry-nETV1 and either EGFP alone or the indicated DET1 mutation treated with 1 μM vemurafenib or DMSO for 24 hours. (E) HA immunoblots of HA-tagged DET1 in A375 melanoma cells expressing EGFP alone or the DET1 mutations.
The Journal of Clinical Investigation R E S E A R C H A R T I C L E
1 4 5 6 jci.org Volume 128 Number 4 April 2018
(DFCI), Joan Massagué (MSKCC), and Takahiro Taguchi (Kochi University) for cell lines; and Charles L. Sawyers, James A. Fagin, and Neal Rosen (all from MSKCC) for critical review of the man-uscript. Next-generation sequencing and gene expression arrays were conducted at the MSKCC Genomics Core Facility. FACS was performed at the MSKCC Flow Cytometry Core. This work was supported by grants from the National Cancer Institute (NCI) (K08CA140946, to YC; R01CA193837, to YC; P50CA092629, to YC; P50CA140146, to PC and CRA; K08CA151660, to PC; and DP2 CA174499, to PC); the US Department of Defense (DOD) (W81XWH-10-1-0197); the Prostate Cancer Foundation (to YC), the Starr Cancer Consortium (to YC and PC); the Geoffrey Beene Cancer Research Center (to YC and PC); the Gerstner Family Foundation (to YC); the Bressler Scholars Fund (to YC); the GIST Cancer Research Fund (to PC and CRA); the Shuman Fund (to PC and CRA); and the GIST Cancer Awareness Fund (to PC).
Address correspondence to: Ping Chi or Yu Chen, Memorial Sloan Kettering Cancer Center, 1275 York Avenue, New York, New York 10065, USA. Phone: 646.888.3338; Email: [email protected] (P. Chi). Phone: 646.888.3356; Email: [email protected] (Y. Chen).
Study approval. All animal experiments were performed in accor-dance with a protocol reviewed and approved by the IACUC of MSK-CC (protocol 11-12-029).
Author contributionsExperimental design: YX, ZC, PC, YC, and CRA; shRNA screen: ZC, YX, JQZ, YG, SRVK, KC, and GH; RNAi: YX and IS; Western blotting: SW, YX, and ZC; immunoprecipitation: YX; ChIP, ChIP-seq, and RNA-seq: PC, YC, YX, IS, EWPW, SS, and DG; genera-tion of expression vectors: YX, ZC, YG, and JL; mCherry nETV1 protein stability assay: YX and YG; xenografts: YX, DM, EGW, LR, and JW; growth competition assay and FACS: YX, JQZ, and ZC; CRISPR/Cas9-mediated knockout: YX and ZC; structure mod-eling: WM; writing of the manuscript: YX, ZC, YC, and PC. All authors reviewed and edited the manuscript.
AcknowledgmentsWe wish to thank Corynn Kasap (Rockefeller University), Mary Klein (MSKCC), Terri McBride (Bella) (University of Minnesota Medical School), and Karey Zheng (New York University) for reagent development; David Solit (MSKCC), Jonathan Fletcher
1. Chapman PB, et al. Improved survival with vemu-rafenib in melanoma with BRAF V600E muta-tion. N Engl J Med. 2011;364(26):2507–2516.
2. Flaherty KT, et al. Improved survival with MEK inhibition in BRAF-mutated melanoma. N Engl J Med. 2012;367(2):107–114.
3. Corless CL, et al. PDGFRA mutations in gastro-intestinal stromal tumors: frequency, spectrum and in vitro sensitivity to imatinib. J Clin Oncol. 2005;23(23):5357–5364.
4. Demetri GD, et al. Efficacy and safety of imatinib mesylate in advanced gastrointestinal stromal tumors. N Engl J Med. 2002;347(7):472–480.
5. Shi H, et al. Acquired resistance and clonal evolu-tion in melanoma during BRAF inhibitor therapy. Cancer Discov. 2014;4(1):80–93.
6. Van Allen EM, et al. The genetic landscape of clinical resistance to RAF inhibition in metastatic melanoma. Cancer Discov. 2014;4(1):94–109.
7. Poulikakos PI, et al. RAF inhibitor resistance is mediated by dimerization of aberrantly spliced BRAF(V600E). Nature. 2011;480(7377):387–390.
8. Das Thakur M, et al. Modelling vemurafenib resis-tance in melanoma reveals a strategy to forestall drug resistance. Nature. 2013;494(7436):251–255.
9. Sun C, et al. Reversible and adaptive resistance to BRAF(V600E) inhibition in melanoma. Nature. 2014;508(7494):118–122.
10. Dry JR, et al. Transcriptional pathway signatures predict MEK addiction and response to selumetinib (AZD6244). Cancer Res. 2010;70(6):2264–2273.
11. Pratilas CA, et al. (V600E)BRAF is associated with disabled feedback inhibition of RAF-MEK signaling and elevated transcriptional out-put of the pathway. Proc Natl Acad Sci U S A. 2009;106(11):4519–4524.
12. Marais R, Wynne J, Treisman R. The SRF acces-sory protein Elk-1 contains a growth factor- regulated transcriptional activation domain. Cell. 1993;73(2):381–393.
13. Slack C, Alic N, Foley A, Cabecinha M, Hoddinott
MP, Partridge L. The Ras-Erk-ETS-Signaling Pathway Is a Drug Target for Longevity. Cell. 2015;162(1):72–83.
14. Wasylyk B, Hagman J, Gutierrez-Hartmann A. Ets transcription factors: nuclear effectors of the Ras-MAP-kinase signaling pathway. Trends Bio-chem Sci. 1998;23(6):213–216.
15. Chi P, et al. ETV1 is a lineage survival factor that cooperates with KIT in gastrointestinal stromal tumours. Nature. 2010;467(7317):849–853.
16. Hayashi Y, et al. Platelet-Derived Growth Factor Receptor-α Regulates Proliferation of Gastro-intestinal Stromal Tumor Cells With Mutations in KIT by Stabilizing ETV1. Gastroenterology. 2015;149(2):420–32.e16.
17. Ran L, et al. Combined inhibition of MAP kinase and KIT signaling synergistically destabilizes ETV1 and suppresses GIST tumor growth. Cancer Discov. 2015;5(3):304–315.
18. Ran L, et al. ETV1-Positive Cells Give Rise to BRAFV600E -Mutant Gastrointestinal Stromal Tumors. Cancer Res. 2017;77(14):3758–3765.
19. Ran L, et al. FOXF1 defines the core-regulatory circuitry in gastrointestinal stromal tumor (GIST) [published online ahead of print November 21, 2017]. Cancer Discov. https://doi.org/10.1158/2159-8290.CD-17-0468.
20. Jané-Valbuena J, et al. An oncogenic role for ETV1 in melanoma. Cancer Res. 2010;70(5):2075–2084.
21. Mehra R, et al. Comprehensive Analysis of ETS Family Members in Melanoma by Fluorescence In Situ Hybridization Reveals Recurrent ETV1 Amplification. Transl Oncol. 2013;6(4):405–412.
22. Vitari AC, et al. COP1 is a tumour suppressor that causes degradation of ETS transcription factors. Nature. 2011;474(7351):403–406.
23. Migliorini D, et al. Cop1 constitutively reg-ulates c-Jun protein stability and functions as a tumor suppressor in mice. J Clin Invest. 2011;121(4):1329–1343.
24. Baert JL, Monte D, Verreman K, Degerny C,
Coutte L, de Launoit Y. The E3 ubiquitin ligase complex component COP1 regulates PEA3 group member stability and transcriptional activity. Oncogene. 2010;29(12):1810–1820.
25. Chen Y, et al. ETS factors reprogram the andro-gen receptor cistrome and prime prostate tum-origenesis in response to PTEN loss. Nat Med. 2013;19(8):1023–1029.
26. Obenauf AC, et al. Therapy-induced tumour secretomes promote resistance and tumour pro-gression. Nature. 2015;520(7547):368–372.
27. Xing F, et al. Concurrent loss of the PTEN and RB1 tumor suppressors attenuates RAF depen-dence in melanomas harboring (V600E)BRAF. Oncogene. 2012;31(4):446–457.
28. Yen HC, Xu Q, Chou DM, Zhao Z, Elledge SJ. Global protein stability profiling in mammalian cells. Science. 2008;322(5903):918–923.
29. Knott SRV, et al. A computational algo-rithm to predict shRNA potency. Mol Cell. 2014;56(6):796–807.
30. Bose R, et al. ERF mutations reveal a balance of ETS factors controlling prostate oncogenesis. Nature. 2017;546(7660):671–675.
31. Diaz AA, Qin H, Ramalho-Santos M, Song JS. HiTSelect: a comprehensive tool for high- complexity-pooled screen analysis. Nucleic Acids Res. 2015;43(3):e16.
32. Schwechheimer C, Deng XW. The COP/DET/FUS proteins-regulators of eukaryotic growth and development. Semin Cell Dev Biol. 2000;11(6):495–503.
33. Lau OS, Deng XW. The photomorphogenic repressors COP1 and DET1: 20 years later. Trends Plant Sci. 2012;17(10):584–593.
34. Lu G, et al. Phosphorylation of ETS1 by Src family kinases prevents its recognition by the COP1 tumor suppressor. Cancer Cell. 2014;26(2):222–234.
35. Wilson TR, et al. Widespread potential for growth-factor-driven resistance to anticancer kinase inhibitors. Nature. 2012;487(7408):505–509.

The Journal of Clinical Investigation R E S E A R C H A R T I C L E
1 4 5 7jci.org Volume 128 Number 4 April 2018
36. Johannessen CM, et al. A melanocyte lineage pro-gram confers resistance to MAP kinase pathway inhibition. Nature. 2013;504(7478):138–142.
37. Cerami E, et al. The cBio cancer genomics portal: an open platform for exploring multidimen-sional cancer genomics data. Cancer Discov. 2012;2(5):401–404.
38. Uljon S, et al. Structural Basis for Substrate Selectivity of the E3 Ligase COP1. Structure. 2016;24(5):687–696.
39. Lito P, et al. Relief of profound feedback inhi-bition of mitogenic signaling by RAF inhibitors
attenuates their activity in BRAFV600E melano-mas. Cancer Cell. 2012;22(5):668–682.
40. Wagle N, et al. MAP kinase pathway alterations in BRAF-mutant melanoma patients with acquired resistance to combined RAF/MEK inhibition. Cancer Discov. 2014;4(1):61–68.
41. Hugo W, et al. Non-genomic and Immune Evolu-tion of Melanoma Acquiring MAPKi Resistance. Cell. 2015;162(6):1271–1285.
42. Straussman R, et al. Tumour micro- environment elicits innate resistance to RAF inhibitors through HGF secretion. Nature.
2012;487(7408):500–504. 43. Wiesner T, et al. Alternative transcription initia-
tion leads to expression of a novel ALK isoform in cancer. Nature. 2015;526(7573):453–457.
44. Wang B, et al. ATXN1L, CIC, and ETS Transcription Factors Modulate Sensitiv-ity to MAPK Pathway Inhibition. Cell Rep. 2017;18(6):1543–1557.
45. Liao S, Davoli T, Leng Y, Li MZ, Xu Q, Elledge SJ. A genetic interaction analysis identifies cancer drivers that modify EGFR dependency. Genes Dev. 2017;31(2):184–196.