Embed Size (px)
Citation preview
Transcriptional responses to drought stress in root and leafof chickpea seedling
Xiansheng Wang • Ying Liu • Yuying Jia • Hanyan Gu •
Hongyu Ma • Tian Yu • Hua Zhang • Quanjia Chen •
Lin Ma • Aixing Gu • Jusong Zhang • Shubing Shi • Hao Ma
Received: 7 October 2011 / Accepted: 16 April 2012 / Published online: 6 May 2012
� Springer Science+Business Media B.V. 2012
Abstract Chickpea (Cicer arietinum L.) is an important
pulse crop grown mainly in the arid and semi-arid regions
of the world. Due to its taxonomic proximity with the
model legume Medicago truncatula and its ability to grow
in arid soil, chickpea has its unique advantage to under-
stand how plant responds to drought stress. In this study, an
oligonucleotide microarray was used for analyzing the
transcriptomic profiles of unigenes in leaf and root of
chickpea seedling under drought stress, respectively.
Microarray data showed that 4,815 differentially expressed
unigenes were either C2-fold up- or B0.5-fold down-reg-
ulated in at least one of the five time points during drought
stress. 2,623 and 3,969 unigenes were time-dependent
differentially expressed in root and leaf, respectively. 110
pathways in two tissues were found to respond to drought
stress. Compared to control, 88 and 52 unigenes were
expressed only in drought-stressed root and leaf,
respectively, while nine unigenes were expressed in both
the tissues. 1,922 function-unknown unigenes were found
to be remarkably regulated by drought stress. The expres-
sion profiles of these time-dependent differentially
expressed unigenes were useful in furthering our knowl-
edge of molecular mechanism of plant in response to
drought stress.
Keywords Chickpea � Oligonucleotide microarray �Drought � Transcriptional response � Root � Leaf
Introduction
Among abiotic environmental stresses, drought is one of
the common adverse environmental conditions that have
adverse effects on the growth of plants and the productivity
of crops. Plants have adapted to respond to this stress at
molecular and cellular levels as well as at physiological
and biochemical levels, enhancing them to survive. To
date, a large number of drought-induced genes in various
plants have been identified, and their expression profiles in
response to drought stress also have been revealed. And the
products of some of these identified genes have been
confirmed to function in drought tolerance or in signal
transduction pathway [1–6]. Identification of drought-
induced genes in various plants and revealing their
expression profiles in response to drought stress have been
not only of great interest for understanding their underlying
molecular mechanisms in drought tolerance but also of
great benefit to the breeding of drought-tolerant crops.
Chickpea is the third most important pulse crop in the
world just behind dry bean (Phaseolus vulgaris L.) and
field pea (Pisum sativum L.), and its cultivation area has
been more than million hectares/year since 2006 year [7].
Xiansheng Wang and Ying Liu contributed equally to this work.
Electronic supplementary material The online version of thisarticle (doi:10.1007/s11033-012-1662-4) contains supplementarymaterial, which is available to authorized users.
X. Wang � Y. Jia � H. Gu � H. Ma � T. Yu � H. Ma (&)
State Key Laboratory of Crop Genetics and Germplasm
Enhancement, Nanjing Agricultural University, Nanjing 210095,
Jiangsu, China
e-mail: [email protected]
Y. Liu
College of Agriculture, Hebei University of Engineering, Hebei
056038, China
H. Zhang � Q. Chen � L. Ma � A. Gu � J. Zhang � S. Shi (&)
Key Laboratory of Agriculture Biotechnology, Xinjiang
Agricultural University, Urumqi 830052, Xinjiang, China
e-mail: [email protected]
123
Mol Biol Rep (2012) 39:8147–8158
DOI 10.1007/s11033-012-1662-4
Chickpea is an annual, self-pollinating, diploid (2n = 2x =
16) plant with a short life cycle of 3–5 months. It has a
small genome size of 740 Mbp that is only 1.5 times larger
than that of Medicago truncatula. Due to its taxonomic
proximity with the model legume M. truncatula and its
ability to grow in the arid and semi-arid regions, chickpea
has been found rich in tolerance genes for a range of abiotic
stresses such as drought, high salinity and cold, etc. and has
been suggested as a model legume crop in study of crop
agronomic responses to various stresses [8]. A lot of genes
differentially expressed in response to drought stress in
chickpea have been identified, and their expressions in
response to drought stress have been analyzed. For exam-
ple, Romo et al. [9] reported that one gene encoding lipid
transfer protein (CapLTP) and two genes encoding late
embryogenesis abundant (CapLEA-1 and CapLEA-2) were
induced by water stress. Boominathan et al. [10] identified
101 dehydration-inducible transcripts in chickpea by
repetitive rounds of cDNA subtraction. Mantri et al. [11]
employed a 768-featured boutique microarray to compare
the genes expressed by chickpea in response to drought,
cold, high salinity and the fungal pathogen Ascochyta ra-
biei and identified 46, 54, 266 and 51 differentially
expressed transcripts, respectively. Molina et al. found that
a total of 7,532 UniTags were more than 2.7-fold differ-
entially expressed and 880 were regulated more than 8-fold
in chickpea root upon drought stress. By means of con-
structing two cDNA libraries using the PEG-treated and -
nontreated seedling leaves of chickpea [12], Gao et al. [13]
have identified 36 up-regulated and 56 down-regulated
genes in response to drought stress. Following the intro-
duction of DNA microarray technology, massive changes
in gene regulation in various plants can be assayed in a
high-throughput manner [14]. DNA microarray analysis for
the identification and characterization of large numbers of
genes has been becoming one of the most powerful tools
for dissecting environmental and developmental responses
in plants. To date, some initial cDNA microarrays (or
macroarray) have been utilized in study of drought toler-
ance of chickpea [10, 11, 15–18]. However, since their
cDNA microarray scales were all very small (no more than
1,000 cDNA), even a part of their ESTs coming from
grasspea and lentil, these researches’ information quantity
and accuracy were very limited. Further more, there were
no researches investigating gene expression profiles in root
and leaf of chickpea at the same time to date [10, 11, 15,
16]. Therefore, the transcriptional profiling of genes dif-
ferentially expressed in root and leaf of chickpea in
response to drought stress has not been completely
unveiled yet. In order to globally understand the molecular
mechanism of chickpea in drought tolerance, it is necessary
to detect the differential expressions of a variety of genes in
chickpea in response to drought stress on a larger scale
DNA microarray. To October of 2009, 34,177 ESTs of
chickpea were available in the NCBI EST database (http://
www.ncbi.nlm.nih.gov/dbEST/dbEST_summary.html), and
this offered the condition for constructing a larger scale
DNA microarray.
In this work, we constructed a 6,164 oligonucleotide
spotted microarray from 36,301 ESTs and 283 nucleotide
sequences of chickpea. And this microarray was further
employed to investigate the transcriptomic profiles of
unigenes expressed in leaf and root of chickpea seedling
under drought stress, respectively. Our results will provide
insights into the expression profiles of the time-dependent
differentially expressed unigenes in root and leaf of
chickpea seedling under drought stress, and make a sig-
nificant contribution to the understanding of the molecular
mechanisms developed by the plant against drought stress.
Materials and methods
Plant growth and stress treatments
Seeds from a drought-tolerant chickpea cultivar Xj-209
were germinated in quartz sand in a growth chamber with a
day/night cycle of 14/10 h at 28/20 �C, as described by
Gao et al. [13]. When grown for 10 days, the seedlings
were carefully transferred to one-off cups with water. 24 h
later, the seedlings were separated into two groups: one
group was exposed to 60 mM PEG 4000 as drought
treatment, and the other was harvested immediately as
control (0 h).
RNA isolation and preparation of fluorescent dye-
labeled cDNA
For drought treated group, roots and leaves of chickpea
seedlings were harvested separately at 0.5, 1.5, 6, 12, and
24 h during drought stress treatment, frozen in liquid
nitrogen, and kept at -80 �C until use. Total RNA was
extracted using Trizol reagent (Invitrogen, Carlsbad, CA,
USA) and purified with RNeasy mini spin column Kit
(Qiagen, Valencia, CA, USA) according to the manufac-
turer’s instructions. Residual genomic DNA was digested
by RNasefree DNase I (Takara). cDNA was synthesized,
linearly amplified and labeled using the cRNA Amplifica-
tion and Labeling Kit (CapitalBio). In brief, total RNA was
reverse transcribed with Cbcscript reverse transcriptase and
T7 oligo dT primer. 2nd-strand cDNA was synthesized by
DNA polymerase. The double-stranded cDNA was in vitro
transcribed into cRNA and purified by Nucleospin RNA
Clean-up kit (Macherey-Nagel, Germany). The resulting
cRNA was reverse transcribed by MMLV and purified with
PCR Nucleospin Extract II kit (Macherey-Nagel,
8148 Mol Biol Rep (2012) 39:8147–8158
123
Germany). After reverse transcription, the cDNA was
labeled by Cy5-dCTP or Cy3-dCTP (GE Healthcare, USA)
with klenow enzyme at 37 �C for 60 min. The labeled
cDNA was purified with PCR Nucleospin Extract II kit
(Macherey-Nagel, Germany).
EST collection and annotation
All the ESTs and nucleotide sequences of chickpea in
GenBank (to October of 2009) were downloaded. Vector
sequences were screened against UniVec database (http://
www.ncbi.nlm.nih.gov/VecScreen/VecScreen.html). The
resulting high quality sequences ([100 bp) were then
assembled using Phrap software (http://www.phrap.org/).
Default settings were used except 40 bp minimum overlap
and 99 % identity [19]. Assembled contigs and singletons
(called clusters) were manually revised by Consed software
(http://www.phrap.org/) [20]. All clusters were compared
with the NCBI nucleotide (nt) and non-redundant protein
(nr) databases by BLASTN (E-values B1 9 10-10) and
BLASTX (E-values B1 9 10-5), respectively. The stan-
dards of exact choice of the most related entry in each
group of alignments depended not only on the best hit
values but also on the information of matched sequences in
detail. All assembled sequences having the same annota-
tion were further clustered into a unigene. In total, 6,164
unigenes were used in designing the oligonucleotide
microarray. For each unigene, oligonucleotides were
designed using the Agilent eArray Ver. 4.5 with the length
of 60 bases.
Based on Gene Ontology (GO) classification, all unig-
enes of chickpea were analyzed for their functional char-
acteristics under drought stressed and controlled conditions.
Using the single-directional best hit (SBH) method as
recommended by the KEGG Automatic Annotation Server
(KAAS) [21] for sets of ESTs allowed us to assign unigene
pathway annotations.
Microarray hybridizations and data analysis
Chickpea oligonucleotide microarray containing 6,164
chickpea oligonucleotide probes (supplementary Table 1)
was used. The gene expression profiles in root and leaf
after 0.5, 1.5, 6, 12, and 24 h drought stress and the cor-
responding non-stressed controls (0 h) were investigated
by microarray analysis.
Each test sample was Cy5-labeled and the reference
samples Cy3 labeled. The arrays were hybridized at 42 �C
for 12–16 h in BioMixer II (CapitalBio). After hybridiza-
tion, the slides were washed with 29 SSC plus 0.2 % SDS at
42 �C for 5 min, with 0.29 SSC for 5 min at room temper-
ature and spin-dried. Hybridized microarray slides were
scanned with a LuxScan 10 K/A scanner (CapitalBio). Spot
intensities were quantified using GenePix Pro 4.0 image
analysis software (Axon Instruments). Data with signal
intensity more than 1,200 were accepted as the standard for
gene expression. Unigenes up- or down-regulated greater
than a 2-fold or less than 0.5-fold ratio value (Cy5 intensity/
Cy3 intensity) were taken as differentially expressed.
Microarray expression data were MIAME compliant and
have been deposited in a MIAME compliant database (GEO
accession number GSE25705).
To point out the time course in the expression data, a
further evaluation was based on clustering the time-
dependent expression profiles of these significantly differ-
entially expressed unigenes with an expression-level
alteration criterion of ratio value(n time point)/ratio value(n-1
time point) C 2 or ratio value(n time point)/ratio value(n-1 time
point) B 0.5 at n time point (0.5, 1.5, 12, and 24 h) during
drought stress, via self organizing maps (SOM) module of
the Multiexperiment Viewer ver. 4.2 software (MeV,
www.tm4.org).
Two independent biological replicates for each time
point of two tissues were used to hybridize. The processes
of labeling, hybridization, washing, and scanning were
carried out at Beijing National Biochip Research and
Engineering Center, China.
Quantitative real-time PCR and data analysis
To validate the array data, the expressions of 10 genes
(Contig_1885: proline dehydrogenase; Contig_3134:
lipoxygenase LOXN3; Contig_2853: peroxidase1B; Con-
tig_5876: nitrate transporter; Contig_3259: homocysteine
S-methyltransferase; Contig_1500: Photosystem I reaction
center subunit N, chloroplast precursor; Contig_2780: beta-
amylase; Contig_2823: glycine-rich protein 1; Con-
tig_2895: glutathione peroxidase 1; Contig_1672: alanine:
glyoxylate aminotransferase) were confirmed by qPCR
with the same RNA samples used for microarray hybrid-
ization. The primers used for qPCR are listed in supple-
mentary Table 2.
The cDNA from the total RNA samples, which were
used for the microarrays at different time points (0, 0.5,
1.5, 6, 12, and 24 h) during PEG-treatment, was synthe-
sized with M-MLV Reverse Transcriptase (Invitrogen),
respectively. qPCR was performed using SYBR premix EX
Taq (TaKaRa Biotech, Dalian, China) in the Bio-RAD
iCycler iQ5 Machine. The actin gene (GenBank accession
no. AJ012685) was assigned for control. All reactions were
performed in triplicate. Expressed ratio was calculated
using the Livak method [22]:
Expressed ratio ¼ 2�DDCT
where DDCT is the sum of: [CT(gene) - CT(actin)](Drought
stressed) - [CT(gene) - CT(actin)](Unstressed).
Mol Biol Rep (2012) 39:8147–8158 8149
123
For statistics, an analysis of variance (ANOVA) of the
data was performed, and a least significant difference
(LSD) test with a confidence interval of 95 % was used to
compare the means.
Results
Characterization of EST sequences
To capture the genes induced by drought stress in chickpea
as many as possible, not only all the 34,177 EST sequences
of chickpea in GenBank [supplementary Text 1, including
our previously submitted 5,097 ESTs (GenBank accession
no. FE668437–FE673533)] but also 283 nucleotide
sequences (supplementary Text 2) were downloaded in
October, 2009. After removing vector sequences and lower
quality sequences, 36,301 ESTs (including our recently
submitted 2,124 ESTs, GenBank accession no. HS107522–
HS109645) resulted in the identification of 11,042 unig-
enes (7,770 singletons and 3,372 clusters). All unigenes
were compared with the NCBI nucleotide (nt) and non-
redundant protein (nr) databases by BLASTN (E-values
B1 9 10-10) and BLASTX (E-values B1 9 10-5),
respectively. The standards of exact choice of the most
related entry in each group of alignments depended not
only on the best hit values but also on the information of
matched sequences in detail. In the case of the unigenes
corresponded to different regions of the same gene, we kept
the unigene with the longest sequence. The unigenes hav-
ing annotation of non-plant genes were also taken out.
Consequently, a total of 6,164 unigenes were obtained. The
entire data, including all annotative attributes, are shown in
supplementary Table 3. In this data, only 3,680 unigenes
had specific function, while the others 2,484 unigenes
showed similarities to proteins with function completely
unknown or even having no homology.
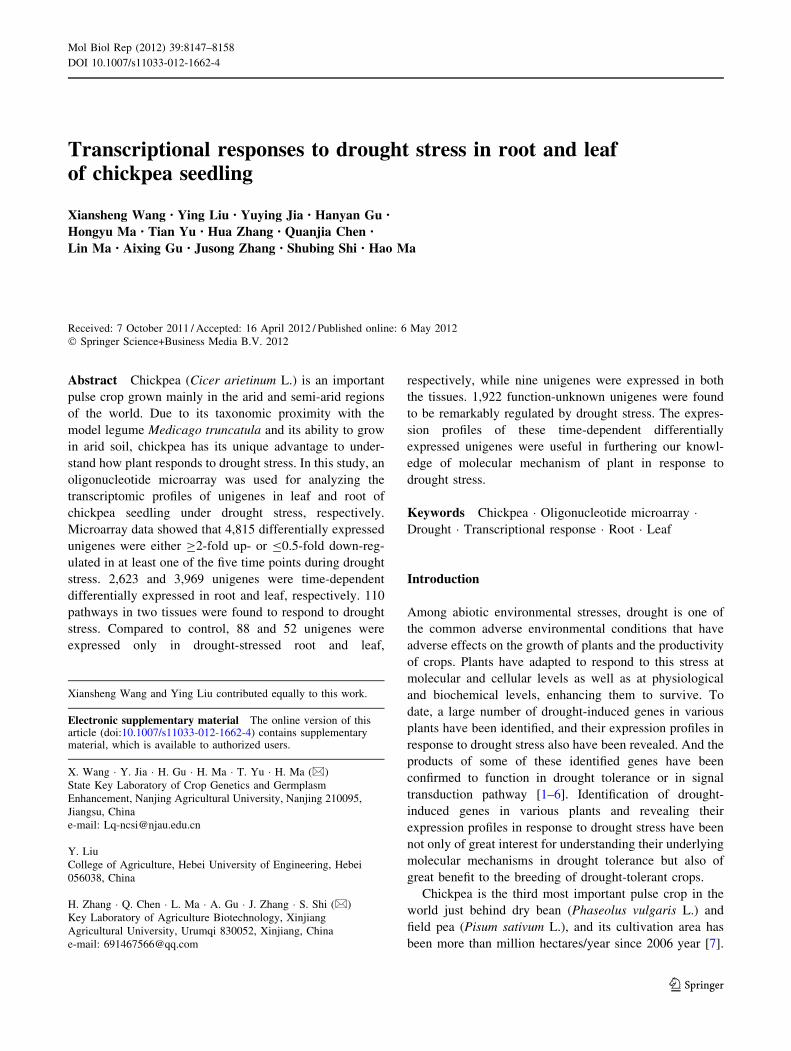
The 6,164 unigenes were further analyzed by the GO
assignments [23]. As a result, 4,674 unigenes (15,296 GO
terms) were classified into three broad categories, namely,
biological processes, cellular components and molecular
functions (Fig. 1). The detailed GO assignment results are
listed in supplementary Table 4.
Overall features of the drought stress-responsive
expression profiles
To identify the differential expression of the genes induced
by drought stress in root and leaf of chickpea seedling at
different time points, an oligonucleotide microarray con-
taining 6,164 unigenes was fabricated. RNA samples from
the roots and leaves collected at 0.5, 1.5, 6, 12, and 24 h
during drought treatment, as well as from that of the
untreated sample at 0 h, were used for microarray
hybridization, respectively.
The biological significance of transcriptional profiling
can be revealed by grouping of differentially expressed
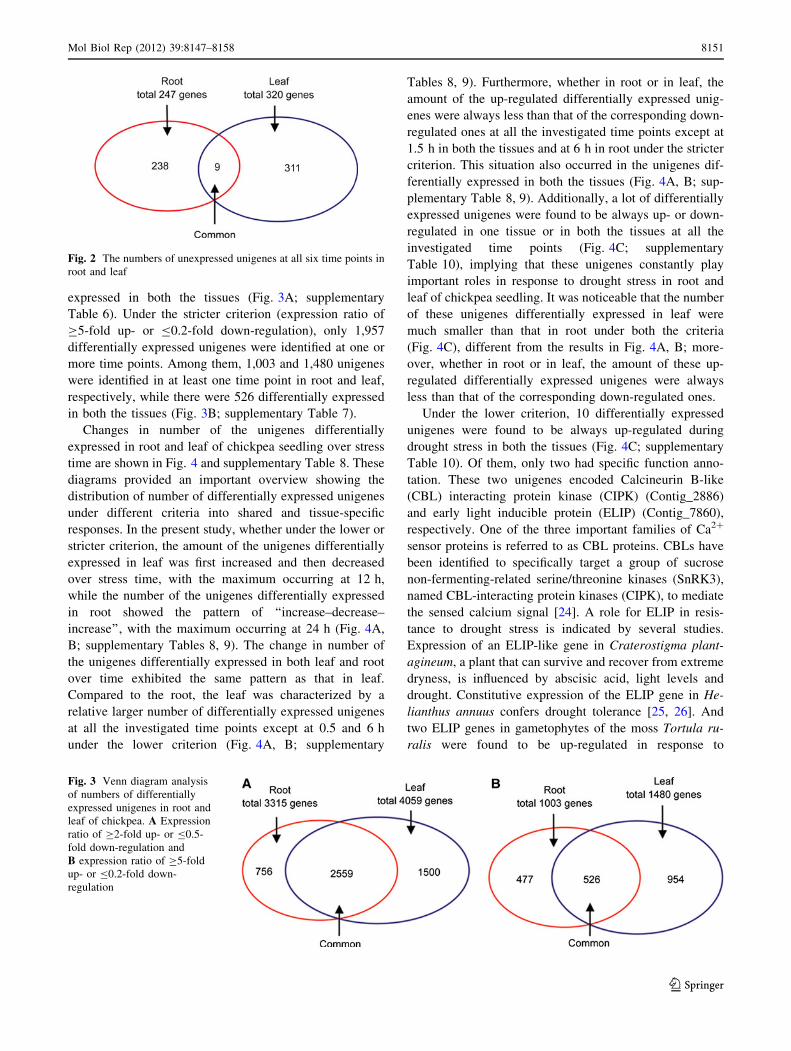
genes. In this study, of 6,164 unigenes, there were 247
unexpressed at all six time points in root, while 320 were
unexpressed in leaf. Nine unigenes were found to be
unexpressed in both the tissues (Fig. 2; supplementary
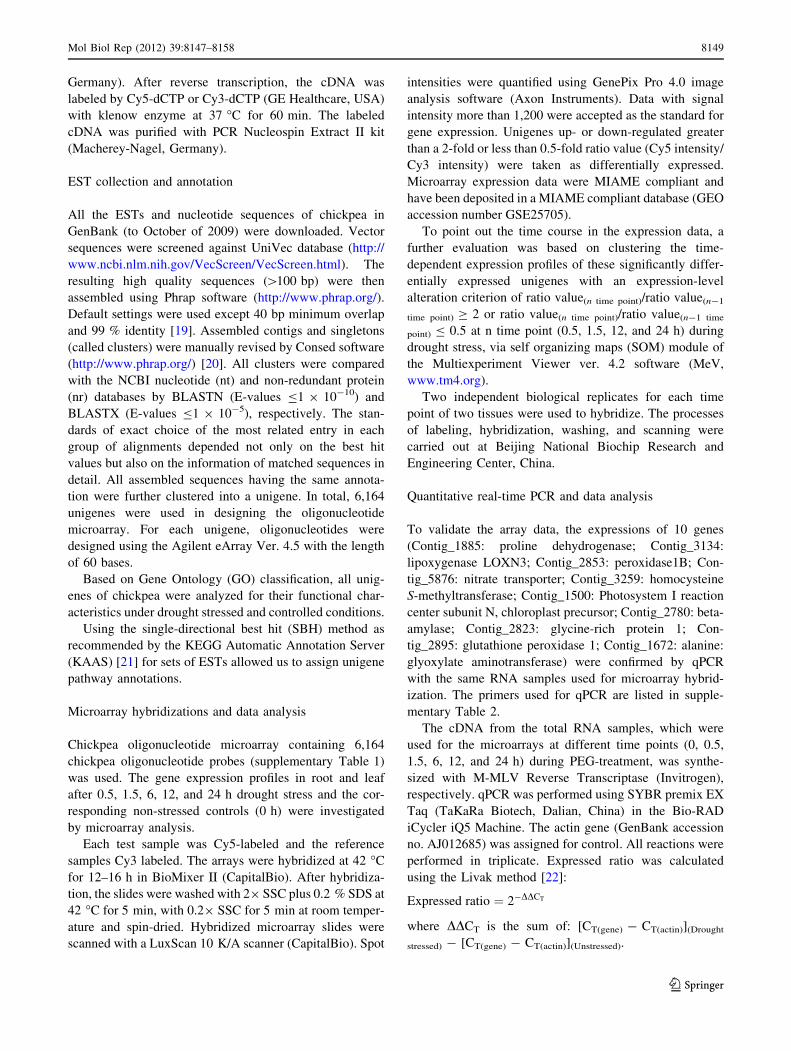
Table 5). Further, among the 6,155 expressed unigenes,
only 4,815 were detected to be differentially expressed
with expression ratio of C2-fold up- or B0.5-fold down-
regulation at one or more time points; among these dif-
ferentially expressed unigenes, 3,315 and 4,059 unigenes
were differentially expressed at least one time point in root
and leaf, respectively, while there were 2,559 differentially
Fig. 1 The GO categories of
4,674 unigenes. The genes were
functionally categorized
according to the Gene Ontology
Consortium and two levels of
the assignment results were
plotted here. In this ontology,
‘‘biological process’’, ‘‘cellular
component’’ and ‘‘molecular
function’’ are categorized
independently
8150 Mol Biol Rep (2012) 39:8147–8158
123
expressed in both the tissues (Fig. 3A; supplementary
Table 6). Under the stricter criterion (expression ratio of
C5-fold up- or B0.2-fold down-regulation), only 1,957
differentially expressed unigenes were identified at one or
more time points. Among them, 1,003 and 1,480 unigenes
were identified in at least one time point in root and leaf,
respectively, while there were 526 differentially expressed
in both the tissues (Fig. 3B; supplementary Table 7).
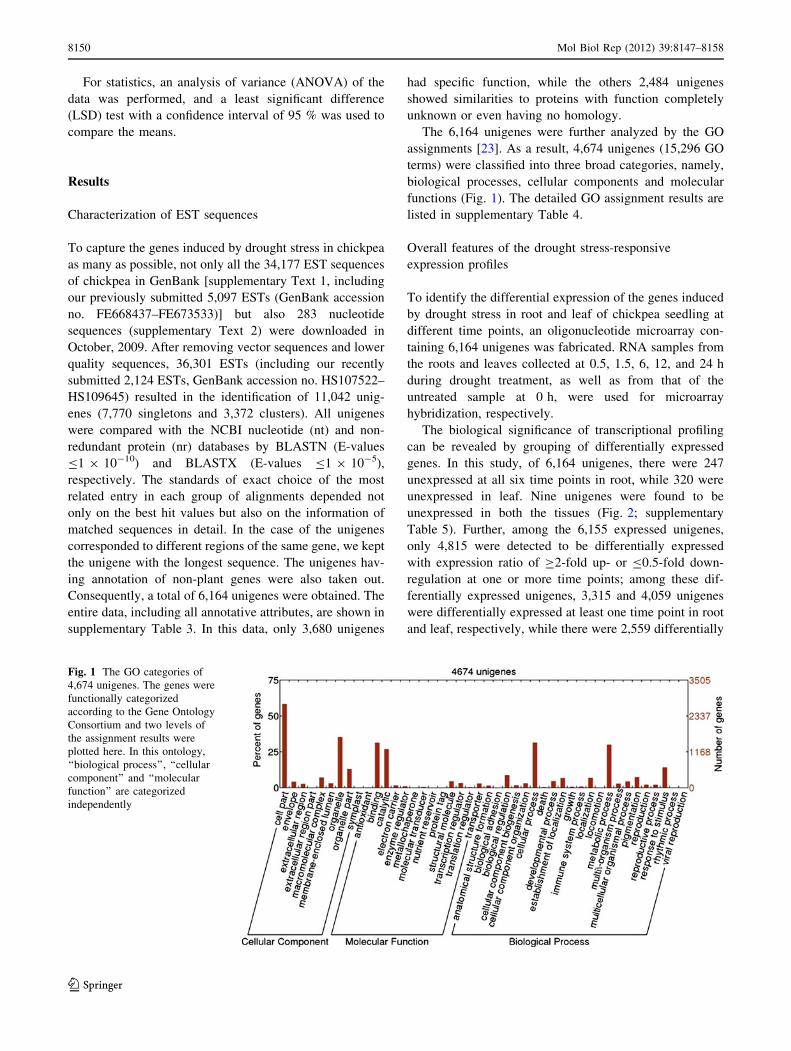
Changes in number of the unigenes differentially
expressed in root and leaf of chickpea seedling over stress
time are shown in Fig. 4 and supplementary Table 8. These
diagrams provided an important overview showing the
distribution of number of differentially expressed unigenes
under different criteria into shared and tissue-specific
responses. In the present study, whether under the lower or
stricter criterion, the amount of the unigenes differentially
expressed in leaf was first increased and then decreased
over stress time, with the maximum occurring at 12 h,
while the number of the unigenes differentially expressed
in root showed the pattern of ‘‘increase–decrease–
increase’’, with the maximum occurring at 24 h (Fig. 4A,
B; supplementary Tables 8, 9). The change in number of
the unigenes differentially expressed in both leaf and root
over time exhibited the same pattern as that in leaf.
Compared to the root, the leaf was characterized by a
relative larger number of differentially expressed unigenes
at all the investigated time points except at 0.5 and 6 h
under the lower criterion (Fig. 4A, B; supplementary
Tables 8, 9). Furthermore, whether in root or in leaf, the
amount of the up-regulated differentially expressed unig-
enes were always less than that of the corresponding down-
regulated ones at all the investigated time points except at
1.5 h in both the tissues and at 6 h in root under the stricter
criterion. This situation also occurred in the unigenes dif-
ferentially expressed in both the tissues (Fig. 4A, B; sup-
plementary Table 8, 9). Additionally, a lot of differentially
expressed unigenes were found to be always up- or down-
regulated in one tissue or in both the tissues at all the
investigated time points (Fig. 4C; supplementary
Table 10), implying that these unigenes constantly play
important roles in response to drought stress in root and
leaf of chickpea seedling. It was noticeable that the number
of these unigenes differentially expressed in leaf were
much smaller than that in root under both the criteria
(Fig. 4C), different from the results in Fig. 4A, B; more-
over, whether in root or in leaf, the amount of these up-
regulated differentially expressed unigenes were always
less than that of the corresponding down-regulated ones.
Under the lower criterion, 10 differentially expressed
unigenes were found to be always up-regulated during
drought stress in both the tissues (Fig. 4C; supplementary
Table 10). Of them, only two had specific function anno-
tation. These two unigenes encoded Calcineurin B-like
(CBL) interacting protein kinase (CIPK) (Contig_2886)
and early light inducible protein (ELIP) (Contig_7860),
respectively. One of the three important families of Ca2?
sensor proteins is referred to as CBL proteins. CBLs have
been identified to specifically target a group of sucrose
non-fermenting-related serine/threonine kinases (SnRK3),
named CBL-interacting protein kinases (CIPK), to mediate
the sensed calcium signal [24]. A role for ELIP in resis-
tance to drought stress is indicated by several studies.
Expression of an ELIP-like gene in Craterostigma plant-
agineum, a plant that can survive and recover from extreme
dryness, is influenced by abscisic acid, light levels and
drought. Constitutive expression of the ELIP gene in He-
lianthus annuus confers drought tolerance [25, 26]. And
two ELIP genes in gametophytes of the moss Tortula ru-
ralis were found to be up-regulated in response to
Fig. 2 The numbers of unexpressed unigenes at all six time points in
root and leaf
Fig. 3 Venn diagram analysis
of numbers of differentially
expressed unigenes in root and
leaf of chickpea. A Expression
ratio of C2-fold up- or B0.5-
fold down-regulation and
B expression ratio of C5-fold
up- or B0.2-fold down-
regulation
Mol Biol Rep (2012) 39:8147–8158 8151
123
desiccation, salt, high light, and rehydration stresses [27].
Contrarily, up to 69 differentially expressed unigenes were
found maintaining down-regulation in both the tissues
during drought stress (Fig. 4C; supplementary Table 10).
Of them, only less than 50 % (29 of 69) unigenes had
unknown function annotation.
Whereas under the stricter criterion, only one differen-
tially expressed unigene (Contig_3686) was found to be
always down-regulated during drought stress in both the
tissues, while there was no unigene showing up-regulation.
Time course analysis of differentially expressed
unigenes induced by drought stress using SOM
In this study, 2,623 and 3,969 unigenes were time-depen-
dent differentially expressed in root and leaf, respectively.
To examine their changes in gene expression, the 2,623 and
3,969 differentially expressed unigenes were divided into
16 typical profiles via SOM clustering (Figs. 5, 6). The
complete list of the 2,623 and 3,969 unigenes are shown in
supplementary Tables 11 and 12.
For root (Fig. 5), the 2,623 differentially expressed
unigens were merged into three major groups: up-
regulated (R1, R9, R11, R12, and R13), down-regulated
(R2, R3, R5, R6, R7, R8, and R10) and fluctuating (R4,
R14, R15, and R16). In the up-regulated group, the signal
intensity of the unigenes in R1 was continuously increased
during the investigated period, with a rapid increase per-
iod at 0.5–6 h; the unigenes in R9 and R13 had a rapidly
increasing trend in signal intensity at 0–6 h followed by
slight decreasing; and the signal intensity of the unigenes
in R11 and R12 was maintained unchanged at early stage
and increased thereafter, with a rapidly increasing period
at mid-stage. In the down-regulated group, the signal
intensity of the unigenes in R2, R7, and R8 was gradually
decreased at 0–6 h and maintained unchanged thereafter;
the unigenes in R3 and R6 had a similar decreasing trend
in signal intensity after 0.5 h; the unigene expression in
R5 was first decreased rapidly, and then increased at
0.5–1.5 h and maintained unchanged at 1.5–24 h; the
unigenes in R10 were maintained almost unchanged in
signal intensity at 0–6 h, and then rapidly decreased at
6–12 h and rapidly increased at 12–24 h. It was notable,
in the fluctuating group, that the signal intensity of the
unigenes in R14 showed an expression pattern completely
contrary to that in R16.
Fig. 4 Changes in number of differentially expressed unigenes in
root and leaf at investigation time points. A Expression ratio of C2-
fold up- or B0.5-fold down-regulation. B Expression ratio of C5-fold
up- or B0.2-fold down-regulation. C Unigenes differentially
expressed in both root and leaf at all five time points
8152 Mol Biol Rep (2012) 39:8147–8158
123
For leaf (Fig. 6), the 3,969 differentially expressed
unigenes were merged into three major groups: up-regu-
lated (L2, L3, L5, L6, and L12), down-regulated (L1, L8,
L13, L14, and L15) and fluctuating (L4, L7, L9, L10, L11,
and L16). In the up-regulated group, the unigenes in L3 and
L6 had a similar expression trend, whereas L2 and L5 had
a similar expression trend; the unigenes in L12 showed a
rapidly increasing expression in signal intensity at
0.5–1.5 h and a gradually decreasing expression thereafter.
In the down-regulated group, the unigene expression in L1,
L8, and L13 had a similar decreasing pattern; the signal
intensity for the unigenes in L14 was maintained unchan-
ged for 0.5 h and then gradually decreased; in the case of
the unigenes in L15, slight fluctuating in signal intensity
was observed. In the fluctuating group, L4, L7, and L16
showed the strongest fluctuation in unigene expression
while L10 had the slightest fluctuation.
Pathways in response to drought stress in root and leaf
To examine the changes of pathways in response to
drought stress, the 6,164 differentially expressed unigenes
of chickpea were annotated in KAAS. As a result, 113
pathways were obtained. These pathways can be classified
into six groups based on their expression profiles in root
and leaf (supplementary Table 13). In group I, 89 pathways
with up- and down-regulated unigenes were involved in
both the tissues. Among them, 75.3 % belonged to
metabolism pathways including amino acid metabolism,
carbohydrate metabolism, energy metabolism and lipid
metabolism. In group II, 11 pathways with up-regulated
unigenes were involved in both root and leaf. Contrarily,
six pathways with down-regulated unigenes were involved
in both root and leaf and classified into group III. Three
pathways with down-regulated unigenes and one pathway
with up-regulated ones were involved only in leaf and
classified into group IV and group V, respectively (sup-
plementary Table 13). In addition, three pathways with no
significantly differentially expressed unigenes either in root
or leaf were classified into group VI.
Unigenes unique and shared in root and leaf in response
to drought stress
In this work, compared to the control, total 88 unigenes
were found to be expressed only in drought-stressed root.
Of them, only 18 unigenes were found to be unique for
root, and the rest were also expressed in leaf (supplemen-
tary Table 14). Total 52 unigenes were found to be
expressed only in drought-stressed leaf. Among them, only
Fig. 5 Clustering of expression profiles in root via SOMs. The 16
SOM clusters shown represent typical profiles within the 2,363
unigenes differentially expressed in root during drought stress
treatment. Each cluster (R1–R16, the number of unigenes included
is indicated) is represented by the red centroid (average expression
profile). (Color figure online)
Mol Biol Rep (2012) 39:8147–8158 8153
123
13 unigenes were unique for leaf, and the rest were also
expressed in root (supplementary Table 15). Nine unigenes
were found to be expressed only in both the stressed tissues
(supplementary Table 16).
Quantitative real time PCR analysis
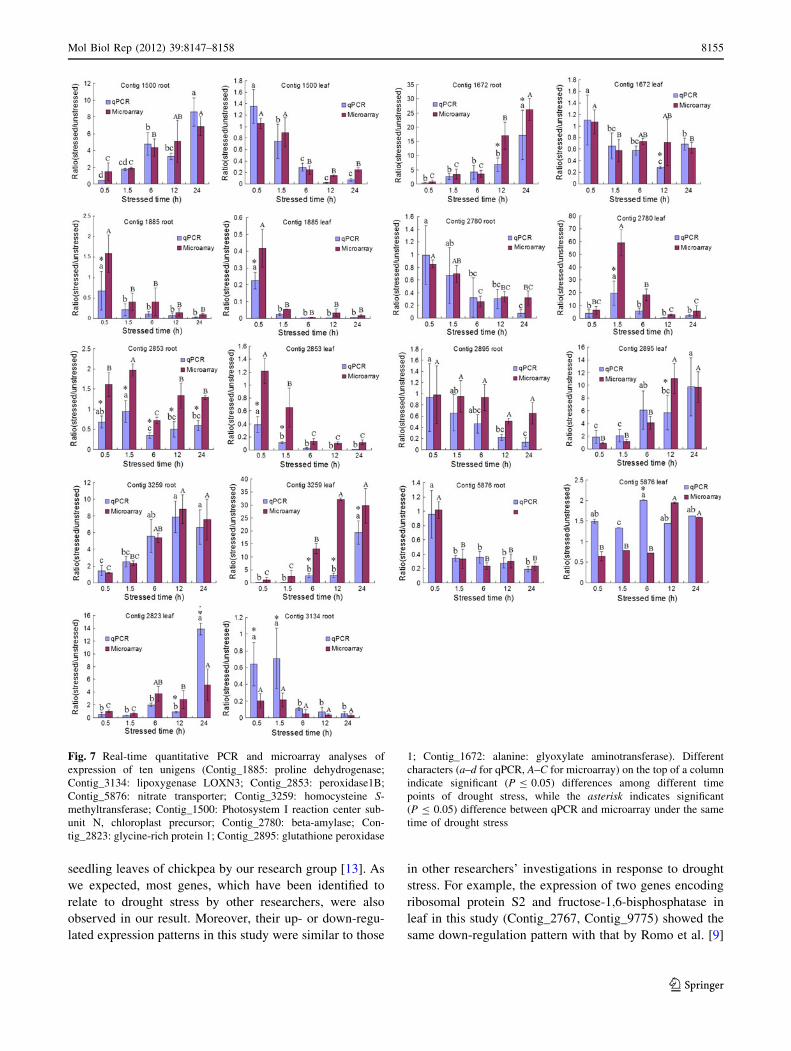
To confirm the microarray results, we selected 10 unigenes
that showed significant up- or down-regulation during
drought stress, and analyzed their differential expressions
by qPCR with the same RNA samples used for the
microarray experiment. As shown in Fig. 7, some genes
displayed significant higher fold-induction at certain time
point in the microarray analysis, such as Contig_1672 at 12
and 24 h in root. On the contrary, some genes displayed
significant higher fold-induction at certain time point in the
qPCR analysis, such as Contig_5876 at 6 h in leaf. These
differences probably reflected the different dynamic range
of microarray compared to qPCR analysis. Though these
differences existed, however, the qPCR results and
microarray data showed similar expression kinetic patterns
(up- or down-regulation) for all the unigenes tested, indi-
cating the strong reliability of the microarray data. In
addition, the qPCR results of CarNAC1 (Contig_3143) and
CarNAC3 (Contig_795) in our previous research were also
in agreement with those of the microarray analysis in this
study [28, 29].
Discussion
The advent of microarrays has enabled the screening of
thousands of genes in parallel to assist in candidate gene
identification. Ideally, one would like to scan the entire
genome of a particular plant to obtain a more complete
picture of transcriptional changes in response to various
stresses. However, the whole genome sequences are not
available for chickpea to date, leading to a dependence on
collections of ESTs assembled from random cDNA
libraries [11]. In this study, to construct an oligonucleotide
microarray, we collected all ESTs and nucleotide sequen-
ces of chickpea in GenBank (to October 2009). This col-
lection contained important ESTs of chickpea related to
physiological acclimation and adaptation to biotic or abi-
otic stresses, such as 592 ESTs from chickpea infected by
Ascochyta rabiei [30, 31], 6,273 related to immune-
response of chickpea to Fusarium oxysporum [32], 24,419
related to salinity and drought stresses [15, 33]. Especially,
this collection included 7,221 ESTs from two cDNA
libraries constructed using the PEG-treated and -nontreated
Fig. 6 Clustering of expression profiles in leaf via SOMs. The 16
SOM clusters shown represent typical profiles within the 3,969
unigenes differentially expressed in leaf during drought stress
treatment. Each cluster (L1–L16, the number of unigenes included
is indicated) is represented by the red centroid (average expression
profile). (Color figure online)
8154 Mol Biol Rep (2012) 39:8147–8158
123
seedling leaves of chickpea by our research group [13]. As
we expected, most genes, which have been identified to
relate to drought stress by other researchers, were also
observed in our result. Moreover, their up- or down-regu-
lated expression patterns in this study were similar to those
in other researchers’ investigations in response to drought
stress. For example, the expression of two genes encoding
ribosomal protein S2 and fructose-1,6-bisphosphatase in
leaf in this study (Contig_2767, Contig_9775) showed the
same down-regulation pattern with that by Romo et al. [9]
Fig. 7 Real-time quantitative PCR and microarray analyses of
expression of ten unigens (Contig_1885: proline dehydrogenase;
Contig_3134: lipoxygenase LOXN3; Contig_2853: peroxidase1B;
Contig_5876: nitrate transporter; Contig_3259: homocysteine S-
methyltransferase; Contig_1500: Photosystem I reaction center sub-
unit N, chloroplast precursor; Contig_2780: beta-amylase; Con-
tig_2823: glycine-rich protein 1; Contig_2895: glutathione peroxidase
1; Contig_1672: alanine: glyoxylate aminotransferase). Different
characters (a–d for qPCR, A–C for microarray) on the top of a column
indicate significant (P B 0.05) differences among different time
points of drought stress, while the asterisk indicates significant
(P B 0.05) difference between qPCR and microarray under the same
time of drought stress
Mol Biol Rep (2012) 39:8147–8158 8155
123
(DY475051, DY475548). In the case of up-regulation, two
LEA protein unigenes in this study (Contig_3383 and
Contig_1170) showed the same expression pattern with
that by Romo et al. [9] (CapLEA-1 and CapLEA-2); and a
similar result for a CBL-interacting protein kinase unigene
(Contig_1755) was also observed in the results of this study
and Tripathi et al. [34].
Although several researches have studied the gene
transcription of chickpea under drought stress via micro-
array technique [10, 11, 15, 16], there were no researches
investigating gene expression profiles in root and leaf of
chickpea seedling at the same time. In this work, compared
to the control, 88 unigenes were found to be expressed only
in drought-stressed root; of them, 18 unigenes were found
to be unique for root (supplementary Table 14). 52 unig-
enes were found to be expressed only in drought-stressed
leaf; among them, 13 unigenes were unique for leaf (sup-
plementary Table 15). Only nine unigenes were found to
be expressed in both the stressed tissues (supplementary
Table 16). Three pathways with down-regulated unigenes
and one pathway with up-regulated ones were found to be
involved only in leaf (supplementary Table 13). Addi-
tionally, a number of differentially expressed unigenes
showed obvious differences in drought stress-responsive
time points, expression intensity and up- or down-regula-
tion between both the tissues (supplementary Tables 11,
12). Therefore, we expect that all the differences in tran-
scriptomic profiles between root and leaf of chickpea
seedling in the present study will enhance our under-
standing of the diversity of responses to drought stress
among plant organs, and more importantly, will benefit the
investigation of mechanism of drought tolerance in
chickpea.
In this study, the number of differentially expressed
unigenes in chickpea root was almost always less than that
in leaf at each investigation time point (Fig. 4A, B; sup-
plementary Tables 8, 9), indicating that the biological
processes involved in drought tolerance in chickpea leaf
was more extensive and active than these in root. In
addition, there were only nine unigenes with expression
ratio of C50-fold up-regulation in root, while 44 unigenes
in leaf (supplementary Tables 8, 9). It is noteworthy that
the highest fold of the up-regulated unigenes in root
(Contig 5431: unknown [G. max], 64.87-fold up-regulation
at 24 h) was much lower than that in leaf (Contig 1183:
PREDICTED: similar to Os12g0187800 [Vitis vinifera],
1048.80-fold up-regulation at 1.5 h). Os12g0187800 is a
conserved hypothetical protein identified in rice [35]. This
is the first evidence that Os12g0187800 may play an
important role in plant drought tolerance, but more detailed
expression, localization and functional analyses are
needed.
In the present study, 4,815 unigenes and 110 pathways
significantly responded to drought stress. Some of them
could be used as candidates for further study of drought
tolerance. As far as we know, some unigenes in chickpea
and other plants or crops have been extensively investi-
gated by previous researchers, such as genes encoding LEA
proteins, water channel proteins, various transcription
factors (DREB, AREB, MYC, MYB, bZIP, and NAC,
etc.), protein kinases, protein phosphatases, sugars (ga-
lactinol, and trehalose, etc.), amino acids (proline, methi-
onine, and glycine, etc.), pathogenesis related proteins, and
so on [3, 36–38]. However, many unigenes (such as genes
encoding germin-like protein [39] and F-box protein [40])
and pathways (such as ‘‘Stilbenoid, diarylheptanoid and
gingerol biosynthesis’’ [PATH: ko00945]) that responded
to drought stress in chickpea were still poorly investigated.
To select the genes and pathways that are candidates for
drought tolerance, we should focus on the genes that were
particularly high up- or down-regulated in response to
drought stress and the pathways they involved in. Supple-
mentary Table 17 listed 183 unigenes that were particu-
larly up- or down-regulated (C50-fold) in root or leaf under
drought stress. Of the 183 unigenes, 110 had specific
function annotation. The proteins encoded by these unig-
enes included ten transcription factors (9.1 % of 110
unigenes), nine LEA proteins (8.2 % of 110 unigenes), six
heat shock proteins (5.5 % of 110 unigenes), five trans-
porters (4.6 % of 110 unigenes), and so on. It is noteworthy
that all genes encoding the heat shock proteins and LEA
proteins showed to be up-regulated in leaf at 1.5–24 h of
drought stress. Supplementary Table 18 showed the 17
pathways in which the 183 unigenes involved. These
results would be helpful for researchers in the study of
chickpea drought tolerance.
Through long-term evolution and adaptation to extreme
conditions, chickpea has been found to be rich in resistance
genes for a range of abiotic stresses, including drought,
cold and high salinity [41]. Our study showed that a high
proportion (1,922 unigenes, 39.92 %) of differentially
expressed unigenes had no function annotation or function
unknown. It is also noteworthy that many of these unigenes
showed remarkable expression changes in response to
drought stress, especially with some having a rapid
increasing or decreasing expression. We daringly specu-
lated that some of these differentially expressed unigenes
might be specific for chickpea and play very important
roles in response to drought stress. Therefore, it is possible
to identify some drought responsive genes unique to
chickpea. Further analysis of the functions and expression
controlling mechanism of these genes in chickpea would
not only supply the opportunity of isolation and identifi-
cation of novel genes, but also enhance our further
8156 Mol Biol Rep (2012) 39:8147–8158
123
understanding of specific mechanism of drought tolerance
in chickpea.
Acknowledgments We gratefully acknowledge the partial financial
support from the projects supported by the National Natural Science
Foundation of China (30960201, 30960206, 30860152 and
31160306), from the project supported by the Xinjiang Science and
Technology Department of China (200991254), from the projects
supported by the National Science and Technology Ministry
(2006BAD09A04, 2006BAD09A08), from the project supported by
the National Science Foundation for Postdoctoral Scientists of China
(20080431107), from the project supported by the Jiangsu Science
Foundation of Postdoctoral Scientists of China (0801048B) for this
research.
References
1. Xiong L, Wang RG, Mao G, Koczan JM (2006) Identification of
drought tolerance determinants by genetic analysis of root
response to drought stress and abscisic acid. Plant Physiol
142:1065–1074
2. Bray EA (1997) Plant responses to water deficit. Trends Plant Sci
2:48–54
3. Ingram J, Bartels D (1996) The molecular basis of dehydration
tolerance in plants. Annu Rev Plant Physiol Plant Mol Biol
47:377–433
4. Shinozaki K, Yamaguchi-Shinozaki K (1996) Molecular
responses to drought and cold stress. Curr Opin Biotechnol
7:161–167
5. Campalans A, Messeguer R, Goday A, Pages M (1999) Plant
responses to drought, from ABA signal transduction events to the
action of the induced proteins. Plant Physiol Biochem
37:327–340
6. Yamaguchi-Shinozaki K, Shinozaki K (2006) Transcriptional
regulatory networks in cellular responses and tolerance to dehy-
dration and cold stresses. Annu Rev Plant Biol 57:781–803
7. Database FAO (2010) http://faostat.fao.org. Accessed Aug and
Sep 1997
8. Jayashree B, Hutokshi KB, Sanjeev S, Jonathan HC (2005) A
legume genomics resource: the chickpea root expressed sequence
tag database. Electron J Biotechnol 8:128–133
9. Romo S, Labrador E, Dopico B (2001) Water stress-regulated
gene expression in Cicer arietinum seedlings and plants. Plant
Physiol Biochem 39:1017–1026
10. Boominathan P, Shukla R, Kumar A, Manna D, Negi D, Verma
PK, Chattopadhyay D (2004) Long term transcript accumulation
during the development of dehydration adaptation in Cicer ari-etinum. Plant Physiol 135:1608–1620
11. Mantri N, Ford R, Coram T, Pang E (2007) Transcriptional
profiling of chickpea genes differentially regulated in response to
high-salinity, cold and drought. BMC Genomics 8:303
12. Molina C, Rotter B, Horres R, Udupa S, Besser B, Bellarmino L,
Baum M, Matsumura H, Terauchi R, Kahl G, Winter P (2008)
SuperSAGE: the drought stress-responsive transcriptome of
chickpea roots. BMC Genomics 9:553
13. Gao WR, Wang XS, Liu QY, Peng H, Chen C, Li JG, Zhang JS,
Hu SN, Ma H (2008) Comparative analysis of ESTs in response
to drought stress in chickpea (C. arietinum L.). Biochem Biophys
Res Commun 376:578–583
14. Andersson A, Keskitalo J, Sjodin A, Bhalerao R, Sterky F, Wissel
K, Tandre K, Aspeborg H, Moyle R, Ohmiya Y, Bhalerao R,
Brunner A, Gustafsson P, Karlsson J, Lundeberg J, Nilsson O,
Sandberg G, Strauss S, Sundberg B, Uhlen M, Jansson S, Nilsson
P (2004) A transcriptional timetable of autumn senescence.
Genome Biol 5:R24
15. Jain D, Chattopadhyay D (2010) Analysis of gene expression in
response to water deficit of chickpea (Cicer arietinum L.) vari-
eties differing in drought tolerance. BMC Plant Biol 10:24
16. Mantri NL, Ford R, Coram TE, Pang ECK (2010) Evidence of
unique and shared responses to major biotic and abiotic stresses
in chickpea. Environ Exp Bot 69:286–292
17. Coram TE, Pang ECK (2006) Expression profiling of chickpea
genes differentially regulated during a resistance response to
Ascochyta rabiei. Plant Biotechnol J 4:647–666
18. Coram TE, Pang ECK (2007) Transcriptional profiling of
chickpea genes differentially regulated by salicylic acid, methyl
jasmonate and aminocyclopropane carboxylic acid to reveal
pathways of defence-related gene regulation. Funct Plant Biol
34:52–64
19. Ewing B, Green P (1998) Base-calling of automated sequencer
traces using phred. II. Error probabilities. Genome Res 8:186–194
20. Gordon D, Abajian C, Green P (1998) Consed: a graphical tool
for sequence finishing. Genome Res 8:195–202
21. Moriya Y, Itoh M, Okuda S, Yoshizawa AC, Kanehisa M (2007)
KAAS: an automatic genome annotation and pathway recon-
struction server. Nucleic Acids Res 35:W182–W185
22. Livak KJ, Schmittgen TD (2001) Analysis of relative gene
expression data using real-time quantitative PCR and the 2-44CT
method. Methods 25:402–408
23. Ashburner M, Ball CA, Blake JA, Botstein D, Butler H, Cherry
JM, Davis AP, Dolinski K, Dwight SS, Eppig JT, Harris MA, Hill
DP, Issel-Tarver L, Kasarskis A, Lewis S, Matese JC, Richardson
JE, Ringwald M, Rubin GM, Sherlock G (2000) Gene ontology:
tool for the unification of biology. Nat Genet 25:25–29
24. Weinl S, Kudla J (2009) The CBL-CIPK Ca2?-decoding signal-
ing network: function and perspectives. New Phytol 184:517–528
25. Alamillo JM, Bartels D (1996) Light and stage of development
influence the expression of desiccation-induced genes in the
resurrection plant Craterostigma plantagineum. Plant Cell Envi-
ron 19:300–310
26. Ouvrard O, Cellier F, Ferrare K, Tousch D, Lamaze T, Dupuis
JM, Casse-Delbart F (1996) Identification and expression of
water stress- and abscisic acid-regulated genes in a drought-tol-
erant sunflower genotype. Plant Mol Biol 31:819–829
27. Zeng Q, Chen X, Wood AJ (2002) Two early light-inducible
protein (ELIP) cDNAs from the resurrection plant Tortula ruralisare differentially expressed in response to desiccation, rehydra-
tion, salinity, and high light. J Exp Bot 53:1197–1205
28. Peng H, Cheng HY, Chen C, Yu XW, Yang JN, Gao WR, Shi
QH, Zhang H, Li JG, Ma H (2009) A NAC transcription factor
gene of Chickpea (Cicer arietinum), CarNAC3, is involved in
drought stress response and various developmental processes.
J Plant Physiol 166:1934–1945
29. Peng H, Yu X, Cheng H, Shi Q, Zhang H, Li JG, Ma H (2010)
Cloning and characterization of a novel NAC family gene Car-NAC1 from chickpea (Cicer arietinum L.). Mol Biotechnol
44:30–40
30. Coram TE, Pang ECK (2005) Isolation and analysis of candidate
ascochyta blight defence genes in chickpea. Part I. Generation
and analysis of an expressed sequence tag (EST) library. Physiol
Mol Plant Pathol 66:192–200
31. Coram TE, Pang ECK (2005) Isolation and analysis of candidate
ascochyta blight defence genes in chickpea. Part II. Microarray
expression analysis of putative defence-related ESTs. Physiol
Mol Plant Pathol 66:201–210
32. Ashraf N, Ghai D, Barman P, Basu S, Gangisetty N, Mandal MK,
Chakraborty N, Datta A, Chakraborty S (2009) Comparative
analyses of genotype dependent expressed sequence tags and
Mol Biol Rep (2012) 39:8147–8158 8157
123
stress-responsive transcriptome of chickpea wilt illustrate pre-
dicted and unexpected genes and novel regulators of plant
immunity. BMC Genomics 10:415
33. Varshney RK, Hiremath PJ, Lekha P, Kashiwagi J, Balaji J,
Deokar AA, Vadez V, Xiao Y, Srinivasan R, Gaur PM, Siddique
KHM, Town CD, Hoisington DA (2009) A comprehensive
resource of drought- and salinity-responsive ESTs for gene dis-
covery and marker development in chickpea (Cicer arietinum L.).
BMC Genomics 10:523
34. Tripathi V, Parasuraman B, Laxmi A, Chattopadhyay D (2009)
CIPK6, a CBL-interacting protein kinase is required for devel-
opment and salt tolerance in plants. Plant J 58:778–790
35. Matsumoto T, Wu J, Kanamori H, Katayose Y, Fujisawa M et al
(2005) The Rice Annotation Project Database (RAP-DB): hub for
Oryza sativa ssp. japonica genome information. Nature
436:500–793
36. Shinozaki K, Yamaguchi-Shinozaki K (2007) Gene networks
involved in drought stress response and tolerance. J Exp Bot
58:221–227
37. Seki M, Umezawa T, Urano K, Shinozaki K (2007) Regulatory
metabolic networks in drought stress responses. Curr Opin Plant
Biol 10:296–302
38. Lee BR, Jung WJ, Lee BH, Avice JC, Ourry A, Kim TH (2008)
Kinetics of drought-induced pathogenesis-related proteins and its
physiological significance in white clover leaves. Physiol Plant
132:329–337
39. Dunwell JM, Gibbings JG, Mahmood T, Naqvi SMS (2008)
Germin and germin-like proteins: evolution, structure, and
function. Crit Rev Plant Sci 27:342–375
40. Zhang Y, Xu WY, Li ZH, Deng XW, Wu WH, Xue YB (2008)
F-box protein DOR functions as a novel inhibitory factor for
abscisic acid-induced stomatal closure under drought stress in
arabidopsis. Plant Physiol 148:2121–2133
41. Singh KB, Ocampo B, Robertson LD (1998) Diversity for abiotic
and biotic stress resistance in the wild annual Cicer species.
Genet Resour Crop Evol 45:9–17
8158 Mol Biol Rep (2012) 39:8147–8158
123