Embed Size (px)
Citation preview
Transcriptional Regulation of Ribosome Components AreDetermined by Stress According to CellularCompartments in Arabidopsis thalianaRodnay Sormani, Celine Masclaux-Daubresse, Francoise Daniele-Vedele, Fabien Chardon*
Institut Jean-Pierre Bourgin, UMR1318 INRA-AgroParisTech, Saclay Plant Sciences, Versailles, France
Abstract
Plants have to coordinate eukaryotic ribosomes (cytoribosomes) and prokaryotic ribosomes (plastoribosomes andmitoribosomes) production to balance cellular protein synthesis in response to environmental variations. We identified 429genes encoding potential ribosomal proteins (RP) in Arabidopsis thaliana. Because cytoribosome proteins are encoded bysmall nuclear gene families, plastid RP by nuclear and plastid genes and mitochondrial RP by nuclear and mitochondrialgenes, several transcriptional pathways were attempted to control ribosome amounts. Examining two independentgenomic expression datasets, we found two groups of RP genes showing very different and specific expression patterns inresponse to environmental stress. The first group represents the nuclear genes coding for plastid RP whereas the secondgroup is composed of a subset of cytoribosome genes coding for RP isoforms. By contrast, the other cytoribosome genesand mitochondrial RP genes show less constraint in their response to stress conditions. The two subsets of cytoribosomegenes code for different RP isoforms. During stress, the response of the intensively regulated subset leads to dramaticvariation in ribosome diversity. Most of RP genes have same promoter structure with two motifs at conserved positions. Thestress-response of the nuclear genes coding plastid RP is related with the absence of an interstitial telomere motif known astelo box in their promoters. We proposed a model for the ‘‘ribosome code’’ that influences the ribosome biogenesis bythree main transcriptional pathways. The first pathway controls the basal program of cytoribosome and mitoribosomebiogenesis. The second pathway involves a subset of cytoRP genes that are co-regulated under stress condition. The thirdindependent pathway is devoted to the control of plastoribosome biosynthesis by regulating both nuclear and plastidgenes.
Citation: Sormani R, Masclaux-Daubresse C, Daniele-Vedele F, Chardon F (2011) Transcriptional Regulation of Ribosome Components Are Determined by StressAccording to Cellular Compartments in Arabidopsis thaliana. PLoS ONE 6(12): e28070. doi:10.1371/journal.pone.0028070
Editor: Vladimir N. Uversky, University of South Florida College of Medicine, United States of America
Received September 12, 2011; Accepted October 31, 2011; Published December 2, 2011
Copyright: � 2011 Sormani et al. This is an open-access article distributed under the terms of the Creative Commons Attribution License, which permitsunrestricted use, distribution, and reproduction in any medium, provided the original author and source are credited.
Funding: This work was partly supported by a grant from Agence Nationale de la Recherche to RS (ANR Blanc06-3-135436). No additional external funding wasreceived for this study. The funders had no role in study design, data collection and analysis, decision to publish, or preparation of the manuscript.
Competing Interests: The authors have declared that no competing interests exist.
* E-mail: [email protected]
Introduction
For their survival, cells need to safeguard energy and to adapt
their growth and differentiation to the local environmental
fluctuations. Ribosomes are integral to the translation of mRNA
into proteins and, as such, are considered as housekeeping com-
ponents of the cells. However, ribosomal biogenesis, as all protein
synthesis, is energy-consuming. In yeast, it has been reported that
at least 75% of the transcriptional activity is dedicated to ribosome
biogenesis [1]. In response to stress such as nutritional limitation,
repression of ribosomal protein synthesis has been observed in all
kingdoms: bacteria, yeast, animal and plants [2]. Although ribo-
some proteins are among the most highly conserved proteins
across evolution in all kingdoms, the regulatory pathways con-
trolling the genes encoding these proteins remain unclear.
In eukaryotic cells, ribosomes are millions of KDa ribonu-
cleoprotein complexes comprising two subunits, a large and a
small subunit, composed of four rRNA together with 48 and 32
ribosomal proteins (RP) respectively. In the model plant Arabidopsis
thaliana, each cytoplasmic RP (cytoRP) can be encoded by different
members of small families including 2 to 7 family members [3,4].
In the same family, the RP isoforms share between 65% and 100%
amino acid sequence identities [3]. To explain the sense of this
conserved redundancy, several explanations have been developed,
such as a specialization of the role of each member or the need to
rapidly regulate the amount of RPs in the cell. There is no
evidence for any of these hypotheses in plants [5,6]. Moreover,
mutant analysis of genes encoding cytoRP often shows that several
of these genes have specific developmental roles [7].
In plants, growth and development need a fine-tuning in the
activity of cytosol, mitochondria and chloroplasts, requiring
distinct and accurate regulation of ribosome biogenesis in each
compartment. Molecular data and phylogenetic analyses support
the cyanobacteria and a-proteobacterial origins of chloroplast and
mitochondria, respectively [8]. The prokaryotic gene families
encoding the mitochondrial (mitoRP) and plastid RP (plastoRP)
are not yet fully listed in Arabidopsis. In a typical prokaryotic
organism, such as Escherichia coli, 54 RP make up the ribosome [9].
Thus, in chloroplast and mitochondria, 54 RP are expected as in
Escherichia coli. However, these RP are not encoded only by genes
located within the organelle genome. Indeed, many organelle
genes including RP ones have been transferred to the nucleus
during plants evolution [8]. From genome sequence analyses,
Bonen and Calixte [10] identified recently 46 mitochondrial-type
PLoS ONE | www.plosone.org 1 December 2011 | Volume 6 | Issue 12 | e28070

RP genes in the nuclear genome and only 7 mitoRP genes in the
mitochondria genome of Arabidopsis. Spinach proteomic and
genomic analyses showed that the plastoribosome contains 58
plastoRP among which only 22 are encoded by the chloroplast
genome [11,12]. In addition, seven of the nuclear-encoded
plastoRP have been categorized as ‘‘plant plastid specific’’
[13,14]. Experimental evidences also revealed that more complex
exchanges exist such as transfer of RP genes from chloroplast to
mitochondrion [15].
Ribosome biogenesis is complex and its control depends on both
internal and external signaling in all three compartments:
cytoplasm, plastid and mitochondrion. Up to now, there is little
information on the transcriptional regulation of members within
each RP gene family. Recently, Whittle and Krochko [16]
analyzed the expression of RP genes in Brassica napus, based on
RP EST abundances reported in databases. Their results suggest
that the differential regulation of the expression level of RP genes
within a family is a transcriptional way to adapt ribosome
composition in plants. In this study, we first recorded the entire list
of genes coding for RPs in Arabidopsis, and the predicted
localization for each RP from the literature and sequence genome
analysis. By analyzing the corresponding expression pattern of
these genes in the CATMA microarray experiment database [17],
we revealed that only five different classes of genes exist. These
classes of genes defined by their response to environmental stress
are related to the predicted localization of the corresponding RP.
These results were then validated with a second analysis of another
microarray experiment database using the genevestigator tool
[18]. We then analyzed the nucleotide motifs in the promoters of
each class of RP gene and revealed that telo-box motif is absent in
the class of nuclear genes encoding plastoRP. Finally, we discussed
the global transcriptional regulation of RP genes in plants.
Results
The Arabidopsis genome contains 429 RP genesThe first step in this study was to obtain a complete list of RP
genes in Arabidopsis thaliana. For cytoribosome, we used the gene list
of cytoRP provided by Barakat et al. [3] and data from proteomics
studies [4,19] to perform TBlastN and TBlastX with all the entries
available on TAIR 7 Arabidopsis genomics data [20] and to
retrieve the missing AGI accession set. In similar manner, for
plastoribosome and mitoribosome, the 54 E. coli RP [9], available
gene list of Arabidopsis mitoRP [10] and proteomic studies of
plastoRP in spinach [11,12], were used to retrieve ribosomal
entries in the Arabidopsis genome. In order to discriminate
between prokaryotic or eukaryotic origins of each sequence, we
performed phylogenic analysis using the Phylogeny.fr pipeline [21].
Localizations of the RP were predicted using SUBA software [22],
and the predictions were validated when it was possible with
available proteomic studies [23,24,25,26,27,28,29]. All these in
silico analyses provided a list containing 429 references for RP
genes with their sub-cellular localization, depicted in Fig. 1 (see
Table S1). Among these RP genes, 48% are implicated in cytoRP
synthesis. Some new AGI have been identified for cytoRP
predicted previously by Barakat et al [3] and additional new
cytoRP genes have been found (Table 1). Validation of protein
localization for these two gene lists was based on proteomic studies
on cytoribosome [4,19]. For around 3% of the RP genes, RP
localization is predicted in the nucleus, reminding us that early
steps of cytoribosome biogenesis are nuclear events [30]. MitoRP
are encoded by 17% of the RP genes, corresponding to 71 genes
distributed in 44 families (see Table S6). Around 18% of the genes
have a plastoRP prediction. They correspond to 77 genes
distributed in 55 families (see Table S7). 80% of their prediction
has been validated by proteomic analyses. The localization
remains unclear for 14% of the RP gene list. Among the 429
RP genes, only 19 were annotated as pseudogenes on TAIR 10,
with no clear RP localization. Finally, the 429 RP genes are then
organized into (i) 221 genes encoding cytoRP (ii) 71 genes
encoding mitoRP and (iii) 77 genes encoding plastoRP.
Transcriptional analysis and clustering of RP genes withCATMA database
To analyze transcriptional regulation of RP genes, dataset from
the public CATMA library [17] has been used. From the
annotation of nuclear, mitochondrial and plastid genomes, 293
gene-specific probes were retrieved for the 429 RP genes providing
expression information on nearly 70% of the RP genes. A set of 49
experiments has been selected for further analysis (list provided in
Table S5). These 49 experiments compare WT plant grown in
control condition vs. treated condition and in the same time show a
significant variation in expression for at least one RP gene. Before
any computer analysis, all data were homogenized and a code
(21), (+1) and (0) was introduced to indicate that gene was
respectively repressed, induced or did not show any variation with
significant p-value (as defined in [17]). Two clustering, one for the
experiments and another for the genes, have been carried out
successively (Fig. 2). Interestingly, CATMA experiments dealing
with stress have been clustered into four groups. Groups 1 and 2
include experiments inducing gene expression in response to biotic
and abiotic stress, respectively. Group 3 assembles experiments in
which stress effect on gene expression was weak. Group 4 includes
experiments where plant Carbon/Nitrogen status is affected.
Gene clustering was performed in order to reveal similarities in
RP gene expression patterns in response to stress. In the set of
CATMA experiments, a list of 47 genes was first identified,
showing no significant variation in signal intensity whatever the
experiment tested. In this class 0, the different corresponding RP
are located within the cytosol, nucleus, mitochondria and plastids
with however an over representation of mitoRP (34% of class 0
compared to 17% of the full gene list). Most of the RP
pseudogenes belong to this class. From the 246 other genes, a
k-means clustering monitored by 4 classes has been used to identify
correlations in the regulation of these RP genes. The four classes
Figure 1. Predicted subcellular localization of RP in Arabidop-sis. Subcellular localization of the RP gene product is the result ofprediction with SUBA software in accordance to phylogenetic analyses,and with proteomics data when data are available. Full gene list isprovided in Table S1. The three numbers in brackets correspond to thegene distribution among the genome localization: nuclear, mitochon-drial or plastidial, respectively.doi:10.1371/journal.pone.0028070.g001
Regulation of RP Gene Expression in Arabidopsis
PLoS ONE | www.plosone.org 2 December 2011 | Volume 6 | Issue 12 | e28070
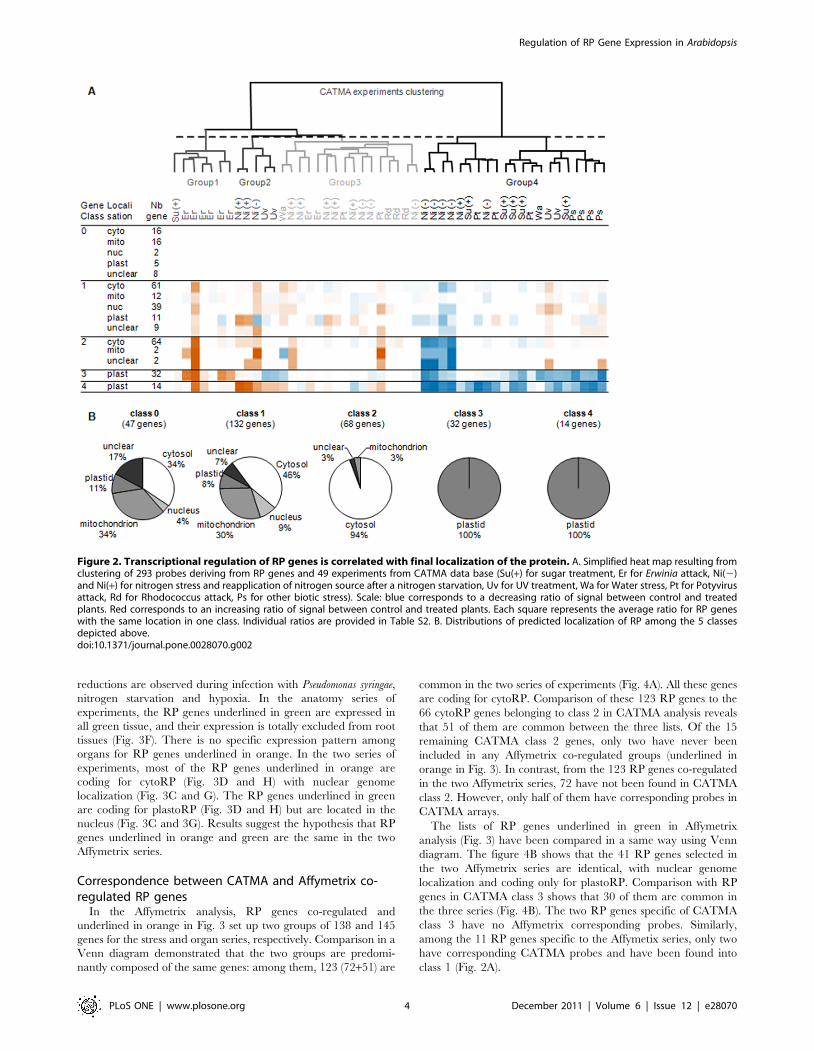
obtained depict specific transcription patterns in response to
environment (Fig. 2A and see Table S2). The most striking result is
that these four classes are correlated with the final location of RP.
Class 1 represents 132 genes with rare and erratic variations
(Fig. 2A). In this group the majority of genes code for cytoRP and
mitoRP. MitoRP are over represented, 30% versus 17% of the full
RP gene list (Fig. 2B). Class 2 is composed of 68 genes among
which 94% are coding for cytoRP. Class 2 is down-regulated by
nitrogen starvation and up-regulated by an Erwinia amylovora
inoculation (Fig. 2A). Classes 3 and 4 are composed of 32 and 14
genes respectively, all of them coding for plastoRP (Fig. 2B).
However, in class 3, RP genes are exclusively nuclear whereas in
class 4 all genes are plastidial, except two that are nuclear. The two
last classes are highly down-regulated by nitrogen starvation and
by all the stress affecting the plant Carbon/Nitrogen status (Group
4 of experiment). The partitioning between classes 3 and 4 is based
on contrasted responses of RP genes to group 2 experiments, UV
stress and nitrogen re-supply (Fig. 2A).
Validation of the CATMA transcriptional analysis usingAffymetrix data available in Genevestigator
To see if our previous analyses resists to higher complexity, we
analyzed a second set of experiment. Results of experiments
using Affymetrix ATH1 arrays provide a second and indepen-
dent dataset that we used to validate our CATMA analysis.
Affymetrix results for 5747 experiments have been analyzed
using 357 Affymetrix probes available for the 429 RP genes
(listed in Table S1). Using Genevestigator [18], hierarchical
clustering of gene expression patterns was carried out with
Pearson’s correlation for the two series of experiments: organ
specificity (referred in Genevestigator as anatomy) and stress
(referred as conditions) (Fig. 3). Matrix of Pearson’s correlations
has been done to highlight co-regulated genes in these two
different series of experiments. In the two series, two blocks of
genes appear with the strongest correlations (r2$0.8) (Fig. 3A and
3E). Pattern of co-regulated genes have been underlined in
orange and green for the largest and he smallest respectively
(Fig. 3B and 3F).
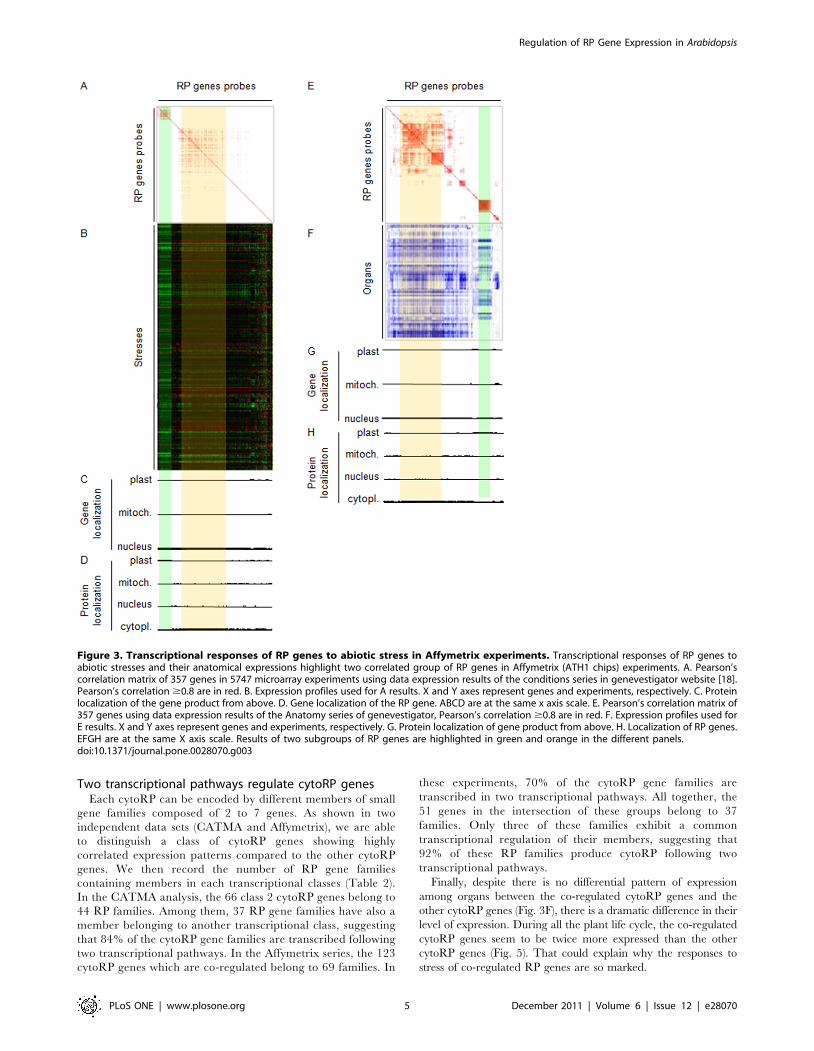
In the stress series, the group of genes underlined in orange is
characterized by an important coordinated response to several
stimuli (Fig. 3B). Increases in gene expression are observed in light
study, circadian clock and shift of etiolated seedling to light
experiments. A decrease expression of these genes is observed
under osmotic stress, drought, and low light treatments. For the
green underlined RP genes, an increase in their expression is
observed in response to brassinolide treatment and dramatic
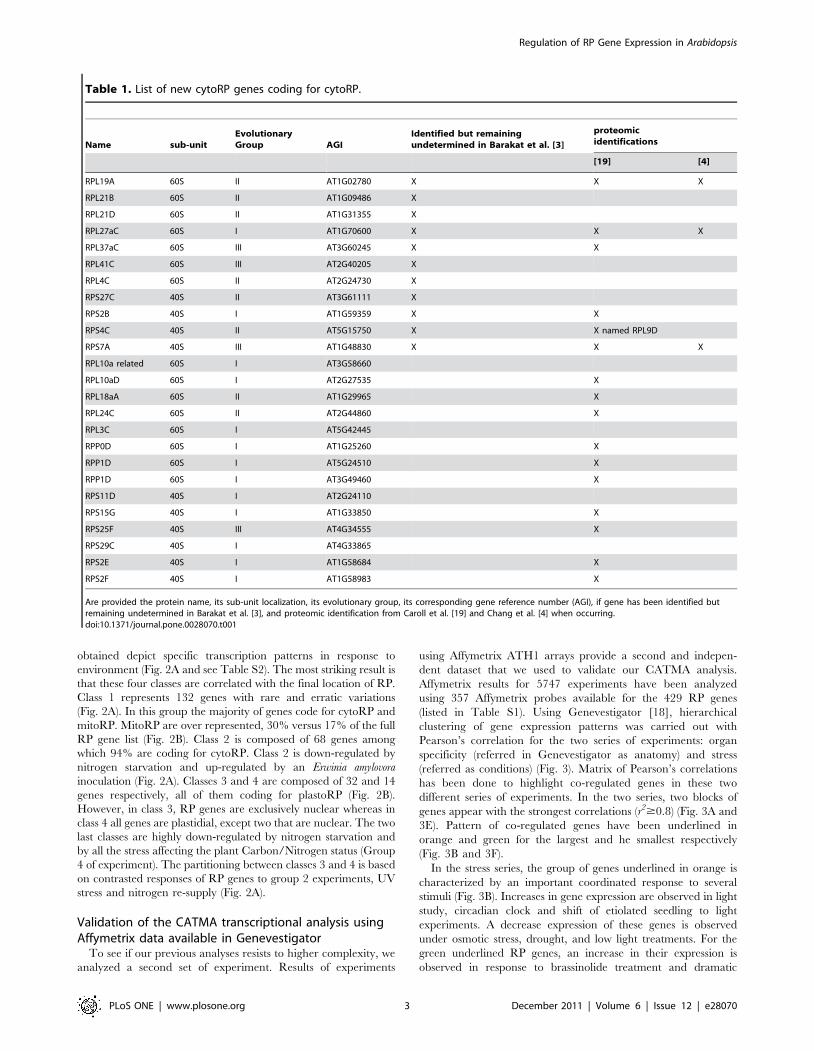
Table 1. List of new cytoRP genes coding for cytoRP.
Name sub-unitEvolutionaryGroup AGI
Identified but remainingundetermined in Barakat et al. [3]
proteomicidentifications
[19] [4]
RPL19A 60S II AT1G02780 X X X
RPL21B 60S II AT1G09486 X
RPL21D 60S II AT1G31355 X
RPL27aC 60S I AT1G70600 X X X
RPL37aC 60S III AT3G60245 X X
RPL41C 60S III AT2G40205 X
RPL4C 60S II AT2G24730 X
RPS27C 40S II AT3G61111 X
RPS2B 40S I AT1G59359 X X
RPS4C 40S II AT5G15750 X X named RPL9D
RPS7A 40S III AT1G48830 X X X
RPL10a related 60S I AT3G58660
RPL10aD 60S I AT2G27535 X
RPL18aA 60S II AT1G29965 X
RPL24C 60S II AT2G44860 X
RPL3C 60S I AT5G42445
RPP0D 60S I AT1G25260 X
RPP1D 60S I AT5G24510 X
RPP1D 60S I AT3G49460 X
RPS11D 40S I AT2G24110
RPS15G 40S I AT1G33850 X
RPS25F 40S III AT4G34555 X
RPS29C 40S I AT4G33865
RPS2E 40S I AT1G58684 X
RPS2F 40S I AT1G58983 X
Are provided the protein name, its sub-unit localization, its evolutionary group, its corresponding gene reference number (AGI), if gene has been identified butremaining undetermined in Barakat et al. [3], and proteomic identification from Caroll et al. [19] and Chang et al. [4] when occurring.doi:10.1371/journal.pone.0028070.t001
Regulation of RP Gene Expression in Arabidopsis
PLoS ONE | www.plosone.org 3 December 2011 | Volume 6 | Issue 12 | e28070
reductions are observed during infection with Pseudomonas syringae,
nitrogen starvation and hypoxia. In the anatomy series of
experiments, the RP genes underlined in green are expressed in
all green tissue, and their expression is totally excluded from root
tissues (Fig. 3F). There is no specific expression pattern among
organs for RP genes underlined in orange. In the two series of
experiments, most of the RP genes underlined in orange are
coding for cytoRP (Fig. 3D and H) with nuclear genome
localization (Fig. 3C and G). The RP genes underlined in green
are coding for plastoRP (Fig. 3D and H) but are located in the
nucleus (Fig. 3C and 3G). Results suggest the hypothesis that RP
genes underlined in orange and green are the same in the two
Affymetrix series.
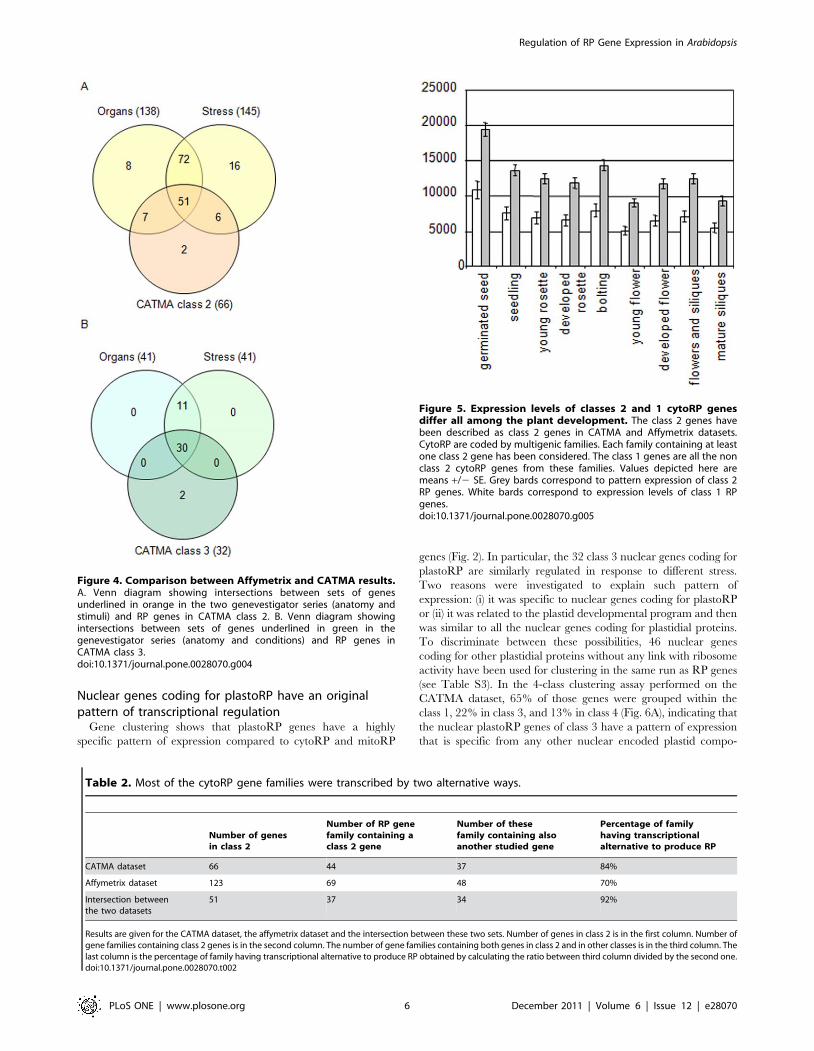
Correspondence between CATMA and Affymetrix co-regulated RP genes
In the Affymetrix analysis, RP genes co-regulated and
underlined in orange in Fig. 3 set up two groups of 138 and 145
genes for the stress and organ series, respectively. Comparison in a
Venn diagram demonstrated that the two groups are predomi-
nantly composed of the same genes: among them, 123 (72+51) are
common in the two series of experiments (Fig. 4A). All these genes
are coding for cytoRP. Comparison of these 123 RP genes to the
66 cytoRP genes belonging to class 2 in CATMA analysis reveals
that 51 of them are common between the three lists. Of the 15
remaining CATMA class 2 genes, only two have never been
included in any Affymetrix co-regulated groups (underlined in
orange in Fig. 3). In contrast, from the 123 RP genes co-regulated
in the two Affymetrix series, 72 have not been found in CATMA
class 2. However, only half of them have corresponding probes in
CATMA arrays.
The lists of RP genes underlined in green in Affymetrix
analysis (Fig. 3) have been compared in a same way using Venn
diagram. The figure 4B shows that the 41 RP genes selected in
the two Affymetrix series are identical, with nuclear genome
localization and coding only for plastoRP. Comparison with RP
genes in CATMA class 3 shows that 30 of them are common in
the three series (Fig. 4B). The two RP genes specific of CATMA
class 3 have no Affymetrix corresponding probes. Similarly,
among the 11 RP genes specific to the Affymetix series, only two
have corresponding CATMA probes and have been found into
class 1 (Fig. 2A).
Figure 2. Transcriptional regulation of RP genes is correlated with final localization of the protein. A. Simplified heat map resulting fromclustering of 293 probes deriving from RP genes and 49 experiments from CATMA data base (Su(+) for sugar treatment, Er for Erwinia attack, Ni(2)and Ni(+) for nitrogen stress and reapplication of nitrogen source after a nitrogen starvation, Uv for UV treatment, Wa for Water stress, Pt for Potyvirusattack, Rd for Rhodococcus attack, Ps for other biotic stress). Scale: blue corresponds to a decreasing ratio of signal between control and treatedplants. Red corresponds to an increasing ratio of signal between control and treated plants. Each square represents the average ratio for RP geneswith the same location in one class. Individual ratios are provided in Table S2. B. Distributions of predicted localization of RP among the 5 classesdepicted above.doi:10.1371/journal.pone.0028070.g002
Regulation of RP Gene Expression in Arabidopsis
PLoS ONE | www.plosone.org 4 December 2011 | Volume 6 | Issue 12 | e28070
Two transcriptional pathways regulate cytoRP genesEach cytoRP can be encoded by different members of small
gene families composed of 2 to 7 genes. As shown in two
independent data sets (CATMA and Affymetrix), we are able
to distinguish a class of cytoRP genes showing highly
correlated expression patterns compared to the other cytoRP
genes. We then record the number of RP gene families
containing members in each transcriptional classes (Table 2).
In the CATMA analysis, the 66 class 2 cytoRP genes belong to
44 RP families. Among them, 37 RP gene families have also a
member belonging to another transcriptional class, suggesting
that 84% of the cytoRP gene families are transcribed following
two transcriptional pathways. In the Affymetrix series, the 123
cytoRP genes which are co-regulated belong to 69 families. In
these experiments, 70% of the cytoRP gene families are
transcribed in two transcriptional pathways. All together, the
51 genes in the intersection of these groups belong to 37
families. Only three of these families exhibit a common
transcriptional regulation of their members, suggesting that
92% of these RP families produce cytoRP following two
transcriptional pathways.
Finally, despite there is no differential pattern of expression
among organs between the co-regulated cytoRP genes and the
other cytoRP genes (Fig. 3F), there is a dramatic difference in their
level of expression. During all the plant life cycle, the co-regulated
cytoRP genes seem to be twice more expressed than the other
cytoRP genes (Fig. 5). That could explain why the responses to
stress of co-regulated RP genes are so marked.
Figure 3. Transcriptional responses of RP genes to abiotic stress in Affymetrix experiments. Transcriptional responses of RP genes toabiotic stresses and their anatomical expressions highlight two correlated group of RP genes in Affymetrix (ATH1 chips) experiments. A. Pearson’scorrelation matrix of 357 genes in 5747 microarray experiments using data expression results of the conditions series in genevestigator website [18].Pearson’s correlation $0.8 are in red. B. Expression profiles used for A results. X and Y axes represent genes and experiments, respectively. C. Proteinlocalization of the gene product from above. D. Gene localization of the RP gene. ABCD are at the same x axis scale. E. Pearson’s correlation matrix of357 genes using data expression results of the Anatomy series of genevestigator, Pearson’s correlation $0.8 are in red. F. Expression profiles used forE results. X and Y axes represent genes and experiments, respectively. G. Protein localization of gene product from above. H. Localization of RP genes.EFGH are at the same X axis scale. Results of two subgroups of RP genes are highlighted in green and orange in the different panels.doi:10.1371/journal.pone.0028070.g003
Regulation of RP Gene Expression in Arabidopsis
PLoS ONE | www.plosone.org 5 December 2011 | Volume 6 | Issue 12 | e28070
Nuclear genes coding for plastoRP have an originalpattern of transcriptional regulation
Gene clustering shows that plastoRP genes have a highly
specific pattern of expression compared to cytoRP and mitoRP
genes (Fig. 2). In particular, the 32 class 3 nuclear genes coding for
plastoRP are similarly regulated in response to different stress.
Two reasons were investigated to explain such pattern of
expression: (i) it was specific to nuclear genes coding for plastoRP
or (ii) it was related to the plastid developmental program and then
was similar to all the nuclear genes coding for plastidial proteins.
To discriminate between these possibilities, 46 nuclear genes
coding for other plastidial proteins without any link with ribosome
activity have been used for clustering in the same run as RP genes
(see Table S3). In the 4-class clustering assay performed on the
CATMA dataset, 65% of those genes were grouped within the
class 1, 22% in class 3, and 13% in class 4 (Fig. 6A), indicating that
the nuclear plastoRP genes of class 3 have a pattern of expression
that is specific from any other nuclear encoded plastid compo-
Figure 4. Comparison between Affymetrix and CATMA results.A. Venn diagram showing intersections between sets of genesunderlined in orange in the two genevestigator series (anatomy andstimuli) and RP genes in CATMA class 2. B. Venn diagram showingintersections between sets of genes underlined in green in thegenevestigator series (anatomy and conditions) and RP genes inCATMA class 3.doi:10.1371/journal.pone.0028070.g004
Table 2. Most of the cytoRP gene families were transcribed by two alternative ways.
Number of genesin class 2
Number of RP genefamily containing aclass 2 gene
Number of thesefamily containing alsoanother studied gene
Percentage of familyhaving transcriptionalalternative to produce RP
CATMA dataset 66 44 37 84%
Affymetrix dataset 123 69 48 70%
Intersection betweenthe two datasets
51 37 34 92%
Results are given for the CATMA dataset, the affymetrix dataset and the intersection between these two sets. Number of genes in class 2 is in the first column. Number ofgene families containing class 2 genes is in the second column. The number of gene families containing both genes in class 2 and in other classes is in the third column. Thelast column is the percentage of family having transcriptional alternative to produce RP obtained by calculating the ratio between third column divided by the second one.doi:10.1371/journal.pone.0028070.t002
Figure 5. Expression levels of classes 2 and 1 cytoRP genesdiffer all among the plant development. The class 2 genes havebeen described as class 2 genes in CATMA and Affymetrix datasets.CytoRP are coded by multigenic families. Each family containing at leastone class 2 gene has been considered. The class 1 genes are all the nonclass 2 cytoRP genes from these families. Values depicted here aremeans +/2 SE. Grey bards correspond to pattern expression of class 2RP genes. White bards correspond to expression levels of class 1 RPgenes.doi:10.1371/journal.pone.0028070.g005
Regulation of RP Gene Expression in Arabidopsis
PLoS ONE | www.plosone.org 6 December 2011 | Volume 6 | Issue 12 | e28070

nents. Similarly, we then wanted to test, if the common expression
pattern of the 12 plastidial genes coding for plastoRP was
dependent of the plastid development. A list of 29 plastidial genes
coding for plastidial proteins without any link with ribosome
activity have been used for clustering in the same run as RP genes
(see Table S4). In the 4-classes clustering assay made on CATMA
dataset, 24% of plastidic genes were grouped within the class 1,
3% in class 2, 3% in class 3, and 70% in class 4 (Fig. 6B). We can
conclude that no specific plastidial transcriptional program is
dedicated to RP genes, the plastidial genome expression being
tightly coordinated through one major transcriptional regulatory
pathway.
Regarding the class 3 and class 4 responses to stress (Fig. 2), we
tested the correlation of their responses to stress in CATMA
dataset. Interestingly, using the open-source Cytoscape software
[31], our basic representation of the highest correlations (r2$0.75)
between gene expressions (Fig. 6C) shows two independent clouds
of genes, one for the class 3 and another for the class 4. The
nuclear (white) and plastidial (grey) genes from classes 3 and 4 are
connected together by two main genes which are RPS1 and
PSRP2.
The pattern of expression of nuclear plastoRP genes isassociated to the absence of a motif in their promoters
To understand the distribution of expression patterns among
RP genes, we analyzed RP promoter sequences of nuclear genes
using MEME software to identify specific or common motifs in the
classes and FIMO software to find motif occurrences between the
classes [32]. Only two interstitial telomere motifs have been found
(Fig. 7). The site II motif ARGCCCA (R = A or G) [33,34] is
located at 270+/225 nucleotides from the translation initiation site
in respectively 59%, 71%, 75% and 64% of the promoters of class
1 cytoRP, class 2 cytoRP, mitoRP and plastoRP genes (Fig. 7A).
The site-II motif was found in only 29% of random promoter. The
telo-box motif AAACCCWA (W = A or T) already described in
several promoters of RP genes in plants [35] was indeed found in
RP promoters but is less represented in promoters of plastoRP
genes than in others (Fig. 7B). The telo-box is located at 230+/225
nucleotides from the translation initiation site, in respectively 61%,
63% and 84% of promoters for class 1 cytoRP, class 2 cytoRP and
class 1 mitoRP (Fig. 7B). Although the telo-box motif was found in
32% of random promoter, Telo-boxes were never found at this
Figure 6. Expression patterns of nuclear and plastidial genes highlight the specificity of nuclear plastoRP gene regulation.A. Distribution of the regulation pattern obtained in CATMA dataset for 46 nuclear genes coding for protein with plastidial location in the 4-meansclustering describing four classes of regulation for RP genes. List and heat map are provided in Table S3. B. Distribution of the regulation patternobtained in CATMA dataset for 30 plastidial genes in the 4-means clustering describing four classes of regulation for RP genes. List and heat map areprovided in Table S4. C. PlastoRP gene expressions network in stress conditions. Graphic representation of relationship between plastoRP geneexpressions during stress conditions. Genes are represented as nodes, and color and shapes have been assigned according to their localization innucleus (white) or plastid genome (grey). Edges connecting nodes represent significant correlation between gene expressions in CATMA experimentanalyzed. Only correlations upper than 0.75 were kept. Edge thickness is proportional to the correlation. We used the open-source Cytoscapesoftware to visualize the network. (*) and (**) highlight the key positions of RPS1 and PSRP-2 genes, respectively.doi:10.1371/journal.pone.0028070.g006
Regulation of RP Gene Expression in Arabidopsis
PLoS ONE | www.plosone.org 7 December 2011 | Volume 6 | Issue 12 | e28070
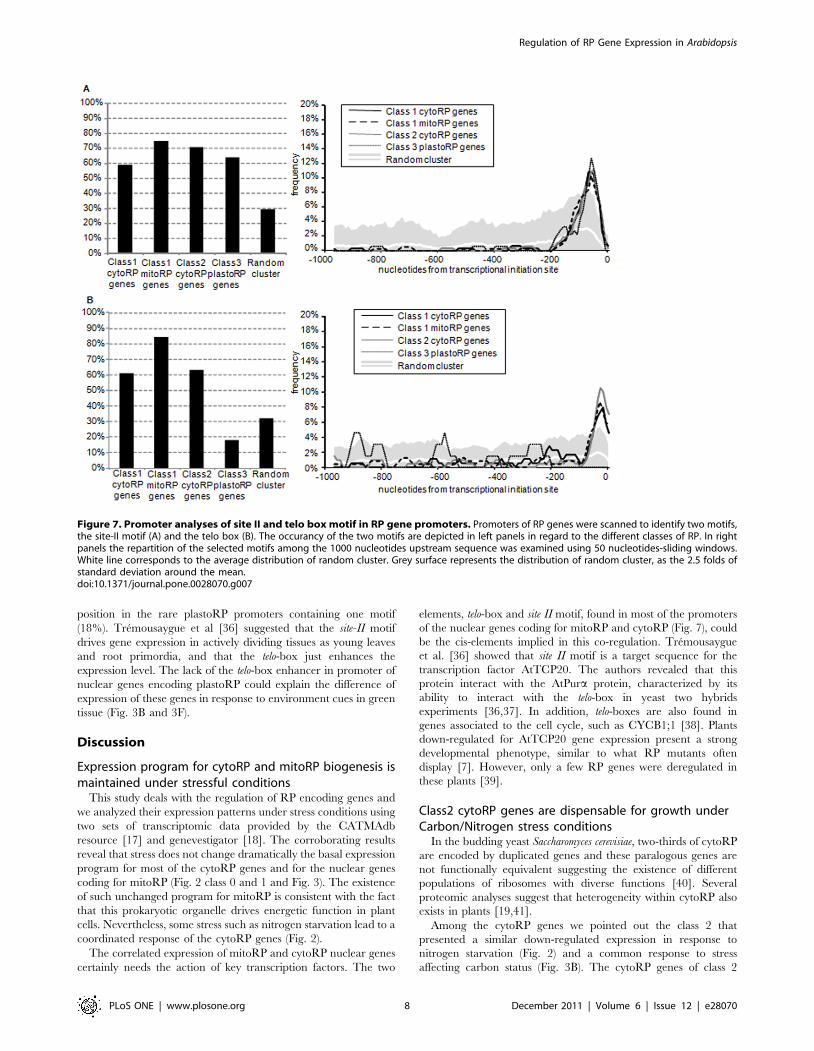
position in the rare plastoRP promoters containing one motif
(18%). Tremousaygue et al [36] suggested that the site-II motif
drives gene expression in actively dividing tissues as young leaves
and root primordia, and that the telo-box just enhances the
expression level. The lack of the telo-box enhancer in promoter of
nuclear genes encoding plastoRP could explain the difference of
expression of these genes in response to environment cues in green
tissue (Fig. 3B and 3F).
Discussion
Expression program for cytoRP and mitoRP biogenesis ismaintained under stressful conditions
This study deals with the regulation of RP encoding genes and
we analyzed their expression patterns under stress conditions using
two sets of transcriptomic data provided by the CATMAdb
resource [17] and genevestigator [18]. The corroborating results
reveal that stress does not change dramatically the basal expression
program for most of the cytoRP genes and for the nuclear genes
coding for mitoRP (Fig. 2 class 0 and 1 and Fig. 3). The existence
of such unchanged program for mitoRP is consistent with the fact
that this prokaryotic organelle drives energetic function in plant
cells. Nevertheless, some stress such as nitrogen starvation lead to a
coordinated response of the cytoRP genes (Fig. 2).
The correlated expression of mitoRP and cytoRP nuclear genes
certainly needs the action of key transcription factors. The two
elements, telo-box and site II motif, found in most of the promoters
of the nuclear genes coding for mitoRP and cytoRP (Fig. 7), could
be the cis-elements implied in this co-regulation. Tremousaygue
et al. [36] showed that site II motif is a target sequence for the
transcription factor AtTCP20. The authors revealed that this
protein interact with the AtPura protein, characterized by its
ability to interact with the telo-box in yeast two hybrids
experiments [36,37]. In addition, telo-boxes are also found in
genes associated to the cell cycle, such as CYCB1;1 [38]. Plants
down-regulated for AtTCP20 gene expression present a strong
developmental phenotype, similar to what RP mutants often
display [7]. However, only a few RP genes were deregulated in
these plants [39].
Class2 cytoRP genes are dispensable for growth underCarbon/Nitrogen stress conditions
In the budding yeast Saccharomyces cerevisiae, two-thirds of cytoRP
are encoded by duplicated genes and these paralogous genes are
not functionally equivalent suggesting the existence of different
populations of ribosomes with diverse functions [40]. Several
proteomic analyses suggest that heterogeneity within cytoRP also
exists in plants [19,41].
Among the cytoRP genes we pointed out the class 2 that
presented a similar down-regulated expression in response to
nitrogen starvation (Fig. 2) and a common response to stress
affecting carbon status (Fig. 3B). The cytoRP genes of class 2
Figure 7. Promoter analyses of site II and telo box motif in RP gene promoters. Promoters of RP genes were scanned to identify two motifs,the site-II motif (A) and the telo box (B). The occurancy of the two motifs are depicted in left panels in regard to the different classes of RP. In rightpanels the repartition of the selected motifs among the 1000 nucleotides upstream sequence was examined using 50 nucleotides-sliding windows.White line corresponds to the average distribution of random cluster. Grey surface represents the distribution of random cluster, as the 2.5 folds ofstandard deviation around the mean.doi:10.1371/journal.pone.0028070.g007
Regulation of RP Gene Expression in Arabidopsis
PLoS ONE | www.plosone.org 8 December 2011 | Volume 6 | Issue 12 | e28070

belong to small RP gene families with another paralogous gene
differentially regulated for at least 70% of them (Table 2). This
transcriptional alternative is probably under-estimated by the lack
of probes for some RP genes. We hypothesize that there are
enough cytoRP family having at least one class 2 RP gene to build
up a cytoribosome in class 2 transcriptional ways. The expression
of class 2 cytoRP genes decreased dramatically when availability of
nitrogen falls whereas other cytoRP genes did not present high
variations (Fig. 2. and 3B). The heterogeneity among RP within
cytoribosome populations is thus certainly lower under stress
conditions. This suggests a specialization of ribosome complex
composition in response to stress. The hypothesis of specialization
of RP among a family is supported by the recent study of leaf
developmental process in Arabidopsis rp mutants [42].
Nuclear genes coding for plastoRP have a specificprogram of transcription
Interestingly, genes coding for RP of plant organelles do not
respond to stress in the same manner if their proteins are targeted
to mitochondria or plastids. PlastoRP genes have a highly specific
pattern of expression compared to cytoRP and mitoRP genes
(Fig. 2, 3B and 3F). Two classes of plastoRP genes differing by
their nuclear or plastid genome localization were distinguished
based on their contrasted responses to UV stress and nitrogen-
resupply conditions (classes 3 and 4 respectively in Fig. 2).
Co-regulation of nuclear genes by the GUN pathway has been
clearly demonstrated for plastidial proteins involved in metabolic
status of chloroplast [43]. Although our analysis shows that the
plastoRP nuclear genes (class 3) are indeed responding to the
carbon/nitrogen status of the plant (Fig. 2 and 3B), their
expression program appeared RP specific and different from the
one of nuclear genes coding for other plastidial proteins (Fig. 6A),
suggesting a co-regulation mechanism independent of the GUN
pathway. However, the results that we obtained on plastidial genes
encoding plastoRP must be carefully analyzed since the polyad-
enylation of the corresponding mRNAs is a marker step for their
degradation in plastids [44]. Because the probes used for CATMA
and affymetrix hybridization experiments were synthesized from
mRNA using oligo dT primers, the differential expression of RP
plastidial genes might have been such biased (Fig. 2 and 3B). In
fact, our analysis shows that the down regulation of RP plastidial
gene expression under stress is not a specific program but is related
to a global plastid RNA steady state level (Fig. 6B), in contrast to
nuclear genes coding for plastoRP.
Cis and trans factors might control the expression of thenuclear genes coding for plastoRP
Proteomic analysis of chloroplast ribosomes had identified in
addition to prokaryotic orthologs, seven plant plastid-specific RP
(PSRP1-7), encoded by nuclear genes [13,14]. Yamaguchi and
Subramanian [13] proposed that the PSRP form a plastid-specific
translation regulatory module and their working model involves
PSRP2 interacting with the plastidial encoded RPS1 protein.
Interestingly, we found that RPS1 and PSRP2 are the two RP
genes that connect the nuclear and plastidial classes 3 and 4 in our
representation of the highest correlations of gene expressions
(Fig. 6C). This finding reinforces the hypothesis of a fundamental
role of the PSRP in the regulation of translation in plastid.
In cytoRP promoters of class 1 and class 2 and in mitoRP
promoters of class 1, the site II motif is located at 270+/225
nucleotides from the transcription initiation site and the telo-box is
located at 230+/225 nucleotides from the transcription initiation
site. Presence of these two elements in RP promoter might allows
to a set of transcription factors to coordinate expression as observed
for the biogenesis of the plant mitochondrial respiratory chain [45].
Strikingly, the site II motif is present at the same localization in
the plastoRP promoters than in the other RP promoters, but the
structure of plastoRP promoter is not conserved for telo-boxes. The
absence of the telo-box enhancer in promoter of nuclear plastoRP
genes could be a part of the mechanism resulting in a more intense
response of class 3 genes to environment fluctuations (Fig. 3B). It
also might be an indication that the evolutionary processes of
plastoRP genes migrating to the nuclear genome did not recruit this
motif in contrast to mitoRP genes.
ConclusionThe regulation of RP protein synthesis could be required to save
energy and nutrient and to adapt in the same time to environment.
Conversely, phenotypic response to stress could be a consequence of
the lack of ribosome needed to translate specific mRNAs. Komili et
al. [40] proposed that there is a ‘‘ribosome code’’ that influences
translation similarly to the ‘‘histone code’’ that influences trans-
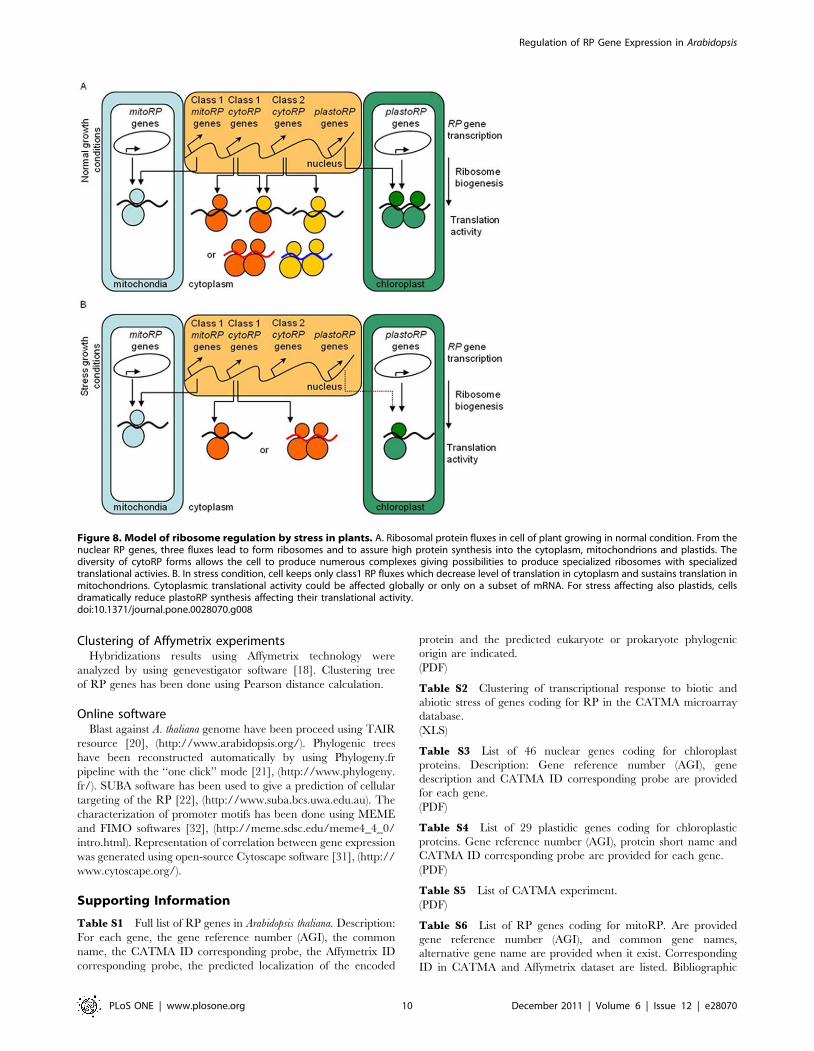
cription. From our results, we propose a model of the ribosome
biogenesis by three transcriptional pathways (Fig. 8).
The first pathway controls the housekeeping cytoribosome and
mitoribosome biogenesis using key transcriptional regulators as
AtTCP20 [36]. The second pathway involves class 2 cytoRP genes
that are up-regulated under non-limiting conditions but down-
regulated under stress. The translational response to stress might
be a general decrease in translation of all mRNAs, as observed in
response to dehydration stress or hypoxia [46,47], or a reduction
in translation of a subset of mRNAs, as observed in response to salt
or cadmium stress [48,49]. During plant development, specializa-
tion of mRNA translation has been observed in mutants belonging
to the same cytoRP family [50,51] and this evidence supports our
last hypothesis. The third independent pathway controls ribosome
biosynthesis in plastids by regulating both nuclear and plastid
genes. This last pathway is highly sensitive to environmental
features and could be convey by plant specific gene coding for
plastoRP like PSRP2.
Methods
Genes and probesRP gene names, AGI, and corresponding probes in CATMA
and Affymetrix arrays are given in Table S1. From the SUBA
database [22], we selected non-RP nuclear genes with protein
localization inferred both in plastid by GFP fusions and MS/MS
determination. Genes coding for RP were removed from the list,
only nuclear genes with CATMA probes were kept. AGI and
corresponding probes of non-RP nuclear-genes with protein
targeted to plastidial compartment are listed in Table S3. From
the gene list available on the CATdb [17], we selected 29 non-RP
plastidial genes with specific probes. AGI and corresponding
probes of plastidial gene without link to ribosome are presented in
Table S4.
Clustering of CATMA experimentsCATdb (http://urgv.evry.inra.fr/CATdb) has been used to
obtained value for hybridization ratios of analyzed genes [17].
Clustering of RP genes have been made using k-means methods
monitored by 3 to 5 fixed classes, 50 times each. Class number of
each RP gene was determined following the modal value of the 50
clustering results, in the three cases. Evaluation of the distribution
of RP genes into 3 to 5 classes indicated that the most efficient
class number is four. Only the results of the 4-means clustering are
depicted here.
Regulation of RP Gene Expression in Arabidopsis
PLoS ONE | www.plosone.org 9 December 2011 | Volume 6 | Issue 12 | e28070
Clustering of Affymetrix experimentsHybridizations results using Affymetrix technology were
analyzed by using genevestigator software [18]. Clustering tree
of RP genes has been done using Pearson distance calculation.
Online softwareBlast against A. thaliana genome have been proceed using TAIR
resource [20], (http://www.arabidopsis.org/). Phylogenic trees
have been reconstructed automatically by using Phylogeny.fr
pipeline with the ‘‘one click’’ mode [21], (http://www.phylogeny.
fr/). SUBA software has been used to give a prediction of cellular
targeting of the RP [22], (http://www.suba.bcs.uwa.edu.au). The
characterization of promoter motifs has been done using MEME
and FIMO softwares [32], (http://meme.sdsc.edu/meme4_4_0/
intro.html). Representation of correlation between gene expression
was generated using open-source Cytoscape software [31], (http://
www.cytoscape.org/).
Supporting Information
Table S1 Full list of RP genes in Arabidopsis thaliana. Description:
For each gene, the gene reference number (AGI), the common
name, the CATMA ID corresponding probe, the Affymetrix ID
corresponding probe, the predicted localization of the encoded
protein and the predicted eukaryote or prokaryote phylogenic
origin are indicated.
(PDF)
Table S2 Clustering of transcriptional response to biotic and
abiotic stress of genes coding for RP in the CATMA microarray
database.
(XLS)
Table S3 List of 46 nuclear genes coding for chloroplast
proteins. Description: Gene reference number (AGI), gene
description and CATMA ID corresponding probe are provided
for each gene.
(PDF)
Table S4 List of 29 plastidic genes coding for chloroplastic
proteins. Gene reference number (AGI), protein short name and
CATMA ID corresponding probe are provided for each gene.
(PDF)
Table S5 List of CATMA experiment.
(PDF)
Table S6 List of RP genes coding for mitoRP. Are provided
gene reference number (AGI), and common gene names,
alternative gene name are provided when it exist. Corresponding
ID in CATMA and Affymetrix dataset are listed. Bibliographic
Figure 8. Model of ribosome regulation by stress in plants. A. Ribosomal protein fluxes in cell of plant growing in normal condition. From thenuclear RP genes, three fluxes lead to form ribosomes and to assure high protein synthesis into the cytoplasm, mitochondrions and plastids. Thediversity of cytoRP forms allows the cell to produce numerous complexes giving possibilities to produce specialized ribosomes with specializedtranslational activies. B. In stress condition, cell keeps only class1 RP fluxes which decrease level of translation in cytoplasm and sustains translation inmitochondrions. Cytoplasmic translational activity could be affected globally or only on a subset of mRNA. For stress affecting also plastids, cellsdramatically reduce plastoRP synthesis affecting their translational activity.doi:10.1371/journal.pone.0028070.g008
Regulation of RP Gene Expression in Arabidopsis
PLoS ONE | www.plosone.org 10 December 2011 | Volume 6 | Issue 12 | e28070
evidences have been reported in the two last columns (corre-
sponding citation number in Table S1).
(PDF)
Table S7 List of RP genes coding for plastoRP. Are provided
gene reference number (AGI), and common gene names,
alternative gene name are also provided when it exist. PSRP are
plastid-specific RP. Corresponding ID in CATMA and Affymetrix
dataset are also listed. Bibliographic localization evidences have
been also summarized in the two last columns (corresponding
citation number in Table S1).
(PDF)
Acknowledgments
We thank Dr Christian Meyer (IJPB, UMR1318 INRA Versailles, France)
for helpful discussion and critical comments on the manuscript.
Author Contributions
Conceived and designed the experiments: FC. Performed the experiments:
FC RS. Analyzed the data: FC RS. Contributed reagents/materials/analysis
tools: FC RS CM-D FD-V. Wrote the paper: FC RS CM-D FD-V.
References
1. Warner JR (1999) The economics of ribosome biosynthesis in yeast. Trends in
Biochemical Sciences 24: 437–440.
2. McIntosh KB, Bonham-Smith PC (2006) Ribosomal protein gene regulation:what about plants? Canadian Journal of Botany 84: 342–362.
3. Barakat A, Szick-Miranda K, Chang I-F, Guyot R, Blanc G, et al. (2001) The
Organization of Cytoplasmic Ribosomal Protein Genes in the ArabidopsisGenome. Plant Physiol 127: 398–415.
4. Chang I-F, Szick-Miranda K, Pan S, Bailey-Serres J (2005) Proteomic
Characterization of Evolutionarily Conserved and Variable Proteins ofArabidopsis Cytosolic Ribosomes. Plant Physiol 137: 848–862.
5. Creff A, Sormani R, Desnos T (2010) The two Arabidopsis RPS6 genes,
encoding for cytoplasmic ribosomal proteins S6, are functionally equivalent.Plant Molecular Biology 73(4–5): 533–546.
6. Degenhardt RF, Bonham-Smith PC (2008) Arabidopsis Ribosomal Proteins
RPL23aA and RPL23aB Are Differentially Targeted to the Nucleolus and AreDisparately Required for Normal Development. Plant Physiol 147: 128–142.
7. Byrne ME (2009) A role for the ribosome in development. Trends in Plant
Science 14: 512–519.
8. Adams KL, Palmer JD (2003) Evolution of mitochondrial gene content: gene lossand transfer to the nucleus. Molecular Phylogenetics and Evolution 29: 380–395.
9. Wittmann HG (1982) Components of bacterial ribosomes. Annual Review ofBiochemistry 51: 155–183.
10. Bonen L, Calixte S (2006) Comparative Analysis of Bacterial-Origin Genes for
Plant Mitochondrial Ribosomal Proteins. Mol Biol Evol 23: 701–712.
11. Yamaguchi K, Subramanian AR (2000) The Plastid Ribosomal Proteins.Identification of all the proteins in the 50 S subunit of an organelle ribosome
(chloroplast). Journal of Biological Chemistry 275: 28466–28482.
12. Yamaguchi K, von Knoblauch K, Subramanian AR (2000) The PlastidRibosomal Proteins. Identification of all the proteins in the 30 S subunit of an
organelle ribosome (chloroplast). Journal of Biological Chemistry 275:28455–28465.
13. Yamaguchi K, Subramanian AR (2003) Proteomic identification of all plastid-
specific ribosomal proteins in higher plant chloroplast 30S ribosomal subunit.European Journal of Biochemistry 270: 190–205.
14. Beligni MV, Yamaguchi K, Mayfield SP (2004) Chloroplast Elongation Factor
Ts Pro-Protein Is an Evolutionarily Conserved Fusion with the S1 Domain-Containing Plastid-Specific Ribosomal Protein-7. Plant Cell 16: 3357–3369.
15. Mollier P, Hoffmann B, Debast C, Small I (2002) The gene encoding
Arabidopsis thaliana mitochondrial ribosomal protein S13 is a recent duplicationof the gene encoding plastid S13. Current Genetics 40: 405–409.
16. Whittle CA, Krochko JE (2009) Transcript Profiling Provides Evidence of
Functional Divergence and Expression Networks among Ribosomal ProteinGene Paralogs in Brassica napus. Plant Cell 21: 2203–2219.
17. Sclep G, Allemeersch J, Liechti R, De Meyer B, Beynon J, et al. (2007) CATMA,
a comprehensive genome-scale resource for silencing and transcript profiling ofArabidopsis genes. BMC Bioinformatics 8: 400.
18. Hruz T, Laule O, Szabo G, Wessendorp F, Bleuler S, et al. (2008)
Genevestigator V3: A Reference Expression Database for the Meta-Analysisof Transcriptomes. Advances in Bioinformatics. doi:10.1155/2008/420747.
19. Carroll AJ, Heazlewood JL, Ito J, Millar AH (2008) Analysis of the Arabidopsis
Cytosolic Ribosome Proteome Provides Detailed Insights into Its Componentsand Their Post-translational Modification. Mol Cell Proteomics 7: 347–369.
20. Swarbreck D, Wilks C, Lamesch P, Berardini TZ, Garcia-Hernandez M, et al.
(2008) The Arabidopsis Information Resource (TAIR): gene structure andfunction annotation. Nucl Acids Res 36: D1009–1014.
21. Dereeper A, Guignon V, Blanc G, Audic S, Buffet S, et al. (2008) Phylogeny.fr:
robust phylogenetic analysis for the non-specialist. Nucl Acids Res 36:W465–469.
22. Heazlewood JL, Verboom RE, Tonti-Filippini J, Small I, Millar AH (2007)
SUBA: the Arabidopsis Subcellular Database. Nucl Acids Res 35: D213–218.23. Kleffmann T, Russenberger D, von Zychlinski A, Christopher W, Sjolander K,
et al. (2004) The Arabidopsis thaliana Chloroplast Proteome Reveals Pathway
Abundance and Novel Protein Functions. Current Biology 14: 354–362.24. Peltier J-B, Cai Y, Sun Q, Zabrouskov V, Giacomelli L, et al. (2006) The
Oligomeric Stromal Proteome of Arabidopsis thaliana Chloroplasts. Mol Cell
Proteomics 5: 114–133.
25. Peltier J-B, Emanuelsson O, Kalume DE, Ytterberg J, Friso G, et al. (2002)Central Functions of the Lumenal and Peripheral Thylakoid Proteome of
Arabidopsis Determined by Experimentation and Genome-Wide Prediction.
Plant Cell 14: 211–236.
26. Alexandersson E, Saalbach G, Larsson C, Kjellbom P (2004) Arabidopsis
Plasma Membrane Proteomics Identifies Components of Transport, Signal
Transduction and Membrane Trafficking. Plant Cell Physiol 45: 1543–1556.
27. Benschop JJ, Mohammed S, O’Flaherty M, Heck AJR, Slijper M, et al. (2007)
Quantitative Phosphoproteomics of Early Elicitor Signaling in Arabidopsis. MolCell Proteomics 6: 1198–1214.
28. Heazlewood JL, Tonti-Filippini JS, Gout AM, Day DA, Whelan J, et al. (2004)
Experimental Analysis of the Arabidopsis Mitochondrial Proteome HighlightsSignaling and Regulatory Components, Provides Assessment of Targeting
Prediction Programs, and Indicates Plant-Specific Mitochondrial Proteins. Plant
Cell 16: 241–256.
29. Zybailov B, Rutschow H, Friso G, Rudella A, Emanuelsson O, et al. (2008)
Sorting Signals, N-Terminal Modifications and Abundance of the ChloroplastProteome. PLoS ONE 3: e1994.
30. Thomas F, Kutay U (2003) Biogenesis and nuclear export of ribosomal subunits
in higher eukaryotes depend on the CRM1 export pathway. Journal of CellScience 116: 2409–2419.
31. Shannon P, Markiel A, Ozier O, Baliga NS, Wang JT, et al. (2003) Cytoscape: ASoftware Environment for Integrated Models of Biomolecular Interaction
Networks. Genome Research 13: 2498–2504.
32. Bailey TL, Boden M, Buske FA, Frith M, Grant CE, et al. (2009) MEMESUITE: tools for motif discovery and searching. Nucl Acids Res 37: W202–208.
33. Kosugi S, Suzuka I, Ohashi Y (1995) Two of three promoter elements identified
in a rice gene for proliferating cell nuclear antigen are essential for meristematictissue-specific expression. The Plant Journal 7: 877–886.
34. Thompson MD, Jacks CM, Lenvik TR, Gantt JS (1992) Characterization ofrps17, rpl9 and rpl15: three nucleus-encoded plastid ribosomal protein genes.
Plant Molecular Biology 18: 931–944.
35. Lenvik TR, Key JL, Gantt JS (1994) Ribosomal Protein S11 Genes fromArabidopsis and Soybean. Plant Physiol 105: 1027–1028.
36. Tremousaygue D, Garnier L, Bardet C, Dabos P, Herve C, et al. (2003) Internaltelomeric repeats and ‘TCP domain’ protein-binding sites co-operate to regulate
gene expression in Arabidopsis thaliana cycling cells. The Plant Journal 33:
957–966.
37. Tremousaygue D, Manevski A, Bardet C, Lescure N, Lescure B (1999) Plant
interstitial telomere motifs participate in the control of gene expression in root
meristems. The Plant Journal 20: 553–561.
38. Regad F, Herve C, Marinx O, Bergounioux C, Tremousaygue D, et al. (1995)
The tef1 box, a ubiquitous cis-acting element involved in the activation of plantgenes that are highly expressed in cycling cells. Mol Gen Gent 248: 703–711.
39. Herve C, Dabos P, Bardet C, Jauneau A, Auriac MC, et al. (2009) In Vivo
Interference with AtTCP20 Function Induces Severe Plant Growth Alterationsand Deregulates the Expression of Many Genes Important for Development.
Plant Physiol 149: 1462–1477.
40. Komili S, Farny NG, Roth FP, Silver PA (2007) Functional Specificity amongRibosomal Proteins Regulates Gene Expression. Cell 131: 557–571.
41. Giavalisco P, Wilson D, Kreitler T, Lehrach H, Klose J, et al. (2005) Highheterogeneity within the ribosomal proteins of the Arabidopsis thaliana 80S
ribosome. Plant Molecular Biology 57: 577–591.
42. Horiguchi G, Molla-Morales A, Perez-Perez JM, Kojima K, Robles P, et al.(2011) Differential contributions of ribosomal protein genes to Arabidopsis
thaliana leaf development. The Plant Journal 65: 724–736.
43. Richly E, Dietzmann A, Biehl A, Kurth J, Laloi C, et al. (2003) Covariations in
the nuclear chloroplast transcriptome reveal a regulatory master-switch. EMBO
reports 4: 491–498.
44. Lange H, Sement FM, Canaday J, Gagliardi D (2009) Polyadenylation-assisted
RNA degradation processes in plants. Trends in Plant Science 14: 497–504.
45. Welchen E, Gonzalez DH (2006) Overrepresentation of Elements Recognizedby TCP-Domain Transcription Factors in the Upstream Regions of Nuclear
Genes Encoding Components of the Mitochondrial Oxidative PhosphorylationMachinery. Plant Physiology 141: 540–545.
Regulation of RP Gene Expression in Arabidopsis
PLoS ONE | www.plosone.org 11 December 2011 | Volume 6 | Issue 12 | e28070
46. Kawaguchi R, Girke T, Bray EA, Bailey-Serres J (2004) Differential mRNA
translation contributes to gene regulation under non-stress and dehydration
stress conditions in Arabidopsis thaliana. The Plant Journal 38: 823–839.
47. Kawaguchi R, Bailey-Serres J (2005) mRNA sequence features that contribute to
translational regulation in Arabidopsis. Nucleic Acids Research 33: 955–965.
48. Matsuura H, Kiyotaka U, Ishibashi Y, Kubo Y, Yamaguchi M, et al. (2010) A
Short Period of Mannitol Stress but Not LiCl Stress Led to Global Translational
Repression in Plants. Bioscience, Biotechnology, and Biochemistry 74:
2110–2112.
49. Sormani R, Delannoy E, Lageix S, Bitton F, Lanet E, et al. (2011) Sub-Lethal
Cadmium Intoxication In Arabidopsis thaliana Impacts Translation At MultipleLevels. Plant and Cell Physiology 52(2): 436–447.
50. Nishimura T, Wada T, Yamamoto KT, Okada K (2005) The Arabidopsis STV1
Protein, Responsible for Translation Reinitiation, Is Required for Auxin-Mediated Gynoecium Patterning. Plant Cell 17: 2940–2953.
51. Imai A, Komura M, Kawano E, Kuwashiro Y, Takahashi T (2008) A semi-dominant mutation in the ribosomal protein L10 gene suppresses the dwarf
phenotype of the acl5 mutant in Arabidopsis thaliana. The Plant Journal 56:
881–890.
Regulation of RP Gene Expression in Arabidopsis
PLoS ONE | www.plosone.org 12 December 2011 | Volume 6 | Issue 12 | e28070