Embed Size (px)
Citation preview

J. Mol. Biol. (1981) 152, 535-552
Transcription of the his3 Gene Region in Sacchuromyces cerevisiae
KEVIN STRUHI,~ AND RONALD W. DAVIS
Department of Biochemistry Stanford University School of Medicine
Stanford, Calif. 94305, U.S.A.
(Received 27 February 1981)
In exponentially growing cells of the yeast Saccharemyces cerevisiae, approximately S.5qb of a 10.1 x lo3 base region of DNA that includes the his3 gene is transcribed into discrete messenger RNA species, These species map at five or six non- overlapping regions on the cloned DNA, and presumably represent the transcriptional products of five or six genes. The spacing between the RNA coding regions ranges between 300 and 600 base-pairs. The steady-state levels of these RNAs average about one to three molecules per cell. Under a condition in which a yeast strain carrying the rnal-tsl mutation accumulates transfer RNA precursors and fails to transport RNA from the nucleus to the cytoplasm, the mRNA species homologous to this 10.1 x lo3 base region appear unaltered in size.
The smallest mRNA species (67 x IO3 bases in length) maps to the same location as the his3 gene determined by complementation patterns in yeast and in Escherichia coli of physically defined derivatives of the cloned his3 gene. The 5’-end of this transcript maps within 50 base-pairs of the sequence that is recognized as a promoter necessary for his3 expression in E. coli. Si nuclease mapping of this transcript strongly suggests that the his3 gene does not contain intervening sequences, The steady-state level of the his3 mRNA is about ten times higher in cells starved of histidine; the levels of the other mRNA species are unaffected by this physiological condition.
1. Introduction
We have chosen the Sacchuromyces cerevisiae (bakers’ yeast) as a model system for eukaryotic gene expression, The ability to transform yeast cells with cloned DNA (Hinnen et al., 1978) and the development of vectors useful for a wide variety of molecular genetic manipulations (Struhl et al., 1979) allows a detailed study of gene expression in vivo. A physical and genetic map of the his3 region has been obtained with the use of deletion mutants of a /\hid hybrid phage (Struhl & Davis, 1980). The cloned his3 gene functions both in Escherichia coli and yeast cells (Struhl et al.,
1976,1979; Hinnen et al., 1978). Thus, it is of interest to compare expression of this gene in a prokaryotic organism to expression in its native eukaryotic host. Previous genetic and physiological experiments have concerned the expression of his3 in E. coli (Struhl et al., 1980; Struhl & Davis, 1980; Brennan & Struhl, 1980).
t Present address: Department of Biological Chemistry, Harvard Medical School, 25 Shattuck St.. Boston. Mass. 02115, C.S.A.
535 0022-2836/81/310535-18 $02.00/O 0 1981 Academic Press Inc. (London) Ltd.
536 K. STRUHL AND R. R. DAVIS
In this paper. the original cloned hisd-containing DNA fragment and derivatives of it are used as nucleic acid hybridization probes for transcript,ional product,s homologous to this region. The location and orientation of the his3 and adjacent, transcripts are determined by using a variety of t,echniyues. In addition, we examine h,is3 regulation by measuring the steady-state level of the his3 messenger RNA under different physiological condit,ions.
2. Materials and Methods
(a) Phage, bacterial and yeast strains and their propagation
Methods for the growth of phage and bacterial strains used in this work have been described (Struhl & Davis, 1980). The wild-type yeast strain, S288C, was grown at 30°C either in YPD medium (1Yh (w/v) yeast extract’, 24; (w/v) peptone, 2% (w/v) glucose) or in standard minimal medium (0.67% (w/v) Difco yeast nitrogen base without amino acids, 2“+, glucose). When aminotriazole was added to the medium, the final concentration was 10 mM. The mutant, yeast strain b1304 (ah mal-l/rn.al-1 GI1L’) (Bossinger Bt Cooper, 1976) was obtained from John Abelson. This strain was grown at 23°C because the ma1 allele prevents growth at 37°C (herein defined as t,he restrictive temperature).
The co-ordinate scale and restriction endonuclease cleavage map for the 10.1 kbt h,iad- containing EcnRI DNA fragment, has been defined (Struhl & Davis, 1980). Plasmid and A hybrid DNA molecules containing various sub-regions of this original fragment were characterized and prepared as before (St.ruhl & Davis, 1980).
DNA fragments are purified from agarose geIs in the following manner. The gel slice is dissolved at 42°C in 5 vol. of a filtered solution cont,aining 6 M-sodium perchlorate, 30 mM- sodium phosphate (pH 7.0). This mixture is loaded on a column of hydroxylapatite (Bio-Rad : HTP) equilibrated with 6 M-sodium perchlorate. Very little resin is needed (50 to 109 pg is generally sufficient) and it is important that the particles be coarse, otherwise the column will flow very slowly. After the sample is loaded, the column is washed with 20 to 30 column volumes of 30 mM-sodium phosphate (pH 7.0). The DNA is eluted with 5 to 10 column volumes of 0.5 M-sodium phosphate (pH 7.0). dialyzed extensively against 10 mM-Tris (pH 7.5) 1 mM-EDTA, 0.3 M-NaCl, and concentrated by precipitation with ethanol. DNA (as large as 30 kb) is recovered in at least 5Oc+, yield and is of high enough quality to permit essentially any enzyme reaction.
(c) RX/l Crolation
Wild-type yeast cells were grown until the absorbance at 600 nm was 2-O (exponential phase). The cells were concentrated IO-fold by centrifugation for 1 min at room temperature and resuspended in 50 mM-potassium phosphate (pH 7.5), 095 M-sorbitol, 14mM-2- mercaptoethanol, and 3 units lyticase/original ml of culture (Scott & Schekman, 1979). After 2 to 3 min at 3O”C, sodium dodecyl sulfate and diethylpyrocarbonate were added to loj,. An equal volume of phenol/chloroform/isoamyl alcohol (24 : 24 : 1, by vol.) was immediately added and the resulting mixture mixed vigorously. Total nucleic acid was prepared by 2 phenol/chloroform extractions, 2 ether extractions, and a precipitation with ethanol. For relatively large-scale RNA preparations (greater than 100 ml), the procedures were performed in 50 ml screw cap plastic tubes (Corning). For small preparations (I to 5 ml), the steps were performed in I-5 ml Eppendorf microfuge tubes. This procedure minimizes the time from growing culture to cellular lysis and prevents significant RNA degradation. Typically 20 mg of total nucleic acid is obtained from 1 1 of yeast; 99oi, of this nucleic acid is RNA.
t Abbreviations used : kb, 103 bases or base-pairs, as appropriate; cDNA, complementary DNA.
TRANKCRIPTIOit OF THE hi.r<? GENE REGIOS 53 7
Poly(A)-containing RNA was isolated by loading the total nucleic acid (in 67 M-NaCI. 10 mM-EDTA, I”/, sodium dodecyl sulfate) on a column of pcJy(U)-Sepherose (Pharmacia). The column was washed .exhaustively with 05 M-NaCl, 10 mM-EDTA, and the poly(A)- containing RNA was eluted in water. The poly(A)+ fraction represents 1 to 2y; of the total nucleic acid and is 50 to SOO/A pure with respect to ribosomal RNA contaminants.
For experiments using M304 (carrying the mal-tsl mutation), the RNA isolation procedure was somewhat different. Osmotically stabilized spheroplasts capable of normal RNA metabolism were prepared from cells grown at 23°C in l’b yeast extract, 2% peptone, 2YA galactose (Hutchinson & Hartwell, 1967). The culture of spheroplasts was split: half was shifted to 37°C (the restrictive temperature) and half remained at 23°C. At various times after the split, total nucleic acid was prepared as described above.
(d) Hybridization procedwes
3213-labeled hybridization probes were prepared as follows. DNA complementary to yeast, poly(A)-containing RNA (cDNA) was synthesized using reverse transcriptase. A 20~1 reaction mixture containing 1 pg RNA, 02 pg oligonucleotides about 6 to 12 bases in length (prepared by DNAase I digestion of calf thymus DNA and obtained from M. Wolfner). 100 pg act,inomycin D/ml, 40 PCi 32P-1abeled deoxy-GTP (about 400 Ci/mmol), and 100 pM-
unlabeled deoxy-ATP, TTP, and CTP in standard buffer conditions was incubated with an empirically determined quantity of enzyme for 40 min at 37°C. The reaction was terminated by addition to 62 M-NaGH, 40 mM-EDTA, I”/0 sodium dodecyl sulfate containing 50 pg of salmon sperm DNA. The cDNA probe was separated from unincorporated triphosphate precursors by using a Sephadex G50 column. Nick-translated DNA probes were prepared as described (Struhl & Davis, 1980).
Hybridization of labeled probes to nitrocellulose paper containing electrophoreticaflg separated DNA was performed as described (Struhl & Davis, 1980). Hybridization to electrophoretically separated RNA was performed by using the following modifications to the procedure of Alwine et al. (1977). RNA was incubated at 50°C in 507; dimethyl sulphoxide, 1 M-glyoxal, and 10 mM-sodium phosphate (pH 7.0) (McMaster & Carmichal, 1977). RNA was separated in a 1.7?; (w/v) agarose gel buffered with lOmM-sodium phosphate (pH 7). The transfer of this RNA to diazotized paper was performed as described except that the washing solution was 61 M-sodium acetate (pH 4). Hybridization procedures were performed as described above.
All the experiments in this paper involving poly(A)-containing RNA from strain S288C (wild-type) used the identical preparation of RNA. The RNA-bound strips of diazotized paper are reusable. 32P-labeled hybridized nucleic acid can be removed by washing the st,rips for 4 h at 65°C in 99% (v/v) f ormamide and 1% sodium dodecyl sulfate (several changes). Remaining 3zP label on t~he paper, if detectable, will eventually decay, The strips are stable for at. least I year.
(e) S, n&ease mpping
A 50.~1 reaction containing 20 pg of poly(A) RNA and 1 pg of BumHI-cleaved hgt4Sc2601 DNA were incubated for 5 min at 70°C (to denature the DNA) and then for 4 h at 54°C in 7004 formamide (recrystallized), 0.3 M-NaCl, 0.1 M-PIPES (pH 7.2) 1 mM-EDTA. Then 9 vol. S, nuclease buffer containing 15 pg of boiled Myxococcus .runthus DNA and an empirically determined quantity of S1 nuclease were added and the S,-resistant nucleic acid was isolated after 30 min of treatment as described (Struhl & Davis, 1980). This nucleic acid was denatured in alkali, electrophoretically separated in a 1.5?; alkaline agarose gel (30 mM- NaOH, 2 mmEDTA), transferred to nitrocellulose, and challenged for hybridization with a 32P-labeled probe of pBR322Sc2676 DNA.
,538 K. STRUHL AND R. W. DAVIS
3. Results
(a) Nost of a 10.1 lcb his3-containing DNA .fragment ia transcribed in yeast cells
The hi.s3 gene was originally isolated as a IO.1 kb DNA fragment, generated by EcoRI endonuclease cleavage (St’ruhl et al.. 1976). Using restrict’ion endonuclease cleavage sites as markers. a physical map of Sc2601 DNA was obtained (Struhl & Davis, 1980). In addition, this region was physically fractionated by subcloning various segment’s of 8~2601 DNA and by isolating deletion mutants of hgt4-Sc2601, The mapping positions of the subcloned fragments and of the deletion endpoints were determined wit,h respect t’o the restrict’ion endonuclease cleavage sites (Struhl Rr Davis, 1980).
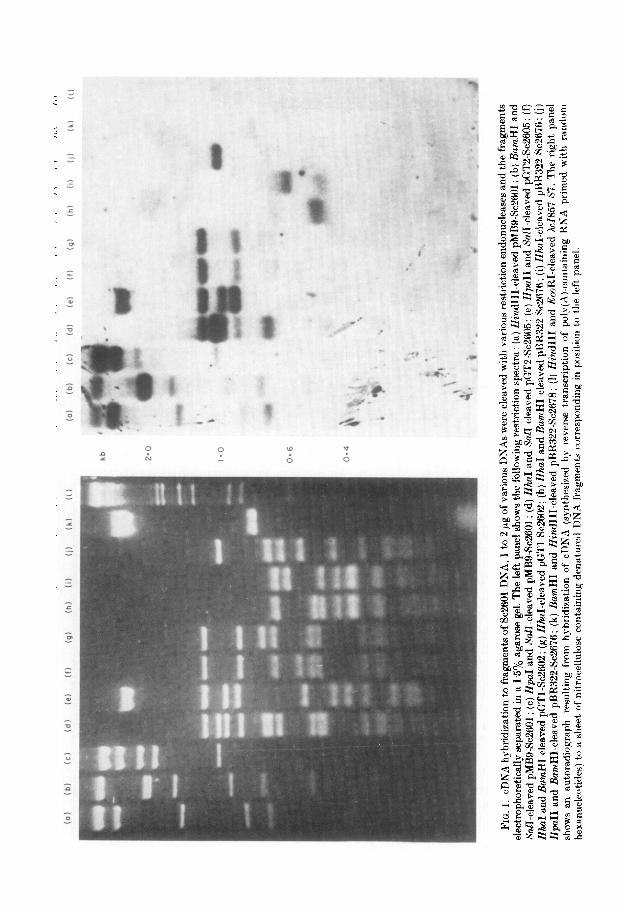
To determine which regions of Sc2601 DNL4 are transcribed. a large number of D,I’A fragments representing different regions of Se2601 were individually challenged for hybridization with a 32P-labeled probe representing sequences complementary to poly(A-containing RNA isolated from an exponentially growing cuhure of yeast cells. The DNA fragments were generated by cleavage of pMB9Sc2601 DNA and some of its derivatives with a variety of restriction endonucleases. These DNA fragments were separated by agarose gel electrophoresis to produce the restriction spectra shown in Figure 1. Following denaturation in alkali, these DNA fragments were transferred in situ to a sheet of cellulose nitrate paper by a modification of the technique of Southern (1975). The hybridization probe was synthesized in vitro as DNA complementary to total poly(A)-containing RNA by using reverse transcriptase. The RNA was primed for this complementary DNA synthesis by random oligonucleotides (6 to 10 nucleotides in length). cDNL4 made in this manner should provide an accurate representation of the sequences present in the poly(A)-containing RNA (St’. qJohn & Davis, 1979). Though sequences homologous to Sc2601 DNA represent only a small percentage of the total cDNA synthesized (roughly 0.1%). they are detectable by hybridization to the fragments of denatured Se2601 DNL4. The 9~2601 DNA fragments immobilized on the filter are unique in the yeast genome (Struhl & Davis, 1977) and are present in a J06-fold molar excess over the cDNA in the hybridization probe. Therefore, the relative abundance of any particular transcribed. sequence should be directly proportional to the relative hybridization intensity. However, fragments with more nucleotides of yeast DNA4 may potenCally hybridize to more of the cDNA probe. Therefore. the observed intensity of hybridization must be normalized to t,he number of yeast nucleotides present on t’he particular DNA fragment.
An autoradiograph from this experiment is shown in Figure 1 and the results are indicat)ed in Figure 2. Essentially every segment of Sc2601 DNA but no segment derived solely from pMB9 DNA hybridizes to the cDNA probe. The only exception is a small region located between co-ordinates 7.7 to 8.0. When normalized for sequence complexity. the regions centered between co-ordinates 45 and 6.0. and between 9.5 and 191 appear to code for RNA which is two to four times more abundant than RNA coded by other regions of Sc2601 DNA. These results indicate that most of Sc2601 DNA is transcribed in yeast cells into poly(A)-containing R,NA.
(01
(bl
(cl
(dl
(e)
(f)
(!I)
(h)
(i)
(11
(k)
(II
(0)
(bl
Cc)
Cd)
(e)
(fl
(9)
(hl
(1)
(I)
(k)
(II
0.6
FIG.
1.
cD
NA
hybr
idiza
tion
to
fragm
ents
of
S&60
1 DN
A,
1 to
2
rg
of
vario
us
DNAs
we
re
cleav
ed
with
va
rious
re
strict
ion
endo
nucle
ases
an
d th
e fra
gmen
ts ele
ctrop
hore
ticall
y se
para
ted
in
a 1.5
%
agar
ose
gel.
The
left
pane
l sh
ows
the
follo
wing
re
strict
ion
spec
tra:
(a)
Hind
ID-c
leave
d pM
BSSc
2691
; (b
) Ha
mHI
an
d &W
I-clea
ved
pMB9
-Sc2
601;
(c)
HpaI
an
d Sa
lI-cle
aved
pM
B9Sc
2601
; (d
) Hh
aI an
d &‘
a&cle
aved
pG
T2Sc
2605
; (e
) Hp
ctII
and
%&c
leave
d pG
T2-S
c260
5:
(fl
Hhd
and
Hum
HI-c
leave
d pG
Tl-S
c260
2;
(g)
H&I-c
leave
d pG
Tl-S
c260
2;
(h)
HhaI
and
Ham
HI-c
leave
d pB
R322
Sc26
76;
(i)
HhnI
-clea
ved
pBR3
22-S
c267
6;
(j)
HpaI
I an
d Ba
rnHI
-clea
ved
pBR3
22Sc
2676
; (k)
Ha
mHI
an
d Hi
ndlII-
cleav
ed
pBR3
22Sc
2678
: (I)
Hi
nd11
1 an
d &o
RI-c
leave
d kI8
57
S7.
The
right
pa
nel
show
s an
au
tora
diogr
aph
resu
lting
from
hy
bridi
zatio
n of
cD
NA
(syn
thes
ized
by
reve
rse
trans
cript
ion
of
poly(
A)-c
onta
ining
RN
A pr
imed
wi
th
rand
om
hexa
nucle
otide
s)
to
a sh
eet
of
nitro
cellu
lose
co
ntain
ing
dena
ture
d DN
A fra
gmen
ts co
rresp
ondin
g in
po
sitio
n to
th
e lef
t pa
nel.

540 K. STRUHL AXD R. W. DAVIS
3 2 66.75 14
J
- K
FIG. 2. Transcribed regions of Hc2601 DNA. The co-ordinate system of 6~2601 DNA (in kb units) is defined by Struhl & Davis (1980). Each horizontal line below the co-ordinate scale (ordered as in Fig. 1) indicates the DNA fragments from a particular restriction endonuclease cleavage that hybridize cDNA. Thick lines indicate a relatively high band intensity (not normalized for fragment length): the absence of a line indicates no hybridization.
(b) Mappiny the discrete mRNA transcripts wa &2601 DNA
The previous section indicates which regions of Sc2601 DNA are transcribed into poly(A)-containing RNA. In this section. it is shown that this RNA is organized into discrete transcripts.
The identical preparation of poly(A)-containing RNA used in the previous section was denatured by treatment with glyoxal and subjected to gel electrophoresis in an agarose gel (MeMaster & Carmichal, 1977). The RNA species, fractionated by molecular weight, were transferred in situ to a sheet of diazotized paper by a modification of the procedure of Alwine et at. (1977). After cutting this RNA-paper into five strips, the discrete poly(A)-containing RNA species homologous to specific regions of Sc2601 DNA were identified by separate hybridizations using different 32P-labeled probes (Fig. 3). This experiment yields information complementary to that obtained in the previous section,
There are at least six discrete poly(A)-containing RNA species homologous to Sc2601 DNA (Fig. 4, lane (1)). Though it is not formally proven, we shall assume that. these discrete species represent messenger RNAs. The molecular weigh& of these mRNAs are inversely and exponentially proportional to their relative mobilities from the origin of electrophoresis (MeMaster & Carmichal, 1977). Their actual molecular weights were determined using those of the yeast ribosomal RNA species (1.71 and 3.36 kb) as size standards (Philippsen et al., 1978). The mRNA species encoded by Se2601 DNA are 2*3,1.9, 155, 1*45,1.2 and O-7 kb in length. The bands are of roughly equal intensity with the exception of the 2.3 kb RNA which is about two to four times more intense. It is possible that a given hybridization band may represent more than one discrete mRNA species.
The mapping positions of these mRNA species are determined by determining which particular region of Sc2601 DNA is homologous to a given sized RNA. The
TRANSCRIPTION OF THE his3 GENE REGION 541
2676
2602
F -
G
H -
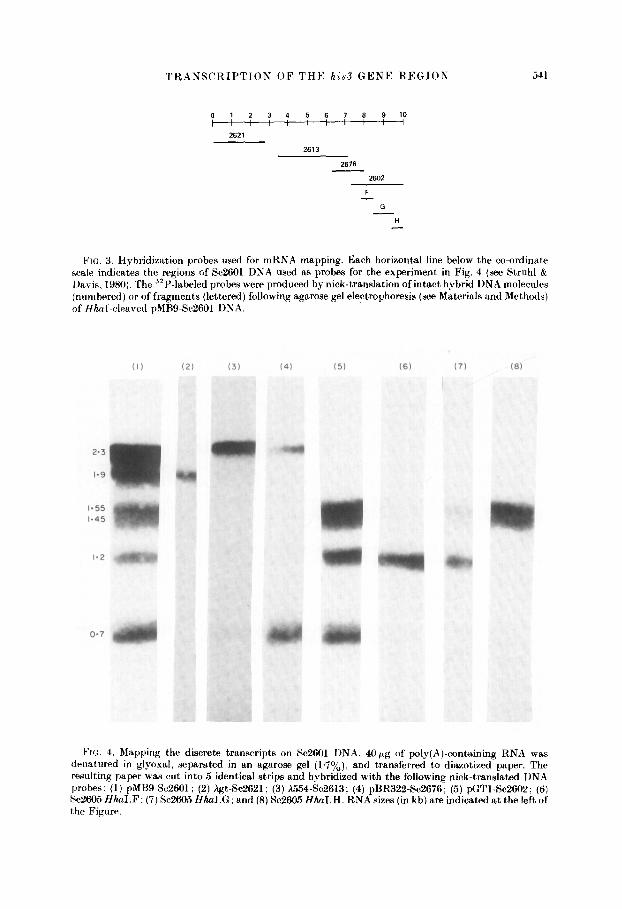
FIG:. 3. Hybridization probes used for mRNA mapping. Each horizontal line below the co-ordinate scale indicates the regions of Sc2601 DNA used as probes for the experiment in Fig. 4 (see Struhl 8: Davis, 1980). The 32P-labeled probes were produced by nick-translation of intact hybrid DNA molecules (numbered) or of fragments (lettered) following agarose gel electrophoresis (see Materials and Methods) of Hhal-cleared pMB9Sc2601 DNA
4) 15) (6) (7) (8)
FIG. 4. Mapping the discrete transcripts on Sc2601 DNA. 4Opg of poly(A)-containing RNA was denatured in glyoxal. separated in an agarose gel (1.7%), and transferred to diazotized paper. The resulting paper was cut into 5 identical strips and hybridized with the following nick-translated DNA probes: (1) pMB9-Sc2601; (2) XgtSc2621; (3) X154-8~2613; (4) pBR322So2676; (5) pGTlSc2602: (6) Sc2605 Hha1.F; (7) Sc2605 Hha1.G; and (8) Sc2605 Hha1.H. RNA sizes (in kb) are indicated at the left of the Figure.
54% K. STRUHL AND R. W. DAVIS
relative intensity of a particular hybridization response depends upon the abundance of the transcript and upon the degree to which the mRNA sequences overlap with the specific probe. By comparing ratios of band intensities obtained with a given probe to the same ratios obtained with the entire Se2601 DNA fragment, it is possible to estimate the amount of overlap between a particular mRKA species and a particular region of DNA. The 32P-labeled hybridization probes were all obtained by nick-translating (Rigby et al.: 1977) various hybrid Dh’A molecules containing defined regions of Se2601 DNA. The locations of these regions are indicated in Figure 3. A collection of autoradiographs is shown in Figure 4.
The approximate map location of a given poly(A)-containing RNA species is based on its molecular weight., the intensities of its hybridization responses to various probes, and the assumption that it contains no or very small intervening sequences. The validity of this assumption is explored in the Discussion. The analysis reported below begins from the leftmost region of Sc2601 DPiA and proceeds rightward.
hgt-Se2621 DNA (co-ordinates 0 to 2.7) hybridizes only to the band corresponding to mRNA(s) 1-9 kb in length (Fig. 4, lane (2)). This sized mRNA also responds very weakly to a hybridization probe of X554Sc2613 DNA (co-ordinates 3.4 to 7.1). This latter probe also hybridizes strongly to a 2.3 kb mRNA and weakly to a 0.7 kb mRNA (Fig. 4, lane (3)). This suggests that the 2.3 kb mRNA is entirely encoded within Sc2613 DNA, and that’ only part of the other mRNAs are so encoded. By comparing the ratios of band intensities as described above, it is estimated that both the 1.9 and the 0.7 kb mRI\;A species share approximately 200 bases of sequence homology with Se2613 DNA. This indicates that there is a 1.9 kb mRNA species mapping between co-ordinates 1.7 and 3.6 and a 0.7 kb mRNA species mapping between co-ordinates 6.9 and 7.6.
The mapping position of the 1.9 kb mRNA accounts for its hybridization to hgt- Sc8621 DNA. However, results presented in the previous section indicate that the leftmost 1.4 kb of 8~2601 DNA (defined by cleavage with Hind111 endonuclease as shown in Fig. 1. lane (a)) is transcribed at roughly the same level as the region bet,ween co-ordinates 1.4 and 4.0 (Fig. 2). Because the only discrete mRNA species detected by hgt-Se2621 DNA is 1.9 kb, it seems likely that the leftmost 1.4 kb of S&601 DNA encodes a 1.9 kb transcript. In other words, it is proposed that the band with a mobility indicating a 1.9 kb transcript actually represents two different mRNA species. Though many eukaryotic mRNAs map in two or more dispersed regions (Berget et ~2.. 1977; Chow et al., 1977), it is unlikely that one 1.9 kb mRNA is encoded both by co-ordinates 0 to 1.4 and 3-1 to 3.6. Figures 1 and 2 clearly indicate that DNA fragments representing co-ordinates 1.7 to 2.5 and 1.6 to 3.0 hybridize equivalent amounts of cDNA. From the data presented: it is impossible to determine the endpoints of this proposed leftmost mRNA species. However, the cDNA hybridization results suggest that most or all of the leftmost 1.4 kb of Se2601 DNA encodes this mRNA. If this 1.9 kb mRNA is entirely encoded by Sc2601 DNA, it would share sequences with the other 1.9 kb mRNA; however, such overlap could be avoided easily by postulating that some of the leftmost mR.?;A is not encoded by Se2601 DKA. Another way to account for the observed

TRASSCRIPTION OF THE his3 GENE REGIOS ,513
results is to propose that RNA homologous to the region between co-ordinates 0 and 1.4 does not exist as a discrete species. This could result from random transcription through the region or by extremely rapid processing. We consider this possibility unlikely especially considering that the led?, argl, urad, trp5 and trpl genes all code for discrete sized mRNA transcripts (data not shown).
Moving further to the right, lane (4) of Figure 4 indicates that pBR322-Se2676 DNA (co-ordinates 6.3 to 8.0) hybridizes normally to t’he 0.7 kb species, relatively weakly to the 2.3 kb species and faintly to the 1.2 kb species. From the band intensities, about 300 bases of the 2.3 kb mRNA and 100 nucleotides of the 1.2 kb mRNA overlaps Sc2676 DNA. Therefore, the mapping co-ordinates of the 2.3 kb mRNA are 4.3 to 6.6 and those of the 1.2 kb species are 7.9 to 9.1. That the 97 kb RNA is entirely encoded by Se2676 DNA is expected from the mapping position determined above. These results are consistent with those obtained by cDNA hybridization, which indicated that the region between co-ordinates 7,7 and 8.0 is not transcribed. Though roughly 100 base-pairs of homology are predicted. it is probably not detectable under the experimental conditions.
The hybridization pattern of pGTlSc2602 DNA indicates that the rightmost 29 kb of Sc2601 DNA (co-ordinates 7.2 to 10.1) encodes four discrete mRNA species (Fig. 4, lane (5)). Hybridization to the 0.7 and the 1.2 kb species was expected from other results. In addition, there is a doublet centered around 1.5 kb. The intensity of hybridization to the 0.7 kb mRNA suggests that about half of its sequences are homologous to pGTlSc2602 DNA ; this confirms the mapping position established previously. Mapping in this region was performed in greater detail by the use of small non-overlapping probes of SC2602 DNA (Fig. 4, lanes (6) to (8)). As expected. the 0.7 kb mRNA does not hybridize to DNA fragments from co-ordinates 7.7 to 10.1. while the 1.2 kb species hybridizes to fragments representing both 7.7 to 8.3 and 8.3 to 9.5. but not 95 to 10.1. The two mRNA species centered around 1.5 kb in length show identical hybridization patterns. They hybridize normally to the region defined by 95 to 10.1, weakly to 8.3 to 9.5, and undetectably to 7.7 to 8.3. Both these mRNA species have one endpoint at co-ordinate 9.4; t.he other probabIy occurs 0.8 kb past the EcoRI site on the cloned Sc2601 DNA fragment,
These results corroborate those obtained by cDNA hybridization. A total of 850, of t’he original cloned Sc2601 DNA fragment is transcribed by exponentially growing yeast cells. All the mRNA species are transcribed at roughly the same level except for the 2.3 kb transcript which is about three times more abundant. The mRNAs (with the possible exception of the adjacent 1.9 kb RNAs) are all encoded by discret,e, non-overlapping regions of Sc2601 DNA, The average spacing between t,ranscripts is about 300 to 400 base-pairs, These results are summarized pictorially in Figure 6.
(c) Direction of mRNA transcription
To determine the direction of transcription for each of the mRNA species, the identical strips of RNA-bound paper used in the previous section, were challenged for hybridization with s2P-labeled probes representing the individual DNA strands of Sc2601 DNA. Such probes were prepared in the following manner. hgt4Sc2601’
544 K. STRUHL AND R. W. DAVIS
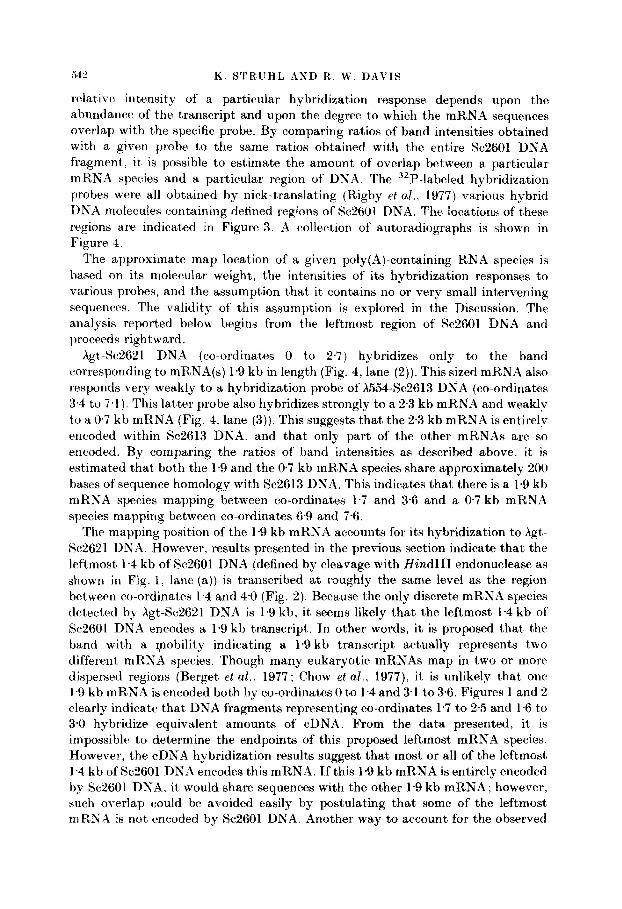
DNA (with the hi&containing fragment in the inverted orientation with respect to Fig. 3) was denatured in alkali, and the resulting single strands separated physically by centrifugation to equilibrium in a CsCl density gradient in the presence of poly(U, G) RXA. Under these conditions, the strand with the highest apparent density (the r strand) is complementary to RNA species representing rightward 5’-3’ transcription on bacteriophage h (Szybalski et al., 1971) ; the less dense strand (I strand) is complementary to leftward transcripts. Using a random collection of oligonucleotides to prime each separated strand, a 32P-labeled probe was synthesized in vitro with DNA polymerase I. The directions of transcription can be assigned by taking into account the facts that (1) only the complementary DNA strand of a given separated strand is copied and thereby 32P-labeled, and (2) the Se2601 DNA fragment is inserted into hgt4 in the opposite orientat’ion from that defining the co-ordinate scale.
The results from this experiment are shown in Figure 5 and included in the map shown in Figure 6. Each discrete transcript hybridizes preferentially (by a factor of 5 to IO) to one of the separated strand DNA probes : that each mRNA species will respond to both probes probably happens because the separated strands are only about 80 to 90% pure. The 2.3 and the 0.7 kb mRNAs are transcribed leftward with respect to 8~2601 DNB while the double at 1.5 kb and the species at 1.2 kb are
FIG. 5. Direction of transcription. 32P-labeled separated strand probes were hybridized to the strips containing poly(A) RNA described in the legend to Fig. 4. 1, indicates leftward transcripts (defined on the normal co-ordinate system) while r indicates rightward transcripts.
TRANSCRIPTION OF THE his3 GENE REGION 545
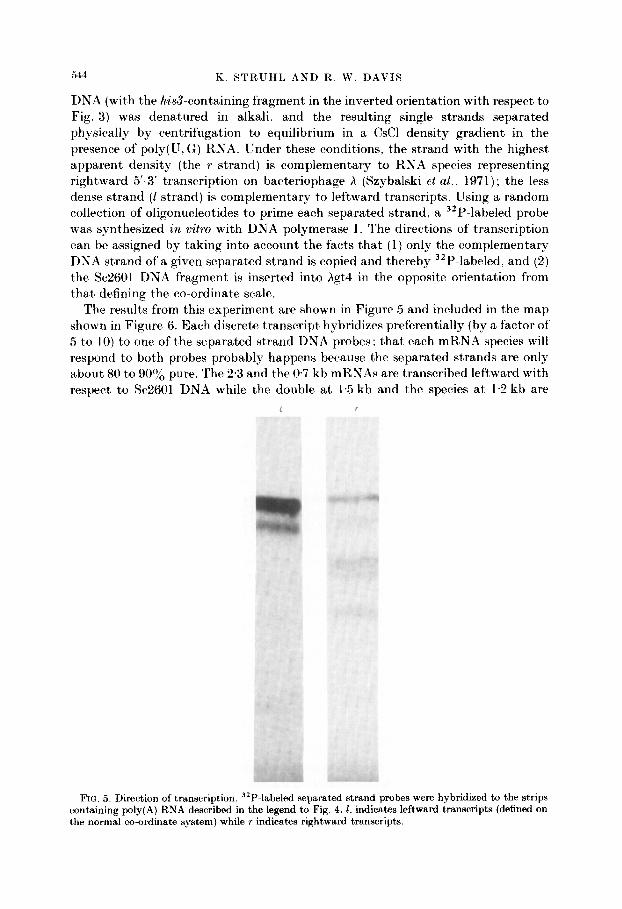
FI(:. 6. mRXA map of SC2601 DNA. The locations, directions of transcription, and relative abundance (thickness of line) for mRNA species encoded by Sc2601 DNA are indicated. See the text for caveats
concerning this map.
transcribed rightward. Though the hybridization pattern to the band at 1.9 kb indicates leftward transcription, the situation is complicated by the fact that this band probably represents two different species. Though it seems likely that both transcripts proceed leftward, it is conceivable that the weak hybridization signal indicating rightward transcription could result from one of these 1.9 kb mRNAs. Consequently, the transcriptional directions for both of these species are not indicated in Figure 6.
(d) Th,e rnal-tsl mutation has no detectable effect on structures of Se2601 -encoded transcripts
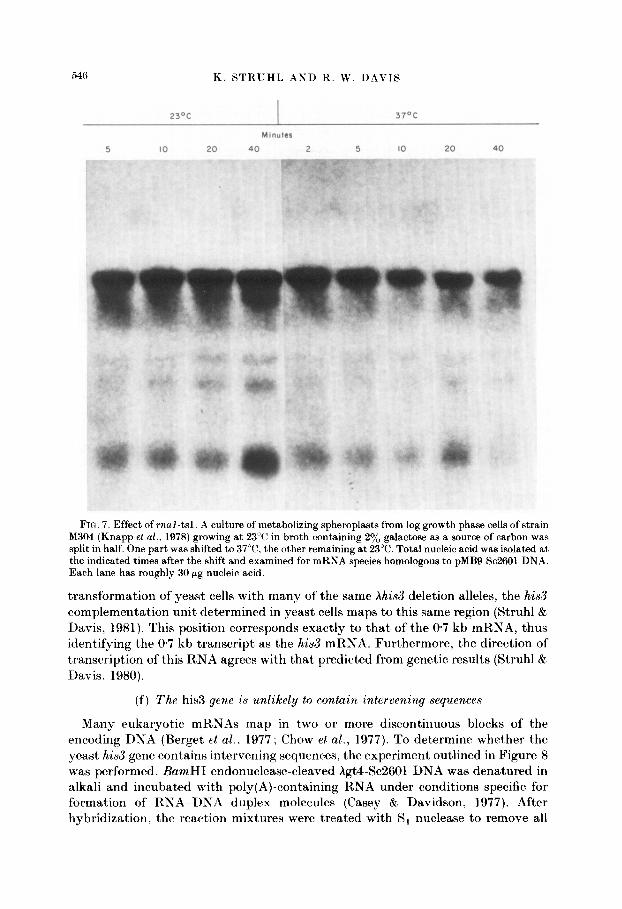
The r.al-tsl mutation prevents yeast cells from growing at 37°C but. not at 23°C. Under the restrictive condition, the bulk of mRNA does not appear to be transported to the cytoplasm (Hutchinson et al., 1969), and transfer RNA genes with intervening sequences accumulate precursors that are not spliced to the mat)ure form (Hopper et al., 1978; Knapp et al.. 1978). To determine the effect of the mal-tsl mutation on mRNA transcription, a culture of metabolizing spheroplasts incubating at 23°C was split such that half was shifted to 37°C and half remained at 23°C. At various times after the shift, total nucleic acid was extracted and examined for the presence of discrete transcripts homologous to Se2601 DNA. The results shown in Figure 7 indicate no detectable qualitative or quantitative difference in the hybridization pattern produced by RNA extracted at various times at either temperature. In addition, the hybridization patterns produced from these total RNA preparations are not distinguishable from those from poly(A)- containing RNA preparations. The banding pattern is observed even after spheroplasts have been incubated at the restrictive temperature for one hour; this indicates that the mRNA species are relatively stable. When the identical RNA- bound paper was probed for gaZl,7,10 (St. John & Davis, 1979) or Tyl (Cameron et al.. 1979) sequences, larger transcripts were easily detected after 30 minutes at the restrictive temperature (T. St. John & R. W. Davis, unpublished results).
(e) The 0.7 kb mRNA maps indistinguishably from the his3 complementation unit
determined by expression in E. coli
The his3 gene was initially located on Sc2601 DNA by determining which of a set of physically defined deletion mutants of a bacteriophage hhis3 hybrid expressed this yeast gene in E. coli (Struhl et al., 1980; Struhl & Davis, 1980). Such a complementation unit was located between co-ordinates 6.9 and 7.6. By
546 K. STRUHL AND R. W. DAVIS
23OC I 37oc
Minutes
5 IO 20 40 2 5 IO 20 40
FIG. 7. Effect of mul-tsl. A culture of metabolizing spheroplasts from log growth phase cells of strain M304 (Knapp et al., 1978) growing at 23°C in broth containing 2% galactose as a source of carbon was
split in half. One part was shifted to 37”C, the other remaining at 23°C. Total nucleic acid was isolated at the indicated times after the shift and examined for mRNA species homologous to pMB9-SC2601 DNA. Each lane has roughly 30 pg nucleic acid.
transformation of yeast cells with many of the same hhisd deletion alleles. the his3
complementation unit determined in yeast cells maps to this same region (Struhl & Davis, 1981). This position corresponds exactly to that of the 0.7 kb mRNA, thus identifying the 0.7 kb transcript as the his3 mRNA. Furthermore, the direction of transcription of this RNA agrees with that predicted from genetic results (Struhl & Davis. 1980).
(f) The his3 gene is unlikely to contain intervening sequences
Many eukaryotic mRNAs map in two or more discontinuous blocks of the encoding DNA (Berget et al., 1977; Chow et aE., 1977). To determine whether the yeast his3 gene contains intervening sequences, the experiment outlined in Figure 8 was performed. BamHI endonuclease-cleaved hgtUc2601 DNA was denatured in alkali and incubated with poly(A)-containing RNA under conditions specific for formation of RNA-DNA duplex molecules (Casey & Davidson, 1977). After hybridization, the reaction mixtures were treated with S, nuclease to remove all
TRANSCRIPTION OF THE his3 GENE REGION ,517
h/S3 R BB B BB R
xgt4-scz6oI~ Sc2676
BumHI cleavage Denature DNA Hybrldlze mRNA
k Gel electrophoresls
hybridize to p’P]pBR322-Sc2676 DNA
No lntervenmg Intervenmg sequence sequence
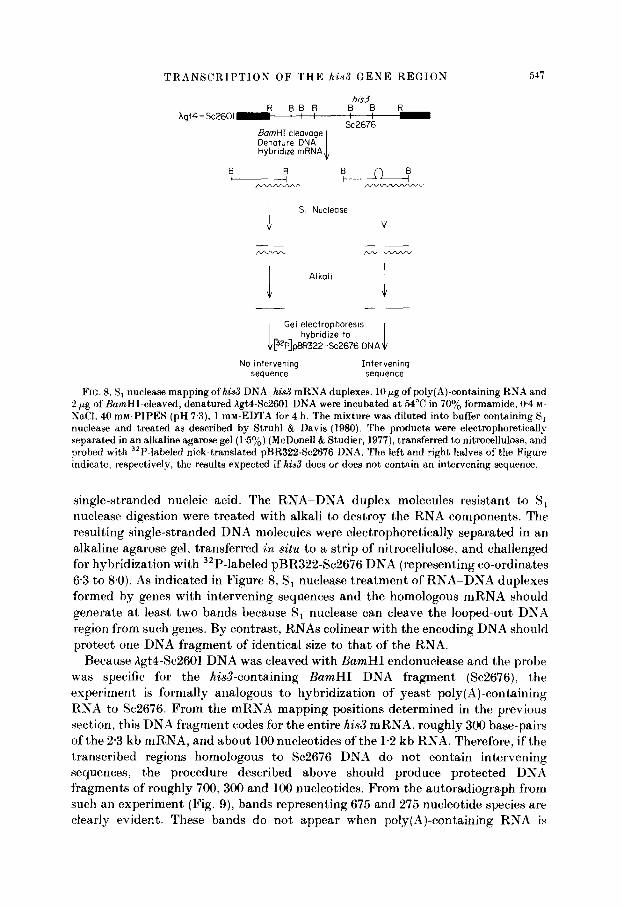
FIG. 8. Si nuclease mapping of his3 DNA-hid mRNA duplexes. 10 pg of poly(A)-containing RNA and 2 rg of BumHI-cleaved, denatured Xgt4Sc2601 DNA were incubated at 54°C in 70% formamide, 94 M-
NaCI, 40 m&r-PIPES (pH 7.3), 1 miu-EDTA for 4 h. The mixture was diluted into buffer containing S, nuclease and treated as described by Struhl & Davis (1980). The products were electrophoretically separated in an alkaline agarose gel (15%) (McDonell & Studier, 1977), transferred to nitrocellulose, and probed with JzP-labeled nick-translated pBR322Sc2676 DNA. The left and right halves of the Figure indicate. respectively, the results expected if his3 does or does not contain an intervening sequence.
single-stranded nucleic acid. The RNA-DNA duplex molecules resistant to K, nuclease digestion were treated with alkali to destroy the RNA components. The resulting single-stranded DNA molecules were electrophoretically separated in an alkaline agarose gel, transferred in situ to a strip of nitrocellulose, and challenged for hybridization with 32P-labeled pBR322Sc2676 DNA (representing co-ordinates 6.3 to 8.0). As indicated in Figure 8, S, nuclease treatment of RNA-DNA duplexes formed by genes with intervening sequences and the homologous mRNA should generate at least two bands because S1 nuclease can cleave the looped-out’ DNA region from such genes. By contrast, RNAs colinear with the encoding DNA should protect one DKA fragment of identical size to that of the RNA.
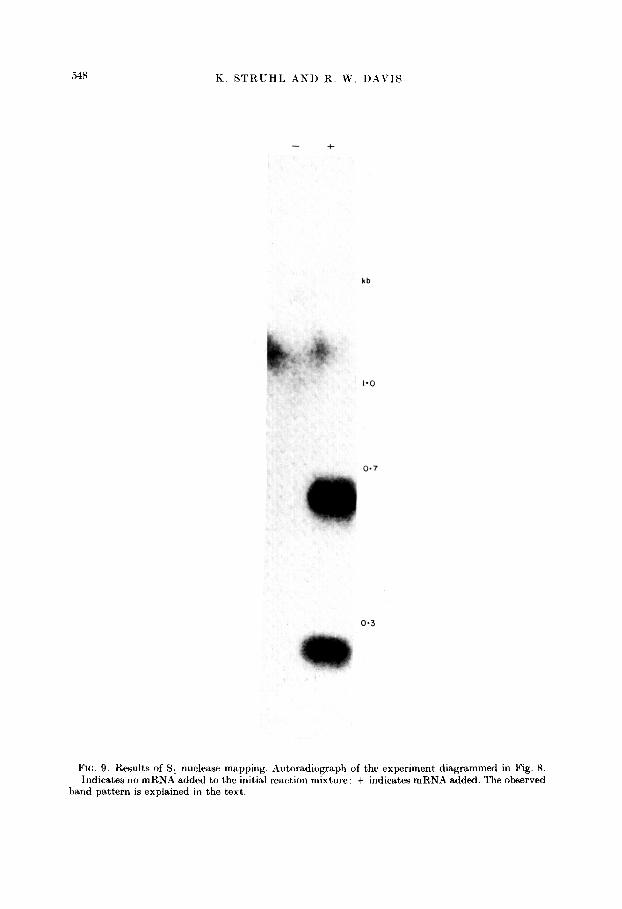
Because hgt4-SC2601 DNA was cleaved with BarnHI endonuclease and the probe was specific for the &d-containing BamHI DNA fragment (Sc2676), the experiment is formally analogous to hybridization of yeast poly(A)-containing RKA to Sc2676. From the mRNA mapping positions determined in the previous section, this DNA fragment codes for the entire his3 mRNA, roughly 300 base-pairs of the 2.3 kb mRNA, and about 100 nucleotides of the 1.2 kb RNA. Therefore, if the transcribed regions homologous to Sc2676 DN4 do not contain intervening sequences, the procedure described above should produce protected DNA fragments of roughly 700, 300 and 100 nucleotides. From the autoradiograph from such an experiment (Fig. 9), bands representing 675 and 275 nucleotide species are ciearIy evident. These bands do not appear when poly(A)-containing RNA is
5-H K. STRUHL AND R. W. DAVIS
- +
kb
0.3
FIG. 9. Results of S, nuclease mapping. Autoradiograph of the experiment diagrammed in Fig. 8. - Indicates no mRNA added to the initial reaction mixture: + indicates mRNA added. The observed band pattern is explained in the text.
TRANSCRIPTION OF THE his3 GENE REGION 549
omitted from the hybridization mixture. The expected band corresponding to the predicted 100 nucleotide species is not observed because its mobility precluded its presence in the gel. The size difference between the 700 base mRNA and the 675 base protected DNA fragment is within experimental error ; in addition, it could be accounted for by the presumed stretch of poly(A) residues at the 3’-end of the RNA. which is probably not encoded by the his3 gene. These results indicate that the his3 mRNA is colinear with the gene. If there is an intervening sequence in hisd, it must be very small (less than 50 base-pairs) and located at the extreme 5’ or 3’.end of the transcript.
(g) H&&dine-starved yeast cells accumulate Jive to ten times the normal amount of his3 mRNA
Aminotriazole is a potent competitive inhibitor of yeast imidazoleglycerol- phosphate dehydratase, the his3 gene product (Klopotowski & Wiater, 1965). =2ddition of aminotriazole to the medium results in temporary cessation of growth due to histidine starvation (Wolfner et al., 1975). This growth inhibition is overcome within a few hours, presumably by increased imidazoleglycerolphosphate dehydratase activity. The levels of many amino acid biosynthetic enzymes are
(I) (21 (3)
his3
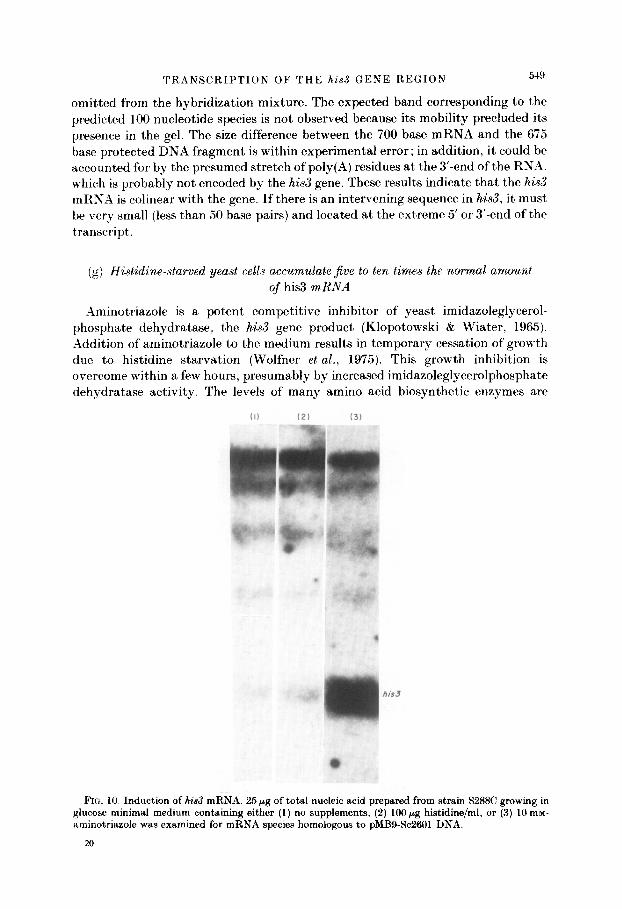
FIG. 10. Induction of his3 mRNA. 25 pg of total nucleic acid prepared from strain S288C growing in glucose minimal medium containing either (1) no supplements, (2) lCtO/.~g histidine/ml, or (3) 10 mM- aminotriazole was examined for mRNA species homologous to pMB9-SC2601 DNA.
20

550 K. STRUHL AND R. W. DAVIS
increased when cells resume growth in the presence of aminotriazole (Wolfner et al., 1975).
Because this physiological condition is likely to reflect directly t’he activity level of the his3 gene product, it was of interest to determine the steady-state level of the his3 mRNA as a function of histidine starvation. Total RNA was extract,ed from yeast cells growing under three different physiological conditions and the transcripts homologous to Sc2601 Dh’A examined by the methods used in the previous sections. From Figure 10, it, is apparent that the transcription pattern of yeast cells growing in glucose minimal medium in t,he presence or in the absence of histidine is identical to that seen when they are grown in rich medium (lanes (I) and (2)). However, addition of aminotriazole to minimal medium results in accumulation of ten times the normal quantity of his3 mRn’A. but normal amounts of the other mKh’A species encoded by Sc2601 DNA (Fig. 10. lane (3)).
4. Discussion
Understanding the molecular mechanisms by which a eukaryotic organism expresses and regulates its genes depends upon the characterization of transcriptional products. In this work. we characterize the RNA transcripts encoded by a 10.1 kb DXU’A fragment containing the yeast his3 gene that are synthesized in growing yeast cells.
Essentially the entire Sc2601 region is transcribed in normally growing yeast cells. This is rather higher than previous estimates of the percentage of the yeast genome that is transcribed; these ranged from 20 to 409; (Hereford & Rosbash, 1977 ; Kaback et al.. 1979). Transcription from the his3 gene region is arranged into at least five and probably six non-overlapping regions on Se2601 DXA. Thus, it is likely that Sc2601 contains coding sequences for five or six different genes. The ambiguity in the number of genes exists because hybridization to a single RNA size class could result from homology to more than one transcript. Though the most likely explanation for the data is that DNA represented by co-ordinates 0 to 4.0 codes for two mRNA species each 1.9 kb in length, it is not conclusive. The Rr\‘A species represented by the doublet at 15 kb in Figure 4 map identically on 8~2601 DNA, t,hough most of the coding regions are probably homologous to the DSA fragment normally adjacent t&o 8~2601 in the yeast genome. Probably, these two mRNAs are transcriptional products of the same gene. Which, if either, of these is translated is unknown. The sequence difference between these RNAs probably occurs past the most 3’.proximal region coded by Sc2601 DNA ; this could be either at t’he 3’.end or in the middle of the RNA. Different RNA species that share almost all of their sequences in common have also been observed in the yeast gal1,7,10 cluster (T. 1’. St. John & R. W. Davis, unpublished results).
L4ll the mRNAs homologous to 8~2601 are expressed at roughly the same level with the exception of the 2.3 kb species. Considering that (1) haploid yeast cells contain approximately equal amounts of DNA and poly(A)-containing RNA, (2) a large fraction of the genome is transcribed, and (3) some mRNA species are more abundant than the majority (Hereford & Rosbash, 1977), it is crudely estimated
TRANSCRIPTION OF THE hiad GENE REGION 561
that yeast, contains an average of about one to two molecules of a typical mRNA species (such as hisd) per cell.
Map positions of the mRNA species were made by assuming that the encoding genes contained small or no intervening sequences. The experiment shown in Figure 9 indicates that this is the case for the his3 gene. This is also suggested b,v correlation of mRNA and polypeptide sizes for the gall, gal7, gall0 and his4 genes (Hopper Br Rowe, 1978: St. John & Davis, 1979; G. R. Fink, personal caommunication). DNA and prot,ein sequences of the yeast iso-l-cytoehrome c (cycl) gene dire+ indicate the absence of intervening sequences within the structural gene (Smith et al., 1979). A general search for yeast genes with intervening sequences greater than 100 base-pairs was unsuccessful (Kaback et al., 1979). Therefore, it is likely that most chromosomal yeast genes do not contain int,ervrning sequences, In this regard, it is interesting that the mal-tsl lesion does not, affect the sizes of the mR,NAs homologous to Sc2601 DNA. At the restrictive t,emperat.ure. this lesion results in the a,ccumulation of tRNA precursors containing int,ervening sequences (Hopper et al.. 1978: Knapp et al., 1978) and the inhibition of m)LiXA transport from the nucleus to the cytoplasm (Hutchinson et al., 1969). This latter phenomenon is not due to rapid cytoplasmic degradation because discrete mRNA species are visible 60 minutes after the temperature shift.
The hid mRXA maps t,o the identical location of the His+ complementation unit determined by his3 expression in E. co/i. In particular, the 5’.end of this mRNA maps less t,han 50 base-pairs from the sequence which, in E. coli. acts as a promoter t,o initiate his3 t.ranscription. This adds support. to the idea that, his3 transcript.ional initiat’ion may share similar features in yeast and in E. ~oli (Struhl & Davis, 1980).
The experiment shown in Figure 10 indicates that the level of his3 mRNA found in yeast cxells varies with the physiological condit’ion. By analogy with a wide variety of examples representing many different organisms. this strongly intimates. but, does not prove, that his3 is regulat,ed at the transcriptional level. For example. the difference in mRN4 levels found for t’he yeast ura3 and the cycl genes can be accounted for by altered rates of RN-A synthesis (Bach et al., 1979: Zitomer et al.. 1979). Condit,ions causing the increased level of his3 mRNA also result in the increased act,ivity levels of many amino acid biosynt,hetic enzymes (Wolfner et al.. 1975): therefore, it seems reasonable that his3 is under the same general control s,vstem as these other related genes. Mutations in at least six genes alter this general control mechanism (G. R. Fink, personal communicat,ion). Four of these are incapable of elevat,ed levels of enzyme activity; they are unable to grow in the presence of aminotriazole. The other two synthesize constitutively high levels of these enzymes and also affect the yeast cell cycle (Wolfner et al., 1975). The likelihood that his3 is under t,ranscriptional regulation suggests that the altered enzyme levels arfs due to increases in the relative levels of the encoding mRSAs. Figure 10 indicates that the levels of the five presumed genes linked to his3 are unchanged by this physiological condition. In addition, t.he fact that, the 2.3 kb mR.NA is unchanged in expression even though it is downstream and transcribed in the same direction as his3 strongly suggests that, the hi.93 gene is not part of an operon.
The physicaal and physiological characterization of mRN.4 species encoded t).b
55.2 K. STRUHL AND R. W. DAVIS
his3 and five other linked genes provide the basis for further studies concerning the expression and regulation of the his3 gene in yeast cells. In particular, it will be important to incorporate these findings with respect to the phenotypes and DNA structures of his3 mutations that alter the expression and/or the regulation of this gene.
We thank Tom St. John for advice and methods relating to RNA biochemistry and for the strip of RNA-paper used in the mal-tsl experiment,.
REFERENCES
Alwine, <J. C., Kemp, D. J. & Stark, G. R. (1977). Proc. Nat. Acad. Sci., U.S.A. 74, 5350-- 5354.
Bach, M. L., Lacroute, F. & Botstein, D. (1979). Proc. Nut. Acud. Sci., U.S.A. 76, 386-390. Berget, S. M., Moore, C. & Sharp, P. A. (1977). Proc. Nut. Acad. Sci., U.S.A. 74, 3171-3175. Bossinger, ,J. & Cooper, T. G. (1976). J. Bacterial. 126, 198-204. Brennan, M. B. & Struhl, K. (1980). J. Mol. Biol. 136, 333-338. Cameron, J. R., Loh, E. Y. & Davis, R. W. (1979). Cell, 16, 739-751. Casey, J. & Davidson, X. (1977). Nucl. Acids Res. 4, 1539-1552. Chow, L. T., Gelinas, R. E., Broker, T. R. & Roberts, R. J. (1977). Cell, 12, l-8. Hereford, L. M. & Rosbash, M. (1977). CeZZ, 10, 453-462. Hinnen, A. H ., Hicks, J. B. & Fink, G. R. (1978). Proc. Nut. Acad. Sci., U.S.A. 75, 1929-
1933. Hopper, A. K., Banks, F. & Evangelidas, V. (1978). Cell, 14, 211-219. Hopper, J. E. & Rowe, L. B. (1978). J. Biol. Chem. 253, 7566-7569. Hutchinson, H. T. & Hartwell, L. H. (1967). J. BacterioE. 94, 1696-1705. Hutchinson, H. T., Hartwell, L. H. & McLaughlin, C. S. (1969). J. Bacterial. 99, 807-814. Kaback, D. B., Angerer, L. M. & Davidson, N. (1979). Nucl. Acids Res. 6, 2499-2517. Klopotowski, T. & Wiater, A. (1965). ilrch. Biochem. Biophys. 112, 562-566. Knapp, G., Beckmann, J. R., Johnson, P. F., Fuhrman, S. A. & Abelson, 6. (1978). Cell, 14,
211-219. McDonell, M. & Studier, F. (1977). J. Mol. Biol. 110, 119-146. McMaster, G. K. & Carmichal, G. G. (1977). Proc. Nut. Acud. Sci., U.S.A. 74, 4835-4838. Philippsen, P., Thomas, M., Kramer, R. A. & Davis, R. W. (1978). J. Mol. Biol. 1%,387-404. Rigby, P. W. J., Rhodes, C., Diekmann, M. & Berg, P. (1977). J. Mol. Biol. 113, 237V251. Scott, .J. H. & Schekman, R. (1979). J. Bacterial. 142, 414-423. Smith, M., Leung, D. W., Gillam, S., Astell, C. R., Montgomery, D. L. & Hall, B. D. (1979).
Cell, 16, 753-761. Southern, E. (1975). J. Mol. Biol. 98, 503-517. St. John, T. P. & Davis, R. W. (1979). Cp.12, 16, 443-452. Struhl, K. & Davis, R. W. (1977). Proc. Nut. Acad. Sk., U.S.A. 74, 5255-5259. Struhl, K. & Davis, R. W. (1980). J. Mol. Biol. 136, 309-332. Struhl, K. & Davis, R. W. (1981). J. Mol. Biol. 152, 553-568. Struhl, K., Cameron, J. R. & Davis, R. W. (1976). Proc. Nut. Acad. Sci., U.S.A. 73, 1471-
1475. Struhl, K., Stinchcomb, D. T., Scherer, S. & Davis, R. W. (1979). Proc. Nut. Acud. LX.,
U.S.A. 76, 1035-1039. Struhl, K., Stinchcomb, D. T. & Davis, R. W. (1980). J. Mol. Biol. 136, 291-307. Szybalski, W., Kubinski, H., Hradecna, Z. & Summers, W. C. (1971). Metkods Enzyml. 21,
383-413. Wolfner, M., Yep, D., Messenguy, F. & Fink, G. R. (1975). J. Mol. Biol. 96, 273-290. Zitomer, R. S., Montgomery, D. L., Nichols, D. L. & Hall, B. D. (1979). Proc. Nat. Acud. Sci.,
U.S.A. 76, 3627-3631.
Edited by A. Brenmer