Embed Size (px)
Citation preview
Transcription Factor/DNA Interaction
02-‐715 Advanced Topics in Computa8onal Genomics
Protein Binding Microarray (PBM)
• High-‐throughput characteriza8on of DNA binding sites of transcrip8on factor (TF)
– DNA probe sets • Each probe is 36-‐mer • Designed to contain all possible con8nuous 10-‐mers and many of the gapped 10-‐mers as subsequences
• 1,048,576 10-‐mers in approximately 44,000 spots
– Incubate the probes with TF proteins
– Stained with fluorophore-‐conjugated an8-‐GST an8body
– Measure the array signal intensi8es
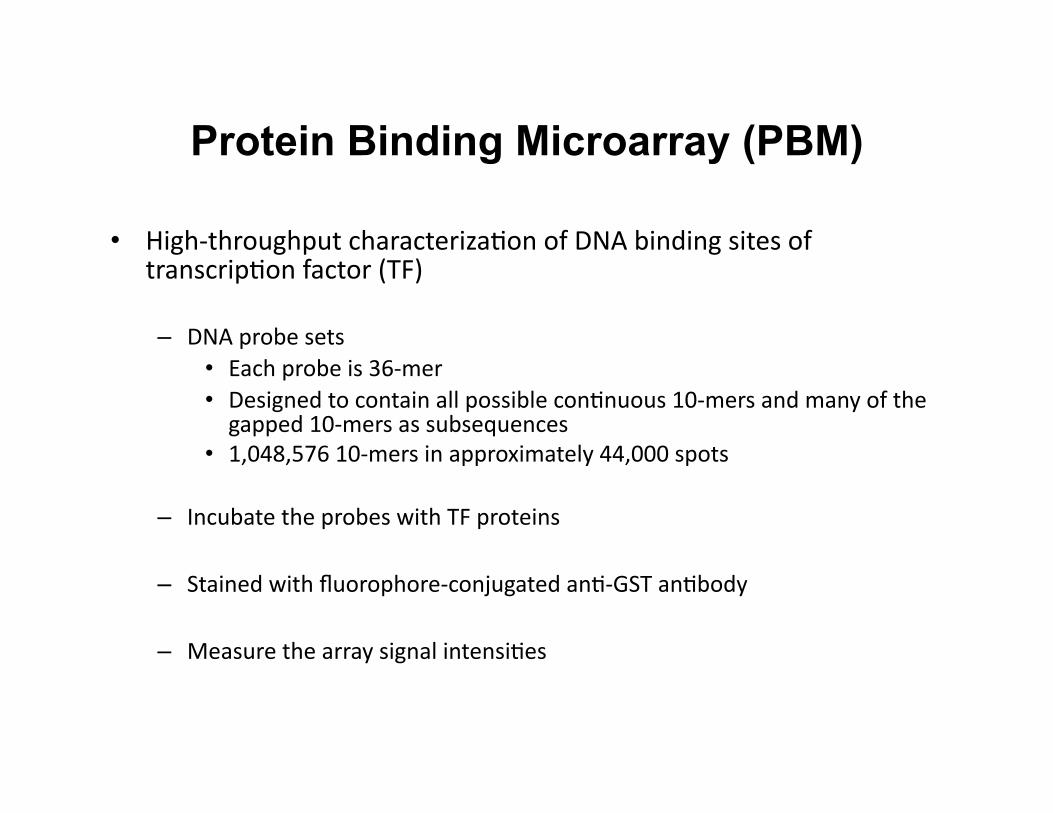
Protein Binding Microarray (PBM)
• High-‐throughput characteriza8on of DNA binding sites of transcrip8on factor (TF)
• In vitro binding in nucleosome free environment
• Direct binding
• Comprehensively determine TF binding specifici8es – All possible binding sequences
Analysis of PBM Data
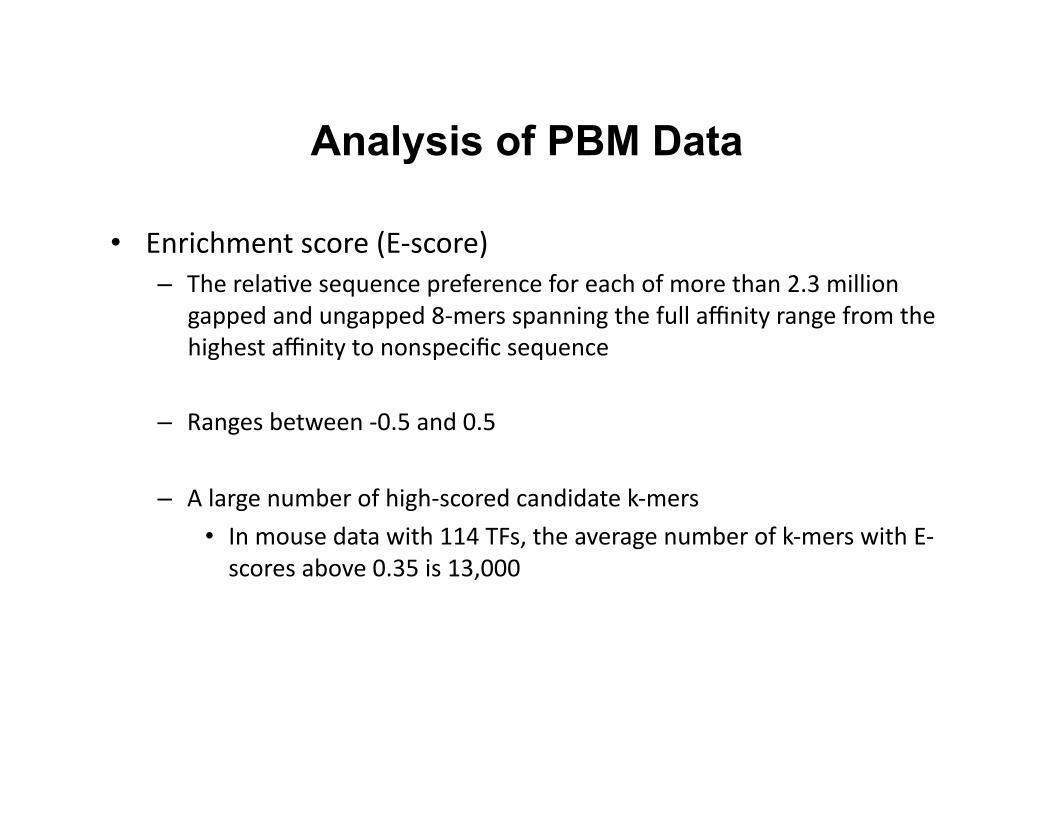
• Enrichment score (E-‐score) – The rela8ve sequence preference for each of more than 2.3 million
gapped and ungapped 8-‐mers spanning the full affinity range from the highest affinity to nonspecific sequence
– Ranges between -‐0.5 and 0.5
– A large number of high-‐scored candidate k-‐mers
• In mouse data with 114 TFs, the average number of k-‐mers with E-‐scores above 0.35 is 13,000
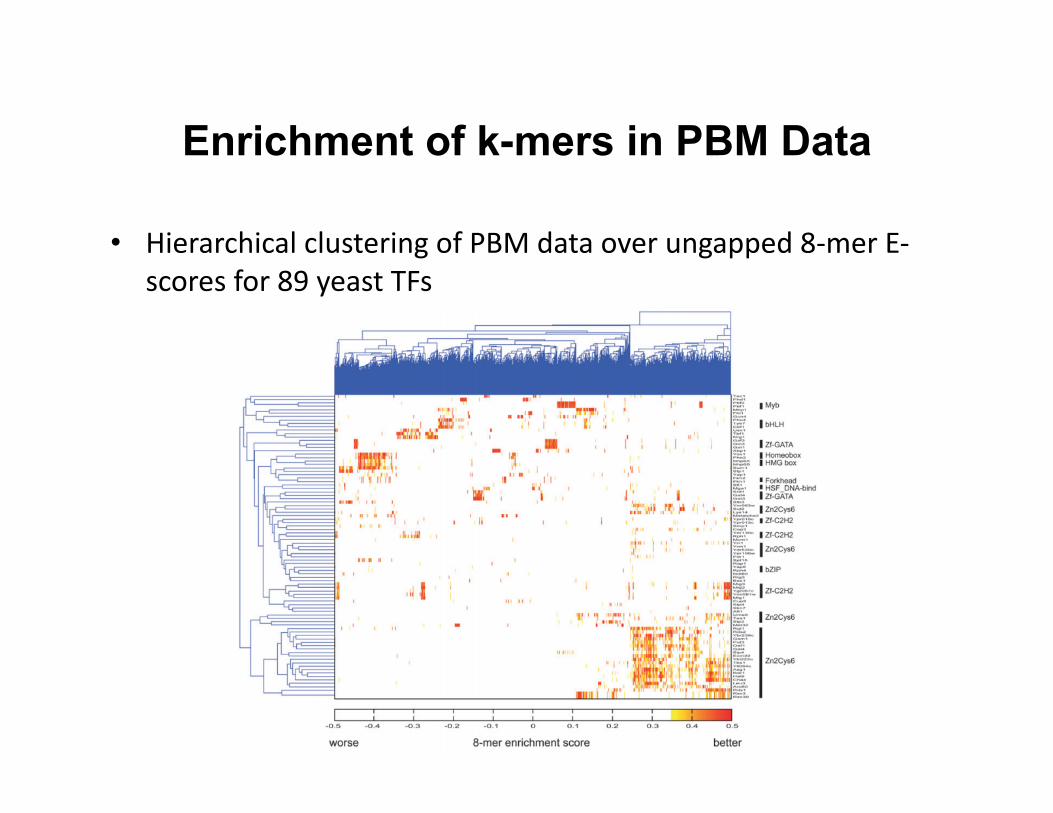
Enrichment of k-mers in PBM Data
• Hierarchical clustering of PBM data over ungapped 8-‐mer E-‐scores for 89 yeast TFs
Analysis of PBM Data
• Construc8ng posi8on-‐specific scoring matrix (PSSM) with Seed-‐and-‐Wobble algorithm – Iden8fies the single 8-‐mer (ungapped or gapped) with the greatest
PBM enrichment score (E score)
– Test the rela8ve preference of each nucleo8de variant at each posi8on, both within and outside the seed
– Convert it to logo representa8on
Analysis of PBM Data
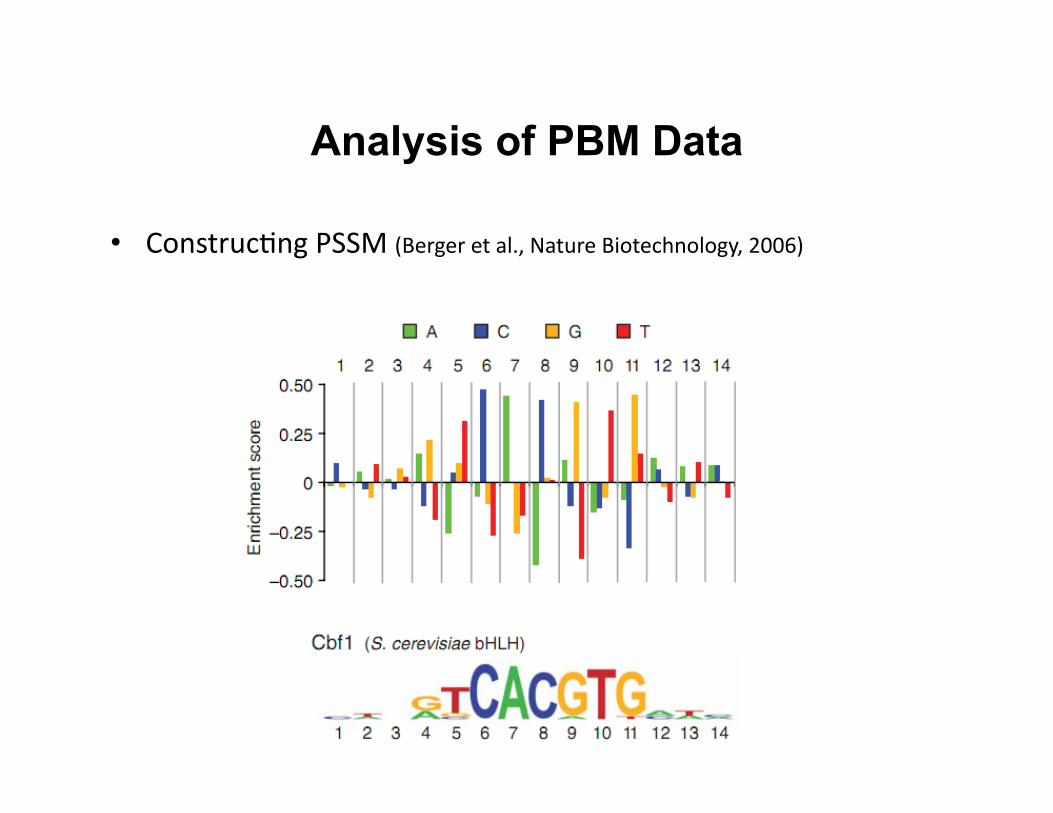
• Construc8ng PSSM (Berger et al., Nature Biotechnology, 2006)
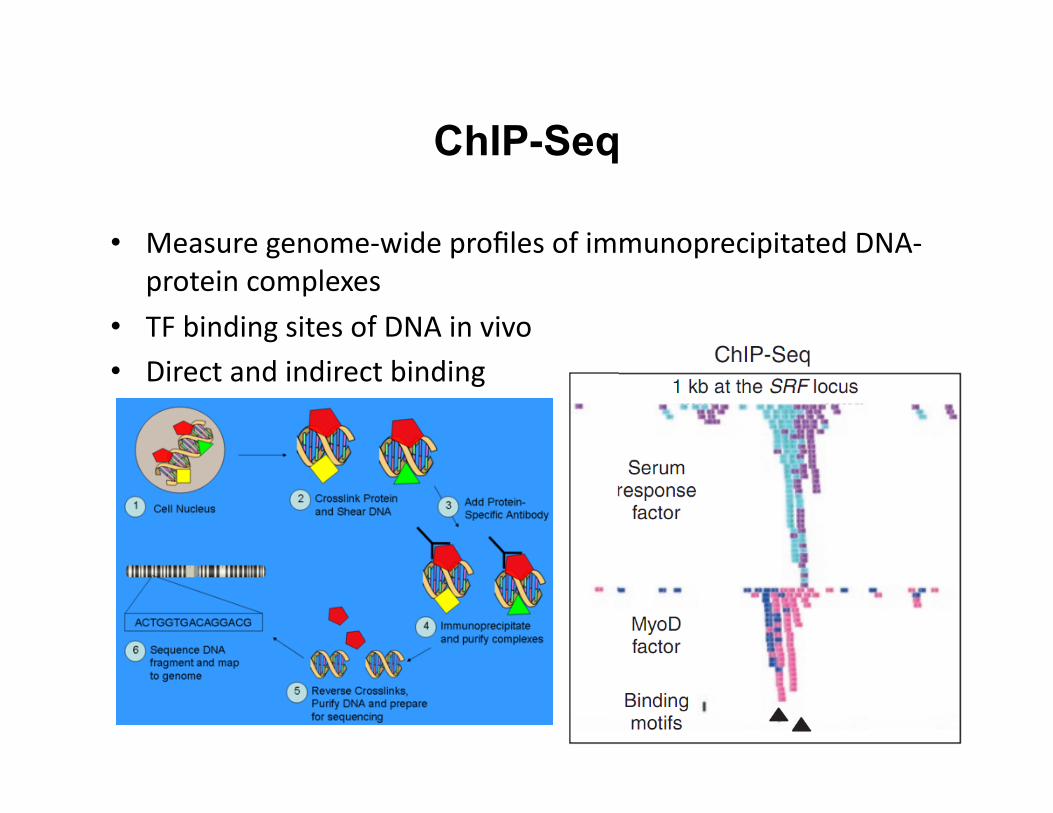
ChIP-Seq
• Measure genome-‐wide profiles of immunoprecipitated DNA-‐protein complexes
• TF binding sites of DNA in vivo • Direct and indirect binding
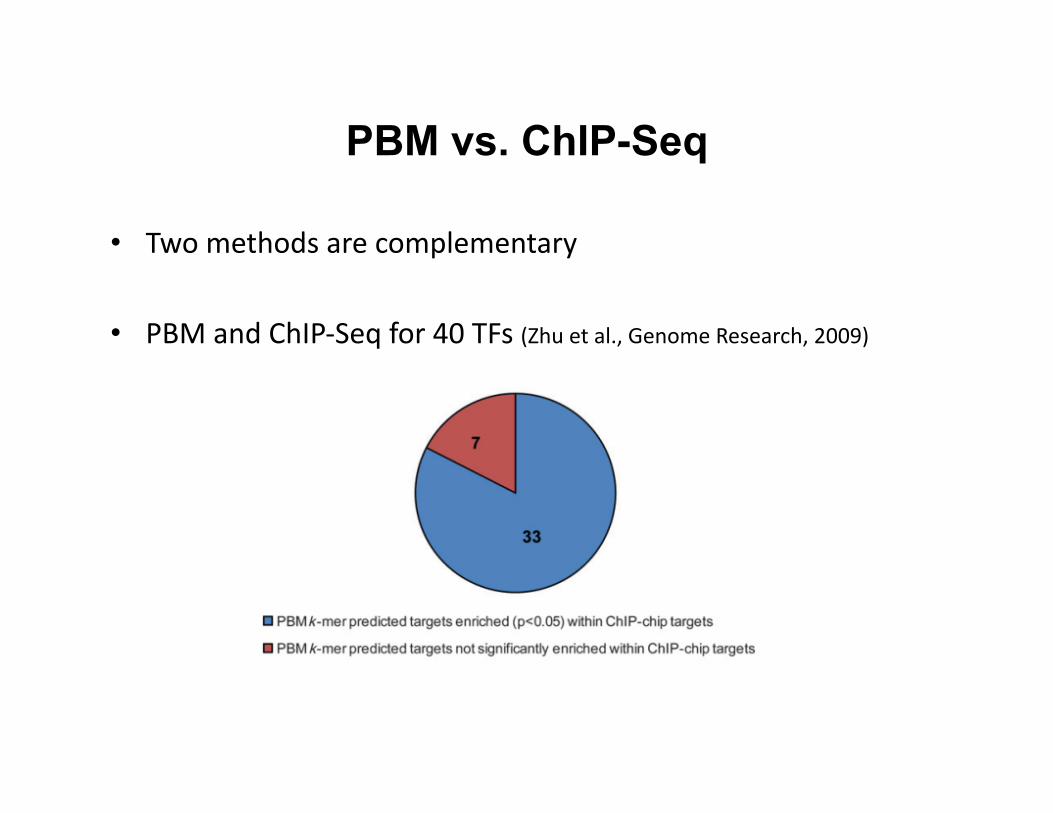
PBM vs. ChIP-Seq
• Two methods are complementary
• PBM and ChIP-‐Seq for 40 TFs (Zhu et al., Genome Research, 2009)
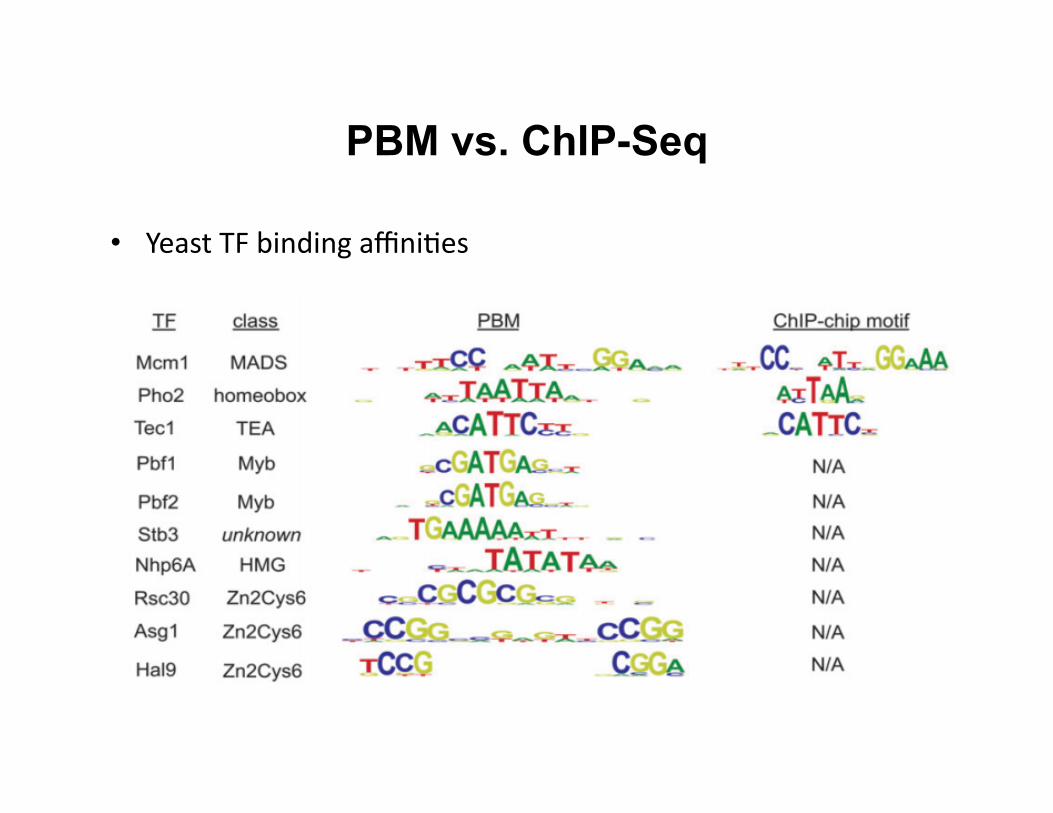
PBM vs. ChIP-Seq
• Yeast TF binding affini8es
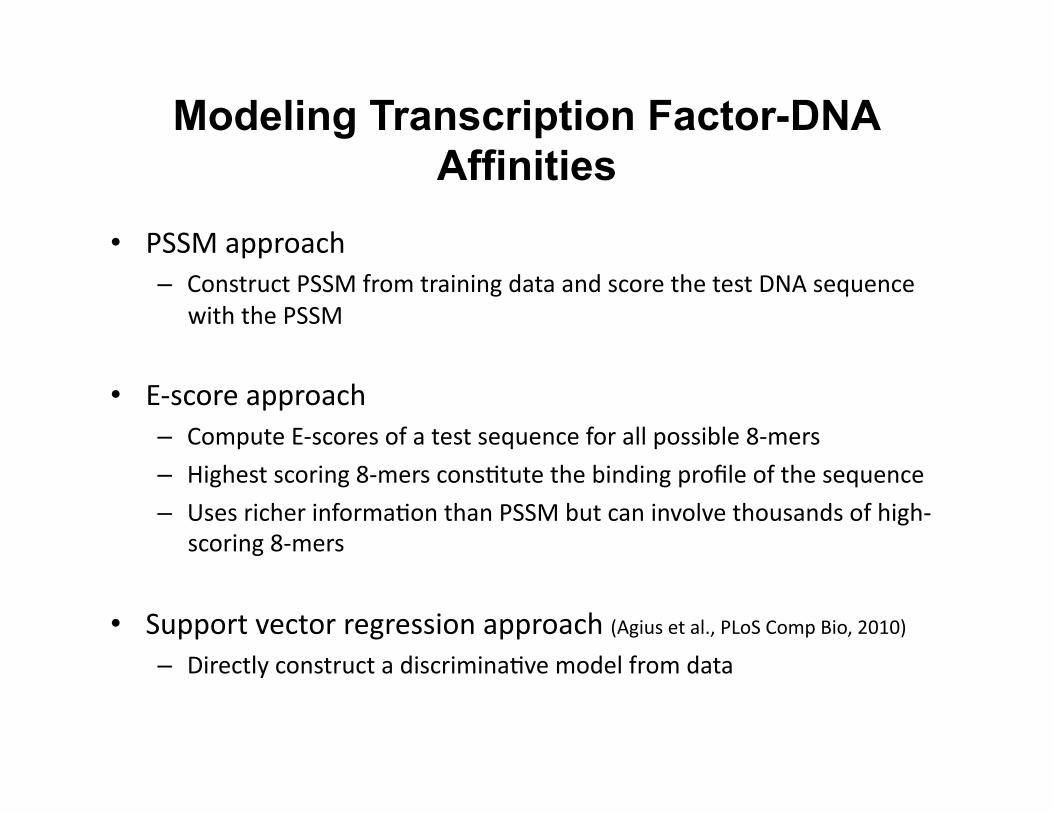
Modeling Transcription Factor-DNA Affinities
• PSSM approach – Construct PSSM from training data and score the test DNA sequence
with the PSSM
• E-‐score approach – Compute E-‐scores of a test sequence for all possible 8-‐mers
– Highest scoring 8-‐mers cons8tute the binding profile of the sequence
– Uses richer informa8on than PSSM but can involve thousands of high-‐scoring 8-‐mers
• Support vector regression approach (Agius et al., PLoS Comp Bio, 2010)
– Directly construct a discrimina8ve model from data
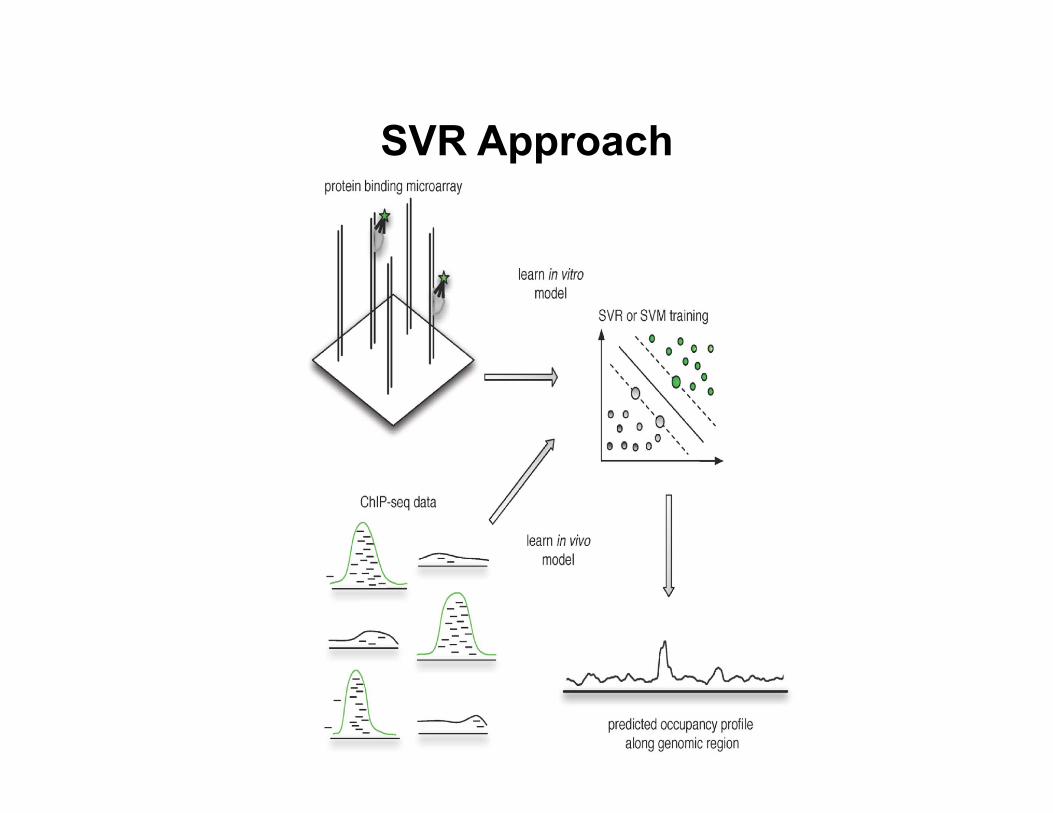
SVR Approach
SVR Model
• Predictors: k-‐mers in PBM
• Response: binding affini8es measured in PBM experiments
• Di-‐mismatch string kernel in SVR for a similarity-‐measure between two sequences – (k,m) mismatch kernel: allowing up to m mismatches in each k-‐mer
match (m<<k)
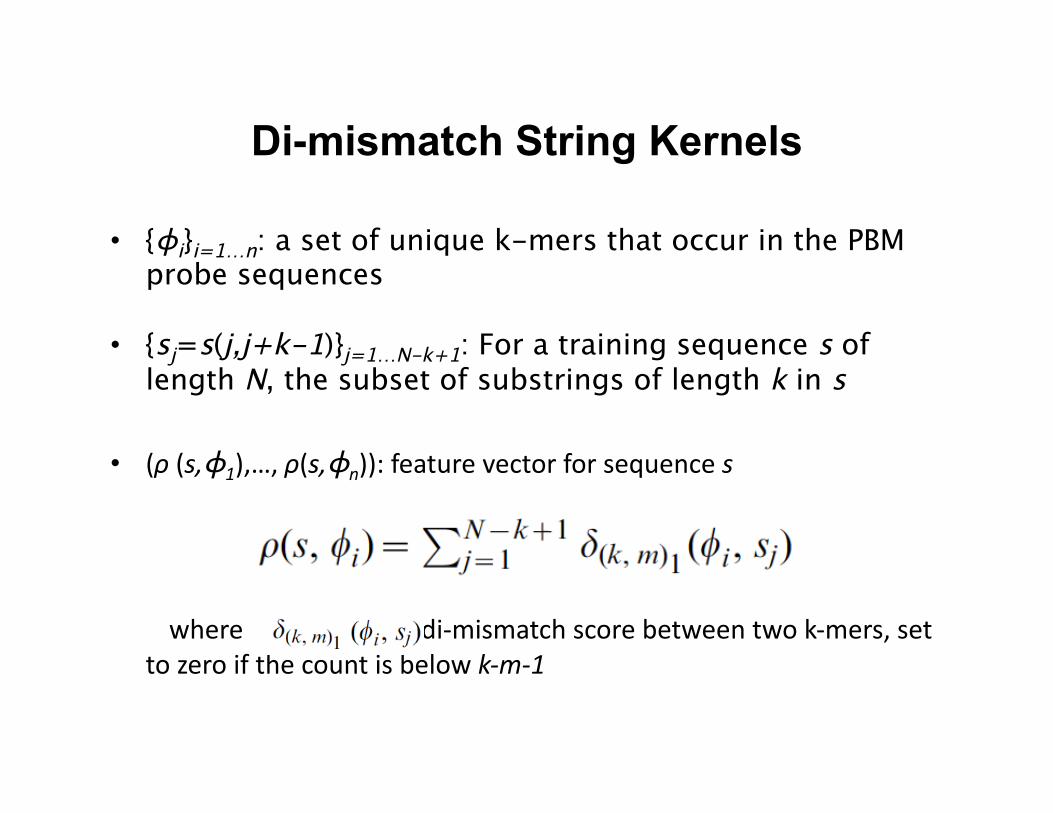
Di-mismatch String Kernels
• {ϕi}i=1…n: a set of unique k-mers that occur in the PBM probe sequences
• {sj=s(j,j+k-1)}j=1…N-k+1: For a training sequence s of length N, the subset of substrings of length k in s
• (ρ (s,ϕ1),…, ρ(s,ϕn)): feature vector for sequence s
where : di-‐mismatch score between two k-‐mers, set to zero if the count is below k-‐m-‐1
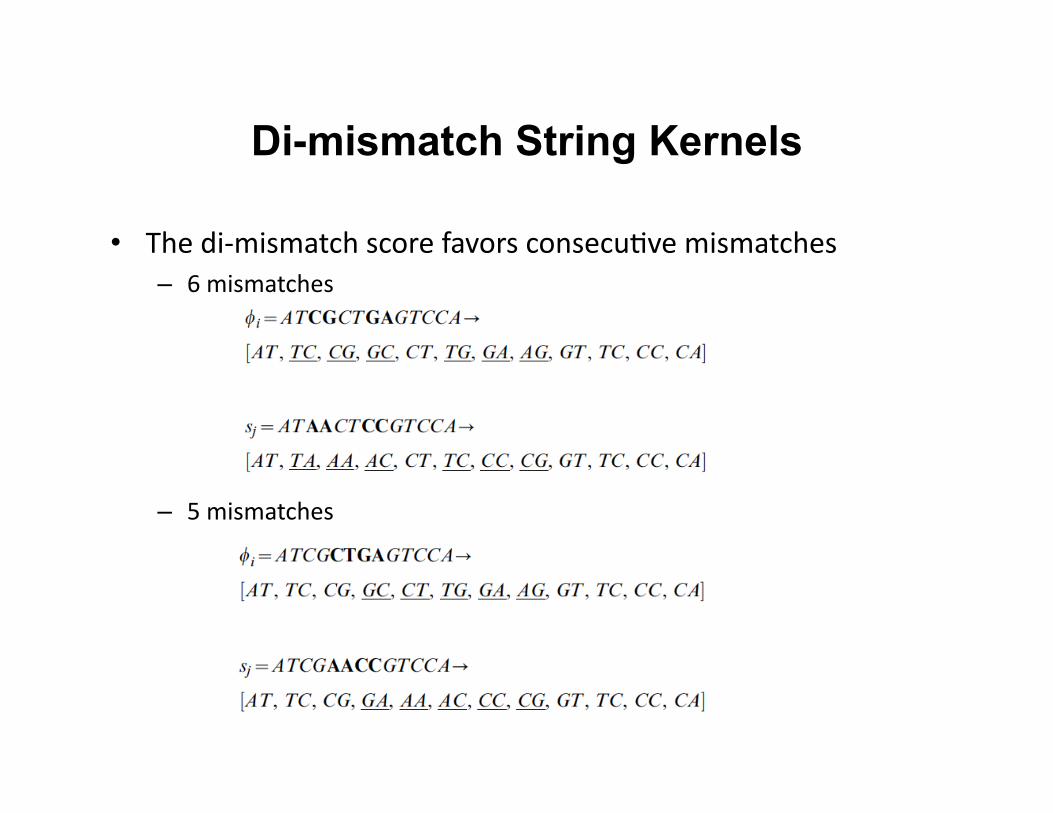
Di-mismatch String Kernels
• The di-‐mismatch score favors consecu8ve mismatches – 6 mismatches
– 5 mismatches
Di-mismatch String Kernels
• Selec8ng k, m in (k,m) mismatch kernel – Cross valida8on for
• k=8,…, 13 • m=1,…,6
– Use (k,m) = (13,5) in all of the experiments
Selecting Samples for Training Data
• Out of 44k probes, only a few hundred probes indicate TF binding – Using all of the probes will lead to a model that predicts the prevalent
low-‐level binding probes
• Posi8ve probes: – Top 500 probes – Probes with normalized binding affini8es (Z-‐score) > 3.5
• Nega8ve probes: – Selected from the low end of the distribu8on of binding affini8es
Selecting Features for Training Data
• Select feature set {ϕi}i=1…n – k-mers overrepresented in either positive or negative
probe class – Evaluate each k-mer with median di-mismatch scores in
each of the positive and negative class – Top 4000 k-mers were selected
Experiments
• PBM for in vitro and ChIP-‐Seq for in vivo binding
• Study designs – Train on PBM data and test on PBM data
– Train on PBM data and test on ChIP-‐Seq data
– Train on ChIP-‐Seq data and test on ChIP-‐Seq data
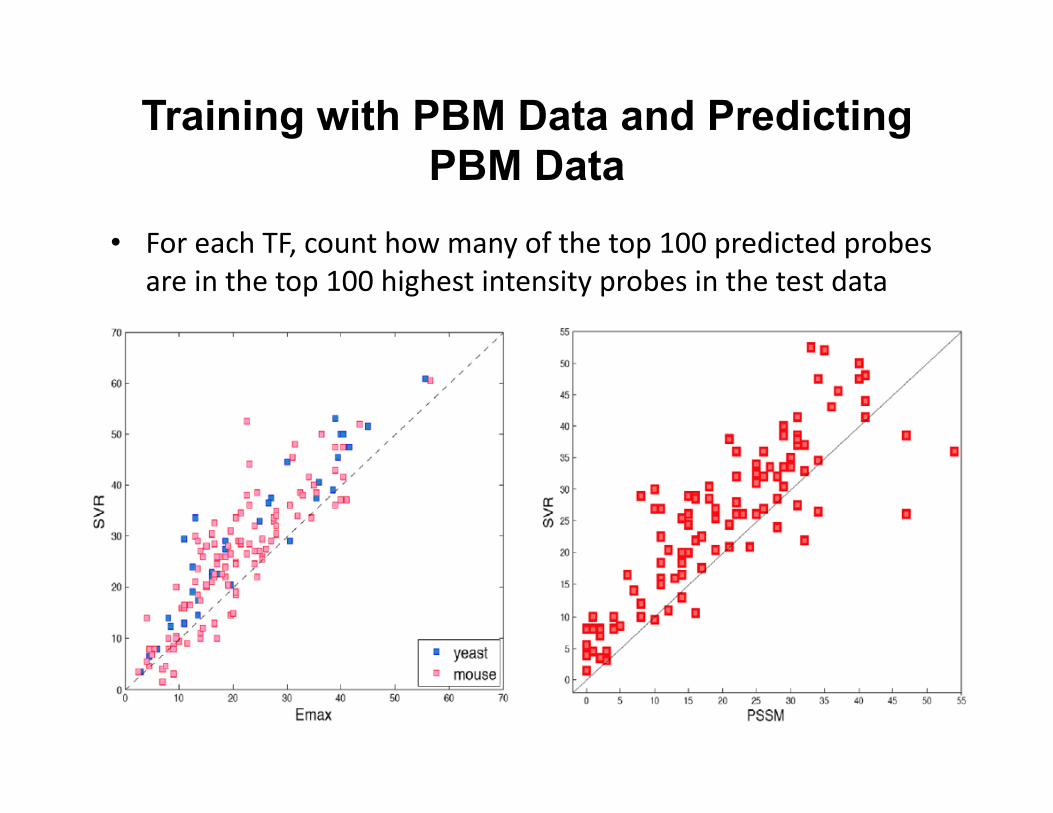
Training with PBM Data and Predicting PBM Data
• For each TF, count how many of the top 100 predicted probes are in the top 100 highest intensity probes in the test data
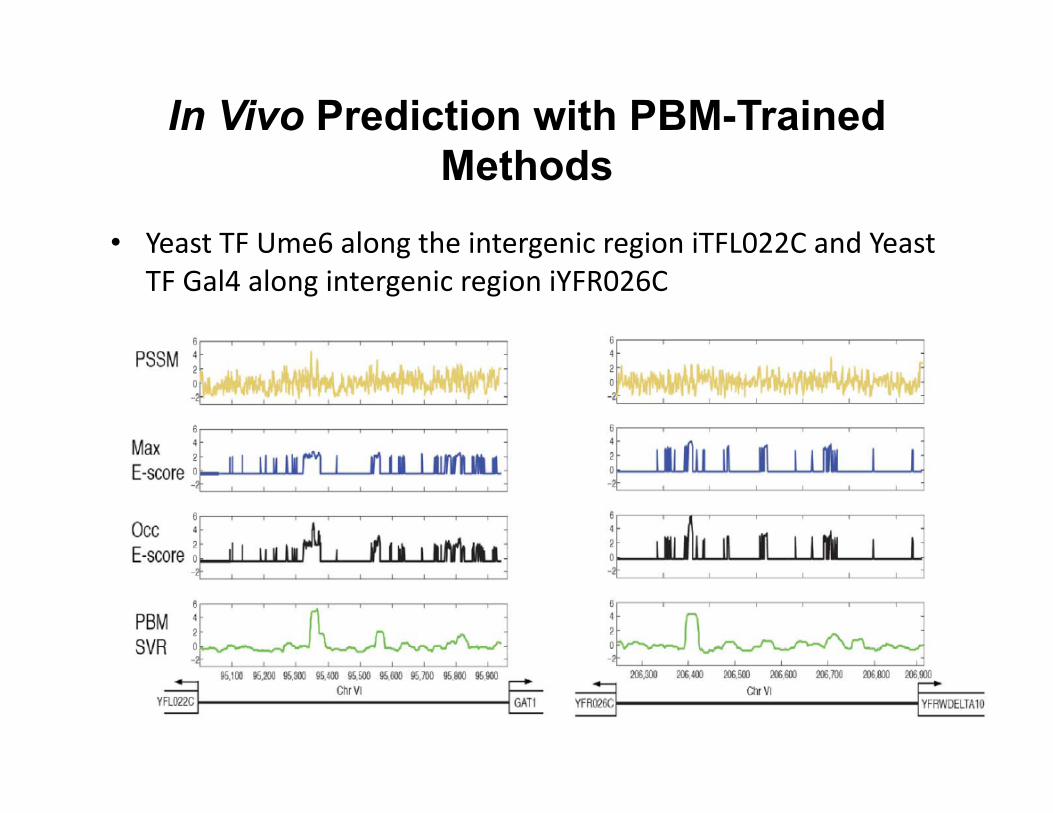
In Vivo Prediction with PBM-Trained Methods
• Yeast TF Ume6 along the intergenic region iTFL022C and Yeast TF Gal4 along intergenic region iYFR026C
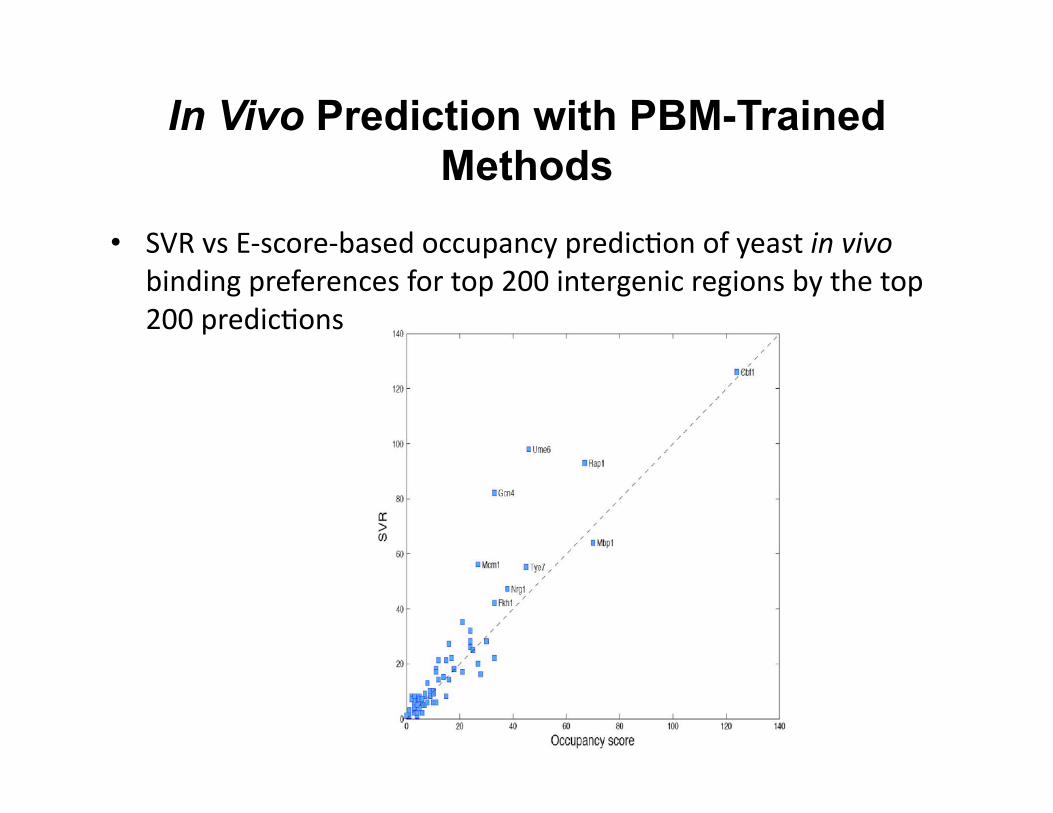
In Vivo Prediction with PBM-Trained Methods
• SVR vs E-‐score-‐based occupancy predic8on of yeast in vivo binding preferences for top 200 intergenic regions by the top 200 predic8ons
ChIP-Seq Data
• Extrac8ng training/test data from measurements of ChIP-‐Seq experiments – Posi8ve regions: 60bp centered at 1000 ChIP-‐seq peak regions – Nega8ve regions: 60bp regions 300bp away from the peaks, 1000 such
regions at the flanking regions of peaks
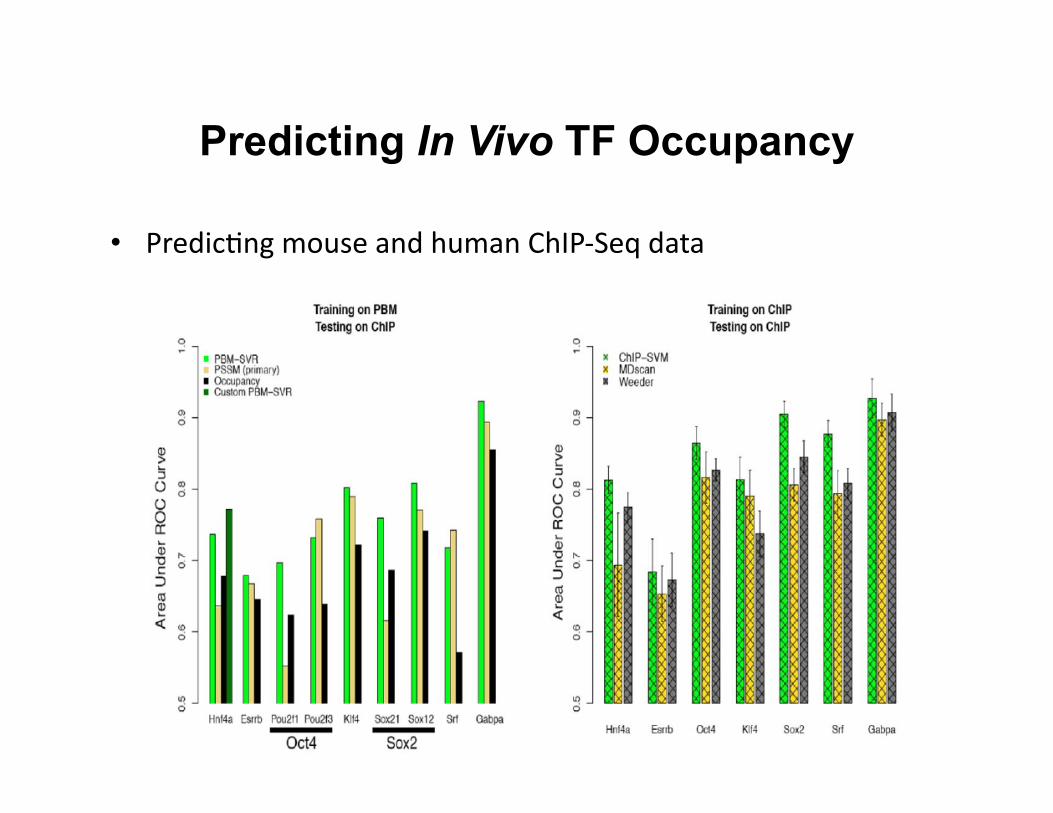
Predicting In Vivo TF Occupancy
• Predic8ng mouse and human ChIP-‐Seq data
Detecting DNA-Protein Interaction
• Posi8on specific scoring matrix (PSSM) – Assumes the nucleo8de at each posi8on is independent of other
nucleo8des
• New feature-‐based approach – Models dependencies among mul8ple nucleo8des in the TF binding
mo8fs
– Feature mo8f models (FMMs)
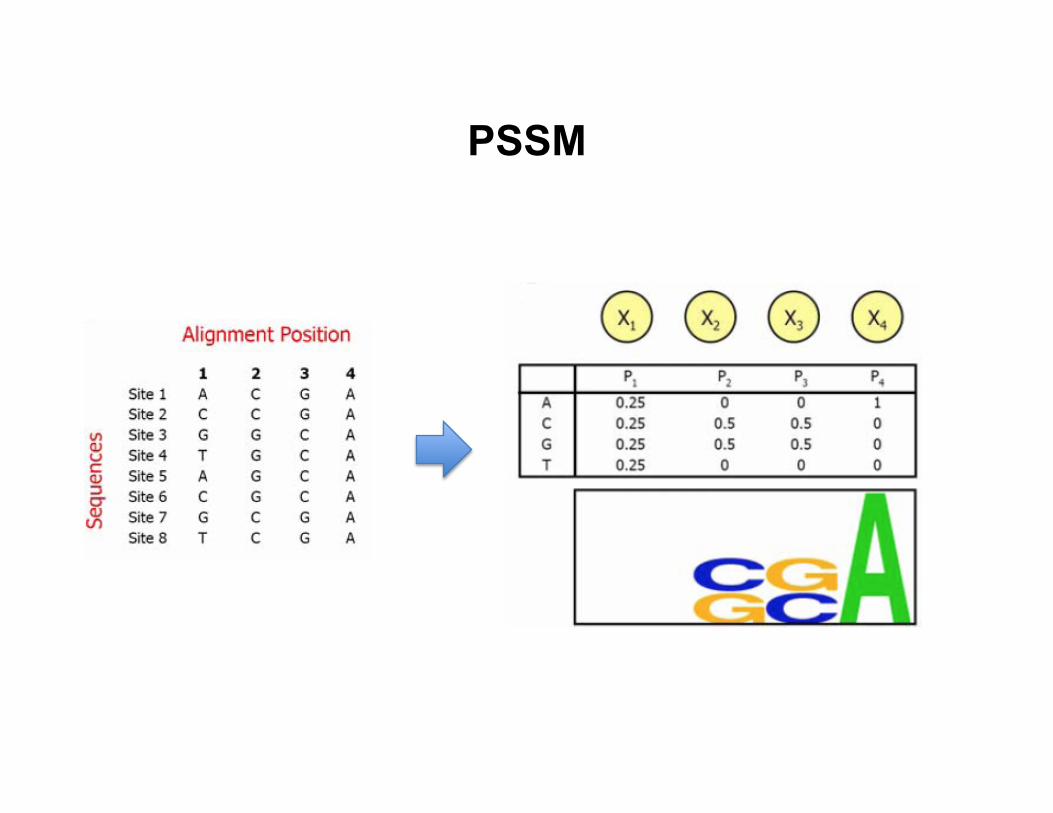
PSSM
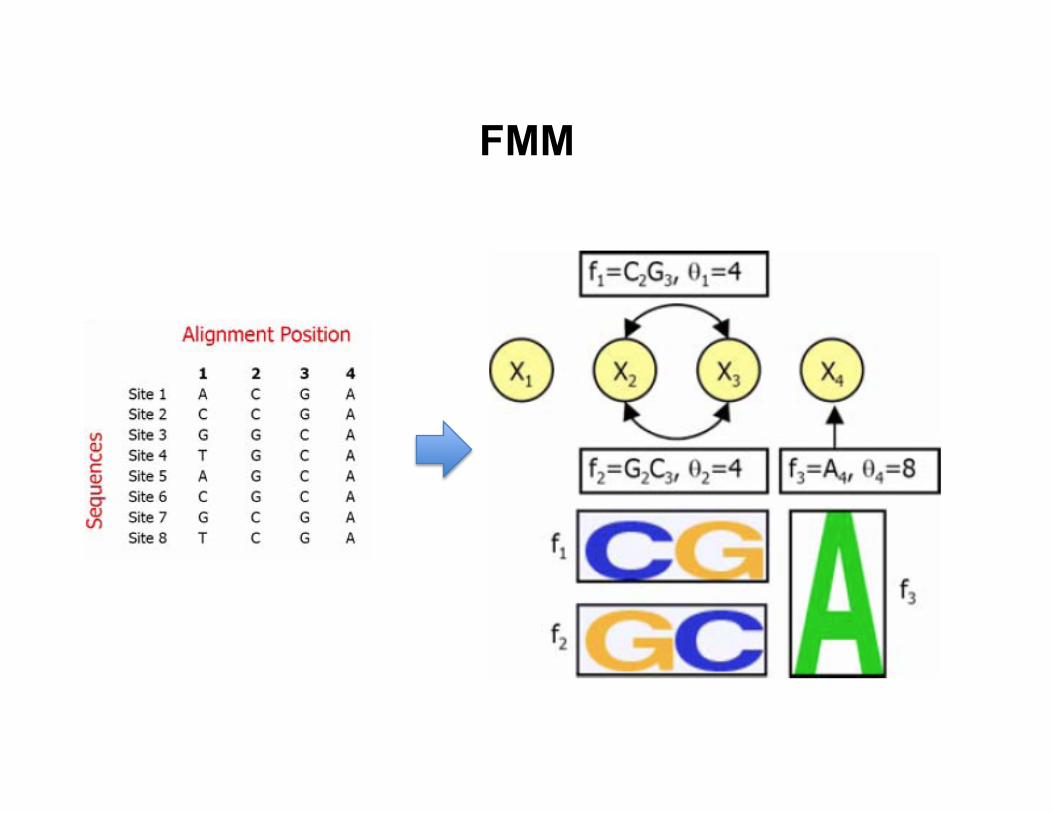
FMM
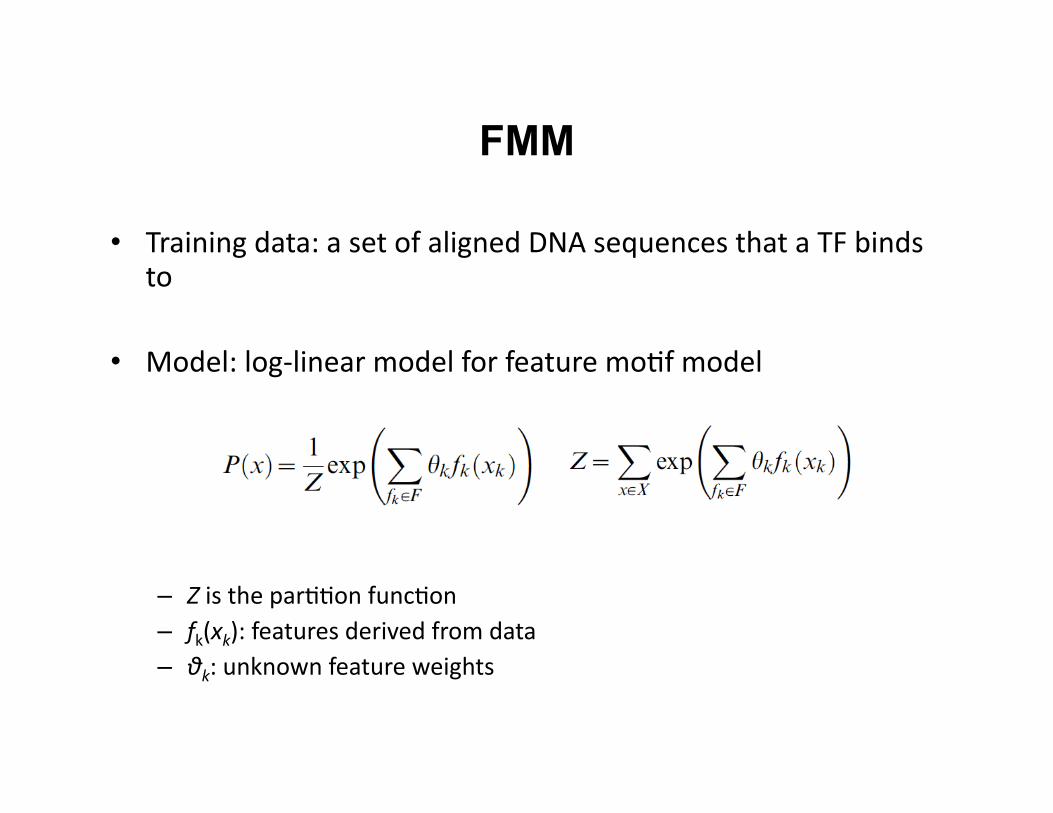
FMM
• Training data: a set of aligned DNA sequences that a TF binds to
• Model: log-‐linear model for feature mo8f model
– Z is the par88on func8on – fk(xk): features derived from data – θk: unknown feature weights
FMM
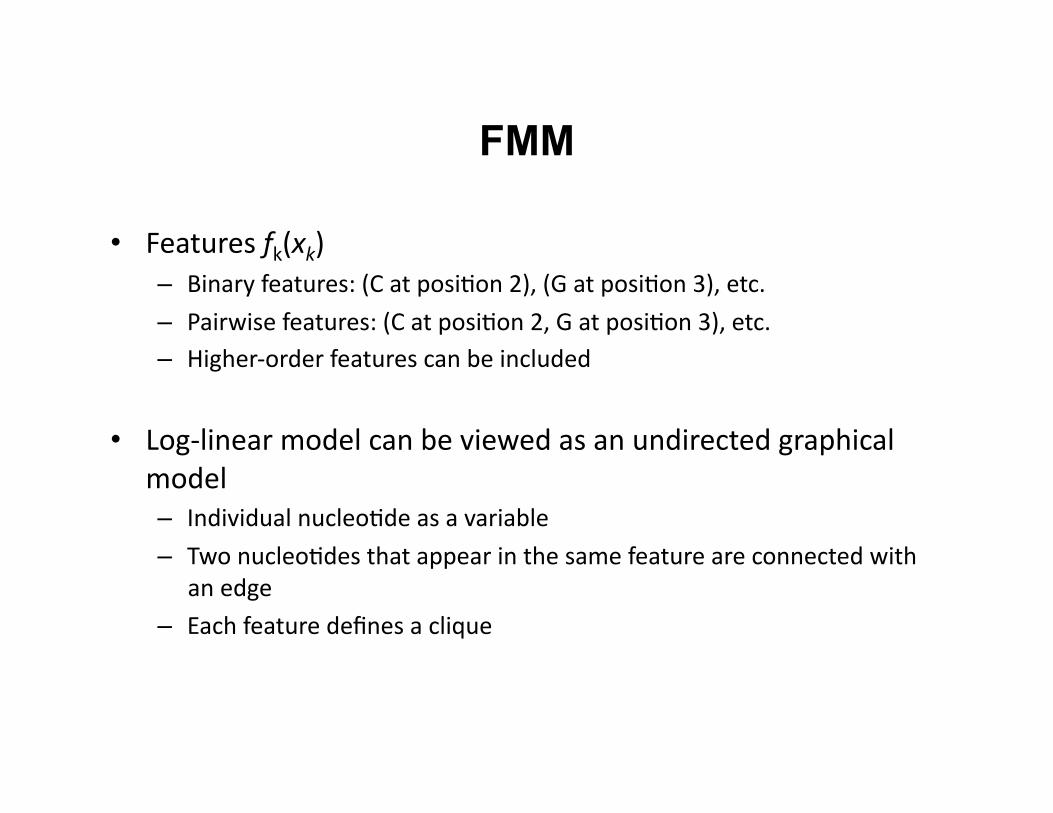
• Features fk(xk) – Binary features: (C at posi8on 2), (G at posi8on 3), etc. – Pairwise features: (C at posi8on 2, G at posi8on 3), etc. – Higher-‐order features can be included
• Log-‐linear model can be viewed as an undirected graphical model – Individual nucleo8de as a variable – Two nucleo8des that appear in the same feature are connected with
an edge
– Each feature defines a clique
PSSM as FMM
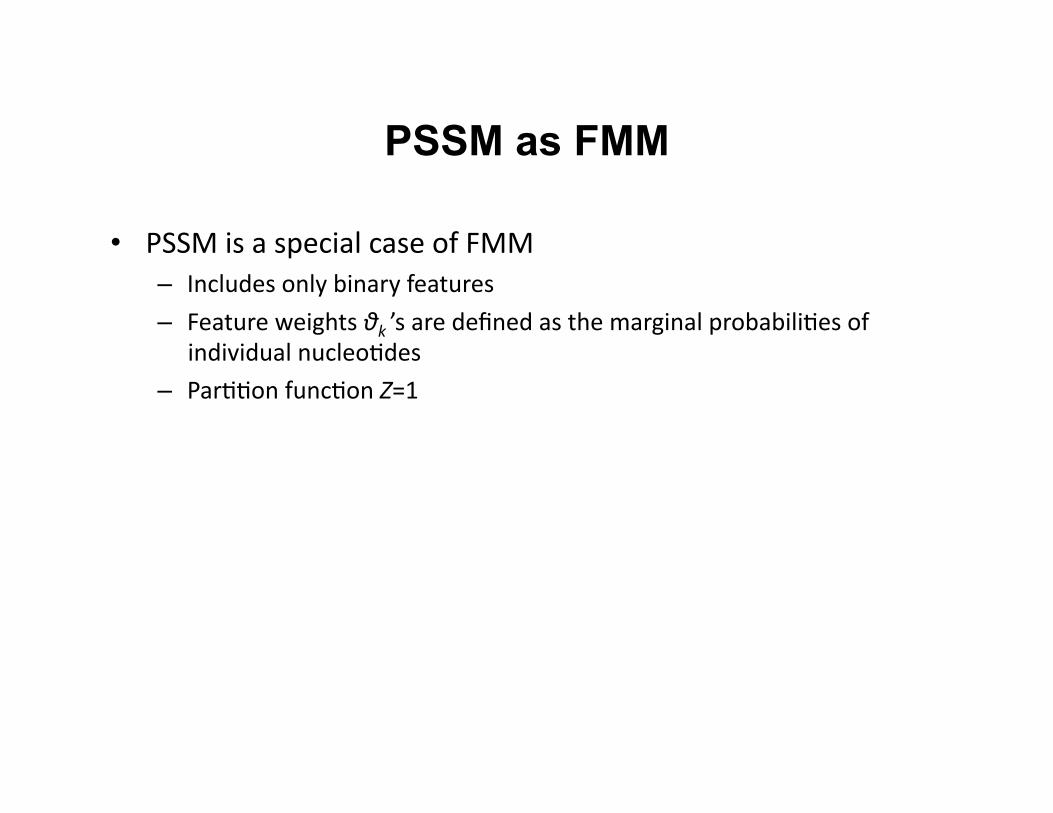
• PSSM is a special case of FMM – Includes only binary features – Feature weights θk ’s are defined as the marginal probabili8es of
individual nucleo8des
– Par88on func8on Z=1
Learning FMM
• Learning the parameters (feature weights) – Given data and a set of features, how can we learn the feature
weights?
• Learning the structure of the undirected graphical model – How can we learn which features to include in the model?
Learning FMM
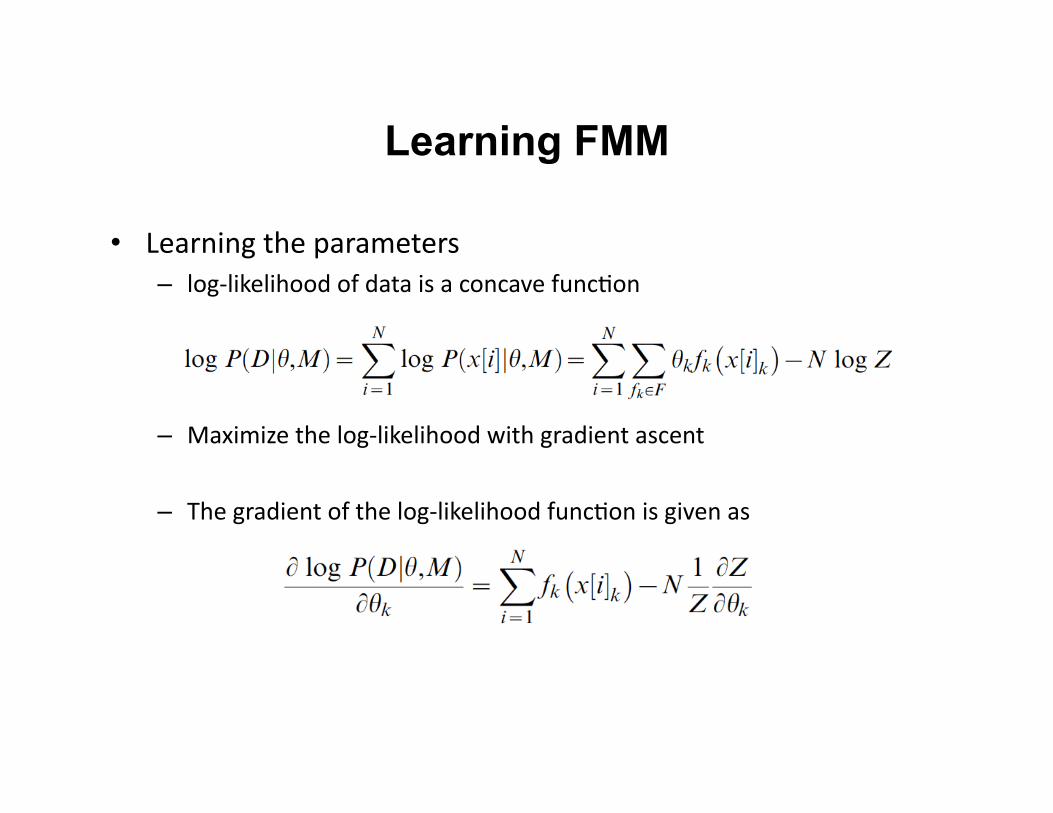
• Learning the parameters – log-‐likelihood of data is a concave func8on
– Maximize the log-‐likelihood with gradient ascent
– The gradient of the log-‐likelihood func8on is given as
Learning FMM
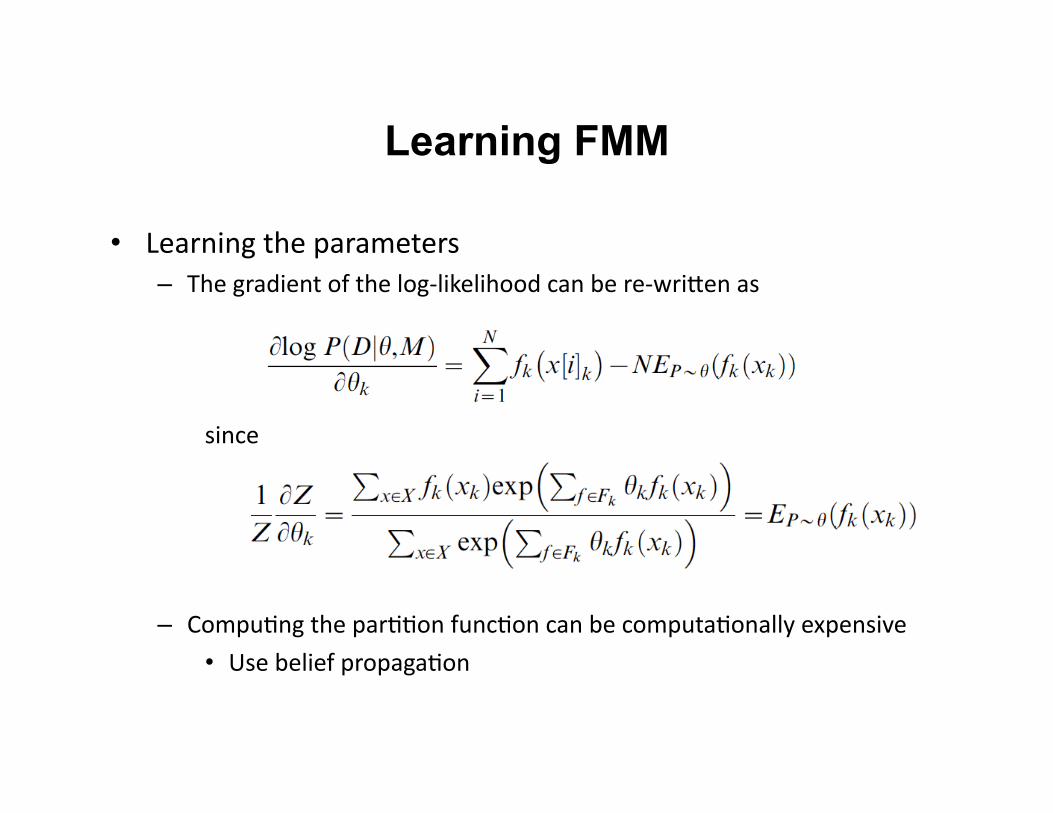
• Learning the parameters – The gradient of the log-‐likelihood can be re-‐wrimen as
since
– Compu8ng the par88on func8on can be computa8onally expensive
• Use belief propaga8on
Learning FMM
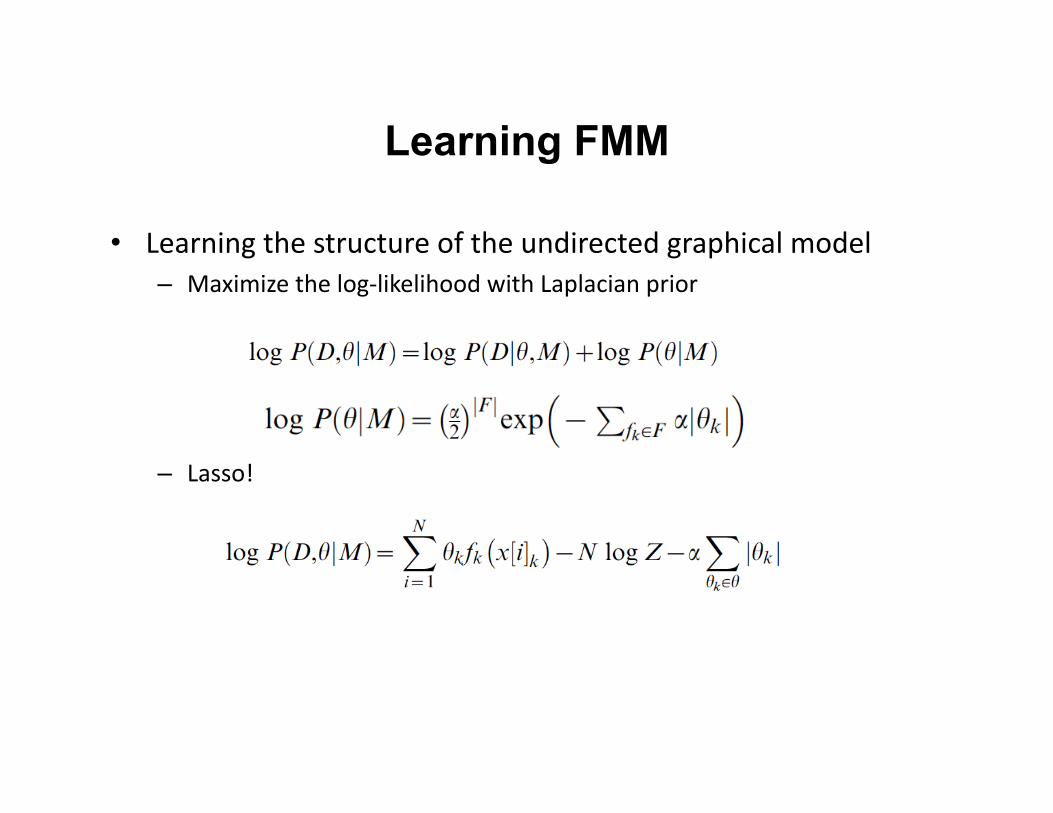
• Learning the structure of the undirected graphical model – Maximize the log-‐likelihood with Laplacian prior
– Lasso!
Learning FMM
• Graoing for op8miza8on
• In each itera8on – Op8mize the objec8ve func8on rela8ve to the current set of ac8ve
features F – Add the inac8ve feature fi F with the maximal gradient at θi=0
– The number of features grows exponen8ally as the number of nucleo8des grows in each sequence
• Apply filtering before using the graoing approach
€
∉
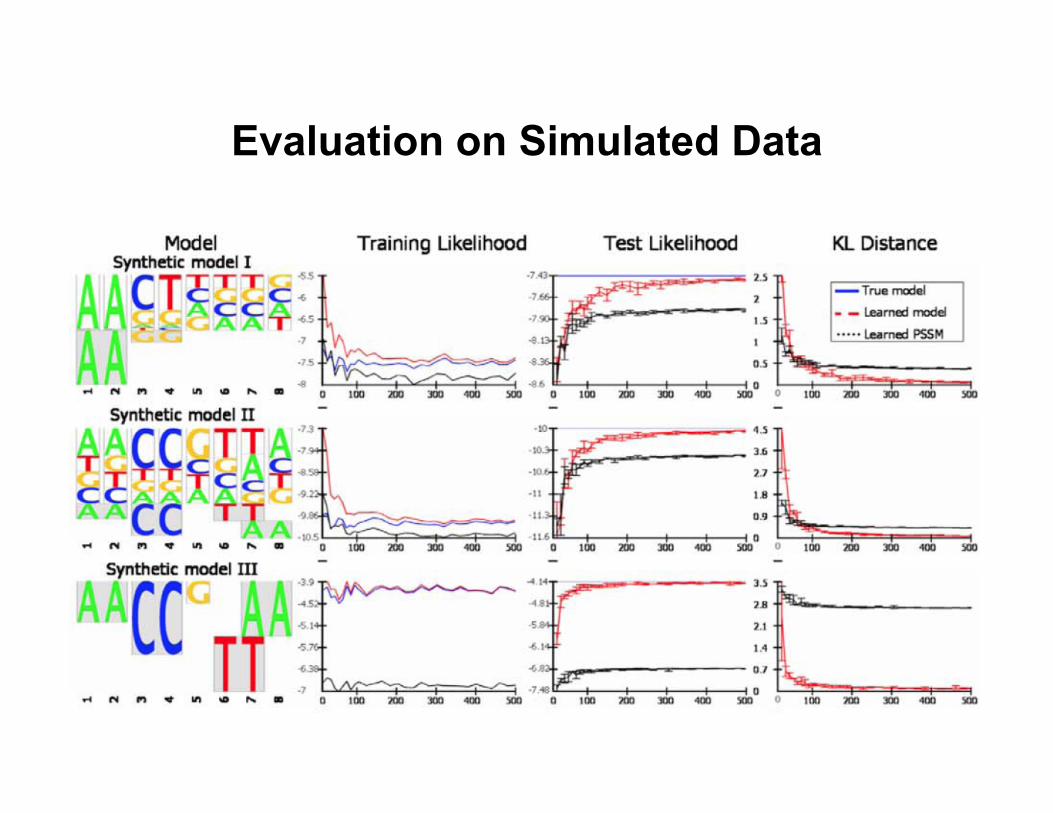
Evaluation on Simulated Data
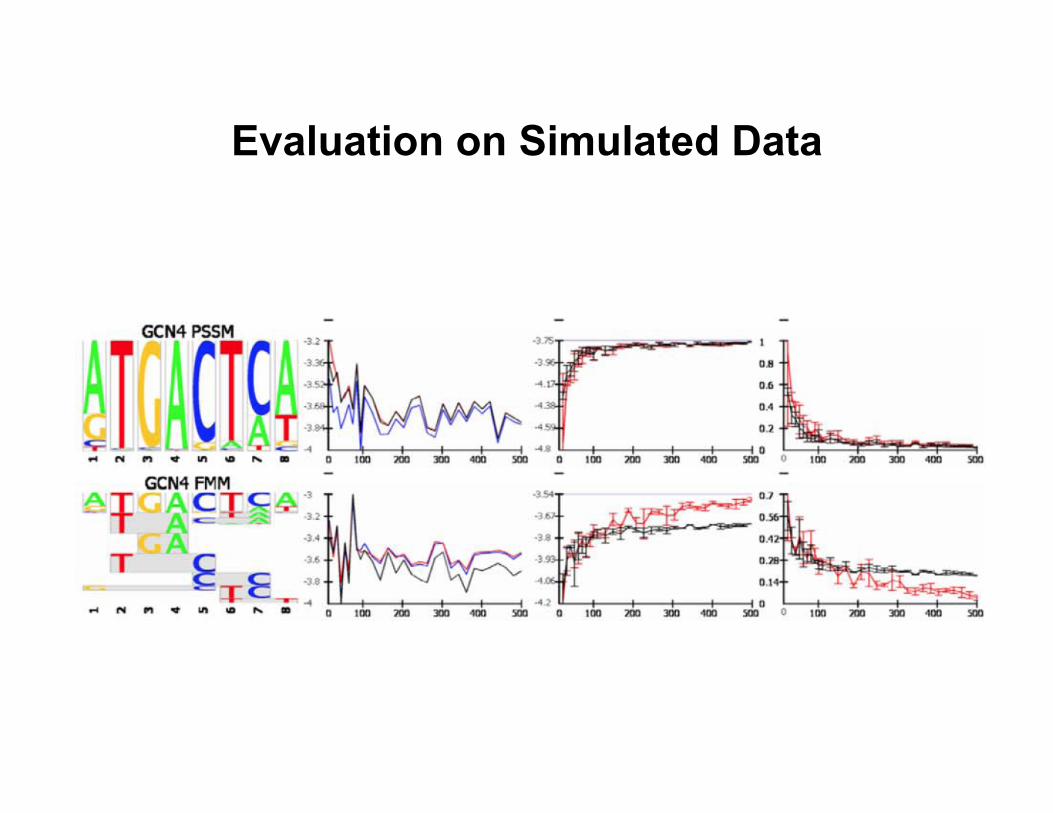
Evaluation on Simulated Data
Summary
• PBM can be used to quan8fy TF target interac8ons in vitro
• ChIP-‐Seq can be used to measure TF target interac8ons in vivo
• Computa8onal methods for predic8ng TF target interac8ons based on PBM or ChIP-‐Seq data – PSSM
– E-‐score for PBM – Support vector regression as a discrimina8ve appraoch
– Graphical model as a way of capturing correlated nucleo8de bases