Embed Size (px)
Citation preview
Transcription Factor E2-2 Is anEssential and Specific Regulator ofPlasmacytoid Dendritic Cell DevelopmentBabacar Cisse,1 Michele L. Caton,1 Manfred Lehner,2 Takahiro Maeda,3 Stefanie Scheu,4,5 Richard Locksley,4
Dan Holmberg,6 Christiane Zweier,7 Nicolette S. den Hollander,8 Sarina G. Kant,8 Wolfgang Holter,2 Anita Rauch,7
Yuan Zhuang,9 and Boris Reizis1,*1Department of Microbiology, Columbia University Medical Center, New York, NY 10032, USA2Department of Hematology and Oncology, Children’s University Hospital, Friedrich-Alexander University Erlangen-Nuremberg,91054 Erlangen, Germany3Nagasaki University Graduate School of Biomedical Science, Nagasaki 853-8691, Japan4Department of Medicine and Microbiology/Immunology, Howard Hughes Medical Institute, University of California, San Francisco,San Francisco, CA 94143, USA5Institute of Medical Microbiology and Hospital Hygiene, University of Dusseldorf, 40225 Dusseldorf, Germany6Department of Medical Biosciences, Umea University, S-901 87 Umea, Sweden7Institute of Human Genetics, University Hospital Erlangen, Friedrich-Alexander University Erlangen-Nuremberg, 91054 Erlangen, Germany8Department of Clinical Genetics, Leiden University Medical Center, 2300 RC Leiden, Netherlands9Department of Immunology, Duke University School of Medicine, Durham, NC 27710, USA
*Correspondence: [email protected]
DOI 10.1016/j.cell.2008.09.016
SUMMARY
Plasmacytoid dendritic cells (PDCs) represent aunique immune cell type specialized in type I inter-feron (IFN) secretion in response to viral nucleic acids.The molecular control of PDC lineage specificationhas been poorly understood. We report that basichelix-loop-helix transcription factor (E protein) E2-2/Tcf4 is preferentially expressed in murine and humanPDCs. Constitutive or inducible deletion of murine E2-2 blocked the development of PDCs but not of otherlineages and abolished IFN response to unmethy-lated DNA. Moreover, E2-2 haploinsufficiency inmice and in human Pitt-Hopkins syndrome patientswas associated with aberrant expression profile andimpaired IFN response of the PDC. E2-2 directlyactivated multiple PDC-enriched genes, includingtranscription factors involved in PDC development(SpiB, Irf8) and function (Irf7). These results identifyE2-2 as a specific transcriptional regulator of thePDC lineage in mice and humans and reveal a keyfunction of E proteins in the innate immune system.
INTRODUCTION
Dendritic cells (DCs) play critical roles in immunity because of
their ability to recognize invading pathogens and mobilize multi-
ple immune cell types to combat them. Conventional DCs
(cDCs) efficiently detect and present foreign antigens to anti-
gen-specific T lymphocytes in the context of major histocompat-
ibility complex (MHC) molecules. On the other hand, plasmacy-
toid DCs (PDCs) represent a distinct DC type specialized in
rapid secretion of type I interferons (interferon a [IFNa] and
IFNb) in response to viruses (Asselin-Paturel and Trinchieri,
2005; Barchet et al., 2005; Cao and Liu, 2007). The resulting
IFN acts both directly to block viral replication and as an adjuvant
to activate multiple immune cell types. In particular, PDCs effi-
ciently suppress HIV replication, and their infection and eventual
depletion contributes to immunodeficiency caused by HIV
(Meyers et al., 2007). Conversely, persistent activation of PDCs
causes elevated IFN levels in autoimmune diseases such as lu-
pus and psoriasis (Banchereau and Pascual, 2006). In the latter
condition, aberrant activation of PDCs by complexes of self-
DNA has been recently demonstrated (Lande et al., 2007). Thus,
PDCs are primary intereferon-producing cells that play central
roles both in protective antiviral responses and in immuno-
pathology.
PDCs express a combination of Toll-like receptors (TLRs)
including TLR7/8 and TLR9, allowing the recognition of virus-
associated nucleic acids such as single-stranded RNA and
unmethylated CpG-containing DNA (CpG), respectively. After
TLR-mediated virus recognition, PDCs produce IFN and other
cytokines and subsequently differentiate into activated cDCs.
The secretion of IFN by PDCs is characterized by rapid kinetics,
high level (up to 1000-fold higher than most cell types), and
broad spectrum of IFN types (a and b). This is facilitated by mul-
tiple mechanisms, including high secretory capacity reflected in
‘‘plasmacytoid’’ (i.e., plasma cell-like) morphology; high basal
expression of IRF7, the key transcriptional regulator of IFN re-
sponse (Barchet et al., 2002); and prolonged retention of TLR li-
gands in early endosomes (Honda et al., 2005). In addition, PDCs
specifically express several unique receptors that modulate IFN
production, including human BDCA-2/CD303 and ILT7 and mu-
rine SiglecH (Gilliet et al., 2008). Thus, the unique functional
Cell 135, 37–48, October 3, 2008 ª2008 Elsevier Inc. 37

properties of PDCs are reflected in their specific gene expression
program.
Although PDCs clearly represent a distinct hematopoietic cell
lineage, the molecular and cellular basis of their development is
poorly understood. PDCs develop in the bone marrow (BM)
from a common progenitor of both cDCs and PDCs (also termed
‘‘pro-DCs’’ [Naik et al., 2007; Onai et al., 2007]). On the other
hand, the developmental progression between pro-DC and com-
mitted PDC remains uncharacterized (Wu and Liu, 2007). An im-
portant signal for PDC development is provided by cytokine Flt3
ligand (Flt3L) through its receptor Flt3 and transcriptional effector
Stat3; however, the same molecules also drive the development
of cDCs (Laouar et al., 2003; Onai et al., 2006). Moreover, Stat3
mediates the proliferation of cDC and PDC progenitors but is dis-
pensable for the specification of PDCs (Esashi et al., 2008). Tran-
scription factor Irf8 is required for PDC development (Schiavoni
et al., 2002; Tsujimura et al., 2003); at the same time, it is essential
for the development and/or function of macrophages and cDCs
(Wu and Liu, 2007). Transcription factor SpiB is preferentially ex-
pressed in the PDC, and its RNAi-mediated knockdown specifi-
cally impaired human PDC development in vitro (Schotte et al.,
2004); however, the role of SpiB in PDC development in vivo is un-
known. Thus, additional transcriptional mechanisms are likely to
specify the unique identity and expression profile of the PDC.
E proteins comprise a family of basic helix-loop-helix (bHLH)
transcription factors homologous to Drosophila protein Daugh-
terless (Lazorchak et al., 2005; Murre, 2005). E proteins include
E12 and E47 (encoded by a single gene, E2a), HEB, and E2-2,
which form homodimers or heterodimers with other family mem-
bers. E protein dimers bind E box sequences (CANNTG) with an
apparent preference for C or G in the middle positions. The ac-
tivity of E proteins is antagonized by the Id proteins (Id1–Id4),
which sequester them into nonfunctional heterodimers. The
E2a gene products are absolutely required for B lymphocyte de-
velopment and maintenance, including immunoglobulin gene re-
arrangement and the expression of key genes such as RAG1/2
and Tdt (Dntt). Similarly, a combined activity of E2a and HEB reg-
ulates T cell receptor rearrangement, proliferation, and selection
in developing T lymphocytes. In contrast, E2-2-deficient lympho-
cytes develop normally, showing a slight reduction only in com-
petitive settings (Bergqvist et al., 2000; Wikstrom et al., 2006;
Zhuang et al., 1996). Thus, E2-2 is largely dispensable for
T and B lymphocyte development, and its function in the immune
system has remained unclear.
Specification of several cDC subsets requires the expression
of E protein inhibitors such as Id2; in contrast, PDCs are not af-
fected by the loss of Id2 (Hacker et al., 2003). Conversely, over-
expression of Id proteins in human hematopoietic progenitors
inhibited the development of both T and B lymphocytes and
PDCs but not of cDCs (Spits et al., 2000). Furthermore, mature
PDCs express genes that represent E protein targets in early
lymphocyte development, such as RAG1/2 genes, TdT (Dntt),
VpreB, and pre-T cell receptor a (PTCRA) (Harman et al., 2006;
Pelayo et al., 2005; Shigematsu et al., 2004). These observations
prompted us to analyze the expression and function of E proteins
in the PDC lineage. We now report that E protein E2-2 is a specific
regulator of PDC development and of PDC-dependent IFN re-
sponses in mice and in humans.
38 Cell 135, 37–48, October 3, 2008 ª2008 Elsevier Inc.
RESULTS
E2-2 Is Preferentially Expressed in the PDCThe analysis of E protein gene expression in sorted murine PDCs
by quantitative RT-PCR (qRT-PCR) showed that E2a (Tcfe2a)
and HEB (Tcf12) were expressed comparably in the PDC and
in other cell types (Figure 1A). On the other hand, E2-2 (gene
symbol Tcf4; thereafter called E2-2 to avoid confusion with
Tcf/LEF family member Tcf4/Tcf7l2) was abundantly expressed
in PDCs, expressed at lower levels in B cells, and barely detect-
able in other cell types, a pattern similar to that of SpiB. The same
PDC-enriched expression of E2-2 was observed in the human
PDC (Figure 1B). Conversely, E protein inhibitor Id2 was abun-
dantly expressed in cDCs but excluded from murine PDCs, likely
facilitating E protein activity in the latter (Figure 1C). Furthermore,
the expression of E2-2 as well as of SpiB was reduced after
CpG-induced activation of PDCs, consistent with the ongoing
differentiation into cDCs (Figure 1D).
The analysis of E protein expression in the human PDC cell
line CAL-1 (Maeda et al., 2005) showed that E2-2 protein was
detected in CAL-1 but not in T cell lymphoma line MOLT-4
(Figure 1E). Indeed, genome-wide expression analysis revealed
that E2-2, along with SPIB, IRF8, and IRF7, is highly enriched in
CAL-1 compared to MOLT-4 (Figure S1 and Document S2 avail-
able online). Electrophoretic mobility shift assay (EMSA) showed
that E box-binding nuclear protein complexes in CAL-1 were
supershifted by antibodies to E2-2 but not to E2A, whereas
the opposite was observed in MOLT-4 (Figure 1F). Similar to
murine PDCs, CpG-treated CAL-1 cells showed reduced E2-2
expression and low levels of E2-2-containing E protein com-
plexes (Figure S2). These data demonstrate that E2-2 is ex-
pressed preferentially in the mature, steady-state PDCs and is
a major component of E box-binding protein complexes in these
cells.
The Development of E2-2�/� PDCs Is Blockedat an Immature StageTo test the role of E2-2 in PDC development, we analyzed mice
with a germline mutation of E2-2 (Zhuang et al., 1996). Because
E2-2�/� knockout (KO) animals die at birth, we transferred
E2-2+/+ control or E2-2�/� KO fetal liver cells (expressing the
CD45.2 allelic marker) into lethally irradiated CD45.1 recipients
and analyzed the development of donor-derived CD45.2+ he-
matopoietic cells. Murine PDCs are CD11clow, Ly-6C+, B220+
and express specific markers such as Bst2 (mPDCA1) and
SiglecH. We found that KO fetal liver cells mediated efficient
hematopoietic reconstitution and gave rise to myeloid cells,
T and B lymphocytes, and CD11b+ (CD8�) and CD11b�
(CD8+) cDC subsets (Figure 2A and Figure S3). In contrast,
KO-derived PDCs were completely absent from the BM and
all lymphoid organs (Figures 2A and 2B and Figure S4). Consis-
tent with the absence of PDCs, no IFNa could be detected in the
supernatants of KO donor-derived splenocytes and BM cells
after culture with type A CpG (n = 3; data not shown). Thus,
the deletion of E2-2 in hematopoietic stem cells completely
blocks the emergence of PDCs.
In agreement with the blocked PDC development in vivo,
Flt3L-supplemented cultures of KO-reconstituted BM failed to

Figure 1. E2-2 Is Preferentially Expressed in the PDC
(A) Expression of E protein genes in sorted splenic cell populations from wild-
type mice, including PDCs (CD11clow Bst2+), B cells (CD11c� B220+), T cells
(TCRb+), monocytes and macrophages (M, CD11c� CD11b+ side scatterlow),
and cDCs (CD11chigh CD11b+). Data represent normalized expression levels
relative to the PDC sample, as determined by qRT-PCR (mean ± SD of tripli-
cate reactions). The expression of the PDC-enriched transcription factor
SpiB is shown as a control.
(B) Expression of E protein genes in sorted human peripheral blood cell pop-
ulations, determined by qRT-PCR as above. Cells include PDCs (BDCA-4+),
B cells (CD19+), T cells (CD3+), monocytes (Mo, CD14+) and total mononuclear
cells (MNC).
(C) The expression of E protein genes and Id2 in PDCs. Shown is RT-PCR anal-
ysis of cell populations sorted as described in (A).
(D) The expression of E2-2 in PDCs undergoing differentiation into cDCs. BM
culture-derived PDCs were purified, incubated with type B CpG for 48 hr (+),
and analyzed by qRT-PCR for the expression of E2-2, SpiB, and the cDC-spe-
cific pI transcript of class II transactivator (CIITA pI) as a control. Data represent
normalized expression levels relative to the untreated (�) PDC sample (mean ±
SD of triplicate reactions).
(E) The expression of E proteins in the human PDC cell line. Shown is Western
blot analysis of the indicated proteins in the PDC line CAL-1 and in T cell lym-
phoma MOLT-4.
generate CD11c+ B220+ PDCs and consisted entirely of CD11c+
CD11b+ cDCs (Figure 2C). These cultures showed the initial
presence of donor-derived CD11c+ CD11b� B220�/low popula-
tion, suggesting that E2-2-deficient progenitors initiated devel-
opment toward the PDC lineage but failed to differentiate. To
test this notion in vivo, we analyzed donor-derived BM cells in
control- and KO-reconstituted chimeric mice (Figure 2D). In con-
trol BM, nearly all donor-derived CD11c+ CD11b� cells were
Flt3low and Ly-6C+, and the majority expressed PDC markers
B220 and Bst2; some cells also expressed peripheral PDC
marker Ly-49Q. Notably, a small fraction of CD11c+ CD11b�
cells negative for B220 or Bst2 was also present in control BM.
In KO BM, the reduced CD11c+ CD11b� population expressed
Flt3 and Ly-6C, but was low or negative for B220, Bst2, and
Ly-49Q. Thus, E2-2-deficient BM PDCs accumulated as an im-
mature CD11c+ Ly-6C+ Bst2� population, which likely repre-
sents a natural early stage of PDC differentiation. Indeed, lineage
tracing with DC- and PDC-specific CD11c-Cre strain indicates
that this population has initiated development along the PDC
lineage (Figure S5). These data suggest a developmental se-
quence from the CD11c� pro-DC to immature CD11c+ Ly-6C+
PDC to mature CD11c+ Ly-C6+ Bst2+ B220+ PDC, with the latter
maturation step being fully dependent on E2-2 expression
(Figure 2E).
Conditional Inactivation of E2-2 Impairs PDCDevelopmentTo test the consequences of E2-2 inactivation in the adult organ-
ism, we used a conditional LoxP-flanked (‘‘floxed’’) allele of E2-2
(Bergqvist et al., 2000) crossed to R26-CreER mice, which
ubiquitously express a tamoxifen-inducible Cre recombinase
(CreER). Conditional knockout (CKO, E2-2flox/flox, R26-CreER+)
mice and Cre-expressing wild-type controls (E2-2wt/wt, R26-
Cre+) were analyzed 10 days after initial tamoxifen administra-
tion, at which point efficient E2-2 combination was observed in
CKO spleens (Figure S6). Compared to controls, the absolute
numbers of PDCs in the BM and spleens of CKO mice were
reduced �7-fold and >10-fold, respectively (Figure 3A). In con-
trast, total CKO splenocyte numbers were only marginally re-
duced (1.6-fold), and the relative content of all major cell types
was unchanged. Furthermore, the BM of CKO animals failed to
give rise to PDCs in Flt3L cultures in vitro (Figure 3B). Although
control total spleen and BM cells manifested robust IFN secre-
tion in response to CpG, the cells from CKO mice failed to pro-
duce IFN (Figure 3C). Thus, widespread loss of E2-2 selectively
abolishes PDC development during adult hematopoiesis and
eliminates PDC-dependent IFN response.
To test for a potential role of other E proteins in the PDC line-
age, we used the same R26-CreER system to induce a simulta-
neous loss of both E2a and HEB (Jones and Zhuang, 2007). No
(F) The analysis of E box-binding nuclear proteins in the PDC. Shown is EMSA
with radiolabeled E box-containing probe and nuclear extracts from CAL-1 or
MOLT-4 cells. The binding reactions contained no additives (�), control (Ctrl)
or E protein-specific antibodies, unlabeled probe as a competitor (Comp), or
unlabeled probe with a mutated E box (Comp*). No supershift was observed
with anti-HEB antibody in CAL-1 (data not shown).
Cell 135, 37–48, October 3, 2008 ª2008 Elsevier Inc. 39
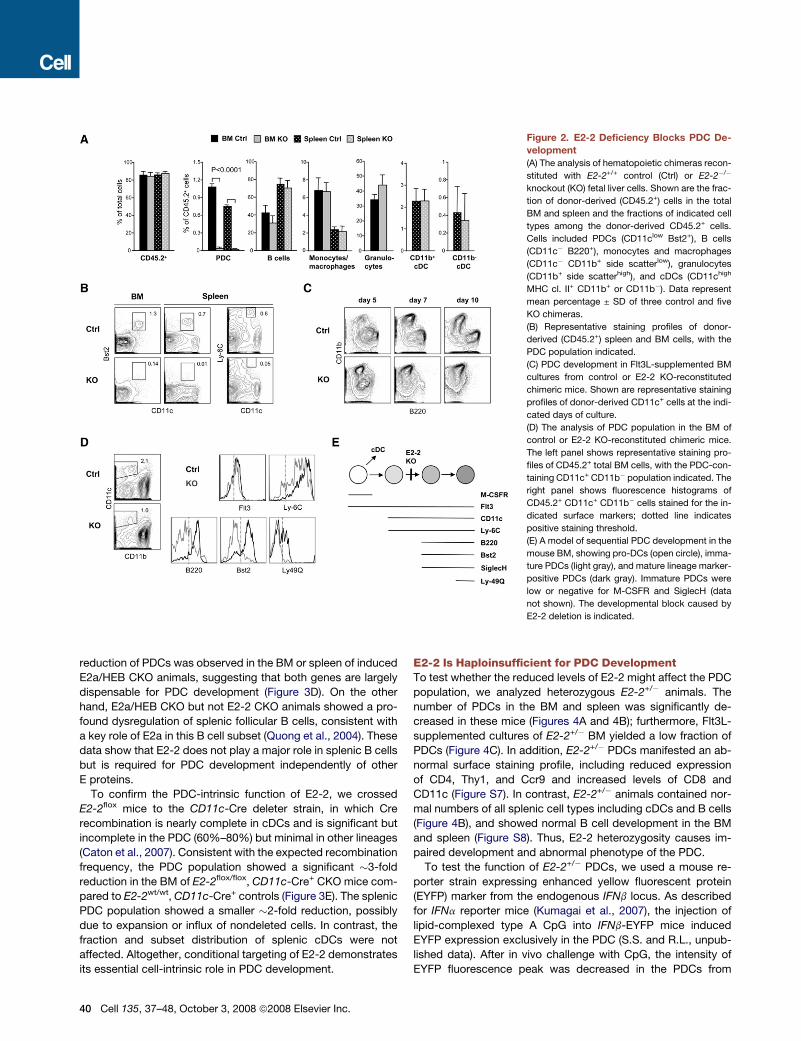
Figure 2. E2-2 Deficiency Blocks PDC De-
velopment
(A) The analysis of hematopoietic chimeras recon-
stituted with E2-2+/+ control (Ctrl) or E2-2�/�
knockout (KO) fetal liver cells. Shown are the frac-
tion of donor-derived (CD45.2+) cells in the total
BM and spleen and the fractions of indicated cell
types among the donor-derived CD45.2+ cells.
Cells included PDCs (CD11clow Bst2+), B cells
(CD11c� B220+), monocytes and macrophages
(CD11c� CD11b+ side scatterlow), granulocytes
(CD11b+ side scatterhigh), and cDCs (CD11chigh
MHC cl. II+ CD11b+ or CD11b�). Data represent
mean percentage ± SD of three control and five
KO chimeras.
(B) Representative staining profiles of donor-
derived (CD45.2+) spleen and BM cells, with the
PDC population indicated.
(C) PDC development in Flt3L-supplemented BM
cultures from control or E2-2 KO-reconstituted
chimeric mice. Shown are representative staining
profiles of donor-derived CD11c+ cells at the indi-
cated days of culture.
(D) The analysis of PDC population in the BM of
control or E2-2 KO-reconstituted chimeric mice.
The left panel shows representative staining pro-
files of CD45.2+ total BM cells, with the PDC-con-
taining CD11c+ CD11b� population indicated. The
right panel shows fluorescence histograms of
CD45.2+ CD11c+ CD11b� cells stained for the in-
dicated surface markers; dotted line indicates
positive staining threshold.
(E) A model of sequential PDC development in the
mouse BM, showing pro-DCs (open circle), imma-
ture PDCs (light gray), and mature lineage marker-
positive PDCs (dark gray). Immature PDCs were
low or negative for M-CSFR and SiglecH (data
not shown). The developmental block caused by
E2-2 deletion is indicated.
reduction of PDCs was observed in the BM or spleen of induced
E2a/HEB CKO animals, suggesting that both genes are largely
dispensable for PDC development (Figure 3D). On the other
hand, E2a/HEB CKO but not E2-2 CKO animals showed a pro-
found dysregulation of splenic follicular B cells, consistent with
a key role of E2a in this B cell subset (Quong et al., 2004). These
data show that E2-2 does not play a major role in splenic B cells
but is required for PDC development independently of other
E proteins.
To confirm the PDC-intrinsic function of E2-2, we crossed
E2-2flox mice to the CD11c-Cre deleter strain, in which Cre
recombination is nearly complete in cDCs and is significant but
incomplete in the PDC (60%–80%) but minimal in other lineages
(Caton et al., 2007). Consistent with the expected recombination
frequency, the PDC population showed a significant �3-fold
reduction in the BM of E2-2flox/flox, CD11c-Cre+ CKO mice com-
pared to E2-2wt/wt, CD11c-Cre+ controls (Figure 3E). The splenic
PDC population showed a smaller �2-fold reduction, possibly
due to expansion or influx of nondeleted cells. In contrast, the
fraction and subset distribution of splenic cDCs were not
affected. Altogether, conditional targeting of E2-2 demonstrates
its essential cell-intrinsic role in PDC development.
40 Cell 135, 37–48, October 3, 2008 ª2008 Elsevier Inc.
E2-2 Is Haploinsufficient for PDC DevelopmentTo test whether the reduced levels of E2-2 might affect the PDC
population, we analyzed heterozygous E2-2+/� animals. The
number of PDCs in the BM and spleen was significantly de-
creased in these mice (Figures 4A and 4B); furthermore, Flt3L-
supplemented cultures of E2-2+/� BM yielded a low fraction of
PDCs (Figure 4C). In addition, E2-2+/� PDCs manifested an ab-
normal surface staining profile, including reduced expression
of CD4, Thy1, and Ccr9 and increased levels of CD8 and
CD11c (Figure S7). In contrast, E2-2+/� animals contained nor-
mal numbers of all splenic cell types including cDCs and B cells
(Figure 4B), and showed normal B cell development in the BM
and spleen (Figure S8). Thus, E2-2 heterozygosity causes im-
paired development and abnormal phenotype of the PDC.
To test the function of E2-2+/� PDCs, we used a mouse re-
porter strain expressing enhanced yellow fluorescent protein
(EYFP) marker from the endogenous IFNb locus. As described
for IFNa reporter mice (Kumagai et al., 2007), the injection of
lipid-complexed type A CpG into IFNb-EYFP mice induced
EYFP expression exclusively in the PDC (S.S. and R.L., unpub-
lished data). After in vivo challenge with CpG, the intensity of
EYFP fluorescence peak was decreased in the PDCs from

Figure 3. Conditional Inactivation of E2-2
Impairs PDC Development
(A) The analysis of R26-CreER+ control (Ctrl,
E2-2wt/wt) and conditional knockout (CKO,
E2-2flox/flox) mice 10 days after the induction of
Cre recombination by tamoxifen. Shown are abso-
lute numbers of total cells and of the PDCs in the
spleen and BM and fractions of indicated cell
types in the spleen (mean ± SD of four animals per
genotype). Cells included PDCs (CD11clow Bst2+),
B cells (CD11c� B220+), monocytes and macro-
phages (M/MF, CD11c� CD11b+ side scatterlow),
cDCs (CD11chigh MHC cl. II+, CD8�, or CD8+),
T cells (TCRb+, CD4+, or CD8+) and NK cells (DX5+).
(B) PDC development in Flt3L-supplemented BM
cultures from induced control and CKO mice.
Shown are representative staining profiles of
CD11c+ cells from day nine BM cultures; CD11b�
B220+ or Bst2+ PDCs are indicated (mean percent-
age ± SD of cultures from four individual mice).
(C) CpG-induced secretion of IFNa by total spleno-
cytes and BM cells from induced control and CKO
mice. Cells were incubated with type A CpG for
48 hr, and IFNa concentration in the supernatant
was determined by ELISA. Symbols represent
cell cultures from individual mice.
(D)Tamoxifen-induceddeletionofE proteins inadult
animals. R26-CreER+ mice conditional for E2-2
(E2-2flox/flox) or E2a/HEB (E2aflox/flox HEBflox/flox)
were analyzed 10 days after the induction. Wild-
type C57BL/6 mice were used as controls for
E2a/HEB CKO. Shown are gated B220+ BM or
spleen cells stained for PDCs (CD11clow Bst2+) or
gated B220+ AA4.1� splenocytes stained for follic-
ular (CD23high CD21low) or marginal zone (CD23low
CD21high) B cells. The fractions of cell populations
among total BM or spleen cells are indicated
(mean ± SD of two to three animals per genotype).
(E) The analysis of CD11c-Cre+ control (E2-2 wt/wt)
and CKO (E2-2flox/flox) animals. Shown are repre-
sentative staining profiles of total BM and spleen
cells from control and CKO mice, with the percent-
age of PDC, cDC, and cDC subsets indicated
(mean ± SD of five animals per genotype).
E2-2+/� reporter mice compared to those from E2-2+/+ litter-
mates, suggesting an impaired induction of IFNb gene
(Figure 4D). Furthermore, serum IFNa was undetectable in
CpG-challenged E2-2+/� mice (Figure 4E), whereas cDC-medi-
ated serum IFN response to double-stranded RNA polymer
poly-I:C (Kumagai et al., 2007) was not impaired. Furthermore,
E2-2+/� mice mounted normal T cell-dependent antibody re-
sponses, suggesting that E2-2 reduction does not impair B cell
function (Figure 4F). Thus, E2-2 heterozygosity results in the re-
duced number of functionally impaired PDCs, revealing a hap-
loinsufficiency of E2-2 for PDC development.
E2-2 Controls PDC Development in HumansTo test whether E2-2 plays a similarly important role in the human
PDC, we analyzed human patients with Pitt-Hopkins syndrome
(PHS). PHS is a rare autosomal-dominant genetic disorder char-
acterized by abnormal craniofacial and neural development, se-
vere mental retardation, and motor dysfunction. Recent studies
identified monoallelic loss-of-function mutations or deletions of
TCF4 (E2-2) and the resulting E2-2 haploinsufficiency as a cause
of PHS (Amiel et al., 2007; Zweier et al., 2007). We analyzed PDC
phenotype and function in the peripheral blood from three PHS
patients and five healthy control subjects. All major immune
cell types, including naive and isotype-switched B cells, were
present in normal numbers in PHS patients; similarly, the levels
of serum immunoglobulins were normal (data not shown). The
PDCs were present in all patients (Figure 5A) and expressed
the expected high levels of CD45RA and CD123 (IL-3R); how-
ever, the expression of specific PDC marker BDCA-2/CD303
was significantly reduced (Figures 5B and 5C). The expression
of ILT7 was more variable in controls, but uniformly low in the pa-
tients. Importantly, in vitro IFNa secretion in response to CpG
was strongly reduced in all PHS patients, suggesting a severe
functional defect of the PDC (Figure 5D). In contrast, phytohe-
magglutinin- and IL-2-induced secretion of IFNg closely corre-
lated with the number of CD56+ CD3+ cells and was not impaired
Cell 135, 37–48, October 3, 2008 ª2008 Elsevier Inc. 41

Figure 4. Impaired PDC Development and Function in E2-2 Heterozygous Mice
(A) Representative staining profiles of PDCs from the BM and spleen of E2-2+/� mice (Het) and wild-type control (Ctrl) littermates.
(B) Absolute numbers of PDCs (CD11clow Bst2+) in E2-2+/� and control mice (mean ± SD of 8–11 mice per genotype). The numbers of splenic B cells (B220+) and
cDCs (CD11chigh MHC cl. II+) are also shown.
(C) PDC development in Flt3L-supplemented BM cultures from E2-2+/� and control mice. Shown are representative staining profiles of gated CD11c+ cells from
day 10 BM cultures; the PDC fraction is indicated (mean percentage ± SD of cultures from four individual mice).
(D) Induction of IFNb gene expression in vivo. E2-2+/�mice or E2-2+/+ littermate controls carrying one copy of IFNb-EYFP knockin allele were injected with CpG/
lipid complex, and EYFP expression was measured 6 hr later. Shown are EYFP fluorescence profiles of splenic PDCs (B220+ Bst2+) with the percentage and mean
fluorescence intensity (MFI) of EYFP+ cells indicated. Data are representative of four independent experiments (five to seven animals per genotype).
(E) Systemic IFN response after challenge with TLR ligands in vivo. E2-2+/� or control littermates were injected with TLR9 ligand CpG/lipid or with TLR3 ligand
pI:C, and serum IFNa was measured 6 or 12 hr later, respectively. E2-2+/�mice similarly failed to mount IFN response to CpG after 12 hr (data not shown). Sym-
bols represent IFNa concentrations in individual animals. The relatively low levels of CpG-induced IFNa are likely due to the early time point analyzed.
(F) T cell-dependent antibody responses in E2-2+/� and control mice. The mice were immunized with nitrophenyl (NP)-keyhole limpet hemocyanin (KLH) conju-
gate (50 mg in alum adjuvant), and serum anti-NP antibody titers were measured by ELISA at the indicated time points. Symbols represent individual control (open
squares) or E2-2+/� (black triangles) immunized mice; asterisks indicate antibody levels below the detection limit. Similar results were obtained with IgG2a isotype
(data not shown).
on a per-cell basis (data not shown). Thus, normal levels of E2-2
expression are essential for the development of functional PDCs
in both mice and humans.
E2-2 Controls the Gene Expression Program of the PDCTo test whether E2-2 controls the specific gene expression pro-
gram of PDCs, we performed genome-wide expression analysis
of PDCs from E2-2+/� mice compared to wild-type controls
(Document S3). Differentially expressed genes were analyzed
against the database of gene expression in PDCs and other im-
mune cell lineages (Robbins et al., 2008). Clustering based on
the probe set downregulated in E2-2+/� cells separated PDCs
42 Cell 135, 37–48, October 3, 2008 ª2008 Elsevier Inc.
away from all other cell types, suggesting that this set is highly
enriched for PDC signature genes (Figure 6A). Indeed, several
strongly downregulated genes (Dntt, Mgl1, Ldhb, Ccr9) are ex-
pressed predominantly in the PDC compared to other mature
cell types (Figures 6B and 6C). The reduction of these genes in
E2-2+/� PDCs was confirmed by qRT-PCR (Figure 6D), or by
flow cytometry in the case of Ccr9 (Figure S7). These data
demonstrate that E2-2 controls the expression of multiple
PDC-enriched genes, including the genes common to PDCs
and immature lymphocytes (such as Dntt and Ccr9).
Next, we focused on the genes involved in PDC development
and/or function. The expression of Toll-like receptors Tlr7 and
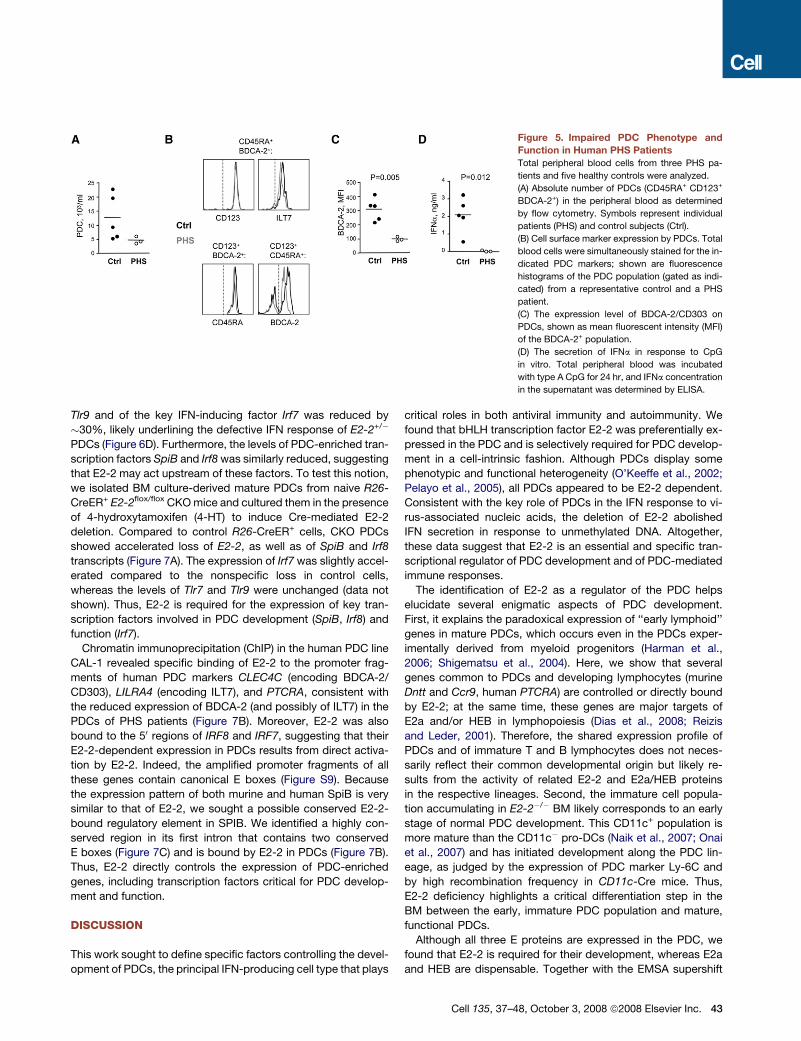
Figure 5. Impaired PDC Phenotype and
Function in Human PHS Patients
Total peripheral blood cells from three PHS pa-
tients and five healthy controls were analyzed.
(A) Absolute number of PDCs (CD45RA+ CD123+
BDCA-2+) in the peripheral blood as determined
by flow cytometry. Symbols represent individual
patients (PHS) and control subjects (Ctrl).
(B) Cell surface marker expression by PDCs. Total
blood cells were simultaneously stained for the in-
dicated PDC markers; shown are fluorescence
histograms of the PDC population (gated as indi-
cated) from a representative control and a PHS
patient.
(C) The expression level of BDCA-2/CD303 on
PDCs, shown as mean fluorescent intensity (MFI)
of the BDCA-2+ population.
(D) The secretion of IFNa in response to CpG
in vitro. Total peripheral blood was incubated
with type A CpG for 24 hr, and IFNa concentration
in the supernatant was determined by ELISA.
Tlr9 and of the key IFN-inducing factor Irf7 was reduced by
�30%, likely underlining the defective IFN response of E2-2+/�
PDCs (Figure 6D). Furthermore, the levels of PDC-enriched tran-
scription factors SpiB and Irf8 was similarly reduced, suggesting
that E2-2 may act upstream of these factors. To test this notion,
we isolated BM culture-derived mature PDCs from naive R26-
CreER+ E2-2flox/flox CKO mice and cultured them in the presence
of 4-hydroxytamoxifen (4-HT) to induce Cre-mediated E2-2
deletion. Compared to control R26-CreER+ cells, CKO PDCs
showed accelerated loss of E2-2, as well as of SpiB and Irf8
transcripts (Figure 7A). The expression of Irf7 was slightly accel-
erated compared to the nonspecific loss in control cells,
whereas the levels of Tlr7 and Tlr9 were unchanged (data not
shown). Thus, E2-2 is required for the expression of key tran-
scription factors involved in PDC development (SpiB, Irf8) and
function (Irf7).
Chromatin immunoprecipitation (ChIP) in the human PDC line
CAL-1 revealed specific binding of E2-2 to the promoter frag-
ments of human PDC markers CLEC4C (encoding BDCA-2/
CD303), LILRA4 (encoding ILT7), and PTCRA, consistent with
the reduced expression of BDCA-2 (and possibly of ILT7) in the
PDCs of PHS patients (Figure 7B). Moreover, E2-2 was also
bound to the 50 regions of IRF8 and IRF7, suggesting that their
E2-2-dependent expression in PDCs results from direct activa-
tion by E2-2. Indeed, the amplified promoter fragments of all
these genes contain canonical E boxes (Figure S9). Because
the expression pattern of both murine and human SpiB is very
similar to that of E2-2, we sought a possible conserved E2-2-
bound regulatory element in SPIB. We identified a highly con-
served region in its first intron that contains two conserved
E boxes (Figure 7C) and is bound by E2-2 in PDCs (Figure 7B).
Thus, E2-2 directly controls the expression of PDC-enriched
genes, including transcription factors critical for PDC develop-
ment and function.
DISCUSSION
This work sought to define specific factors controlling the devel-
opment of PDCs, the principal IFN-producing cell type that plays
critical roles in both antiviral immunity and autoimmunity. We
found that bHLH transcription factor E2-2 was preferentially ex-
pressed in the PDC and is selectively required for PDC develop-
ment in a cell-intrinsic fashion. Although PDCs display some
phenotypic and functional heterogeneity (O’Keeffe et al., 2002;
Pelayo et al., 2005), all PDCs appeared to be E2-2 dependent.
Consistent with the key role of PDCs in the IFN response to vi-
rus-associated nucleic acids, the deletion of E2-2 abolished
IFN secretion in response to unmethylated DNA. Altogether,
these data suggest that E2-2 is an essential and specific tran-
scriptional regulator of PDC development and of PDC-mediated
immune responses.
The identification of E2-2 as a regulator of the PDC helps
elucidate several enigmatic aspects of PDC development.
First, it explains the paradoxical expression of ‘‘early lymphoid’’
genes in mature PDCs, which occurs even in the PDCs exper-
imentally derived from myeloid progenitors (Harman et al.,
2006; Shigematsu et al., 2004). Here, we show that several
genes common to PDCs and developing lymphocytes (murine
Dntt and Ccr9, human PTCRA) are controlled or directly bound
by E2-2; at the same time, these genes are major targets of
E2a and/or HEB in lymphopoiesis (Dias et al., 2008; Reizis
and Leder, 2001). Therefore, the shared expression profile of
PDCs and of immature T and B lymphocytes does not neces-
sarily reflect their common developmental origin but likely re-
sults from the activity of related E2-2 and E2a/HEB proteins
in the respective lineages. Second, the immature cell popula-
tion accumulating in E2-2�/� BM likely corresponds to an early
stage of normal PDC development. This CD11c+ population is
more mature than the CD11c� pro-DCs (Naik et al., 2007; Onai
et al., 2007) and has initiated development along the PDC lin-
eage, as judged by the expression of PDC marker Ly-6C and
by high recombination frequency in CD11c-Cre mice. Thus,
E2-2 deficiency highlights a critical differentiation step in the
BM between the early, immature PDC population and mature,
functional PDCs.
Although all three E proteins are expressed in the PDC, we
found that E2-2 is required for their development, whereas E2a
and HEB are dispensable. Together with the EMSA supershift
Cell 135, 37–48, October 3, 2008 ª2008 Elsevier Inc. 43

Figure 6. E2-2 Regulates the Expression of PDC-Enriched Genes
Sorted PDCs from E2-2+/� mice and wild-type littermate controls were analyzed by microarray expression profiling, and the results were compared to the ex-
pression database of normal immune cell populations (GEO dataset GSE9810).
(A) Clustering of cell populations by total probe set or by the probe sets increased or decreased in E2-2+/� PDCs.
(B) Pairwise comparison of E2-2+/� (Het) and control (Ctrl) PDC expression profiles. The scatter plot represents normalized log intensities of individual probes,
with the probes increased or decreased >3-fold in E2-2+/� PDCs indicated in red and green, respectively. The probes prominently decreased in E2-2+/� PDCs are
highlighted in blue.
(C) Expression profiles of the decreased probes from (B) in normal immune cell populations.
(D) Gene expression in sorted PDCs as determined by qRT-PCR. Data represent percent decrease of the indicated genes in E2-2+/� compared to control wild-
type PDCs (mean ± SD of values from three to four independently sorted and analyzed PDC samples). The expected 50% decrease of E2-2 expression is in-
dicated by the dotted line.
analysis, these data suggest that E2-2 acts primarily as a homo-
dimer in PDCs. Whereas E2a protein levels are increased in ac-
tivated B cells (Quong et al., 1999), the expression and activity of
E2-2 were decreased upon PDC activation, reflecting the differ-
entiation into another cell type, the cDC. Despite its expression in
B cells, previous studies (Wikstrom et al., 2006; Zhuang et al.,
1996) and our data suggest that E2-2 is largely dispensable for
the development and maintenance of B cells. The reciprocal
roles of E2-2 and E2a are likely explained by their relative abun-
dance, which favors the formation of the respective homodimers
in PDCs and in B cells. Because the expression level of each
E protein gene appears to be perfectly tuned to its function, re-
duced gene dosage in heterozygotes results in haploinsuffi-
ciency. Thus, E2a+/� mice show impaired B cells development
and selection and a specific reduction of splenic follicular B cells
(Quong et al., 2004). Similarly, E2-2+/� mice contain lower num-
bers of PDCs; moreover, these PDCs show reduced expression
of multiple PDC-enriched genes and are impaired in their IFN
44 Cell 135, 37–48, October 3, 2008 ª2008 Elsevier Inc.
production capacity. The latter can be explained by the reduced
expression of key IFN response components TLR7/9 and IRF7,
likely in conjunction with other pathway components. Thus, the
correct E2-2 expression level is required for the acquisition of
mature PDC gene expression program and for the resulting
IFN production capacity.
Recent studies revealed an evolutionarily conserved role of
E2-2 in neural development. Thus, E2-2 deficiency abrogates
the specification of pontine nucleus neurons in the mouse brain
(Flora et al., 2007), whereas E2-2 haploinsufficiency leads to se-
vere morphological and functional brain abnormalities in human
PHS patients (Amiel et al., 2007; Zweier et al., 2007). Similarly,
we found that E2-2 is preferentially expressed in both murine
and human PDCs, in agreement with the recent microarray
data (Robbins et al., 2008). Furthermore, PDCs from all three
analyzed PHS patients showed aberrant surface phenotype
and a profound defect of IFN secretion, similar to the results
from E2-2+/� mice. Of note, at least two of the three analyzed

Figure 7. E2-2 Directly Activates PDC-Enriched Genes
(A) The expression of PDC-enriched transcription factors after E2-2 deletion in mature PDCs. Purified BM culture-derived PDCs from naive R26-CreER+ control
(E2-2wt/wt) or CKO (E2-2flox/flox) mice were incubated with tamoxifen in vitro, and the expression of indicated transcripts was monitored by qRT-PCR. No differ-
ences in cell viability have been observed in the cultures (data not shown). The levels of all genes at day 1 were similar to those on day 0 and were taken as 100%.
Data represent mean normalized values ± SD of triplicate PCR reactions.
(B) The binding of E2-2 to the regulatory regions of PDC-expressed genes. Chromatin immunoprecipitation was performed in human PDC line CAL-1 with
anti-E2-2 or control antibodies, and the isolated chromatin was analyzed by qPCR. The data represent normalized fold enrichment of the indicated genes in
anti-E2-2 compared to control antibody ChIP (mean ± SD of triplicate reactions). An irrelevant gene (PROM1) and an irrelevant internal fragment of CLEC4C
gene (CLEC4C*) were used as negative controls.
(C) The map of the human SPIB 50 region and first intron, with the percent identity plot comparison to other genomes generated by ECR software
(http://ecrbrowser.dcode.org). The conserved region in the first intron amplified by ChIP is highlighted with a red oval, and partial alignment of the human
(top) and mouse (bottom) sequences is shown to the right. Conserved E boxes are indicated in red.
PHS patients have a history of recurrent respiratory tract infec-
tions, consistent with the defective IFN response of their PDCs.
Although the rarity of the disease and ethical considerations
precluded a broader analysis of PHS patients, these data sup-
port an evolutionarily conserved role of E2-2 in human PDC de-
velopment.
How does E2-2 control PDC differentiation? The most obvi-
ous possibility is a direct induction of gene sets that would be
critical for PDC commitment and/or lineage identity. Indeed,
we found that several PDC-enriched genes (including bona
fide specific markers such as BDCA-2) were reduced in human
and/or murine E2-2+/� cells; moreover, E2-2 showed direct
binding to the promoters of these genes. In addition, E2-2 con-
trols the expression levels and directly binds to the regulatory
regions of PDC-enriched transcription factors implicated in
PDC development (SpiB, IRF8) and function (IRF7). Although
neither gene is expressed or required exclusively in the PDC,
the E2-2-initiated transcriptional network may control PDC-
specific gene expression through the combined action of all
these factors. Indeed, homologous transcription factors includ-
ing E protein E2a, SpiB-related Ets protein PU.1, and IRF
family proteins Irf4 and Irf8 comprise a critical part of B
Cell 135, 37–48, October 3, 2008 ª2008 Elsevier Inc. 45
lymphocyte regulatory network (Nutt and Kee, 2007; Singh
et al., 2005). SpiB appears to be a prominent direct target of
E2-2 because its expression is very similar to that of E2-2
and is rapidly decreased after E2-2 deletion; moreover, the
identified region of E2-2 binding in the SpiB first intron is highly
conserved. Thus, E2-2 serves as an upstream component of
the complex genetic network that mediates PDC lineage com-
mitment and differentiation.
E protein genes E2a and HEB are collectively required for ev-
ery aspect of adaptive immune system development (Lazorchak
et al., 2005; Murre, 2005). Conversely, the inhibition of E protein
activity by Id2 protein is required for the development of several
innate immunity cell types, such as natural killer (NK) cells and
several cDC subsets (Hacker et al., 2003). We found that a key
innate IFN-producing cell type lacks Id2 expression but instead
is absolutely dependent on the third E protein, E2-2. These re-
sults not only confirm the critical function of all three E proteins
in hematopoiesis but also extend it to the development of innate
immune system. Notably, three E protein genes (as opposed to
a single gene in invertebrates and chordates) are present in the
genomes of jawed fish, which possess a V(D)J recombination-
based lymphoid system as well as IFN response-related genes
encoding IFN, IFN receptor, and IRF7. Thus, the diversification
of E protein family appears to mirror the development of distinct
lymphoid and IFN-producing lineages and is likely to play a role
in these evolutionary steps.
In summary, our data identify E2-2 as an essential and spe-
cific transcriptional regulator of PDC development and of the
PDC-mediated IFN response. These results open new possibil-
ities for genetic and functional analysis of PDC lineage, includ-
ing E2-2 deletion as a tool for specific PDC ablation, and ge-
nome-wide characterization of functional E2-2 target genes in
PDCs. The observed role of E2-2 in the human PDC confirms
the relevance of such studies for the human immune system.
Because PDC hyperactivation contributes to autoimmune dis-
eases (Banchereau and Pascual, 2006), E2-2-dependent mo-
lecular pathways may provide attractive targets for future drug
development.
EXPERIMENTAL PROCEDURES
Animals
The E2-2+/� mice ([Zhuang et al., 1996], kindly provided by H. Zoghbi, Baylor
College of Medicine) were backcrossed onto 129/SvEv background. For
hematopoietic reconstitution, 14.5 days postcoitum (d.p.c.) embryos from
heterozygous intercrosses were genotyped by PCR, and fetal liver cells from
control (E2-2+/+) and knockout (E2-2�/�) embryos were pooled and injected
into lethally irradiated (1000 Rad) B6.SJL mice (Taconic). The IFNb-EYFP strain
carries EYFP reporter gene knocked into IFNb locus (S.S. and R.L., unpub-
lished data). The E2-2flox mice (Bergqvist et al., 2000) were crossed to Rosa26-
CreER (R26-CreER, generated and kindly provided by T. Ludwig, Columbia
University) and CD11c-Cre (Caton et al., 2007) strains. The E2aflox/HEBflox
mice (Jones and Zhuang, 2007) were crossed to R26-CreER mice. All CKO
mice were on C57BL/6 background. For the induction of Cre recombination
in R26-CreER+ mice, tamoxifen was dissolved in oil and administered orally
for three consecutive days (5 mg/day, E2-2 CKO) or injected intraperitoneally
three times every other day (1 mg/day, E2a/HEB CKO), and the mice were
analyzed 10 days after the first administration. All animal studies were per-
formed according to the investigator’s protocol approved by the Institutional
Animal Care and Use Committee of Columbia University.
46 Cell 135, 37–48, October 3, 2008 ª2008 Elsevier Inc.
Human Subjects
Three PHS patients (3, 10, and 17 years of age) with confirmed monoallelic
E2-2/TCF4 mutations and five healthy adult controls were analyzed, as de-
scribed in the Supplemental Experimental Procedures. The study was ap-
proved by the Ethics Committee of the Medical Faculty of the University of
Erlangen-Nuremberg, and informed consent was obtained in all cases.
Cell Analysis and Culture
Single-cell suspensions were stained with fluorochrome-conjugated anti-
bodies to the indicated surface molecules (eBiosciences or BD PharMingen).
The samples were acquired on LSR II flow cytometer or sorted on FACSAria
flow sorter (BD Immunocytometry Systems) and analyzed with FlowJo soft-
ware (Treestar). Magnetic enrichment for CD11b� or B220+ PDCs was per-
formed with MACS columns and microbeads (Miltenyi Biotech).
For PDC development in vitro, total BM cells (2 3 106/ml) were cultured for
8–10 days in complete Dulbecco’s modified Eagle’s medium (DMEM) 10%
fetal calf serum (FCS) with 100 ng/ml recombinant human Flt3L (Peprotech).
For the induction of differentiation, PDCs from 8 day Flt3L cultures of wild-
type BM were MACS purified and incubated for 48 hr with 1 mM type B CpG
oligonucleotide (ODN 1826, Invivogen). For the induction of E2-2 deletion,
PDCs from 8 day Flt3L cultures of R26-CreER+ control (E2-2wt/wt) or CKO
(E2-2flox/flox) BM were MACS purified and incubated with Flt3L and 100 nM
4-hydroxytamoxifen (Sigma) for 1–4 days. Cell lines CAL-1 (Maeda et al.,
2005) and MOLT-4 (ATCC #CRL-1582) were grown in complete RPMI 1640
with 10% FCS.
IFN Assay
Total BM or spleen suspensions (106/ml) were cultured in DMEM 10% FCS in
the presence of 1 mM type A CpG (ODN 2216, Invivogen) for 48 hr. For the mea-
surement of IFN induction in vivo, mice were injected intravenously with 5 mg
ODN 2216 complexed with DOTAP (Roche; 30 ml DOTAP/150 ml total volume)
or with 0.3 mg pI:C (GE Healthcare) and analyzed 6 hr or 12 hr later, respec-
tively. IFNa concentration was measured by ELISA with anti-murine IFNa
antibodies and recombinant standard (PBL Interferon Source).
Expression Analysis
Total RNA from purified human peripheral blood cell types (Allcells) or sorted
murine cells was reverse transcribed and assayed by SYBR Green-based
real-time PCR with MX3000P instrument (Stratagene). The expression of all
genes was normalized to that of b-actin and expressed relative to the indicated
reference sample via the DDCT method. All primers were validated for linear
amplification (sequences available upon request). For microarray analysis
and validation, PDCs (CD11c+ B220+ Bst2+) were flow sorted from pooled
spleens of E2-2+/� or wild-type littermates in multiple independent experi-
ments. Microarray analysis was performed as described in the Supplemental
Experimental Procedures.
Western Blotting, EMSA, and Chromatin Immunoprecipitation
Cell lysates of CAL-1 and MOLT-4 cell lines were probed with antibodies
against human E2-2 ([Bain et al., 1993], monoclonal antibody [mAb] clone
G108-391.2, kindly provided by C. Murre), E2a (mAb clone G98-271 reactive
to E12/E47, BD PharMingen), and HEB (A-20, Santa Cruz Biotechnology).
Electrophoretic mobility shift assay (EMSA) supershift was performed with
the same antibodies as described in the Supplemental Experimental Proce-
dures. For ChIP, CAL-1 cells were crosslinked with formaldehyde, sonicated,
and subjected to immunoprecipitation with anti-E2-2 mAb or mouse IgG con-
trol. After crosslink reversal, the isolated chromatin was analyzed by qPCR as
above. The level of all genes was normalized to 5% total chromatin input of
anti-E2-2 or control IgG sample and expressed as fold difference between
the two samples.
Statistical Analysis
Statistical significance was estimated with an unpaired, two-tailed Student’s
t test.
ACCESSION NUMBERS
The microarray data reported in this paper have been deposited in the GEO da-
tabase with the accession numbers GSE12505 and GSE12507.
SUPPLEMENTAL DATA
Supplemental Data include Supplemental Experimental Procedures, nine fig-
ures, and two data files and can be found with this article online at http://www.
cell.com/cgi/content/full/135/1/37/DC1/.
ACKNOWLEDGMENTS
We thank A. Flora, H. Zoghbi, E. Mercer, C. Murre, and T. Ludwig for animals
and reagents, B. Jones for help with E2a/HEB strain analysis, B. Kee for com-
municating data prior to publication, all members of the Reizis lab for helpful
discussions, and J. Galan for invaluable help with expression analysis and
ChIP. This work was supported by National Institutes of Health (NIH) grant
AI072571, the Sandler Program for Asthma Research award, and the American
Society of Hematology Junior Faculty Scholar award (B.R.), NIH training grants
AI007525 and HD055165 (M.L.C.), NIH training grant GM007367, NIH fellow-
ship AI080184, and the Paul and Daisy Soros Fellowship for New Americans
(B.C.), Deutsche Forschungsgemeinschaft (A.R.), and the Howard Hughes
Medical Institute and NIH grant AI078869 (R.L.).
Received: May 5, 2008
Revised: July 30, 2008
Accepted: September 5, 2008
Published: October 2, 2008
REFERENCES
Amiel, J., Rio, M., de Pontual, L., Redon, R., Malan, V., Boddaert, N., Plouin, P.,
Carter, N.P., Lyonnet, S., Munnich, A., et al. (2007). Mutations in TCF4, encod-
ing a class I basic helix-loop-helix transcription factor, are responsible for
Pitt-Hopkins syndrome, a severe epileptic encephalopathy associated with
autonomic dysfunction. Am. J. Hum. Genet. 80, 988–993.
Asselin-Paturel, C., and Trinchieri, G. (2005). Production of type I interferons:
Plasmacytoid dendritic cells and beyond. J. Exp. Med. 202, 461–465.
Bain, G., Gruenwald, S., and Murre, C. (1993). E2A and E2–2 are subunits of
B-cell-specific E2-box DNA-binding proteins. Mol. Cell. Biol. 13, 3522–3529.
Banchereau, J., and Pascual, V. (2006). Type I interferon in systemic lupus er-
ythematosus and other autoimmune diseases. Immunity 25, 383–392.
Barchet, W., Cella, M., Odermatt, B., Asselin-Paturel, C., Colonna, M., and Ka-
linke, U. (2002). Virus-induced interferon alpha production by a dendritic cell
subset in the absence of feedback signaling in vivo. J. Exp. Med. 195, 507–
516.
Barchet, W., Cella, M., and Colonna, M. (2005). Plasmacytoid dendritic cells–
virus experts of innate immunity. Semin. Immunol. 17, 253–261.
Bergqvist, I., Eriksson, M., Saarikettu, J., Eriksson, B., Corneliussen, B.,
Grundstrom, T., and Holmberg, D. (2000). The basic helix-loop-helix transcrip-
tion factor E2–2 is involved in T lymphocyte development. Eur. J. Immunol. 30,
2857–2863.
Cao, W., and Liu, Y.J. (2007). Innate immune functions of plasmacytoid den-
dritic cells. Curr. Opin. Immunol. 19, 24–30.
Caton, M.L., Smith-Raska, M.R., and Reizis, B. (2007). Notch-RBP-J signaling
controls the homeostasis of CD8- dendritic cells in the spleen. J. Exp. Med.
204, 1653–1664.
Dias, S., Mansson, R., Gurbuxani, S., Sigvardsson, M., and Kee, B.L. (2008).
E2A proteins promote development of lymphoid-primed multipotent progeni-
tors. Immunity 29, 217–227.
Esashi, E., Wang, Y.H., Perng, O., Qin, X.F., Liu, Y.J., and Watowich, S.S.
(2008). The signal tTransducer STAT5 inhibits plasmacytoid dendritic cell de-
velopment by suppressing transcription factor IRF8. Immunity 28, 509–520.
Flora, A., Garcia, J.J., Thaller, C., and Zoghbi, H.Y. (2007). The E-protein Tcf4
interacts with Math1 to regulate differentiation of a specific subset of neuronal
progenitors. Proc. Natl. Acad. Sci. USA 104, 15382–15387.
Gilliet, M., Cao, W., and Liu, Y.J. (2008). Plasmacytoid dendritic cells: Sensing
nucleic acids in viral infection and autoimmune diseases. Nat. Rev. Immunol. 8,
594–606.
Hacker, C., Kirsch, R.D., Ju, X.S., Hieronymus, T., Gust, T.C., Kuhl, C., Jorgas,
T., Kurz, S.M., Rose-John, S., Yokota, Y., et al. (2003). Transcriptional profiling
identifies Id2 function in dendritic cell development. Nat. Immunol. 4, 380–386.
Harman, B.C., Miller, J.P., Nikbakht, N., Gerstein, R., and Allman, D. (2006).
Mouse plasmacytoid dendritic cells derive exclusively from estrogen-resistant
myeloid progenitors. Blood 108, 878–885.
Honda, K., Ohba, Y., Yanai, H., Negishi, H., Mizutani, T., Takaoka, A., Taya, C.,
and Taniguchi, T. (2005). Spatiotemporal regulation of MyD88-IRF-7 signalling
for robust type-I interferon induction. Nature 434, 1035–1040.
Jones, M.E., and Zhuang, Y. (2007). Acquisition of a functional T cell receptor
during T lymphocyte development is enforced by HEB and E2A transcription
factors. Immunity 27, 860–870.
Kumagai, Y., Takeuchi, O., Kato, H., Kumar, H., Matsui, K., Morii, E., Aozasa,
K., Kawai, T., and Akira, S. (2007). Alveolar macrophages are the primary inter-
feron-alpha producer in pulmonary infection with RNA viruses. Immunity 27,
240–252.
Lande, R., Gregorio, J., Facchinetti, V., Chatterjee, B., Wang, Y.H., Homey, B.,
Cao, W., Wang, Y.H., Su, B., Nestle, F.O., et al. (2007). Plasmacytoid dendritic
cells sense self-DNA coupled with antimicrobial peptide. Nature 449, 564–569.
Laouar, Y., Welte, T., Fu, X.Y., and Flavell, R.A. (2003). STAT3 is required for
Flt3L-dependent dendritic cell differentiation. Immunity 19, 903–912.
Lazorchak, A., Jones, M.E., and Zhuang, Y. (2005). New insights into E-protein
function in lymphocyte development. Trends Immunol. 26, 334–338.
Maeda, T., Murata, K., Fukushima, T., Sugahara, K., Tsuruda, K., Anami, M.,
Onimaru, Y., Tsukasaki, K., Tomonaga, M., Moriuchi, R., et al. (2005). A novel
plasmacytoid dendritic cell line, CAL-1, established from a patient with blastic
natural killer cell lymphoma. Int. J. Hematol. 81, 148–154.
Meyers, J.H., Justement, J.S., Hallahan, C.W., Blair, E.T., Sun, Y.A., O’Shea,
M.A., Roby, G., Kottilil, S., Moir, S., Kovacs, C.M., et al. (2007). Impact of
HIV on cell survival and antiviral activity of plasmacytoid dendritic cells.
PLoS ONE 2, e458.
Murre, C. (2005). Helix-loop-helix proteins and lymphocyte development. Nat.
Immunol. 6, 1079–1086.
Naik, S.H., Sathe, P., Park, H.Y., Metcalf, D., Proietto, A.I., Dakic, A., Carotta,
S., O’Keeffe, M., Bahlo, M., Papenfuss, A., et al. (2007). Development of plas-
macytoid and conventional dendritic cell subtypes from single precursor cells
derived in vitro and in vivo. Nat. Immunol. 8, 1217–1226.
Nutt, S.L., and Kee, B.L. (2007). The transcriptional regulation of B cell lineage
commitment. Immunity 26, 715–725.
O’Keeffe, M., Hochrein, H., Vremec, D., Caminschi, I., Miller, J.L., Anders,
E.M., Wu, L., Lahoud, M.H., Henri, S., Scott, B., et al. (2002). Mouse plasma-
cytoid cells: long-lived cells, heterogeneous in surface phenotype and func-
tion, that differentiate into CD8(+) dendritic cells only after microbial stimulus.
J. Exp. Med. 196, 1307–1319.
Onai, N., Obata-Onai, A., Tussiwand, R., Lanzavecchia, A., and Manz, M.G.
(2006). Activation of the Flt3 signal transduction cascade rescues and en-
hances type I interferon-producing and dendritic cell development. J. Exp.
Med. 203, 227–238.
Onai, N., Obata-Onai, A., Schmid, M.A., Ohteki, T., Jarrossay, D., and Manz,
M.G. (2007). Identification of clonogenic common Flt3+M-CSFR+ plasmacy-
toid and conventional dendritic cell progenitors in mouse bone marrow. Nat.
Immunol. 8, 1207–1216.
Pelayo, R., Hirose, J., Huang, J., Garrett, K.P., Delogu, A., Busslinger, M., and
Kincade, P.W. (2005). Derivation of 2 categories of plasmacytoid dendritic
cells in murine bone marrow. Blood 105, 4407–4415.
Cell 135, 37–48, October 3, 2008 ª2008 Elsevier Inc. 47
Quong, M.W., Harris, D.P., Swain, S.L., and Murre, C. (1999). E2A activity is in-
duced during B-cell activation to promote immunoglobulin class switch re-
combination. EMBO J. 18, 6307–6318.
Quong, M.W., Martensson, A., Langerak, A.W., Rivera, R.R., Nemazee, D., and
Murre, C. (2004). Receptor editing and marginal zone B cell development are
regulated by the helix-loop-helix protein, E2A. J. Exp. Med. 199, 1101–1112.
Reizis, B., and Leder, P. (2001). The upstream enhancer is necessary and suf-
ficient for the expression of the pre-T cell receptor alpha gene in immature
T lymphocytes. J. Exp. Med. 194, 979–990.
Robbins, S.H., Walzer, T., Dembele, D., Thibault, C., Defays, A., Bessou, G.,
Xu, H., Vivier, E., Sellars, M., Pierre, P., et al. (2008). Novel insights into the re-
lationships between dendritic cell subsets in human and mouse revealed by
genome-wide expression profiling. Genome Biol. 9, R17.
Schiavoni, G., Mattei, F., Sestili, P., Borghi, P., Venditti, M., Morse, H.C., 3rd,
Belardelli, F., and Gabriele, L. (2002). ICSBP is essential for the development of
mouse type I interferon-producing cells and for the generation and activation
of CD8alpha(+) dendritic cells. J. Exp. Med. 196, 1415–1425.
Schotte, R., Nagasawa, M., Weijer, K., Spits, H., and Blom, B. (2004). The ETS
transcription factor Spi-B is required for human plasmacytoid dendritic cell de-
velopment. J. Exp. Med. 200, 1503–1509.
Shigematsu, H., Reizis, B., Iwasaki, H., Mizuno, S., Hu, D., Traver, D., Leder,
P., Sakaguchi, N., and Akashi, K. (2004). Plasmacytoid dendritic cells activate
lymphoid-specific genetic programs irrespective of their cellular origin. Immu-
nity 21, 43–53.
48 Cell 135, 37–48, October 3, 2008 ª2008 Elsevier Inc.
Singh, H., Medina, K.L., and Pongubala, J.M. (2005). Contingent gene regula-
tory networks and B cell fate specification. Proc. Natl. Acad. Sci. USA 102,
4949–4953.
Spits, H., Couwenberg, F., Bakker, A.Q., Weijer, K., and Uittenbogaart, C.H.
(2000). Id2 and Id3 inhibit development of CD34(+) stem cells into predendritic
cell (pre-DC)2 but not into pre-DC1. Evidence for a lymphoid origin of pre-DC2.
J. Exp. Med. 192, 1775–1784.
Tsujimura, H., Tamura, T., and Ozato, K. (2003). Cutting edge: IFN consensus
sequence binding protein/IFN regulatory factor 8 drives the development of
type I IFN-producing plasmacytoid dendritic cells. J. Immunol. 170, 1131–
1135.
Wikstrom, I., Forssell, J., Goncalves, M., Colucci, F., and Holmberg, D. (2006).
E2–2 regulates the expansion of pro-B cells and follicular versus marginal zone
decisions. J. Immunol. 177, 6723–6729.
Wu, L., and Liu, Y.J. (2007). Development of dendritic-cell lineages. Immunity
26, 741–750.
Zhuang, Y., Cheng, P., and Weintraub, H. (1996). B-lymphocyte development
is regulated by the combined dosage of three basic helix-loop-helix genes,
E2A, E2–2, and HEB. Mol. Cell. Biol. 16, 2898–2905.
Zweier, C., Peippo, M.M., Hoyer, J., Sousa, S., Bottani, A., Clayton-Smith, J.,
Reardon, W., Saraiva, J., Cabral, A., Gohring, I., et al. (2007). Haploinsuffi-
ciency of TCF4 causes syndromal mental retardation with intermittent hyper-
ventilation (Pitt-Hopkins syndrome). Am. J. Hum. Genet. 80, 994–1001.