Embed Size (px)
Citation preview
Transaction Advisory Services
Transaction TrendsNorwegian M&A update – Q4 2018
Norwegian M&A activity resilient to geopolitical turmoil – for now
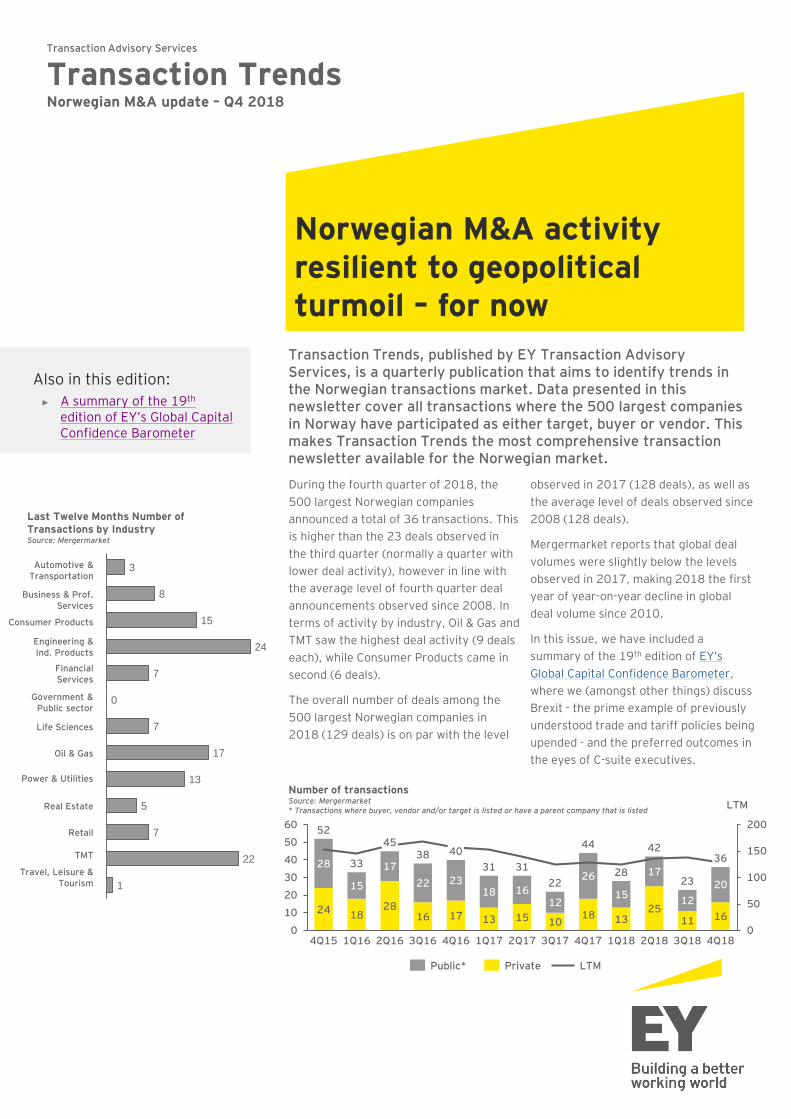
Transaction Trends, published by EY Transaction Advisory Services, is a quarterly publication that aims to identify trends in the Norwegian transactions market. Data presented in this newsletter cover all transactions where the 500 largest companies in Norway have participated as either target, buyer or vendor. This makes Transaction Trends the most comprehensive transaction newsletter available for the Norwegian market.
Also in this edition:
Number of transactionsSource: Mergermarket* Transactions where buyer, vendor and/or target is listed or have a parent company that is listed
During the fourth quarter of 2018, the
500 largest Norwegian companies
announced a total of 36 transactions. This
is higher than the 23 deals observed in
the third quarter (normally a quarter with
lower deal activity), however in line with
the average level of fourth quarter deal
announcements observed since 2008. In
terms of activity by industry, Oil & Gas and
TMT saw the highest deal activity (9 deals
each), while Consumer Products came in
second (6 deals).
The overall number of deals among the
500 largest Norwegian companies in
2018 (129 deals) is on par with the level
observed in 2017 (128 deals), as well as
the average level of deals observed since
2008 (128 deals).
Mergermarket reports that global deal
volumes were slightly below the levels
observed in 2017, making 2018 the first
year of year-on-year decline in global
deal volume since 2010.
In this issue, we have included a
summary of the 19th edition of EY’s
Global Capital Confidence Barometer,
where we (amongst other things) discuss
Brexit - the prime example of previously
understood trade and tariff policies being
upended - and the preferred outcomes in
the eyes of C-suite executives.
► A summary of the 19th
edition of EY’s Global Capital Confidence Barometer
3
8
15
24
7
7
17
13
5
7
22
1
0
Last Twelve Months Number of Transactions by IndustrySource: Mergermarket
Automotive & Transportation
Business & Prof. Services
Consumer Products
Financial Services
Government & Public sector
Power & Utilities
Real Estate
TMT
Travel, Leisure & Tourism
Oil & Gas
24 1828
16 17 13 15 1018 13
2511 16
28
15
17
22 2318 16
12
26
15
17
12
20
0
50
100
150
200
0
10
20
30
40
50
60
LTM
4238
4Q16 1Q182Q174Q15 1Q16
44
2Q16 1Q17
52
3Q16
36
3Q17 4Q17 2Q18
33
3Q18
4540
3131
2228
23
4Q18
Public* LTMPrivate
Engineering & Ind. Products
Life Sciences
Retail
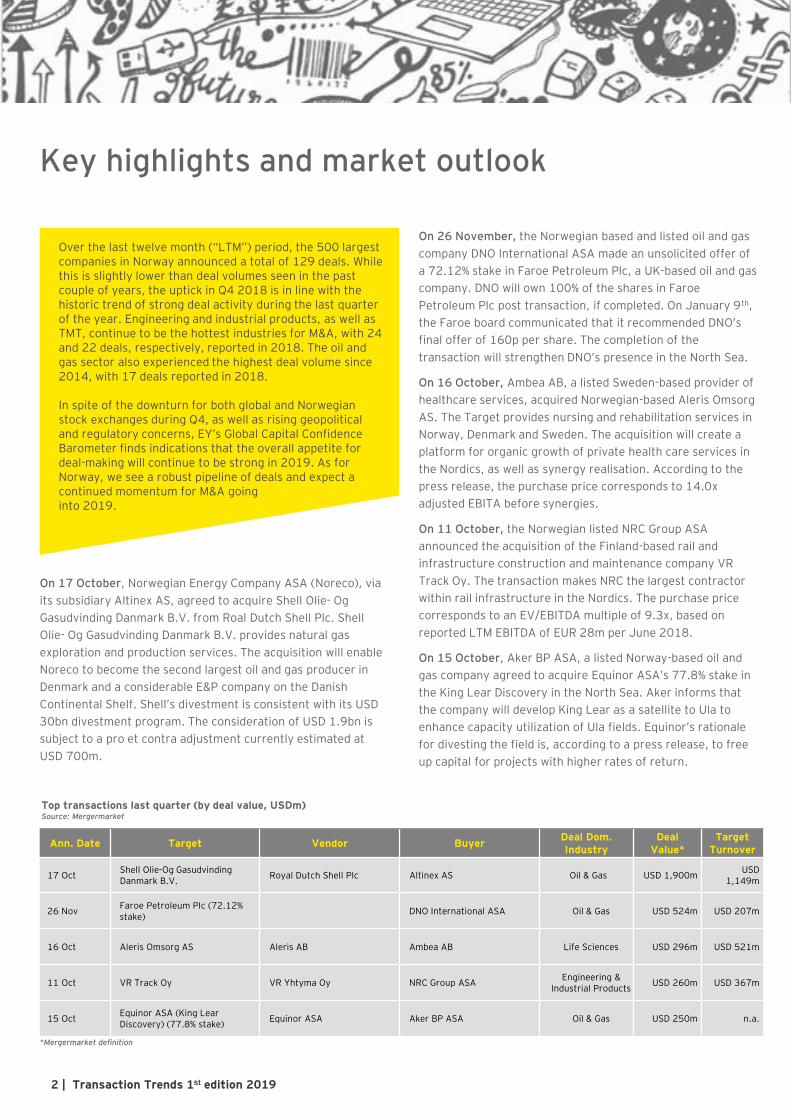
On 26 November, the Norwegian based and listed oil and gas
company DNO International ASA made an unsolicited offer of
a 72.12% stake in Faroe Petroleum Plc, a UK-based oil and gas
company. DNO will own 100% of the shares in Faroe
Petroleum Plc post transaction, if completed. On January 9th,
the Faroe board communicated that it recommended DNO’s
final offer of 160p per share. The completion of the
transaction will strengthen DNO’s presence in the North Sea.
On 16 October, Ambea AB, a listed Sweden-based provider of
healthcare services, acquired Norwegian-based Aleris Omsorg
AS. The Target provides nursing and rehabilitation services in
Norway, Denmark and Sweden. The acquisition will create a
platform for organic growth of private health care services in
the Nordics, as well as synergy realisation. According to the
press release, the purchase price corresponds to 14.0x
adjusted EBITA before synergies.
On 11 October, the Norwegian listed NRC Group ASA
announced the acquisition of the Finland-based rail and
infrastructure construction and maintenance company VR
Track Oy. The transaction makes NRC the largest contractor
within rail infrastructure in the Nordics. The purchase price
corresponds to an EV/EBITDA multiple of 9.3x, based on
reported LTM EBITDA of EUR 28m per June 2018.
On 15 October, Aker BP ASA, a listed Norway-based oil and
gas company agreed to acquire Equinor ASA’s 77.8% stake in
the King Lear Discovery in the North Sea. Aker informs that
the company will develop King Lear as a satellite to Ula to
enhance capacity utilization of Ula fields. Equinor’s rationale
for divesting the field is, according to a press release, to free
up capital for projects with higher rates of return.
Key highlights and market outlook
On 17 October, Norwegian Energy Company ASA (Noreco), via
its subsidiary Altinex AS, agreed to acquire Shell Olie- Og
Gasudvinding Danmark B.V. from Roal Dutch Shell Plc. Shell
Olie- Og Gasudvinding Danmark B.V. provides natural gas
exploration and production services. The acquisition will enable
Noreco to become the second largest oil and gas producer in
Denmark and a considerable E&P company on the Danish
Continental Shelf. Shell’s divestment is consistent with its USD
30bn divestment program. The consideration of USD 1.9bn is
subject to a pro et contra adjustment currently estimated at
USD 700m.
2 | Transaction Trends 1st edition 2019
Top transactions last quarter (by deal value, USDm)Source: Mergermarket
Ann. Date Target Vendor BuyerDeal Dom.Industry
DealValue*
TargetTurnover
17 OctShell Olie-Og GasudvindingDanmark B.V.
Royal Dutch Shell Plc Altinex AS Oil & Gas USD 1,900mUSD
1,149m
26 NovFaroe Petroleum Plc (72.12% stake)
DNO International ASA Oil & Gas USD 524m USD 207m
16 Oct Aleris Omsorg AS Aleris AB Ambea AB Life Sciences USD 296m USD 521m
11 Oct VR Track Oy VR Yhtyma Oy NRC Group ASAEngineering &
Industrial ProductsUSD 260m USD 367m
15 OctEquinor ASA (King Lear Discovery) (77.8% stake)
Equinor ASA Aker BP ASA Oil & Gas USD 250m n.a.
*Mergermarket definition
Over the last twelve month (“LTM”) period, the 500 largest companies in Norway announced a total of 129 deals. While this is slightly lower than deal volumes seen in the past couple of years, the uptick in Q4 2018 is in line with the historic trend of strong deal activity during the last quarter of the year. Engineering and industrial products, as well as TMT, continue to be the hottest industries for M&A, with 24 and 22 deals, respectively, reported in 2018. The oil and gas sector also experienced the highest deal volume since 2014, with 17 deals reported in 2018.
In spite of the downturn for both global and Norwegian stock exchanges during Q4, as well as rising geopolitical and regulatory concerns, EY’s Global Capital Confidence Barometer finds indications that the overall appetite for deal-making will continue to be strong in 2019. As for Norway, we see a robust pipeline of deals and expect a continued momentum for M&A going into 2019.
Transaction TypeSource: Mergermarket
Buyer RegionSource: Mergermarket
Activity Breakdown
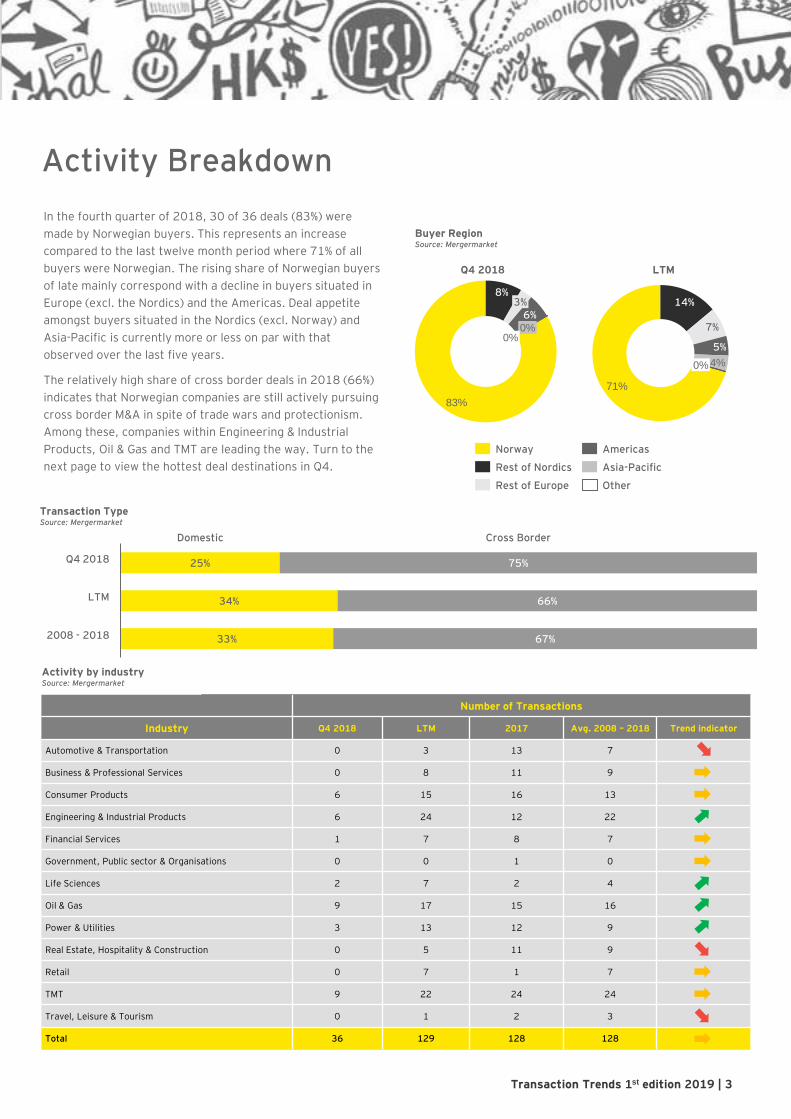
In the fourth quarter of 2018, 30 of 36 deals (83%) were
made by Norwegian buyers. This represents an increase
compared to the last twelve month period where 71% of all
buyers were Norwegian. The rising share of Norwegian buyers
of late mainly correspond with a decline in buyers situated in
Europe (excl. the Nordics) and the Americas. Deal appetite
amongst buyers situated in the Nordics (excl. Norway) and
Asia-Pacific is currently more or less on par with that
observed over the last five years.
The relatively high share of cross border deals in 2018 (66%)
indicates that Norwegian companies are still actively pursuing
cross border M&A in spite of trade wars and protectionism.
Among these, companies within Engineering & Industrial
Products, Oil & Gas and TMT are leading the way. Turn to the
next page to view the hottest deal destinations in Q4.
83%
8%
6%3%
0%0%
Norway
Other
Rest of Nordics
Rest of Europe
Americas
Asia-Pacific
LTM
71%
14%
7%
5%
4%0%
Q4 2018
25%
34%
33%
75%
66%
67%
Domestic Cross Border
LTM
2008 - 2018
Q4 2018
Activity by industrySource: Mergermarket
Number of Transactions
Industry Q4 2018 LTM 2017 Avg. 2008 – 2018 Trend indicator
Automotive & Transportation 0 3 13 7
Business & Professional Services 0 8 11 9
Consumer Products 6 15 16 13
Engineering & Industrial Products 6 24 12 22
Financial Services 1 7 8 7
Government, Public sector & Organisations 0 0 1 0
Life Sciences 2 7 2 4
Oil & Gas 9 17 15 16
Power & Utilities 3 13 12 9
Real Estate, Hospitality & Construction 0 5 11 9
Retail 0 7 1 7
TMT 9 22 24 24
Travel, Leisure & Tourism 0 1 2 3
Total 36 129 128 128
Transaction Trends 1st edition 2019 | 3
5%
Transaction ArenaSource: Mergermarket
4%
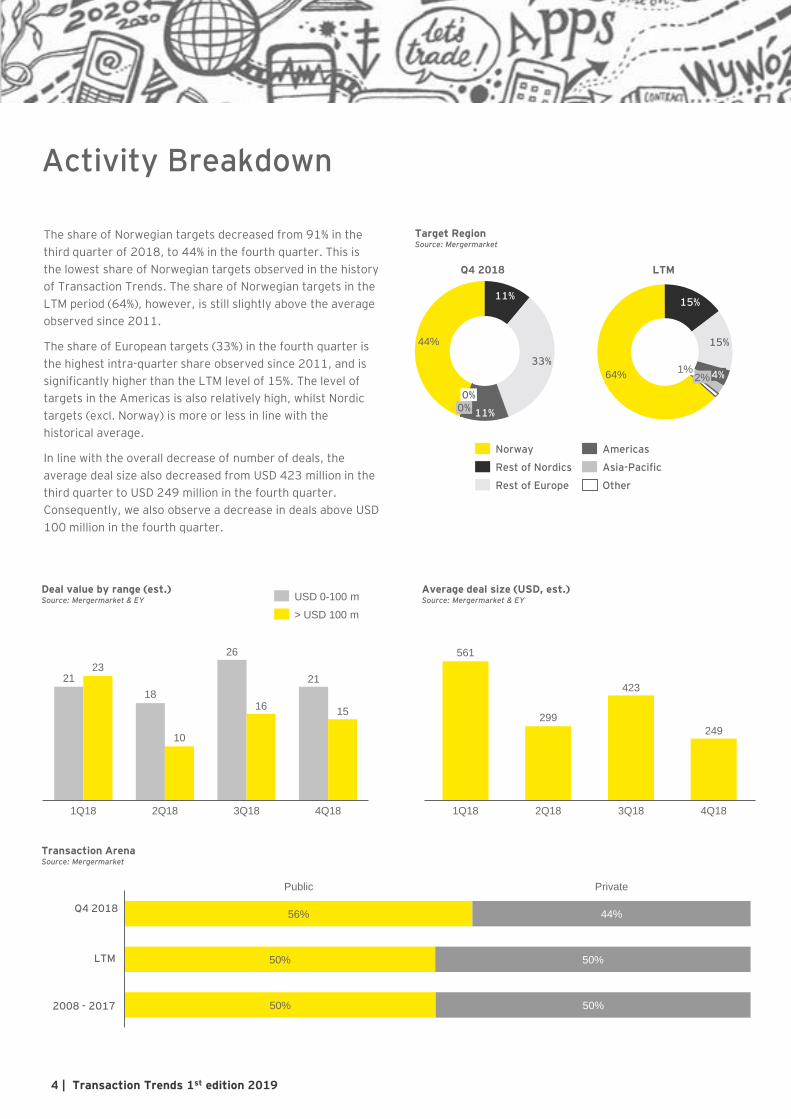
The share of Norwegian targets decreased from 91% in the
third quarter of 2018, to 44% in the fourth quarter. This is
the lowest share of Norwegian targets observed in the history
of Transaction Trends. The share of Norwegian targets in the
LTM period (64%), however, is still slightly above the average
observed since 2011.
The share of European targets (33%) in the fourth quarter is
the highest intra-quarter share observed since 2011, and is
significantly higher than the LTM level of 15%. The level of
targets in the Americas is also relatively high, whilst Nordic
targets (excl. Norway) is more or less in line with the
historical average.
In line with the overall decrease of number of deals, the
average deal size also decreased from USD 423 million in the
third quarter to USD 249 million in the fourth quarter.
Consequently, we also observe a decrease in deals above USD
100 million in the fourth quarter.
4 | Transaction Trends 1st edition 2019
Target RegionSource: Mergermarket
Activity Breakdown
44%
11%
33%
11%0%0%
Rest of Europe
Norway Americas
Rest of Nordics Asia-Pacific
Other
Q4 2018
64%
15%
15%
4%2%1%
LTM
56%
50%
50%
44%
50%
50%
PrivatePublic
LTM
2008 - 2017
Q4 2018
21
18
26
2123
10
1615
3Q181Q18 2Q18 4Q18
> USD 100 m
USD 0-100 mDeal value by range (est.) Source: Mergermarket & EY
Average deal size (USD, est.) Source: Mergermarket & EY
561
299
423
249
4Q181Q18 3Q182Q18
Public Market Update
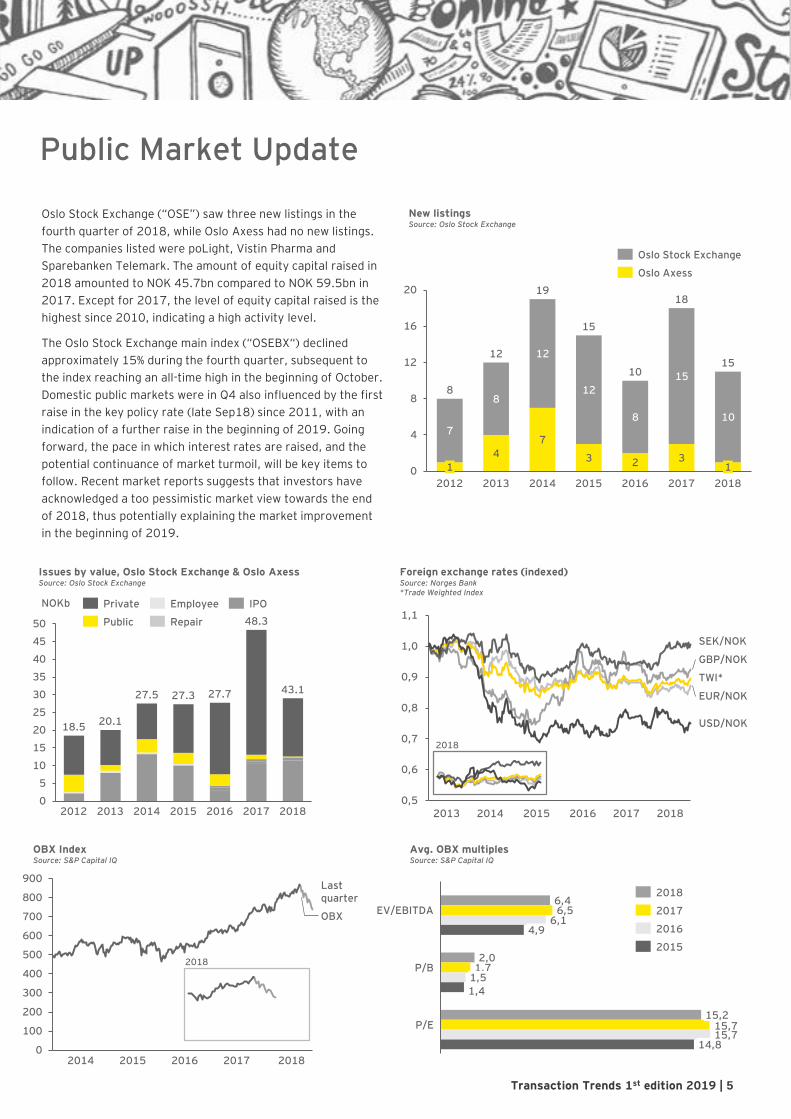
Oslo Stock Exchange (“OSE”) saw three new listings in the
fourth quarter of 2018, while Oslo Axess had no new listings.
The companies listed were poLight, Vistin Pharma and
Sparebanken Telemark. The amount of equity capital raised in
2018 amounted to NOK 45.7bn compared to NOK 59.5bn in
2017. Except for 2017, the level of equity capital raised is the
highest since 2010, indicating a high activity level.
The Oslo Stock Exchange main index (“OSEBX“) declined
approximately 15% during the fourth quarter, subsequent to
the index reaching an all-time high in the beginning of October.
Domestic public markets were in Q4 also influenced by the first
raise in the key policy rate (late Sep18) since 2011, with an
indication of a further raise in the beginning of 2019. Going
forward, the pace in which interest rates are raised, and the
potential continuance of market turmoil, will be key items to
follow. Recent market reports suggests that investors have
acknowledged a too pessimistic market view towards the end
of 2018, thus potentially explaining the market improvement
in the beginning of 2019.
New listings Source: Oslo Stock Exchange
4
7
3 2 3
7
8
12
12
8
15
10
0
4
8
12
16
20
1
2014
1
2012 20172013 2015 2016 2018
8
12
19
15
10
18
15
Oslo Stock Exchange
Oslo Axess
Issues by value, Oslo Stock Exchange & Oslo AxessSource: Oslo Stock Exchange
Avg. OBX multiples Source: S&P Capital IQ
Transaction Trends 1st edition 2019 | 5
5%4%
0
5
10
15
20
25
30
35
40
45
50
20142013
20.1
NOKb
2012 20162015 2017 2018
27.7
18.5
27.5 27.3
48.3
43.1
EmployeePrivate
RepairPublic
IPO
14,8
EV/EBITDA
2,0P/B
P/E
4,96,1
15,7
6,56,4
1,71,5
1,4
15,215,7
2018
2017
2016
2015
OBX Index Source: S&P Capital IQ
0
100
200
300
400
500
600
700
800
900Last quarter
OBX
2018
2014 2015 2016 2017 2018
Foreign exchange rates (indexed) Source: Norges Bank*Trade Weighted Index
5%4%
2013 2014 2015 2016 2017 2018
1,1
0,9
0,5
1,0
0,6
0,8
0,7
EUR/NOK
GBP/NOK
TWI*
SEK/NOK
USD/NOK
2018
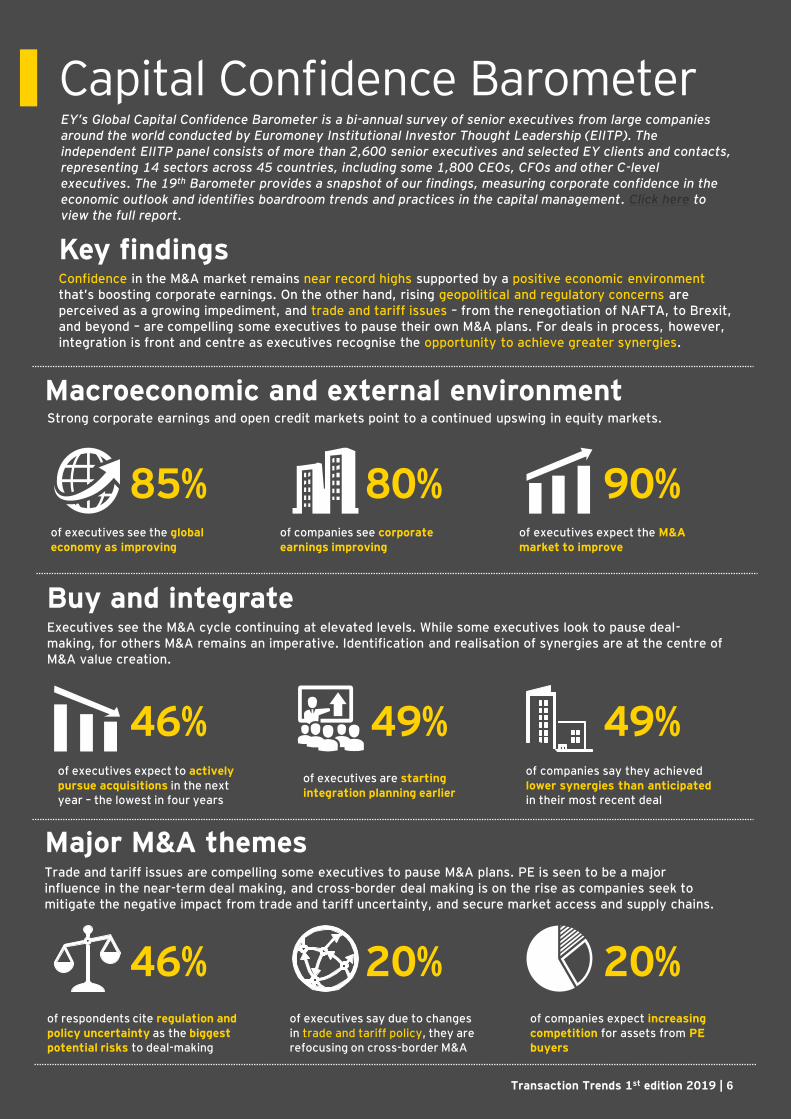
Capital Confidence BarometerEY’s Global Capital Confidence Barometer is a bi-annual survey of senior executives from large companies around the world conducted by Euromoney Institutional Investor Thought Leadership (EIITP). The independent EIITP panel consists of more than 2,600 senior executives and selected EY clients and contacts, representing 14 sectors across 45 countries, including some 1,800 CEOs, CFOs and other C-level executives. The 19th Barometer provides a snapshot of our findings, measuring corporate confidence in the economic outlook and identifies boardroom trends and practices in the capital management. Click here to view the full report.
Key findings
Macroeconomic and external environmentStrong corporate earnings and open credit markets point to a continued upswing in equity markets.
Buy and integrate
Major M&A themes
Executives see the M&A cycle continuing at elevated levels. While some executives look to pause deal-making, for others M&A remains an imperative. Identification and realisation of synergies are at the centre of M&A value creation.
Trade and tariff issues are compelling some executives to pause M&A plans. PE is seen to be a major influence in the near-term deal making, and cross-border deal making is on the rise as companies seek to mitigate the negative impact from trade and tariff uncertainty, and secure market access and supply chains.
of executives see the globaleconomy as improving
of companies see corporateearnings improving
80%of executives expect the M&Amarket to improve
90%
Confidence in the M&A market remains near record highs supported by a positive economic environment that’s boosting corporate earnings. On the other hand, rising geopolitical and regulatory concerns are perceived as a growing impediment, and trade and tariff issues – from the renegotiation of NAFTA, to Brexit, and beyond – are compelling some executives to pause their own M&A plans. For deals in process, however,integration is front and centre as executives recognise the opportunity to achieve greater synergies.
of executives expect to actively pursue acquisitions in the next year – the lowest in four years
46%of executives are starting integration planning earlier
49%of companies say they achieved lower synergies than anticipatedin their most recent deal
49%
of respondents cite regulation and policy uncertainty as the biggest potential risks to deal-making
46%of executives say due to changes in trade and tariff policy, they are refocusing on cross-border M&A
20%of companies expect increasing competition for assets from PE buyers
20%
85%
Transaction Trends 1st edition 2019 | 6
Brexit
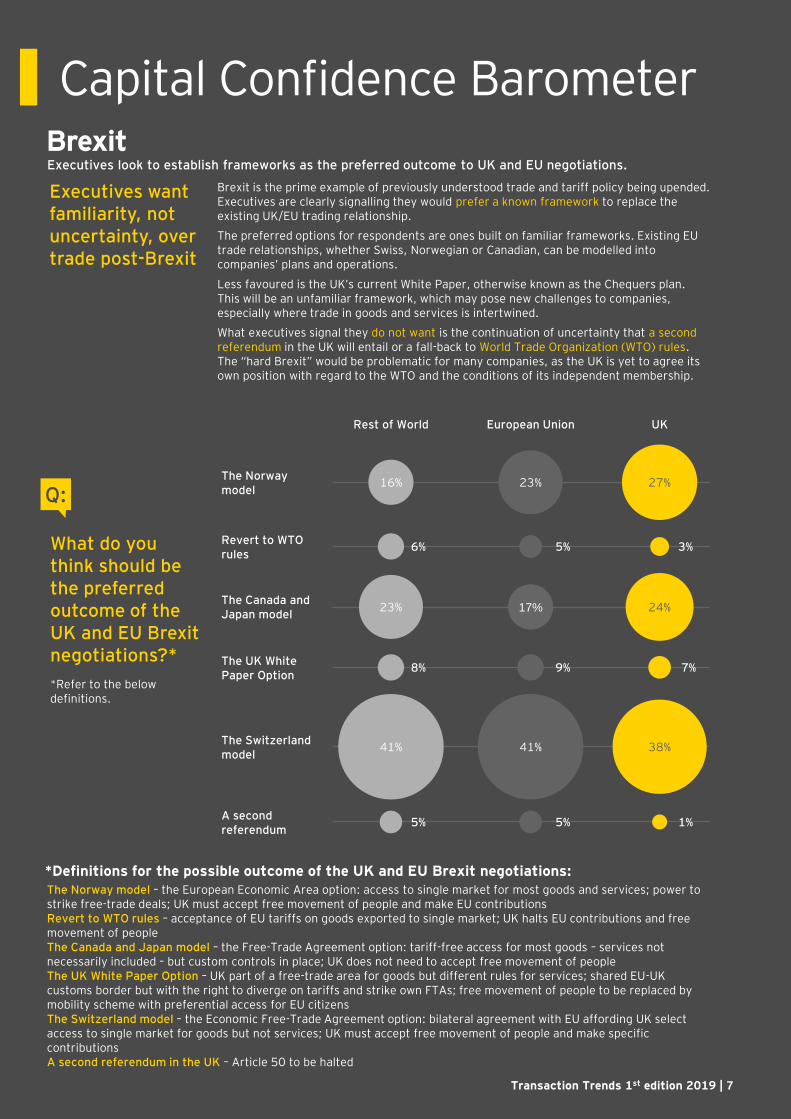
What do you think should be the preferred outcome of the UK and EU Brexit negotiations?*
Executives want familiarity, not uncertainty, over trade post-Brexit
*Refer to the below definitions.
Capital Confidence Barometer
The Norway model – the European Economic Area option: access to single market for most goods and services; power to strike free-trade deals; UK must accept free movement of people and make EU contributionsRevert to WTO rules – acceptance of EU tariffs on goods exported to single market; UK halts EU contributions and free movement of peopleThe Canada and Japan model – the Free-Trade Agreement option: tariff-free access for most goods – services not necessarily included – but custom controls in place; UK does not need to accept free movement of peopleThe UK White Paper Option – UK part of a free-trade area for goods but different rules for services; shared EU-UK customs border but with the right to diverge on tariffs and strike own FTAs; free movement of people to be replaced by mobility scheme with preferential access for EU citizensThe Switzerland model – the Economic Free-Trade Agreement option: bilateral agreement with EU affording UK select access to single market for goods but not services; UK must accept free movement of people and make specific contributionsA second referendum in the UK – Article 50 to be halted
*Definitions for the possible outcome of the UK and EU Brexit negotiations:
Brexit is the prime example of previously understood trade and tariff policy being upended. Executives are clearly signalling they would prefer a known framework to replace the existing UK/EU trading relationship.
The preferred options for respondents are ones built on familiar frameworks. Existing EU trade relationships, whether Swiss, Norwegian or Canadian, can be modelled into companies’ plans and operations.
Less favoured is the UK’s current White Paper, otherwise known as the Chequers plan. This will be an unfamiliar framework, which may pose new challenges to companies, especially where trade in goods and services is intertwined.
What executives signal they do not want is the continuation of uncertainty that a second referendum in the UK will entail or a fall-back to World Trade Organization (WTO) rules. The “hard Brexit” would be problematic for many companies, as the UK is yet to agree its own position with regard to the WTO and the conditions of its independent membership.
Q:
The Switzerland model
41% 41% 38%
The Norway model
16% 23% 27%
The Canada and Japan model
23% 17% 24%
The UK White Paper Option
Revert to WTO rules
A second referendum
Rest of World European Union UK
3%5%6%
7%9%8%
1%5%5%
Transaction Trends 1st edition 2019 | 7
Executives look to establish frameworks as the preferred outcome to UK and EU negotiations.
Transaction Support
Contact list - EY Transaction Advisory Services
Strategy and Operations
Sell-side services Vendor due diligence IPO due diligence SPA support Sell-side M&A advisory Carve-out planning Exit readiness
Complete and integrated services covering preparation to closing
EY Transaction Advisory Services
Buy-side services Financial due diligence Commercial and
operational due diligence Tax and legal due
diligence SPA support Buy-side M&A advisory Integration support
Other services Valuation and modelling Tax structuring Legal support Restructuring
Global reach and local presence with 10,000 transaction professionals
M1
60
02
no
rdic
Vegard Stevning
+47 916 83 692
Oslo
Trond Olberg
+47 997 35 554
Oslo
Bjørn Tore Foss
+47 970 25 021
Oslo
Ole Conrad Siem
+47 971 16 869
Oslo
Erik Haagensen
+47 905 66 778
Oslo
Cecilie Rasmussen
+47 984 89 439
Stavanger
Cato Rognli
+47 982 06 499
Oslo
Nils Kristian Bø
+47 971 66 567
Oslo
Kjell Stenersen
+47 982 06 678
Stavanger
Espen Norheim
+47 928 02 095
Stavanger
Merete Skage
+47 982 06 499
Bergen
Helge Fredheim
+47 913 47 741
Oslo
Njaal Arne Høyland
+47 928 81 430
Oslo
Henning Raa
+47 917 86 479
Oslo
Valuation & Business Modeling
Sigurd Garmann Tuntland
+47 901 06 610
Oslo
Corporate Finance
Transaction Tax
Transaction Trends 1st edition 2019 | 8
Marit Dokka Holthe
+47 917 14 900
Oslo
About this publication
Transaction Trends is a quarterly publication that aims to identify trends in the
Norwegian transactions market. Transactions covered in this publication are
public and private transactions announced by the 500 largest Norwegian
companies (DN500), defined as a transaction where either the buyer, target or
vendor company is a Norwegian based company. Public transactions are defined
as transactions where either the buyer, target or vendor company is listed on a
public stock exchange. All other transactions have been classified as private.
Domestic transactions are defined as transactions conducted within a national
boundary, i.e. deals involving two or more incumbent nationals, while cross
border transactions involve companies from at least two different nationalities.
Deal Value is taken as the sum of the consideration paid by the acquirer for the
equity stake in the target plus the value of the net debt in the target, where
applicable. Inclusion of net debt in the deal value will depend on the stake
acquired or the target company type.
Transaction Statistics are based on Mergermarket and EY data. Public market
data are sourced from S&P Capital IQ and Oslo Stock Exchange.
Transaction Trends is published by EY Transaction Advisory Services.
Contact information
For further enquiries, or to add your name to the mailing list for this publication,
please send an e-mail to [email protected].
About EYEY is a global leader in assurance, tax,transaction and advisory services. Theinsights and quality services we deliverhelp build trust and confidence in thecapital markets and in economies theworld over. We develop outstandingleaders who team to deliver on ourpromises to all of our stakeholders. In sodoing, we play a critical role in building abetter working world for our people, forour clients and for our communities.
EY refers to the global organization,and may refer to one or more, of themember firms of Ernst & Young GlobalLimited, each of which is a separate legalentity. Ernst & Young Global Limited, aUK company limited by guarantee, doesnot provide services to clients. For moreinformation about our organization, pleasevisit ey.com.
© 2019 EYGM Limited.
All Rights Reserved.
This material has been prepared for general
informational purposes only and is not intended to
be relied upon as accounting, tax, or other
professional advice. Please refer to your advisors
for specific advice.
ey.com
EY | Assurance | Tax | Transactions | Advisory