Embed Size (px)
Citation preview
Transaction Pricing and the Adoptionof Electronic Payments:
A Cross-Country Comparison∗
Wilko Bolt,a David Humphrey,b and Roland Uittenbogaarda
aDe Nederlandsche BankbFlorida State University
After safety, the efficiency of a nation’s payment system isa primary concern of central banks. Since electronic paymentsare typically cheaper than paper-based or cash payments, pric-ing these transactions should speed up the shift to electron-ics. But by how much? Norway explicitly priced point-of-saleand bill-payment transactions and rapidly shifted to electronicpayments, while the Netherlands experienced a similar shiftwithout pricing. Controlling for terminal availability and dif-ferences between countries, direct pricing accelerated the shiftto electronics by about 20 percent. The quid pro quo was theelimination of bank-float revenues.
JEL Codes: D12, G21.
1. Introduction
The average bank cost of an electronic payment is one-third to one-half that of its paper-based equivalent or cash (cf. Humphrey et al.2006). A merchant’s average cost of accepting a bill payment elec-tronically over a giro network or at the point of sale (POS) is alsolower (credit cards excepted). Since the resource cost of a country’spayment system may account for 1–2 percent of its GDP, it is clear
∗The authors would like to thank Hans Brits, Nicole Jonker, Rein Kieviet,Raymond Kleijmeer, Andrew Stone, Carlo Winder, and two anonymous refer-ees for valuable comments and suggestions. The views expressed in this articleare those of the authors alone and do not necessarily represent those of DeNederlandsche Bank, the European System of Central Banks, or the FederalReserve Bank of Philadelphia. Author e-mails: Bolt: [email protected]; Humphrey:[email protected]; Uittenbogaard: [email protected].
89
90 International Journal of Central Banking March 2008
that shifting from paper to electronic payments can confer socialbenefits. Importantly, the discounted value of these cost benefitswill be larger the more rapidly this shift occurs. Additional effectsalso exist and are of concern to central banks since the replacementof cash by electronic payments can alter the monetary aggregates(Duca and VanHoose 2004), reduce government seigniorage revenues(Humphrey, Kaloudis, and Øwre 2004), and make tax evasion andillegal transactions more difficult to hide.
There is overwhelming evidence that consumers respond to priceincentives but very little evidence on how strong this response maybe in the payments area. Although consumers are used to respond-ing to price incentives, they tend not to welcome the opportunityto trade off perceived payment preferences with relative prices whentheir payment use has commonly been viewed as being “free.” Whilebusinesses often pay directly for the payment services they use viaexplicit transaction fees or compensating balances, consumers havetraditionally paid implicitly through lost float or lower (or no) inter-est on transaction balances. However, consumer surveys indicatethat certain implicit costs (e.g., availability, convenience, and secu-rity) can affect payment choice (Borzekowski and Kiser 2006; Klee2006), and models have been developed to discriminate betweenpecuniary and behavioral reasons for credit card versus debit carduse (Zinman 2005). These and other motivations for choosing dif-ferent payment instruments were outlined in a recent survey, buttheir relative importance has not been determined (Scholnick et al.2007). As per-transaction pricing of consumer payments is rare inEurope and the United States, these analyses cannot address whatthe impact of explicit pricing would be. Such pricing is rare since,reportedly, banks fear a loss of deposit market share if they are thefirst (and only) bank to implement it, while antitrust authoritieswould be suspicious of industry efforts to coordinate the implementa-tion of per-transaction prices to minimize changes in relative marketshares.
One country—Norway—has overcome these difficulties by coor-dinating only the timing of when direct pricing of consumer pay-ments would start—not the level of prices to be charged, which couldin fact be zero. The quid pro quo was a phasing out of banks’ practiceof recouping payment costs through payment float—debiting con-sumer accounts prior to a value date for bill payments or delaying
Vol. 4 No. 1 Transaction Pricing 91
funds availability for credits to accounts—which made it appear thatpayment use was “free” because the monetary cost to users was indi-rect and implicit. The goal was to make payment costs more explicitso consumers could match better the benefits and costs of differentpayment instruments, a response expected to lower the social costof their payment system (Enge and Øwre 2006).
Our purpose is to determine the effect of differential transaction-based pricing of payment instruments on the adoption rate ofelectronic payments. This is done by comparing the shift to elec-tronic payments in two countries—one that has transaction pricing(Norway) and one that does not (the Netherlands). Transaction-based prices are key since they directly affect consumers’ decisionsabout payment use, whereas implicit prices and fixed fees can havelimited behavioral effects since these costs do not vary with usageand, when imposed, are typically stable over time. Nonprice effects—such as availability, convenience, and security—also influence pay-ment use, and our attempt to control for these effects utilizes atwo-country model.
Data on payment instrument use for many developed countriesis available annually in various Bank for International Settlementsand European Central Bank documents, as well as from payment sta-tistics by national central banks. As these time series rarely exceedfifteen years, a parsimonious model specification is necessary. A com-parable time series of actual payment instrument prices on a broadrange of payment instruments is available only for Norway. We con-trast the rapid adoption of electronic payments in Norway over 1990–2004 with the experience of the Netherlands, which also rapidlyadopted electronic payments but did not impose per-transactionprices on consumers. By applying a system estimation to our model,we improve the degrees of freedom and increase the efficiency of ourestimators.
If the incremental effect of direct pricing is large, holding con-stant other intracountry and cross-country influences affecting theadoption of electronic payments, then the potential social benefitcan also be large. This suggests that antitrust concerns raised bypossible bank coordination of the implementation of prices (but notthe level) could be offset by subsequent social benefits. We find thatwhile pricing has speeded up the shift to electronic payments, theshift was only about 20 percent faster in Norway with pricing than in
92 International Journal of Central Banking March 2008
the Netherlands without pricing. Our analysis extends earlier workon payment pricing (Humphrey, Kim, and Vale 2001) by separatingterminal-availability influences from price effects for point-of-saletransactions and by doubling the time period covered to capturemore price variation. Newly available data also allows us to analyzethe paper/electronic trade-off for giro-based bill payments as wellas issues associated with nonstationarity in aggregate trended pay-ment data. Finally, we control for unspecified and hard-to-measurenonprice influences to obtain potentially more accurate priceelasticities.
In what follows, section 2 illustrates how the composition ofpayments has evolved in Norway and the Netherlands along withthe levels of relative paper and electronic prices in Norway. Explicittransaction prices for consumers are zero in the Netherlands. Ourfocus is on the substitution of debit cards for cash (or cash andchecks) at the point of sale along with the substitution of electronicgiro payments for paper-initiated giro transactions.
In section 3, a parsimonious “country-difference” model is spec-ified to separate the effect of pricing on point-of-sale debit card useand ATM (automated teller machine) cash withdrawals from dif-ferences in terminal availability and real personal consumption inour two countries. A similar model relies primarily on prices forthe substitution of electronic versus paper-initiated giro payments(Internet connections far exceed giro use and are not a constraint,and, in any case, an electronic or paper giro can be initiated byphone or in person). No good data exists on payment use prior tothe start of pricing (1986) in Norway, so nonprice attributes of dif-ferent payment instruments can affect measured price elasticities ifstandard analysis is applied using only one country (as was the casein Humphrey, Kim, and Vale 2001). The Netherlands, which did notprice, is used to “hold constant” nonprice attributes of the differ-ent payment instruments to obtain potentially more accurate priceeffects. Put differently, we seek to “subtract” the shift to electronicpayments that presumedly would have occurred without pricing—due to nonprice attributes, terminal availability, and per-person con-sumption levels—from the shift that is observed with pricing plusthese three influences on use.
Our set of four equations is estimated in section 4 in a seeminglyunrelated regression framework to improve efficiency. The effects of
Vol. 4 No. 1 Transaction Pricing 93
prices on payment composition, including the implied price elastici-ties, are presented here. Different models are estimated to judge therobustness of the price effect under alternative specifications, suchas different lagged relationships, first differences, and error correc-tion. A summary of our results is contained in section 5, along withan estimate of the bank cost savings associated with the shift toelectronic payments.
2. Payment Composition, Pricing, and Other Influenceson Payment Instrument Use
2.1 Payment Composition
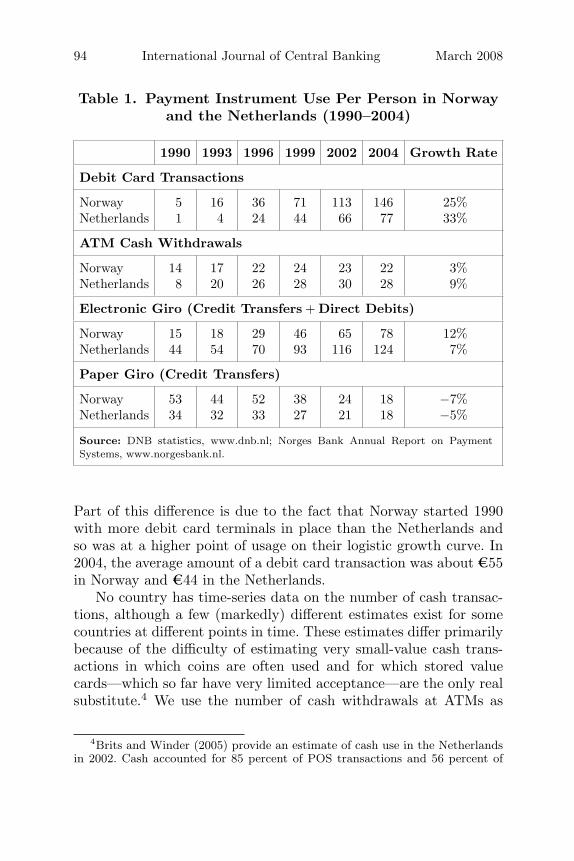
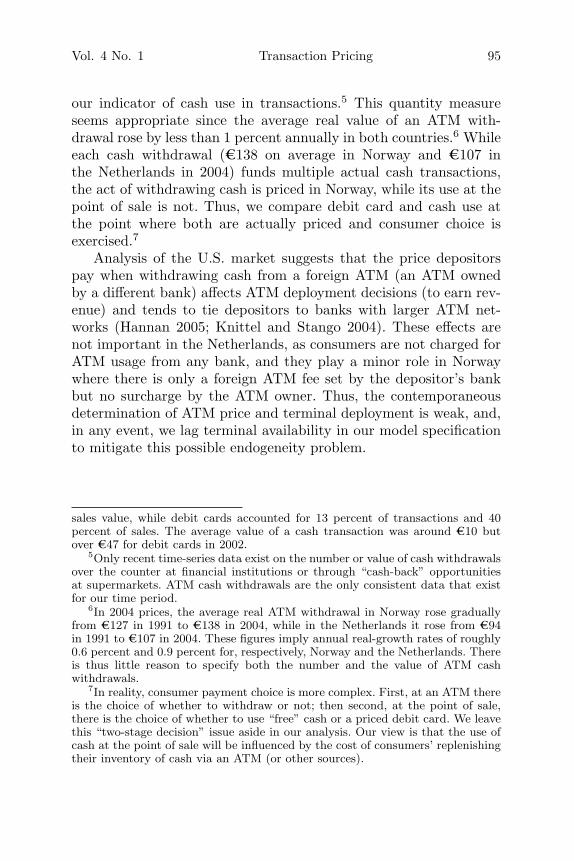
Both Norway and the Netherlands experienced a relatively rapidchange in their payment composition for point-of-sale and bill-payment transactions over 1990–2004. Point-of-sale instruments arenow almost solely debit cards and cash, but in the early 1990s,checks were also important.1 As seen in table 1, the number of debitcard transactions per person per year in Norway rose from 5 to146 over our fifteen-year period, growing 25 percent per year.2 TheNetherlands started from a smaller base of one transaction per per-son per year but rose to seventy-seven, a 33 percent annual growth.3
1Unlike in the United States, credit card use is low in Europe (and minisculein the two countries we examine).
2Oil company terminals and cards were introduced in the 1980s as a substi-tute for cash at gas stations. Although these terminals also accepted bank debitcards, oil company cards could not be used elsewhere and were not priced. TheNorwegian payment statistics do not include oil company transactions as debitcard purchases (Norges Bank 2000, 33) and neither do we. Oil company termi-nals are included in our series of debit card terminals, however, since they acceptdebit cards for payment.
3Checks written per person in Norway went from twelve per person annuallyin 1990 to less than one in 2004. In the Netherlands, they went from seventeento zero. Credit card transactions per person in both countries were less than onein 1990 and only three per person (the Netherlands) to five (Norway) in 2004(or about 3 percent of card use in each country). The dominance of debit cardsover credit cards is probably due to the fact that banks—not the credit cardcompanies—through a joint venture were the first to introduce EFTPOS (elec-tronic funds transfer at point of sale) directly from deposit accounts and havePOS terminals connected to the bank network installed in shops. The banks’ pur-pose was to replace checks and cash with cheaper electronic cards at the pointof sale.
94 International Journal of Central Banking March 2008
Table 1. Payment Instrument Use Per Person in Norwayand the Netherlands (1990–2004)
1990 1993 1996 1999 2002 2004 Growth Rate
Debit Card Transactions
Norway 5 16 36 71 113 146 25%Netherlands 1 4 24 44 66 77 33%
ATM Cash Withdrawals
Norway 14 17 22 24 23 22 3%Netherlands 8 20 26 28 30 28 9%
Electronic Giro (Credit Transfers + Direct Debits)
Norway 15 18 29 46 65 78 12%Netherlands 44 54 70 93 116 124 7%
Paper Giro (Credit Transfers)
Norway 53 44 52 38 24 18 −7%Netherlands 34 32 33 27 21 18 −5%
Source: DNB statistics, www.dnb.nl; Norges Bank Annual Report on PaymentSystems, www.norgesbank.nl.
Part of this difference is due to the fact that Norway started 1990with more debit card terminals in place than the Netherlands andso was at a higher point of usage on their logistic growth curve. In2004, the average amount of a debit card transaction was about e55in Norway and e44 in the Netherlands.
No country has time-series data on the number of cash transac-tions, although a few (markedly) different estimates exist for somecountries at different points in time. These estimates differ primarilybecause of the difficulty of estimating very small-value cash trans-actions in which coins are often used and for which stored valuecards—which so far have very limited acceptance—are the only realsubstitute.4 We use the number of cash withdrawals at ATMs as
4Brits and Winder (2005) provide an estimate of cash use in the Netherlandsin 2002. Cash accounted for 85 percent of POS transactions and 56 percent of
Vol. 4 No. 1 Transaction Pricing 95
our indicator of cash use in transactions.5 This quantity measureseems appropriate since the average real value of an ATM with-drawal rose by less than 1 percent annually in both countries.6 Whileeach cash withdrawal (e138 on average in Norway and e107 inthe Netherlands in 2004) funds multiple actual cash transactions,the act of withdrawing cash is priced in Norway, while its use at thepoint of sale is not. Thus, we compare debit card and cash use atthe point where both are actually priced and consumer choice isexercised.7
Analysis of the U.S. market suggests that the price depositorspay when withdrawing cash from a foreign ATM (an ATM ownedby a different bank) affects ATM deployment decisions (to earn rev-enue) and tends to tie depositors to banks with larger ATM net-works (Hannan 2005; Knittel and Stango 2004). These effects arenot important in the Netherlands, as consumers are not charged forATM usage from any bank, and they play a minor role in Norwaywhere there is only a foreign ATM fee set by the depositor’s bankbut no surcharge by the ATM owner. Thus, the contemporaneousdetermination of ATM price and terminal deployment is weak, and,in any event, we lag terminal availability in our model specificationto mitigate this possible endogeneity problem.
sales value, while debit cards accounted for 13 percent of transactions and 40percent of sales. The average value of a cash transaction was around e10 butover e47 for debit cards in 2002.
5Only recent time-series data exist on the number or value of cash withdrawalsover the counter at financial institutions or through “cash-back” opportunitiesat supermarkets. ATM cash withdrawals are the only consistent data that existfor our time period.
6In 2004 prices, the average real ATM withdrawal in Norway rose graduallyfrom e127 in 1991 to e138 in 2004, while in the Netherlands it rose from e94in 1991 to e107 in 2004. These figures imply annual real-growth rates of roughly0.6 percent and 0.9 percent for, respectively, Norway and the Netherlands. Thereis thus little reason to specify both the number and the value of ATM cashwithdrawals.
7In reality, consumer payment choice is more complex. First, at an ATM thereis the choice of whether to withdraw or not; then second, at the point of sale,there is the choice of whether to use “free” cash or a priced debit card. We leavethis “two-stage decision” issue aside in our analysis. Our view is that the use ofcash at the point of sale will be influenced by the cost of consumers’ replenishingtheir inventory of cash via an ATM (or other sources).
96 International Journal of Central Banking March 2008
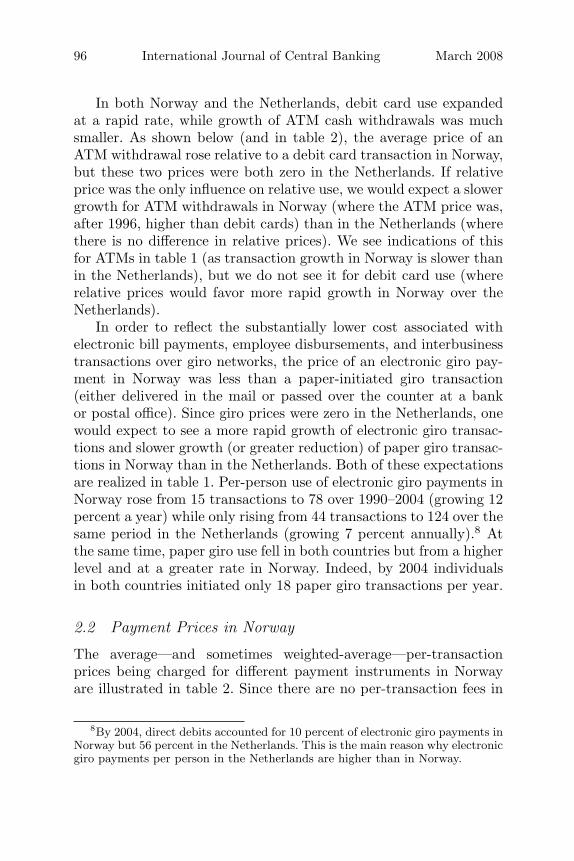
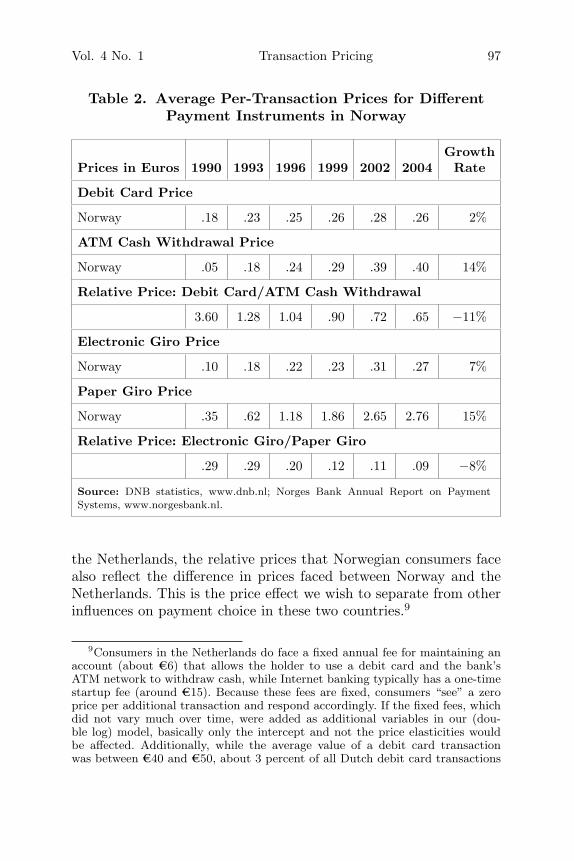
In both Norway and the Netherlands, debit card use expandedat a rapid rate, while growth of ATM cash withdrawals was muchsmaller. As shown below (and in table 2), the average price of anATM withdrawal rose relative to a debit card transaction in Norway,but these two prices were both zero in the Netherlands. If relativeprice was the only influence on relative use, we would expect a slowergrowth for ATM withdrawals in Norway (where the ATM price was,after 1996, higher than debit cards) than in the Netherlands (wherethere is no difference in relative prices). We see indications of thisfor ATMs in table 1 (as transaction growth in Norway is slower thanin the Netherlands), but we do not see it for debit card use (whererelative prices would favor more rapid growth in Norway over theNetherlands).
In order to reflect the substantially lower cost associated withelectronic bill payments, employee disbursements, and interbusinesstransactions over giro networks, the price of an electronic giro pay-ment in Norway was less than a paper-initiated giro transaction(either delivered in the mail or passed over the counter at a bankor postal office). Since giro prices were zero in the Netherlands, onewould expect to see a more rapid growth of electronic giro transac-tions and slower growth (or greater reduction) of paper giro transac-tions in Norway than in the Netherlands. Both of these expectationsare realized in table 1. Per-person use of electronic giro payments inNorway rose from 15 transactions to 78 over 1990–2004 (growing 12percent a year) while only rising from 44 transactions to 124 over thesame period in the Netherlands (growing 7 percent annually).8 Atthe same time, paper giro use fell in both countries but from a higherlevel and at a greater rate in Norway. Indeed, by 2004 individualsin both countries initiated only 18 paper giro transactions per year.
2.2 Payment Prices in Norway
The average—and sometimes weighted-average—per-transactionprices being charged for different payment instruments in Norwayare illustrated in table 2. Since there are no per-transaction fees in
8By 2004, direct debits accounted for 10 percent of electronic giro payments inNorway but 56 percent in the Netherlands. This is the main reason why electronicgiro payments per person in the Netherlands are higher than in Norway.
Vol. 4 No. 1 Transaction Pricing 97
Table 2. Average Per-Transaction Prices for DifferentPayment Instruments in Norway
GrowthPrices in Euros 1990 1993 1996 1999 2002 2004 Rate
Debit Card Price
Norway .18 .23 .25 .26 .28 .26 2%
ATM Cash Withdrawal Price
Norway .05 .18 .24 .29 .39 .40 14%
Relative Price: Debit Card/ATM Cash Withdrawal
3.60 1.28 1.04 .90 .72 .65 −11%
Electronic Giro Price
Norway .10 .18 .22 .23 .31 .27 7%
Paper Giro Price
Norway .35 .62 1.18 1.86 2.65 2.76 15%
Relative Price: Electronic Giro/Paper Giro
.29 .29 .20 .12 .11 .09 −8%
Source: DNB statistics, www.dnb.nl; Norges Bank Annual Report on PaymentSystems, www.norgesbank.nl.
the Netherlands, the relative prices that Norwegian consumers facealso reflect the difference in prices faced between Norway and theNetherlands. This is the price effect we wish to separate from otherinfluences on payment choice in these two countries.9
9Consumers in the Netherlands do face a fixed annual fee for maintaining anaccount (about e6) that allows the holder to use a debit card and the bank’sATM network to withdraw cash, while Internet banking typically has a one-timestartup fee (around e15). Because these fees are fixed, consumers “see” a zeroprice per additional transaction and respond accordingly. If the fixed fees, whichdid not vary much over time, were added as additional variables in our (dou-ble log) model, basically only the intercept and not the price elasticities wouldbe affected. Additionally, while the average value of a debit card transactionwas between e40 and e50, about 3 percent of all Dutch debit card transactions
98 International Journal of Central Banking March 2008
The weighted-average per-transaction price of a cash withdrawalin Norway was in 1996, and earlier, less than that for debit cards.10
This was because a cash withdrawal at one’s own bank was freeduring business hours and prices applied only to withdrawals afterbusiness hours or at another bank’s ATM. While debit cards startedout in 1990 with a price that was more than three times higher thanthe weighted average of different ATM prices (table 2, row 3), itended up being only 65 percent of the cash withdrawal price in 2004.Thus, only after 1996 did the absolute price of a debit card favor itsuse over cash when EFTPOS terminals were available.11 But evenbefore 1996, there was an indirect inducement to use debit cards inNorway when it became possible in late 1992 to obtain “cash back”from a debit card transaction at the point of sale.12 This avoided theextra cost and inconvenience of having to use an ATM to withdrawcash, since small amounts of cash could be obtained at no additionalcost when making purchases at the local market.
There was a stronger relative price inducement to use an elec-tronic rather than a paper-initiated giro transaction for consumerbill payments. In 1990, the price of an electronic giro transactionwas only 29 percent as high as a paper giro payment, but by 2004
were subject to a merchant surcharge of about 15 eurocents (De Nederland-sche Bank 2004) when the transaction value was less than e10–e12. Some mer-chants wished to discourage use of debit cards for low-value transactions sinceaccepting cash is cheaper due to bank fees paid by merchants for debit cardtransactions.
10This observation only holds on a per-transaction basis. On average, oneATM withdrawal could fund roughly two to three debit card transactions. How-ever, since this difference in “transaction domain” between both instrumentsis relatively stable over time, it should only affect the intercept in our modelin logs.
11The relative debit card/ATM price changes shown reflect banks’ initial effortsto induce depositors to shift cash withdrawals from branch offices to cheaperATMs and then later from cash use to even cheaper debit card transactions.
12Although cash-back transactions and cash at the counter at one’s own bankare also sources for obtaining cash for free in Norway—and implicitly lower theeffective price for obtaining cash compared to our use of the weighted averageof free and priced ATM access—these data are available only for recent yearsand therefore could not be directly included in the analysis. The alternative ofincluding a cash-back dummy, since it was collinear with the debit card pricevariable already in the model, yielded anomalous results, suggesting that thesetwo effects cannot be reliably separated. Thus, the debit card price elasticityreported below is best considered as a combination of price and cash-back effectsin Norway.
Vol. 4 No. 1 Transaction Pricing 99
this had fallen to only 9 percent of the paper price. In the begin-ning, electronic giro payments were initiated via telephone, but thiswas later overtaken by the spread of Internet banking. This appliesto credit transfers where the consumer retains control in initiatinga payment, as opposed to a direct debit where the receiver of thecredit initiates the debit to the consumer’s account under a pre-arranged contractual agreement. Billers often give a slight discountto customers who pay by direct debit, thus creating a slight priceadvantage over a credit transfer. However, regardless of which partyinitiates the payment, both are counted as a single electronic girotransaction.
It is important to note that the prices charged in Norway do notcover the full bank cost of making a payment (cf. Flatraaker andRobinson 1995; Gresvik and Øwre 2003). In 1988, transaction pricescovered only around 25 percent of the banks’ payment cost, but thiscoverage had risen to around 70 percent in 2001.13 As well, in bothcountries banks initially made some effort to inform customers ofthe advantages of using lower-cost electronic payments whether ornot the transactions were directly priced (but we cannot explicitlyaccount for this in our model).
2.3 Terminal Availability and Levels of Consumption
While relative prices provide an inducement to use electronic pay-ments at the point of sale, this can be accomplished only if a mer-chant has an EFTPOS terminal that can be used. This observationpoints to the two-sided nature of the payment market, which influ-ences the adoption rate of new payment instruments. In particular,the market for electronic payment services is considered a two-sidedmarket in the sense that both consumers and merchants are neededsimultaneously to demand and “consume” card payments. Suppliersof payment card services (or so-called “platforms”) can effectivelycross-subsidize between merchants and consumers through differen-tial pricing to stimulate this demand. In two-sided markets, typi-cally only one side is charged on a per-transaction basis, while the
13The relationship between fees and underlying costs is different in Sweden,with surplus bank revenues from card transactions cross-subsidizing the expenseof providing cash, distorting resource allocation (Sveriges Riksbank 2004, withmore detail in Guibourg and Segendorff 2007).
100 International Journal of Central Banking March 2008
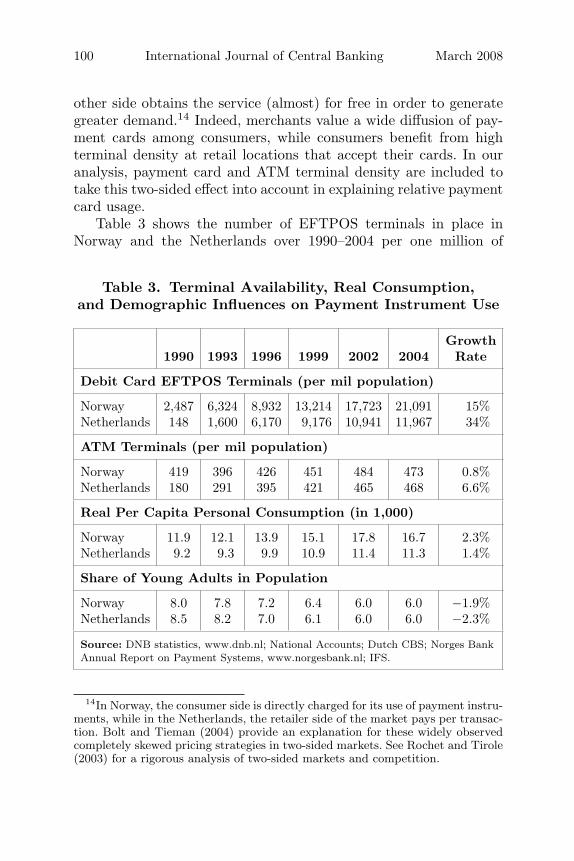
other side obtains the service (almost) for free in order to generategreater demand.14 Indeed, merchants value a wide diffusion of pay-ment cards among consumers, while consumers benefit from highterminal density at retail locations that accept their cards. In ouranalysis, payment card and ATM terminal density are included totake this two-sided effect into account in explaining relative paymentcard usage.
Table 3 shows the number of EFTPOS terminals in place inNorway and the Netherlands over 1990–2004 per one million of
Table 3. Terminal Availability, Real Consumption,and Demographic Influences on Payment Instrument Use
Growth1990 1993 1996 1999 2002 2004 Rate
Debit Card EFTPOS Terminals (per mil population)
Norway 2,487 6,324 8,932 13,214 17,723 21,091 15%Netherlands 148 1,600 6,170 9,176 10,941 11,967 34%
ATM Terminals (per mil population)
Norway 419 396 426 451 484 473 0.8%Netherlands 180 291 395 421 465 468 6.6%
Real Per Capita Personal Consumption (in 1,000)
Norway 11.9 12.1 13.9 15.1 17.8 16.7 2.3%Netherlands 9.2 9.3 9.9 10.9 11.4 11.3 1.4%
Share of Young Adults in Population
Norway 8.0 7.8 7.2 6.4 6.0 6.0 −1.9%Netherlands 8.5 8.2 7.0 6.1 6.0 6.0 −2.3%
Source: DNB statistics, www.dnb.nl; National Accounts; Dutch CBS; Norges BankAnnual Report on Payment Systems, www.norgesbank.nl; IFS.
14In Norway, the consumer side is directly charged for its use of payment instru-ments, while in the Netherlands, the retailer side of the market pays per transac-tion. Bolt and Tieman (2004) provide an explanation for these widely observedcompletely skewed pricing strategies in two-sided markets. See Rochet and Tirole(2003) for a rigorous analysis of two-sided markets and competition.
Vol. 4 No. 1 Transaction Pricing 101
population (which controls for differences in population size).15 Asshown in the first two rows, Norway had almost twice as many debitcard terminals as the Netherlands in 2004, and this difference wasfar more extreme in earlier periods. While the growth of EFTPOSterminals has been more than twice as rapid in the Netherlands,it still has a long way to go to provide the same density of termi-nal access as Norway. By this measure alone, it really would notbe possible—regardless of any price incentive—for consumers in theNetherlands to use debit cards with the same intensity per person asthey do in Norway. As noted earlier, there is no price incentive to usedebit cards in the Netherlands, so there are two reasons—no priceincentive and fewer EFTPOS terminals per person—to expect thatthe Netherlands would use debit cards less intensively than Norway.Even so, as shown below, it is difficult to separate the effect of pricesfrom terminal availability on debit card and ATM use.
The same “separation problem” exists for cash withdrawals atATMs. Norway prices ATM withdrawals, while the Netherlands doesnot, and for the entire period Norway also provided a greater den-sity of ATMs to withdraw cash from (table 3, row 3). Separating theprice effect from the terminal effect for ATM cash withdrawals maybe somewhat easier here since by 2004 both countries had almost thesame ATM density but withdrawals were priced only in Norway and,compared to the Netherlands after 1993, per-person use in Norwaywas correspondingly less (table 1, row 3).16
Inferences on the relative importance of pricing may be moreaccurate if two other possible, but small, influences on paymentchoice are considered. One concerns differences in the level of real
15In 2004, the population in the Netherlands was 16.3 million; in Norway itwas 4.6 million.
16As Norway is roughly nine times larger than the Netherlands, differences inpopulation density may compromise the usefulness of our availability measureof ATM and EFTPOS terminals. However, both countries are highly urbanized,which is probably the most important driver for installing terminals. In Nor-way, the five largest cities account for about 25 percent of total population butonly 1 percent of total geographic area (see Norway statistics, www.ssb.no). Lessextreme, in the Netherlands, the ten largest cities make up roughly 20 percentof Dutch population, with 3.5 percent of the geographic area (see CBS statistics,www.cbs.nl). Since this difference in densities is effectively a constant over fifteenyears, in our log-difference equation its impact would affect only the interceptand not the slope parameter, which is our terminal elasticity.
102 International Journal of Central Banking March 2008
per capita personal consumption between the two countries, sincehigher levels of real consumption tend to be associated with largernumbers of transactions.17 A second influence concerns the possibil-ity that changes in the number of young adults in both countries mayaffect differences in new payment adoption rates. Consumer surveysindicate that young adults and higher-income individuals adopt newpayment arrangements more rapidly than others, even without pric-ing. But direct pricing could well affect the adoption rates of thosewith greater habit persistence, those with a lower opportunity cost,or those who do not value much the added convenience or securitythat electronic payments can offer.
The level and variation of both per capita consumption and theshare of young adults in the population over time are illustrated inthe bottom half of table 3. Real per capita consumption in Norwaywas 29 percent greater than that in the Netherlands in 1990 but roseto be 48 percent higher in 2004. This difference should be associatedwith a rising number of all types of transactions in Norway relativeto the Netherlands. There are smaller differences between these twocountries in the shares of young adults—new entrants into the laborforce aged twenty to twenty-four. Indeed, these shares are falling inboth countries.18
3. A Country-Difference Model of Payment Choice
Differences between Norway and the Netherlands are used to try toexplain per capita use of debit cards, ATM cash withdrawals, andelectronic and paper giro payments. As outlined above, the maininfluences on payment use and composition are differences in thenumber of EFTPOS and ATM terminals per million population,the prices being charged in Norway (positive) and the Netherlands(zero), and differences in the level of real per capita consumption.
17All monetary values for Norway (prices as well as real consumption) havebeen translated from Norwegian kroner into euros using a purchasing power parityexchange rate. Also, real per capita consumption in Norway includes oil revenuesonly indirectly, as some of this revenue is used to finance government expendi-tures, which likely reduces taxes from what they otherwise would be, permittingreal consumption to be larger.
18Demographic variables are typically extremely smooth series. In implemen-tation, this created convergence problems in our system estimation and thepopulation share variable was excluded.
Vol. 4 No. 1 Transaction Pricing 103
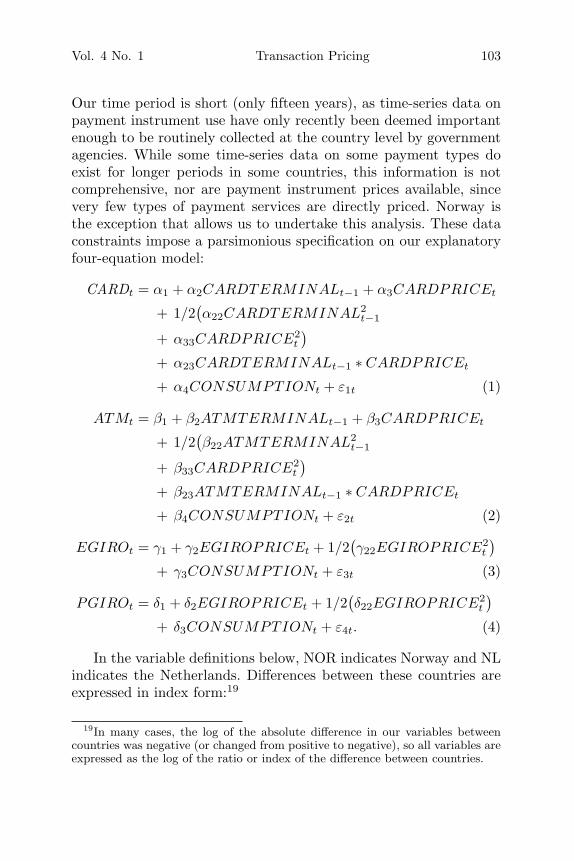
Our time period is short (only fifteen years), as time-series data onpayment instrument use have only recently been deemed importantenough to be routinely collected at the country level by governmentagencies. While some time-series data on some payment types doexist for longer periods in some countries, this information is notcomprehensive, nor are payment instrument prices available, sincevery few types of payment services are directly priced. Norway isthe exception that allows us to undertake this analysis. These dataconstraints impose a parsimonious specification on our explanatoryfour-equation model:
CARDt = α1 + α2CARDTERMINALt−1 + α3CARDPRICEt
+ 1/2(α22CARDTERMINAL2
t−1
+ α33CARDPRICE2t
)+ α23CARDTERMINALt−1 ∗ CARDPRICEt
+ α4CONSUMPTIONt + ε1t (1)
ATMt = β1 + β2ATMTERMINALt−1 + β3CARDPRICEt
+ 1/2(β22ATMTERMINAL2
t−1
+ β33CARDPRICE2t
)+ β23ATMTERMINALt−1 ∗ CARDPRICEt
+ β4CONSUMPTIONt + ε2t (2)
EGIROt = γ1 + γ2EGIROPRICEt + 1/2(γ22EGIROPRICE2
t
)+ γ3CONSUMPTIONt + ε3t (3)
PGIROt = δ1 + δ2EGIROPRICEt + 1/2(δ22EGIROPRICE2
t
)+ δ3CONSUMPTIONt + ε4t. (4)
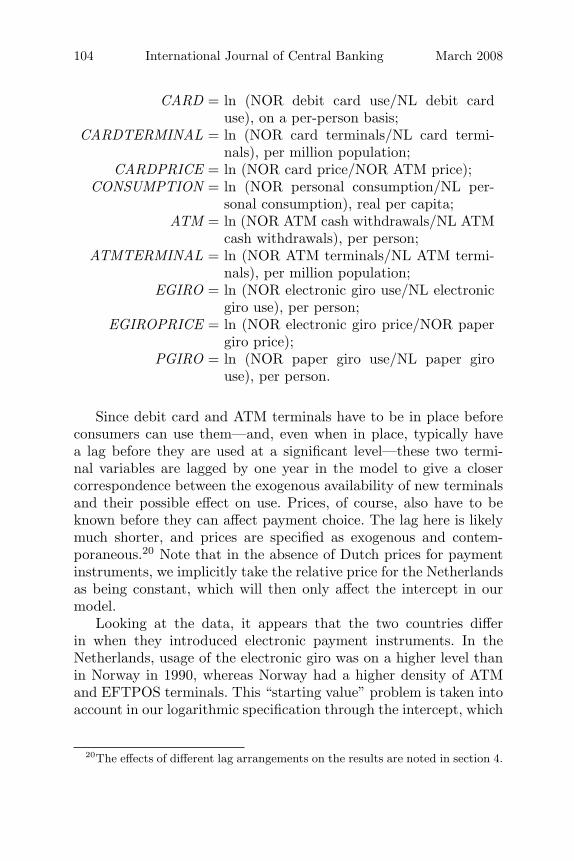
In the variable definitions below, NOR indicates Norway and NLindicates the Netherlands. Differences between these countries areexpressed in index form:19
19In many cases, the log of the absolute difference in our variables betweencountries was negative (or changed from positive to negative), so all variables areexpressed as the log of the ratio or index of the difference between countries.
104 International Journal of Central Banking March 2008
CARD = ln (NOR debit card use/NL debit carduse), on a per-person basis;
CARDTERMINAL = ln (NOR card terminals/NL card termi-nals), per million population;
CARDPRICE = ln (NOR card price/NOR ATM price);CONSUMPTION = ln (NOR personal consumption/NL per-
sonal consumption), real per capita;ATM = ln (NOR ATM cash withdrawals/NL ATM
cash withdrawals), per person;ATMTERMINAL = ln (NOR ATM terminals/NL ATM termi-
nals), per million population;EGIRO = ln (NOR electronic giro use/NL electronic
giro use), per person;EGIROPRICE = ln (NOR electronic giro price/NOR paper
giro price);PGIRO = ln (NOR paper giro use/NL paper giro
use), per person.
Since debit card and ATM terminals have to be in place beforeconsumers can use them—and, even when in place, typically havea lag before they are used at a significant level—these two termi-nal variables are lagged by one year in the model to give a closercorrespondence between the exogenous availability of new terminalsand their possible effect on use. Prices, of course, also have to beknown before they can affect payment choice. The lag here is likelymuch shorter, and prices are specified as exogenous and contem-poraneous.20 Note that in the absence of Dutch prices for paymentinstruments, we implicitly take the relative price for the Netherlandsas being constant, which will then only affect the intercept in ourmodel.
Looking at the data, it appears that the two countries differin when they introduced electronic payment instruments. In theNetherlands, usage of the electronic giro was on a higher level thanin Norway in 1990, whereas Norway had a higher density of ATMand EFTPOS terminals. This “starting value” problem is taken intoaccount in our logarithmic specification through the intercept, which
20The effects of different lag arrangements on the results are noted in section 4.
Vol. 4 No. 1 Transaction Pricing 105
is not restricted to a value of 1 (which would imply equal startingvalues for 1990).
4. Estimation Results and the Effect of Price onPayment Instrument Use
The system of equations (1)–(4) was estimated in a seemingly unre-lated regression framework to allow for the possible correlationbetween errors in locally identifying debit card use with those forATM cash withdrawals and similarly for electronic and paper girouse. With fifteen observations per equation, there are thirty-eightdegrees of freedom (d.f. = 4 ∗ 15 − 22). As shown in the appen-dix, the explanatory power of the model was high (the respectiveadjusted R2s were .96, .98, .84, and .75 from the system estima-tion). As the variables are not I(0) and thus our levels estimationmay be unbalanced, yielding spurious results, we first checked for thepresence of any residual autocorrelation. Fortunately, system resid-ual portmanteau (Ljung-Box) Q-test statistics (adjusted for smallsample) indicate that the autocorrelations of the residuals are notstatistically significant. As well, the Durbin-Watson values are fairlyreasonable for our four levels equations (respectively, 2.12, 2.80, 1.86,and 2.03). These autocorrelation tests suggest that the variables ofour four equations are likely to be cointegrated.
To formally test for cointegration, we applied augmented Dickey-Fuller (ADF) tests to the residuals of the levels equations (1)–(4),using critical values computed by Phillips and Ouliaris (1990). Thetest statistics show that we reject the null of no cointegration atthe 5 percent level for the ATM and the electronic giro equation,and at a 10 percent level for the debit card and paper giro equa-tion (see the last column in table 5, discussed later).21 The signsof the estimated parameters appear to be reasonable and expectedfrom theory, so the degree of spurious correlation, if any, is likely tobe small. Moreover, as shown in the next subsection, the residualsof our levels equations—measuring the deviations of a “long-run”
21By definition, cointegration requires that the variables be integrated of thesame order. Keeping in mind our small sample, applying ADF tests—usingMacKinnon (1996) critical values—indicated that for fourteen out of seventeenvariables, the null of a unit root is not rejected.
106 International Journal of Central Banking March 2008
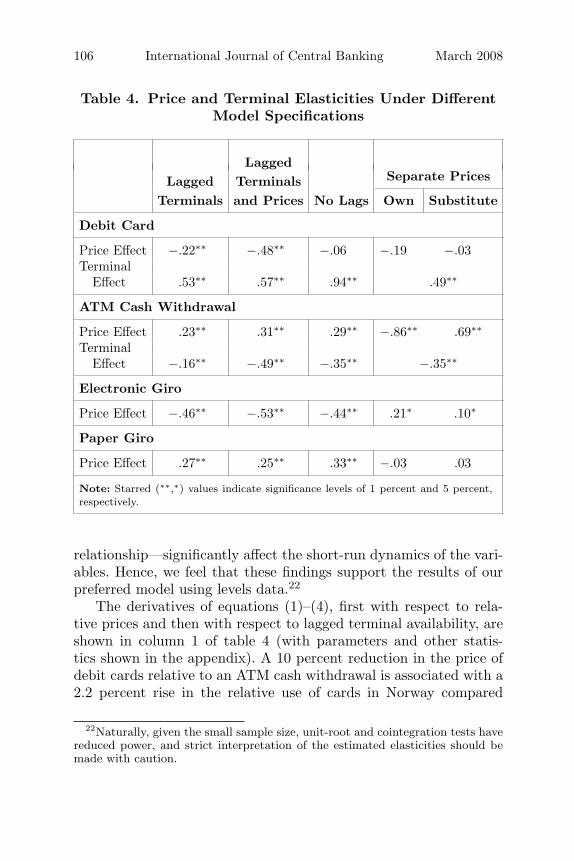
Table 4. Price and Terminal Elasticities Under DifferentModel Specifications
LaggedLagged Terminals Separate Prices
Terminals and Prices No Lags Own Substitute
Debit Card
Price Effect −.22∗∗ −.48∗∗ −.06 −.19 −.03Terminal
Effect .53∗∗ .57∗∗ .94∗∗ .49∗∗
ATM Cash Withdrawal
Price Effect .23∗∗ .31∗∗ .29∗∗ −.86∗∗ .69∗∗
TerminalEffect −.16∗∗ −.49∗∗ −.35∗∗ −.35∗∗
Electronic Giro
Price Effect −.46∗∗ −.53∗∗ −.44∗∗ .21∗ .10∗
Paper Giro
Price Effect .27∗∗ .25∗∗ .33∗∗ −.03 .03
Note: Starred (∗∗,∗) values indicate significance levels of 1 percent and 5 percent,respectively.
relationship—significantly affect the short-run dynamics of the vari-ables. Hence, we feel that these findings support the results of ourpreferred model using levels data.22
The derivatives of equations (1)–(4), first with respect to rela-tive prices and then with respect to lagged terminal availability, areshown in column 1 of table 4 (with parameters and other statis-tics shown in the appendix). A 10 percent reduction in the price ofdebit cards relative to an ATM cash withdrawal is associated with a2.2 percent rise in the relative use of cards in Norway compared
22Naturally, given the small sample size, unit-root and cointegration tests havereduced power, and strict interpretation of the estimated elasticities should bemade with caution.
Vol. 4 No. 1 Transaction Pricing 107
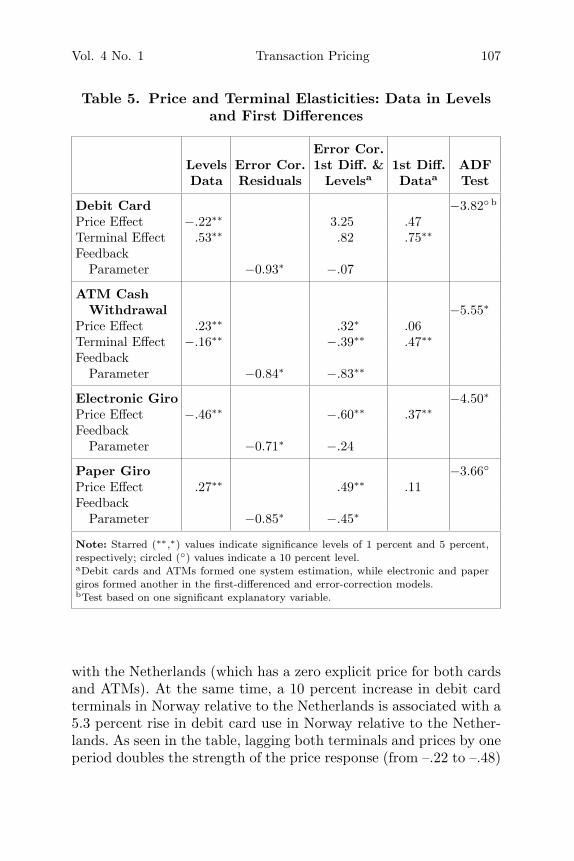
Table 5. Price and Terminal Elasticities: Data in Levelsand First Differences
Error Cor.Levels Error Cor. 1st Diff. & 1st Diff. ADFData Residuals Levelsa Dataa Test
Debit Card −3.82◦ b
Price Effect −.22∗∗ 3.25 .47Terminal Effect .53∗∗ .82 .75∗∗
FeedbackParameter −0.93∗ −.07
ATM CashWithdrawal −5.55∗
Price Effect .23∗∗ .32∗ .06Terminal Effect −.16∗∗ −.39∗∗ .47∗∗
FeedbackParameter −0.84∗ −.83∗∗
Electronic Giro −4.50∗
Price Effect −.46∗∗ −.60∗∗ .37∗∗
FeedbackParameter −0.71∗ −.24
Paper Giro −3.66◦
Price Effect .27∗∗ .49∗∗ .11Feedback
Parameter −0.85∗ −.45∗
Note: Starred (∗∗,∗) values indicate significance levels of 1 percent and 5 percent,respectively; circled (◦) values indicate a 10 percent level.aDebit cards and ATMs formed one system estimation, while electronic and papergiros formed another in the first-differenced and error-correction models.bTest based on one significant explanatory variable.
with the Netherlands (which has a zero explicit price for both cardsand ATMs). At the same time, a 10 percent increase in debit cardterminals in Norway relative to the Netherlands is associated with a5.3 percent rise in debit card use in Norway relative to the Nether-lands. As seen in the table, lagging both terminals and prices by oneperiod doubles the strength of the price response (from –.22 to –.48)
108 International Journal of Central Banking March 2008
but does not alter the terminal elasticity. Assuming no lags, how-ever, increases considerably the apparent responsiveness of debitcard use to changes in terminal availability—making it almost one-to-one in percentage terms—but the trade-off is that it generates aprice elasticity insignificantly different from zero.
Over 1990–2004, the price of ATMs in Norway rose relative tothat of debit cards. The price elasticity suggests that a 10 percentrise in the relative price of ATMs is associated with a 2.3 percentdecrease in relative use.23 Numerically, this is very similar to theresult for the debit card equation, where a 10 percent reductionin the relative price of debit cards gives a 2.2 percent rise in rel-ative use.24 The ATM terminal elasticity, however, has an unex-pected sign and is negative at its mean. When evaluated yearly,the terminal elasticity is positive over 1990–94, but the negativerelationship for the remaining years dominates, giving a negativemean. Looking more closely at ATM use and terminal availabil-ity by year (not shown) suggests that the source of the negativeelasticity is that per-person ATM use in Norway reaches a peakin 1998 and then falls, while ATM availability in Norway reachesa peak five years later in 2003. Similarly, ATM use in the Nether-lands peaks in 2001, but terminals continue to expand. The apparentexplanation for the negative ATM terminal elasticity is that ATMuse has reached saturation (due in part to the price disincentive),while terminals are still being added (allowing banks to substituteATMs for expensive branches, which fell absolutely in the two coun-tries), giving the result that terminals are expanding while use isfalling.
The estimated price effects for electronic and paper giro pay-ments conform to expectations since, when the relative price of elec-tronic giro transactions falls 10 percent, relative use of this instru-ment in Norway rises 4.6 percent compared with the Netherlands.Similarly, a 10 percent increase in the relative price of paper giro
23Since the price ratio used in the ATM equation is the same as that used inthe debit card equation—ln (Norway debit card price/Norway ATM price)—thenegative debit card price elasticity would become a positive elasticity in the ATMequation.
24The ATM price effect is larger when both terminals and prices are lagged inthe model. Using bank-level data for Spain, Scholnick et al. (2007) also find thatdebit cards substitute for ATM cash withdrawals.
Vol. 4 No. 1 Transaction Pricing 109
payments is associated with a 2.7 percent reduction in relative usebetween the two countries.25 Once an individual switched to makingan electronic giro payment, almost all of their giro transactions wereelectronic, and electronic payment volume grew by inducing moreand more individuals to switch. In contrast, the substitution of debitcards for ATMs was twofold since it involved individuals shiftinga progressively larger share of their point-of-sale transactions fromcash to cards over time as more terminals became available and rel-ative prices changed as well as inducing more and more individualsto adopt and use cards.
To illustrate the robustness of our results, our preferred model inequations (1)–(4) was respecified so that direct debits, which com-prise 10 percent of electronic giro payments in Norway but 56 percentin the Netherlands, were deleted from the electronic giro use (basi-cally leaving only credit transfers). This had almost no effect onthe price results shown in column 1 of table 4. Equations (1)–(4)were respecified again to include checks with ATMs so that bothcan substitute with debit cards. Checks were important in the early1990s, had a high price, and their use effectively fell to zero by 2004.Nothing of substance was changed except that the debit card priceelasticity lost significance.26
Real per capita personal consumption was markedly higher inNorway and growing faster than in the Netherlands. We expectedthat this would have a significantly positive effect on expanding rel-ative electronic payment use in Norway. However, the effect of realper capita personal consumption on payment use was insignificantin all four equations.
Just as an exercise, equations (1)–(4) were simplified by deletingthe squared terminal, squared price, and terminal-price interactionvariables. Then the remaining price ratio in each equation (e.g., debitcard price/ATM price and electronic giro price/paper giro price) wasreexpressed as the log of separate own and substitute price variables
25Since the same price ratio is used in both the electronic and paper giroequations—ln (Norway electronic giro price/Norway paper giro price)—the neg-ative electronic giro price elasticity would become a positive elasticity in thepaper giro equation.
26The price and terminal elasticities were only slightly changed if, instead ofestimating equations (1)–(4) as a single system, system estimation was appliedto (1) and (2) and then separately to (3) and (4).
110 International Journal of Central Banking March 2008
for each equation. The resulting own and substitute price elasticities,along with the reestimated terminal effect, are shown in the last twocolumns of table 4. Our preferred model (in column 1) is specifiedin ratio form, due to our limited sample, but it is of interest to seethe implied own and cross-price elasticities that result from estimat-ing each price elasticity separately. All but one own price elasticity isnegative, and three of the four cross-price elasticities are positive (aswould be expected for a substitute payment instrument). However,considering that only one negative own elasticity and two positivecross-elasticities were significant, it seems that the price effects arenot very strong.
4.1 Cointegration and Error Correction
In the previous section we formally tested whether the variables ofour levels equations were cointegrated. These tests indicated that theresiduals were stationary and that we could reject the null hypoth-esis of no cointegration. To assess how deviations from the long-runequilibrium—as captured by the movements of the residuals—affectthe short-run dynamics of the variables, we also estimated an error-correction (system) model. Since the models in levels, in first differ-ences, or in error-correction form are all nested within an “autore-gressive distributed lag” framework, it allows us to test which modelfits the data best.
To illustrate, consider the following extension of equation (1),written in an autoregressive distributed lag regression format byadding lagged endogenous and exogenous variables:27
CARDt = α + γCARDt−1 + δ1CARDPRICEt + δ2CARDPRICEt−1
+ β1CARDTERMINALt−1 + β2CARDTERMINALt−2
+ ut. (5)
Without affecting its ability to explain the data or changing theleast-squares estimates of the parameters of interest, (5) may be
27Note that compared with equation (1), the squared variables, interactionterms, and consumption have been excluded. These additional variables could beincluded without affecting our illustration.
Vol. 4 No. 1 Transaction Pricing 111
rewritten in error-correction form:
∆CARDt = α + β1∆CARDTERMINALt−1 + δ1∆CARDPRICEt
+ (γ − 1)(CARDt−1 − α22CARDTERMINALt−2
− α33CARDPRICEt−1) + ut, (6)
where α22 = β1+β2γ−1 and α33 = δ1+δ2
γ−1 denote the long-run elasticities(equivalent to the elasticities in levels equation (1)). In (6) we havean equilibrium relationship describing the short-run dynamics,
∆CARDt = α + β1∆CARDTERMINALt−1 + δ1∆CARDPRICEt
+ ut,
and an equilibrium error,
CARDt−1 − α22CARDTERMINALt−2 − α33CARDPRICEt−1,
which measures the deviation from the long-run relationshipbetween the variables CARDt−1, CARDTERMINALt−2, andCARDPRICEt−1. Consequently, the feedback parameter γ−1 can beinterpreted as the proportion of the resulting disequilibrium that isreflected in the movement of CARDt in one period. If the parameterγ1 − 1 is negative and significantly different from zero, the model inerror-correction format cannot be rejected.28 In this case, long-runequilibrium deviations have a significant impact on the short-rundynamics, which disqualifies the model in first differences. On theother hand, insignificance of the adjustment parameter would favora first-difference model and implies a “disconnect” between the shortrun and long run. This disconnect would then cast doubt as well onthe empirical relevance of the long-run relationship (even when thevariables are cointegrated).
Because our variables in levels are cointegrated, direct estima-tion of equations (1)–(4) yields “super-consistent” estimators ofthe (cointegrating) long-run elasticities. Under cointegration, theresiduals from the levels equations can be used to estimate the
28As a stability condition, the feedback parameter γ − 1 needs to be between0 and –1.
112 International Journal of Central Banking March 2008
error-correction model. Alternatively, one can estimate equation (6)directly, using first differences and lagged level variables, but thiswill reduce our already limited degrees of freedom even further. Theerror-correction estimation results of all four equations are shownin table 5, along with the price and terminal elasticities for ourpreferred levels model from table 4.
The second column shows the adjustment parameters using thestationary residuals of the levels equations (1)–(4). All parame-ters have the right sign and magnitude, and are significant at the5 percent level, indicating that the short-run dynamics is indeedsignificantly influenced by deviations from the long-run relation-ship.29 The first-difference results are shown in column 4 of table 5,but the model is rejected. While the terminal elasticities have theexpected sign and are significant, this is at the expense of weakresults for the price elasticities. Compared with using residuals inthe error-correction estimation, we obtain weaker results when weapply direct estimation of the error-correction equations (see column3). Here the debit card price elasticity is no longer significant, butthe other price elasticities have the expected sign and are signifi-cant (even with a reduction in degrees of freedom), although in twocases the feedback parameter was not significant at the 5 percentlevel.
Given our data limitations, the outcomes of the cointegrationtests, and the performance of the error-correction model using sta-tionary residuals, these results weakly suggest that the (cointegrat-ing) price elasticities using levels data in equations (1)–(4)—ourpreferred model—are robust and can be relied upon as long-runestimates.
4.2 Estimation of Electronic for Paper Substitutionin Norway
The effect of pricing on payment instrument use is also esti-mated for Norway alone. This approach should give similar results
29The residual properties of the error-correction estimation using residualsare fairly reasonable with (adjusted) Ljung-Box stats: Q(1) = 24.1 (p = 0.09),Q(2) = 43.1 (p = 0.09), Q(3) = 62.8 (p = 0.07), and Q(10) = 163.5(p = 0.41).
Vol. 4 No. 1 Transaction Pricing 113
to our country-difference model if nonprice characteristics thataffect payment use in a country are weak. The specificationis linear and simpler than our country-difference model (dueto degrees-of-freedom considerations), and all the data are forNorway:
CARDATMt = α1 + α2CARDATMTERMINALt−1
+ α3CARDATMPRICEt + α4CONSUMPTIONt
+ ε1t (7)
ELEPAPERt = β1 + β2ELEPAPERPRICEt + β3CONSUMPTIONt
+ ε2t, (8)
where
CARDATM = ln (debit card use/ATM use), on aper-person basis;
CARDATMTERMINAL = ln (card terminals/ATM terminals),per million population;
CARDATMPRICE = ln (debit card price/ATM price);CONSUMPTION = ln (personal consumption), real per
capita;ELEPAPER = ln (electronic giro use/paper giro use),
per person;ELEPAPERPRICE = ln (electronic giro price/paper giro
price).
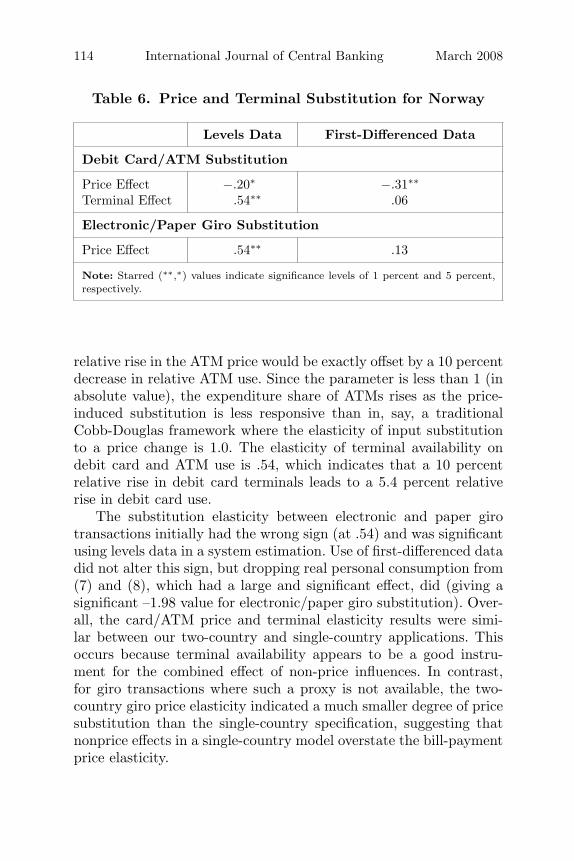
Equations (7) and (8) were estimated in a systems equationframework (with 23 degrees of freedom, d.f. = 2 ∗ 15 − 7). As shownin table 6, the elasticity of substitution between debit cards andcash was −.20 using levels data and −.31 in first differences. A 10percent rise in the relative price of an ATM cash withdrawal (whichreduces the ratio of debit card to ATM prices) is associated with asmall (2.0 percent or 3.1 percent) rise in the ratio of debit card toATM use. If this parameter was −1.0, then the expenditure sharesof debit cards and ATMs would be unchanged, since a 10 percent
114 International Journal of Central Banking March 2008
Table 6. Price and Terminal Substitution for Norway
Levels Data First-Differenced Data
Debit Card/ATM Substitution
Price Effect −.20∗ −.31∗∗
Terminal Effect .54∗∗ .06
Electronic/Paper Giro Substitution
Price Effect .54∗∗ .13
Note: Starred (∗∗,∗) values indicate significance levels of 1 percent and 5 percent,respectively.
relative rise in the ATM price would be exactly offset by a 10 percentdecrease in relative ATM use. Since the parameter is less than 1 (inabsolute value), the expenditure share of ATMs rises as the price-induced substitution is less responsive than in, say, a traditionalCobb-Douglas framework where the elasticity of input substitutionto a price change is 1.0. The elasticity of terminal availability ondebit card and ATM use is .54, which indicates that a 10 percentrelative rise in debit card terminals leads to a 5.4 percent relativerise in debit card use.
The substitution elasticity between electronic and paper girotransactions initially had the wrong sign (at .54) and was significantusing levels data in a system estimation. Use of first-differenced datadid not alter this sign, but dropping real personal consumption from(7) and (8), which had a large and significant effect, did (giving asignificant –1.98 value for electronic/paper giro substitution). Over-all, the card/ATM price and terminal elasticity results were simi-lar between our two-country and single-country applications. Thisoccurs because terminal availability appears to be a good instru-ment for the combined effect of non-price influences. In contrast,for giro transactions where such a proxy is not available, the two-country giro price elasticity indicated a much smaller degree of pricesubstitution than the single-country specification, suggesting thatnonprice effects in a single-country model overstate the bill-paymentprice elasticity.
Vol. 4 No. 1 Transaction Pricing 115
4.3 The Effect of Pricing on Payment Use
Our overall conclusion is that the availability of card terminals isa good proxy for the net effect of nonprice influences (such as con-venience) on card use. And although nonprice influences on carduse appear to have a stronger effect than does per-transaction pric-ing, the shift to electronic payments is speeded up when pricing ispresent.30 If both prices and terminals are expanded at similar per-centage rates, then the adoption of electronic payments could havebeen speeded up by perhaps 40 percent compared with not havingper-transaction pricing.31 As seen in tables 2 and 3, however, debitcard terminals changed at a much greater rate than did the priceof ATMs or the relative prices of cards to ATMs, indicating that inthis instance a potential speedup of 40 percent is too high and wasnot realized.
More precisely, for Norway, the average annual growth in debitcard terminal density equaled +15 percent, whereas the growth incard price relative to ATMs was −11 percent. Given the estimatedelasticities in column 1 of table 4, this would predict a relative riseof debit card use over ATMs of 15%× 0.53 + 11% × 0.22 = 10.4%from the terminal and price effects alone. Without any price induce-ments, this increase in usage would be 15%×0.53 = 8.0%, suggestingthat the substitution process has been speeded up by approximately2.4/10.4 = 23%, although the realized contribution of pricing todebit card adoption was 2.4 percent a year.32
Electronic giro payments do not have a terminal constraint, andthe influence of consumption growth on payment use is not signifi-cant, so only the effect of pricing is measured in the single-countrycase, while nonprice influences are incorporated in the two-countryestimate. The growth of electronic giro relative to paper giro prices
30Dutch survey results confirm the relative importance of terminal availabilityfor payment instrument usage and stress also the nonprice attributes of paymentinstruments (see Jonker 2007).
31This estimate is derived from the ratio of the price elasticity in our preferredmodel (–22 percent) in column 1 of table 4 to the terminal elasticity (53 percent),which equals .42.
32The same calculation using price (−.20) and terminal (.54) elasticities forNorway alone from table 6 gives a 20 percent speedup for debit card use (with acontribution of 2.2 percent annually).
116 International Journal of Central Banking March 2008
was −8 percent, while the price elasticity in table 4 was .46, sug-gesting that the realized contribution of pricing to the adoption ofelectronic giro payments was 8% × 0.46 = 3.7% annually. Thus, interms of both the size of the estimated price elasticities and theirrealized impact on adoption rates, the effect of pricing on the shiftto electronic payments is greater for giro transactions than for debitcards.
5. Summary and Conclusions
Electronic payment instruments (credit cards excepted) are consid-erably cheaper than their paper-based alternatives, including cash.Banks and merchants are interested in shifting users to electronicpayments to save costs, as are some government policymakers whoseek to improve the cost efficiency of their nation’s payments system.Historically, banks have recouped their payment costs through (i)interest earned on payment float (from delaying availability of fundscredited to accounts and debiting accounts prior to bill-paymentvalue dates), (ii) maintaining a spread between market rates and therate paid on deposits, and (iii) charging flat monthly fees or imposingbalance requirements. In contrast to business users, consumers facevery few payment services that are priced on a per-transaction basisand so have little price incentive to choose the lowest-cost instrumenteither at the point of sale or for bill payments.
Banks are well aware that transaction pricing can speed up theshift to electronic payments, but they are reluctant to lose depositmarket share by being the first (and perhaps only) bank to imple-ment explicit prices differentiated according to underlying costs.While this problem is mitigated if most (or all) banks implementpricing at about the same time, antitrust authorities are unlikelyto view such coordination as being in the public interest unless thesocial benefits from pricing are significant and the quid pro quo isa compensating reduction in payment float, a higher interest ratepaid on deposits, or a reduction in flat fees or balance requirements.Indeed, float reduction was the trade-off when banks coordinatedthe timing of when they would implement pricing in Norway (therewas no coordination in the prices to be charged, and initially somewere zero).
Vol. 4 No. 1 Transaction Pricing 117
We use the experience of Norway (which priced its payment ser-vices) and the Netherlands (which did not) over 1990–2004 to try todetermine what the incremental effect of transaction pricing may beon the adoption of debit cards versus withdrawing cash from an ATMand on the adoption of electronic giro transactions (credit transfersand direct debits) versus paper giros. Specifically, we compare per-person payment instrument use in Norway in response to the pricesbeing charged, the availability of terminals, and the level of real con-sumption with the experience of the Netherlands, which also adoptedelectronic payments but did not price. Our four-equation country-difference model spanned fifteen years—the limit of the availabledata—and during this time the share of electronic payments roseby some 60 percentage points, from around the mid-twenties to themid-eighties, which in most cases easily covered the inflection pointwhere the share of electronic payments switches from rising at anincreasing rate to rising at a decreasing rate.
Our model is estimated in a systems-equation framework usinglevels data, and robustness is illustrated by estimating models in afirst-difference and error-correction framework. Price and terminalelasticities derived from these models form the basis for our conclu-sions and indicate the incremental effect of pricing on the adoptionrate of electronic payments. The similarity of our card/ATM priceand terminal elasticity results between our two-country and single-country applications suggests that terminal availability is itself agood proxy for hard-to-specify/hard-to-measure nonprice attributesof card use at the point of sale. In contrast, for giro bill-paymenttransactions where such a proxy was not available, the two-countrygiro price elasticity indicated a much smaller degree of price sub-stitution than the single-country specification. This indicates thatunspecified nonprice effects in a single-country framework can over-state the “true” giro price elasticity value.
The effects of pricing differ depending on which instruments arebeing considered. Overall, pricing has a smaller effect on shiftingconsumers from ATM cash withdrawals to debit card use than itdoes in shifting use from paper to electronic giro transactions. Thereason for this difference seems to be that consumers value the non-price benefits associated with debit card use (convenience, security)such that the availability of terminals needed for debit card transac-tions has a stronger effect on debit card use than prices (as evidenced
118 International Journal of Central Banking March 2008
by the fact that the debit card price elasticity is smaller than theterminal elasticity). Debit cards also substitute for costly checks,and the high price on these instruments in Norway was associatedwith their virtual elimination, although the same thing happenedin the Netherlands, which did not price. While terminal availabil-ity has a stronger effect on debit card use than does pricing, theshift to cards can be speeded up when explicit pricing is combinedwith terminal availability. Using our estimated elasticities and theactual changes in prices and terminals, the predicted relative riseof debit card use over ATMs was 8 percent from terminal effectsalone but rose to 10.4 percent with pricing, an increase of over20 percent.
The effect of pricing on electronic giro use was greater than itwas for debit cards since the electronic giro price elasticity is largerand the percent change in price experienced was greater. Reasonsfor this difference are the above-mentioned nonprice convenience andsecurity attributes of debit cards, which promoted use, along withthe fact that for one-third of our time period the absolute priceof a debit card transaction was actually higher than the weighted-average price of an ATM cash withdrawal. In contrast, the price ofan electronic giro was always absolutely lower than the paper giroprice. Even though the relative prices of debit cards and electronicgiros were both falling over the entire period, the higher absoluteprice of a debit card transaction versus an ATM transaction wouldbe expected to dull the overall price response being measured forthe entire period, as there is no strong reason to believe that theprice response is symmetric (and symmetry was not imposed inour model) since the nonprice attributes of debit cards and ATMsare different. Thus, if pricing is implemented, it will likely be moresuccessful if the absolute price of the less expensive instrument isalways absolutely lower than the price of the more expensive instru-ment.33 Also, the fact that terminal elasticities are an importantcomponent of the substitution process for cards suggests that non-priced attributes—such as convenience and security—play a greater
33This was not done in Norway, perhaps because dispensing cash via an ATMwas already less expensive than dispensing it through a branch office (assumingthe rise in dispensing frequency at an ATM does not rise enough to offset thisadvantage).
Vol. 4 No. 1 Transaction Pricing 119
role for cards versus cash than for electronic versus paper girotransactions.
Given the large resource cost of a country’s payments sys-tem, it is obvious that shifting from paper to electronic paymentscan confer social benefits. Although not shown here, we estimatedthat the shift from ATM cash withdrawals and checks to debitcards plus the savings from shifting from paper to electronic girotransactions—if it happened without a lag—may save e0.7 billionin bank costs for Norway (.35 percent of GDP in 2004) and e2.9billion for the Netherlands (.61 percent of GDP).34 On a discountedbasis over time, shifting from 90 percent paper-based instrumentsand cash to 90 percent electronic and card instruments could saveabout e2,300 per person in each country.35 Merchant cost sav-ings, for which little information exists, would increase these savingsestimates.
As both Norway and the Netherlands are on their way to real-izing the full potential gains from electronic payments, the issue ofpricing or not pricing is seemingly more a policy topic for developedcountries that are not as far along in the substitution process or formost developing countries that are in the initial stages of thinkingabout how to improve the efficiency of their payments system. Thesocial benefits of electronic payments are quite large and may con-vince antitrust authorities to allow the coordination of the timingof the implementation of pricing (but not, of course, the prices tobe charged) to speed up this transition. But pricing could become areality even in countries that have largely shifted to electronic pay-ments since, with low or falling interest rate margins, this wouldfacilitate the recoupment of bank payment costs compared to con-tinued reliance on indirect methods (large loan-deposit interest ratespread, delayed funds availability, minimum balance requirements,or monthly fixed fees).
34The savings are absolutely higher for the Netherlands primarily because itspopulation (16.3 million) is much larger than that of Norway (4.6 million), butGDP per capita is lower.
35More information on the cost-savings estimate derived from payment-costdata and fitted logistic S-curves of a changing share of payment use is containedin a working paper (Bolt, Humphrey, and Uittenbogaard 2005).
120 International Journal of Central Banking March 2008
Appendix
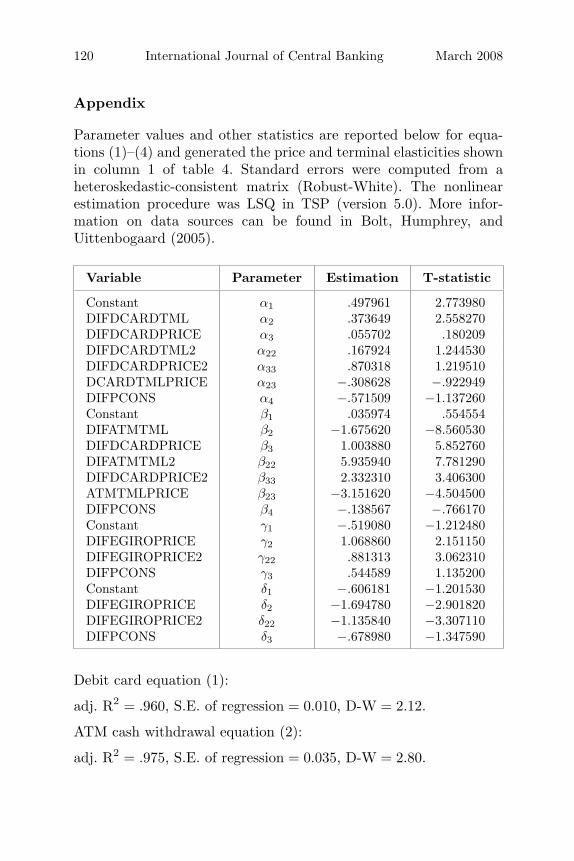
Parameter values and other statistics are reported below for equa-tions (1)–(4) and generated the price and terminal elasticities shownin column 1 of table 4. Standard errors were computed from aheteroskedastic-consistent matrix (Robust-White). The nonlinearestimation procedure was LSQ in TSP (version 5.0). More infor-mation on data sources can be found in Bolt, Humphrey, andUittenbogaard (2005).
Variable Parameter Estimation T-statistic
Constant α1 .497961 2.773980DIFDCARDTML α2 .373649 2.558270DIFDCARDPRICE α3 .055702 .180209DIFDCARDTML2 α22 .167924 1.244530DIFDCARDPRICE2 α33 .870318 1.219510DCARDTMLPRICE α23 −.308628 −.922949DIFPCONS α4 −.571509 −1.137260Constant β1 .035974 .554554DIFATMTML β2 −1.675620 −8.560530DIFDCARDPRICE β3 1.003880 5.852760DIFATMTML2 β22 5.935940 7.781290DIFDCARDPRICE2 β33 2.332310 3.406300ATMTMLPRICE β23 −3.151620 −4.504500DIFPCONS β4 −.138567 −.766170Constant γ1 −.519080 −1.212480DIFEGIROPRICE γ2 1.068860 2.151150DIFEGIROPRICE2 γ22 .881313 3.062310DIFPCONS γ3 .544589 1.135200Constant δ1 −.606181 −1.201530DIFEGIROPRICE δ2 −1.694780 −2.901820DIFEGIROPRICE2 δ22 −1.135840 −3.307110DIFPCONS δ3 −.678980 −1.347590
Debit card equation (1):
adj. R2 = .960, S.E. of regression = 0.010, D-W = 2.12.
ATM cash withdrawal equation (2):
adj. R2 = .975, S.E. of regression = 0.035, D-W = 2.80.
Vol. 4 No. 1 Transaction Pricing 121
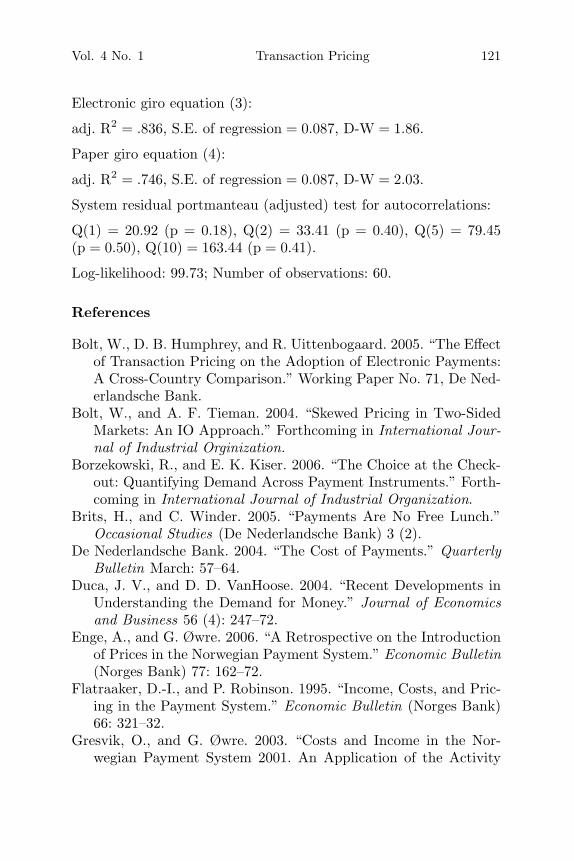
Electronic giro equation (3):
adj. R2 = .836, S.E. of regression = 0.087, D-W = 1.86.
Paper giro equation (4):
adj. R2 = .746, S.E. of regression = 0.087, D-W = 2.03.
System residual portmanteau (adjusted) test for autocorrelations:
Q(1) = 20.92 (p = 0.18), Q(2) = 33.41 (p = 0.40), Q(5) = 79.45(p = 0.50), Q(10) = 163.44 (p = 0.41).
Log-likelihood: 99.73; Number of observations: 60.
References
Bolt, W., D. B. Humphrey, and R. Uittenbogaard. 2005. “The Effectof Transaction Pricing on the Adoption of Electronic Payments:A Cross-Country Comparison.” Working Paper No. 71, De Ned-erlandsche Bank.
Bolt, W., and A. F. Tieman. 2004. “Skewed Pricing in Two-SidedMarkets: An IO Approach.” Forthcoming in International Jour-nal of Industrial Orginization.
Borzekowski, R., and E. K. Kiser. 2006. “The Choice at the Check-out: Quantifying Demand Across Payment Instruments.” Forth-coming in International Journal of Industrial Organization.
Brits, H., and C. Winder. 2005. “Payments Are No Free Lunch.”Occasional Studies (De Nederlandsche Bank) 3 (2).
De Nederlandsche Bank. 2004. “The Cost of Payments.” QuarterlyBulletin March: 57–64.
Duca, J. V., and D. D. VanHoose. 2004. “Recent Developments inUnderstanding the Demand for Money.” Journal of Economicsand Business 56 (4): 247–72.
Enge, A., and G. Øwre. 2006. “A Retrospective on the Introductionof Prices in the Norwegian Payment System.” Economic Bulletin(Norges Bank) 77: 162–72.
Flatraaker, D.-I., and P. Robinson. 1995. “Income, Costs, and Pric-ing in the Payment System.” Economic Bulletin (Norges Bank)66: 321–32.
Gresvik, O., and G. Øwre. 2003. “Costs and Income in the Nor-wegian Payment System 2001. An Application of the Activity
122 International Journal of Central Banking March 2008
Based Costing Framework.” Working Paper No. 2003/8, NorgesBank.
Guibourg, G., and B. Segendorff. 2007. “A Note on the Price andCost Structure of Retail Payment Services in the Swedish Bank-ing Sector 2002.” Journal of Banking and Finance 31 (9): 2817–27.
Hannan, T. 2005. “ATM Surcharge Bans and Bank Market Struc-ture: The Case of Iowa and Its Neighbors.” Working Paper No.46, Board of Governors of the Federal Reserve System.
Humphrey, D., A. Kaloudis, and G. Øwre. 2004. “The Future ofCash: Falling Legal Use and Implications for Government Pol-icy.” Journal of International Financial Markets, Institutionsand Money 14 (3): 221–33.
Humphrey, D. B., M. Kim, and B. Vale. 2001. “Realizing the Gainsfrom Electronic Payments: Costs, Pricing and Payment Choice.”Journal of Money, Credit, and Banking 33 (2): 216–34.
Humphrey, D., M. Willesson, G. Bergendahl, and T. Lindblom. 2006.“Benefits from a Changing Payment Technology in EuropeanBanking.” Journal of Banking and Finance 30 (6): 1631–52.
Jonker, N. 2007. “Payment Instruments as Perceived byConsumers—Results from a Household Survey.” De Economist155 (3): 271–303.
Klee, E. 2006. “Paper or Plastic? The Effect of Time on the Useof Check and Debit Cards at Grocery Stores.” Working PaperNo. 2, Board of Governors of the Federal Reserve System.
Knittel, C. R., and V. Stango. 2004. “Incompatibility, Prod-uct Attributes and Consumer Welfare: Evidence from ATMs.”NBER Working Paper 10962.
MacKinnon, J. G. 1996. “Numerical Distribution Functions for UnitRoot and Cointegration Tests.” Journal of Applied Econometrics11 (6): 601–18.
Norges Bank. 2000. Annual Report on Payment Systems. Norway:Norges Bank.
Phillips, P. C. B., and S. Ouliaris. 1990. “Asymptotic Properties ofResidual Based Tests for Cointegration.” Econometrica 58 (1):165–93.
Rochet, J.-C., and J. Tirole. 2003. “Platform Competition in Two-Sided Markets.” Journal of the European Economic Association1 (4): 990–1029.
Vol. 4 No. 1 Transaction Pricing 123
Scholnick, B., N. Massoud, A. Saunders, S. Carbo, and F. Rodriguez.2007. “The Economics of Credit Cards, Debit Cards and ATMs:A Survey and Some New Evidence.” Forthcoming in Journal ofBanking and Finance.
Sveriges Riksbank. 2004. “Prices and Costs in the Swedish PaymentSystem.” Financial Stability Report 2: 65–73.
Zinman, J. 2005. “Debit or Credit?” Working Paper, DartmouthCollege.