Embed Size (px)
Citation preview

Trans. Inst. Indian Geographers
Changing Household Size in India: An Inter-State Comparison
Debendra Kumar Nayak and Rabi Narayan Behera, Shillong, Meghalaya
Changing Household Size
The issue of changes in household size and composition in developing world is attracting scholarly attention only in recent years due largely to significant demographic changes of declining fertility, mortality and urbanisation in most countries and due to sociological changes towards smaller households. Such changes have been quite widespread in economically developed countries. The decline in fertility explains part of this change. The average household has fewer parents, fewer siblings, fewer grandchildren, and fewer other relatives of the household head. The social sciences, including sociology, economics, and anthropology, have a long tradition of
AbstractBased on Census information, this research explores the trend and spatial pattern in the changes of household size in India using state level data. Changes in household size are clear reflections on changes in living arrangements as well as in household composition. The problem acquires nuances of meanings in a country like India which has shown indications towards a tendency to move into a low fertility regime in the years to come. However, aggregate demographic statistics generally mask substantial changes in the size and number of households. As in most indicators of demographic, economic and social changes, household changes are neither uniform in their social and spatial content. The paper examines inter-state variation in this feature of change that is unfolding in India in recent years. The study reveals, demographic parameters, in contrast to non-demographic parameters, have a stronger association with extremes of household size-either very small or very large.
Key Words: Multi-generational households, joint families, mean household size, Demographic convergence.
scholarly contribution on issues pertaining to families and households and there are extensive corresponding literatures. In contrast, demographers have neglected the quantitative dimensions of the size composition and change in households and their causes and consequences (Bongaarts, 2001). Understandably, family demography is fairly recent and relatively underdeveloped branch of population studies. Intrinsic complexity inherent in demographic understanding of households and families have rendered this interesting area of analysis rather muted. Bongaarts (2001) has an explanation to this unsatisfactory situation. He goes on to add that “in conventional demography the unit of analysis is the

2 | Transactions | Vol. 36, No. 1, 2014
individual, whose characteristics can be described with a limited number of variables such as age and sex. Widely accepted theories and models have been developed to describe how population distributions of these individual characteristics are determined by vital processes. In contrast, the family demographer has to deal with multi-dimensional families, households, and kin groups...The networks of relationships make families essential socioeconomic units, but they pose formidable problems to the demographer who tries to identify and quantify the key structural dimensions of these interrelated groups of individuals”.
Nevertheless, studies on household size constitute a significant area of research in countries experiencing declining population growth effected by or leading to significant changes in living arrangements. Understandably sociologists and demo-graphers are not attracted to this area of research in countries with high fertility level. This perhaps explains lack of research in this area in India. A cursory glance at available research in India reveals little or negligible studies conducted in this area. Aiyappan (1972) analysed the census data on households to study changes in family size from 1871 to 1961 in Kerala, particularly drawing interesting conclusions on the basis of data contained in the 1891 Census report. Studies of developing countries have focused on several socio cultural as well as socioeconomic factors associated with fertility and household size: modernization (Levy, 1985); contraceptive use and family-planning programs (Koenig et al., 1987); and cultural attitudes and values, such as the
perceived old-age security value of children (Rani, 1986) or the view of children as risk insurance (Robinson, 1986). Researchers have examined the extent to which fertility and household size may vary depending on individuals’ family backgrounds, social and psychological characteristics, or economic status. Blake (1986) observed an inverse relationship between social class and household size. More education, higher age-at-marriage, longer interval between marriage and the birth of the first child, and employment status were found associated with smaller families (Wagner et al., 1985). Probability of having an additional child is higher in families with all children of the same sex (Gualtieri and Hicks 1986).
More recently, national census 2001 drew attention to falling household size during the last three decades which is becoming an all India phenomenon rather than confined to Kerala. The other agency that has made some contribution to this area is National Family Health Surveys (1993, 1999 and 2006). Both Census and NFHS data provide valuable insights into significant changes in household size and composition as well as in interstate variation beginning since 1991-a fact that has not been adequately researched till date.
Based on Census information, this study explores the trend and spatial pattern in the changes of household size in India using state level data. Changes in household size are clear reflections on changes in living arrangements as well as in household composition. The problem acquires nuances of meanings in a country like India which has shown indications towards a tendency to
Transactions | Vol. 36, No. 1, 2014 | 3
move into a low fertility regime in the years to come. However, aggregate demographic statistics generally mask substantial changes in the size and number of households. As in most indicators of demographic, economic and social changes, household changes are neither uniform in their social and spatial content. It may be worthwhile to examine inter-state variation in this feature of change that is unfolding in India in recent years.
Family and households: Concepts
Census of India while collecting data on the households considered it to be basic unit in a society for social, economic, political and socialization purpose. Sociologically, Household is a co-residential socio-economic unit regardless of kinship ties whereas family is a group- membership in which is mainly based on affinal and consanguinal ties. While both household and families are culturally defined, the former are task-oriented residence units and the latter are conceived of as kinship groupings that need not be localized. But the family is also co-residential, socio-economic unit in most cases. The type and size of the household in most of the societies are influenced by kinship rules, demographic and socio-economic factors, level of urbanization and industrialization. Therefore to understand the social structure of a society, its cohabitation pattern and congestion at a given point of time, the household level data is a very useful tool.
Census in India traditionally collects information on three types of household
namely Normal households, Institutional Households and Houseless Households1.
Aggregate Pattern
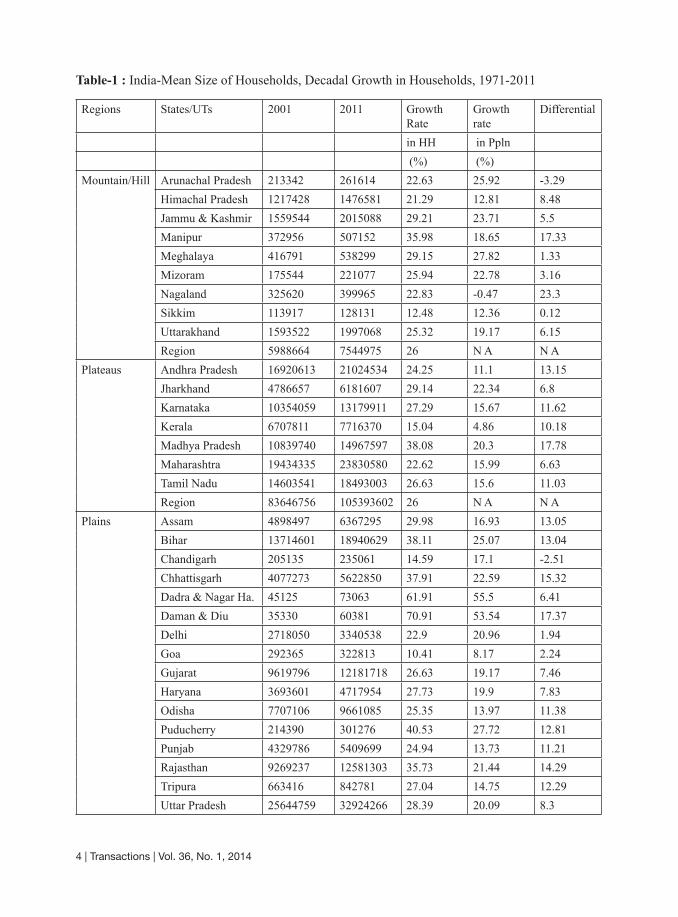
In India as a whole (Table-1), the rate of increase in population was higher than the rate of increase in the number of households till the year 1981. The pattern has reversed in the year 1991 and has become more intense in the year 2001. The 2011 Census data confirms a further intensification of this process of reversal whereby the increase in households far exceeds the increase in population growth. This is further evident from the decline in mean household size which increased till 1991 but fell sharply in the year 2001. The 2001 and 2011Census reveal widespread interstate variation in mean household size and composition across India.
It is evident that since 1991, the mean household size is not only declining, the increase in the number households is much faster than the rate at which population is increasing. Significantly, the decade 2001-2011 witnessed significant decline in the rate of population growth, but the multiplication of households continued at a greater pace while the mean size of the households registered a substantial decline from 5.3 to 4.9. Demographers attribute this change to a deepening of demographic transition process in India associated with fertility decline. This is also indicative of a rise in nuclear families relative to multi-generational families which till recent times were far more widespread.
4 | Transactions | Vol. 36, No. 1, 2014
Regions States/UTs 2001 2011 Growth Rate
Growth rate
Differential
in HH in Ppln (%) (%)
Mountain/Hill Arunachal Pradesh 213342 261614 22.63 25.92 -3.29Himachal Pradesh 1217428 1476581 21.29 12.81 8.48Jammu & Kashmir 1559544 2015088 29.21 23.71 5.5Manipur 372956 507152 35.98 18.65 17.33Meghalaya 416791 538299 29.15 27.82 1.33Mizoram 175544 221077 25.94 22.78 3.16Nagaland 325620 399965 22.83 -0.47 23.3Sikkim 113917 128131 12.48 12.36 0.12Uttarakhand 1593522 1997068 25.32 19.17 6.15Region 5988664 7544975 26 N A N A
Plateaus Andhra Pradesh 16920613 21024534 24.25 11.1 13.15Jharkhand 4786657 6181607 29.14 22.34 6.8Karnataka 10354059 13179911 27.29 15.67 11.62Kerala 6707811 7716370 15.04 4.86 10.18Madhya Pradesh 10839740 14967597 38.08 20.3 17.78Maharashtra 19434335 23830580 22.62 15.99 6.63Tamil Nadu 14603541 18493003 26.63 15.6 11.03Region 83646756 105393602 26 N A N A
Plains Assam 4898497 6367295 29.98 16.93 13.05Bihar 13714601 18940629 38.11 25.07 13.04Chandigarh 205135 235061 14.59 17.1 -2.51Chhattisgarh 4077273 5622850 37.91 22.59 15.32Dadra & Nagar Ha. 45125 73063 61.91 55.5 6.41Daman & Diu 35330 60381 70.91 53.54 17.37Delhi 2718050 3340538 22.9 20.96 1.94Goa 292365 322813 10.41 8.17 2.24Gujarat 9619796 12181718 26.63 19.17 7.46Haryana 3693601 4717954 27.73 19.9 7.83Odisha 7707106 9661085 25.35 13.97 11.38Puducherry 214390 301276 40.53 27.72 12.81Punjab 4329786 5409699 24.94 13.73 11.21Rajasthan 9269237 12581303 35.73 21.44 14.29Tripura 663416 842781 27.04 14.75 12.29Uttar Pradesh 25644759 32924266 28.39 20.09 8.3
Table-1 : India-Mean Size of Households, Decadal Growth in Households, 1971-2011

Transactions | Vol. 36, No. 1, 2014 | 5
Growth in Households: Trends and Patterns
Rarely one finds a uniform change in a country like India with so much variation in its physical and social make up. Though this demographic change has its regional nuances, the rate of increase in the number of households, barring a few, is remarkable in all the important regional divisions of India. Number of households increased phenomenally in the plains, followed by the plateau and the mountains and hilly areas. At a very broad level the plateau region and the hills and mountainous regions added around 26 percent to their existing households during 2001-2011 decade while the rate of growth of the households was much higher (close to 30%) in the plains during the same period. Within the hilly region, the growth in households was particularly high in Manipur, Jammu and Kashmir and Meghalaya. Significantly, the rate of growth in households was far more uniform in the plateau region except in Kerala which added only 15 percent to its households and Madhya Pradesh adding a high of 38 percent.
The range of variation is remarkably high in the plains. The increase in households ranged from a low of 10 percent in Goa to as high as 70 percent in Daman and Diu. Some of the states that witnessed excessive
Fig.1 : Change in Household and Population, 2001-2011
West Bengal 15820386 20067299 26.84 13.93 12.91Region 102948853 133650011 29.82 N A N A
Islands A & N Island 77578 93376 20.36 6.68 13.68Lakshadweep 9957 10703 7.49 6.23 1.26Region 87535 104079 18.9 N A N A
INDIA 192671808 246692667 28.04 17.64 10.4
increase in household numbers include Dadra and Nagar Haveli (62%), Pudducherry (40%), Bihar (38%) Chhattisgarh (38%) and Rajasthan (36%). On the other extreme are states/UTs which added far fewer numbers to the existing households. These include the highly urbanised Chandigarh (15%) and Delhi (22%). These variations notwithstanding, the increase in the number of households provide valuable insights into the nature of demographic changes when contrasted with the rate of population increase in these very regions/states (see fig.1).
6 | Transactions | Vol. 36, No. 1, 2014
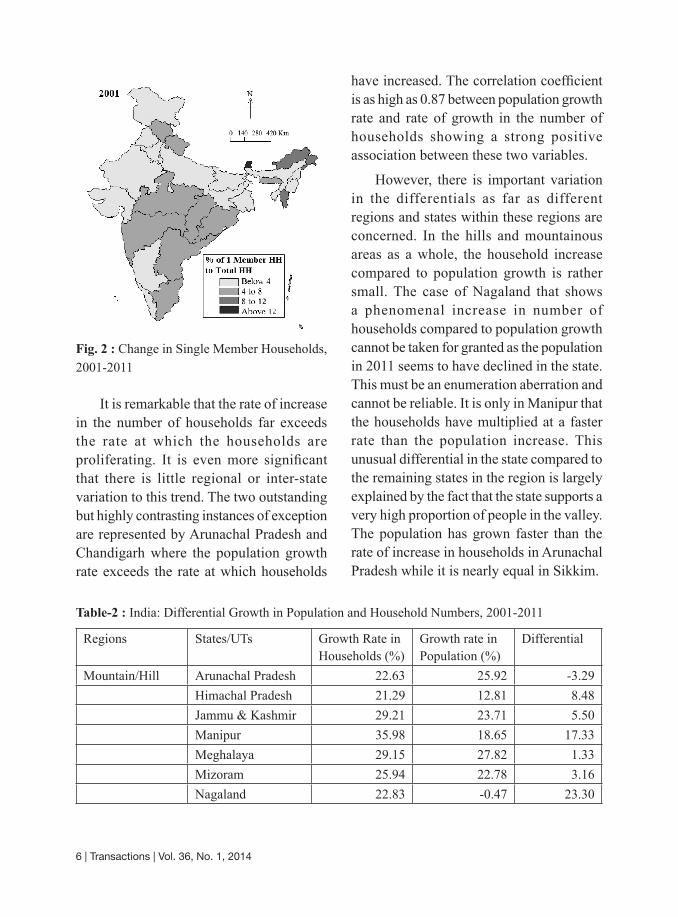
It is remarkable that the rate of increase in the number of households far exceeds the rate at which the households are proliferating. It is even more significant that there is little regional or inter-state variation to this trend. The two outstanding but highly contrasting instances of exception are represented by Arunachal Pradesh and Chandigarh where the population growth rate exceeds the rate at which households
have increased. The correlation coefficient is as high as 0.87 between population growth rate and rate of growth in the number of households showing a strong positive association between these two variables.
However, there is important variation in the differentials as far as different regions and states within these regions are concerned. In the hills and mountainous areas as a whole, the household increase compared to population growth is rather small. The case of Nagaland that shows a phenomenal increase in number of households compared to population growth cannot be taken for granted as the population in 2011 seems to have declined in the state. This must be an enumeration aberration and cannot be reliable. It is only in Manipur that the households have multiplied at a faster rate than the population increase. This unusual differential in the state compared to the remaining states in the region is largely explained by the fact that the state supports a very high proportion of people in the valley. The population has grown faster than the rate of increase in households in Arunachal Pradesh while it is nearly equal in Sikkim.
Fig. 2 : Change in Single Member Households, 2001-2011
Table-2 : India: Differential Growth in Population and Household Numbers, 2001-2011
Regions States/UTs Growth Rate in Households (%)
Growth rate in Population (%)
Differential
Mountain/Hill Arunachal Pradesh 22.63 25.92 -3.29 Himachal Pradesh 21.29 12.81 8.48 Jammu & Kashmir 29.21 23.71 5.50 Manipur 35.98 18.65 17.33 Meghalaya 29.15 27.82 1.33 Mizoram 25.94 22.78 3.16 Nagaland 22.83 -0.47 23.30

Transactions | Vol. 36, No. 1, 2014 | 7
Sikkim 12.48 12.36 0.12 Uttarakhand 25.32 19.17 6.15Plateaus Andhra Pradesh 24.25 11.1 13.15 Jharkhand 29.14 22.34 6.80 Karnataka 27.29 15.67 11.62 Kerala 15.04 4.86 10.18 Madhya Pradesh 38.08 20.3 17.78 Maharashtra 22.62 15.99 6.63 Tamil Nadu 26.63 15.6 11.03Plains Assam 29.98 16.93 13.05 Bihar 38.11 25.07 13.04 Chandigarh 14.59 17.1 -2.51 Chhattisgarh 37.91 22.59 15.32 Dadra & Nagar Ha. 61.91 55.5 6.41 Daman & Diu 70.91 53.54 17.37 Delhi 22.90 20.96 1.94 Goa 10.41 8.17 2.24 Gujarat 26.63 19.17 7.46 Haryana 27.73 19.9 7.83 Odisha 25.35 13.97 11.38 Puducherry 40.53 27.72 12.81 Punjab 24.94 13.73 11.21 Rajasthan 35.73 21.44 14.29 Tripura 27.04 14.75 12.29 Uttar Pradesh 28.39 20.09 8.30 West Bengal 26.84 13.93 12.91Islands A & N Island 20.36 6.68 13.68 Lakshadweep 7.49 6.23 1.26INDIA 28.04 17.64 10.40
The plains however display wide variation in differentials ranging from a negative in Chandigarh to 17 per cent in Daman and Diu. Delhi and Goa represent areas of slower increase in households compared to the increase in population. Surprisingly, Haryana, Gujarat, Uttar Pradesh and Dadra and Nagar Haveli have
The differential is more uniform in the plateau region ranging between 10-15 percent. Madhya Pradesh has experienced much faster increase in its households (differential being 18 percent) while Jharkhand and Maharashtra represent areas of slower growth in households compared to population growth rate.
8 | Transactions | Vol. 36, No. 1, 2014
experienced relatively slower increase in households compared to population growth along with Dehi, Goa and Chandigarh forming a contiguous belt in western part of the vast plains. The remaining states in the plains have differentials ranging between 10-15.
The inevitable conclusion is that households are indeed becoming smaller across regions and states breaking barriers of geographical diversity though the pace may be different.
Size of Households
While mean size of households has decreased across regions, inter regional variations in the average size are still staggering. The Hilly and mountainous regions continue with much higher household size with Jammu and Kashmir supporting an average of 6.23 persons per household closely followed by Meghalaya (5.51) Manipur (5.37) and Arunachal Pradesh (5.28). The plain areas display wider variation. States like Uttar Pradesh, Bihar and Rajasthan continue with very large households of over 6 persons on an average. Punjab (5.6) and Haryana (5.7) too have much higher average size of households. Together, these states including Jammu and Kashmir from the mountainous region constitute a contiguous belt in the North sticking to large households, indicating continuance of multi-generational households and joint families unlike in the south where the mean size of the households is not only small, but continuously declining too. In the plateau region, Tamilnadu, with
an average household size of 3.9 persons has the lowest size in the country as a whole. Only Jharkhand in this region has a much higher mean household to join the cross regional contiguous belt of large household size. An outlier of this belt is located in the tribal areas of the North-east.
Decreasing household size all across the country is evidenced from an analysis of mean household size. Table-4 reveals this uniform decline in household size irrespective of geographical location and regions. The only three exceptions are rather interesting represented by the mountainous Arunachal Pradesh and the most modern and highly urbanised Delhi as well as the littoral Goa where the mean household size has shown a marginal increase over the 2001-2011 decade. In the rest of the country the mean household size has declined in varying degrees.
In the Hilly region, the decline in household size is marginal in Meghalaya, Sikkim and Mizoram while Arunachal has indeed shown an increase. Only Manipur in this region shows substantial decline in its mean household size. The case of Nagaland which too shows phenomenal decline in its household size cannot be taken on its face value for reasons cited earlier.
The extent of decline in mean size of household in the plateau region is modest ranging from 0.27 member per household in Jharkhand to 0.65 in Madhya Pradesh. With the exception of Madhya Pradesh the decline is lower than the national average (0.39) in all the states included in this region.

Transactions | Vol. 36, No. 1, 2014 | 9
Table 3 : India: Mean Size of Households
Region States/UTs 2001 2011 Change Hilly & Mountain Arunachal Pradesh (AR) 5.00 5.28 0.28
Himachal Pradesh (HP) 4.90 4.64 -0.26Jammu & Kashmir (JK) 6.40 6.23 -0.17Manipur (MN) 5.70 5.37 -0.33Meghalaya (ML) 5.50 5.51 0.01Mizoram (MZ) 5.00 4.93 -0.07Nagaland (NL) 6.00 4.95 -1.05Sikkim (SK) 4.70 4.74 0.04Uttarakhand (UK) 5.30 5.07 -0.23
Plateaus Andhra Pradesh (AP) 4.40 4.03 -0.37Jharkhand (JH) 5.60 5.33 -0.27Karnataka (KA) 5.00 4.64 -0.36Kerala (KL) 4.70 4.33 -0.37Madhya Pradesh (MP) 5.50 4.85 -0.65Maharashtra (MH) 5.00 4.72 -0.28Tamil Nadu (TN) 4.20 3.9 -0.3
Plains Assam (AS) 5.40 4.9 -0.5Bihar (BR) 6.00 5.48 -0.52Chandigarh (CH) 4.30 4.49 0.19Chhattisgarh (CG) 5.10 4.54 -0.56Dadra & Nagar Haveli (DN) 4.80 4.69 -0.11Daman & Diu (DD) 4.40 4.02 -0.38Goa (GA) 4.50 4.52 0.02Gujarat (GJ) 5.20 4.96 -0.24Haryana (HR) 5.70 5.37 -0.33NCT of Delhi (DL) 5.00 5.02 0.02Odisha (OR) 4.70 4.34 -0.36Puducherry (PY) 4.50 4.13 -0.37Punjab (PB) 5.60 5.12 -0.48Rajasthan (RJ) 6.00 5.45 -0.55Tripura (TR) 4.80 4.36 -0.44Uttar Pradesh (UP) 6.40 6.06 -0.34West Bengal (WB) 5.00 4.55 -0.45
Islands A& N Islands (AN) 4.50 4.07 -0.43Lakshadweep (LD) 6.00 6.02 0.02
INDIA 5.3 4.91 -0.39

10 | Transactions | Vol. 36, No. 1, 2014
The plains however display great diversity in the extent of decline in household size. Apart from Delhi and Goa which show an increase in the average size of the household, the decline in mean size of households is all pervasive and ranges from 0.11 in Dadra and Nagar Haveli to 0.56 in Chhatisgarh. Some of the states located in Plain areas that have shown remarkable decline in the mean size of households include Chhatisgarh, Rajasthan, Bihar and Assam as well as Punjab, West Bengal and Tripura- states widely distributed in the region. Conversely, states and union territories which have experienced very small decline in their mean size of the households are Dadra and Nagar Haveli, Chandigarh, Haryana and Gujarat. Together with Delhi and Goa which show an increase in the average size of the household, they form a loosely contiguous belt in the North-Western part of the country representing areas of very slow decline in the mean size of the household.
An interesting comparison can be made between single member households (see
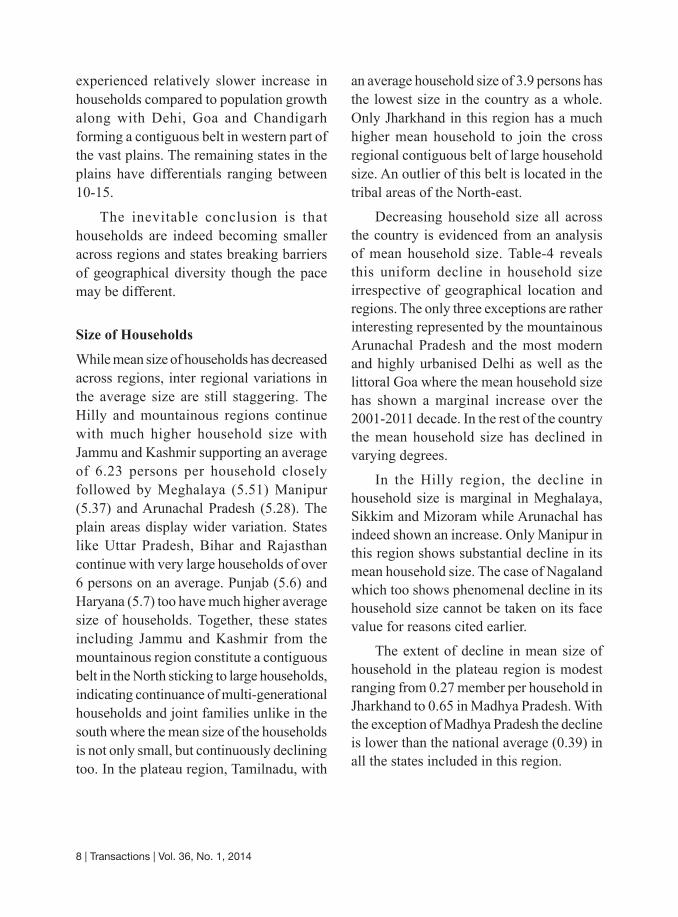
Table-4: Regional Variation in one member and over six member households, 2001-2011
Region States/UTs 1 member HH Over 6 member HH2001 2011 2001 2011
Hilly & Mountain
Arunachal Pradesh (AR) 8.3 5.9 37.7 40.9Himachal Pradesh (HP) 7.0 5.7 33.7 27.3Jammu & Kashmir (JK) 2.0 1.6 57.0 44.3Manipur (MN) 1.8 1.6 49.4 35.6Meghalaya (ML) 4.5 3.6 46.3 44.5Mizoram (MZ) 10.7 5 40.1 35.9Nagaland (NL) 3.9 5.6 54.5 41.1Sikkim (SK) 14.2 5.2 34.9 30.2Uttarakhand (UK) 5.8 5.5 40.3 34.7
fig.2) and large households of 6 members or more (see fig.5). Table-5 helps a comparative analysis of changes in the proportion of households in these two categories and across different regions and states of India. It is evident that proportion of one member households during 2001-2011 decade registered a general decline in the hilly and mountainous region with the possible exception of Nagaland. The fall in the proportion of such households was precipitous in Mizoram and Sikkim. Simultaneously, the entire region except Arunachal Pradesh experienced decline in the proportion of very large sized households of six members or more. Decline in the proportion of households in two extremes suggest proliferation in medium household size.
In contrast to this hill pattern the plateau region displays a situation in which the proportion of one member households has either remained constant or has increased while there is a significant drop in the proportion of very large households. This indicates a strong tendency towards smaller households in the plateau region.
Transactions | Vol. 36, No. 1, 2014 | 11
Plateaus Andhra Pradesh (AP) 4.3 5 23.3 15.3Jharkhand (JH) 3.9 2.7 45.7 40.2Karnataka (KA) 3.8 4 33.3 25.9Kerala (KL) 3.2 3.7 25.4 19.9Madhya Pradesh (MP) 4.3 4.3 43.8 32.7Maharashtra (MH) 4.1 4.1 32.1 26.6Tamil Nadu (TN) 5.1 5.3 19.6 13.4
Plains Assam (AS) 3.3 3.1 42.4 32.5Bihar (BR) 3.3 2.1 51.3 44.5Chandigarh (CH) 9.0 6.5 22.3 21.7Chhattisgarh (CG) 5.6 5.6 37.5 28.5Dadra & Nagar Haveli (DN) 4.5 5.9 32.4 26.8Daman & Diu (DD) 7.0 7.1 25.0 19.1Goa (GA) 5.7 5.3 25.6 20.0Gujarat (GJ) 3.7 3.7 37.6 33.2Haryana (HR) 2.5 2.3 44.0 36.0NCT of Delhi (DL) 4.6 3.7 34.6 31.6Odisha (OR) 4.9 4.2 31.1 24.2Puducherry (PY) 3.8 3.7 22.5 15.7Punjab (PB) 2.7 2.6 43.0 33.5Rajasthan (RJ) 3.0 2.8 50.9 42.5Tripura (TR) 3.5 3.1 30.7 19.6Uttar Pradesh (UP) 3.6 2.6 56.8 52.4West Bengal (WB) 3.4 3.4 33.2 23.0
Islands A& N Islands (AN) 7.4 7.3 24.4 17.6Lakshadweep (LD) 7.9 6.1 49.1 50.4
INDIA 3.9 3.7 38.3 31.5
however that the extent of fall in the large sized households in most regions and states far exceeds the fall or increase in the one member households. While a uniform decline in large households can be easily attributed to a greater nucleation of families, it may be interesting to know the reasons for significant decline in one member households.
In the plains however there is a uniform decline in both one member households and very large households. The fall in the proportion of large size households is however much sharper across regions.
It is interesting that the southern states have experienced increase in one member households in sharp contrast to other areas in the backdrop of continuously falling average size of the households. It is evident
12 | Transactions | Vol. 36, No. 1, 2014
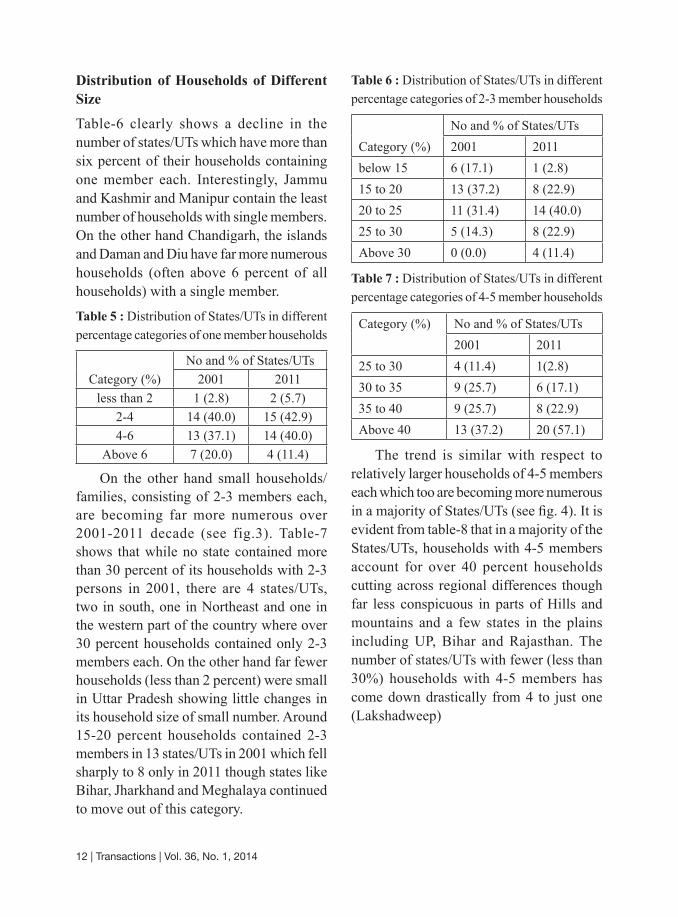
Distribution of Households of Different Size
Table-6 clearly shows a decline in the number of states/UTs which have more than six percent of their households containing one member each. Interestingly, Jammu and Kashmir and Manipur contain the least number of households with single members. On the other hand Chandigarh, the islands and Daman and Diu have far more numerous households (often above 6 percent of all households) with a single member.
Table 5 : Distribution of States/UTs in different percentage categories of one member households
Category (%)No and % of States/UTs
2001 2011less than 2 1 (2.8) 2 (5.7)
2-4 14 (40.0) 15 (42.9)4-6 13 (37.1) 14 (40.0)
Above 6 7 (20.0) 4 (11.4)
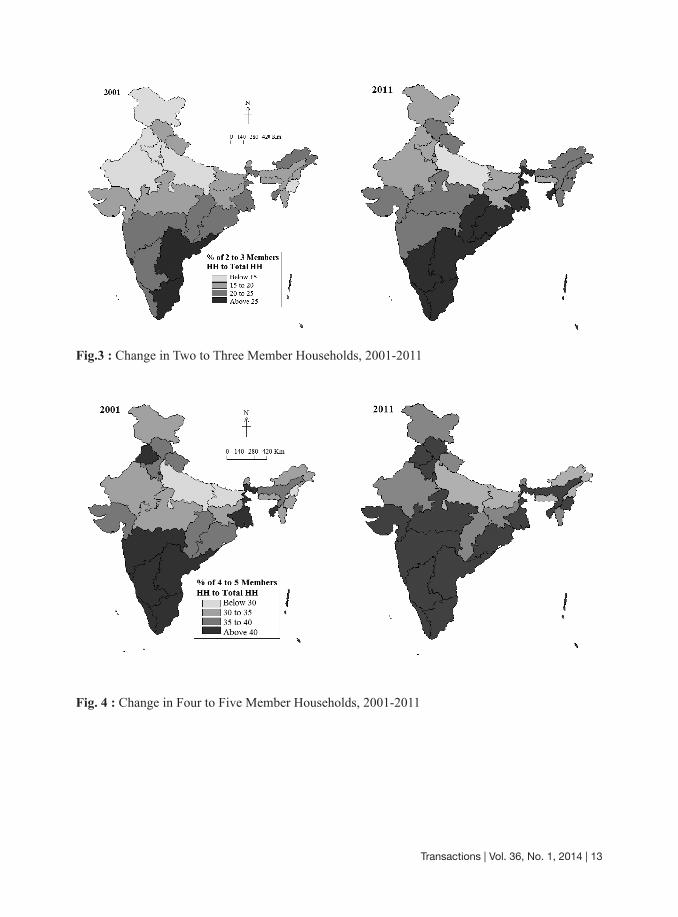
On the other hand small households/families, consisting of 2-3 members each, are becoming far more numerous over 2001-2011 decade (see fig.3). Table-7 shows that while no state contained more than 30 percent of its households with 2-3 persons in 2001, there are 4 states/UTs, two in south, one in Northeast and one in the western part of the country where over 30 percent households contained only 2-3 members each. On the other hand far fewer households (less than 2 percent) were small in Uttar Pradesh showing little changes in its household size of small number. Around 15-20 percent households contained 2-3 members in 13 states/UTs in 2001 which fell sharply to 8 only in 2011 though states like Bihar, Jharkhand and Meghalaya continued to move out of this category.
Table 6 : Distribution of States/UTs in different percentage categories of 2-3 member households
Category (%)No and % of States/UTs2001 2011
below 15 6 (17.1) 1 (2.8)15 to 20 13 (37.2) 8 (22.9)20 to 25 11 (31.4) 14 (40.0)25 to 30 5 (14.3) 8 (22.9)Above 30 0 (0.0) 4 (11.4)
Table 7 : Distribution of States/UTs in different percentage categories of 4-5 member households
Category (%) No and % of States/UTs 2001 2011
25 to 30 4 (11.4) 1(2.8)30 to 35 9 (25.7) 6 (17.1)35 to 40 9 (25.7) 8 (22.9)Above 40 13 (37.2) 20 (57.1)
The trend is similar with respect to relatively larger households of 4-5 members each which too are becoming more numerous in a majority of States/UTs (see fig. 4). It is evident from table-8 that in a majority of the States/UTs, households with 4-5 members account for over 40 percent households cutting across regional differences though far less conspicuous in parts of Hills and mountains and a few states in the plains including UP, Bihar and Rajasthan. The number of states/UTs with fewer (less than 30%) households with 4-5 members has come down drastically from 4 to just one (Lakshadweep)
Transactions | Vol. 36, No. 1, 2014 | 13
Fig. 4 : Change in Four to Five Member Households, 2001-2011
Fig.3 : Change in Two to Three Member Households, 2001-2011

14 | Transactions | Vol. 36, No. 1, 2014
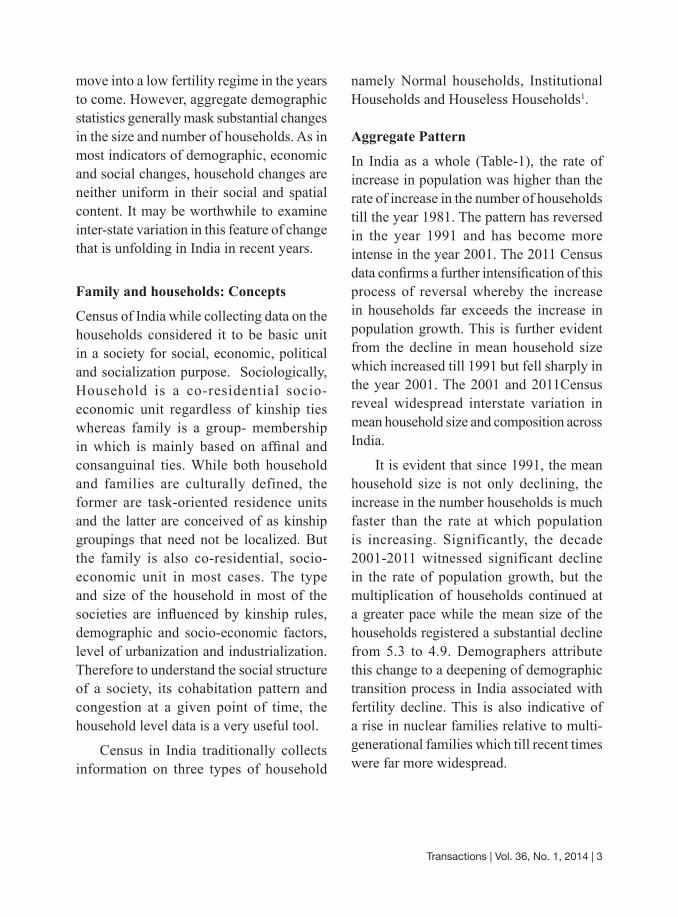
The decline in the proportion of very large households is perhaps most revealing of the 2011 census data (table-9). Form just one state/UT containing less than 20 percent of households with six members each in 2001, the number of such states increased to 7. All the south Indian states exhibited a tendency towards fewer households of large size. However, Daman and Diu and Tripura too joined this club. Interestingly many of the other Northeastern states (except Assam), Jammu and Kashmir and states in the plains namely Uttar Pradesh, Bihar, Jharkhand, Rajasthan and Hayana had over a third (more than 35 percent) of their households containing 6 members or more. The plains and the Hilly areas seem to have changed only marginally as far as the proportion of large households is concerned (see fig. 5).
Table 8 : Distribution of States/UTs in different percentage categories of over 6 member households
Category (%)No and % of States/UTs 2001 2011
less than 20 1 (2.8) 7 (20.0)20-25 5 (14.3) 4 (11.4)25-30 2 (5.7) 5 (14.3)30-35 9 (25.7) 7 (20.0)35-40 3 (8.5) 3 (8.5)Above 40 15 (42.8) 9 (25.7)
It is evident that there are declines in both single member and very large households in many regions cutting across geographical regions suggesting smaller household size as a norm to become a reality in years to come. Does it indicate a convergence of sorts?
Fig. 5 : Change in Large Households, 2001-2011
Transactions | Vol. 36, No. 1, 2014 | 15
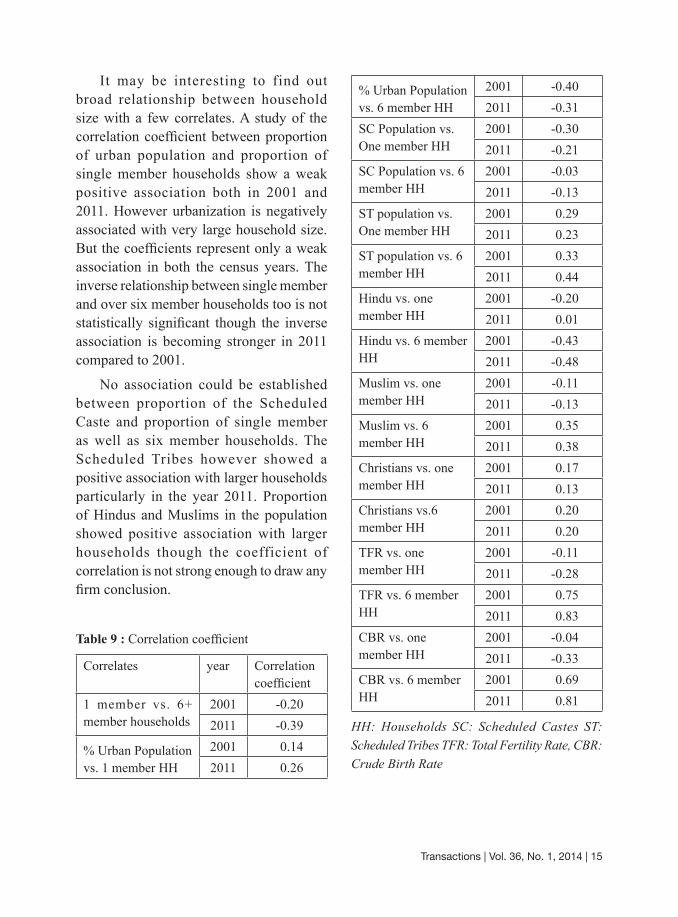
It may be interesting to find out broad relationship between household size with a few correlates. A study of the correlation coefficient between proportion of urban population and proportion of single member households show a weak positive association both in 2001 and 2011. However urbanization is negatively associated with very large household size. But the coefficients represent only a weak association in both the census years. The inverse relationship between single member and over six member households too is not statistically significant though the inverse association is becoming stronger in 2011 compared to 2001.
No association could be established between proportion of the Scheduled Caste and proportion of single member as well as six member households. The Scheduled Tribes however showed a positive association with larger households particularly in the year 2011. Proportion of Hindus and Muslims in the population showed positive association with larger households though the coefficient of correlation is not strong enough to draw any firm conclusion.
Table 9 : Correlation coefficient
Correlates year Correlation coefficient
1 member vs. 6+ member households
2001 -0.202011 -0.39
% Urban Population vs. 1 member HH
2001 0.142011 0.26
% Urban Population vs. 6 member HH
2001 -0.402011 -0.31
SC Population vs. One member HH
2001 -0.302011 -0.21
SC Population vs. 6 member HH
2001 -0.032011 -0.13
ST population vs. One member HH
2001 0.292011 0.23
ST population vs. 6 member HH
2001 0.332011 0.44
Hindu vs. one member HH
2001 -0.202011 0.01
Hindu vs. 6 member HH
2001 -0.432011 -0.48
Muslim vs. one member HH
2001 -0.112011 -0.13
Muslim vs. 6 member HH
2001 0.352011 0.38
Christians vs. one member HH
2001 0.172011 0.13
Christians vs.6 member HH
2001 0.202011 0.20
TFR vs. one member HH
2001 -0.112011 -0.28
TFR vs. 6 member HH
2001 0.752011 0.83
CBR vs. one member HH
2001 -0.042011 -0.33
CBR vs. 6 member HH
2001 0.692011 0.81
HH: Households SC: Scheduled Castes ST: Scheduled Tribes TFR: Total Fertility Rate, CBR: Crude Birth Rate
16 | Transactions | Vol. 36, No. 1, 2014
Table - 9 clearly reveals that demo-graphic parameters in contrast to non-demographic parameters reveal a stronger association with single or large (over six member) households. For example, TFR shows a strong positive association with large household size though it has little relationship with single member households. The same is true of crude birth rate and large households of 6 or more. The positive association between fertility/birth rate with very large household size is getting stronger over the decade.
Concluding Remarks
Family and households hold a prominent place in social life of any population as the most potent socio-economic institution. Any change in the household size or lack of it is a reflection of complex economic, social and demographic process. Likewise, any change in household size has serious social, economic and demographic implication. The study underscores this fact as India is surely moving towards smaller household size if one goes by the macro demographic data available in recently held Censuses. Understandably, this change is not spatially uniform with different regions with their varied social and economic institutions responding differently to this process which however appears to be unfolding irrespective of geographical differences. Only the pace and magnitude of this decline in household size varies from state to state and region to region. This demographic transition which may aptly be described as a sort of convergence is taking place at a time when there is great divergence in most economic
indicators of development driven by a liberal economic order adopted since the 1990s. The conclusions of present study however are based on grossly aggregate data and the need is to scrutinise the pattern at lower aggregate levels which may throw up far more interesting regional patterns and more pertinent issues of concern as far as changing household size in India is concerned.
Note1 Census defines different types of households as the following:
Household: A ‘household’ is usually a group of persons who normally live together and take their meals from a common kitchen unless the exigencies of work prevent any of them from doing so. Persons in a household may be related or unrelated or a mix of both. However, if a group of unrelated persons live in a census house but do not take their meals from the common kitchen, then they are not constituent of a common household. Each such person should be treated as a separate household. The important link in finding out whether it is a household or not, is a common kitchen. There may be one member households, two member households or multi-member households. In a few situations, it may become difficult to apply the definition of household strictly as given above. For example, a person living alone in a census house whether cooking or not cooking meals is treated as a household. Similarly, if husband and wife or a group of related persons are living together in a census house but not cooking their meals, it also constitutes a normal household.
Institutional households- A group of unrelated persons who live in an institution
Transactions | Vol. 36, No. 1, 2014 | 17
and take their meals from a common kitchen is called an Institutional Household. Examples of Institutional Households are boarding houses, messes, hostels, hotels, rescue homes, jails, ashrams, orphanages, etc. If in a building which is occupied by an Institutional Household, the families of the warden and the peon are also living in separate census houses and cooking for themselves separately, then each of the family is treated as separate household and the houses occupied by them is treated as separate census houses. In this situation there will be one building, three census houses and three households i.e. one Institutional Household and two Normal Households. If a group of unrelated persons, sharing a common kitchen, is found living in a census house which is not an institution, such a household does not form an Institutional Household but is treated like other Normal household.
Houseless households- Households who do not live in buildings or census houses but live in the open on roadside, pavements, in Hume pipes, under flyovers and staircases, or in the open in places of worship, mandaps, railway platforms, etc. are treated as Houseless households.
References
Niranjan, S., Saritha Nair and T. K. Roy (2005) “A Socio-Demographic Analysis of the Size and Structure of the Family in India” Journal of Comparative Family Studies Vol. 36, No. 4, autumn pp. 623-651
Aiyappan, A., (1972) “Household Size, Extended Families and Changes in Family Structures in Kerala” Indian Census Centenary Seminar, New Delhi, Registrar General, India.
Blake Judith (1986) “Number of Siblings, Family Background and the Process of Educational Attainment” Social Biology Vol. 33 pp.5–21.
Bongaarts, John (1983) “The Formal Demography of Families and Households: An Overview”, IUSSP Newsletter no. 17 pp. 33-42.
Bongaarts John, Thomas K. Burch, and Kenneth W. Wachter (eds.) (1987) Family Demography: Methods and their Application, Oxford, Clarendon Press.
Bongaarts John (2001) Household Size and Composition in Developing World http://www.popcouncil.us/pdfs/wp/144.pdf accessed on 14.08.2013.
Census of India (2001) Data Highlights http://censusindia.gov.in/Data_Products/Data_Highlights/Data_Highlights_link/data_highlights_hh123.pdf and http://censusindia .gov. in/Data_Products /Data_Highlights/Data_Highlights_link/Datahighlights_HH567.pdf accessed on 14.08.2013
Gualtieri, C. Thomas, and Robert E. Hicks (1986) “Family Configuration and Family Size” Social Biology, Vol.33 pp.146–147.
Koening, Michael A, James A Phillips, Ruth S. Simmons, Mehrab Ali Khan (1987) “Trends in family size preferences and contraceptive use in Matlab, Bangladesh” Studies in Family Planning, Vol. 18 no.3 pp. 117-27.
Levy, Victor (1985) “Cropping Pattern, Mechanization, Child Labor and Fertility Behavior in a Farming Economy, Rural Egypt” Economic Development and Cultural Change Vol. 33 pp. 777–791.
18 | Transactions | Vol. 36, No. 1, 2014
National Family and Health Survey-3 (2007) Chapter-2 Household Population and Housing Characteristics, International Institute for Population Sciences, Mumbai pp. 23-26.
Rani, Usha D. (1986) “Old Age Security Value of Children and Fertility in Relation to Social Policy” Paper presented at the annual meeting of the International Sociological Association.
Robinson, W. C. (1986) “High fertility as Risk-insurance” Population Studies, Vol. 40 pp.289–298.
Wagner, Mazie E, Herman J. P. Schubert, and Daniel S. P. Schubert (1985) “Family Size Effects: A Review” Journal of Genetic Psychology Vol. 146 pp.65–78.
Debendra Kumar NayakProfessor,
Rabi Narayan BeheraResearch Scholar,
Department of GeographyNorth-Eastern Hill University
Shillong-793022