Embed Size (px)
Citation preview
1
Trans Fat Intake by the
U.S. Population
Diana Doell, Ph.D.
Office of Food Additive Safety
Center for Food Safety and Applied Nutrition
Food and Drug Administration
GMA Science Forum
Washington D.C.
April 4, 2012
2
Trans Fat
• Industrially-produced trans fat (IP-TFA) added to food increases serum low-density lipoprotein cholesterol (LDL-C)
• Increases risk of coronary heart disease (CHD)
• Lowers high-density lipoprotein cholesterol (HDL-C)
3
Trans Fat
• Institute of Medicine (IOM) - trans fat
consumption should be kept as low as possible
while consuming a nutritionally adequate diet
• Any incremental increase in intake increases
CHD risk (IOM)
• 2010 Dietary Guidelines for Americans
recommends trans fat intake be as low as
possible
4
2003 Trans Fat Final Rule
• July 11, 2003 – Final Rule published requiring trans fat content be
declared in the nutrition label and took effect on January 1, 2006 (68 FR 41470)
– Trans fat content expressed to nearest 0.5 g per serving < 5 g and to nearest 1 g > 5 g
– For products containing < 0.5 g trans fat, the content declared on the label is 0 g
– For products that contain < 0.5 g of total fat, “Not a significant source of trans fat” may be used instead of a declaration of trans fat content if no claims are made about fat, fatty acid, or cholesterol content
– Foods sold at deli and bakery service cases are exempt from labeling unless the food bears a claim or other nutrition information
5
• Intake for IP-TFA was estimated to be 4.6 g/p/d
for adults
• Many food products have been reformulated to
eliminate or substantially reduce trans fat
Impact of 2003 Trans Fat
Final Rule
6
Rationale for Updating Our
Intake Estimate
• Citizen Petitions
– Center for Science in the Public Interest (CSPI) 2004
• Revoke GRAS status for all added partially hydrogenated food oils
– Dr. Fred Kummerow 2009
• Ban partially hydrogenated fat from food
• Over 5 years since trans fat labeling became mandatory
• A comparison of intakes will assist in gauging the impact of the 2003 trans fat labeling rule
7
Partially Hydrogenated Oils (PHOs)
• Primary dietary source of trans fat is PHOs
• Trans fat isomers are formed in PHOs during hydrogenation process
• Trans fat content of PHOs controlled by temperature, pressure, reaction time, catalyst, fat source
• Typical trans fat content – 25-45% of the oil, with higher levels possible
8
Sources of Trans Fat Other Than PHOs
• Some non-hydrogenated refined oils and hydrogenated oils may contain some trans fatty isomers
• Dietary intake would be minor relative to that from PHOs
• Trans fat isomers can also occur naturally in products of ruminant animals – Intake of naturally-occurring trans fat estimated to be
1.2 g/p/d in 2003
9
Data Sources of Trans Fat Levels in Foods
• Product Label Information
• Market Share Information
• Analytical Data
10
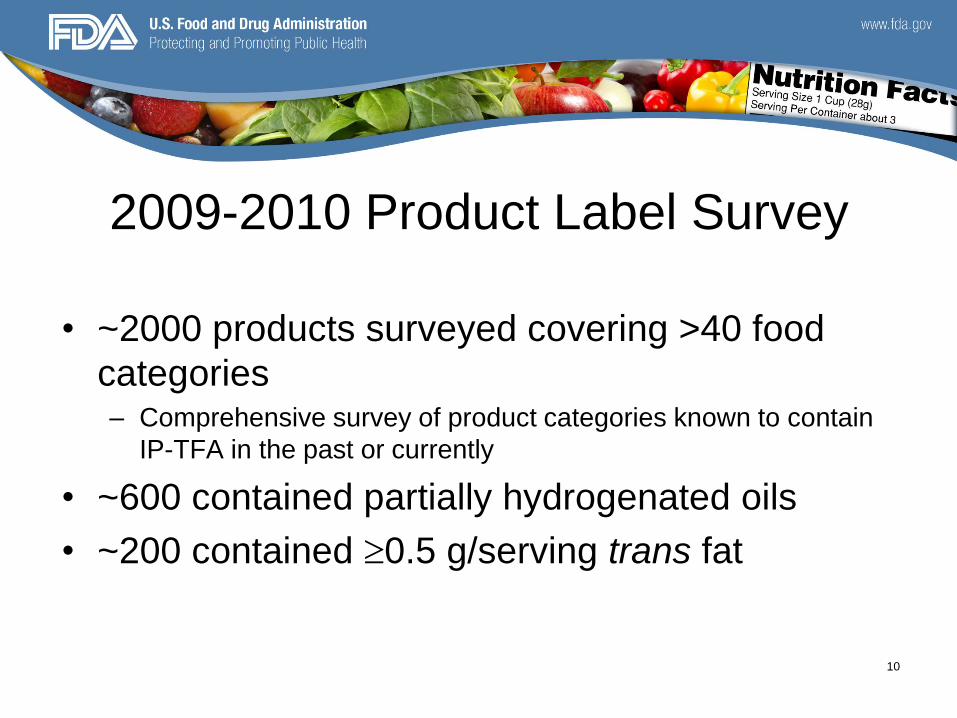
2009-2010 Product Label Survey
• ~2000 products surveyed covering >40 food
categories – Comprehensive survey of product categories known to contain
IP-TFA in the past or currently
• ~600 contained partially hydrogenated oils
• ~200 contained 0.5 g/serving trans fat
11
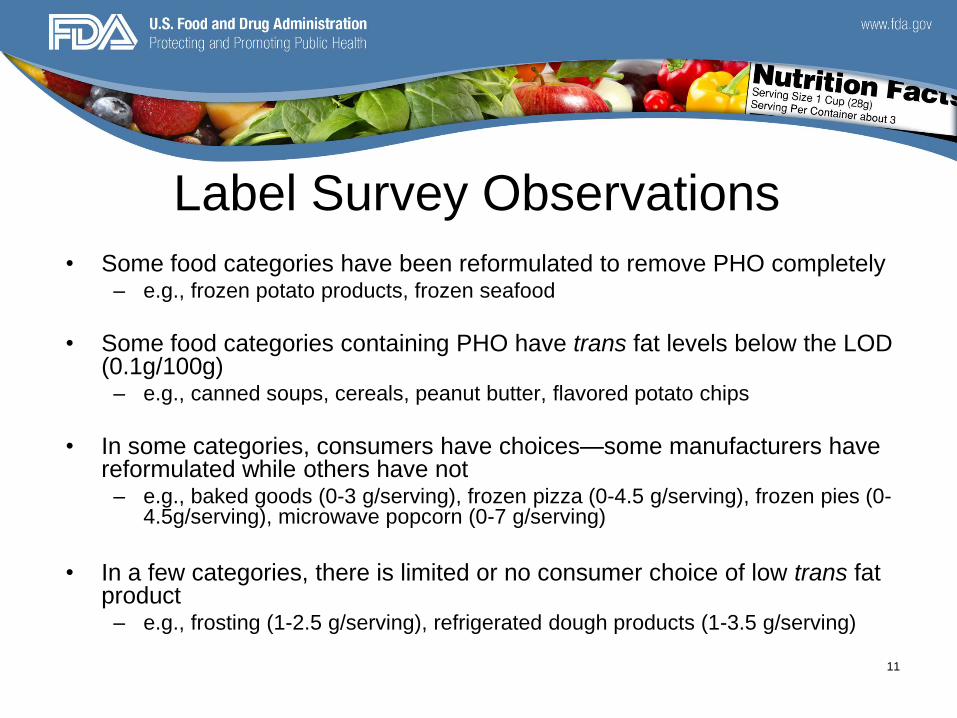
Label Survey Observations
• Some food categories have been reformulated to remove PHO completely – e.g., frozen potato products, frozen seafood
• Some food categories containing PHO have trans fat levels below the LOD (0.1g/100g)
– e.g., canned soups, cereals, peanut butter, flavored potato chips
• In some categories, consumers have choices—some manufacturers have reformulated while others have not
– e.g., baked goods (0-3 g/serving), frozen pizza (0-4.5 g/serving), frozen pies (0-4.5g/serving), microwave popcorn (0-7 g/serving)
• In a few categories, there is limited or no consumer choice of low trans fat product
– e.g., frosting (1-2.5 g/serving), refrigerated dough products (1-3.5 g/serving)
12
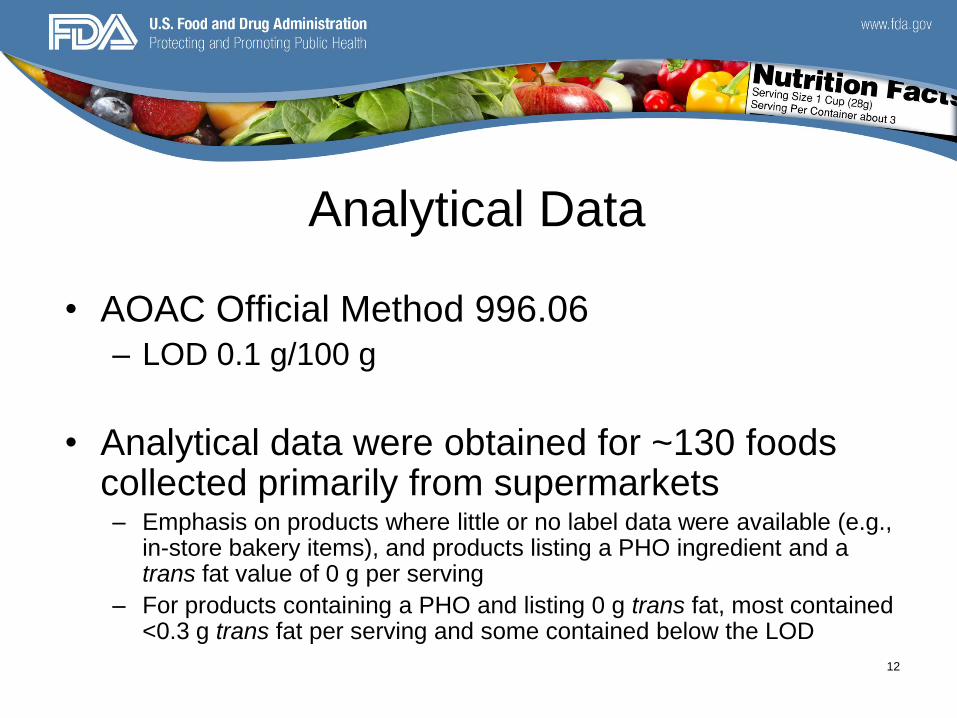
Analytical Data
• AOAC Official Method 996.06 – LOD 0.1 g/100 g
• Analytical data were obtained for ~130 foods collected primarily from supermarkets – Emphasis on products where little or no label data were available (e.g.,
in-store bakery items), and products listing a PHO ingredient and a trans fat value of 0 g per serving
– For products containing a PHO and listing 0 g trans fat, most contained <0.3 g trans fat per serving and some contained below the LOD

13
Method for Estimating Trans Fat Intake
• Three populations were chosen for the intake
estimate
– U.S. population, aged 2+ years
– Children, 2-5 years
– Teenage boys, aged 13-18 years
• Intakes were estimated on an “eaters-only” basis
at the mean and 90th percentile
14
Intake Estimated Using Analytical Data,
Label Data, and Market Share Data
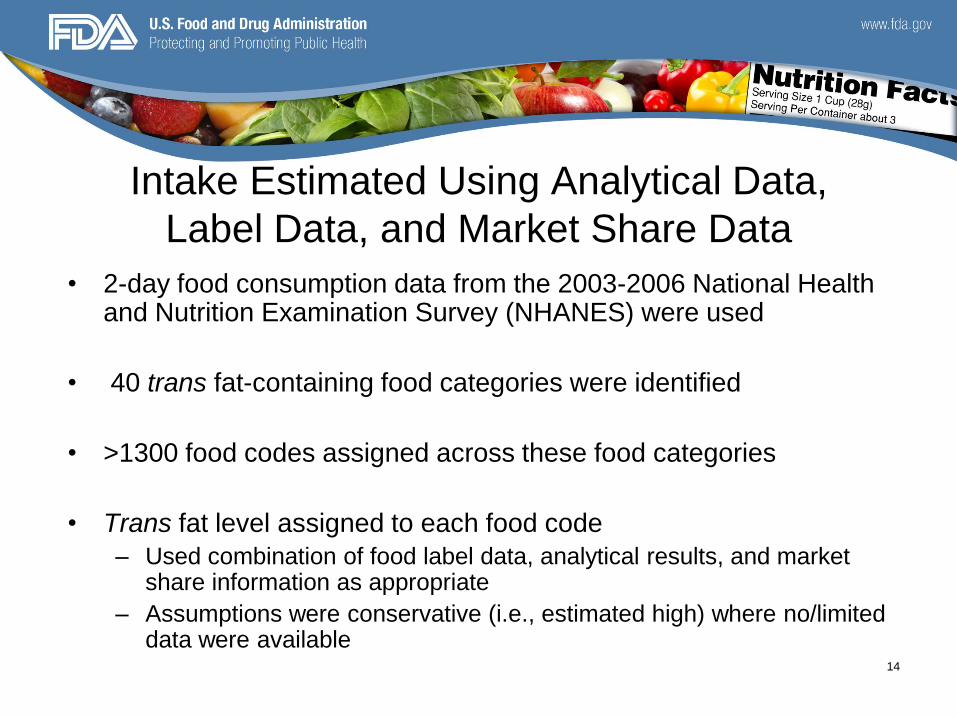
• 2-day food consumption data from the 2003-2006 National Health and Nutrition Examination Survey (NHANES) were used
• 40 trans fat-containing food categories were identified
• >1300 food codes assigned across these food categories
• Trans fat level assigned to each food code
– Used combination of food label data, analytical results, and market share information as appropriate
– Assumptions were conservative (i.e., estimated high) where no/limited data were available
15
Intake Estimated Using Analytical Data,
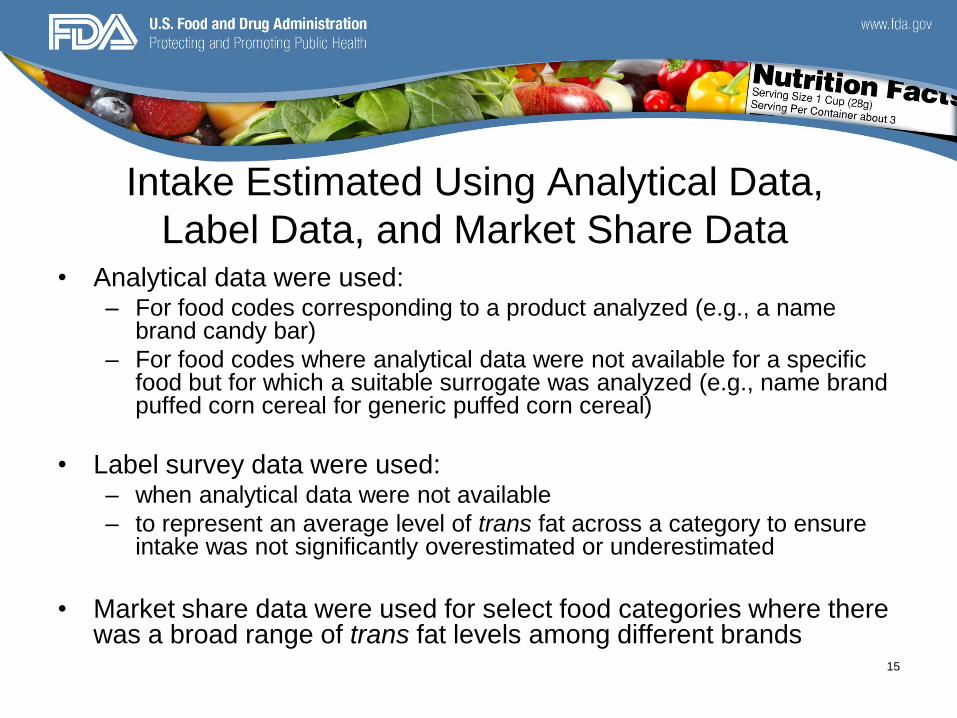
Label Data, and Market Share Data • Analytical data were used:
– For food codes corresponding to a product analyzed (e.g., a name brand candy bar)
– For food codes where analytical data were not available for a specific food but for which a suitable surrogate was analyzed (e.g., name brand puffed corn cereal for generic puffed corn cereal)
• Label survey data were used: – when analytical data were not available
– to represent an average level of trans fat across a category to ensure intake was not significantly overestimated or underestimated
• Market share data were used for select food categories where there was a broad range of trans fat levels among different brands

16
Food Categories Considered • Bread and Refrigerated/Frozen Dough
Products
• Breaded Chicken Products Non Fast Food
• Breakfast Foods
• Brownies
• Cakes
• Cake-Type Snacks
• Candy
• Canned Soups
• Cereal, Hot
• Cereal
• Cheesecakes
• Chocolate Chip Cookies
• Coffee Creamer
• Crackers
• Donuts
• Frosting
• Frozen Pizza
• Fruit Snacks
• Gravy
• Ice Cream Bars, Cones, and Sandwiches
• Ice Cream Cones and Toppings
• Ice Cream
• Instant Coffee and Cocoa Products
• Instant Soups and Soup Mixes
• Macaroni and Cheese
• Margarine and Refrigerated Spreads
• Muffins
• Nutrition and Granola Bars
• Other Cookies
• Pastry Products
• Peanut Butter
• Pies
• Pudding
• Sandwich Cookies
• Savory Snacks
• Shortening
• Snack Dips
• Stuffing
• Tortillas
• Wafer Type Cookies
17
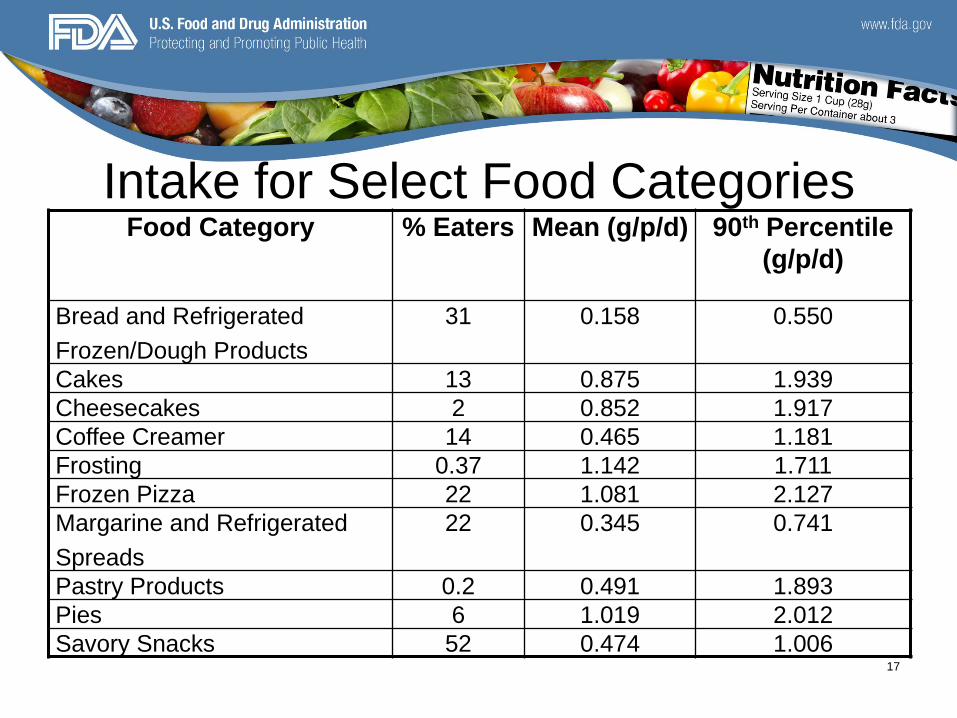
Intake for Select Food Categories Food Category % Eaters Mean (g/p/d) 90th Percentile
(g/p/d)
Bread and Refrigerated
Frozen/Dough Products
31 0.158 0.550
Cakes 13 0.875 1.939
Cheesecakes 2 0.852 1.917
Coffee Creamer 14 0.465 1.181
Frosting 0.37 1.142 1.711
Frozen Pizza 22 1.081 2.127
Margarine and Refrigerated
Spreads
22 0.345 0.741
Pastry Products 0.2 0.491 1.893
Pies 6 1.019 2.012
Savory Snacks 52 0.474 1.006

18
Trans Fat Intake from Fast Food • To allow for the wide variation of trans fat levels, a Monte Carlo
model was used.
• Trans fat levels were obtained from surveying nutrition information on the websites of fast food chains.
• Over 250 food items were grouped into 10 fast food categories (i.e., French fries, onion rings, mozzarella sticks, hash browns, French toast, fish sandwiches, chicken sandwiches, chicken nuggets, fried chicken and fried seafood) from 15 different national fast food chains.
• The trans fat level used for each food category was determined by averaging the trans fat levels reported by the fast food chain for each food in that category.
19
Intake Estimated Using Analytical Data,
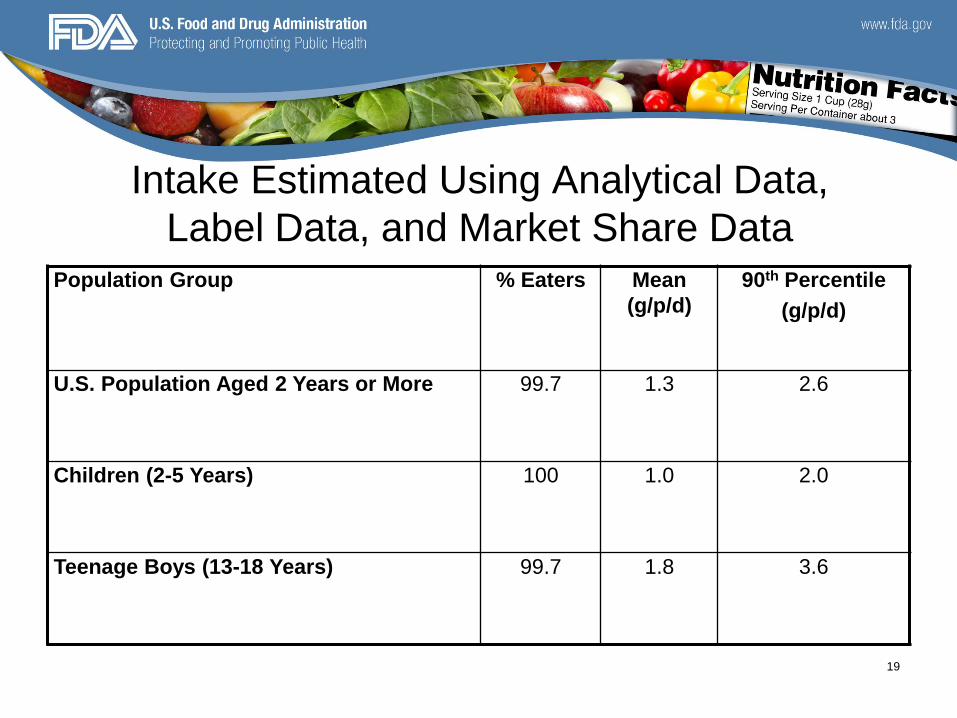
Label Data, and Market Share Data Population Group % Eaters Mean
(g/p/d)
90th Percentile
(g/p/d)
U.S. Population Aged 2 Years or More 99.7 1.3 2.6
Children (2-5 Years) 100 1.0 2.0
Teenage Boys (13-18 Years) 99.7 1.8 3.6
20
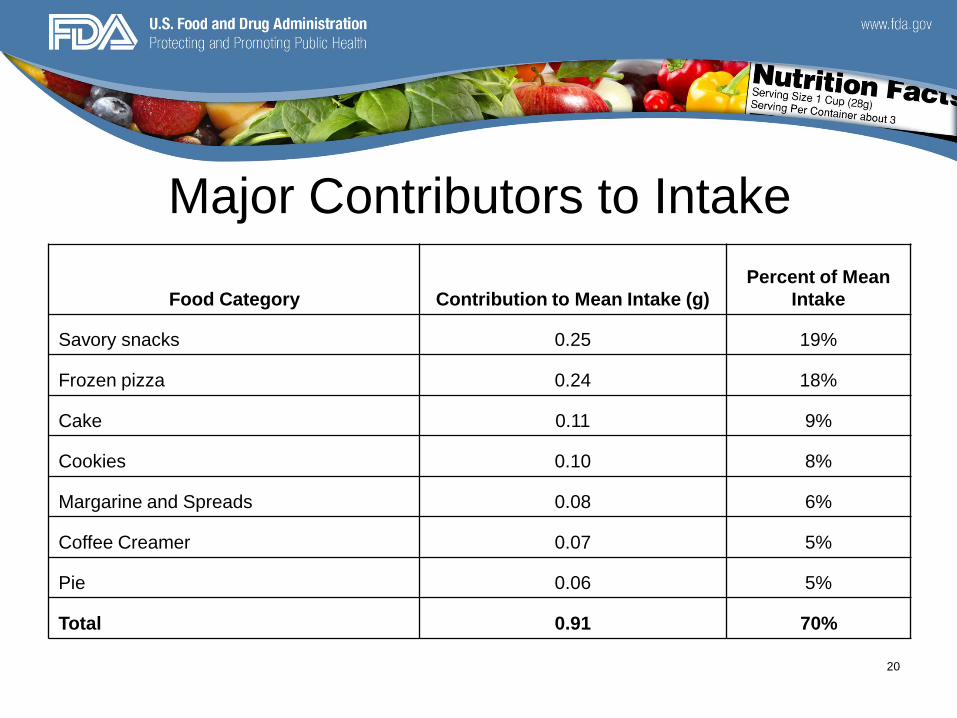
Major Contributors to Intake
Food Category Contribution to Mean Intake (g)
Percent of Mean
Intake
Savory snacks 0.25 19%
Frozen pizza 0.24 18%
Cake 0.11 9%
Cookies 0.10 8%
Margarine and Spreads 0.08 6%
Coffee Creamer 0.07 5%
Pie 0.06 5%
Total 0.91 70%

21
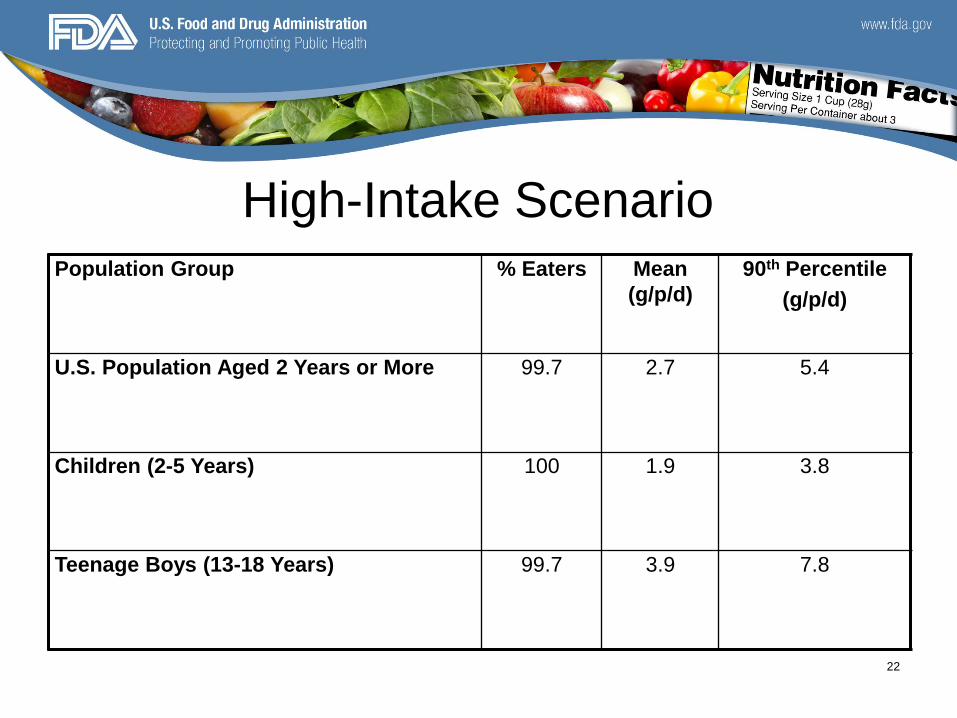
High-Intake Scenario
• Certain individuals or populations may consume
food products containing substantial levels of
trans fat
• “Worst-case” scenario was also estimated
– Highest trans fat level used for each food code
22
High-Intake Scenario Population Group % Eaters Mean
(g/p/d)
90th Percentile
(g/p/d)
U.S. Population Aged 2 Years or More 99.7 2.7 5.4
Children (2-5 Years) 100 1.9 3.8
Teenage Boys (13-18 Years) 99.7 3.9 7.8
23
Intake Estimated Using the USDA
Nutrient Intake Database
• USDA National Nutrient Database for Standard Reference
(SR), Release 22 (SR22, 2009) used as an independent data
source
• USDA SR is a major source of food composition data in the
U.S.
• USDA SR22 includes data on 1,534 trans fat-containing food
items that represent 25 different food categories
• Trans fat levels in SR22 were combined with consumption
data from the 2003-2006 NHANES
24
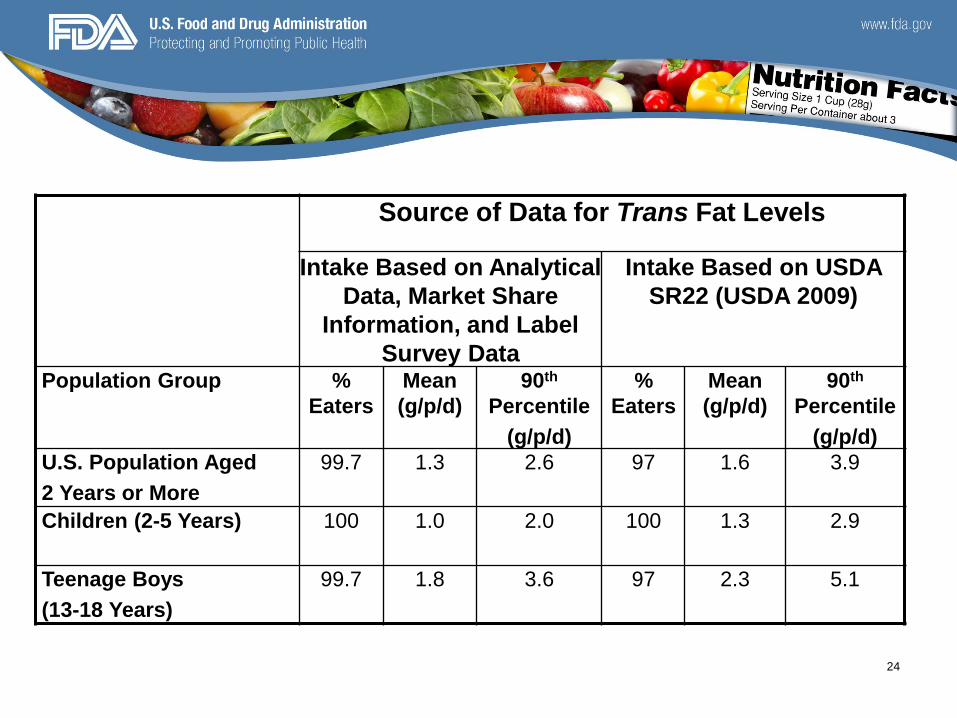
Source of Data for Trans Fat Levels
Intake Based on Analytical
Data, Market Share
Information, and Label
Survey Data
Intake Based on USDA
SR22 (USDA 2009)
Population Group %
Eaters
Mean
(g/p/d)
90th
Percentile
(g/p/d)
%
Eaters
Mean
(g/p/d)
90th
Percentile
(g/p/d)
U.S. Population Aged
2 Years or More
99.7 1.3 2.6 97 1.6 3.9
Children (2-5 Years) 100 1.0 2.0 100 1.3 2.9
Teenage Boys
(13-18 Years)
99.7 1.8 3.6 97 2.3 5.1

25
Intake of Trans Fat from
Non-Hydrogenated Refined Oils • Small amounts of trans isomers are found in non-hydrogenated refined oils
• USDA SR22 intake estimate included intake of trans fat in refined oils
• Intake estimate based on market share information, label survey data, and analytical data accounted for trans fat intake from non-hydrogenated refined oils only in products that contain a PHO
• Mean intake of non-hydrogenated refined oils by U.S. population estimated to be 30 g/p/d
• Assumed a trans fat level of 2% in these oils
• Contribution of trans fat from non-hydrogenated refined oils estimated to be as high as 0.6 g/p/d for the U.S. population
26
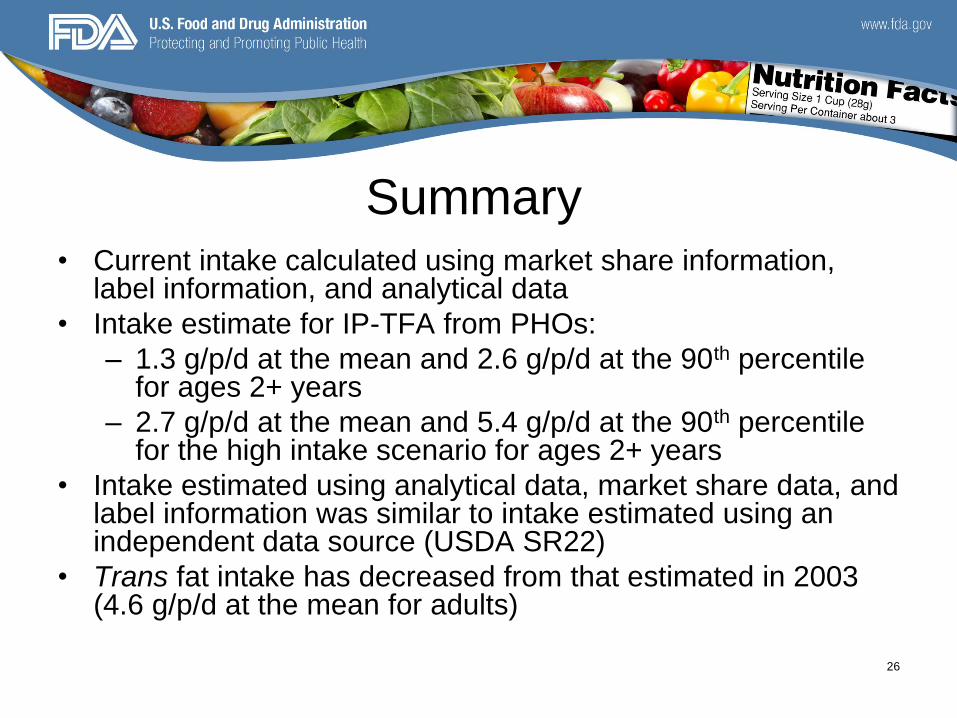
Summary • Current intake calculated using market share information,
label information, and analytical data
• Intake estimate for IP-TFA from PHOs:
– 1.3 g/p/d at the mean and 2.6 g/p/d at the 90th percentile for ages 2+ years
– 2.7 g/p/d at the mean and 5.4 g/p/d at the 90th percentile for the high intake scenario for ages 2+ years
• Intake estimated using analytical data, market share data, and label information was similar to intake estimated using an independent data source (USDA SR22)
• Trans fat intake has decreased from that estimated in 2003 (4.6 g/p/d at the mean for adults)
27
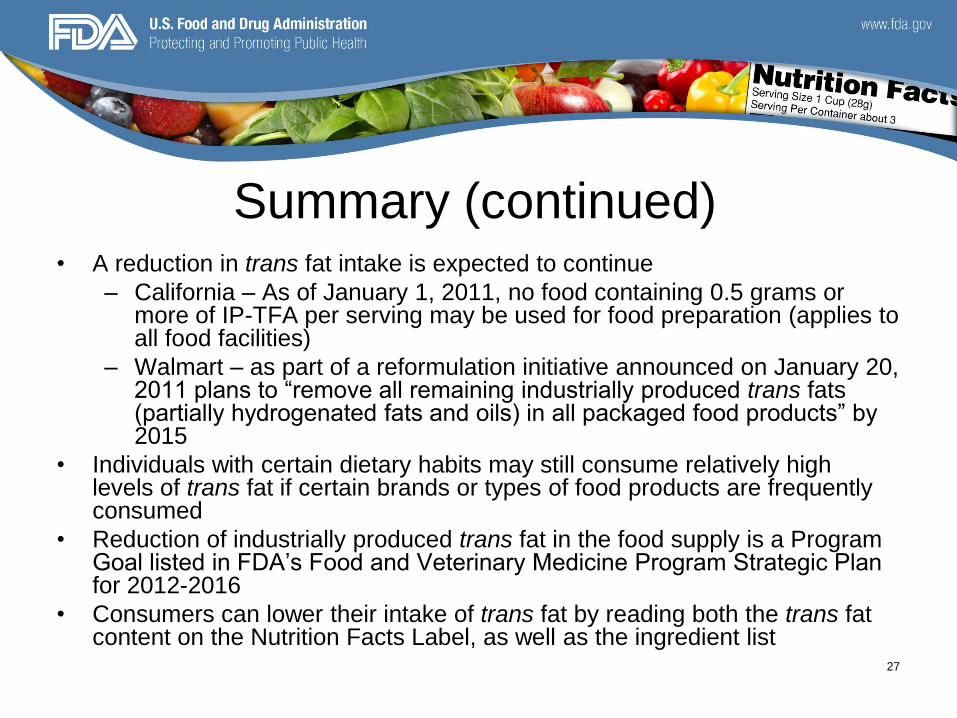
Summary (continued) • A reduction in trans fat intake is expected to continue
– California – As of January 1, 2011, no food containing 0.5 grams or more of IP-TFA per serving may be used for food preparation (applies to all food facilities)
– Walmart – as part of a reformulation initiative announced on January 20, 2011 plans to “remove all remaining industrially produced trans fats (partially hydrogenated fats and oils) in all packaged food products” by 2015
• Individuals with certain dietary habits may still consume relatively high levels of trans fat if certain brands or types of food products are frequently consumed
• Reduction of industrially produced trans fat in the food supply is a Program Goal listed in FDA’s Food and Veterinary Medicine Program Strategic Plan for 2012-2016
• Consumers can lower their intake of trans fat by reading both the trans fat content on the Nutrition Facts Label, as well as the ingredient list