Embed Size (px)
Citation preview
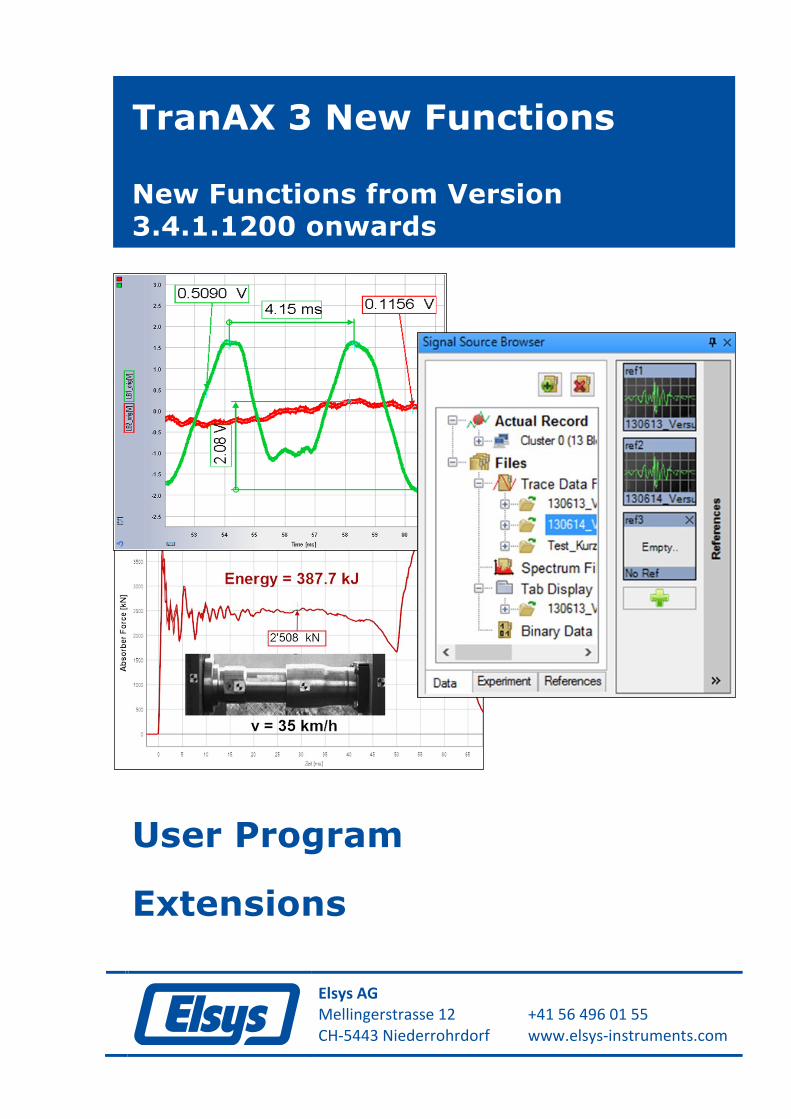
TranAX 3 New Functions
New Functions from Version 3.4.1.1200 onwards
User Program
Extensions
Elsys AG Mellingerstrasse 12 +41 56 496 01 55 CH-5443 Niederrohrdorf www.elsys-instruments.com

TranAX 3 New Functions News Version 3.4.1.1200
© Elsys AG 1
Content 1 Reference Pointers ....................................................................................................... 2
1.1 Potential Sources for Reference Pointers ......................................................................... 2
1.2 Reference-Pointers in the Formula Editor ........................................................................ 3
1.3 Reference-Pointers in Auto Sequence .............................................................................. 4
2 New functionality in the waveform display windows .................................................. 5
2.1 Adding images and formatting of calculation results ....................................................... 5
2.2 On-Curve Measurements .................................................................................................. 6
2.3 Cursor on Sample points ................................................................................................... 7
2.4 Additional beneficial functions ......................................................................................... 7
3 Signal Source Browser ( ) Expansions......................................................................... 8
4 New Functions in the Formula-Editor........................................................................... 9
4.1 Group "File Functions" ...................................................................................................... 9
4.2 Group "Programming" .................................................................................................... 10
4.3 Group "Layout Waveform" ............................................................................................. 11
4.4 Group "Auto Sequence Functions" ................................................................................. 12
4.5 Group "Misc. Functions" ................................................................................................. 13
TranAX 3 New Functions News Version 3.4.1.1200
2 © Elsys AG
1 Reference Pointers
From TranAX version 3.4.1.1200 onwards it is possible, instead of curves from files to work with so called Reference Pointers. Hardware channels can be assigned as well to these pointers. With pointers it is possible to sequentially analyze single Tpc5 files that for example have been recorded in Auto Sequence mode. The reference pointer can be imagined as a place holder that can be used in a Waveform Display, Scalar tables or Formula editor. By assigning curves from a different file (or hardware-channels directly) only the data content is exchanged, while the profile (color, line thickness, zoom position, labels, etc.) will be retained. This offers the advantage that the planning and preparation of a screen lay-out, e.g., curves display, scalar tables, texts, only once needs to be set up with the Reference Pointer curves. Subsequently all measurement curves can be assigned via Drag & Drop, without having to replace those in the lay-out or in a formula each time.
Copy files are not generated. The Pointer acts like an arrow referencing a se-lected Signal Source (file or hardware channel). When such a source file is removed from the computer or moved then that pointer disappears, e.g. is empty.
1.1 Potential Sources for Reference Pointers
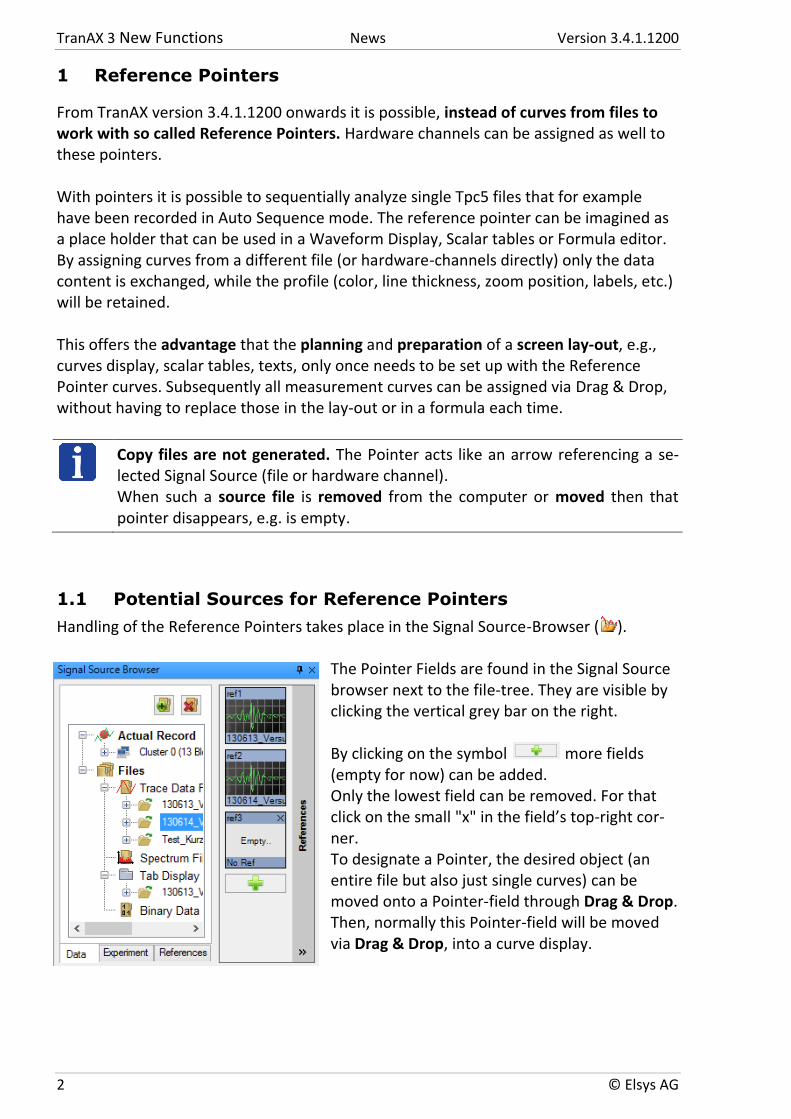
Handling of the Reference Pointers takes place in the Signal Source-Browser ( ).
The Pointer Fields are found in the Signal Source browser next to the file-tree. They are visible by clicking the vertical grey bar on the right. By clicking on the symbol more fields (empty for now) can be added. Only the lowest field can be removed. For that click on the small "x" in the field’s top-right cor-ner. To designate a Pointer, the desired object (an entire file but also just single curves) can be moved onto a Pointer-field through Drag & Drop. Then, normally this Pointer-field will be moved via Drag & Drop, into a curve display.
TranAX 3 New Functions News Version 3.4.1.1200
© Elsys AG 3
The following objects are valid:
Stored files, with the following formats being supported: o *.Tpc5: TranAX 3 Standard Format for measured curves in time domain o *.TPS5: TranAX 3 Standard Data Format for Spectrum and FFT curves o *.TDP: stored Tab-Pages in TranAX 3 o *.BDF: binary Raw Data from Recorder and ECR-Mode
Hardware Channels, all channels on the Control Panel respectively from an actual cluster. Thereby it is also possible to select multiple channels from the two first columns and via Drag & Drop deposit those on a Pointer-field.
Averaged YT and FFT curves (@- resp. %-curves) several channels here as well can be selected and dragged onto a Pointer-field.
The designated Pointer-fields then can be via Drag & Drop moved onto a curve dis-play. This relates always to all the curves designated to a given Pointer. When, for ex-ample only one curve is being dealt with, only that curve should be dragged onto the Pointer-field.
1.2 Reference-Pointers in the Formula Editor
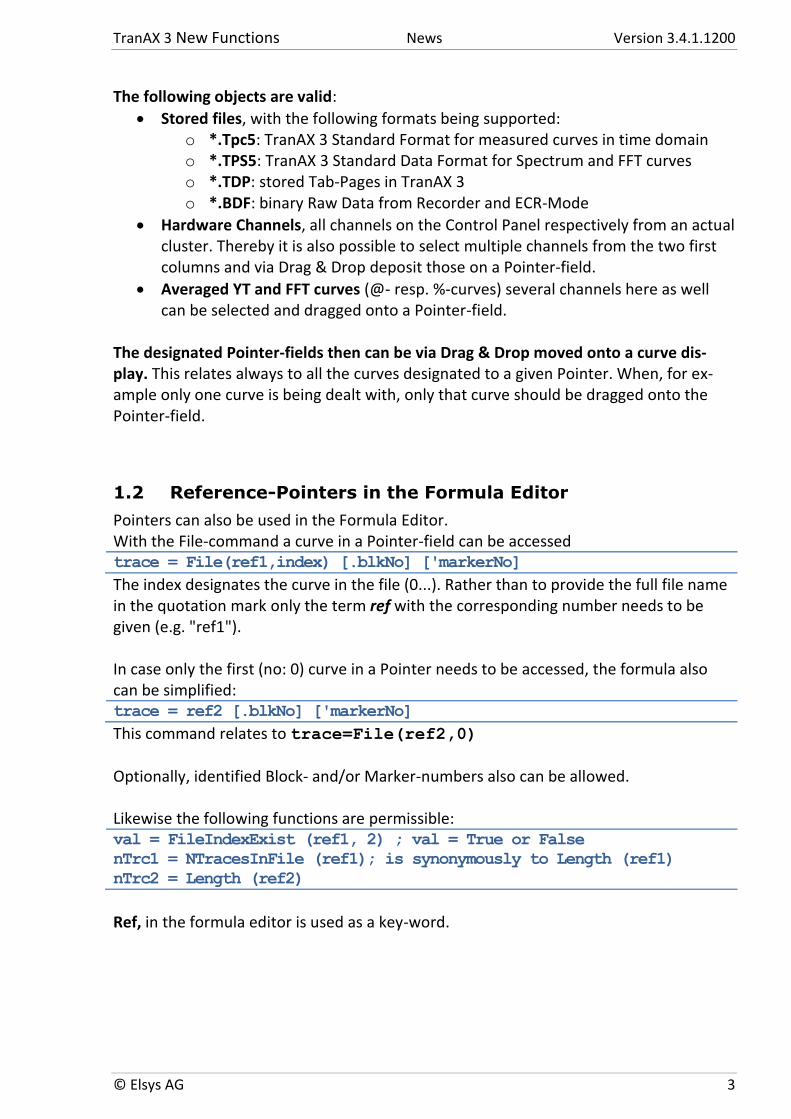
Pointers can also be used in the Formula Editor. With the File-command a curve in a Pointer-field can be accessed trace = File(ref1,index) [.blkNo] ['markerNo]
The index designates the curve in the file (0...). Rather than to provide the full file name in the quotation mark only the term ref with the corresponding number needs to be given (e.g. "ref1"). In case only the first (no: 0) curve in a Pointer needs to be accessed, the formula also can be simplified: trace = ref2 [.blkNo] ['markerNo]
This command relates to trace=File(ref2,0) Optionally, identified Block- and/or Marker-numbers also can be allowed. Likewise the following functions are permissible: val = FileIndexExist (ref1, 2) ; val = True or False
nTrc1 = NTracesInFile (ref1); is synonymously to Length (ref1)
nTrc2 = Length (ref2)
Ref, in the formula editor is used as a key-word.
TranAX 3 New Functions News Version 3.4.1.1200
4 © Elsys AG
1.3 Reference-Pointers in Auto Sequence
Pointers also can be used with Auto Sequences. At command Save instead of the file name, the corresponding Pointer (without name extension, e.g. TPC5, etc.) must be indicated. Save ref1, 0A1–4
With this method it is possible in an Auto-Sequence-loop to archive measured curves (in number-progressive files) and simultaneously use the actual measurement data for dis-play or extended calculations in the Formula editor. Auto Sequence example: Repeat 10
Start Recording
Wait on EOR
Save xy_#.tpc5, 0A1-4 ; Generate a measurement series
Save ref4, 0A1-4 ; Generate (overwrite) a file
; "ref4.tpc5" and allocate to the
; corresponding Pointer
Calculate
Wait for Calculations
Next
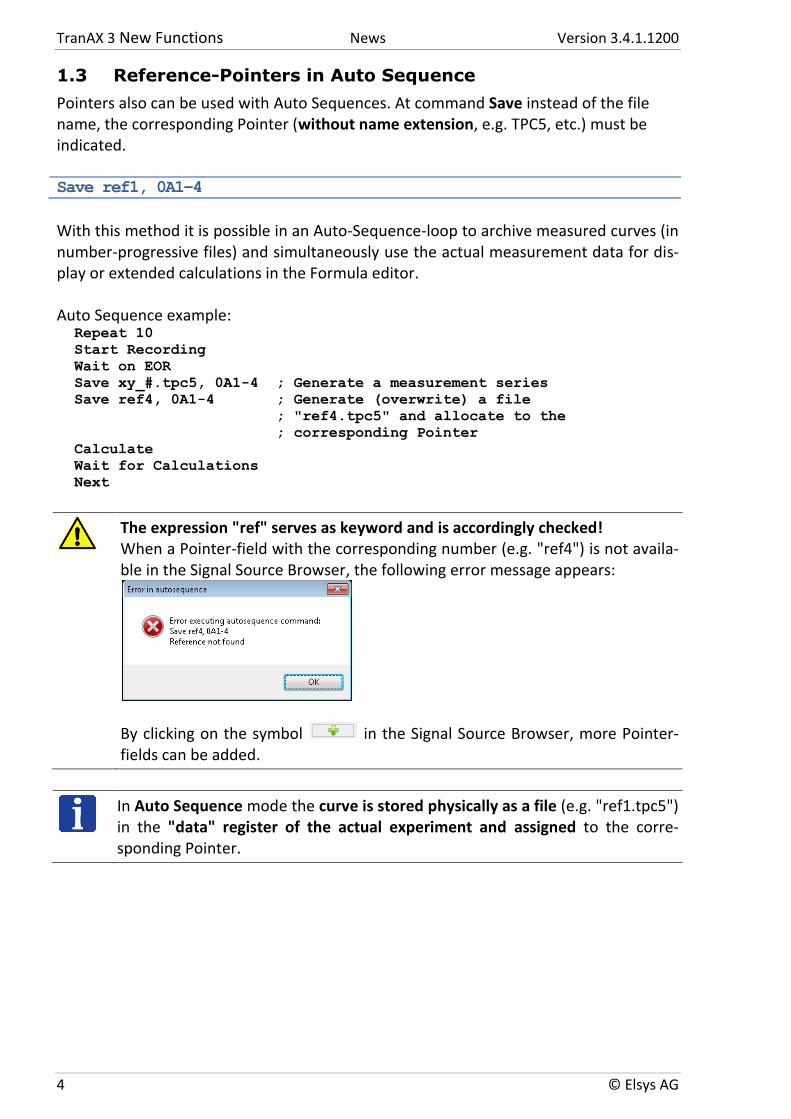
The expression "ref" serves as keyword and is accordingly checked! When a Pointer-field with the corresponding number (e.g. "ref4") is not availa-ble in the Signal Source Browser, the following error message appears:
By clicking on the symbol in the Signal Source Browser, more Pointer-fields can be added.
In Auto Sequence mode the curve is stored physically as a file (e.g. "ref1.tpc5") in the "data" register of the actual experiment and assigned to the corre-sponding Pointer.
TranAX 3 New Functions News Version 3.4.1.1200
© Elsys AG 5
2 New functionality in the waveform display windows
2.1 Adding images and formatting of calculation results
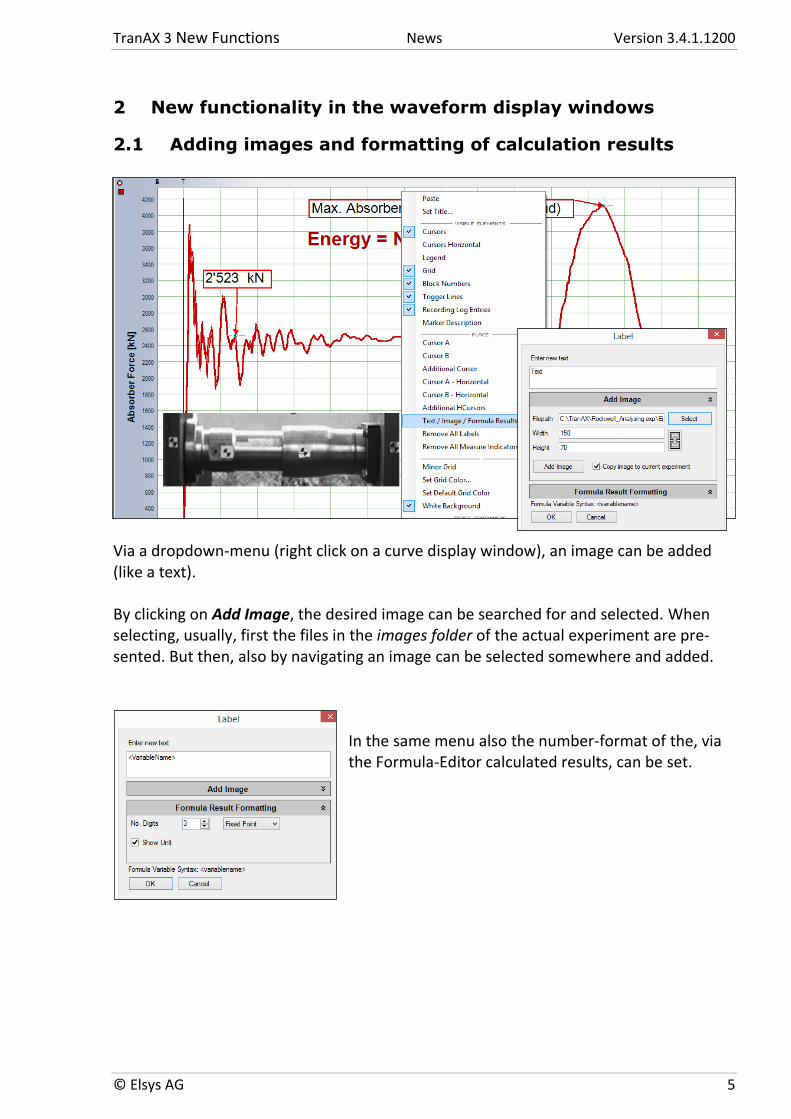
Via a dropdown-menu (right click on a curve display window), an image can be added (like a text). By clicking on Add Image, the desired image can be searched for and selected. When selecting, usually, first the files in the images folder of the actual experiment are pre-sented. But then, also by navigating an image can be selected somewhere and added.
In the same menu also the number-format of the, via the Formula-Editor calculated results, can be set.
TranAX 3 New Functions News Version 3.4.1.1200
6 © Elsys AG
2.2 On-Curve Measurements
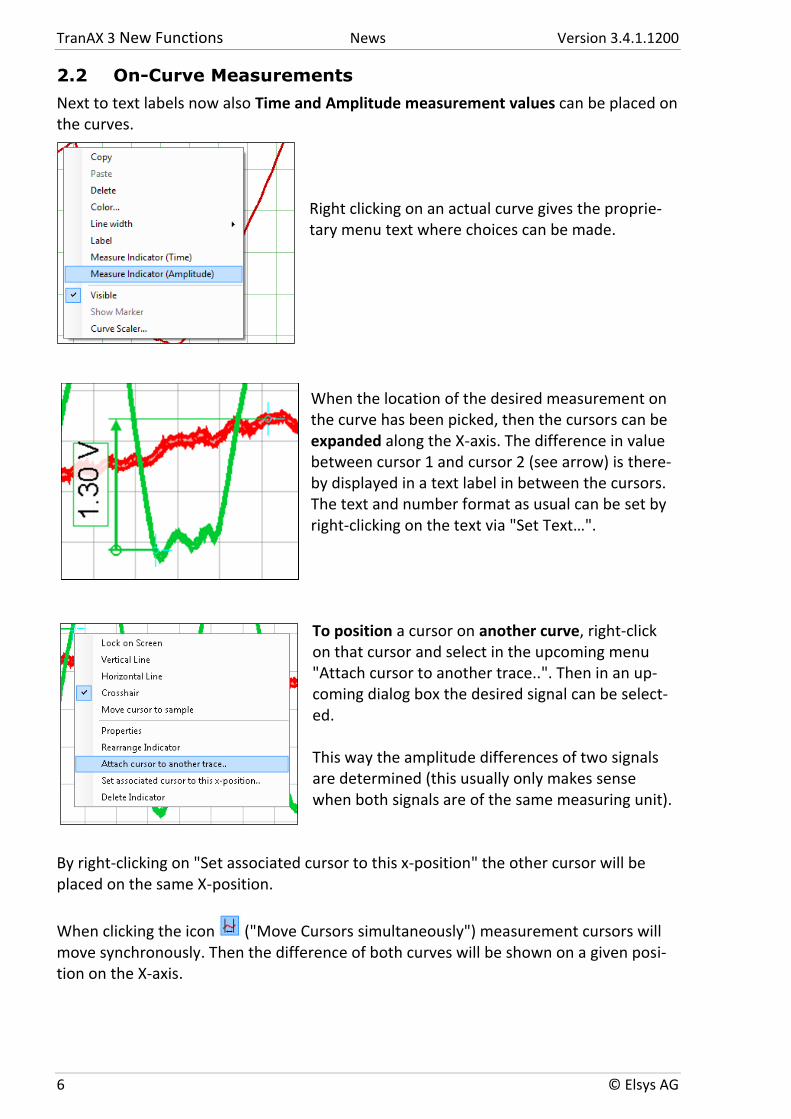
Next to text labels now also Time and Amplitude measurement values can be placed on the curves.
Right clicking on an actual curve gives the proprie-tary menu text where choices can be made. When the location of the desired measurement on the curve has been picked, then the cursors can be expanded along the X-axis. The difference in value between cursor 1 and cursor 2 (see arrow) is there-by displayed in a text label in between the cursors. The text and number format as usual can be set by right-clicking on the text via "Set Text…".
To position a cursor on another curve, right-click on that cursor and select in the upcoming menu "Attach cursor to another trace..". Then in an up-coming dialog box the desired signal can be select-ed. This way the amplitude differences of two signals are determined (this usually only makes sense when both signals are of the same measuring unit).
By right-clicking on "Set associated cursor to this x-position" the other cursor will be placed on the same X-position.
When clicking the icon ("Move Cursors simultaneously") measurement cursors will move synchronously. Then the difference of both curves will be shown on a given posi-tion on the X-axis.
TranAX 3 New Functions News Version 3.4.1.1200
© Elsys AG 7
2.3 Cursor on Sample points
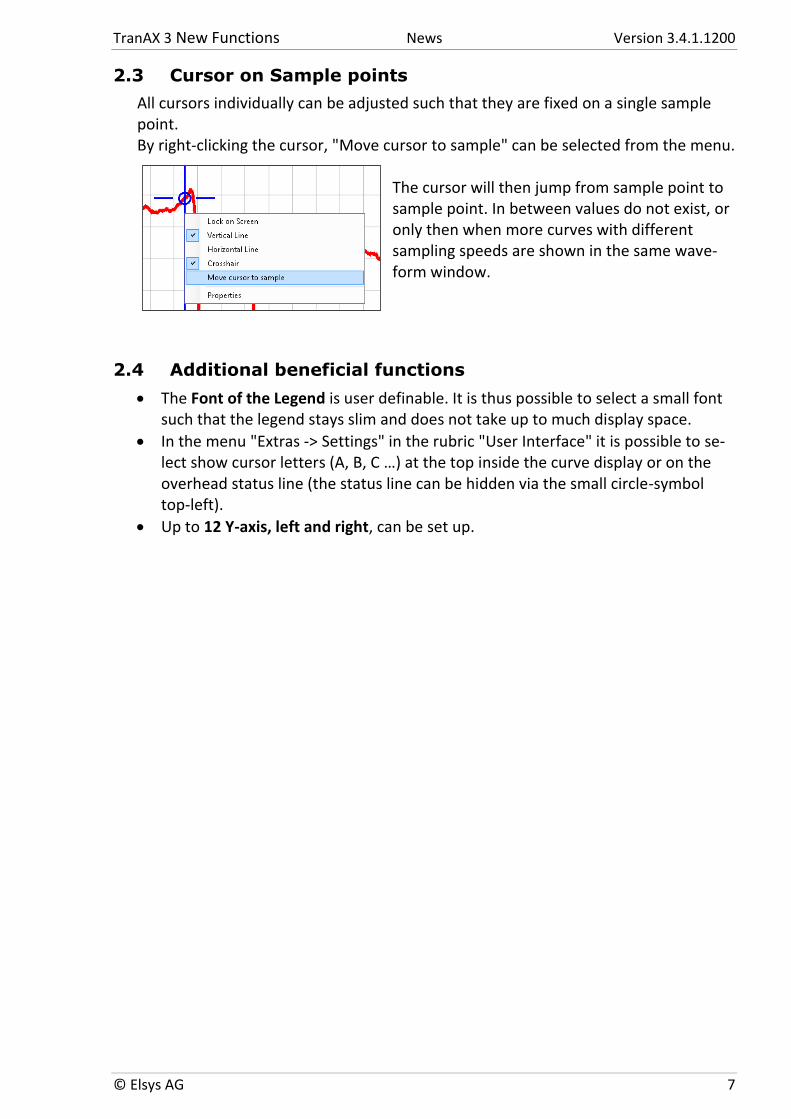
All cursors individually can be adjusted such that they are fixed on a single sample point. By right-clicking the cursor, "Move cursor to sample" can be selected from the menu.
The cursor will then jump from sample point to sample point. In between values do not exist, or only then when more curves with different sampling speeds are shown in the same wave-form window.
2.4 Additional beneficial functions
The Font of the Legend is user definable. It is thus possible to select a small font such that the legend stays slim and does not take up to much display space.
In the menu "Extras -> Settings" in the rubric "User Interface" it is possible to se-lect show cursor letters (A, B, C …) at the top inside the curve display or on the overhead status line (the status line can be hidden via the small circle-symbol top-left).
Up to 12 Y-axis, left and right, can be set up.
TranAX 3 New Functions News Version 3.4.1.1200
8 © Elsys AG
3 Signal Source Browser ( ) Expansions
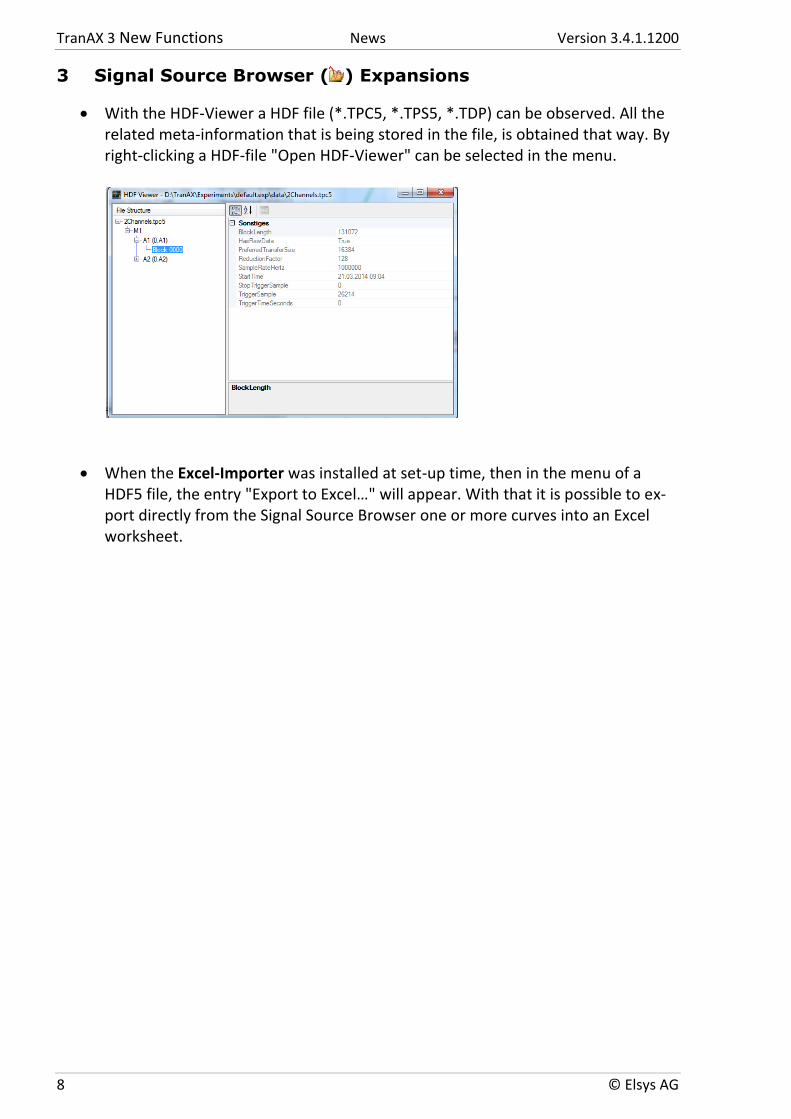
With the HDF-Viewer a HDF file (*.TPC5, *.TPS5, *.TDP) can be observed. All the related meta-information that is being stored in the file, is obtained that way. By right-clicking a HDF-file "Open HDF-Viewer" can be selected in the menu.
When the Excel-Importer was installed at set-up time, then in the menu of a HDF5 file, the entry "Export to Excel…" will appear. With that it is possible to ex-port directly from the Signal Source Browser one or more curves into an Excel worksheet.
TranAX 3 New Functions News Version 3.4.1.1200
© Elsys AG 9
4 New Functions in the Formula-Editor
4.1 Group "File Functions"
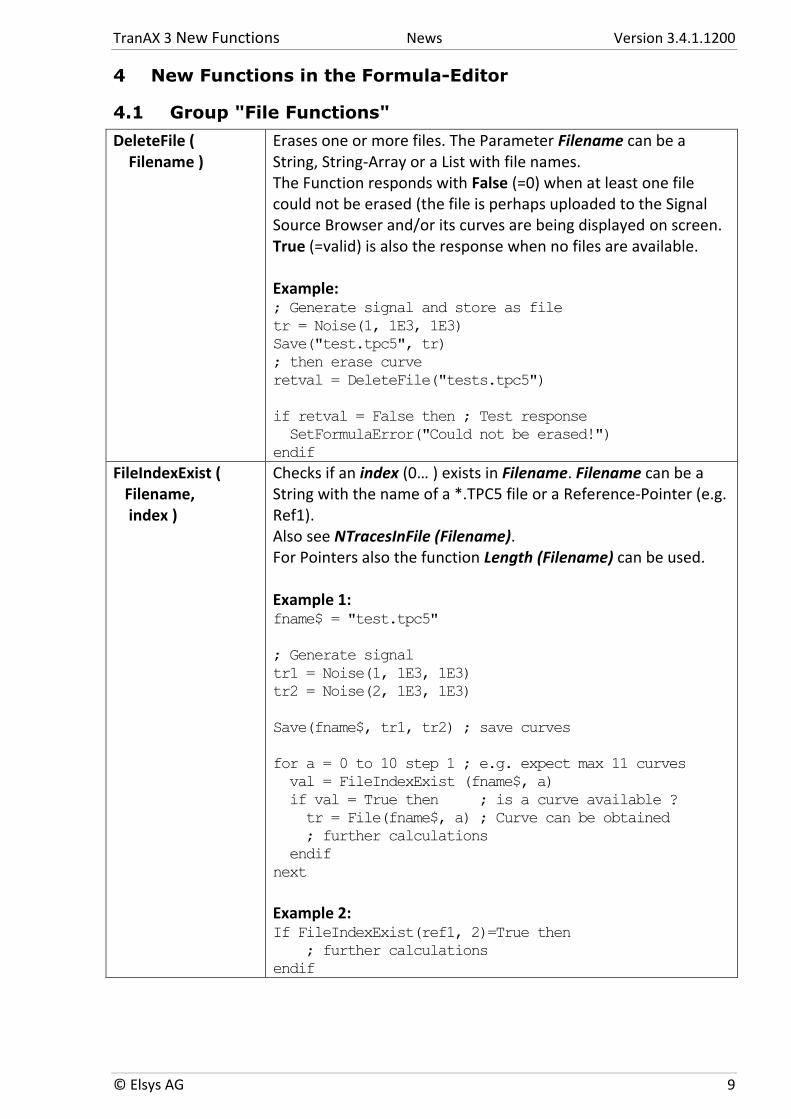
DeleteFile ( Filename )
Erases one or more files. The Parameter Filename can be a String, String-Array or a List with file names. The Function responds with False (=0) when at least one file could not be erased (the file is perhaps uploaded to the Signal Source Browser and/or its curves are being displayed on screen. True (=valid) is also the response when no files are available. Example: ; Generate signal and store as file
tr = Noise(1, 1E3, 1E3)
Save("test.tpc5", tr)
; then erase curve
retval = DeleteFile("tests.tpc5")
if retval = False then ; Test response
SetFormulaError("Could not be erased!")
endif FileIndexExist ( Filename, index )
Checks if an index (0… ) exists in Filename. Filename can be a String with the name of a *.TPC5 file or a Reference-Pointer (e.g. Ref1). Also see NTracesInFile (Filename). For Pointers also the function Length (Filename) can be used. Example 1: fname$ = "test.tpc5"
; Generate signal
tr1 = Noise(1, 1E3, 1E3)
tr2 = Noise(2, 1E3, 1E3)
Save(fname$, tr1, tr2) ; save curves
for a = 0 to 10 step 1 ; e.g. expect max 11 curves
val = FileIndexExist (fname$, a)
if val = True then ; is a curve available ?
tr = File(fname$, a) ; Curve can be obtained
; further calculations
endif
next
Example 2: If FileIndexExist(ref1, 2)=True then
; further calculations
endif
TranAX 3 New Functions News Version 3.4.1.1200
10 © Elsys AG
4.2 Group "Programming"
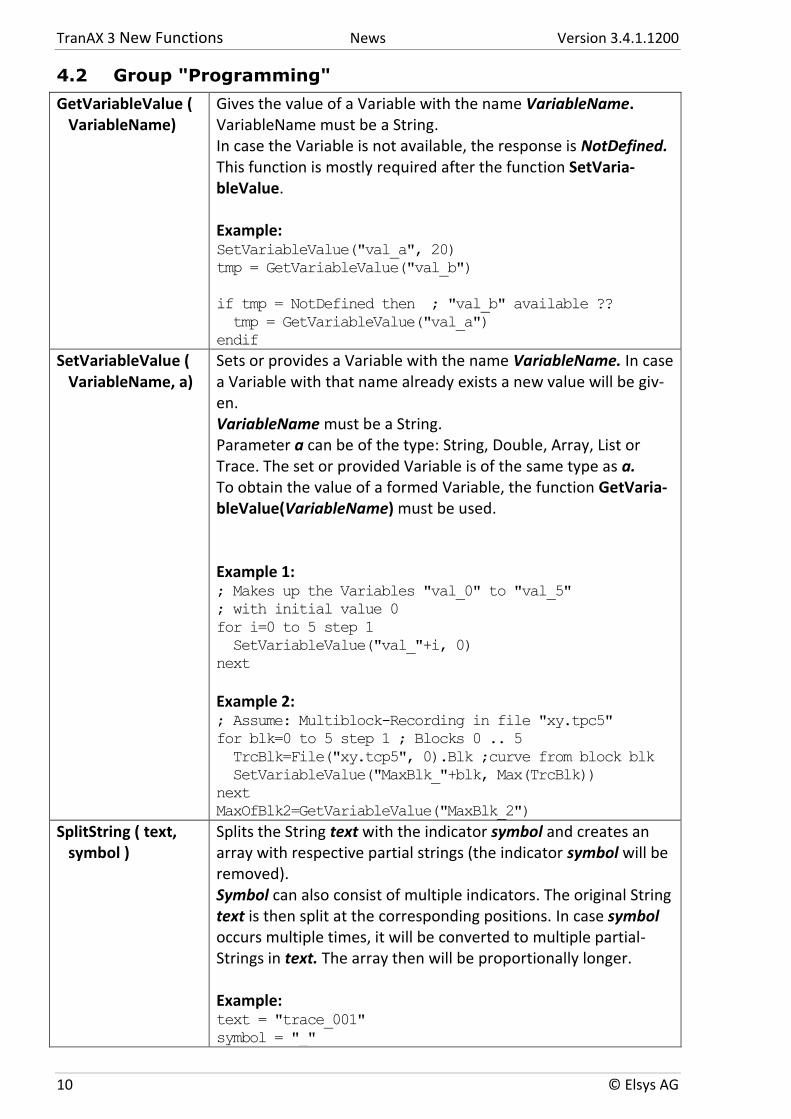
GetVariableValue ( VariableName)
Gives the value of a Variable with the name VariableName. VariableName must be a String. In case the Variable is not available, the response is NotDefined. This function is mostly required after the function SetVaria-bleValue. Example: SetVariableValue("val_a", 20)
tmp = GetVariableValue("val_b")
if tmp = NotDefined then ; "val_b" available ??
tmp = GetVariableValue("val_a")
endif SetVariableValue ( VariableName, a)
Sets or provides a Variable with the name VariableName. In case a Variable with that name already exists a new value will be giv-en. VariableName must be a String. Parameter a can be of the type: String, Double, Array, List or Trace. The set or provided Variable is of the same type as a. To obtain the value of a formed Variable, the function GetVaria-bleValue(VariableName) must be used. Example 1: ; Makes up the Variables "val_0" to "val_5"
; with initial value 0
for i=0 to 5 step 1
SetVariableValue("val_"+i, 0)
next
Example 2: ; Assume: Multiblock-Recording in file "xy.tpc5"
for blk=0 to 5 step 1 ; Blocks 0 .. 5
TrcBlk=File("xy.tcp5", 0).Blk ;curve from block blk
SetVariableValue("MaxBlk_"+blk, Max(TrcBlk))
next
MaxOfBlk2=GetVariableValue("MaxBlk_2")
SplitString ( text, symbol )
Splits the String text with the indicator symbol and creates an array with respective partial strings (the indicator symbol will be removed). Symbol can also consist of multiple indicators. The original String text is then split at the corresponding positions. In case symbol occurs multiple times, it will be converted to multiple partial-Strings in text. The array then will be proportionally longer. Example: text = "trace_001"
symbol = "_"
TranAX 3 New Functions News Version 3.4.1.1200
© Elsys AG 11
StrArray = SplitString(text, symbol)
stringTrace = StrArray (0) ; "trace"
stringNumber = StrArray (1) ; "001"
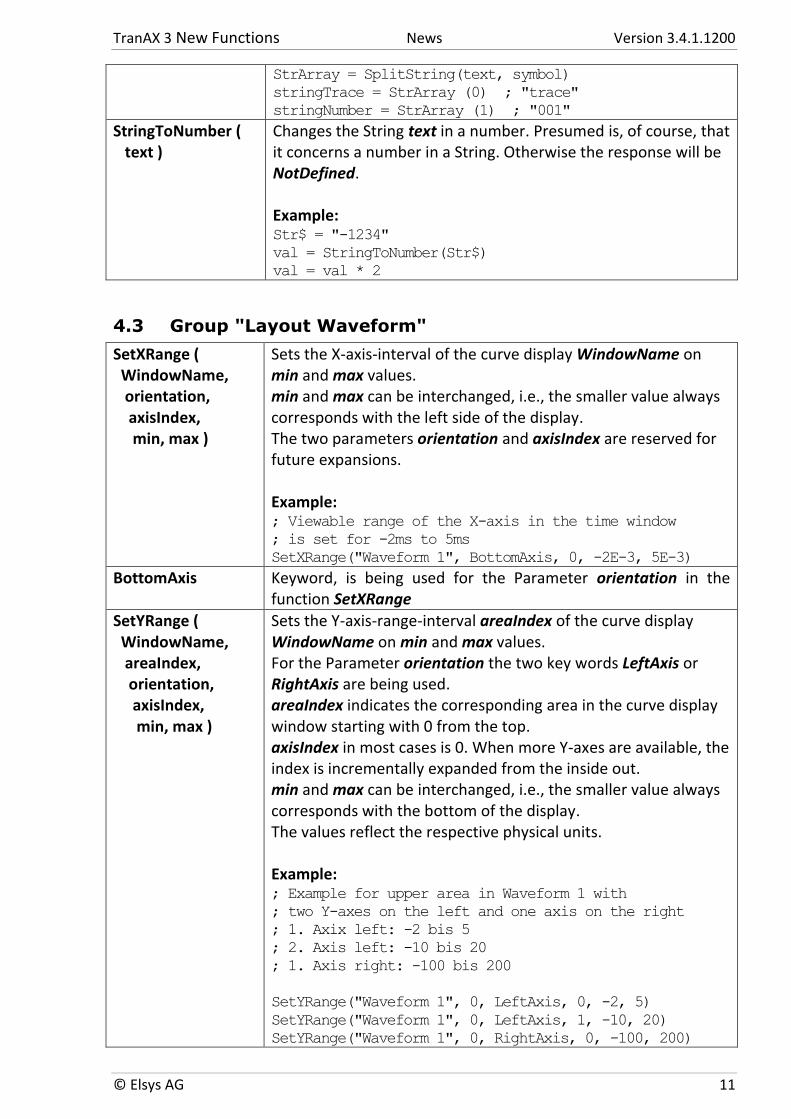
StringToNumber ( text )
Changes the String text in a number. Presumed is, of course, that it concerns a number in a String. Otherwise the response will be NotDefined. Example: Str$ = "-1234"
val = StringToNumber(Str$)
val = val * 2
4.3 Group "Layout Waveform"
SetXRange ( WindowName, orientation, axisIndex, min, max )
Sets the X-axis-interval of the curve display WindowName on min and max values. min and max can be interchanged, i.e., the smaller value always corresponds with the left side of the display. The two parameters orientation and axisIndex are reserved for future expansions. Example: ; Viewable range of the X-axis in the time window
; is set for -2ms to 5ms
SetXRange("Waveform 1", BottomAxis, 0, -2E-3, 5E-3) BottomAxis Keyword, is being used for the Parameter orientation in the
function SetXRange
SetYRange ( WindowName, areaIndex, orientation, axisIndex, min, max )
Sets the Y-axis-range-interval areaIndex of the curve display WindowName on min and max values. For the Parameter orientation the two key words LeftAxis or RightAxis are being used. areaIndex indicates the corresponding area in the curve display window starting with 0 from the top. axisIndex in most cases is 0. When more Y-axes are available, the index is incrementally expanded from the inside out. min and max can be interchanged, i.e., the smaller value always corresponds with the bottom of the display. The values reflect the respective physical units. Example: ; Example for upper area in Waveform 1 with
; two Y-axes on the left and one axis on the right
; 1. Axix left: -2 bis 5
; 2. Axis left: -10 bis 20
; 1. Axis right: -100 bis 200
SetYRange("Waveform 1", 0, LeftAxis, 0, -2, 5)
SetYRange("Waveform 1", 0, LeftAxis, 1, -10, 20)
SetYRange("Waveform 1", 0, RightAxis, 0, -100, 200)
TranAX 3 New Functions News Version 3.4.1.1200
12 © Elsys AG
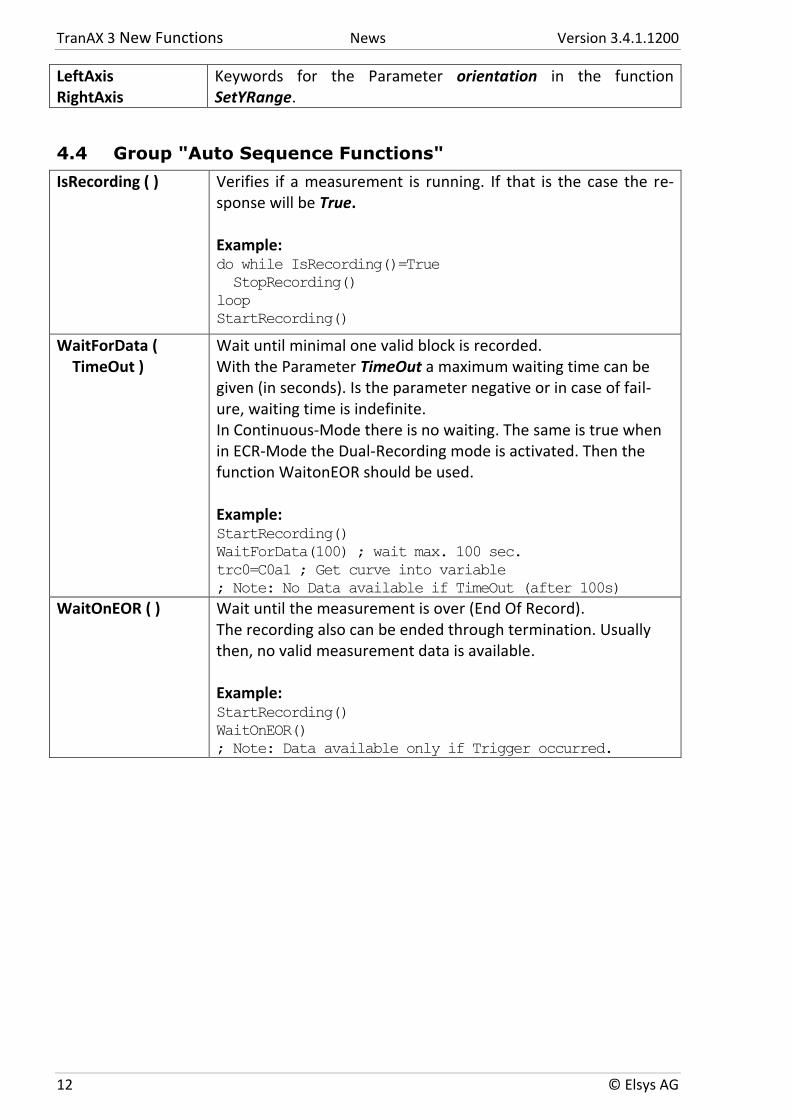
LeftAxis RightAxis
Keywords for the Parameter orientation in the function SetYRange.
4.4 Group "Auto Sequence Functions"
IsRecording ( ) Verifies if a measurement is running. If that is the case the re-sponse will be True. Example: do while IsRecording()=True
StopRecording()
loop
StartRecording()
WaitForData ( TimeOut )
Wait until minimal one valid block is recorded. With the Parameter TimeOut a maximum waiting time can be given (in seconds). Is the parameter negative or in case of fail-ure, waiting time is indefinite. In Continuous-Mode there is no waiting. The same is true when in ECR-Mode the Dual-Recording mode is activated. Then the function WaitonEOR should be used. Example: StartRecording()
WaitForData(100) ; wait max. 100 sec.
trc0=C0a1 ; Get curve into variable
; Note: No Data available if TimeOut (after 100s)
WaitOnEOR ( ) Wait until the measurement is over (End Of Record). The recording also can be ended through termination. Usually then, no valid measurement data is available. Example: StartRecording()
WaitOnEOR()
; Note: Data available only if Trigger occurred.
TranAX 3 New Functions News Version 3.4.1.1200
© Elsys AG 13
4.5 Group "Misc. Functions"
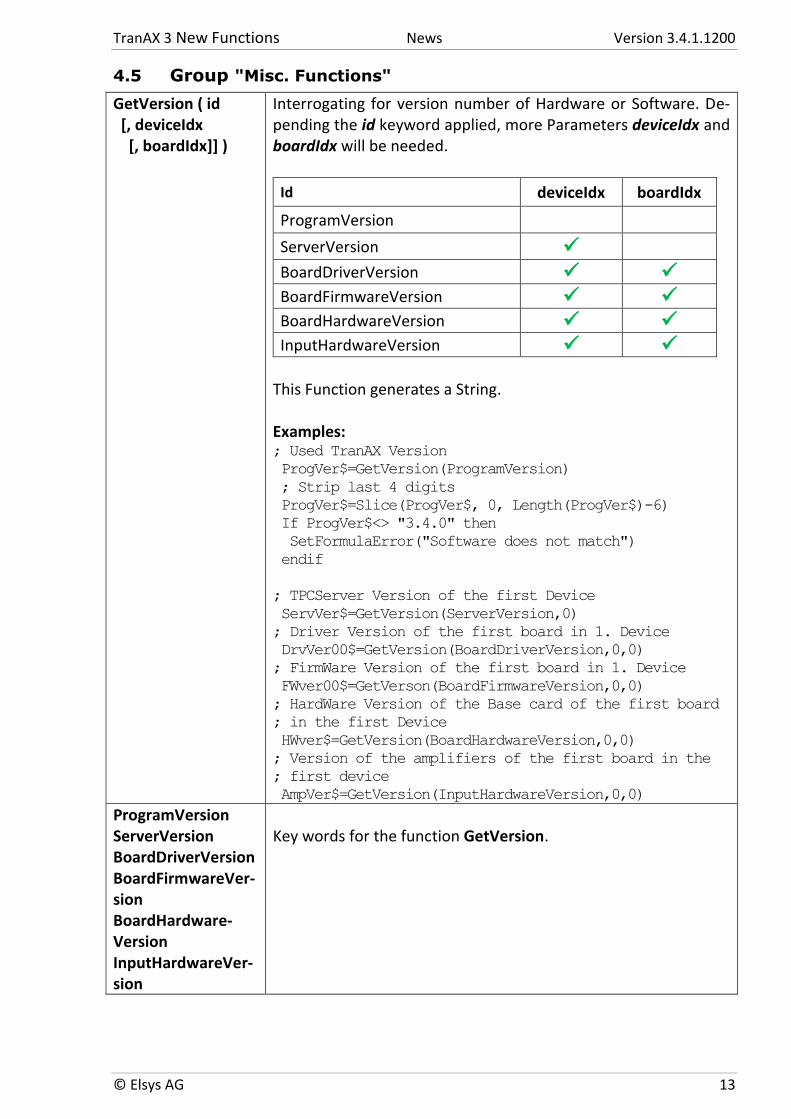
GetVersion ( id [, deviceIdx [, boardIdx]] )
Interrogating for version number of Hardware or Software. De-pending the id keyword applied, more Parameters deviceIdx and boardIdx will be needed.
Id deviceIdx boardIdx
ProgramVersion ServerVersion BoardDriverVersion BoardFirmwareVersion BoardHardwareVersion InputHardwareVersion
This Function generates a String. Examples: ; Used TranAX Version
ProgVer$=GetVersion(ProgramVersion)
; Strip last 4 digits
ProgVer$=Slice(ProgVer$, 0, Length(ProgVer$)-6)
If ProgVer$<> "3.4.0" then
SetFormulaError("Software does not match")
endif
; TPCServer Version of the first Device
ServVer$=GetVersion(ServerVersion,0)
; Driver Version of the first board in 1. Device
DrvVer00$=GetVersion(BoardDriverVersion,0,0)
; FirmWare Version of the first board in 1. Device
FWver00$=GetVerson(BoardFirmwareVersion,0,0)
; HardWare Version of the Base card of the first board
; in the first Device
HWver$=GetVersion(BoardHardwareVersion,0,0)
; Version of the amplifiers of the first board in the
; first device
AmpVer$=GetVersion(InputHardwareVersion,0,0)
ProgramVersion ServerVersion BoardDriverVersion BoardFirmwareVer-sion BoardHardware-Version InputHardwareVer-sion
Key words for the function GetVersion.
TranAX 3 New Functions News Version 3.4.1.1200
14 © Elsys AG
Document information File name: TranAX_3.4.1.1200_News_EN.docx Status: Released Last Changes Date: 28.8.2014 Authors: Elsys AG