Embed Size (px)
Citation preview
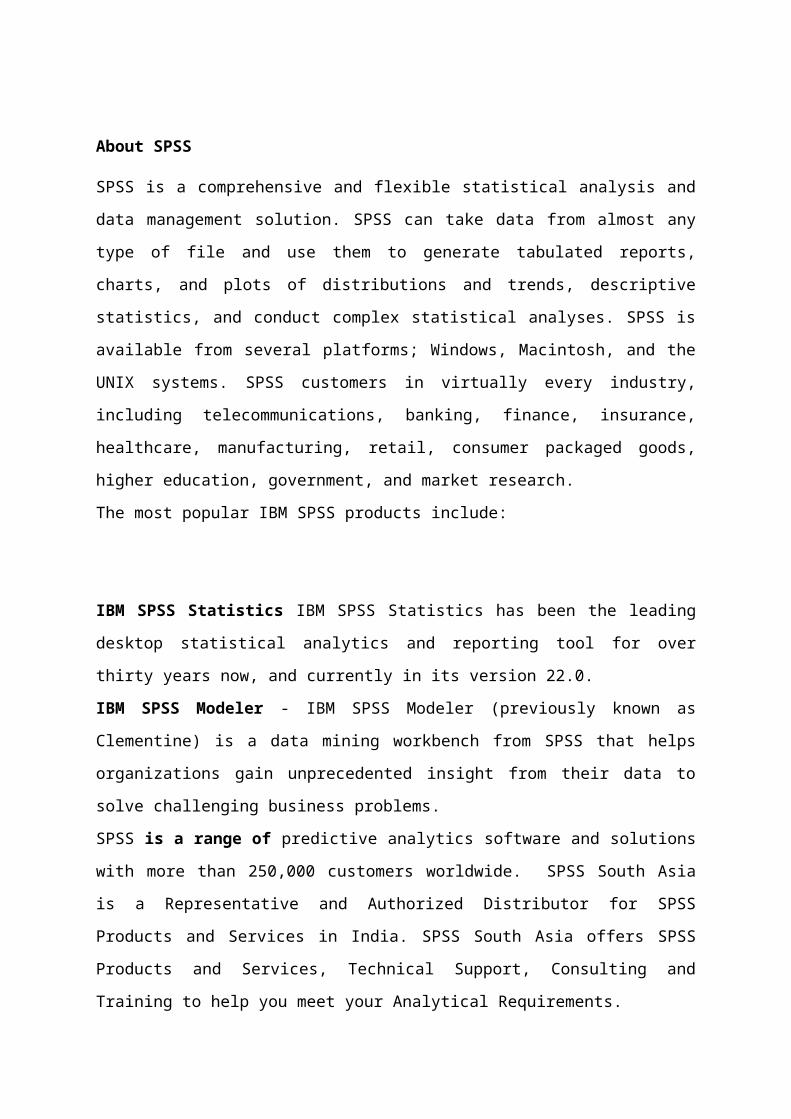
“SPSS Training Program Report”
The training programme was organised in Department of Mechanical
Engineering from 22nd June -24th June, 2015. The details are as under. It was
well appreciated by the participants. The programme details are as under:
Name of Training Programme SPSS
Date 22nd June- 24th June, 2015
Time 9.00AM. to 5.00PM.
Venue SPCE, Mechanical Department,
Room No. 213 (Research Lab)
Name of Trainer Mr. Subramanya K.
Name of Department Mechanical Department
Name of Coordinator Dr. S. B. Rane
No of Participants 13
Type of participants attended UG, PG, Ph.D student, Faculty Members.
About SPSS
SPSS is a comprehensive and flexible statistical analysis and data management solution.
SPSS can take data from almost any type of file and use them to generate tabulated reports,
charts, and plots of distributions and trends, descriptive statistics, and conduct complex
statistical analyses. SPSS is available from several platforms; Windows, Macintosh, and the
UNIX systems. SPSS customers in virtually every industry, including telecommunications,
banking, finance, insurance, healthcare, manufacturing, retail, consumer packaged goods,
higher education, government, and market research.
The most popular IBM SPSS products include:
IBM SPSS Statistics IBM SPSS Statistics has been the leading desktop statistical analytics
and reporting tool for over thirty years now, and currently in its version 22.0.
IBM SPSS Modeler - IBM SPSS Modeler (previously known as Clementine) is a data
mining workbench from SPSS that helps organizations gain unprecedented insight from their
data to solve challenging business problems.
SPSS is a range of predictive analytics software and solutions with more than 250,000
customers worldwide. SPSS South Asia is a Representative and Authorized Distributor for
SPSS Products and Services in India. SPSS South Asia offers SPSS Products and Services,
Technical Support, Consulting and Training to help you meet your Analytical Requirements.
Objectives of Program
Demonstration of SPSS as a data analysis tool.
To analyse and reorganize information using SPSS.
To integrate information and build models using SPSS.
To carry out inferential statistical analysis using SPSS.
To effectively summarize research findings and represent them graphically using
SPSS.
Program Contents
Data preparation, validation, selection
Descriptive statistics
Graphical representation of data
Tabular representation of data
Regression analysis, linear, multi linear
Chi square Test
T- test, ANOVA
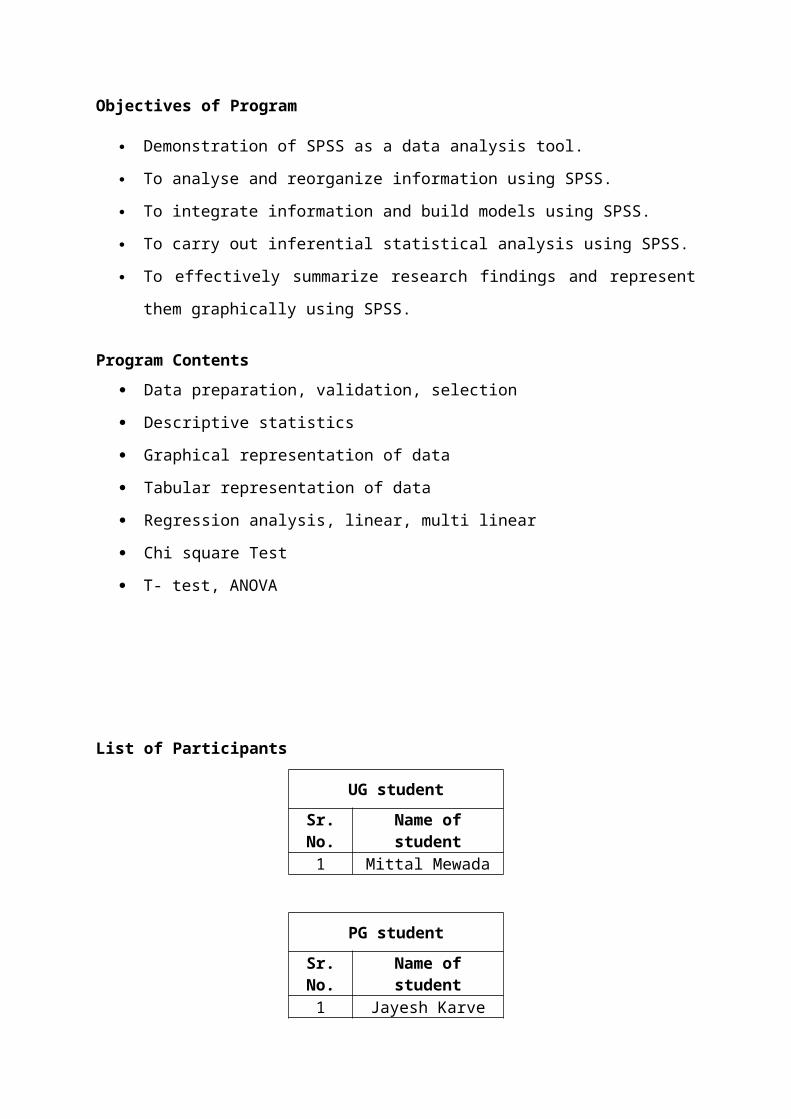
List of Participants
UG student
Sr. No. Name of student1 Mittal Mewada
PG student
Sr. No. Name of student1 Jayesh Karve2 Rohini Gedam3 Vajir Ashish4 Pankaj dhobale5 Atul Sonawane6 Ranjit Patil7 Jaswin Mali8 Akshay Kusneniwar9 Sagar Patil
Ph.D student
Sr. No. Name of student1 P.D. Deshmukh
Faculty members
Sr. No. Name of student1 Greegory Mathew2 Prathamesh Potdar
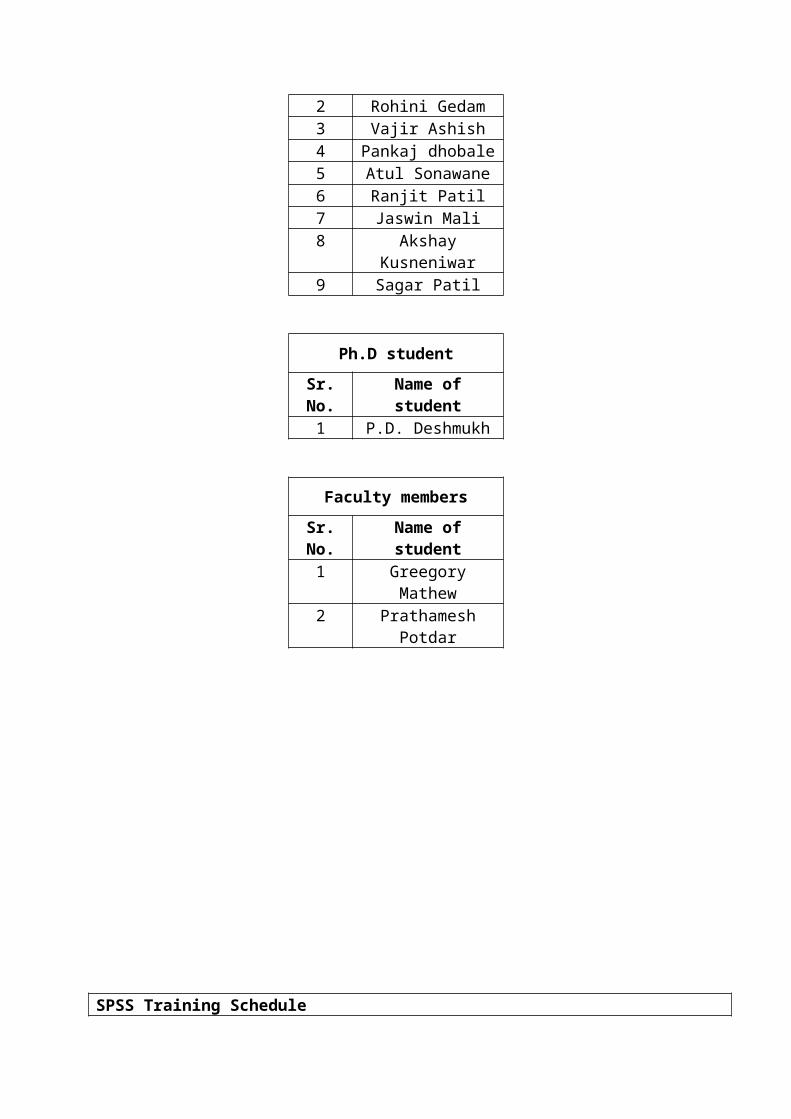
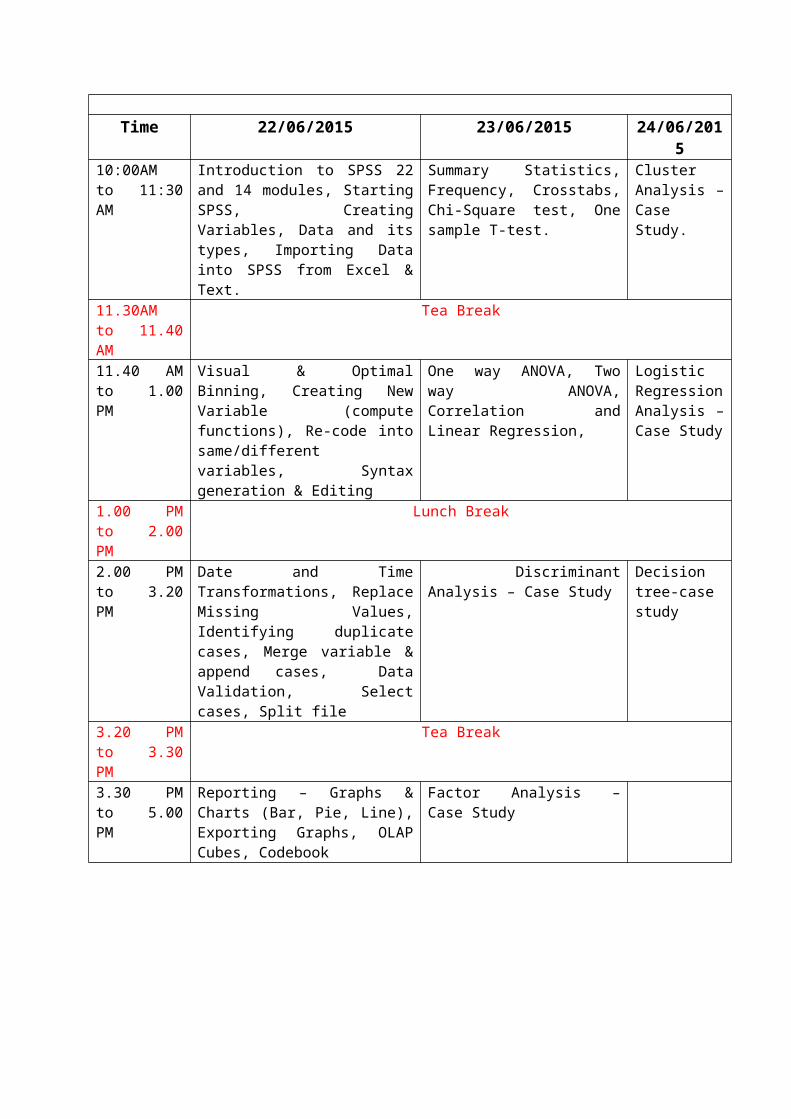
SPSS Training Schedule
Time 22/06/2015 23/06/2015 24/06/201510:00AM to 11:30 AM
Introduction to SPSS 22 and 14 modules, Starting SPSS, Creating Variables, Data and its types, Importing Data into SPSS from Excel & Text.
Summary Statistics, Frequency, Crosstabs, Chi-Square test, One sample T-test.
Cluster Analysis – Case Study.
11.30AM to 11.40 AM
Tea Break
11.40 AM to 1.00 PM
Visual & Optimal Binning, Creating New Variable (compute functions), Re-code into same/different variables, Syntax generation & Editing
One way ANOVA, Two way ANOVA, Correlation and Linear Regression,
Logistic Regression Analysis – Case Study
1.00 PM to 2.00 PM
Lunch Break
2.00 PM to 3.20 PM
Date and Time Transformations, Replace Missing Values, Identifying duplicate cases, Merge variable & append cases, Data Validation, Select cases, Split file
Discriminant Analysis – Case Study
Decision tree-case study
3.20 PM to 3.30 PM
Tea Break
3.30 PM to 5.00 PM
Reporting – Graphs & Charts (Bar, Pie, Line), Exporting Graphs, OLAP Cubes, Codebook
Factor Analysis – Case Study
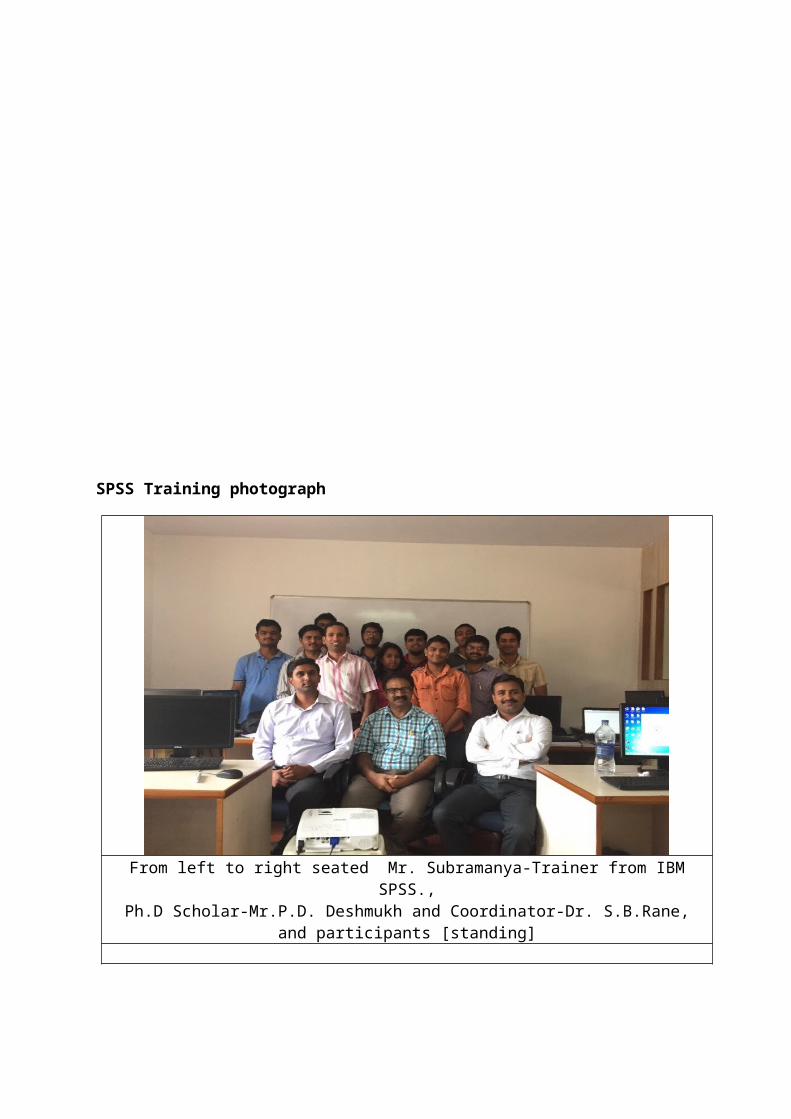
SPSS Training photograph
From left to right seated Mr. Subramanya-Trainer from IBM SPSS., Ph.D Scholar-Mr.P.D. Deshmukh and Coordinator-Dr. S.B.Rane, and participants [standing]
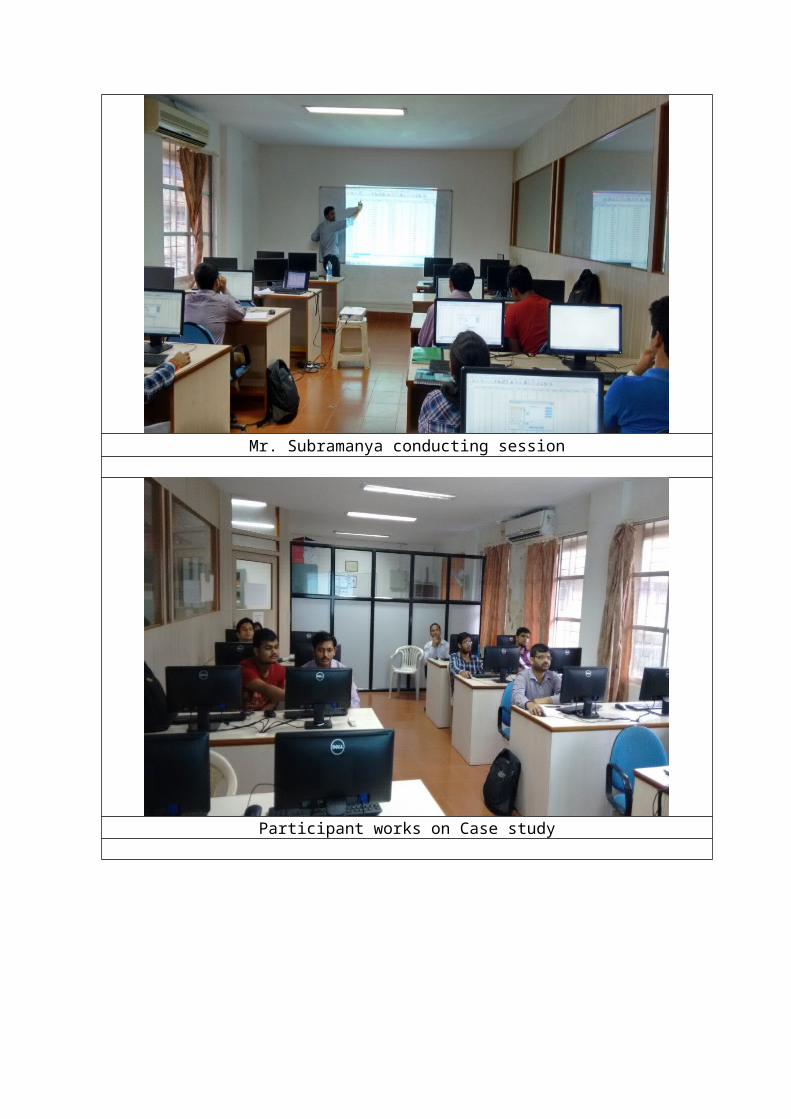
Mr. Subramanya conducting session
Participant works on Case study
Mr. Subramanya conducting session
Mr. Subramanya conducting session