Embed Size (px)
Citation preview
TRAINING ON COMPUTABLE
GENERAL EQUILIBRIUM MODELLING
MODEL AUTETA
A CLOSED ECONOMY WITH
GOVERNMENT
This pedagogical material was developed by Véronique Robichaud and
accompanies Lesson 6. The model used is an adaptation of the model AUTETA
presented in: Decaluwé, B., A. Martens and L. Savard (2001), « La politique
économique du développement et les modèles d'équilibre général calculable.
Une introduction », Montréal, Presses de l'Université de Montréal, 524 p. Since the
SAM has been changed, the simulation results cannot be compared.
1
Table of content
Hypotheses ........................................................................................................................ 2
Sets ...................................................................................................................................... 2
Equations ........................................................................................................................... 3
Variables ............................................................................................................................ 5
Parameters ........................................................................................................................ 7
The social accounting matrix for AUTETA ...................................................................... 8
Correspondence between the SAM and the model ................................................. 9
Schema ............................................................................................................................ 10
GAMS Code .................................................................................................................... 11
Value of parameters ...................................................................................................... 18
Simulations ....................................................................................................................... 20
2
Hypotheses
Model of a closed economy with government
Four industries / commodities:
o Agriculture;
o Manufacturing;
o Services;
o Public administrations
Two factors of production:
o Labour (mobile across sectors)
o Capital (fixed by sector)
Two categories of households:
o Salaried households;
o Capitalists.
Sets
Industries and commodities
PUBSERMANAGRIji ,,,,
(AGR: agriculture, MAN: manufacturing, SER: services, PUB: public administrations)
Tradable commodities and industries (excluding public administrations)
SERMANAGRITRtr ,,
(AGR: agriculture, MAN: manufacturing, SER: services)
Sub-set of tradable industries and commodities excluding services:
MANAGRTRBNSbns ,
Households
CAPSALHh ,
(SAL: salaried, CAP: capitalists)
3
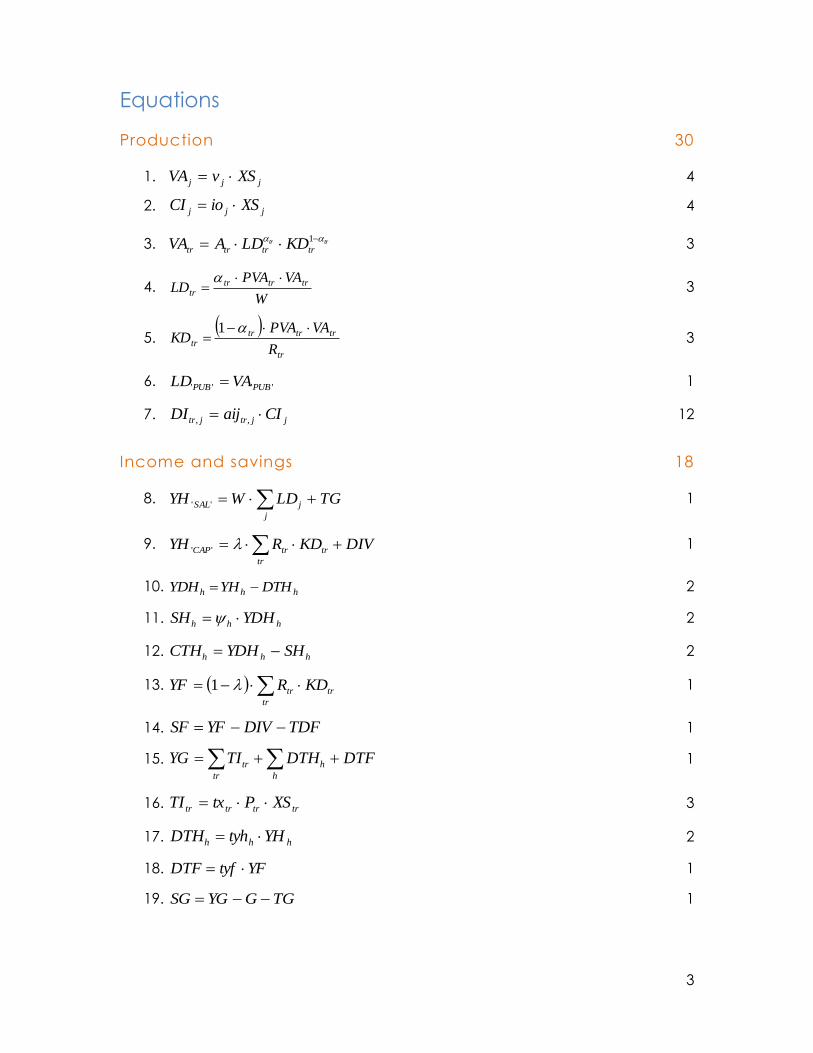
Equations
Production 30
1. jjj XSvVA 4
2. jjj XSioCI 4
3. trtr
trtrtrtr KDLDAVA
1
3
4. W
VAPVALD trtrtr
tr
3
5.
tr
trtrtrtr
R
VAPVAKD
1 3
6. '''' PUBPUB VALD 1
7. jjtrjtr CIaijDI ,, 12
Income and savings 18
8. TGLDWYHj
jSAL '' 1
9. DIVKDRYHtr
trtrCAP '' 1
10. hhh DTHYHYDH 2
11. hhh YDHSH 2
12. hhh SHYDHCTH 2
13. tr
trtr KDRYF 1 1
14. TDFDIVYFSF 1
15. DTFDTHTIYGh
h
tr
tr 1
16. trtrtrtr XSPtxTI 3
17. hhh YHtyhDTH 2
18. YFtyfDTF 1
19. TGGYGSG 1

4
Demand 12
20. tr
hhtr
htrPD
CTHC
,
,
6
21. tr
trtr
PD
ITINV
3
22. j
jtrtr DIDIT , 3
Prices 12
23. WPVA PUB '' 1
24. j
tr
jtrtr
jCI
DIPD
PCI
,
4
25. j
jjjj
jXS
CIPCIVAPVAP
4
26. trtrtr PtxPD 1 3
Equil ibrium 8
27. bnsbns
h
bnshbns INVDITCXS , 2
28. ''
''
PUB
PUBP
GXS 1
29. j
jLDLS 1
30. trtr KDKS 3
31. SGSFSHITh
h 1
Verification of the Walras’ law
32. ''''',''' SERSER
h
SERhSER INVDITCXSLEON 1
Total: 81

5
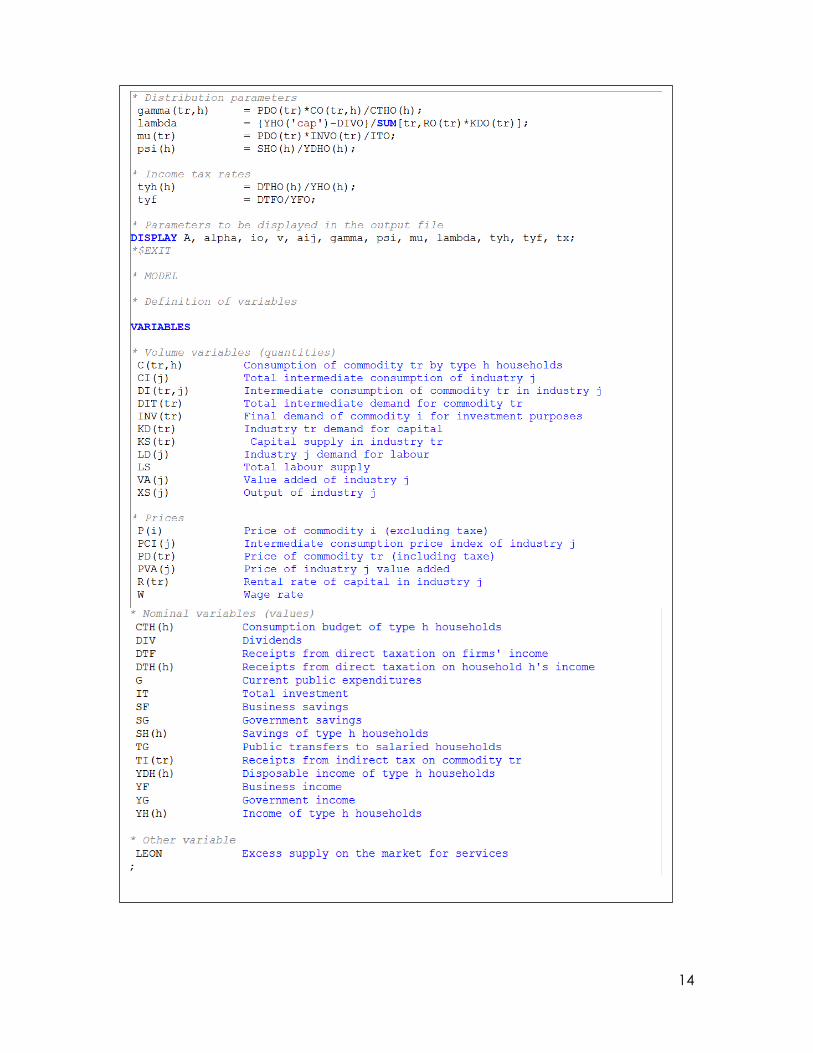
Variables
Volume variables (quantities) 47
:,htrC Consumption of commodity tr by type h households 6
:jCI Total intermediate consumption of industry j 4
:, jtrDI Intermediate consumption of commodity tr in industry j 12
:trDIT Total intermediate demand for commodity tr 3
:trINV Final demand of commodity tr for investment purposes 3
:trKD Industry tr demand for capital 3
:trKS Capital supply in industry tr 3
:jLD Industry j demand for labour 4
:LS Total labour supply 1
:jVA Value added of industry j 4
:jXS Output of industry j 4
Prices 19
:iP Price of commodity i (excluding taxes) 4
:jPCI Intermediate consumption price index of industry j 4
:trPD Price of commodity tr (including taxes) 3
:jPVA Price of industry j value added 4
:trR Rental rate of capital in industry tr 3
:W Wage rate 1
Nominal variables (values) 22
:hCTH Consumption budget of type h households 2
:DIV Dividends 1
:DTF Receipts from direct taxation on firms' income 1
:hDTH Receipts from direct taxation on household h income 2
:G Current public expenditures 1
:IT Total investment 1
:SF Business savings 1

6
:SG Government savings 1
:hSH Savings of type h households 2
:TG Public transfers to salaried households 1
:trTI Receipts from indirect tax on commodity tr 3
:hYDH Disposable income of type h households 2
:YF Business income 1
:YG Government income 1
:hYH Income of type h households 2
Other variables 1
:LEON Excess supply on the market for services 1
Total: 89
Exogenous variables (closures) Number
:DIV Dividends 1
:G Current public expenditures 1
:trKS Capital supply in industry tr 3
:LS Total labour supply 1
:agrP Price of commodity agr – numéraire 1
:TG Public transfers to salaried households 1
Total: 8

7
Parameters
:trA Scale parameter (Cobb-Douglas – production function)
:, jtraij Coefficient (Leontief - intermediate consumption)
:tr Elasticity (Cobb-Douglas – production function)
:,htr Share of commodity tr in type h household consumption budget
:jio Coefficient (Leontief – total intermediate consumption)
: Share of capital income received by capitalists
:tr Share of commodity tr in total investment expenditures
:h Average propensity to save of type h household
:trtx Indirect tax rate on commodity tr
:tyf Direct tax rate on firms' income
:htyh Direct tax rate on household h income
:jv Coefficient (Leontief – value added)

8
The social accounting matrix for AUTETA
FACTORS AGENTS INDUSTRIES COMMODITIES ACC. TOTAL
1. 2. 3. 4. 5. 6. 7. 8. 9. 10. 11. 12. 13. 14. 15. (1 to 15)
1. Labour
300 100 200 150 750
2. Capital
100 150 100 350
3. Salaried households 750
50
800
4. Capitalists
210
70
280
5. Firms
140
140
6. Government 40 28 7 10 25 15 125
7. Agriculture
500 500
8. Manufacturing
625 625
9. Services
600 600
10. Public administrations 200 200
11. Agriculture
162 21
50 150 90 10 27 510
12. Manufacturing
108 84
20 150 90 25 173 650
13. Services
270 105
30 75 120 15 615
14. Public administrations 200 200
15. Accumulation
220 42 63 -125
200
Total (1 to 15) 750 350 800 280 140 125 500 625 600 200 510 650 615 200 200

9
Correspondence between the SAM and the model
j
jLDW jLDW
j
jLDW
tr
trtr KDR
TG DIV
hYH tr
trtrKDR
tr
trtrKDR1
hDTH
trTI
jj XSP
jj XSP
YF
YG
htrtr CPD , jtrtr DIPD ,
trtr INVPD
trtr XSPD
trtr KDR
'''' PUBPUB XSP
IT
DTF
j
jLDW
tr
trtr KDR
G
SG
hYH YF YG
hSH
SF

10
Schema

11
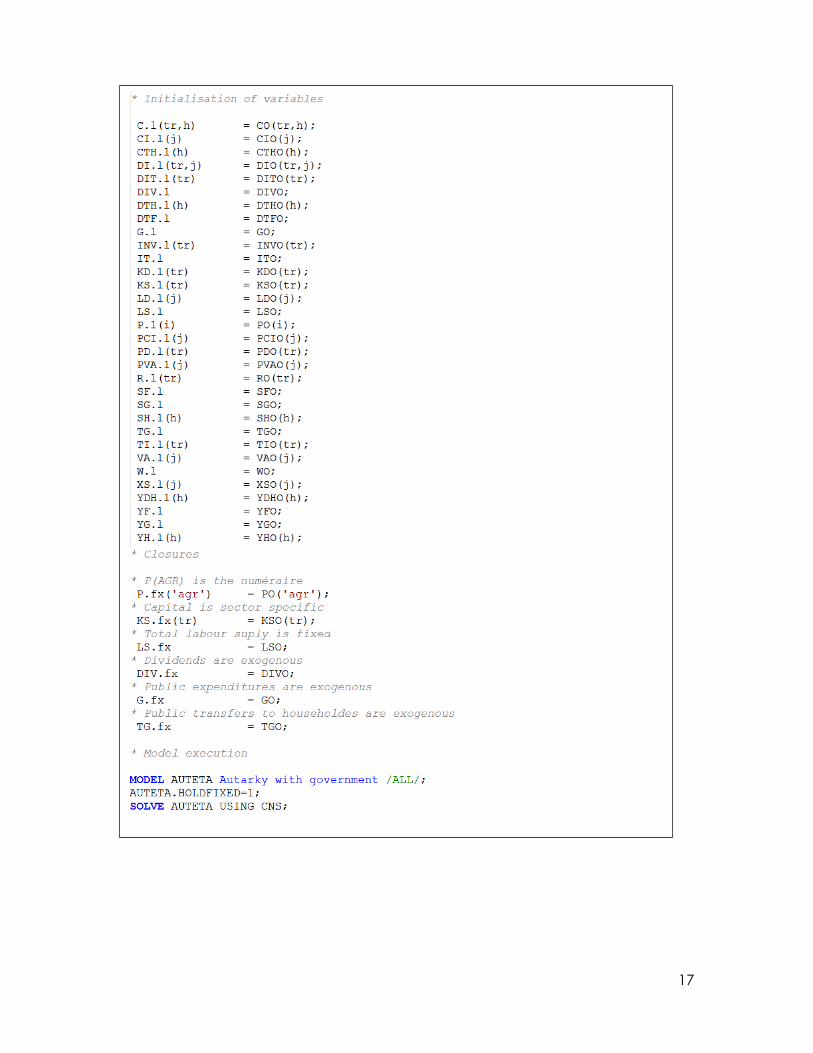
GAMS Code
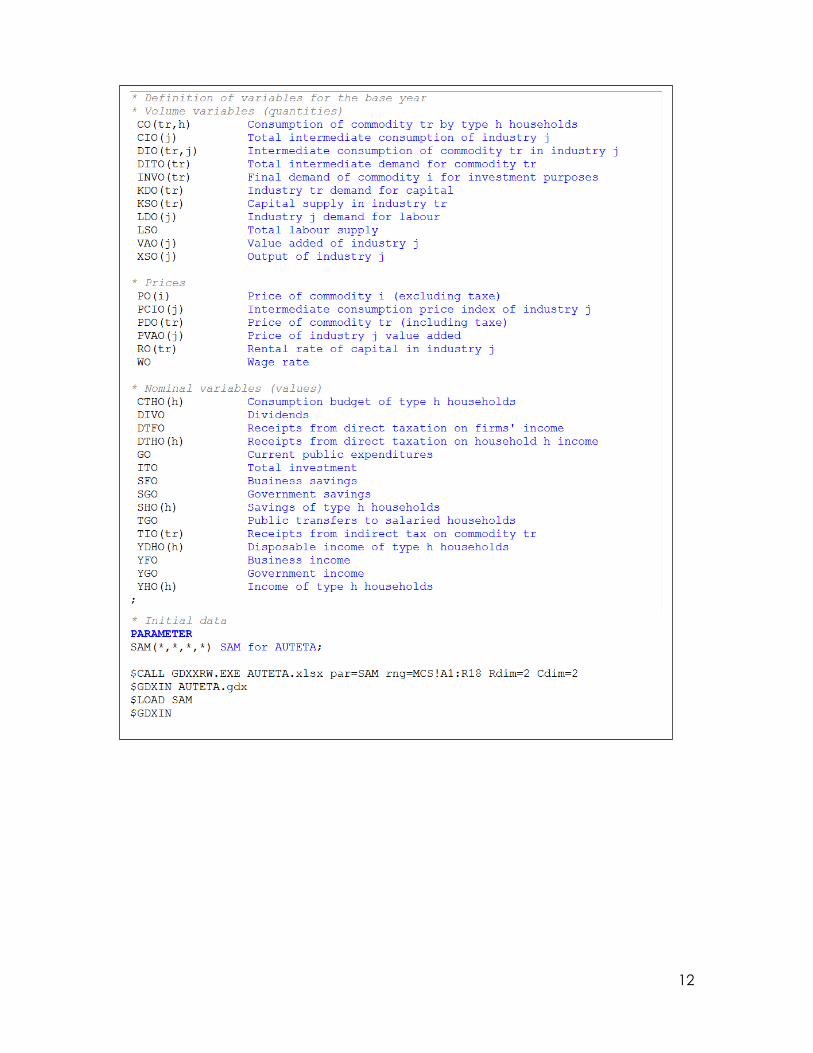
12
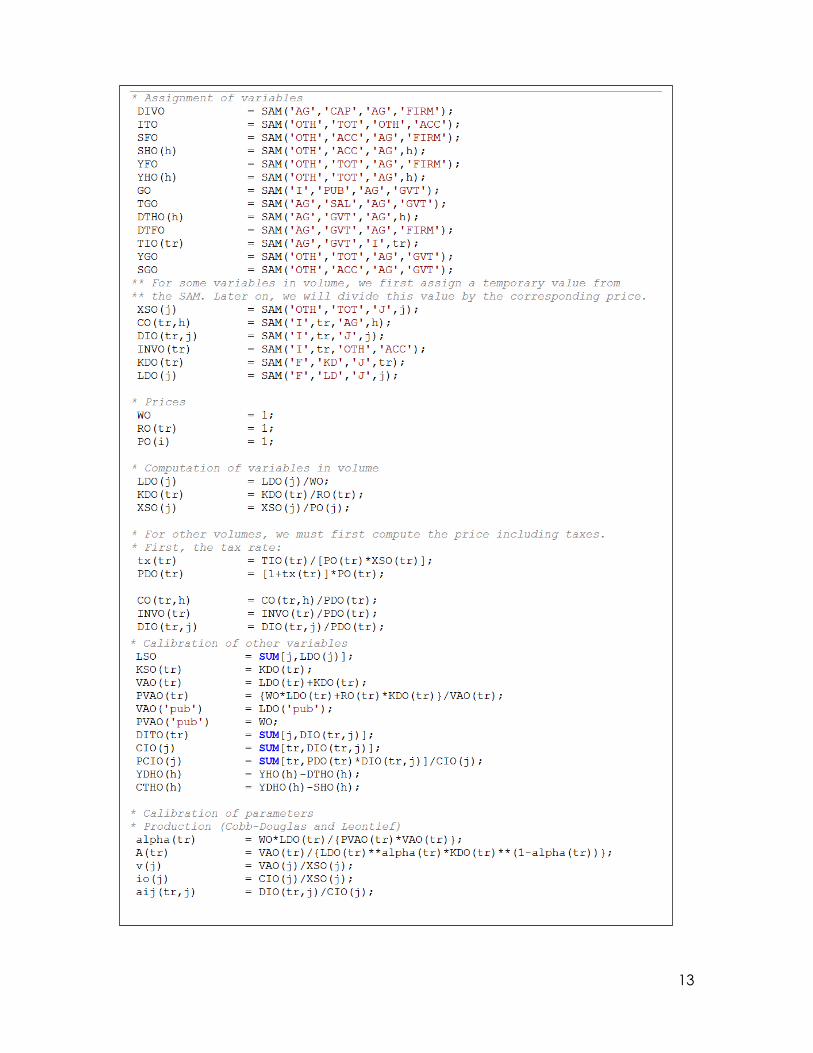
13
14

15

16
17

18
Value of parameters Definition Symbol Value
Scale parameter – Cobb-Douglas Aagr 1.755
Aman 1.960
Aser 1.890
Intermediate consumption coefficient – Leontief aijagr,agr 0.503
aijman,agr 0.197
aijser,agr 0.300
aijagr,man 0.403
aijman,man 0.396
aijser,man 0.201
aijagr,ser 0.302
aijman,ser 0.297
aijser,ser 0.401
aijagr,pub 0.202
aijman,pub 0.496
aijser,pub 0.302
Elasticity – Cobb-Douglas agr 0.750
man 0.400
ser 0.667
Share of commodity in the consumption budget of salaried
households agr,sal 0.300
man,sal 0.200
ser,sal 0.500
Share of commodity in the consumption budget of
capitalists households agr,cap 0.100
man,cap 0.400
ser,cap 0.500
Total intermediate consumption coefficient – Leontief ioagr 0.195
ioman 0.583
ioser 0.486
iopub 0.242
Share of capital income to capitalists 0.600
Share of commodity in total investment expenditures agr 0.135
man 0.865
serl
Propensity to save sal 0.289
cap 0.167
Value-added coefficient – Leontief vagr 0.800
vman 0.400
vser 0.500
vpub 0.750
19
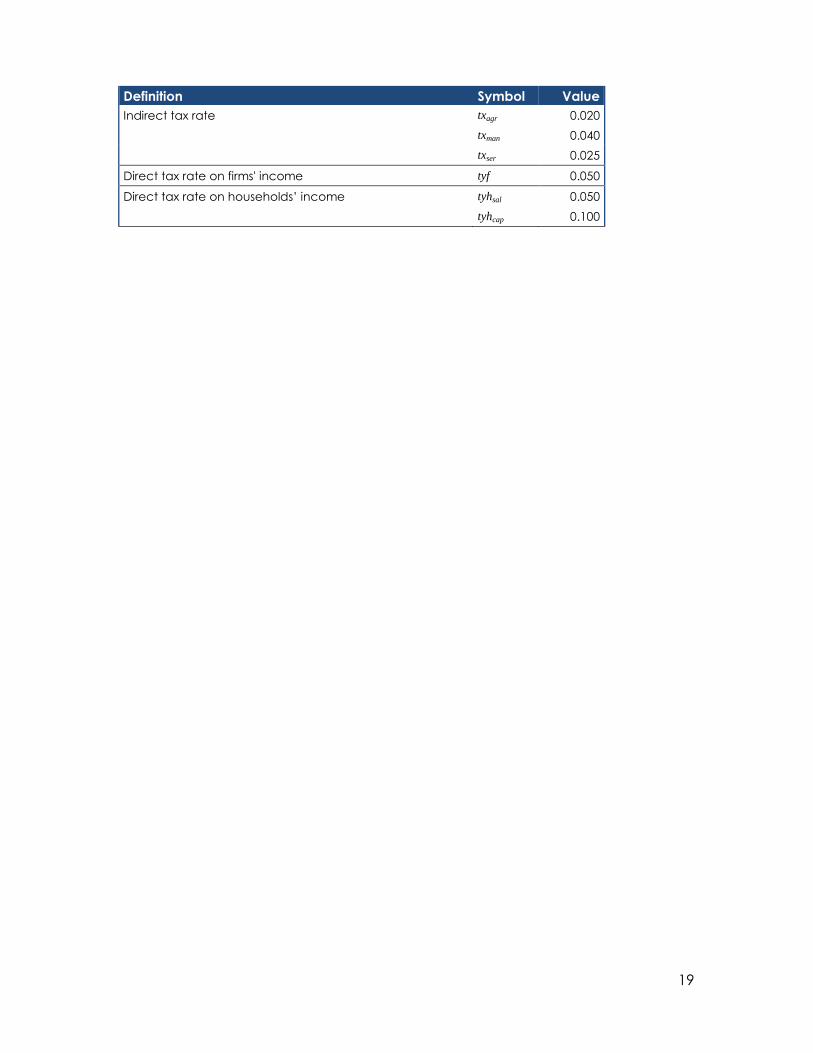
Definition Symbol Value
Indirect tax rate txagr 0.020
txman 0.040
txser 0.025
Direct tax rate on firms' income tyf 0.050
Direct tax rate on households’ income tyhsal 0.050
tyhcap 0.100
20
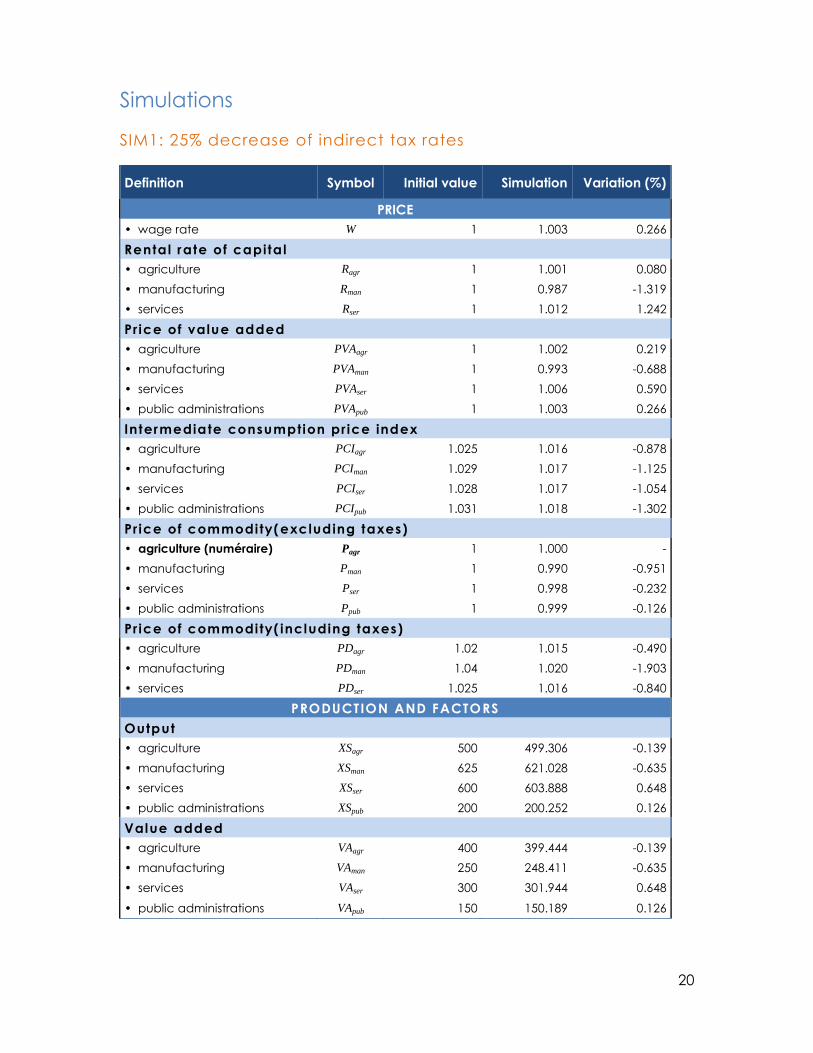
Simulations
SIM1: 25% decrease of indirect tax rates
Definition Symbol Initial value Simulation Variation (%)
PRICE
• wage rate W 1 1.003 0.266
Rental rate of capital
• agriculture Ragr 1 1.001 0.080
• manufacturing Rman 1 0.987 -1.319
• services Rser 1 1.012 1.242
Price of value added
• agriculture PVAagr 1 1.002 0.219
• manufacturing PVAman 1 0.993 -0.688
• services PVAser 1 1.006 0.590
• public administrations PVApub 1 1.003 0.266
Intermediate consumption pr ice index
• agriculture PCIagr 1.025 1.016 -0.878
• manufacturing PCIman 1.029 1.017 -1.125
• services PCIser 1.028 1.017 -1.054
• public administrations PCIpub 1.031 1.018 -1.302
Price of commodity(excluding taxes)
• agriculture (numéraire) Pagr 1 1.000 -
• manufacturing Pman 1 0.990 -0.951
• services Pser 1 0.998 -0.232
• public administrations Ppub 1 0.999 -0.126
Price of commodity( including taxes)
• agriculture PDagr 1.02 1.015 -0.490
• manufacturing PDman 1.04 1.020 -1.903
• services PDser 1.025 1.016 -0.840
PRODUCTION AND FACTORS
Output
• agriculture XSagr 500 499.306 -0.139
• manufacturing XSman 625 621.028 -0.635
• services XSser 600 603.888 0.648
• public administrations XSpub 200 200.252 0.126
Value added
• agriculture VAagr 400 399.444 -0.139
• manufacturing VAman 250 248.411 -0.635
• services VAser 300 301.944 0.648
• public administrations VApub 150 150.189 0.126
21
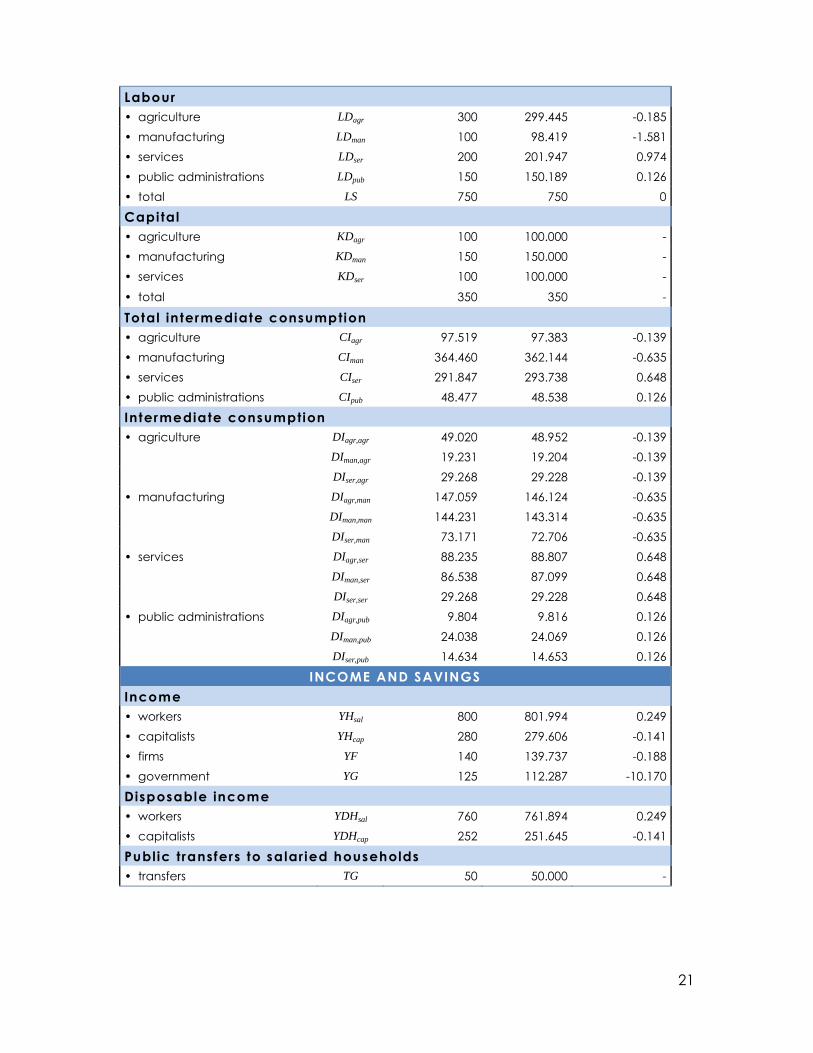
Labour
• agriculture LDagr 300 299.445 -0.185
• manufacturing LDman 100 98.419 -1.581
• services LDser 200 201.947 0.974
• public administrations LDpub 150 150.189 0.126
• total LS 750 750 0
Capital
• agriculture KDagr 100 100.000 -
• manufacturing KDman 150 150.000 -
• services KDser 100 100.000 -
• total
350 350 -
Total intermediate consumption
• agriculture CIagr 97.519 97.383 -0.139
• manufacturing CIman 364.460 362.144 -0.635
• services CIser 291.847 293.738 0.648
• public administrations CIpub 48.477 48.538 0.126
Intermediate consumption
• agriculture DIagr,agr 49.020 48.952 -0.139
DIman,agr 19.231 19.204 -0.139
DIser,agr 29.268 29.228 -0.139
• manufacturing DIagr,man 147.059 146.124 -0.635
DIman,man 144.231 143.314 -0.635
DIser,man 73.171 72.706 -0.635
• services DIagr,ser 88.235 88.807 0.648
DIman,ser 86.538 87.099 0.648
DIser,ser 29.268 29.228 0.648
• public administrations DIagr,pub 9.804 9.816 0.126
DIman,pub 24.038 24.069 0.126
DIser,pub 14.634 14.653 0.126
INCOME AND SAVINGS
Income
• workers YHsal 800 801.994 0.249
• capitalists YHcap 280 279.606 -0.141
• firms YF 140 139.737 -0.188
• government YG 125 112.287 -10.170
Disposable income
• workers YDHsal 760 761.894 0.249
• capitalists YDHcap 252 251.645 -0.141
Public transfers to salar ied households
• transfers TG 50 50.000 -
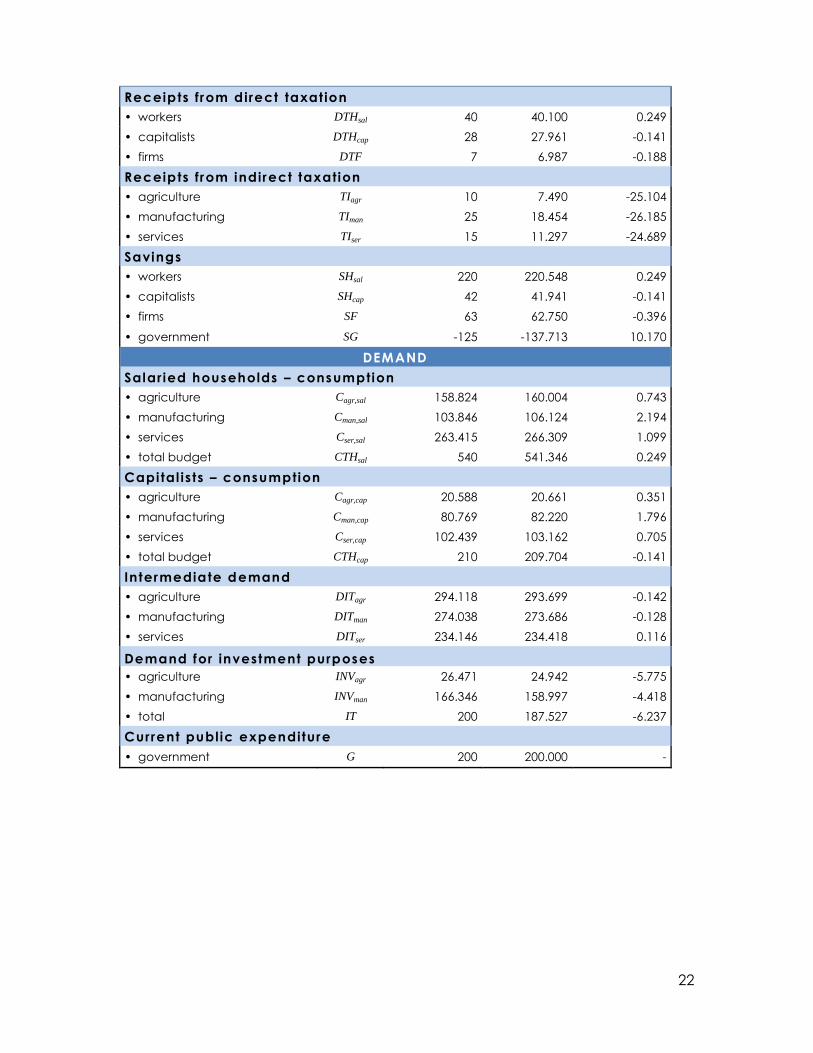
22
Receipts from direct taxat ion
• workers DTHsal 40 40.100 0.249
• capitalists DTHcap 28 27.961 -0.141
• firms DTF 7 6.987 -0.188
Receipts from indirect taxation
• agriculture TIagr 10 7.490 -25.104
• manufacturing TIman 25 18.454 -26.185
• services TIser 15 11.297 -24.689
Savings
• workers SHsal 220 220.548 0.249
• capitalists SHcap 42 41.941 -0.141
• firms SF 63 62.750 -0.396
• government SG -125 -137.713 10.170
DEMAND
Salar ied households – consumption
• agriculture Cagr,sal 158.824 160.004 0.743
• manufacturing Cman,sal 103.846 106.124 2.194
• services Cser,sal 263.415 266.309 1.099
• total budget CTHsal 540 541.346 0.249
Capital ists – consumption
• agriculture Cagr,cap 20.588 20.661 0.351
• manufacturing Cman,cap 80.769 82.220 1.796
• services Cser,cap 102.439 103.162 0.705
• total budget CTHcap 210 209.704 -0.141
Intermediate demand
• agriculture DITagr 294.118 293.699 -0.142
• manufacturing DITman 274.038 273.686 -0.128
• services DITser 234.146 234.418 0.116
Demand for investment purposes
• agriculture INVagr 26.471 24.942 -5.775
• manufacturing INVman 166.346 158.997 -4.418
• total IT 200 187.527 -6.237
Current public expenditure
• government G 200 200.000 -
23
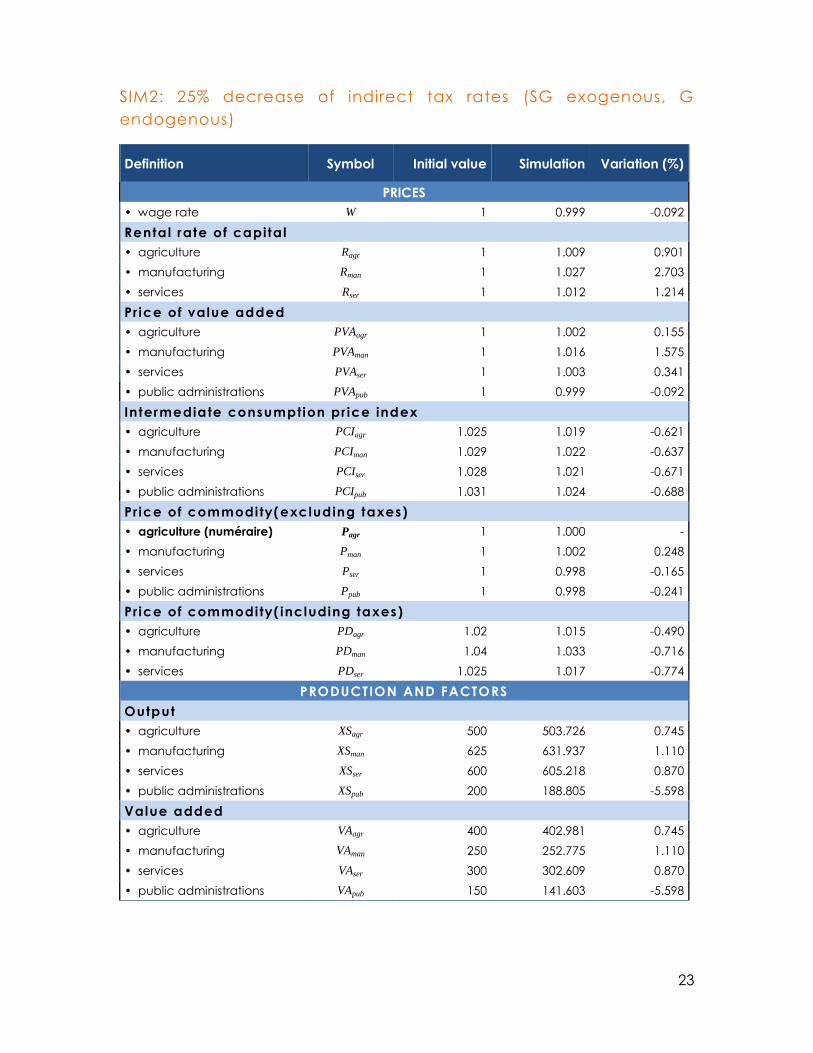
SIM2: 25% decrease of indirect tax rates (SG exogenous, G
endogenous)
Definition Symbol Initial value Simulation Variation (%)
PRICES
• wage rate W 1 0.999 -0.092
Rental rate of capital
• agriculture Ragr 1 1.009 0.901
• manufacturing Rman 1 1.027 2.703
• services Rser 1 1.012 1.214
Price of value added
• agriculture PVAagr 1 1.002 0.155
• manufacturing PVAman 1 1.016 1.575
• services PVAser 1 1.003 0.341
• public administrations PVApub 1 0.999 -0.092
Intermediate consumption pr ice index
• agriculture PCIagr 1.025 1.019 -0.621
• manufacturing PCIman 1.029 1.022 -0.637
• services PCIser 1.028 1.021 -0.671
• public administrations PCIpub 1.031 1.024 -0.688
Price of commodity(excluding taxes)
• agriculture (numéraire) Pagr 1 1.000 -
• manufacturing Pman 1 1.002 0.248
• services Pser 1 0.998 -0.165
• public administrations Ppub 1 0.998 -0.241
Price of commodity( including taxes)
• agriculture PDagr 1.02 1.015 -0.490
• manufacturing PDman 1.04 1.033 -0.716
• services PDser 1.025 1.017 -0.774
PRODUCTION AND FACTORS
Output
• agriculture XSagr 500 503.726 0.745
• manufacturing XSman 625 631.937 1.110
• services XSser 600 605.218 0.870
• public administrations XSpub 200 188.805 -5.598
Value added
• agriculture VAagr 400 402.981 0.745
• manufacturing VAman 250 252.775 1.110
• services VAser 300 302.609 0.870
• public administrations VApub 150 141.603 -5.598
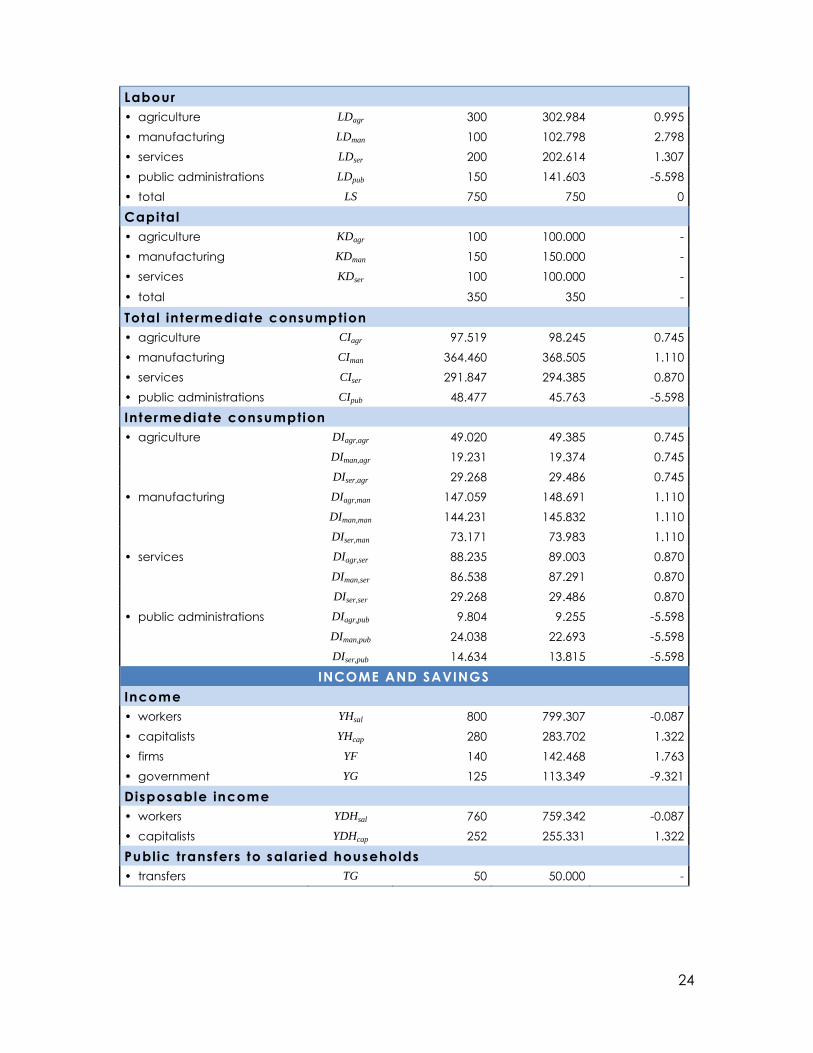
24
Labour
• agriculture LDagr 300 302.984 0.995
• manufacturing LDman 100 102.798 2.798
• services LDser 200 202.614 1.307
• public administrations LDpub 150 141.603 -5.598
• total LS 750 750 0
Capital
• agriculture KDagr 100 100.000 -
• manufacturing KDman 150 150.000 -
• services KDser 100 100.000 -
• total
350 350 -
Total intermediate consumption
• agriculture CIagr 97.519 98.245 0.745
• manufacturing CIman 364.460 368.505 1.110
• services CIser 291.847 294.385 0.870
• public administrations CIpub 48.477 45.763 -5.598
Intermediate consumption
• agriculture DIagr,agr 49.020 49.385 0.745
DIman,agr 19.231 19.374 0.745
DIser,agr 29.268 29.486 0.745
• manufacturing DIagr,man 147.059 148.691 1.110
DIman,man 144.231 145.832 1.110
DIser,man 73.171 73.983 1.110
• services DIagr,ser 88.235 89.003 0.870
DIman,ser 86.538 87.291 0.870
DIser,ser 29.268 29.486 0.870
• public administrations DIagr,pub 9.804 9.255 -5.598
DIman,pub 24.038 22.693 -5.598
DIser,pub 14.634 13.815 -5.598
INCOME AND SAVINGS
Income
• workers YHsal 800 799.307 -0.087
• capitalists YHcap 280 283.702 1.322
• firms YF 140 142.468 1.763
• government YG 125 113.349 -9.321
Disposable income
• workers YDHsal 760 759.342 -0.087
• capitalists YDHcap 252 255.331 1.322
Public transfers to salar ied households
• transfers TG 50 50.000 -
25
Receipts from direct taxat ion
• workers DTHsal 40 39.965 -0.087
• capitalists DTHcap 28 28.370 1.322
• firms DTF 7 7.123 1.763
Receipts from indirect taxation
• agriculture TIagr 10 7.556 -24.441
• manufacturing TIman 25 19.005 -23.980
• services TIser 15 11.329 -24.473
Savings
• workers SHsal 220 219.809 -0.087
• capitalists SHcap 42 42.555 1.322
• firms SF 63 65.344 3.721
• government SG -125 -125.000 -
DEMAND
Salar ied households – consumption
• agriculture Cagr,sal 158.824 159.468 0.406
• manufacturing Cman,sal 103.846 104.505 0.634
• services Cser,sal 263.415 265.239 0.693
• total budget CTHsal 540 539.532 -0.087
Capital ists – consumption
• agriculture Cagr,cap 20.588 20.963 1.821
• manufacturing Cman,cap 80.769 82.427 2.053
• services Cser,cap 102.439 104.603 2.112
• total budget CTHcap 210 212.776 1.322
Intermediate demand
• agriculture DITagr 294.118 296.334 0.753
• manufacturing DITman 274.038 275.189 0.420
• services DITser 234.146 235.375 0.525
Demand for investment purposes
• agriculture INVagr 26.471 26.961 1.854
• manufacturing INVman 166.346 169.815 2.086
• total IT 200 202.709 1.354
Current public expenditure
• government G 200 188.349 -5.826
26
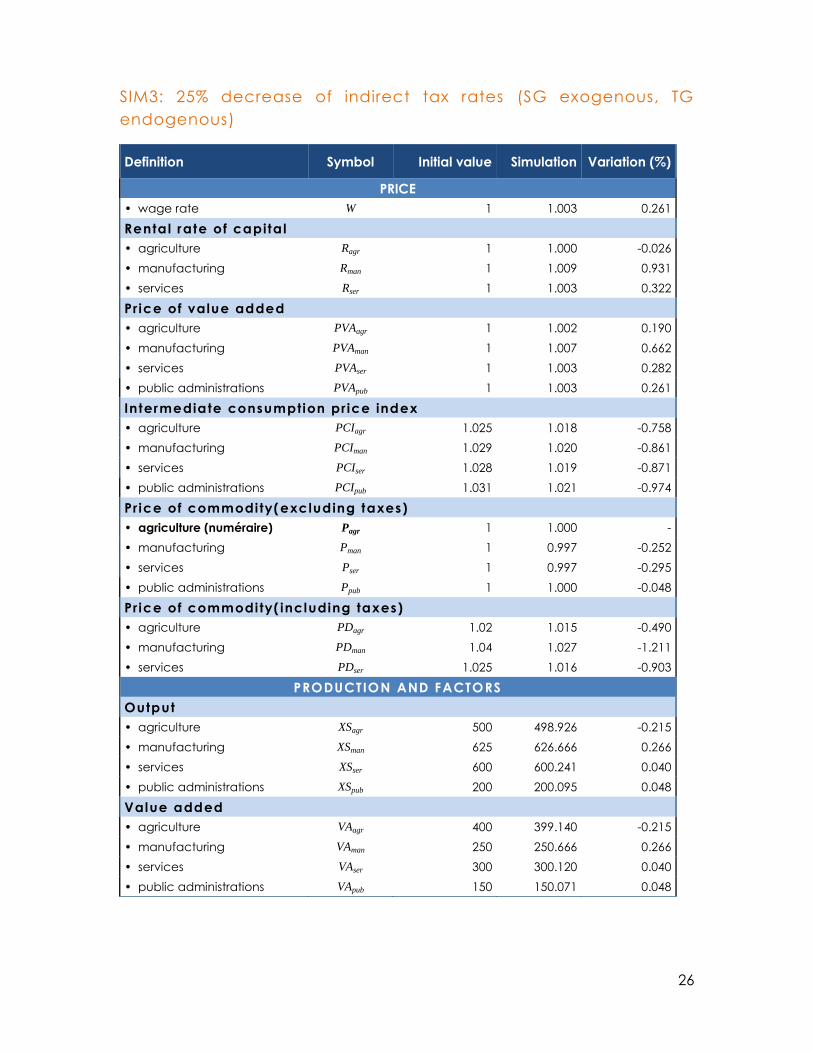
SIM3: 25% decrease of indirect tax rates (SG exogenous, TG
endogenous)
Definition Symbol Initial value Simulation Variation (%)
PRICE
• wage rate W 1 1.003 0.261
Rental rate of capital
• agriculture Ragr 1 1.000 -0.026
• manufacturing Rman 1 1.009 0.931
• services Rser 1 1.003 0.322
Price of value added
• agriculture PVAagr 1 1.002 0.190
• manufacturing PVAman 1 1.007 0.662
• services PVAser 1 1.003 0.282
• public administrations PVApub 1 1.003 0.261
Intermediate consumption pr ice index
• agriculture PCIagr 1.025 1.018 -0.758
• manufacturing PCIman 1.029 1.020 -0.861
• services PCIser 1.028 1.019 -0.871
• public administrations PCIpub 1.031 1.021 -0.974
Price of commodity(excluding taxes)
• agriculture (numéraire) Pagr 1 1.000 -
• manufacturing Pman 1 0.997 -0.252
• services Pser 1 0.997 -0.295
• public administrations Ppub 1 1.000 -0.048
Price of commodity( including taxes)
• agriculture PDagr 1.02 1.015 -0.490
• manufacturing PDman 1.04 1.027 -1.211
• services PDser 1.025 1.016 -0.903
PRODUCTION AND FACTORS
Output
• agriculture XSagr 500 498.926 -0.215
• manufacturing XSman 625 626.666 0.266
• services XSser 600 600.241 0.040
• public administrations XSpub 200 200.095 0.048
Value added
• agriculture VAagr 400 399.140 -0.215
• manufacturing VAman 250 250.666 0.266
• services VAser 300 300.120 0.040
• public administrations VApub 150 150.071 0.048
27
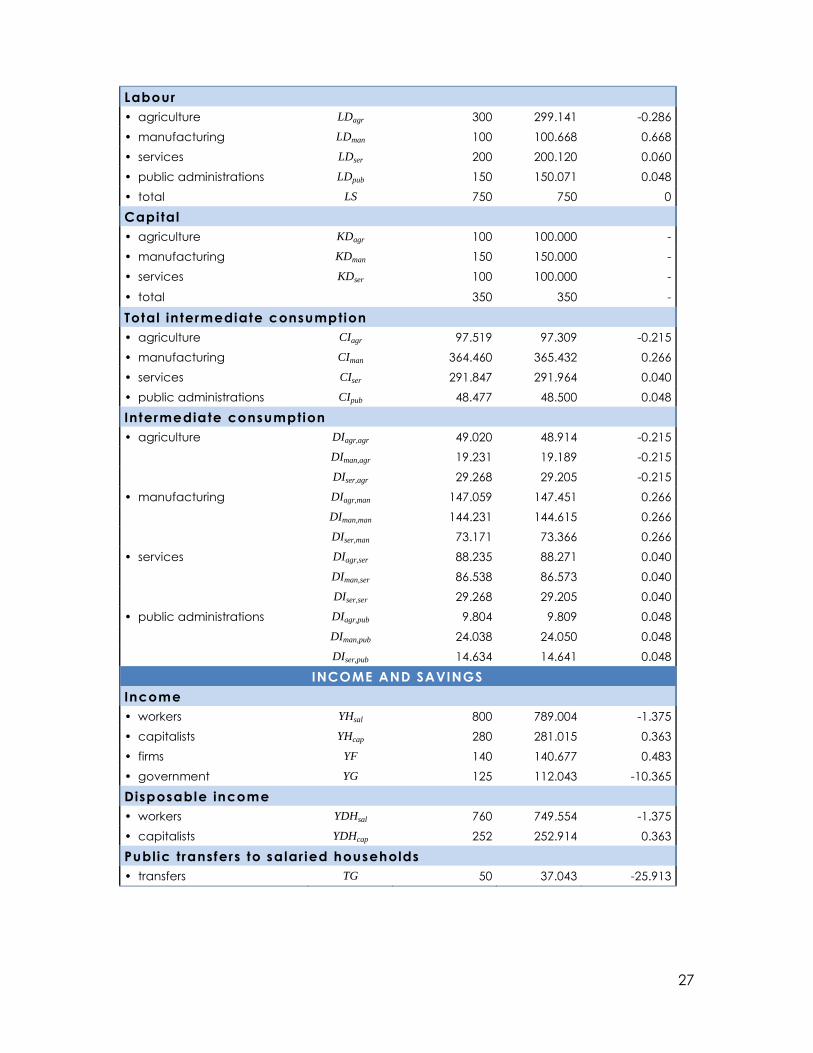
Labour
• agriculture LDagr 300 299.141 -0.286
• manufacturing LDman 100 100.668 0.668
• services LDser 200 200.120 0.060
• public administrations LDpub 150 150.071 0.048
• total LS 750 750 0
Capital
• agriculture KDagr 100 100.000 -
• manufacturing KDman 150 150.000 -
• services KDser 100 100.000 -
• total
350 350 -
Total intermediate consumption
• agriculture CIagr 97.519 97.309 -0.215
• manufacturing CIman 364.460 365.432 0.266
• services CIser 291.847 291.964 0.040
• public administrations CIpub 48.477 48.500 0.048
Intermediate consumption
• agriculture DIagr,agr 49.020 48.914 -0.215
DIman,agr 19.231 19.189 -0.215
DIser,agr 29.268 29.205 -0.215
• manufacturing DIagr,man 147.059 147.451 0.266
DIman,man 144.231 144.615 0.266
DIser,man 73.171 73.366 0.266
• services DIagr,ser 88.235 88.271 0.040
DIman,ser 86.538 86.573 0.040
DIser,ser 29.268 29.205 0.040
• public administrations DIagr,pub 9.804 9.809 0.048
DIman,pub 24.038 24.050 0.048
DIser,pub 14.634 14.641 0.048
INCOME AND SAVINGS
Income
• workers YHsal 800 789.004 -1.375
• capitalists YHcap 280 281.015 0.363
• firms YF 140 140.677 0.483
• government YG 125 112.043 -10.365
Disposable income
• workers YDHsal 760 749.554 -1.375
• capitalists YDHcap 252 252.914 0.363
Public transfers to salar ied households
• transfers TG 50 37.043 -25.913

28
Receipts from direct taxat ion
• workers DTHsal 40 39.450 -1.375
• capitalists DTHcap 28 28.102 0.363
• firms DTF 7 7.034 0.483
Receipts from indirect taxation
• agriculture TIagr 10 7.484 -25.161
• manufacturing TIman 25 18.753 -24.989
• services TIser 15 11.221 -25.191
Savings
• workers SHsal 220 216.976 -1.375
• capitalists SHcap 42 42.152 0.363
• firms SF 63 63.643 1.021
• government SG -125 -125.000 -
DEMAND
Salar ied households – consumption
• agriculture Cagr,sal 158.824 157.412 -0.889
• manufacturing Cman,sal 103.846 103.674 -0.166
• services Cser,sal 263.415 262.161 -0.476
• total budget CTHsal 540 532.578 -1.375
Capital ists – consumption
• agriculture Cagr,cap 20.588 20.765 0.857
• manufacturing Cman,cap 80.769 82.056 1.593
• services Cser,cap 102.439 103.747 1.277
• total budget CTHcap 210 210.761 0.363
Intermediate demand
• agriculture DITagr 294.118 294.444 0.111
• manufacturing DITman 274.038 274.428 0.142
• services DITser 234.146 234.332 0.079
Demand for investment purposes
• agriculture INVagr 26.471 26.305 -0.627
• manufacturing INVman 166.346 166.508 0.098
• total IT 200 197.771 -1.114
Current public expenditure
• government G 200 200.000 -


![KD-R975BTS / KD-R970BTS / KD-R97MBS / KD … Size: B6L (182 mm x 128 mm) Book Size: B6L (182 mm x 128 mm) ENGLISH FRANÇAIS ESPAÑOL B5A-0813-10 [K] KD-R975BTS / KD-R970BTS / KD-R97MBS](https://img.pdfslide.us/doc/110x75/5aaf5da87f8b9a25088d67a8/kd-r975bts-kd-r970bts-kd-r97mbs-kd-size-b6l-182-mm-x-128-mm-book-size.jpg)