Embed Size (px)
Citation preview

page 130/03/2018
Training on data collection and management
to improve GHG inventory compilation in the
waste sector
PATPA Asia-Pacific Workshop
28-30 March 2018
Oscar Zarzo, GIZ

page 2
Agenda overview
30/03/2018
TIME Activity Responsible
DAY 1 3:15-3:30 pm Introduction Oscar Zarzo, GIZ
DAY 1 3:30-3:50 pm UNFCCC reporting Oscar Zarzo, GIZ
DAY 1 3:50-4:10 pm Bangladesh‘s GHG
inventory on waste
Mr Mokhtar Ahmed,
Ministry of Environment,
Bangladesh
DAY 1 4:10-5:15 pm Overview of 2006 IPCC
GL for GHG inventory
waste
Oscar Zarzo, GIZ
DAY 2 9-9:15 am Recap of day 1 Oscar Zarzo, GIZ
DAY 2 9:15 – 10:15 am Dealing with data needs Oscar Zarzo, GIZ
DAY 2 10:15-11:15 am Group work: Data needs All
DAY 2 11:30 am-12:15 pm Inst. Arrangements All
DAY 2 12:15-12:30 pm (Short) Summary All

page 3
CONTENT
30/03/2018
Module 1 – Policy and institutional framework
Module 2 – GHG inventory in the waste sector
Module 3 – Waste data management
Module 4 – In depth calculation methods
Module 5 – Mitigation actions

page 427/02/2017
Module 1 - Policy
and Institutional
framework

page 5
M1 : Policy and institutional framework
30/03/2018
M1.1• The Evolution of International Climate Policy
M1.2• Reporting requirements arising from the UNFCCC
M1.3
• Institutional roles in GHG Inventory development in the waste sector
• Data sources
• Inventory compilation
M1.4 • Policy instruments for mitigation
• GHG emissions and mitigation in the waste sector

page 6
M1.1 The evolution of International Climate Policy
30/03/2018
DidYouKnow?Thefirsttimetheterm“globalwarming”enteredthepublicdomainwasinthetitleofascientificpaperbyUSscientistWallaceBroeckerin1975.Thepaperwasentitled“Climatechange:AreweontheBrinkofaPronouncedGlobalWarming?”

page 7
M1.1 The evolution of International Climate Policy
30/03/2018

page 8
M1.2 Reporting requirements arising from the
UNFCCC
30/03/2018
Annex 1
• CRF & NIR
• NCs
• BRs
Non-Annex 1
• NCs
• BURs

page 9
M1.2 NCs and BURs
30/03/2018

page 10
M1.2 NCs and BURs
30/03/2018

page 11
M1.3 Institutional roles in GHG Inventory
development in the waste sector
30/03/2018
• Data collection
• Management
• Reporting

page 12
M1.3 Sources of data
30/03/2018
Institutional functions in
waste management

page 13
M1.3 GHG Inventory compilation
30/03/2018
National Inventory
preparation and
reporting processes

page 14
M1.3 Sustainable institutional arrangements
30/03/2018
BURs and NCs
- enhance coordination and inter-
sectoral dialogue
- raise awareness
- facilitate consultation

page 15
M1.4 Policy instruments for mitigation
30/03/2018
NDCs
• Paris Agreement
• Long term goals
NAMAs
• Individual vs national
• Integrated approach

page 16
M1.4 GHG emissions and mitigation
30/03/2018
Source: IPCC 5th Assessment Report, 2014, working group 3, mitigation, page 381
page 1730/03/2018
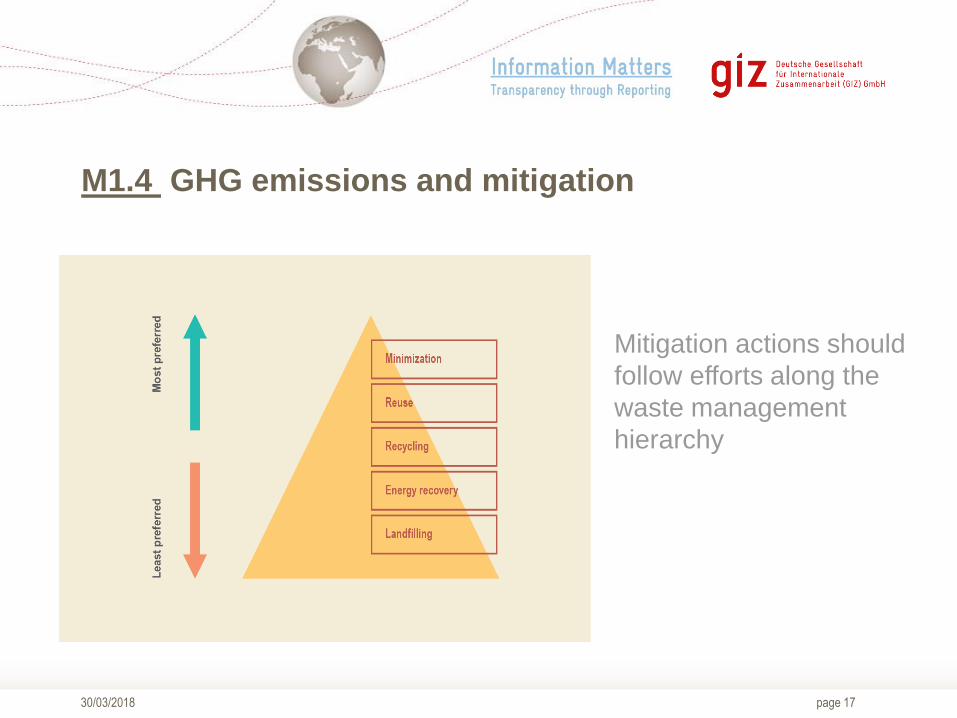
M1.4 GHG emissions and mitigation
Mitigation actions should
follow efforts along the
waste management
hierarchy

page 1830/03/2018
Module 2 – GHG
inventory in the
waste sector

page 19
M2 : GHG inventory in the waste sector
30/03/2018
M2.1 • Guidelines
M2.2 • Solid waste disposal
M2.3 • Biological treatment
M2.4 • Incineration and open burning
M2.5 • Wastewater treatment and discharge
M2.6 • Key data category and double counting
M2.7 • Exercise on key data category

page 20
M2.1 Structure of categories
27/02/2017

page 2130/03/2018
page 22
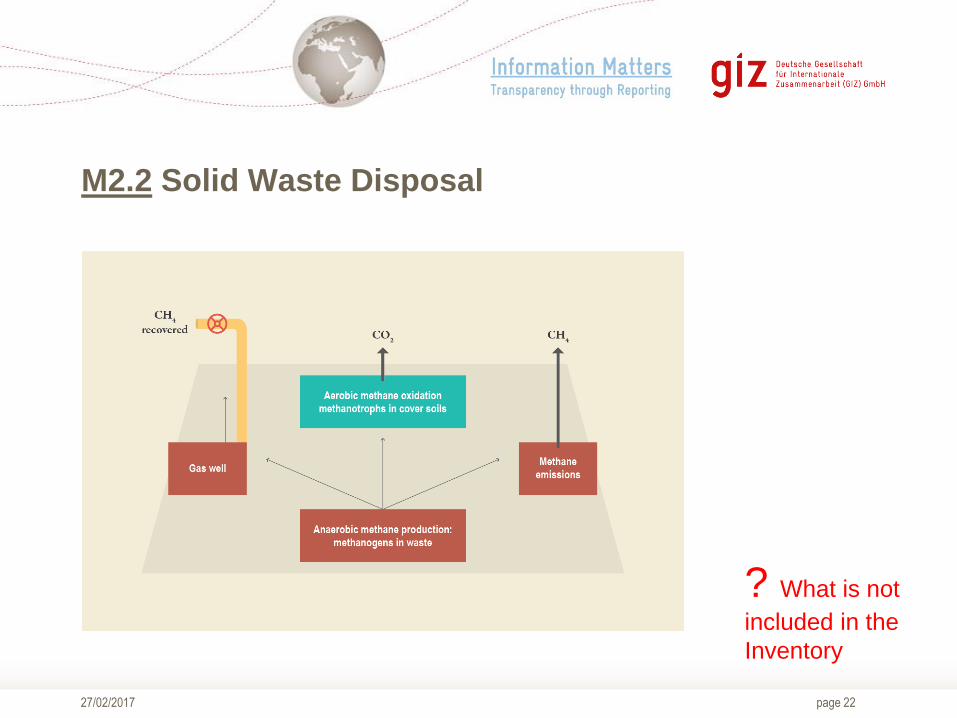
M2.2 Solid Waste Disposal
27/02/2017
? What is not
included in the
Inventory

page 23
M2.2 Solid waste disposal, First Order Decay
27/02/2017

page 24
M2.2 Solid waste disposal, First Order Decay
30/03/2018
DidYouKnow?FirstOrderDecay(FOD)thatforapopulationofatoms,moleculesoranythingelse,aconstantfraction/unittimeisconvertedtosomethingelse.Theactualfraction/unittimeisexpressedasaconstantrate,inunitsoftime.TheFODmethodassumesthatthedegradableorganiccomponentinwastedecaysslowlythroughoutafewdecades,duringwhichCH4andCO2areformed.Ifconditionsareconstant,therateofCH4productiondependssolelyontheamountofcarbonremaininginthewaste.

page 25
M2.2 Solid waste disposal, Data needs
27/02/2017
1. Population for 50 years
2. Waste generation rate in kg/capita
3. The share of total waste deposited in solid waste disposal sites
4. The share of different types of disposal sites
5. The waste composition of the waste disposed
• Sludge (industrial and household), industrial waste, other waste
• Landfill gas use and flaring

page 26
M2.2 Population data
27/02/2017
Country Disaggregation
Namibia • Split into “high income” and “low income” urban regions for
2010.
• Why?- Sustained and significant migration from rural to
urban, fast-expanding low income suburbs
Tunisia • Data is available from 1950 onwards from Tunisia’s
National Statistics Institute.
• A distinction is made between the rural and urban
population and different generation rates are applied.

page 27
M2.2 Waste generation rate
27/02/2017
Country Interpolation, single regression
Bulgaria • 1950-1978 calculated based on urban population
• 1979-1993 data on waste generation from operators of
service
• 1999-2010 statistical data on waste generation is available
Missing years (1994-1999) calculated by single regression
method
Brazil • calculated based on data from two different waste
management companies
• data from one is used to estimate the waste landfilled in
1970 from the other for waste landfilled in 2005
• data for the intermediate years were linearly interpolated
page 2827/02/2017
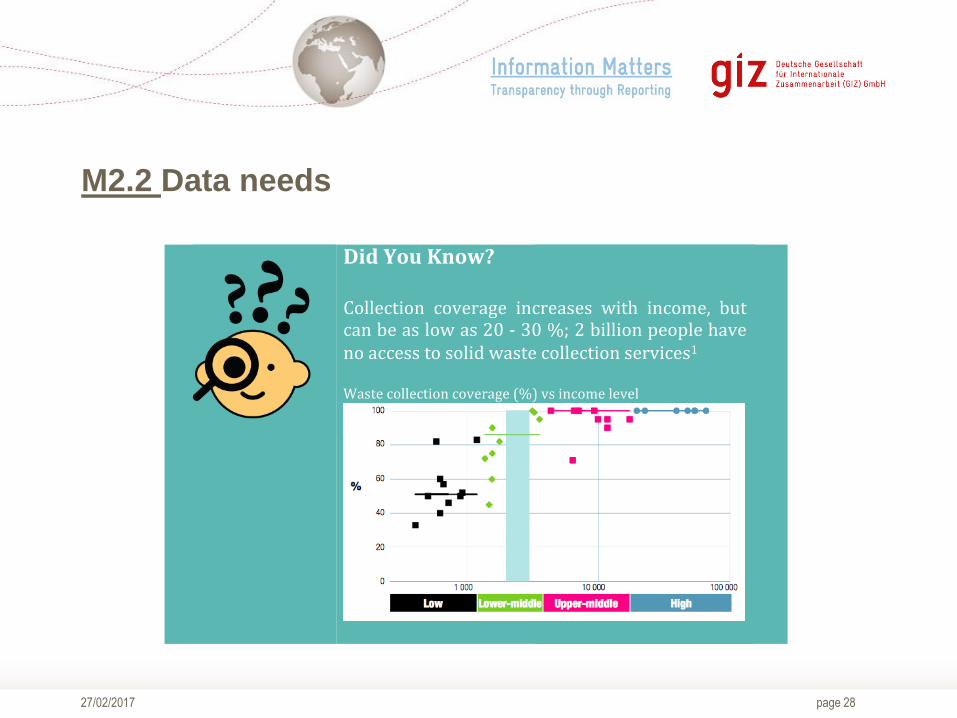
1 ISWA-UNEP, 2015, Global Waste Management Outlook
DidYouKnow?Collection coverage increases with income, butcanbeaslowas20-30%;2billionpeoplehavenoaccesstosolidwastecollectionservices1Wastecollectioncoverage(%)vsincomelevel
M2.2 Data needs

page 29
M2.2 Share of waste disposed
27/02/2017
Country Using data and expert judgement
Armenia Inventory of solid waste disposal sites/landfills operating over the
period of 1990-2012. Based on urban population data:
• The capital city of Yerevan - Anaerobic managed solid waste
disposal sites
• Secondary cities (Gyumri and Vanadzor) - Unmanaged solid waste
disposal sites – deep and/or with high water table.
• 45 additional cities and towns – unmanaged solid waste disposal
sites.
Tunisia • There is a number of managed disposal sites with weighbridges –
anaerobic controlled disposal site
• The difference between the amount of waste generated and the
amount measured entering managed disposals sites is attributed to
uncontrolled landfills.
• The first managed landfill opened in 1999. By 2010 ten landfills
opened in Tunisia, which receive more than 85% of the waste.

page 30
M2.2 Waste composition
27/02/2017
Country Using data and expert judgment
Bulgaria • a study conducted in 2002 that determines the shares of
different waste types depending on the geographical
distribution and population size of different settlements
• a model has been developed, which calculates different
fractions of the biodegradable organic content of waste for
different population groups according to the size of
settlements
Tunisia • The composition of the waste comes from a study
conducted in 2007 (feasibility study for the construction of a
second landfill for the Greater Tunis, ANGed).
• This composition is also verified in the context of CDM
projects on landfills.

page 31
M2.2 Data needs
30/03/2018
DidYouKnow?OfallcreditsissuesforCleanDevelopmentMechanism(CDM)projectssofar,6%comefromprojectsinthewastesector.Thisissignificant,takingintoaccountthatmostCDMprojectsarelandfillgasextractionprojects,nottouchingonothermitigationstrategiesinthesector.

page 32
M2.3 Biological treatment, Composting
27/02/2017
? What is not
included in the
Inventory

page 33
M2.3 Biological treatment, Anaerobic digestion
27/02/2017
? What is not
included in the
Inventory

page 34
M2.3 Data needs
27/02/2017
• Amount of organic waste treated
• Emission factor for treatment
• Default emission factors are available
• On a wet and dry weight basis
Biogas production, Seini, Romania
Source: RWA Group

page 35
M2.3 Tier 1 is used, uncertainty is high
27/02/2017
Country Interpolation, single regression
Chile • No registry of facilities
• Data relies on facilities that are permitted
• Efforts were made to survey large facilities and large
municipalities
Tunisia • Official statistics were used, but data is unreliable, not
clear if all operators report (uncertainty at 20%, doubled)
• 100% uncertainty is assumed for the emission factors

page 36
M2.4 Incineration and open burning
27/02/2017
? What is not
included in the
Inventory

page 3727/02/2017
Incineration
- Amount of waste burned per type of waste (municipal, industrial,
hazardous, clinical, sewage sludge)
- Amount of fossil liquid waste
- Amount of fossil carbon per waste type (for CO2 emissions)
Open burning
- Population burning waste
- Per capita waste generation rate for population burning waste
- Fraction of waste burned
M2.4 Incineration and open burning, Data needs

page 3827/02/2017
Country Methods to collect data, estimations used
Armenia • Assumed that 100% of rural population burns all waste
openly
Mexico • Incineration of medical waste only, the facilities report to
the EPA
• Assumed that 40% of waste generated in rural areas is
burned
Tunisia • Amount of medical waste estimated by # of bed and
occupancy rate in hospitals
• Assumed that 20% of population in rural area is burning
the waste
• Energy and waste sector inventory experts exchange
M2.4 Incineration and open burning, Examples

page 39
M2.5 Wastewater treatment and discharge
27/02/2017
W
A
S
T
E
W
A
T
E
R
CH4
N2O
DidYouKnow?BiologicalOxygenDemand(BOD)istheamountofdissolvedoxygenneeded(demanded)byaerobicbiologicalorganismstobreakdownorganicmaterialpresentinwateratcertaintemperatureoveraspecifictimeperiod.TotalorganicallydegradablecarbonismeasuredandexpressedinBOD.

page 40
M2.5 Wastewater treatment systems and discharge
pathways
27/02/2017

page 41
M2.5 Steps
27/02/2017
• Determine Total Organic Biodegradable Content (TOW)
• Emission factors for each pathway of the system
• Relative share of each pathway in the system
• Default values based on the carbon discharged per person and total
population
• Systems may be distributed based on rural, urban high income, urban
low income population
• The main industries to consider are pulp and paper, food and beverage
and organic chemical industry
• For N2O the protein intake per person

page 42
M2.5 CH4 estimation from wastewater – estimating
activity data
27/02/2017
Country Interpolation, single regression
Armenia • Population classified into 3 groups: large cities, other
towns and villages
• Cities (95% sewer, 5% latrines); towns (50% sewer, 50%
latrines); villages (5% sewers, 95% latrines)
South
Africa
• NIR includes detailed table on treatment type or discharge
pathway per income group (according to the 3 suggested
categories)
Chile • Industrial wastewater data was available for 2006-2010.
Extrapolation was tempted by different methods, tying
extrapolation to GDP changes proved best.

page 43
M2.5 N2O estimation from wastewater
27/02/2017
Country Interpolation, single regression
Armenia • FAO protein consumption rates used
• Interpolation for interim years missing (2009-2010)
Vietnam • Data from Vietnam’s National Institute on Nutrition was
used

page 44
M2.6 Key data categories and double counting
27/02/2017
• Avoiding double counting
• Key category analysis

page 4527/02/2017

page 46
M2.6 Avoiding double counting
30/03/2018
• Allocation to “budget lines” or SECTORS (waste to energy, sludge used
as fertilizer)
• Anthropogenic and not biogenic origin (CO2 emissions from landfills)

page 47
M2.6 Key categories
27/02/2017
- Qualitative assessment – which seems to be the most important
source(s) of emissions?
- Based on previous emission estimates
- Trend assessments
- Future policies
- Based on uncertainties
- Lack of completeness – if data is not complete, this may lead to a
bias
- Lack of data – if data is not available, it may be better to use default
- Data is not representative – if data is not representative, this may
lead to bias

page 48
M2.7 Quality Quiz TRUE or FALSE
27/02/2017
1. The amount of waste collected is less than the amount of waste
generated.
2. The composition of waste generated is the same as the composition of
the waste disposed
3. Methane is generated in anaerobic conditions
4. Small scale biogas production generates Greenhouse Gas emissions
and should be included in the Waste Sector Greenhouse Gas Inventory
5. GHG emissions from material recycling are included in the waste sector
GHG inventory

page 49
Agenda overview Day 2
30/03/2018
TIME Activity Responsible
9-9:25 am Recap of day 1 and
exercise KCA and double
counting
Oscar Zarzo, GIZ
9:25 – 10:35 am Dealing with data needs
Exercise: Landfill
categorisation
Oscar Zarzo, GIZ
10:35-11:15 am Group work: Data needs All
11:30 am-12:15 pm Institutional Arrangements All
12:15-12:30 pm (Short) Summary All

page 5030/03/2018
Exercise1.Keycategoryanalysisanddoublecounting
In this exercise, each source of emission must be allocated to the correct category making sure that no emissions are accounted twice.
To illustrate where these treatment options may be in your process flow diagram, we illustrate on the next slides a couple of options through a process flow diagram showing also a mass balance. Depending on the level of development of the sector, the diagram changes.

page 51
M2.7 Process flow example: Middle income
27/02/2017

page 52
M2.7 Process flow example: High income
30/03/2018

page 53
M2.7 Process flow example: Low income
30/03/2018

page 5430/03/2018
Module 3
Waste data
management

page 55
M3 : Waste data management
30/03/2018
M3.1• Waste data collection
M3.2• Data management
M3.3• Waste characterization
M3.4 • SWDS classification
M3.5• Exercise on SWDS classification
M3.6• Exercise Waste Data Management

page 5627/02/2017
“Measurement is the first step that
leads to control and eventually to
improvement. If you can’t measure
something, you can’t understand it. If
you can’t understand it, you can’t
control it. If you can’t control it, you
can’t improve it.”
Prof. H. James Harrington

page 5727/02/2017
Diversity of data generation and collection
Who (collects the data)
Landfill Manager; Collection / fleet manager; Industry operator (waste producers);
Private operators; Recyclers; Contracts department; Water / Waste Water department;
Consultancies; City manager / Mayor; Universities; International Organisation (i.e.Eurostat, OECD, IFIs, UNSD, Basel etc.); prospectors
What (data is
collected)
Waste quantity (mass, density, volumes), population, collection rates; transport costs,
exports and imports, operating cost; Waste treatment and disposal facility weigh bridge
(in and out); composition; generation rates; revenues; residential type, income groups,kWh.
Where(is it collected)
Treatment / disposal facility gate; Industrial waste storage area; facility, city, municipal,national level; on collection truck; ports and borders.
When(is it collected)
Each collection; Monthly; Quarterly; Billing periods; Performance periods; Annually;Random sampling
Why (is it collected)
Contract management (performance indicators); Benchmarking; Cost / quality control;
Aid decision-making by government; inform policy, investment, strategies and planning;
monitoring progress towards targets; Aid enforcement and compliance monitoring;statutory reporting; identifying sector trends; research.
M3.1: Waste data collection

page 58
M3.1 The Waste Management Service and Value
Chains

page 59
M3.1 Management (SWM) Practitioners’ Integrated
SWM Data Interests
page 60
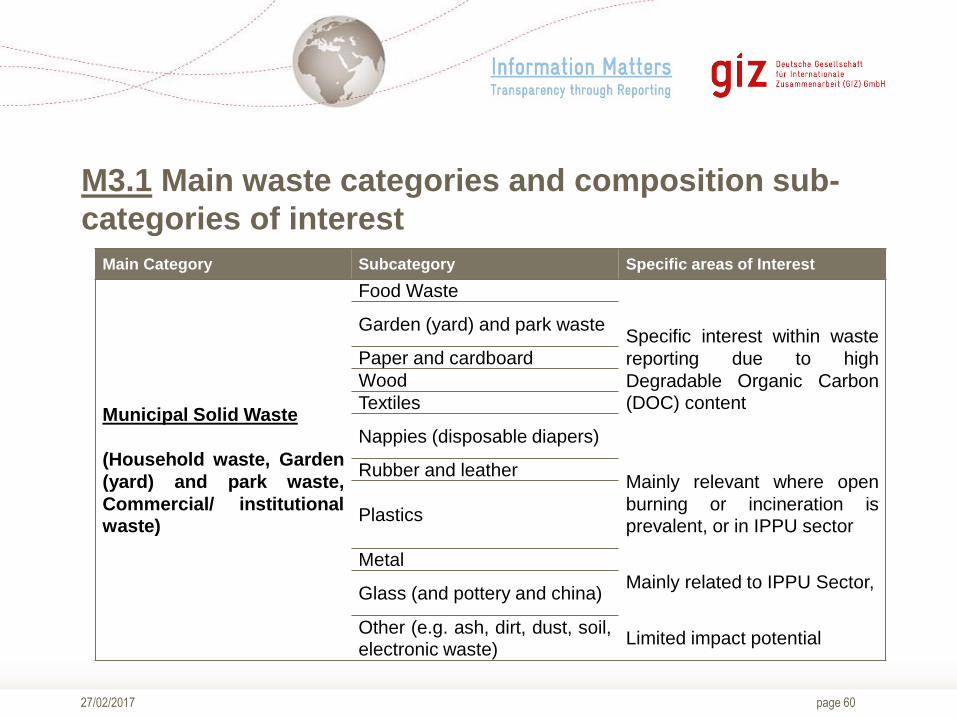
M3.1 Main waste categories and composition sub-
categories of interest
27/02/2017
Main Category Subcategory Specific areas of Interest
Municipal Solid Waste
(Household waste, Garden
(yard) and park waste,
Commercial/ institutionalwaste)
Food Waste
Specific interest within waste
reporting due to high
Degradable Organic Carbon(DOC) content
Garden (yard) and park waste
Paper and cardboard
Wood
Textiles
Nappies (disposable diapers)
Rubber and leatherMainly relevant where open
burning or incineration isprevalent, or in IPPU sector
Plastics
Metal
Mainly related to IPPU Sector,Glass (and pottery and china)
Other (e.g. ash, dirt, dust, soil,electronic waste)
Limited impact potential

page 61
M3.1 Main waste categories and composition sub-
categories of interest
27/02/2017
Main Category Subcategory Specific areas of Interest
Wastewater & Sludge
Sludge from domestic wastewater
treatment plants
Storage, Conveyance and treatment (CH4
release)
Sludge from industrial wastewatertreatment plants
Storage, Conveyance and treatment (CH4
release)
Industrial Waste
(process solid wastes
only, office etc. waste
regarded as MSW) and
industrial sludge reported as such)
Manufacturing Industry processwastes (other than sludge)
(report by industry types, i.e.: Food, beverages &
tobacco; Textile; Wood and wood products; Pulp
& paper; Petroleum products, solvents, plastics;Rubber; Other)
Construction and Demolition wastes Mainly inert
Other
Clinical Wastei.e. syringes, needles, animal tissues, bandages,clothes, etc.
Hazardous WasteWaste oils, solvents, ash, cinder, & others of
hazardous nature (flammability, explosiveness,causticity, toxicity)
Agricultural Waste
Certain manure, agricultural residues, animal
carcasses, plastic film for greenhouses treated
and/or disposed with other MSW and/or industrialwastes and not covered under AFOLU volume

page 62
M3.2 Waste data management
27/02/2017
DidYouKnow?Thequantityandcompositionofwastevariesbetweencountries,butalsobetweenincomegroups,socialgroups,industrialprocesses,geographies,andclimaticconditionswithinacountryandevenwithinacity.Highincomegroupsusuallyproducemorewastewithahigherpercentageofplastics,electronicequipmentetc.,whilelowincomegroupsgenerallyproducelesswasteoverall,withagreaterpercentagebeingfood,andfines(ash,soil,sand,etc.).Knowingthewastegenerationandcompositionofdifferentgroupsalongsidepopulation/sizeofeachgroupisessentialtoproducingreliablewastegenerationestimations,especiallyinlocationswheretheformalwastecollectionsystemdoesnotcaptureandreportonallwastes.

page 63
M3.2 Waste generation
27/02/2017
South African MSW Generation by income group:
High Income: 0.55 Tonnes/cap/year
Middle Income: 0.28 Tonnes/cap/year
Low Income: 0.13 Tonnes/cap/year
National Average: 0.22 Tonnes/cap/year (fine for national statistics,
but not site specific)
Senegal MSW Generation
National Average: 0.17 Tonnes/cap/year
IPCC 2006 Guidelines
Default for Africa: 0.29 Tonnes/cap/year

page 64
M3.2 MSW Composition for 2 different South African
Municipalities
27/02/2017
Food waste
17%
Garden waste
19%
PLASTICS
21%
PAPER &
PAPERBOARD
16%
METAL
2%
GLASS
9%
C&D
0% TEXTILES
8%
SPECIAL CARE
WASTES
5%
OTHER WASTE
3%
% Composition by Mass (kg)
Food waste Garden waste PLASTICS
PAPER & PAPERBOARD METAL GLASS
C&D TEXTILES SPECIAL CARE WASTES
OTHER WASTE
Food waste20%
Garden waste19%
PLASTICS18%
PAPER & PAPERBOARD
18%
METAL2%
GLASS4%
C&D0%
TEXTILES7%
SPECIAL CARE WASTES
8%
OTHER WASTE4%
% Composition by Mass (kg)

page 65
M3.2 Landfill Disposal Composition (includes
Industrial and other wastes) for same 2 South African
Municipalities
27/02/2017
Food waste42%
Garden waste13%
PLASTICS7%
PAPER & PAPERBOARD
8%
METAL2%
GLASS3%
C&D
19%
TEXTILES2%
SPECIAL CARE WASTES
2%
OTHER WASTE2%
Food waste
9%
Garden waste
34%
PLASTICS
12%
PAPER &
PAPERBOARD9%
METAL
1%
GLASS
5%
C&D
21%
TEXTILES
4%
SPECIAL CARE
WASTES3%
OTHER WASTE
2%

page 66
M3.2 IPCC 2006 Guidelines Default MSW
Composition for Southern Africa
27/02/2017
Food waste
23%
Garden waste
25%
Wood
15%
OTHER WASTE
37%

page 67
M3.2 Solid Waste Management Facility - Weigh Bridge
Data
27/02/2017
Source: RWA Group

page 68
M3.2 Always difficulties knowing what enters a landfill
27/02/2017 Source: RWA Group

page 69
M3.2 Material Flow Mass Balance QA/QC Tool – Tier
3
27/02/2017

page 70
M3.2 Material Flow Mass Balance QA/QC Tool – Tier
1 / 2
27/02/2017

page 71
M3.2 GHG Inventory Focus areas in Wastewater
27/02/2017

page 72
M3.2 Domestic Wastewater Service Chain
27/02/2017

page 73
M3.2 Which sanitation option is worst?
27/02/2017
A: Open Defecation B: Stagnant Open
Sewer
B: Latrine dumping to
flowing river
Pictures: RWA Group

page 74
Example: Dakar WWTP and Faecal Sludge Facility
27/02/2017
Source: RWA Group

page 75
Example: Tankered Wastewater Treatment Plant –
Gate Records
27/02/2017

page 76
M3.3 Waste characterisation
30/03/2018
Source: RWA Group

page 77
M3.3 Selecting an appropriate methodology
27/02/2017
Waste Characterisation Analysis should be compliant with accepted
international best practice, which include:
• ASTM D5231 - 92(2016) - Standard Test Method for Determination of
the Composition of Unprocessed Municipal Solid Waste - Available from
- http://www.astm.org/cgi-bin/resolver.cgi?D5231
• UNEP/IETC - Developing Integrated Solid Waste Management Plan,
Volume 1, Waste Characterisation and Quantification with Projections
for Future (2009).
• Methodology for the Analysis of Solid Waste (SWA-Tool) User Version –
Available from - https://www.wien.gv.at/meu/fdb/pdf/swa-tool-759-
ma48.pdf

page 78
M3.3 Essential Steps
27/02/2017
Pre-investigation • 1
Analysis design and planning
• 2
Execution of waste
analysis • 3
Evaluation of waste
analysis• 4

page 79
M3.3 System Design - Essential
27/02/2017
• Seasonality – Exercise must be conducted in all major climatic seasons
(usually 3 times in a year)
• 32 x 100 kg randomly selected samples from each strata – minimum
required
Main difference is where in the waste service chain the analysis is
conducted
• Waste direct from households / commercial properties
• Waste from bins
• Waste from collection vehicles entering landfill

page 80
M3.3 Potential Strata
27/02/2017
1. Urban High Income
2. Urban Middle Income
3. Urban Low Income
4. Collection system
5. Bin type and size
6. Food Market
7. Dry goods market
8. CBD Offices
9. Street bins
10.Commercial districts (commercial properties only)
11. Industrial sectors
12.Parks and Gardens

page 81
M3.3 Analysis at SWDS

page 82

page 83
page 84
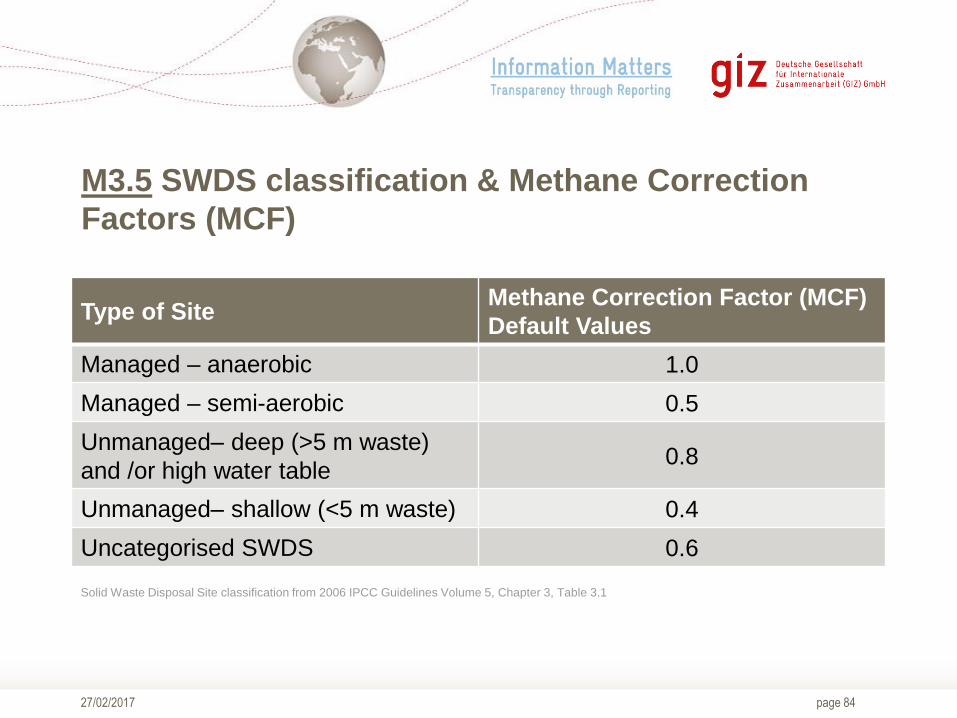
M3.5 SWDS classification & Methane Correction
Factors (MCF)
27/02/2017
Type of SiteMethane Correction Factor (MCF)
Default Values
Managed – anaerobic 1.0
Managed – semi-aerobic 0.5
Unmanaged– deep (>5 m waste)
and /or high water table0.8
Unmanaged– shallow (<5 m waste) 0.4
Uncategorised SWDS 0.6
Solid Waste Disposal Site classification from 2006 IPCC Guidelines Volume 5, Chapter 3, Table 3.1

page 85
M3.5 Anaerobic managed SWDS
27/02/2017
These must have controlled placement of waste. i.e.:
a) waste directed to specific deposition areas;
b) a degree of control of scavenging; and
c) a degree of control of fires
and will include at least one of the following:
i. cover material; and / or
ii. mechanical compacting; and / or
iii. levelling of the waste.

page 86
Example: Anaerobic managed SWDS
27/02/2017
Source: RWA Group

page 87
M3.5 Semi-aerobic managed SWDS
27/02/2017
These must have controlled placement of waste and will include all of the
following structures for introducing air to waste layer:
i. permeable cover material; and
ii. leachate drainage system; and
iii. Regulating pondage; and
iv. gas ventilation system.

page 88
Example: Semi-aerobic managed SWDS
27/02/2017 Source: RWA Group

page 89
M3.5 Unmanaged SWDS – Deep (>5m waste) and/or
high water table
27/02/2017
All SWDS not meeting the criteria of managed SWDS and which have
depths of greater than or equal to 5 metres and/or high water table at near
ground level.
Latter situation corresponds to filling inland water, such as pond, river or
wetland, by waste.

page 90
Example: Unmanaged SWDS – Deep (>5m waste)
and/or high water table
27/02/2017 Source: RWA Group

page 91
M3.5 Unmanaged – Shallow (<5m waste)
27/02/2017
All SWDS not meeting the criteria of managed SWDS and which have
depths of less than 5 metres.
Source: RWA Group

page 9227/02/2017
M3.5 Uncategorised solid waste disposal sites
Only if countries cannot categorise their SWDS into first four categories of
managed and unmanaged SWDS, can the MCF for this category can be
used.
Generally used for countries that cannot define what kind of landfills they
have or had in the past.

page 93
M3.5 Oxidation factor (OX) for SWDS
27/02/2017
Type of site Methane Correction Factor (MCF)
default values
Managed, unmanaged and
uncategorised
0
Managed, covered with CH4 oxidising
material
0.1
IPCC 2006 Guidelines, Volume 5, Chapter 3, Table 3.2

page 94
M3.6 Exercise Classification of Solid Waste Disposal
Sites
27/02/2017
Observe the following Solid Waste Disposal Sites (SWDS) Examples and
in your groups:
Identify the classification of each example Solid Waste Disposal Sites
using the 2006 IPCC Guidelines Volume 5 Chapter 3
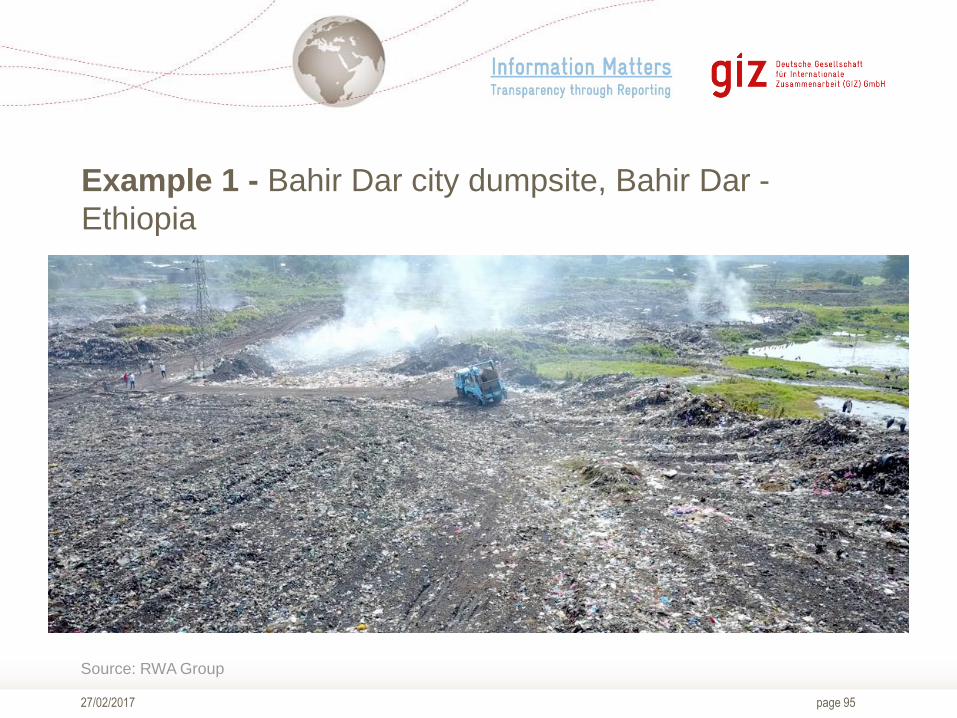
page 95
Example 1 - Bahir Dar city dumpsite, Bahir Dar -
Ethiopia
27/02/2017
Source: RWA Group

page 96
Example 2 - Dakar city dumpsite, Dakar - Senegal
27/02/2017
Source: RWA Group

page 97
Example 3 - Reppie SWDS - Addis Ababa - Ethiopia
27/02/2017
Source: RWA Group
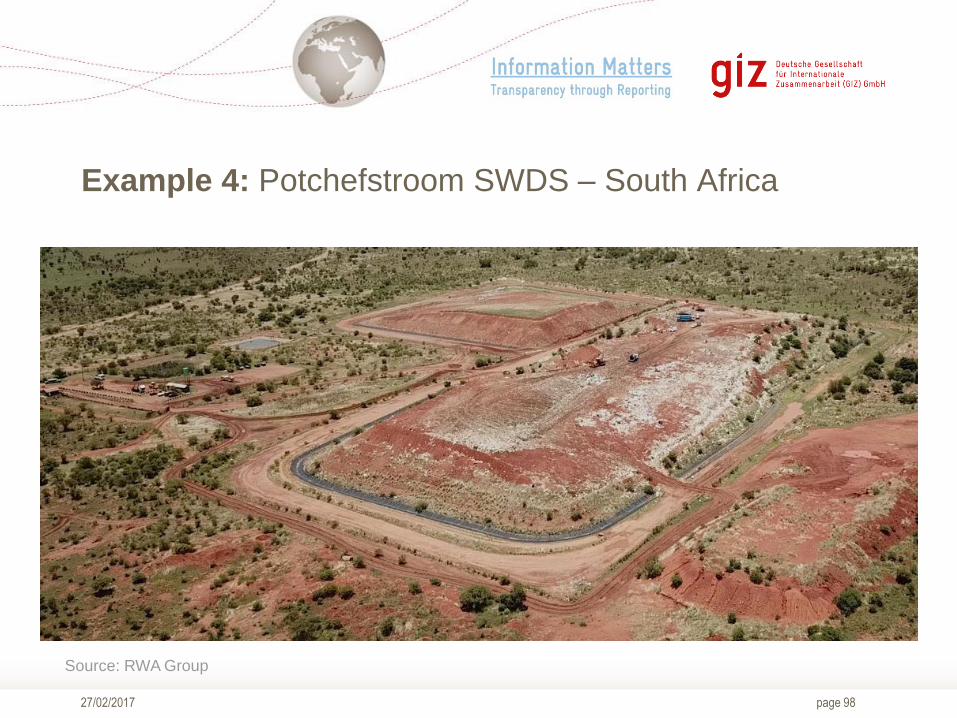
page 98
Example 4: Potchefstroom SWDS – South Africa
27/02/2017
Source: RWA Group

page 9927/02/2017
Example 5: Colombia, basurero Doña Juana
Source: https://static.iris.net.co/sostenibilidad/upload/images/2017/3/16/37342_1.jpg

page 10027/02/2017
Example 6: Amman, Jordan
Source: RWA Group

page 101
M3.7 Exercise 3. Waste Data Management
30/03/2018
An interactive group exercise based on a scenario country (”My Country”)
with two separate main waste management areas, the capital city “My City”
and the rural area and secondary town areas of “My Country” (see map).
Using two mass balance diagrams presenting example waste
management data from the two subnational groups, analyse the data,
aggregate it, validate it for the entire “country” waste management sector.

page 102
M3.7 Exercise 3. Waste Data Management
30/03/2018Source: RWA Group

page 10330/03/2018
M5.8 Institutional arrangements and data flow

page 104
M5.8 Institutional arrangements and data flow
30/03/2018

page 105
M5.8 Institutional arrangements and data flow
30/03/2018
page 106
Thank you very much for your time and attention!
28.06.2016
http://mitigationpartnership.net/information-matters
In all matters of the
project please
contact:
(MRV and GHG Inventory
advisor at the German
Environment Agency)