Embed Size (px)
Citation preview
TRAINING NEEDS ANALYSIS AND TALENT MANAGEMENT OF ADMINISTRATIVE
STAFF AT A HEALTH SCIENCES UNIVERSITY
by
HERIET NANCY MATLAKALA
submitted in accordance with the requirements
for the degree of
MASTER OF COMMERCE
in the subject
HUMAN RESOURCE MANAGEMENT
at the
UNIVERSITY OF SOUTH AFRICA
SUPERVISOR: PROF ADéLE BEZUIDENHOUT
CO-SUPERVISOR: MS LIEZEL DIEDERICKS
FEBRUARY 2021
i
DECLARATION
I, HERIET NANCY MATLAKALA, student number 34620605, declare that the
dissertation entitled, “TRAINING NEEDS ANALYSIS AND TALENT MANAGEMENT OF
ADMINISTRATIVE STAFF AT A HEALTH SCIENCES UNIVERSITY”, is my own work.
All the sources that I have used or quoted have been indicated and acknowledged by
means of complete references.
Furthermore, I declare that the dissertation was submitted to the originality checking
software, Turnitin, and that it falls within the accepted requirements for originality. Finally,
I certify that I have not previously submitted this work, or part of it, for examination at
Unisa, or at any other institution, for another qualification.
27 February 2021
_____________________ ________________
Heriet Nancy Matlakala Date
ii
ACKNOWLEDGEMENTS
I thank God for leading me throughout this study. I also wish to pass my gratitude to the
following persons for their respective contributions to this study:
• my husband, Mogale, for his love, cooperation and understanding of the time
that I needed to spend on my dissertation.
• my lovely girls, Lethabo and Mamosa, their love, understanding and support. Let
this journey be an assertion to them that through love, hard work and with God,
nothing is impossible.
• my supervisors for the endless support and confidence that they have shown in
me. They are really remarkable women! Professor Adele Bezuidenhout, thank
you for seeing the potential in me. I really appreciate your supervision. Ms Liezel
Diedericks, thank you for seeing the light in me and letting it shine bright through
my profession.
• Mr Donald Tshabalala and Dr Jeremy Mitonga for outstanding assistance
regarding statistical analysis in this study.
• Dr Edwin Seleka for his assistance with language editing.
• my mentors, Prof Mokgadi Matlakala and Ms Mmafani Serote for their continued
academic excellence encouragements.
• my mother, Dipasana Anna Ntshabeleng for the wisdom she instilled in me about
value of education and her continued encouragements, as well as her teachings
about keeping faith in God.
iii
ABSTRACT
TRAINING NEEDS ANALYSIS AND TALENT MANAGEMENT OF
ADMINISTRATIVE STAFF AT A HEALTH SCIENCES UNIVERSITY
by
Heriet Nancy Matlakala
SUPERVISOR : Prof Adele Bezuidenhout
CO-SUPERVISOR : Ms Liezel Diedericks
DEPARTMENT : Human Resource Management
DEGREE : Master of Commerce
The aim of this research was to establish the link between the training needs analysis
(TNA) process and talent management (TM) practices of administrative staff at a health
sciences university (HSU). The nature of the office work space and the training need
analysis model (TNAM) indicate that the design of administrative staff members'
vocations does not include some of the core dimensions of TNA and TM. This may lead
to several peculiarities in terms of how administrative staff work, narrate and engage with
their line managers. If not attended to, these peculiarities may impact the levels of
administrative staff members' training needs and TM adversely. Additionally, the
possibility that they may leave the organisation may increase. As a result, a quantitative
online survey was conducted on a census sample of 163 (n = 163) permanent
administrative staff members (secretaries and administrative officers) atthe specific
unversity.
In the absence of a good fit, an exploratory factor analysis (EFA) revealed a four-factor
model for the TNA process and a three-factor model for TM practice. A correlational
analysis revealed a statistically significant relationship between perceptions of the TNA
process and TM practice. A bivariate-partial correlation revealed a significant positive
relationship or link between the TNA process and TM practice. A Mann-Whitney test was
also used to determine the significant mean differences among groups based on the TNA
process and TM practice. Tests for statistically significant mean differences demonstrated no
significant difference between female and male administrative staff members. The same was
true for differences in terms of age, job title, job level and job tenure. In terms of educational
level, no significant mean differences were found among administrative staff members in
iv
possession of undergraduate degrees and those with postgraduate degrees. The findings are
applicable to similar populations and may assist in improving the work experience of other
office employees. In addition, it is the conviction of the researcher that the results of this study
will help university management and the human resource development (HRD) section to follow
the required TNA process. It will also improve the TM practice of administrative staff members
by ensuring that their training needs are linked with their tasks and that individual TNAs are
undertaken to ensure that organisational goals are achieved.
Key terms: Administrative Staff; Health Sciences University; Talent; Talent anagement;
Training Needs Analysis; Training Needs Assessment.
v
TSHOBOKANYO
TOKOLOLO YA DITLHOKEGO TSA KATISO LE TSAMAISO YA DITALENTE
TSA BADIRI BA TSAMAISO KWA YUNIBESITHING YA DISAENSE TSA
BOITEKANELO
ka
Heriet Nancy Matlakala
MOTLHOKOMEDI: Mop Adele Bezuidenhout
MOTLHOKOMEDIMMOGO: Mme Liezel Diedericks
LEFAPHA: Tsamaiso ya Badiri
DIKIRII: Master of Commerce
Maikaelelo a patlisiso eno e ne e le go bona kgolagano magareng ga tirego ya tokololo ya
ditlhokego tsa katiso (TNA) le ditiragatso tsa tsamaiso ya ditalente (TM) tsa badiri ba
tsamaiso kwa yunibesithing ya disaense tsa boitekanelo (HSU). Mofuta wa sebaka sa tiro
mo kantorong le sekao sa tshekatsheko ya ditlhokego tsa katiso (TNAM) di supa gore
thadiso ya ditiro tsa badiri ba tsamaiso ga e a akaretsa dingwe tsa dintlha tsa botlhokwa
tsa TNA le TM. Seno se ka lebisa kwa goreng go nne le dilo dingwe tse di sa tlwaelegang
malebana le gore badiri ba tsamaiso ba dira jang, ba tlotla le go dirisana jang le
batsamaisi ba bona ba tlhamalalo. Fa go sa samaganwe natso, dilo tseo tse di sa
tlwaelegang di ka ama seelo sa ditlhokego tsa katiso le tsamaiso ya ditalente tsa badiri
ba tsamaiso mo go maswe. Go tlaleletsa foo, kgonagalo ya gore ba ka tlogela setheo e
ka oketsega. Ka ntlha ya seo, go dirilwe thekatsheko e e lebelelang dipalopalo mo
inthaneteng ka sampole ya palobatho ya 163 (n = 163) ya badiri ba leruri ba tsamaiso
(bakwaledi le batlhankedi ba tsamaiso) kwa yunibesithing e e tlhalositsweng.
Moo go neng go se na tekano e e siameng, tokololo ya tlhotlhomiso ya ntlha (EFA) e
senotse sekao sa dintlha tse nne malebana le tirego ya TNA le sekao sa dintlha tse
tharo malebana le tiragatso ya TM. Tokololo ya tsamaelano e senotse kamano e e
maleba mo dipalopalong magareng ga megopolo ka ga tirego ya TNA le tiragatso ya
TM. Tsamaelano ya bogare ya dipalopedi e bontshitse kamano gongwe kgolagano e e
siameng magareng ga tirego ya TNA le tiragatso ya TM. Go dirisitswe gape teko ya Mann-
Whitney go swetsa ka dipharologano tsa botlhokwa tsa bogare magareng ga ditlhopha go ya
ka tirego ya TNA le tiragatso ya TM. Diteko tsa dipharologano tsa dipalopalo tsa botlhokwa
vi
tsa bogare ga di a bontsha pharologano epe e e botlhokwa magareng ga badiri ba tsamaiso
ba basadi le ba banna. Seno se ne se tshwana le mo dipharologanong go ya ka dingwaga,
maemotiro, legato la tiro le sebaka sa go dira. Malebana le seelo sa thuto, ga go a fitlhelwa
dipharologano dipe tse di botlhokwa tsa bogare magareng ga badiri ba tsamaiso ba ba nang
le didikirii tse di kwa tlase ga kalogo le ba ba nang le didikirii tsa morago ga kalogo. Diphitlhelelo
di ka dirisiwa mo ditlhophadikgolong tse di tshwanang le tseo me di ka thusa go tokafatsa
maitemogelo a tiro a badiri ba bangwe ba dikantoro. Go tlaleletsa foo, mmatlisisi o dumela
gore dipoelo tsa thutopatlisiso eno di tlaa thusa botsamaisi jwa yunibesithi le karolo ya
tlhabololo ya badiri (HRD) go latela ditirego tse di tlhokegang tsa TNA. Gape di tlaa tokafatsa
tirego ya TM ya badiri ba tsamaiso ka go netefatsa gore ditlhokego tsa bona tsa katiso di
golaganngwa le ditiro tsa bona, le gore go dirwa diTNA tsa mongwe le mongwe go netefatsa
gore go fitlhelelwa maikemisetso a setheo.
Mareo a botlhokwa
Badiri ba Tsamaiso, Yunibesithi ya Disaense tsa Boitekanelo, Talente, Tsamaiso ya
Talente, Tokololo ya Ditlhokego tsa Katiso le Tshekatsheko ya Ditlhokego tsa Katiso.
vii
SETSOPOLWA
TSHEKATSHEKO YA DINYAKWA TŠA TLHAHLO LE TAOLO YA TALENTE
YA BAŠOMI BA TSHEPEDIŠO KA YUNIBESITHING YA DITHUTAMAHLALE
TŠA MAPHELO
ka
Heriet Nancy Matlakala
MOHLAHLI WA THUTO : Moprof Adele Bezuidenhout
MOTHUŠAMOHLAHLI WA THUTO: Ms Liezel Diedericks
LEFAPHA : Bolaodi bja Merero ya Bašomi
KGRATA : Mastase wa Dithutakgwebo
Maikemišetšo a dinyakišišo tše e bile go utolla kamano magareng ga tshepedišo ya
tshekatsheko ya dinyakwa tša tlhahlo (TNA) le ditiro tša taolo ya talente (TM) ya bašomi
ba tshepedišo ka yunibesithing ya dithutamahlale tša maphelo (HSU). Sebopego sa lefelo
la mošomo la ka kantorong le mokgwa wa tshekatsheko ya dinyakwa tša tlhahlo (TNAM)
di laetša gore tlhamo ya dithuto tša maloko a bašomi ba tshepedišo ga e akaretše tše
dingwe tša metheo ye bohlokwa ya TNA le TM. Se se ka feletša ka dilo tše mmalwa tšeo
di sego tša tlwaelega mabapi le ka fao bašomi ba tshepedišo ba šomago ka gona, ba
bolelago le go boledišana le bolaodi ba bona ka mošomong. Ge se se ka se rarollwe, dilo
tše di sego tša tlwaelega di ka ama maemo a dinyakego tša tlhahlo tša bašomi ba
tshepedišo le TM gampe. Godimo ga fao, kgonagalo ya gore ba ka tšwa ka fao
yunibesithing e ka oketšega. Ka lebaka la se, dinyakišišo tša bontši tša inthaneteng di
dirilwe mabapi le sampole ya dipalopalo tša bašomi ba tshepedišo ba sa ruri ba 163 (n =
163) (e lego bangwaledi le bahlankedi ba tshepedišo) ka yunibesithing ye itšego.
Ge go hlokega go ba le maswanedi go mošomo, tshekatsheko ya go utolla mabaka
(EFA) e utollotše mokgwa wa mabaka a mane wa tshepedišo ya TNA le mokgwa wa
mabaka a mararo wa tiro ya TM. Tshekatsheko ya kamano e utollotše kamano ye
bohlokwa go dipalopalo magareng ga maikutlo a tshepedišo ya TNA le tiro ya TM.
Kamano ye e sego ya felela ya phapano gabedi e utollotše kamano ye bohlokwa ye
kaone goba kamano magareng ga tshepedišo ya TNA le tiro ya TM. Teko ya Mann-
Whitney le yona e šomišitšwe go tseba phapano ye nnyane magareng ga dihlopha tšeo
di theilwego go tshepedišo ya TNA le tiro ya TM. Diteko tša bohlokwa bja dipalopalo di ra
viii
gore diphapano ga se tša laetša phapano ye kgolo magareng ga bašomi ba tshepedišo
ba basadi le ba banna. Phapano ye kgolo le yona ga se ya laetšwa mabapi le mengwaga,
thaetlele ya mošomo, maemo a mošomo le lebaka leo mošomi a le tšerego a le
mošomong. Mabapi le maemo a mošomo, ga se gwa ba le diphapano tše kgolo tšeo di
hweditšwego magareng ga bašomi ba tshepedišo bao ba nago le dikgrata tša mathomo
le bao ba nago le dikgrata tša bobedi. Dikutollo tše di direga gape ka bašoming ba go
swana le bona gomme di ka thuša ka go kaonafatšeng ga maitemogelo a ka mošomong
a bašomi ba bangwe ba ka dikantorong. Godimo ga fao, monyakišiši o dumela gore
dipoelo tša dinyakišišo tše di tla thuša bolaodi bja yunibesithi le karolo ya lefapha la
tlhabollo ya bašomi (HRD) go latela tshepedišo ye e nyakegago ya TNA. Se gape se tla
kaonafatša tiro ya TM ya bašomi ba tshepedišo ka go netefatša gore dinyakwa tša bona
tša tlhahlo di amana le mešomo ya bona, le gore di-TNA di a dirwa go netefatša gore dinepo
tša yunibesithi di a fihlelelwa.
Mareo a bohlokwa
Bašomi ba Tshepedišo, Yunibesithi ya Dithutamahlale tša Maphelo, Talente, Taolo ya
Talente, Tshekatsheko ya Dinyakwa tša Tlhahlo le Tshekatsheko ya Dinyakwa tša
Tlhahlo.
ix
TABLE OF CONTENTS
DECLARATION ........................................................................................................................... I
ACKNOWLEDGEMENTS ........................................................................................................... II
ABSTRACT ............................................................................................................................... III
CHAPTER 1 ............................................................................................................................... 1
SCIENTIFIC ORIENTATION AND BACKGROUND ................................................................... 1
1.1 INTRODUCTION ...................................................................................................... 1
1.2 BACKGROUND AND MOTIVATION ........................................................................ 2
1.3 BACKGROUND TO THE PROBLEM ....................................................................... 5
1.3.1 PROBLEM STATEMENT .................................................................................................. 6
1.4 RESEARCH QUESTIONS ....................................................................................... 7
1.4.1 Research question relating to the literature review ................................................... 7
1.4.2 Research question relating to the empirical study .................................................... 7
1.4.3 Research questions integrating literature and empirical questions ........................... 8
1.4.4 Aim of the study ....................................................................................................... 8
1.4.5 Research objectives ................................................................................................. 8
1.5 SIGNIFICANCE OF THE STUDY ............................................................................. 8
1.6 HYPOTHESIS .......................................................................................................... 9
1.7 DEFINITION OF TERMS ......................................................................................... 9
1.8 THEORETICAL FOUNDATIONS OF THE STUDY ................................................ 10
1.9 CONCEPTUAL FRAMEWORK .............................................................................. 11
1.10 INTRODUCTION TO RESEARCH DESIGN AND METHODOLOGY ..................... 12
1.11 DELIMITATIONS .................................................................................................... 12
1.12 ETHICAL CONSIDERATIONS ............................................................................... 13
1.13 CHAPTER LAYOUT ............................................................................................... 13
1.14 CHAPTER SUMMARY ........................................................................................... 14
CHAPTER 2 ............................................................................................................................. 15
TRAINING NEEDS ANALYSIS ................................................................................................. 15
2.1 INTRODUCTION .................................................................................................... 15
2.2 THE CONTEXT OF STRATEGIC HUMAN RESOURCE DEVELOPMENT ............ 17
2.3 CONCEPTUALISATION AND DEFINITION OF TRAINING NEEDS ANALYSIS .... 19
2.4 PURPOSE AND SIGNIFICANCE OF TRAINING NEEDS ANALYSIS .................... 23
2.4.1 Training needs analysis and training ...................................................................... 27
2.5 THE PROCESS OF TRAINING NEEDS ANALYSIS .............................................. 29
2.5.1 Organisational level training needs analysis ........................................................... 30
2.5.2 Individual level training needs analysis ................................................................... 31
x
2.5.3 Task level training needs analysis .......................................................................... 32
2.6 TYPES OF TRAINING NEEDS .............................................................................. 33
2.6.1 Formal training needs............................................................................................. 33
2.6.2 Informal training needs ........................................................................................... 34
2.7 MODELS FOR CONDUCTING / EXECUTING TRAINING NEEDS ANALYSIS ...... 34
2.7.1 Three-level O-T-P model – foundation framework .................................................. 35
2.7.2 Michalak’s and Yager’s model ................................................................................ 36
2.7.3 Proposed training need analysis practice model ..................................................... 38
2.7.4 The advantages and disadvatages of the models ................................................... 40
2.8 PREVIOUS RESEARCH FINDINGS ON THE TRAINING NEEDS ANALYSIS OF
ADMINISTRATIVE STAFF AT UNIVERSITIES ...................................................... 42
2.8.1 Language and intercultural courses, participation in mobilty programmes and staff
week ...................................................................................................................... 42
2.8.2 Communication skills.............................................................................................. 43
2.8.3 Technological skills ................................................................................................ 43
2.9 DEMOGRAPHICAL VARIABLES AND THE PERCEPTION OF THE
EFFECTIVENESS OF TRAINING NEEDS ANALYSIS ........................................... 44
2.9.1 Age ........................................................................................................................ 44
2.9.2 Gender ................................................................................................................... 44
2.9.3 Job title .................................................................................................................. 44
2.9.4 Educational level .................................................................................................... 45
2.9.5 Job level ................................................................................................................. 45
2.9.6 Tenure ................................................................................................................... 45
2.10 HISTORICAL THEORETICAL PERSPECTIVES ON TRAINING NEEDS ANALYSIS
............................................................................................................................... 46
2.11 THE SUCCESS FACTORS OF TRAINING NEEDS ANALYSIS ............................. 47
2.12 SUCCESS FACTORS AND BEST PRACTICE FOR TRAINING NEEDS ANALYSIS
............................................................................................................................... 48
2.13 CHAPTER SUMMARY ........................................................................................... 51
TALENT MANAGEMENT WITHIN THE CONTEXT OF A HIGHER EDUCATION INSTITUTION
................................................................................................................................................. 52
3.1 INTRODUCTION .................................................................................................... 52
3.2 CONCEPTUALISATION OF TALENT AND TALENT MANAGEMENT ................... 52
3.2.1 Conceptualising ‘talent’ .......................................................................................... 53
3.2.1.1 Inclusive subject approach: talent as all people ...................................................... 53
3.2.1.2 Exclusive subject approach: talent as few people ................................................... 54
3.2.2 Conceptualising talent management ...................................................................... 56
3.3 DIFFERENT APPROACHES TO TALENT MANAGEMENT ................................... 59
xi
3.3.1 Exclusive (elitist) approach ..................................................................................... 60
3.3.2 Inclusive (egalitarian) approach .............................................................................. 61
3.4 THE PURPOSE AND SIGNIFICANCE OF TALENT MANAGEMENT .................... 62
3.5 TALENT MANAGEMENT PROCESS ..................................................................... 63
3.5.1 Dimensions/steps in the process of talent management ......................................... 64
3.5.1.1 Talent planning....................................................................................................... 65
3.5.1.2 Recruitment ............................................................................................................ 66
3.5.1.3 Compensation and reward ..................................................................................... 66
3.5.1.4 Performance management ..................................................................................... 66
3.5.1.5 Employee empowerment ........................................................................................ 67
3.5.1.6 Employee engagement .......................................................................................... 67
3.5.1.7 Organisational culture ............................................................................................ 67
3.5.2 Models to talent management ................................................................................ 68
3.5.2.1 Talent life cycle ...................................................................................................... 68
3.5.2.2 Global talent management strategic framework...................................................... 69
3.5.2.3 The multiple-actors model: employees at the heart of the talent system ................. 71
3.5.2.4 Talent management wheel ..................................................................................... 73
3.5.2.5 CRF talent management system ............................................................................ 76
3.5.3 Advantages and disadvantages of talent management .......................................... 78
3.5.3.1 Advantages ............................................................................................................ 78
3.5.3.2 Disadvantages ....................................................................................................... 79
3.6 TALENT MANAGEMENT IN THE CONTEXT OF ADMINISTRATIVE STAFF IN THE
HIGHER EDUCATION SECTOR ........................................................................... 80
3.6.1 The higher education sector ................................................................................... 80
3.6.2 Administrative staff in the higher education sector .................................................. 81
3.6.2.1 Skills required by administrative staff in higher education ....................................... 82
3.6.3 Current competency frameworks for higher education administrative staff ............. 84
3.7 EFFECTS OF DEMOGRAPHIC VARIABLES OF ADMINISTRATIVE STAFF ON
TALENT MANAGEMENT ....................................................................................... 86
3.7.1 Age ........................................................................................................................ 86
3.7.2 Gender ................................................................................................................... 86
3.7.3 Job title .................................................................................................................. 87
3.7.4 Qualification ........................................................................................................... 87
3.7.5 Job level ................................................................................................................. 87
3.7.6 Work experience .................................................................................................... 87
3.8 CONCEPTUAL FRAMEWORK ON THE LINK BETWEEN TNA AND TM .............. 88
3.9 CONCEPTUAL FRAMEWORK MODEL OF TNA AND TM OF THE STUDY.......... 95
3.10 CHAPTER SUMMARY ........................................................................................... 96
xii
CHAPTER 4 ............................................................................................................................. 97
RESEARCH METHODOLOGY AND DESIGN ......................................................................... 97
4.1 INTRODUCTION .................................................................................................... 97
4.2 RESEARCH PHILOSOPHY ................................................................................... 97
4.3 RESEARCH DESIGN ............................................................................................. 98
4.4 RESEARCH APPROACH ...................................................................................... 98
4.5 RESEARCH METHOD ........................................................................................... 98
4.5.1 Determination and description of the sample .......................................................... 99
4.5.1.1 Composition of the sample by age ......................................................................... 99
4.5.1.2 Composition of the sample by gender .................................................................. 100
4.5.1.3 Composition of the sample by job title .................................................................. 101
4.5.1.4 Composition of the sample by educational level ................................................... 102
4.5.1.5 Composition of the sample by job level ................................................................ 102
4.5.1.6 Composition of the sample by tenure ................................................................... 103
4.5.1.7 Composition of the sample by schools and department ........................................ 104
4.5.1.8 Composition of the sample by tenure in terms of their current position ................. 105
4.5.1.9 Summary: Demographical profile of the sample ................................................... 106
4.5.2 Measuring Instruments ......................................................................................... 106
4.5.3 Research procedures ........................................................................................... 107
4.5.4 Data analysis ....................................................................................................... 108
4.5.4.1 Exploratory factor analysis ................................................................................... 108
4.5.4.2 Reliability .............................................................................................................. 109
4.5.4.3 Descriptive statistics ............................................................................................. 109
4.5.4.4 Correlations .......................................................................................................... 110
4.5.4.5 Test for significant mean differences .................................................................... 110
4.6 ETHICAL CONSIDERATIONS ............................................................................. 110
4.7 FORMULATION OF THE HYPOTHESES ............................................................ 112
4.8 CHAPTER SUMMARY ......................................................................................... 113
CHAPTER 5 ........................................................................................................................... 114
RESEARCH RESULTS .......................................................................................................... 114
5.1 INTRODUCTION .................................................................................................. 114
5.2 VALIDITY ............................................................................................................. 114
5.2.1 Content validity measures .................................................................................... 114
5.2.2 Exploratory factor analysis ................................................................................... 115
5.2.2.1 EFA for training needs analysis model (TNAM) .................................................... 116
5.4.2.2 Exploratory factor analysis for talent management ............................................... 123
5.3 RELIABILITY ........................................................................................................ 130
5.3.1 Reliability test for training needs analysis model (TNAM) ..................................... 130
xiii
5.3.1.1 Reliability for feedback construct .......................................................................... 130
5.3.1.2 Reliability of organisational analysis construct ...................................................... 132
5.3.1.3 Reliability for task significance construct .............................................................. 133
5.3.1.4 Reliability of task analysis construct ..................................................................... 134
5.3.1.5 Reliability of total training needs analysis construct .............................................. 135
5.3.2 Reliability test for Talent Management Constructs (TM) ....................................... 138
5.3.2.1 Reliability coefficient of talent development .......................................................... 139
5.3.2.2 Reliability coefficient of talent selection ................................................................ 141
5.3.2.3 Reliability coefficient of talent utilisation................................................................ 142
5.3.2.4 Reliability of total talent management construct .................................................... 143
5.4 DESCRIPTIVE STATISTICS ................................................................................ 146
5.4.1 Descriptive statistics for training needs analysis ................................................... 146
5.4.2 Interpretation of the descriptive results pertaining to training needs analysis ........ 148
5.4.3 Descriptive statistics for talent management ........................................................ 149
5.4.4 Interpretation of the descriptive results pertaining to talent management ............. 150
5.5 CORRELATIONAL ANALYSIS ............................................................................. 151
5.6 TEST FOR SIGNIFICANT MEAN DIFFERENCES ............................................... 154
5.6.2 Test for significant mean differences with regard to TNA ...................................... 155
5.6.2.1 Age ...................................................................................................................... 155
5.6.2.2 Gender ................................................................................................................. 155
5.6.2.3 Job title ................................................................................................................ 156
5.6.2.4 Educational level .................................................................................................. 157
5.6.2.5 Job level ............................................................................................................... 157
5.6.2.6 Tenure ................................................................................................................. 158
5.6.3 Test for significant mean differences with regard to TM ........................................ 159
5.6.3.1 Age ...................................................................................................................... 159
5.6.3.2 Gender ................................................................................................................. 160
5.6.3.3 Job title ................................................................................................................ 161
5.6.3.4 Educational level .................................................................................................. 161
5.6.3.5 Job level ............................................................................................................... 162
5.6.3.6 Tenure ................................................................................................................. 163
5.7 CONCLUSIONS REGARDING THE RESEARCH HYPOTHESES ....................... 164
5.8 CHAPTER SUMMARY ......................................................................................... 166
CHAPTER 6 ........................................................................................................................... 167
CONCLUSIONS, LIMITATIONS AND RECOMMENDATIONS ............................................... 167
6.1 INTRODUCTION .................................................................................................. 167
6.1.1 RESEARCH QUESTIONS RELATING TO THE LITERATURE REVIEW ...................... 167
6.1.2 RESEARCH QUESTIONS RELATING TO THE EMPIRICAL STUDY ........................... 167
xiv
6.2 CONCLUSIONS ................................................................................................... 168
6.2.1 Conclusions relating to the literature .................................................................... 168
6.2.2 Conclusion relating to the empirical results .......................................................... 172
6.3 THE SIGNIFICANT CONTRIBUTION OF THE STUDY ........................................ 177
6.3.1 Theoretical contribution ........................................................................................ 177
6.3.2 Empirical contribution ........................................................................................... 177
6.3.3 Practical contributions .......................................................................................... 178
6.4 LIMITATIONS ...................................................................................................... 178
6.4.1 Limitations of the literature review ........................................................................ 178
6.4.2 Limitations of the empirical study ......................................................................... 178
6.5 RECOMMENDATIONS ........................................................................................ 180
6.5.1 Recommendation for practice related to TNA process and TM practice in a higher
education setting .................................................................................................. 180
6.5.2 Recommendation for integration of the TNA process and TM practice within the
plans of the university........................................................................................... 181
6.5.3 Recommendation for future research ................................................................... 182
6.6 CHAPTER SUMMARY ......................................................................................... 182
6.7 COMMUNICATING THE RESULTS ..................................................................... 182
LIST OF REFERENCES ........................................................................................................ 184
ANNEXURES ......................................................................................................................... 214
ANNEXURE A: Ethical Clearance (Unisa HRM Ethics Review Committee) ............................ 215
ANNEXURE B: E-mail requesting permission to collect data at Sefako Makgatho Health
Sciences University .............................................................................................. 217
ANNEXURE C: Permission granted to collect data at Sefako Makgatho Health Sciences
University ............................................................................................................. 219
ANNEXURE D: Consent letter (administrative staff member) ................................................. 220
ANNEXURE E: Questionnaire ................................................................................................ 221
xv
LIST OF TABLES
Table 2.1 Three level O-T-P model ................................................................................... 40 Table 2.2 Michalak’s and Yager’s model ........................................................................... 41 Table 2.3 Proposed TNA model ........................................................................................ 42 Table 2.4 The success factors of training needs analysis .................................................. 47 Table 3.1 Phases and success factors of talent management ........................................... 94 Table 4.1 Age distribution of sample (N=163) .................................................................... 99 Table 4.2 Gender distribution of sample (N=163) ............................................................ 100 Table 4.3 Job title distribution of sample (N=163) ............................................................ 101 Table 4.4 Educational level distribution of sample (N=163) ............................................. 102 Table 4.5 Job level distribution of sample (N=163) .......................................................... 102 Table 4.6 Tenure distribution of sample (N=163) ............................................................. 103 Table 4.7 Schools and Department distribution of sample (N=163) ................................. 104 Table 4.8 Tenure in their current position (N=163) .......................................................... 105 Table 4.9 Research hypotheses ...................................................................................... 112 Table 5.1 KMO and Bartlett’s test .................................................................................... 115 Table 5.2 Communalities for the training needs analysis model ...................................... 116 Table 5.3 Total variance explained on TNAM .................................................................. 117 Table 5.4 Factor analysis for the training needs analysis................................................. 119 Table 5.5 Four new factors of training needs analysis ..................................................... 123 Table 5.6 KMO for talent management ............................................................................ 123 Table 5.7 Communalities of talent management .............................................................. 124 Table 5.8 Total variance explained on talent management .............................................. 125 Table 5.9 Factor analysis of the talent management ....................................................... 127 Table 5.10 Three new factors of talent management ......................................................... 129 Table 5.11 Reliability coefficients of feedback construct (N=163) ...................................... 131 Table 5.12 Reliability coefficients of organisational analysis construct (N=163) ................. 132 Table 5.13 Reliability coefficients of task signifance construct (N=163) ............................. 133 Table 5.14 Reliability coefficients of task analysis construct (N=163) ................................ 134 Table 5.15 Reliability coefficients for the total training needs analysis (N=163) ................. 135 Table 5.16 Reliability coefficients of talent development (N=163) ...................................... 139 Table 5.17 Reliability coefficients of talent selection (N=163) ............................................ 141 Table 5.18 Reliability coefficients of talent utilisation (N=163) ........................................... 142 Table 5.19 Reliability coefficients of for the total talent management (N=163) ................... 143 Table 5.20 Mean, Standard deviations, skewness and kurtosis for TNA-4 (N=163) ........... 146 Table 5.21 Mean, standard deviations, skewness and kurtosis for talent management
(N=163) ........................................................................................................... 149 Table 5.22 Correlations between TNA-4 and TM (N=163) ................................................. 152 Table 5.23 Age mean differences (N=163) ........................................................................ 155 Table 5.24 Gender mean differences (N=163) .................................................................. 156 Table 5.25 Job title mean differences (N=163) .................................................................. 156 Table 5.26 Educational level mean differences (N=163) .................................................... 157 Table 5.27 Job level mean differences (N=163) ................................................................ 158 Table 5.28 Tenure mean differences (N=163) ................................................................... 158 Table 5.29 Age mean differences on talent management (N=163) .................................... 159 Table 5.30 Gender mean differences on talent management (N=163) .............................. 160 Table 5.31 Job title mean difference (N=163) .................................................................... 161 Table 5.32 Educational mean difference (N=163) .............................................................. 162 Table 5.33 Job level mean differences (N=163) ................................................................ 162 Table 5.34 Tenure mean differences (N=163) ................................................................... 163 Table 5.35 Summary of the findings of research hypotheses ............................................ 164
xvi
LIST OF FIGURES
Figure 2.1 Three-level O-T-P model foundation framework 35 Figure 2.2 Michalak’s and Yager’s model 37 Figure 2.3 Proposed training need analysis practice model 39 Figure 3.1 Seven blocks of talent management .................................................................. 65 Figure 3.2 Talent life cycle .................................................................................................. 69 Figure 3.3 Global talent management strategic framework ................................................. 70 Figure 3.4 The multiple-actors model: employees at the heart of the talent system ............ 71 Figure 3.5 The talent management wheel ........................................................................... 74 Figure 3.6 The CRF talent management system ................................................................ 77 Figure 3.7 HC Bridge decision framework .......................................................................... 90 Figure 3.8 Talent management and training needs analysis conceptual model of HSU ...... 95 Figure 4.1 Sample distribution by age (N=163) ................................................................. 100 Figure 4.2 Distribution by gender (N=163) ........................................................................ 100 Figure 4.3 Sample distribution by job title (N=163) ........................................................... 101 Figure 4.4 Sample distribution by educational level (N=163) ............................................ 102 Figure 4.5 Sample distribution by job level (N=163) .......................................................... 103 Figure 4.6 Sample distribution by tenure (N=163). ............................................................ 104 Figure 4.7 Sample distribution by schools and departments (N=163) ............................... 105 Figure 5.1 Scree plot for the training needs analysis model .............................................. 118 Figure 5.2 Factor plot for the training needs analysis model ............................................. 118 Figure 5.3 Scree plot for the talent management .............................................................. 125 Figure 5.4 Factor plot for talent management ................................................................... 126
xvii
LIST OF ABBREVIATIONS
GTM Global Talent Management
HE Higher Education
HR Human Resources
HRD Human Resource Development
HSU Health Sciences University
KSAs Knowledge, Skills, and Abilities
O-J-T On-The-Job Training
O-T-P Organisation-Task-Person
SDA Skills Development Act
SDLA Skills Development Levies Act
SHRD Strategic Human Resource Development
SMUREC Sefako Makgatho University Research Ethics Committee
TM Talent Management
TNA Training Needs Analysis
TNA Training Needs Assessment
1
CHAPTER 1
SCIENTIFIC ORIENTATION AND BACKGROUND
1.1 INTRODUCTION
Training refers to the action of imparting a specific skill to an employee with the view to
empower them to perform a particular task. On the other hand, development deals with
the general enhancement and growth of individual abilities through learning (Asfaw,
Argaw & Bayissa, 2015; George & Jacob, 2016; Ologunowa, Akintunde & Adu, 2015).
TNA of administrative staff, namely, secretaries and administrative officers remain
important for the achievement of the organisations’ planned goals and objectives.
Therefore, administrative staff must be trained so that they can achieve the organisational
goals. In order to address these training needs, the organisations, task and people (OTP)
foundation framework of TNA model, should be used expansively.
One of the main components of OTP is that TNA identifies training needs at employee,
departmental or organisational level in order to help the organisation to perform effectively
(Khan & Al Zubaidy, 2016). TNA needs to be conducted, so that the priority training needs
can be identified to assist in equipping the employees with the right skills for the
organisation (Vinesh, 2014). Therefore, the role of the organisation is to manage the
employees' talent for future skills (Kurgat, 2016). Vaiman, Haslberger and Vance (2015:
281) refer to talent as specified and in-demand knowledge, skills and abilities among
individuals in critical job roles, and TM as a set of organisational procedures aimed to
attract, develop, mobilise, and retain key people.
According to Collings, Scullion and Vaiman (2015) TM methods need to be more
balanced among organisational needs and that they should be closely connected with
employees’ objectives and expectations to retain high potential talents. Therefore, the
methods of TM have led to a variety of definitions of the concept. TM focuses on two
significant dimensions; firstly, this includes the employees who are employed in key roles
and those who possess high levels of talent (measured by their knowledge, skills, and
abilities that add significant value) in an organisation. Secondly, it involves extra HRM
2
policies, processes, and techniques that are efficiently used to manage such talented
individuals (Vaiman et al., 2015).
Administrative staff at the HSU include personnel who hold positions such as secretaries,
administrative officers, personal assistants and clerks. These are normally referred to as
support staff. Okolocha and Baba (2017) explain that a “secretary” could be defined as
an officer, responsible for archives, communication, minutes of the meetings, and related
matters of an organisation. The secretary should have the ability to think and act fast,
especially, in an automated office. Therefore, to expand on the skills of secretaries, there
is a need to measure their current skills, against the expected skills, in order to close the
gap which exists as a result of lack of the required skills. The assessment of secretaries’
training needs is important, as secretaries play a crucial role in the accomplishment of
organisational objectives (Okolocha & Baba, 2017). In this study, the administrative staff
refers to secretaries and administrative officers working in the specific HSU.
1.2 BACKGROUND AND MOTIVATION
In terms of the legislation in South Africa, the Department of Higher Education, together
with the Sector Educational Training Authority supports the view of training and
development of employees in the workplace (Bezuidenhout & Nenungwi, 2012; Erasmus,
Loedolff, Mda & Nel, 2015). Therefore, HRD practitioners have to identify the training
needs, in conjunction with the workplace skills plan of the organisation and ensure that
employees comply with the legislation.
Furthermore, it is the responsibility of the employer to ensure that employees comply with
legislation regarding job-related training and development, by attending training aligned
to the workplace skills plan, regularly. Erasmus et al. (2015) estimate that South African
organisations spend an average of 3.13 percent of their payroll on training and
development. Shaheen, Naqvi and Khan (2013) indicate that trained employees are more
efficient and effective, compared to those that are untrained. According to Botha, Kiley,
Truman and Tshilongamulenzhe (2013), ensuring that employees master the desired
skills, has become the major focus of human resources development efforts in
organisations.
3
Clinton, Emmanuel and Denzel (2016) found that the Skills Development Levies Act (Act
9 of 1999) (SDLA) and the Skills Development Act (SDA) 97 of 1998 include new rules
that employment services should make learning and training programmes available. For
the formerly deprived clusters, this has to give employees chances to advance new skills
and be re-skilled, so they can find new marketplaces and explore technological inventions
(Peterson, 2006).
Teffu (2014) indicates that workplace skills plans, in particular, detect the skills shortages
at the organisation level and specify the scarce skills within a specific area and the
budget. However, the South African government also needs to admit mistakes being
made during the application of the policy of employment equity, such as TM practices and
review; which may exacerbate the problem of skills shortages (Van Antwerpen & Ferreira,
2016).
Hurlimann, March and Robins (2013) allude to the fact that there is often complete neglect
of administrative staff's work in higher education (HE) environments. Likewise, a study
conducted by Barkhuizen, Mogwere and Schutte (2014) on administrative staff in HE
found that all the TM practices are poorly applied and large gaps exist between the
present applications and the perceived significance of talent review process, retention
practices, talent development and commitment management.
The purpose of the Skills Development Act (SDA) 97 of 1998 is pivotal to the development
of the skills of South African employees. This is made possible by the capacity of this
piece of legislature to improve the quality of their lives, productivity in the workplace, and
competitiveness of employers (SDA, section 2). In addition, the SDA 97 of 1998
encourages employers to offer employees opportunities to acquire new skills. In
compliance with the act mentioned above, it is imperative that every employer, should
ensure that the skills of the employees are continuously improved so as to achieve the
organisational goals. To achieve the purpose of the SDA, it is essential to accurately
identify the training needs of employees. Each individual organisation is responsible for
the training of its employees, assessments of training needs, as well as a performance
review for such employees (Clinton et al., 2016).
The HSU has experienced tremendous and rapid changes in 2005 as well as 2014 due
to the dissolution from the merger with another university (Mukwawaya, 2015). The recent
4
demerger and the name change of the former campus to HSU have brought challenges
which included staff members experiencing a lack of training interventions, organisational
orientation and resources. Within this rapidly changing environment, insecurity
intimidates staff members and may lead to a lack of motivation (Mukwawaya, 2015).
Consequently, the university continues to work with the same administrative staff in a new
or changing environment that has new or changed goals. However, with the name change
and process changes aligned to the new university, there has not been much attention
given to the needs of the administrative staff to be able to meet the organisational goals.
This poses a number of challenges that include: tensions, obstructions, incapacity and a
lack of motivation among staff.
According to Sefako Makgatho Health Sciences University’s (2015) policy, this university
is committed to and directed by the value of lifelong learning to training and development.
The university supports the values embedded in the Constitution of the Republic of South
Africa; namely, human dignity, equality, fairness and social justice (Dlamini & Mulaudzi,
2016; South Africa, 2016). These include adhering to the principles of integrity, academic
freedom and excellence which are highly regarded by this institution (Sefako Makgatho
Health Sciences University, 2015). Academic excellence rests itself on support by
administrative processes. Therefore, there is a need to look into the needs assessment
of administrative personnel to ensure efficiency in the support for academic excellence.
This aligns with training and development of staff to undertake their activities.
Literature reveals that training is the process of learning, development, acquiring
additional skills and consciousness of knowledge for an employee to improve on a
specific job which can increase organisational performance (Asfaw, Argaw & Bayissa,
2015; Obi-Ankie & Ekwe, 2014; Raza, 2014; Saleem, Shahid & Naseem, 2011; Singh,
Ram & Prasad, 2016). In addition, Obi-Ankwe and Ekwe (2014) and Nudy (2015) state
that training is essential for personal growth opportunities of employees as it promotes
the attainment of organisational objectives. Generally, TM focuses on the concepts of
loyalty, job, fulfilment and organisational output (Kurgat, 2016). As a result, the
relationship between TNA and TM lies on the job, task and the organisation.
AlYahya, Mat and Awadh (2013) support the view of training as a structured learning
practice such as seminars and workshops. These practices are usually focused on
improving specific skills. However, HRD focuses on all the essential skills the employees
5
in the organisation require if they are to be effective. Training could thus be considered
as one of many different instruments available for HRD practitioners (AlYahya et. al.,
2013).
Rama Devi and Shaik (2012) state that training enables the employees to acquire
improved skills which leads to better performance. On the other hand, Nudy (2015)
explains that training helps to effect synergy between what should happen and what is
happening between the desired standards and the current level of work performance.
Therefore, more employees should attend required training, so that the needed skills are
acquired.
Asfaw et al. (2015) and Erasmus et al. (2015) found that for organisations to reach their
goals, the main aim for HRD practitioners should be to increase their employees’
competencies, especially when the employees are low on work performance due to a lack
of knowledge. Therefore, organisations must invest more in their own employees’
knowledge and skills, in order to realise their goals. A TNA process provides information
on the training and skills development requirements of all members of an organisation.
Organisations, whether in the private or public sector agree that training and development
are essential to the growth and development of the organisation (AlYahya et al., 2013).
The HSU as well requires the TNA and TM following the changes brought about by the
demerger.
1.3 BACKGROUND TO THE PROBLEM
The statement of a problem indicates the particular phenomenon of interest which is of
importance to the researcher. The problem indicates the rationale for which the scientific
enquiry is done, and therefore is the focus of the investigation. In this study the problem
of interest is the apparent undefined TNA processes and TM structure with special
reference to administrative staff in a changed environment of the HSU. Administrative
staff in many organisations in South Africa, including the HSU, are an instrumental asset
for growth to the organisation; and they are regarded as the backbone of any successful
organisation (Destiny, 2016). Adam (2015) is of the view that there is no doubt that
secretaries are the top office management and administration experts, globally.
6
In relation to the specific setting for this study, which is the HSU, the demerger of the two
previous universities and the subsenquent institution of the new HSU brought about
extensive changes. The changes include the new name, strategic focus and goals, and
new processes as well as the vision of the university. However, the staff in the university
remains the same. The administrative staff in this institution serve both academic, medical
and student populations that are tied to the university. They are expected to perform
activities in a highly efficient manner, dispite the changes that have been introduced after
the demerger.
Failure to invest in the training needs of organisational personnel may result in an inability to
keep abreast of the ever changing global technology (Aliata & Hawa 2014; Chinyere, 2016).
Furthermore, it may also result in the administrative members of staff becoming redundant
due to the fear of new technological advancements (Erasmus, et al., 2015). Okolocha and
Baba (2017) state that secretaries should become more conscious of new technology and
how they affect the management of archives and record keeping.
Lack of knowledge about TNA leads to training that is not planned (Balisi, 2014). The training
needs assessment is the method of determining if a training need exists and if it does, what
training is required to fill the gap (Balisi, 2014). The required skills that are needed for the
administrative staff following a de-merger and subsequent reconfiguration of the
administrative staff complement is essential.
The inconsistency between the present condition of administrative staff in terms of skills
required and the preferred condition must be investigated to identify training needs. An
investigation into the TNA process and TM practices of HSU for administrative staff may
provide the university management and the HRD section with the information required in
order to make decisions on the skills required.
1.3.1 PROBLEM STATEMENT
The TNA process and the TM practices for administrative staff at the HSU are not well
defined. It is uncertain what these processes should look like for the new HSU in order to
address administrative staff needs in terms of the TNA process and TM practices; as well
as to ensure the attainment of the organisational goals. As indicated, the demerger put
the spotlight on the obvious need for adequate TNA and TM for the administrative staff at
the HSU. An investigation of the current, limited, TNA process and TM practices is crucial
for the purpose of equipping all administrative staff with the necessary abilities to achieve
7
organisational efficacy. The skills of the administrative staff at the HSU need to be
investigated and improved because any lack of required skills among the staff will
constitute a drawback in the attainment of organisational goals. For this reason, it is
important to investigate whether the perception of the TNA process and TM practices are
linked within the HSU environment.
1.4 RESEARCH QUESTIONS
Based on the aforementioned research problem, the research questions were formulated.
These were informed by the literature surveyed and the empirical study:
1.4.1 Research question relating to the literature review
The following research questions were formulated:
• How are the two constructs of the TNA process and TM practices conceptualised
and explained by theoretical models in literature?
• Does a theoretical link between the perception of TNA process and TM practices
exist?
• What are the different theoretical frameworks governing the TNA process and TM
practices?
1.4.2 Research question relating to the empirical study
With regard to the empirical study, the following research questions were addressed:
• Is there an empirically tested relationship between the TNA process and TM
practices at the HSU?
• What are the differences with regard to biographical variables (age, gender, job
title, educational level, job level and tenure) of the outcome of the TNA process
and TM practices?
8
1.4.3 Research questions integrating literature and empirical questions
• What recommendations can be formulated for conducting the TNA process and
TM practices of administrative staff in a higher education setting?
• What recommendations can be offered to ensure that TNA facilitates TM of
administrative staff within the university?
1.4.4 Aim of the study
The aim of this research was to investigate the link between the perception of TNA
process and TM practice within an HSU environment; in order to make recommendations
for training and management of talent for the administrative staff in the HSU university.
1.4.5 Research objectives
Research objectives in this study guided on the information to be obtained in preparation
to achieve the aim of the study. The objectives of the study were to:
• investigate the link or relationship between the perception of TNA process and TM
practices within the HSU environment.
• measure perceptions of administrative staff in terms of the TNA process and the
TM practices at the HSU.
• evaluate the differences in the TNA process and TM practices with regard to
demographic variables of age, gender, job title, educational level, job level and
tenure.
• make recommendations to ensure that training and management of talent for the
administrative staff are integrated into the development plans of employees in the
university.
1.5 SIGNIFICANCE OF THE STUDY
Against the aforementioned background, this study intends to augment the human
resource management (HRM) literature by illustrating the relationship between TNA and
TM. Subsequently, the research seeks to investigate the nature of the link or perceived
9
relationship between the TNA and the levels of TM in an office work environment for
administrative staff. The intention is to contribute to the field of HRM and HRD, with
special references to practice within the office work environment. Developments in
technology have changed the structure of numerous organisations and further lead to the
emergence of office work environments where employees can communicate. This study
is, therefore, a point of departure towards establishing the nature of the link between the
TNA process and TM practice in the administrative staff's office work environment. This
study may prove beneficial due to the link or relationships found. Furthermore, the level
of significance between variables as well as the results of the exploratory factor analysis
may work as a beneficial source of data for human resource advisors in reshaping needs
and shaping the best human resource approaches to improve the training and TM of the
administrative staff.
1.6 HYPOTHESIS
A hypothesis is the researcher's conviction about the outcome of the study; therefore, a
hypothesis is referred to as a theoretical outcome (Spector, 2012). According to Antonius
(2013), a research hypothesis suggests the likeliest answer to a research question.
Accordingly, the major hypotheses of the study were as follows:
Ho1: There is no relationship between the perceived TNA process and TM practices in
the HSU.
Ho2: There are no significant differences between the age, gender, job title, educational
level, job level and tenure with regard to their perceptions of the TNA process and
TM practices.
Ha3: Administrative staff at HSU perceive that the current TNA process and TM
practices are not adequate.
1.7 DEFINITION OF TERMS
In order to provide the clear meanings of the words used in the study, improve
accessibility, and achieve the purpose of this study, the researcher defined the terms
below:
10
• Administrative staff: employees of the university, who are not members of the
teaching staff and who are working in the offices that support academic activities
within the university.
• Health sciences university: a university offering health sciences programmes
and that serves the community and students with health services.
• Talent: is the ability that comes without training and it is often contrasted with a
skill, which is an ability acquired and developed through practice.
• Training: is a highly useful tool that can bring an employee into a position where
they can do their job correctly, effectively, and conscientiously. Training is the act
of increasing the knowledge and skill of an employee for doing a particular job.
• Development: is a process that creates growth, progress, positive change or the
addition of physical, economic, environmental and demographic components.
• Talent management: is the methodically organised, strategic process of getting
the right talent on-board and assisting them to grow to their optimal capabilities
keeping organisational objectives in mind.
• Training needs analysis: is a process that an organisation goes through in order
to determine all the training that needs to be completed in a certain period to allow
their employees to complete their job as effectively as possible, as well as progress
and grow.
1.8 THEORETICAL FOUNDATIONS OF THE STUDY
Methodological assumptions are opinions regarding the nature of social science and
scientific research (Mouton & Marais, 1996; Penalva, 2014). According to Punch (2014)
methodological theory consists of methods on paradigms, and includes opinions.
Methods of investigation are founded on assumptions – assumptions around the nature
of the reality being considered, assumptions around what forms familiarity of this reality,
and assumptions about appropriate methods of building knowledge of this reality.
• Philosophical assumptions
The study adheres to a positivistic worldview or philosophy. According to De Vos,
Strydom, Fouché and Delport (2013) positivists believe that a phenomenon can either be
observed or experienced, and that knowledge is acquired and derived through accrued
and confirmed actualities. De Vos et al. (2013) and Creswell (2013) suggest some
11
fundamental, interrelated assumptions that the inquirer should ask in order to understand
each paradigm. Therefore, the assumptions underlying the study were as follows:
• Ontological assumption
Du Plooy-Cilliers, Davis and Bezuidenhout (2014) explain ontology as the study of
presence, reality or authenticity, containing the expectations that are prepared about
certain occurrences. The key questions contracts with what certainty (reality) is, and how
we identify what is tangible. In this research, the nature of reality is the respondents’
awareness and understanding regarding TNA, TM and the required skills of administrative
staff.
• Meta-theoretical assumption
Meta-theoretical assumptions indicate a commitment to the reality of the theories and
laws of a particular paradigm (Creswell, 2013). The assumptions that are made about the
training needs and skills competencies, are related to the person, and environment. In
this regard, it is assumed that a person who is an administrative staff member, is in
constant interaction with the environment, which is the University where the person is
employed.
• Epistemological assumption
Bless, Higson-Smith and Sithole (2013) define the epistemology as “the study of ways of
knowing about the world” and Du Plooy-Cilliers et al. (2014) define epistemology as the
resources of the study of awareness. In this study, the assumption of the researcher is
that, the knowledge, skills and attitudes required to perform their jobs to the desired
standard are indepensable . It was assumed that the respondents would give honest
answers to research related questions and would freely share their experiences. It was
also assumed that the data would be recorded accurately, and that rational conclusions
would be drawn from the available information.
1.9 CONCEPTUAL FRAMEWORK
A conceptual framework is an alternative way of depicting a set of related variables and
outcomes in the study in an elaborative schematic diagram. It shows the key factors,
12
presumed relationships and possible outcomes of the research problem. The TNA and
TM framework as well as the talent cycle were used for this study; and these are
described in detail in Chapters two and three.
1.10 INTRODUCTION TO RESEARCH DESIGN AND METHODOLOGY
Research design is a plan that describes how the research will be undertaken and
research methodology is the exposition of the total strategy for the study (Van Wyk, 2012).
A quantitative exploratory and descriptive method were followed. This approach helped
to generate an account of the reality in the university. The study was conducted in two
phases in which Phase 1 entailed a literature review on TNA processes, TM systems and
theoretical framework and models in preparation pertaining to these two aspects for
evidence to highlight the importance of the TNA and TM. Phase 2 entailed the empirical
study which was the research design and methods as well as the results of the study.
Phase 2 is the outcome of the research. Detailed descriptions of each phase are provided
in Chapters two, three, four and five.
1.11 DELIMITATIONS
The study was restricted to investigating how the core dimensions of the TNA process
are linked to the TM practice within the HSU environment. The population of interest was
administrative staff working on a permanent basis at the HSU. Though, by virtue of their
office workspace, the study focused on administrative officers and secretaries only. Other
administrative staff, such as administrative laboratory assistants were excluded from the
study.
Since the study was limited only to respondents from the HSU, the outcome cannot be
generalised to other universities or institutions of higher learning in South Africa or
elsewhere. The research was conducted in English and restricted its focus to the TNA
process and TM practices. When such a link or relationship is identified, the foundation
data could be beneficial to future researchers where the aim could be to address issues
pertinent to constructs of the TNA process and TM practice. The selected research
approach was planned to establish the cause and effect of the link or relationship in order
to explore whether such a link or relationship does in fact exist.
13
1.12 ETHICAL CONSIDERATIONS
The research was carried out with caution towards the University of South Africa’s
research ethics policy and all likely sources of harm were considered not prevented at all
times. The ethics procedures of the institution were followed throughout the research
processes. Taking part was voluntary and no remuneration whatsoever was given to
subjects. Confidentiality was upheld at all times. Furthermore, the researcher obtained
informed agreement from the participants. Ethical clearance was granted by the
University research office (Annexures A & C).
1.13 CHAPTER LAYOUT
Six chapters of the study are presented below as follows:
Chapter 1: Scientific orientation and background
Chapter one presents the background and motivation of the study, research philosophy,
background to the problem, problem statement, research questions, aims, goals and the
significance of the study.
Chapter 2: Training needs analysis
This chapter presents: the relevant literature relating to the definition of administrative
staff in HSU, the phenomenon of administrative staff, needs analysis, identification of
training needs on the required skills, barriers to efficient training and management of
organisational change on training or learning needs which stem from a performance gap
between current performance and future desired performance.
Chapter 3: Talent management within the context of a higher education institution
This chapter presents the relevant literature related to the definition of talent and
management of talent, different approaches to TM, the TM processes, with its purpose
and significance analysed. Lastly, the potential conceptual framework on the interaction
and link between effective TNA and TM is as well presented.
14
Chapter 4: Research methodology and design
Chapter four presents information on the research methodology used in this study as well
as the target popuation and selection of a sample.
Chapter 5: Research results
Chapter five presents the results that were obtained from the data analysis, tables, figures
and narrative explanations used to present the statistical analysis of the research findings.
Chapter 6: Conclusions, limitations and recommendations
Chapter six presents key results and conclusions that are drawn from the study as well
as implications of the study. This was followed by the limitations and recommendations
that emerged from the research findings.
1.14 CHAPTER SUMMARY
This chapter presented a short overview of the research project. It discussed the
background to and motivation for the study, background to the problem, problem
statement, research questions and aims, potential value add of the study, major
hypothesis, the research design and research methodology of the study. The motivation
for this study was based on the fact that identifying and analysing the TNA process and
TM practices of administrative staff at a HSU following major organisational change, might
aid the HSU and human resources (HR) professionals to develop a more committed
workforce. In addition, no known research has been conducted on the TNA and TM of
administrative staff in the context of a HSU.
Chapter two, which follows, will address the TNA process and describe various applicable
theoretical aspects concerning TNA.
15
CHAPTER 2
TRAINING NEEDS ANALYSIS
2.1 INTRODUCTION
This chapter examines strategic human resource development (SHRD) as a context
within which the TNA is practiced. The chapter goes on to explore the conceptualisation
and the significance of TNA, the types of training needs, the TNA models and
considerations of TNA, as well as the conceptual theoretical framework of the TNA.
Finally, the chapter discusses historical theoretical perspectives on TNA, the success
factors and the best practices of TNA. Taking into account the above thesis statement of
this chapter, the information about TNA will assist in realising the need to invest in training
administrative staff in organisations with the purpose to achieve excellent customer
services.
According to Khan and Al Zubaidy (2016) an organisation that decides to increase its
level of customer service as part of a corporate plan has a strategic plan to increase the
competitive advantage of the university to introduce training programmes necessary for
its success. Yousif, Ahmed and Osman (2018) indicate that TNA is a three-sided term,
which consists of training (any activities to gain knowledge, skills or change attitude),
needs (the gap between current and desired or required) and analysis (process for
identifying needs and placing them in priority order). According to Khan and Al Zubaidy
(2016) a training need is a shortage of skills or abilities, which can be reduced through
training. Training refers to the action of imparting a specific skill to an employee, in order
for him or her to do a particular job (Asfaw et al., 2015; George & Jacob, 2016; Ologunowa
et al., 2015). TNA identifies training needs at employee, departmental or organisational
level in order to assist the organisation to perform successfully (Khan & Al Zubaidy, 2016).
In addition, the aim of the TNA is to make sure that training addresses current problems,
is tailor-made to organisational objectives, and is delivered in an operative and cost-
efficient manner (Khan & Al Zubaidy, 2016). Therefore, it can be argued that for training
to be successful, the focus should be on TNA.
16
Altarawneh and Aseery (2016:191) define TNA as an investigation that is undertaken to
determine the nature of performance problems in order to establish the underlying
reasons and how training needs can address this due to individual performance. The
assumption is that a previous process or step, for example a situation analysis conducted
in the organisation, may indicate the possibility of the performance problem being due to
a lack of skills and knowledge to improve productivity rather than personal, system
problem, or a management problem. Thus, in cases where training focuses on the
current situation, people might become aware of a performance problem, then do a
situation analysis and only if the situation analysis indicates a possible knowledge
skills gap, then a full and detailed TNA will be conducted (Erasmus et al., 2015).
Altarawneh and Aseery (2016) further explain that the TNA pursue information about first
optimum performance; the real or present performance; the feeling of learners and the
causes of identified difficulties and solution. Therefore, conducting an operative
assessment confirms that training is the suitable solution to a performance shortage.
However, training is not the solution to problems triggered by poor organisational strategy
and insufficient resources (Altarawneh & Aseery, 2016). Balisi (2014) indicates that when
the TNA is done properly, the solution will address the real problem. Therefore, the TNA
can be considered to be the starting point in any training and development activities.
Manna, Singh and Sharma (2016) indicate that the TNA was a systematic way of
gathering data on existing employees’ capabilities and skills demanded in organisation.
It also helps to understand and analyse the implication of new and changed roles for
employees under internal mobility such as promotion, transfer etc. Therefore, to get good
training result, it should be done methodically step by step, starting with training need
identification, developing and designing an appropriate training to serve the needs,
training implementation according to plan and training programme evaluation to check
that desired result had been achieved (Manna et al., 2016).
Hartoyo, Efendy and Utama (2017) indicate that the TNA is a systematic effort of
organisational management to identify the underlying causes of inefficiency and
ineffectiveness that happen in the implementation of employees’ tasks. According to
Balisi (2014) the TNA is the procedure of determining if a training need exists, and if it
does, it identifies the type of training that is needed to fill the gap (Cole, 2004).
Furthermore, the TNA refers to the organisational process of collecting and analysing
data, that supports decision making about when training is the best option (or not) to
17
improve individual performances, define who should be trained, and exactly what content
should be taught (Clarke, 2003). Therefore, management problems or systems should be
addressed by other interventions and not just training employees for the sake of training.
Instead, they should aim to continually perform targeted TNA in order to help
administrative staff to achieve organisational goals in providing excellent customer
services. The following section discusses the context of SHRD that could be understood
in effecting TNA.
2.2 THE CONTEXT OF STRATEGIC HUMAN RESOURCE DEVELOPMENT
The conceptualisation of SHRD was first reconnoitered by scholars who argued for the
enclosure of strategic viewpoints to complement the existing theory and investigation on
HRD (Alagaraja, 2013). In addition, SHRD comprises the consideration of the impact of
the general HRD strategy on an organisation (Alagaraja, 2013).
Authors such as Meyer et al. (2012) define SHRD as a mixture of the strategic process,
which if properly aligned and integrated, are directed at providing for learning of all
relevant stakeholders. Erasmus et al. (2015) explain that SHRD is geared to the strategic
business plan to support in implementing the HR strategy by refining the knowledge and
skills of the employees in the organisation. Therefore, HRD strategy is defined as the
design of planned and unfolding events that emphasises on developing skills in order to
achieve current and future strategic goals. However, SHRD means that the procedure of
changing an organisation, respondents outside it, groups inside it, and the employees
within the organisation through strategic learning so that they retain the knowledge and
the skills required in the future (Altarawneh & Assery 2016; Erasmus et al., 2015; Huka,
Mbugua, & Njehia, 2015).
Erasmus et al. (2015) define HRD as a set of efficient and planned activities, considered
by an organisation to provide its members with the opportunity to learn required skills, in
order to meet current and future job demands. This can only be realised by putting training
in place (Altarawneh & Aseery, 2016). Therefore, HRD refers to the procedure for
increasing the rational, affective and behavioural abilities of all people and organisations
in the world (Erasmus et al., 2015).
18
Erasmus, Loedolf, Mda and Nel (2013) found that SHRD incorporates long, intermediate
and short-term learning plans designed to nurture the necessary talent. The goal of SHRD
is to provide the strategic learning experiences on the knowledge, skills and abilities
(KSAs) necessary in the future by numerous groups of organisational stakeholders
including workers, customers and suppliers among others (Clardy, 2008). Therefore,
HRD effort is tied formally to providers, to distributors of talent within an organisation or
outside the particular organisation (Erasmus et al., 2013).
Worldwide skills gaps have forced businesses to institute aggressive TM strategies to
attract, advance and optimise the available talent in the broader marketplace (Meyers et
al, 2013). Managing talent inside the organisation has been identified as the device
capable of enabling the attraction, development, and retaining of the necessary skills and
knowledge within the organisation through complete strategy, practices, and interventions
(Erasmus et al., 2015). Manna et al. (2016) found that training and development of current
employees were more beneficial than hiring new talent for organisations, as existing
employees already know the organisational culture, working pattern and their co-workers.
TM is the additional administration, procedures and opportunities that are offered to
individuals in the organisation who are deemed to be “talent” (Yasin, 2014). TM aims at
developing and positioning the right people at the right job at the right time, and give them
the right setting to show off their abilities in the best possible way for the organisation
(Marjani & Safaee, 2016). Apart from TM, managing the talent of employees within the
organisation has been identified to provide employees with the opportunity to grow and
acquire knowledge.
Currently, there is limited literature relating to TM in line with the work commitment and
service quality of non-academic employees (administrative staff) in higher education
institutions. Hence, researchers such as Van Antwerpen and Ferreira (2016) and Balisi
(2014) highlight that studies on support staff in higher educational settings are still limited.
Therefore, the TM and development of the identified TNA for administrative staff in HSU
and the influence on their work commitment is imperative. The current administrative staff
at HSU should identify their training needs to be trained on, rather than the university
appointing new talented employees.
A planned TNA, linked with the goals of the organisation, will address the identified gaps
of administrative staff by recommending the best training solution. Therefore, the TNA is
19
a procedure of determining if a training need exists and if it does, what training is
necessary to fill the gap (Balisi, 2014). In addition, the TNA aims to make sure that training
addresses the current organisational problems, and is tailored to support organisational
objectives. Therefore, a training need may be viewed as a shortage of skills that could be
eliminated by means of training (Khan & Al Zubaidy, 2016). Training is aimed at preparing
the workers in doing the work now (Hartoyo et al., 2017).
Erasmus et al. (2015) point out that in a very economical global market where it is
problematic to find top performers, many organisations are moving to advance internal
talent programmes. Such programmes require a strategic method that develops the talent
of all employees in order to close the current knowledge and skills gaps. Therefore, the
organisation needs to become a high-quality employer by increasing an employer
trademark so that the talented employees do not have to look elsewhere for employment
(Erasmus et al., 2015). Nwoke, Worlu and Akinbiyi (2016) pointed out that training and
development have the perceived capacity to hold talented individuals, and in
accordance with the psychological contract employees that perform highly, regularly
see development as an advantage which they are entitled to.
In addition, when employees see experienced individuals gain knowledge from the
training they get, their company normally benefits from their increased dedication,
workers’ fulfilment and retention (Nwoke et al., 2016:130). The analysis of training needs
has a close association with planning workouts where the best design is preceded by
finding the problems. In addition, the TNA is the strategic contributions in the planning
process (Hartoyo et al., 2017). In order to ensure that SHRD is purposeful, it is essential
at the outset to investigate the nature and the extent of the general strategic business
plan of the organisation, and specifically the HR management role in this strategy
(Erasmus et al., 2015). The next section discusses the conceptualisation and definition
of the TNA that could be employed in effecting this.
2.3 CONCEPTUALISATION AND DEFINITION OF TRAINING NEEDS ANALYSIS
Iqbal and Khan (2011) report that the concept of the TNA has been shifted from
conducting a training activity to every proactive programme used for developing and
implementing varied practical solutions for individuals, work groups and organisations.
Training needs may be individual or group (Bansal & Tripathi, 2017). As a result, the TNA
20
played a key role for organisations to motivate employees for their better career growth
and performance (Manna et al., 2016). Furthermore, Iqbal and Khan (2011) cite Cheng
and Dawson (1998) that the concept of the TNA is now considered at a strategic level as
it settled relations with several human resource functions. Altschuld and Lepicki (2010)
defined the TNA as a formal process to obtain information on the two states, namely
current versus desired, compare them, identify gaps and arrive at needs-based priorities
for organisational activities.
Erasmus et al. (2015) explain the TNA as the process of analysing change between what
is currently occurring within an organisation on a particular job or jobs, and what is
essential either at present or in the future, based on organisations’ operative and planned
goals. In addition, the TNA is the process of assessing the organisation, separate
employees and employees' tasks to discover exactly what gaps exist between what
people know, do, and what they should know, and feel in order to perform proficiently
(Altarawneh & Aseery, 2016; Erasmus et al., 2015). According to Driscoll and Taylor
(1992) for the past thirty years, and thirty years since 1992 theoretical and empirical
perspectives on the identification of training needs within organisations have been based
upon this three-way framework. Therefore, a job description is a unique marker to critically
appraised the TNA as well as career development (Yousif et al., 2019).
Altarawneh and Aseery (2016:191) define the TNA as "an investigation that is undertaken
to determine the nature of performance problems in order to establish the underlying
reasons and the way in which training needs can address the problem". According to
Balisi (2014) TNA is the procedure of determining if a training need exists, and if it does,
it identifies the type of training that is needed to fill the gap (Cole, 2004). Therefore, the
TNA is a systematic effort of organisational management to identify the underlying causes
of inefficiency and ineffectiveness that happen in the implementation of employees’ tasks.
Moreover, the training efforts should be done to cover the lack of knowledge and skills of
workers through analysis at the organisational level, position and individual (Hartoyo et
al., 2017). Training need is important to cover the lack of knowledge and skills of
employees through the analysis on the three levels of organisation, task and individual.
TNA is the procedure of defining if a training need occurs, and it ensures what training is
essential to seal the gap (Cole, 2004). In addition, a training need happens when there is
21
a gap between what is required of a person to achieve the work proficiently and what the
employee know. The conservative approach to the TNA has frequently considered
training as the only solution and overlooked non-training issues (Stone, 2009). Therefore,
the TNA is designed to identify performance gaps that can be remedied by training
(Tracey, 2004). In order to fill this gap, training is essential (Bangura, 2017). Therefore,
the function of proper needs analysis is to identify the training goal (Kozlowski & Salas,
2003). The study conducted by Manna et al. (2016) found that the need for training might
occur due to various reasons such as differences in values and cultures. Hence, the
appropriate training of administrative staff identified should be improved through TNA.
George and Jacob (2016) explain that the TNA is an assessment process that assists as
a problem-solving tool for determining what training needs are required. In addition, the
TNA is a complete study inclusive of two phases (Iqbal & Khan, 2011). The first diagnostic
phase identifies inconsistencies among performance standard, current performance,
current competence, and then ranks these inconsistencies by prioritising them in order of
severity. The final curative phase finds out that the causes of the prioritised discrepancies,
and then decides to use training, non-training, or both types of interventions for their
solution (Iqbal & Khan, 2011). Mangkunegara (2013) argues that the TNA is a systematic
study of an educational problem with the gathering of data and information from numerous
sources to obtain the additional problem-solving skill. HSU should consider training
administrative staff to close the performance gap.
The definition of the TNA from Erasmus et al. (2015) is applicable and useful to guide this
study. It highlights the interplay between what is currently occurring within an organisation
on a particular job or jobs and what is needed in the future, based on organisations’
operative planned goals. Moreover, Hartoyo et al. (2017) support this view that the TNA
is a problem-solving instrument to determine current and future challenges that training
and development programmes must meet. This definition will guide the empirical
measurement of the appropriate TNA.
Erasmus et al. (2015) argued that conducting the TNA ensures that funds are set aside
to address training and development problems. A TNA is only the first serious stage in
any training phase. Hence, the TNA is a simple method of identifying the current gaps in
the knowledge, strengths, and the weakness in the procedure that enable effective
training programmes being delivered (Hartoyo et al., 2017). Additionally, the TNA is the
22
right step to design an applicable, cost-effective training programme with clear priorities
setting to achieve specific knowledge, skills, and practice (Yousif et al., 2019). Therefore,
the TNA is one of the prime factors to rise the knowledge, skills, abilities, and competency
of the employees to achieve predictable individual and organisational performance
(Mazhisham, Khalid, Nazli, Manap & Hussain, 2018). The TNA of administrative staff
should be considered as the key factor and first step in any training in order to increase
the knowledge, skills and abilities to achieve the anticipated individual and organisational
performance.
Kraiger (2003) indicates that there is still relatively little theoretical and empirical research
on the TNA. The theoretic and methodological characteristics of the TNA scientific
knowledge are, somehow, unknown (Ferreira & Abbad, 2013). Therefore, it seems that
much of what was recommended by formative authors (Mahler & Monroe, 1952;
McGehee & Thayer, 1961; Moore & Dutton 1978, among others) is still not completely
integrated into TNA research and practice. In addition, many studies conducted were in
professional jobs like those for nurses, physicians, and medical laboratory technicians.
Hence, there is a lack of research on TNA conducted by university staff (Yousif et al.,
2019). As a result, there is lack of research on TNA of university administrative staff.
From the above discussion it becomes clear that TNA is a process of finding out what an
employee is required to do and to perform the work more effectively. Then, the TNA of
administrative staff in HSU aims to identify the gap between what the job demands for
the administrative staff to do and what the administrative staff will actually be doing. The
gaps that the job demands and what will actually be done, are the transformation of what
the administrative staff does and what the organisations’ real expectations of
administrative staff in relation to their job are. In conclusion the researcher considers that
the gap between present and desired results direct towards training so that the gap can
be minimised. The TNA of administrative staff, namely secretaries and administrative
officers, remains important for the achievement of the organisations planned goals and
objectives. Therefore, administrative staff should be trained to ensure that they achieve
the university’s goals.
Nudy (2015) states that among numerous human resource management practices, the
training policy plays a significant role in the progress of human resources training and
23
development. The following section discusses the purpose and significance of TNA that
could be employed in effecting this.
2.4 PURPOSE AND SIGNIFICANCE OF TRAINING NEEDS ANALYSIS
Denby (2010) indicates that the requirement to any training investment should be the
completion of a TNA, Without it, the valuable budget may be wasted on coaching and
guidance that is unnecessary. In addition, it will not deliver a return on investment through
the delivery of a positive impact on the bottom line. Cole (2004) explains that TNA is the
procedure of identifying if a training need exists and it identifies what training is necessary
to bridge the gap. Five significant processes are as follows:
• Authority and management readiness in performing needs analysis
• Understand the work situation of the organisation
• Focus on gaps and training needs
• Plan for training implementation
• Management reporting (Hartoyo et al., 2017)
Manna et al. (2016) indicate that gap identification and minimisation of it would help
organisations to predict demand and supply of competent employees and develop skill
inventories for future use. The skills inventories are such as broadening job
responsibilities, cross domain functional assignments, as well as business decision for
rightsizing and downsizing.
From the above it is clear that the main purpose of TNA is to find performance gaps and
determine if the problem can be solved by training. Needs assessment is a "road map" to
attain a clear goal. The TNA process can be identified from the gap in performance for
example, the gap between the real performance and the anticipated performance
(Hartoyo et al., 2017).
Huka et al. (2015) explain that the purpose of TNA in individual’s development cannot be
over emphasised. Because of this, TNA is vital for effective development of training aims
since it enhances the probabilities of realising positive training impact on the learners
(Huka et al., 2015). The crucial role of TNA in human ability development will eventually
result in administrative staff and organisational productivity.
24
Muma, Iravo and Omondi (2014) and Ologunowa et al. (2015) found that training needs
assessment is the first step in the creation and identification of an effective and efficient
training programme since it forms the basis for:
• determining instructional objectives
• selection and design of instructional programmes
• implementation and evaluation of training delivery
Training cannot resolve problems caused by poor system design and inadequate
resources (Sorenson, 2002). Training should not be seen as a means of satisfying
employees only, however, it should consider the needs of the organisation (Ologunowa
et al., 2015).
Teffu (2014) explains that an active approach to learning and development has to start
with a complete TNA process, so that the organisation, divisions and people can identify
their specific needs. The training needs process has a close link with the assessment of
training and development as the objectives of the programmes should be measured as
part of the TNA process (Teffu, 2014).
Kaur (2015) suggests that there is a necessity for training and development in all
organisations. Erasmus et al. (2015) also explain that training is the only solution to
address the problem. Training enables organisations to make better decisions and
resolve problems more efficiently. Hence, each organisation should offer training to their
employees. On that account, these employees would be able to take good decisions,
resolve problems efficiently, handle pressure and tension effectively, and contribute to
organisational performance and progress.
Asante and Alemna (2015) indicate that the training and development programme is an
important issue of career progression for all the employees in an organisation. Asfaw et
al. (2015) stress that the significance of training in current years has been inclined by the
comparative attainment of training and development organisations’ goals. Only if proper
TNA has been conducted and training is targeted, training will address the problem.
Obi-Anike and Ekwe (2014) present that the training of employees must be an on-going
activity to create intellectual capital and help the employees to learn practical aspects of
25
their jobs. Vinesh (2014) recommends that the organisation should put in place a training
and development strategy or plans with the intention of enabling all employees to give
quality services.
Altarawneh and Aseery (2016) explain that TNA pursue information about first optimum
performance; the real or present performance; the feeling of learners and the causes of
identified difficulties and solution. Therefore, conducting an operative assessment
confirms that training is the suitable solution to a performance shortage. However, training
is not the solution to problems triggered by poor organisational strategy or insufficient
resources (Altarawneh & Aseery, 2016). The TNA that is done properly will ensure that
the solution address the real problem (Balisi, 2014).
Standard TNA takes into account different aspects that may require the needs for training.
These factors include organisation, employee and task analysis. Therefore, there is a
need for measuring current levels of skills, knowledge and approach in the focus in order
to establish skills gap (Huka et al., 2015).
According to Huka et al. (2015) TNA is vital for successful development of training goals
and increases chances of realising positive influence on the learners. Employees should
be skilled and developed to meet their own job needs and the needs of the organisation.
Therefore, organisations have the responsibility to develop and apply training and
development systems to support them to achieve their goals (Muma et al., 2014).
Therefore, organisations have to analyse training needs more efficiently. They have
limited budgets and training should be done effectively and efficiently. Ologunowa et al.
(2015) conclude that training and development programmes are important requirements
of survival for organisations that promote persistence in employment performance. They
also highlight the benefits of TNA as to:
• increase productivity
• improve the quality of work and raise confidence
• develop new skills, knowledge, understanding and attitudes
• use new tools and equipment effectively
• reduce waste, accidents, turnover and other overhead costs
26
• fight obsolencence in skill, technologies, methods, products, markets and capital
management
• bring incumbents to the level of performance for their job
• improve organisational development and ensure continuity of leadership
• ensure the survival and growth of the organisation (Hartoyo et al., 2017)
Taking into account the above discussions,TNA becomes very important in the
organisation, and employees who have not had sufficient knowledge as at the period of
employment, may be trained by effective training for improved efficiency, effectiveness
and high productivity (Ologunowa et al., 2015). Huka et al. (2015) recommend suitable
TNA methods to identify and cluster specific training needs. Therefore, numerous TNA
methods like observations, customer feedback and interviews, affect the remaining
influence of diverse TNA methods to the transmission of commercial skills (Agochiya,
2009; Goad, 2010; Huka et al., 2015).
Employee’s training needs can be identified through business systems such as the skill
gap analysis, training needs assessment, performance appraisal, counselling session
and job evaluation (AlYahya et al, 2013). Therefore, the training needs of administrative
staff should be identified, and employees should be given a chance to improve the
necessary skills required to do the job.
Finally, Basili (2014) states that a well organised TNA will address the identified problems
and make adequate plans for assets, time and expertise needed. A planned TNA linked
with the goals of the organisation, will address the identified gaps of administrative staff
by providing training as the required intervention.
The previous section positioned TNA within the realm of SHRD and also provided insight
on the strategic importance of TNA. TNA was conceptualised and practical application
methods and models were discussed. Although all of these elements were necessary,
there must be a well planned programme to consider HRD so that the need can be
appropriately addressed. The following section discusses the TNA and training the could
be employed in addressing the needs.

27
2.4.1 Training needs analysis and training
(a) Importance of training needs analysis from a business perspective
Worldwide organisations have realised the significance of training and regarded it as a
commitment and retention tool than expenses (Terera & Ngirande, 2014). Sanghaik
(2012) indicates that TNA is an important business plan which prepares the organisation’s
human resource function for unavoidable change and also provides opportunity to
improve technology, systems, structures and the nature of work itself. Therefore, TNA is
very essential and failure to conduct a TNA may lead to costly mistakes such as a total
waste of training budget (Cekada, 2010; Denby, 2010). In addition, TNA is a systematic
method to conclude whether training needs exist in an organisation (Bhattacharyya,
2015).
According to Blanchard and Thacker (2007) TNA is essential because it aids to determine
whether training can correct the performance problem. Also, TNA points out that
employees lack necessary knowledge, skill, and attitude (KSA) to do the job, for which
they need training. The KSA lack obstacles need to be known and be removed by
providing the correct training to the right people (Blanchard & Thacker, 2007). TNA is
considered as the first critical phase in any training cycle (Altarawneh & Aseery, 2016;
Hartoyo et al., 2017). Bhattacharyya (2015) states that TNA is the first step to design the
training programmes that can assist in meeting the performance gap of workers. TNA
enables finalising a training plan for an organisation, systematically exploring all the
possible alternatives (Bhattacharyya, 2015).
TNA focuses on the needs of the individual employees, group of workers and the entire
organisation (Bhattacharyya, 2015). However, Altarawneh and Aseery (2016), Balisi
(2014), Bhattacharyya (2015), Blanchard and Thacker (2007), Enojo, Ojonemi and
Williams (2016), Hartoyo et al. (2017) and Miller and Osinki (1996) found that
organisational needs, operational or task needs and individual needs are three stages
required to identify training needs. In addition, TNA identifies training needs at employee,
departmental or organisational level in order to assist the organisation to perform
successfully (Khan & Al Zubaidy, 2016). The aim of TNA is to ensure that training
addresses existing problems, is tailor-made to organisational goals, and is delivered in
28
an effective and cost-efficient manner (Khan & Al Zubaidy, 2016). It is worth noting that
HSU does not do this; thus, the reason to conduct this study.
Ologunowa et al. (2015) state that training, re-training and development of employees are
seen as vital for any organisation because of the challenges posed by current technology.
However, there is no restriction on the training of pre-merger employees. The pre- and
post-administrative staff at HSU need to be trained so that they can be familiar with the
new technology.
Training has become extremely significant as it provides employees with insufficient
experience at the time of their employment the opportunity to increase their technological
skill by attending effective training for improved efficiency, success and high productivity.
However, Shaheen et al. (2013) pointed out that training also increases the organisation’s
productivity, efficiency, output and income as well as additional results that are associated
with the training. Training thus proves to be beneficial both on an individual and
organisational level. Nazli, Sipon and Radzi (2014) state that the achievement and failure
of training is dependent on the identification of right employees for a training programme.
Hence, TNA ensures a right employee involvement in a training programme. In particular,
the development of administrative staff within the organisation will contribute to the
employees being familiar with technology, well trained, extremely skilled and more valued
to the organisation than those who are not developed.
(b) Training from a business perspective
Training is defined as “a systematised tailor-made programme designed to suit the needs
of a specific organisation for emerging certain attitudes, actions, skills and abilities among
employees, regardless of their functional level” (Bhattacharyya, 2015:32). In addition, it
is considered as a means of improving the knowledge, skills and behaviours of workers
to enhance their operative and efficient functioning on their job (Andoh, Appiah & Adom-
Nyankey, 2016). Moreover, training is one method among many for redressing
performance deficiencies (Clardy, 2008).
Training is not just putting a large percentage of workers through some training. It should
be viewed as a set of integrated processes in which organisational and employee needs
are analysed and reacted upon. However, this must be done in a rational, logical and
29
strategic manner (Blanchard & Thacker, 2007). Training is not only a means of arming
employees with skills they require to perform their jobs, it is frequently deemed to be
representative of an employer's commitment to their work force (Ngèthe, 2014).
Kayode (2001) is of the view that training is essential for development of new skills or
knowledge and use of new kit and tools correctly. Therefore, training implies the
development of particular skills to prepare people to carry out specific tasks successfully
(Effah, 1998). According to Rothwell and Whiteford (2012) training is short term in its
focus and is delivered when employees require specific knowledge, skills and attitudes to
execute their jobs successfully. However, training is believed to be effective when the
training outcomes match with their goals (Cobblah & Van der Walt, 2017). The argument
advanced is that for training to be seen as the right training that enriches employees’
performance and morale, it should be well-aligned to the institutions’ workplace skills plan
(Teffu, 2014).
In particular, the training of administrative staff within an organisation will contribute to the
employees being familiar with technology, well trained, extremely skilled and more valued
to the organisation than those who are not trained. There should be a prioritised
organisational training plan to consider the training needs in order to achieve the
organisational goals. TNA and training complement each other. The following section
discusses the process of TNA.
2.5 THE PROCESS OF TRAINING NEEDS ANALYSIS
According to AlYahya et al. (2013) and Ologunowa et al. (2015), training needs can be
categorised into two groups; namely, organisational training needs and individual training
needs. In addition to organisational and individual needs, Balisi (2014), Enojo et al.
(2016), Huka et al. (2015) and Muma et al. (2014) are of the opinion that the TNA process
normally includes task analysis. Furthermore, TNA focuses on the needs of the individual
employees, group of workers, task and the entire organisation. Thus, it is important to
conduct all three analyses, because information from the three analysis informs the
decision to assign money and time for training as well as to ensure that the training is
directly linked to the organisation's policy plan (Balisi, 2014). In light of the above, it is
important to conduct TNA process to organisational, task and individual analysis to
achieve the organisational plan.
30
In addition, Balisi (2014) explains that there are severe limitations on TNA processes in
the public service because organisations were considering the individual need analysis
when measuring the training needs. The study conducted by Driscoll and Taylor (1992)
indicate that for more than the past two decades, theoretical, and empirical viewpoints on
the identification of training needs within organisations have been based upon a tripartite
or three-way framework, of namely, organisation, task and individuals.
In addition, McGehee and Thayer (1961) proposed that assessment of training needs
involves three types of analysis, that is, organisation, operational (task) and person
analysis. Therefore, individual, task and organisational need analysis should be
connected and organised (Altarawneh & Aseery, 2016). Apart from individual analysis
when measuring training needs, it is important to include organisational and task needs
analysis. It is very imperative that HSU analyse the TNA of administrative staff on the
tripartite framework of organisational analysis, individual or person analysis and task
analysis for the achievement of the organisational goals.
2.5.1 Organisational level training needs analysis
Organisational analysis was initially conceptualised by McGehee and Thayer (1961) as
focusing on where in the organisation training could be utilised based on the
organisational goals. Balisi (2014) found that organisational level TNA decides where
training is required and in what conditions the training will be conducted. However,
organisational analysis requires studying and understanding organisational culture,
values that guides the organisation, vision and mission (Huka et al., 2015). In addition,
organisational analysis is based on internal organisational environments that impact the
achievement of organisational goals, that has been recognised in accordance with the
vision and mission of the organisation.
Organisational level includes:
• The vision and mission of the organisation
• Funds and distributions
• Internal factors causing problems
• The impact of factors causing the problem (Bansal & Tripathi, 2017; Hartoyo et al.,
2017)
31
According to Erasmus et al. (2015) the starting point of the needs analysis process should
be a business plan. In principle, training should be matched with the organisations’
mission, strategy, goals and culture. However, organisational needs analysis, also aids
to identify the allocated funds for the training and development programme and identify
capacities of the actual weaknesses that can be improved by training (Altarawneh &
Aseery, 2016). Therefore, organisational level TNA is dependant on top management’s
support. The planned and active policies as well as the task analysis in HSU need to be
reconsidered.
2.5.2 Individual level training needs analysis
Individual or person analysis serves to identify personnel who need training, via
performance appraisal, proficiency testing and other methods of measuring job
performance. Huka et al. (2015) state that an employee in an organisation is considered
in a job position in relation to his or her skills to undertake certain tasks. On the other
hand, Hartoyo et al. (2017) explain that individual analysis is required to know how each
employee performs when undertaking the job. The change between the anticipated
performance and the actual performance is the need for training of the employee. Khan
and Masrek (2017) found that on the individual level, the needs analysis evaluates
training needs according to the employee’s performance, attitude and observations.
Individual needs analysis emphasises how well employees execute their jobs and what
skills, capabilities and knowledge they use to conduct those jobs (Altarawneh & Aseery,
2016). It implies that TNA is done in such a way that it considers what skills, capabilities
and knowledge the employees need to be able to do their jobs. Furthermore, individual
analysis focuses on identifying who should be skilled and what training is required by the
individual (Rikkua & Chakrabartyb, 2013).
According to Bansal and Tripathi (2017), individual or person or people analysis is where
you analyse how well the group or individual performs the task or job. Moreover, a variety
of tools are available to assess the extent of teams and individuals' skills, knowledge and
abilities. These include:
• Interviewing staff (about the job)
• Observation on-the-job
• Job profile (Bansal & Tripathi, 2017)
32
The administrative officer and the secretaries at HSU should be given an opportunity to
attend training programmes in order to fill the gap between the actual performance and
expected performance to be achieved.
2.5.3 Task level training needs analysis
Operation or task analysis entails setting performance standard or criteria, describing
tasks to be completed. Furthermore, task analysis defines how employees perform a job.
The resolution of this analysis is to control what should be given to employees so that
employees can do the work in accordance with the level to be attained. In addition, task
analysis needs cautious testing of the work to be achieved after training (Hartoyo et al.,
2017). As a result, task or operation analysis entails setting performance standard or
criteria, describing tasks to be completed.
Altarawneh and Aseery (2016) define task analysis as a procedure of identifying the
purpose of a job and its constituent's parts, and stating what must be learned in order for
them to perform efficiently. According to Bansal and Tripathi (2017), the task or
operational level is concerned with what KSAs are required to perform certain jobs or
task. The information can be gained through:
• Quality assurance procedures
• Interviewing Head of departments
• Obtaining job description (Bansal & Tripathi, 2017)
Furthermore, task analysis identifies the nature of the tasks to be performed on the job
and the KSAs required to perform these tasks (Rikkua & Chakrabartyb, 2013). This
provides data on job contents and necessary skills provided in the job descriptions,
capability models, performance appraisal standards and job structure (Khan & Masrek,
2017). Therefore, the content of training need should match the task as well as specifying
the necessary requirements for achieving it (Ibegbulam & Eze, 2016). It is important that
the content of training need skills tie with the task.
According to Erasmus et al. (2015), group needs are linked to a number of employees
doing the same type of work who lack certain skills and refer to a particular task level or
33
category of employees. Furthermore, this group needs should enable the training and
development practitioner to identify requirements in respect of specific job-related
training, interventions such as team-building programmes. The group needs
requirements of the administrative staff at HSU should be identified in respect of their
particular task for the training interventions.
In addition, Huka et al. (2015) found that TNA play an important role in acquirement of
skills, knowledge and change of attitude of the employees. However, George and Jacob
(2016) indicate that TNA is an assessment procedure that serves as a problem-solving
instrument for the purpose of what training needs to be attended. Therefore, training
needs should be identified during the performance appraisal of individuals by identiying
the training needs required for administrative staff at HSU. The following section
discusses the types of training needs.
2.6 TYPES OF TRAINING NEEDS
The TNA is a continuing process of collecting data to determine what training needs exist
so that training can be established to help the organisation achieve its objectives
(Altarawneh & Aseery, 2016). However, the types of training needs are either formal or
informal (Lai & Smith, 2017).
2.6.1 Formal training needs
Erasmus et al. (2015) state that formal training is designed to follow South African
Qualification Authority (SAQA) recognised qualifications or certificates that have
measurable objectives and outcomes. Lai and Smith (2017) define formal learning as
related to a formal course that often leads to a qualification. In addition, formal learning
happens in an educational institution such as universities during a certified course time.
Hence, the administrative staff of HSU should all be allowed to enrol for any qualification
related to their job with any institution of their choice thereby learning and gaining more
knowledge in order to improve their performance and achieve the organisational goals.
34
2.6.2 Informal training needs
Informal non-structured training and development offers regular guidance in the
workplace and the training is more experimental concentrating on the development of
functional knowledge and practical skills (Erasmus et al., 2015). According to Awino
(2016), on-the-job training uses the fixed or existing workplace tools, mechanisms,
booklets, equipment, knowledge and skills necessary for an employee to learn efficiently
to execute his or her job. Therefore, the university should provide the training required in
order to improve a base educated and skilled administrative staff either on-the-job or off-
the-job training.
Off-the-job training and development method include conferences, seminars and
workshops (Nwanzu & Uche-Okolo, 2017). Therefore, training workshops such as team
building and conferences focus on coaching administrative staff on how to do their current
jobs, and assist them to acquire the knowledge and the skills that they need. Training
can, if suitably designed and managed, help employees to acquire knowledge and skills.
Ferdous and Razzak (2012) are of the view that in order for a training programme to be
prosperous, a TNA has to be conducted prior to the commencement of the programme.
This means that the TNA should take place before the design or implementation of the
actual training. The needs analysis should be conducted to determine whether training is
linked to job or organisational goals and whether it empowers the programme evaluation,
since the results of training can be measured against the specific pre-determined
objectives. Numerous models exist in literature on how training needs should be
conducted to produce the organisation’s desired results. The following section discusses
the models for conducting or executing TNA.
2.7 MODELS FOR CONDUCTING / EXECUTING TRAINING NEEDS ANALYSIS
The application of the three-level model approach of organisation, task and people or
individual analysis need to address the training needs of the administrative staff. This
models are suitable for TNA and it offers a systematic process conducted prior to
designing a training programme which involves determining the needs at organisational,
operational or individual level, identifying what kind of training is needed and finally
identifying who are the individuals that need to be trained or retrained.
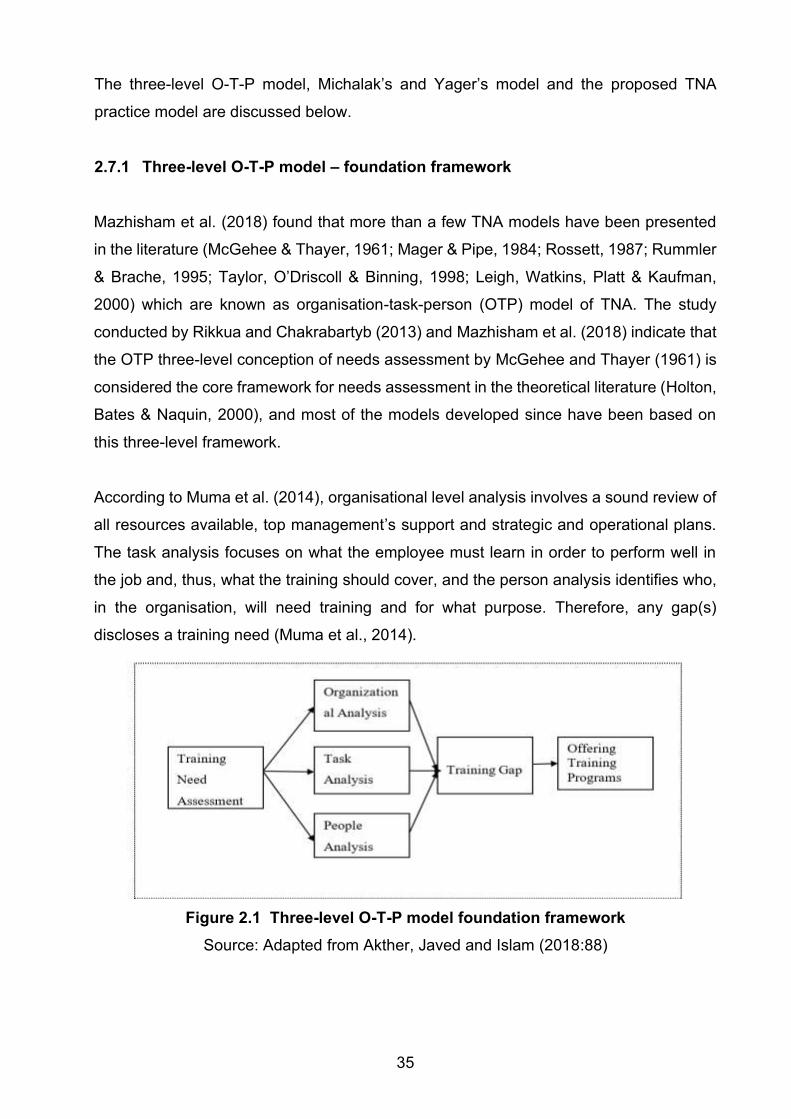
35
The three-level O-T-P model, Michalak’s and Yager’s model and the proposed TNA
practice model are discussed below.
2.7.1 Three-level O-T-P model – foundation framework
Mazhisham et al. (2018) found that more than a few TNA models have been presented
in the literature (McGehee & Thayer, 1961; Mager & Pipe, 1984; Rossett, 1987; Rummler
& Brache, 1995; Taylor, O’Driscoll & Binning, 1998; Leigh, Watkins, Platt & Kaufman,
2000) which are known as organisation-task-person (OTP) model of TNA. The study
conducted by Rikkua and Chakrabartyb (2013) and Mazhisham et al. (2018) indicate that
the OTP three-level conception of needs assessment by McGehee and Thayer (1961) is
considered the core framework for needs assessment in the theoretical literature (Holton,
Bates & Naquin, 2000), and most of the models developed since have been based on
this three-level framework.
According to Muma et al. (2014), organisational level analysis involves a sound review of
all resources available, top management’s support and strategic and operational plans.
The task analysis focuses on what the employee must learn in order to perform well in
the job and, thus, what the training should cover, and the person analysis identifies who,
in the organisation, will need training and for what purpose. Therefore, any gap(s)
discloses a training need (Muma et al., 2014).
Figure 2.1 Three-level O-T-P model foundation framework
Source: Adapted from Akther, Javed and Islam (2018:88)
36
Furthermore, Clarke (2003) stated that the OTP model integrated macro through to micro
analyses, arising from an investigation of training needs to meet organisational needs,
task or job needs through to the specific needs of the individual or person. All three levels
of the needs analysis are correlated and the training needs should be identified at all
levels (Mazhisham et al., 2018). It is important for HSU to identify their needs analysis on
the main framework of TNA in order to meet the organisational needs, task or job needs
through the particular needs of the individual analysis.
The model shows that the training programmes should start on the foundation of the TNA
that should cover organisation, task and the individual's aspects of the organisation. The
organisational analysis consists of considering how employees training can help to
achieve organisational goals and where in the organisation training is needed. Also, a
conscious and structured approach to training needs would in all likelihood help to
increase the selection of training solutions that most closely relate to the organisational
needs. It is likely that this will affect training usefulness.
Finally, TNA provides an opportunity for managers and trainers to get into organisation
and talk to employees by providing a channel for all respondents to deliberate
programmes to be mounted hence the parties identify and own the programmes (Muma
et al., 2014). This model confirms that TNA of administrative staff should be identified
based on the three-way framework of organisational, task and person or individual
analysis.
2.7.2 Michalak’s and Yager’s model
Muma et al. (2014) argue that the eleven (11) steps expose method for conducting
training needs assement, since it provides solutions to the who, what, and why training.
However, Erasmus et al. (2015) state that the steps of Michalak’s and Yager’s model is
a primarily used as a benefit for analysing training needs as a guide in stating questions
for questionnaires of investigation results.
The model is primarily used for analysing training needs at the micro-level which covers
the task and individual analysis or small groups. The focus of this model can assist to
include additional information in relation to TNA level in the HSU. Michalak’s and Yager’s
model is created on the model of Mager and Pipe (1984) and is used mainly as a rule in
37
articulating questionnaires or to conduct analyses of research results. This model
distinguishes between the canno`t do and does not do pathways, dealing with a training
need that has been identified and training that should be provided (Erasmus et al., 2015).
This model consists of eleven steps namely to:
Figure 2.2 Michalak’s and Yager’s model
Source: Adapted from Erasmus et al (2015:140) and Blanchard and Thacker (2003:118)
According to the first step when a problem is experienced, it is important to identify the
problem not the symtoms. The second step suggest a comparison should be made
regarding the cost of training and the profit it brings to the initiative. On the third step, it
should be indicated whether there is lack of skills and knowledge amongst the employees,
and if so, there cannot do path should be followed. In step four employees are provided
with the direct assistance to complete their task. Additionally, in step five training should
be applied to solve the problem; however, it should be highlighted that training should not
be considered as the first and the best solution in all circumstances.
In step six, once training is finished, the acquired skills should be constantly applied. On
the seventh step, changing the employee’s occupation should be measured after all
possibilities of solving a performance problem have been exhausted. Moreover, in step
eight the employee should be transferred to a unit where his or her capability can add
valued, however, the last option is to dismiss the employee. Step nine emphasise that
the reward or punish system used in the organisation is vital to be considered since this
38
system may be the foundation of the problem. Based on the reward or punish system,
employees should be provided with feedback concerning the service he or she rendered.
Lastly, depending on the circumstances, there might be difficulties in the system that stop
employees from doing the work correctly, these include employees being allocated too
much work or wherein the organisation does not support the employees skills and
knowledge. In addition, Blanchard and Thacker (2003) and (2007) explain that Michalak
and Yager’s gaps can be identified through four things: (KSA) knowledge, skill, and
attitude; incentive or punishment, feedback or problems in the organisation.
From the above discussion it becomes clear that Michalak’s and Yager’s model is mainly
used as an encouragement for analysing training needs at the micro-level. Micro-level
training needs has two aspects, the operative or task level which emphasises the content
of a persons’ job, and the people or individual performance or small groups. This model
is exactly focusing on the knowledge and skills of employees that needs to do the work.
Therefore, the model provides solutions to the who, what, and why training (Muma et al.,
2014). Once the job content of administrative employees is determined, the average
performance essential is used to define the training gap. Hence, the performance analysis
verify that there is performance shortage and defining whether the organisation should
correct deficiencies through training or other means (Hartoyo et al., 2017).
2.7.3 Proposed training need analysis practice model
According to Mazhisham et al. (2018) TNA is critically significant for the execution of
training and development in an organisation at all levels. Therefore, it is the main tools
and powerful process of training that helps employees, groups and the whole organisation
to be successful. The model consists of four aspects of key actors, level of interest,
methods and the outcomes of the analysis.
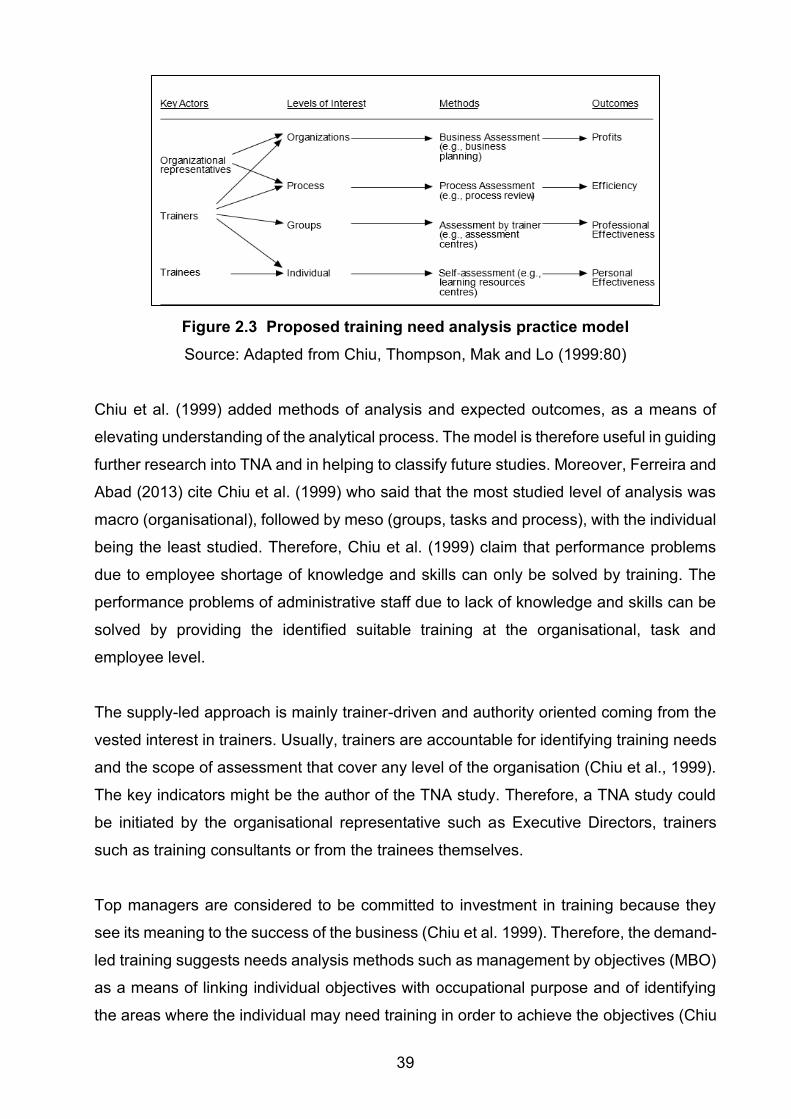
39
Figure 2.3 Proposed training need analysis practice model
Source: Adapted from Chiu, Thompson, Mak and Lo (1999:80)
Chiu et al. (1999) added methods of analysis and expected outcomes, as a means of
elevating understanding of the analytical process. The model is therefore useful in guiding
further research into TNA and in helping to classify future studies. Moreover, Ferreira and
Abad (2013) cite Chiu et al. (1999) who said that the most studied level of analysis was
macro (organisational), followed by meso (groups, tasks and process), with the individual
being the least studied. Therefore, Chiu et al. (1999) claim that performance problems
due to employee shortage of knowledge and skills can only be solved by training. The
performance problems of administrative staff due to lack of knowledge and skills can be
solved by providing the identified suitable training at the organisational, task and
employee level.
The supply-led approach is mainly trainer-driven and authority oriented coming from the
vested interest in trainers. Usually, trainers are accountable for identifying training needs
and the scope of assessment that cover any level of the organisation (Chiu et al., 1999).
The key indicators might be the author of the TNA study. Therefore, a TNA study could
be initiated by the organisational representative such as Executive Directors, trainers
such as training consultants or from the trainees themselves.
Top managers are considered to be committed to investment in training because they
see its meaning to the success of the business (Chiu et al. 1999). Therefore, the demand-
led training suggests needs analysis methods such as management by objectives (MBO)
as a means of linking individual objectives with occupational purpose and of identifying
the areas where the individual may need training in order to achieve the objectives (Chiu
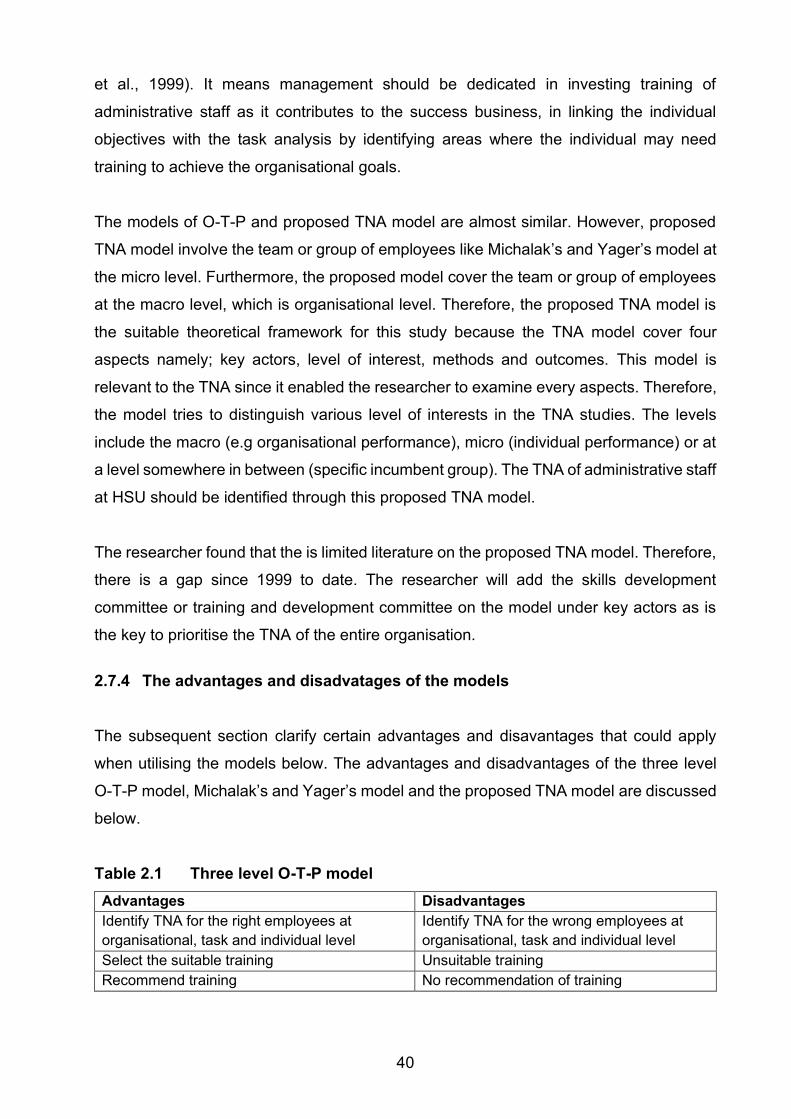
40
et al., 1999). It means management should be dedicated in investing training of
administrative staff as it contributes to the success business, in linking the individual
objectives with the task analysis by identifying areas where the individual may need
training to achieve the organisational goals.
The models of O-T-P and proposed TNA model are almost similar. However, proposed
TNA model involve the team or group of employees like Michalak’s and Yager’s model at
the micro level. Furthermore, the proposed model cover the team or group of employees
at the macro level, which is organisational level. Therefore, the proposed TNA model is
the suitable theoretical framework for this study because the TNA model cover four
aspects namely; key actors, level of interest, methods and outcomes. This model is
relevant to the TNA since it enabled the researcher to examine every aspects. Therefore,
the model tries to distinguish various level of interests in the TNA studies. The levels
include the macro (e.g organisational performance), micro (individual performance) or at
a level somewhere in between (specific incumbent group). The TNA of administrative staff
at HSU should be identified through this proposed TNA model.
The researcher found that the is limited literature on the proposed TNA model. Therefore,
there is a gap since 1999 to date. The researcher will add the skills development
committee or training and development committee on the model under key actors as is
the key to prioritise the TNA of the entire organisation.
2.7.4 The advantages and disadvatages of the models
The subsequent section clarify certain advantages and disavantages that could apply
when utilising the models below. The advantages and disadvantages of the three level
O-T-P model, Michalak’s and Yager’s model and the proposed TNA model are discussed
below.
Table 2.1 Three level O-T-P model
Advantages Disadvantages
Identify TNA for the right employees at
organisational, task and individual level
Identify TNA for the wrong employees at
organisational, task and individual level
Select the suitable training Unsuitable training
Recommend training No recommendation of training
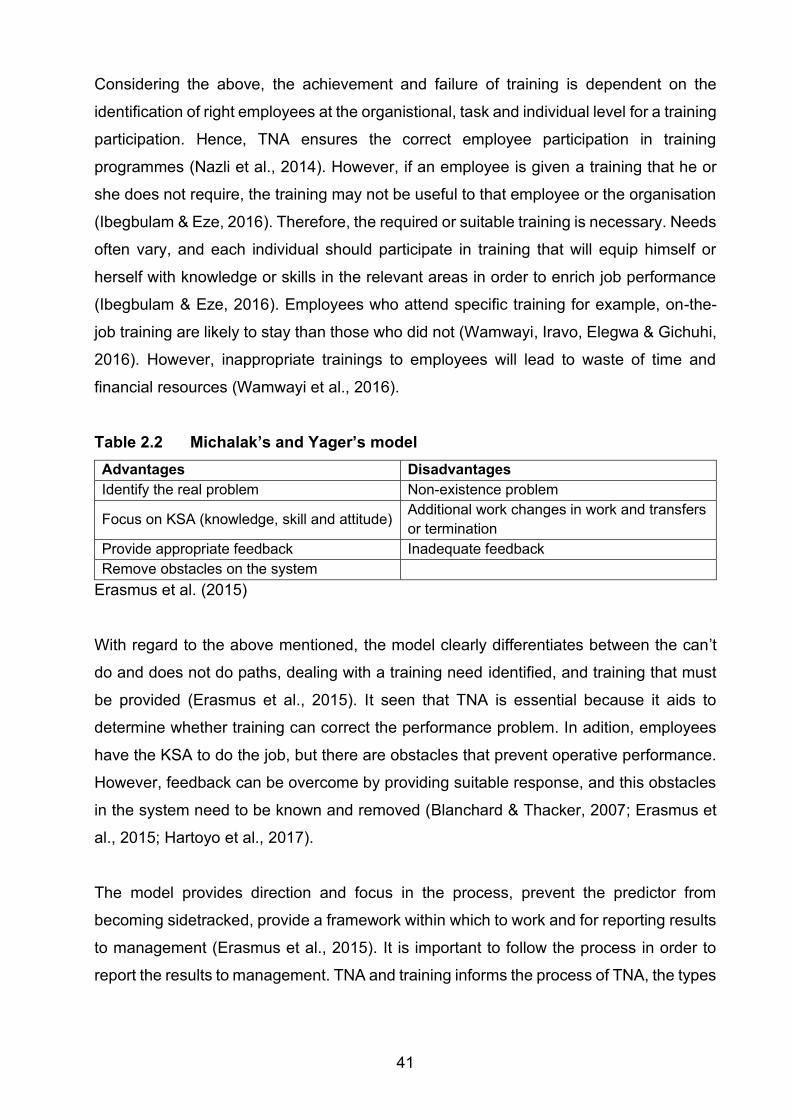
41
Considering the above, the achievement and failure of training is dependent on the
identification of right employees at the organistional, task and individual level for a training
participation. Hence, TNA ensures the correct employee participation in training
programmes (Nazli et al., 2014). However, if an employee is given a training that he or
she does not require, the training may not be useful to that employee or the organisation
(Ibegbulam & Eze, 2016). Therefore, the required or suitable training is necessary. Needs
often vary, and each individual should participate in training that will equip himself or
herself with knowledge or skills in the relevant areas in order to enrich job performance
(Ibegbulam & Eze, 2016). Employees who attend specific training for example, on-the-
job training are likely to stay than those who did not (Wamwayi, Iravo, Elegwa & Gichuhi,
2016). However, inappropriate trainings to employees will lead to waste of time and
financial resources (Wamwayi et al., 2016).
Table 2.2 Michalak’s and Yager’s model
Advantages Disadvantages
Identify the real problem Non-existence problem
Focus on KSA (knowledge, skill and attitude) Additional work changes in work and transfers
or termination
Provide appropriate feedback Inadequate feedback
Remove obstacles on the system
Erasmus et al. (2015)
With regard to the above mentioned, the model clearly differentiates between the can’t
do and does not do paths, dealing with a training need identified, and training that must
be provided (Erasmus et al., 2015). It seen that TNA is essential because it aids to
determine whether training can correct the performance problem. In adition, employees
have the KSA to do the job, but there are obstacles that prevent operative performance.
However, feedback can be overcome by providing suitable response, and this obstacles
in the system need to be known and removed (Blanchard & Thacker, 2007; Erasmus et
al., 2015; Hartoyo et al., 2017).
The model provides direction and focus in the process, prevent the predictor from
becoming sidetracked, provide a framework within which to work and for reporting results
to management (Erasmus et al., 2015). It is important to follow the process in order to
report the results to management. TNA and training informs the process of TNA, the types
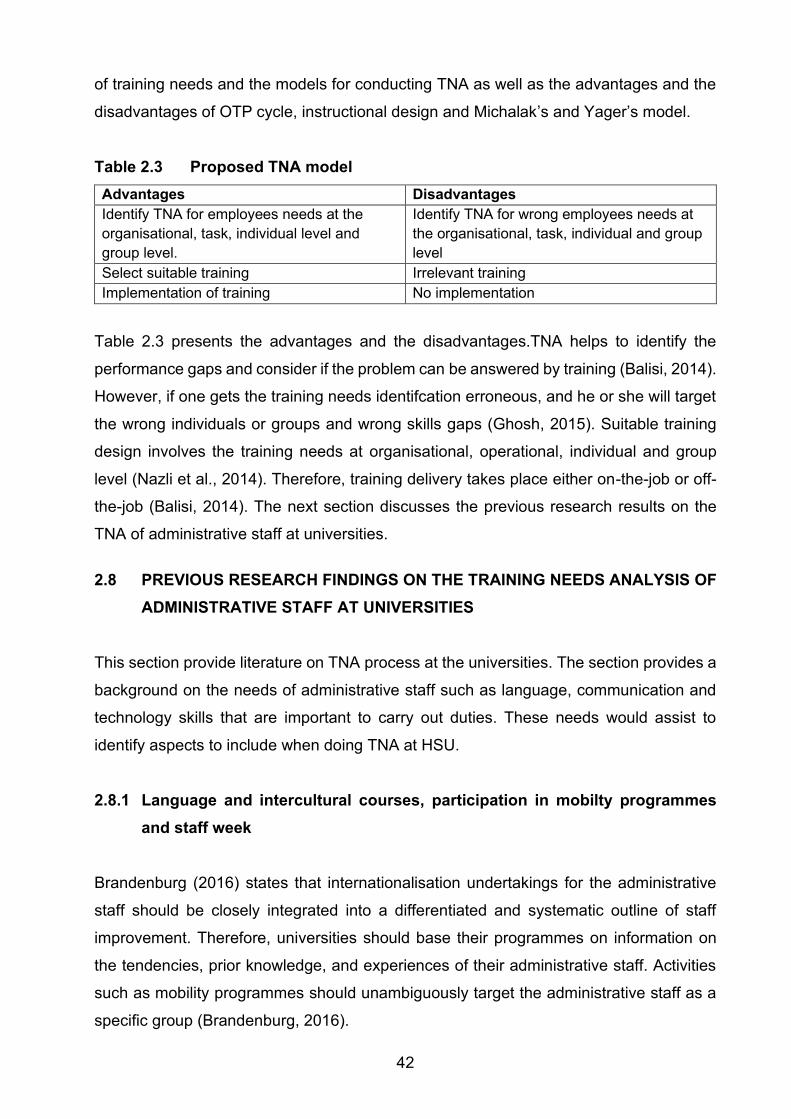
42
of training needs and the models for conducting TNA as well as the advantages and the
disadvantages of OTP cycle, instructional design and Michalak’s and Yager’s model.
Table 2.3 Proposed TNA model
Advantages Disadvantages
Identify TNA for employees needs at the
organisational, task, individual level and
group level.
Identify TNA for wrong employees needs at
the organisational, task, individual and group
level
Select suitable training Irrelevant training
Implementation of training No implementation
Table 2.3 presents the advantages and the disadvantages.TNA helps to identify the
performance gaps and consider if the problem can be answered by training (Balisi, 2014).
However, if one gets the training needs identifcation erroneous, and he or she will target
the wrong individuals or groups and wrong skills gaps (Ghosh, 2015). Suitable training
design involves the training needs at organisational, operational, individual and group
level (Nazli et al., 2014). Therefore, training delivery takes place either on-the-job or off-
the-job (Balisi, 2014). The next section discusses the previous research results on the
TNA of administrative staff at universities.
2.8 PREVIOUS RESEARCH FINDINGS ON THE TRAINING NEEDS ANALYSIS OF
ADMINISTRATIVE STAFF AT UNIVERSITIES
This section provide literature on TNA process at the universities. The section provides a
background on the needs of administrative staff such as language, communication and
technology skills that are important to carry out duties. These needs would assist to
identify aspects to include when doing TNA at HSU.
2.8.1 Language and intercultural courses, participation in mobilty programmes
and staff week
Brandenburg (2016) states that internationalisation undertakings for the administrative
staff should be closely integrated into a differentiated and systematic outline of staff
improvement. Therefore, universities should base their programmes on information on
the tendencies, prior knowledge, and experiences of their administrative staff. Activities
such as mobility programmes should unambiguously target the administrative staff as a
specific group (Brandenburg, 2016).
43
2.8.2 Communication skills
Destiny (2016) states that the need for sufficient training of senior administrators to meet
the current needs cannot be over-emphasised. Hence, there is a need for assessment of
communication skills as a training of senior administrators in tertiary institutions (Destiny,
2016). Communication skills links together their historical, future performance and guide
verdicts throughtout the improvement effort. With the quick technological changes in the
society especially universities, there is a need to assess the communication skills as
required for a training need of senior administrators (Destiny, 2016).
Jusoh, Atek, Omar and Abdullah (2018) found that administrative officers experienced
average level of communication anxiety. However, work obligations at office by the
officers is one of the factors that obstructs their time in learning (Jusoh et al., 2018). It is
important for the administrative staff to be trained throughtout so that they can meet their
required performance.
2.8.3 Technological skills
Rikkua and Chakrabartyb (2013) indicate that effective TNA is particularly vital in today’s
changing workplace as new technologies and flexible working practices are becoming
widespread, leading to corresponding changes in the skills and abilities needed.
Administrative staff are likely to fail in achieving targets due to lack of progressive
technology, as such, timely feedback coupled with coverage of relevant training to
minimise negative training results (Farooq & Khan 2011). Zainuddin and Isa (2014) found
that 35.6 % of administrative staffs did not have good familiarity on computer vision
syndrome. Therefore, since technology is about improving work efficacy within work
environment, then secretaries have to be proactive in their occupation to be abreast with
the technological world as soon as any new development is introduced (Adam, 2015).
According to Bansal and Tripathi (2017), learning to function, a specific technology
requires acquisition of extra skills or knowledge which may vary in the numerous staff
groups likely to make differing use of the technology in question. TNA to specify the
training needs of administrative staff regarding the use of new technology is required. The
following sections discuss the demographic variables and the perception of the
effectiveness of TNA that could be employed in effecting this study.
44
2.9 DEMOGRAPHICAL VARIABLES AND THE PERCEPTION OF THE
EFFECTIVENESS OF TRAINING NEEDS ANALYSIS
Factors that favourably dispose one to TNA of administrative staff may be summarised
into biographical variables such as: age, gender, job title, educational level, job level and
tenure.
2.9.1 Age
There seems to be very little, if any, literature available on the perception of TNA of
administrative staff in terms of age. However, administrative staff aged between 34 years
and younger uttered more confidence and experience in the dominion of multimedia
usage and manipulation, web and other presentation software using mobile devices,
using the internet, using word processing and using email (Erasmus & Joubert, 2017).
Noteworthy, staff aged between 35–41 presented similar confidence in all the ICT skills
domains (Erasmus, Naidoo & Joubert 2017). Younger employees are more exposed to
digitalisation at the earlier career stage than older employees (Nwokoye & Uwajumogu,
2017).
2.9.2 Gender
According to Al Shobaki, Abu-Naser, EI Talla and Abu Amuna (2018), there is no
substantial dissimilarity between the male and female administrative positions at the
institutions on TNA. However, giving more opportunities for both males and females to
persuade them by organising workshops, seminars and conferences, both inside and
outside the organisation, where the pace at which employees work is maintainable and
may improve (Al Shobaki et al., 2018).
2.9.3 Job title
According to Jung and Shin (2015) in an organisational hierarchy, high ranked employees
tends to embrace decision-making power, and lower rank employees tends to be
excluded from the process of TNA. According to Omonijo, Oludayo, Eche, Uche and
Ohunakin (2015), junior staff progress is being delayed by their supervisors based on
grudge, bitterness and malice. Meanwhile, Brandenburg (2016) states that staff
45
improvement is especially effective for lower rank positions and high rank staff not
focused mainly on internationalisation. Many administrative staff tasks in the lower ranks
are frequently described as simple as monotonous, which limits these staff members’
abilities to demonstrate their skill (Jung & Shin, 2015).
2.9.4 Educational level
Ahmed, Abu-Naser, El Talla and Al Shobaki (2018) found that organisations should
always work on the nature of administrators’ work commensurate with the qualifications
and abilities of the people who are based on it. For example, by putting the right person
in the right position.
According to Wamwayi, Iravo, Elegwa and Gichuhi (2016), and Altarawneh and Aseery
(2016) 48% of administrative staff have a master's level of education, and this constitutes
54% of males and 46% of females. However, the administrative staff qualification is in
favour of the employees who have obtained diploma degree compared to postgraduate
studies (Ahmed et al., 2018). Majority of administrative staff have obtained diploma as a
qualification. Hence, Khan, Masrek and Nadzar (2015) emphasise that qualified
employees may not be skilled of handling current innovations.
2.9.5 Job level
The rise in administrative staff in the 1990s and the early 2000s was due to development
in the higher-grade positions and newly created higher education occupations (Baltaru &
Soysal, 2018). However, the increase in administrative staff reflect a rise in the quantity
of professional and highly experienced administrative staff. In addition, this increase is at
the expense of technical and administrative staff with lower levels of qualification (Baltaru
& Soysal, 2018). Numerous cases of certain individuals enter a new organisation at a
high-level rank due to their education or special proficiency (Smith‐Jentsch, Campbell,
Milanovich & Reynolds, 2001).
2.9.6 Tenure
Ologunowa et al. (2015) found that training becomes significant that effective training for
improved efficacy, effectiveness and high productivity should develop employees who
46
have not had sufficient experience during the time of employment. The following section
discusses the historical perspective that could be employed in effecting TNA.
2.10 HISTORICAL THEORETICAL PERSPECTIVES ON TRAINING NEEDS
ANALYSIS
The study conducted by Moore and Dutton (1978) found that in 1952, Mahler and Manroe
studied the determination of training needs in industry, finding that most methods for
determining training needs were formal. According to Wright and Gregory (1992), it has
been more than ten years since Moore and Dutton (1978) published their seminal work
on TNA. Therefore, their paper traced the history of needs assessment practice from
1953, when only one in ten companies reported systematic approaches to determining
training needs to 1978. Furthermore, it was found that in 25 years, needs analysis theory
had progressed little further than the growth, formulation and creation of specific collection
of data (Wright & Gregory, 1992).
Wright and Gregory (1992) indicate that the best training theorists still defined needs in
terms of the equation: standard or desired performance – present or actual performance
= training needs. Little theory development has happened addressing the issue of how to
diagnose performance problems and ascertain that they are caused by lack of knowledge
and some variant training represents the optimal solution set (Moore & Dutton, 1978).
Reid and Barrington (1994) argued that finding the right reason for the gap is extremely
important because it would help in getting the right solution. As per McKillip (1987), TNA
should focus on the main reason of gap between the current and desired state. The
method of training need identification totally depends on the area of focus determined by
organisation. Therefore, focusing on the right direction is most crucial for achieving the
organisation's vision and mission.
The importance of analysing training needs prior to conducting training has been
emphasised by many authors (Burke & Day, 1986; Goldstein, 1986; Wexley, 1984).
However, McGehee and Thayer (1961) proposed that assessment of training needs
involves three types of analysis: organisation, operational (task) and person analysis.
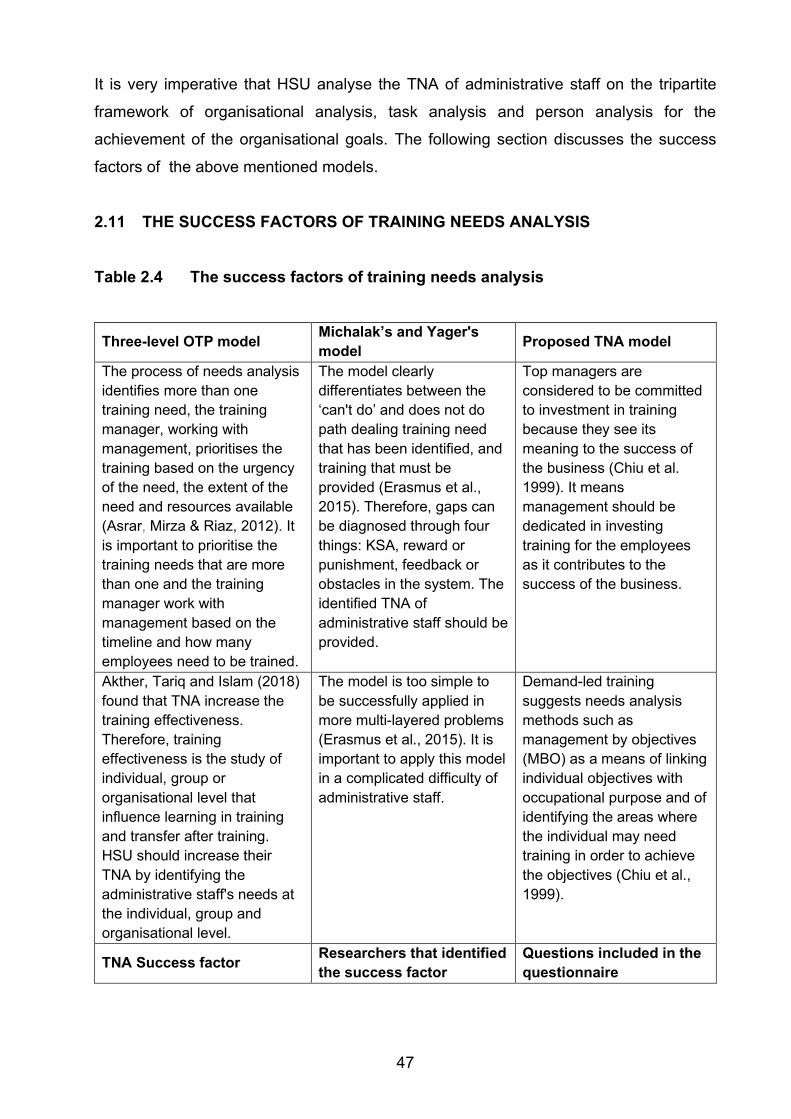
47
It is very imperative that HSU analyse the TNA of administrative staff on the tripartite
framework of organisational analysis, task analysis and person analysis for the
achievement of the organisational goals. The following section discusses the success
factors of the above mentioned models.
2.11 THE SUCCESS FACTORS OF TRAINING NEEDS ANALYSIS
Table 2.4 The success factors of training needs analysis
Three-level OTP model Michalak’s and Yager's
model Proposed TNA model
The process of needs analysis
identifies more than one
training need, the training
manager, working with
management, prioritises the
training based on the urgency
of the need, the extent of the
need and resources available
(Asrar, Mirza & Riaz, 2012). It
is important to prioritise the
training needs that are more
than one and the training
manager work with
management based on the
timeline and how many
employees need to be trained.
The model clearly
differentiates between the
‘can't do’ and does not do
path dealing training need
that has been identified, and
training that must be
provided (Erasmus et al.,
2015). Therefore, gaps can
be diagnosed through four
things: KSA, reward or
punishment, feedback or
obstacles in the system. The
identified TNA of
administrative staff should be
provided.
Top managers are
considered to be committed
to investment in training
because they see its
meaning to the success of
the business (Chiu et al.
1999). It means
management should be
dedicated in investing
training for the employees
as it contributes to the
success of the business.
Akther, Tariq and Islam (2018)
found that TNA increase the
training effectiveness.
Therefore, training
effectiveness is the study of
individual, group or
organisational level that
influence learning in training
and transfer after training.
HSU should increase their
TNA by identifying the
administrative staff's needs at
the individual, group and
organisational level.
The model is too simple to
be successfully applied in
more multi-layered problems
(Erasmus et al., 2015). It is
important to apply this model
in a complicated difficulty of
administrative staff.
Demand-led training
suggests needs analysis
methods such as
management by objectives
(MBO) as a means of linking
individual objectives with
occupational purpose and of
identifying the areas where
the individual may need
training in order to achieve
the objectives (Chiu et al.,
1999).
TNA Success factor Researchers that identified
the success factor
Questions included in the
questionnaire
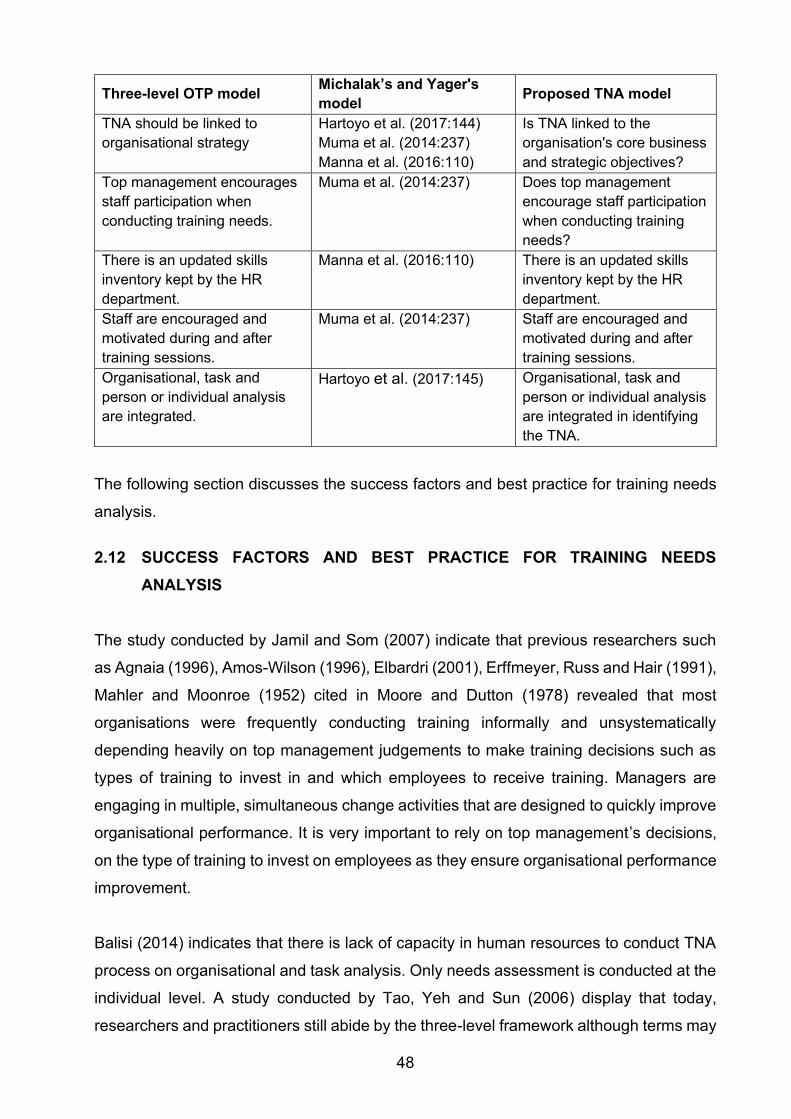
48
Three-level OTP model Michalak’s and Yager's
model Proposed TNA model
TNA should be linked to
organisational strategy
Hartoyo et al. (2017:144)
Muma et al. (2014:237)
Manna et al. (2016:110)
Is TNA linked to the
organisation's core business
and strategic objectives?
Top management encourages
staff participation when
conducting training needs.
Muma et al. (2014:237)
Does top management
encourage staff participation
when conducting training
needs?
There is an updated skills
inventory kept by the HR
department.
Manna et al. (2016:110) There is an updated skills
inventory kept by the HR
department.
Staff are encouraged and
motivated during and after
training sessions.
Muma et al. (2014:237)
Staff are encouraged and
motivated during and after
training sessions.
Organisational, task and
person or individual analysis
are integrated.
Hartoyo et al. (2017:145) Organisational, task and
person or individual analysis
are integrated in identifying
the TNA.
The following section discusses the success factors and best practice for training needs
analysis.
2.12 SUCCESS FACTORS AND BEST PRACTICE FOR TRAINING NEEDS
ANALYSIS
The study conducted by Jamil and Som (2007) indicate that previous researchers such
as Agnaia (1996), Amos-Wilson (1996), Elbardri (2001), Erffmeyer, Russ and Hair (1991),
Mahler and Moonroe (1952) cited in Moore and Dutton (1978) revealed that most
organisations were frequently conducting training informally and unsystematically
depending heavily on top management judgements to make training decisions such as
types of training to invest in and which employees to receive training. Managers are
engaging in multiple, simultaneous change activities that are designed to quickly improve
organisational performance. It is very important to rely on top management’s decisions,
on the type of training to invest on employees as they ensure organisational performance
improvement.
Balisi (2014) indicates that there is lack of capacity in human resources to conduct TNA
process on organisational and task analysis. Only needs assessment is conducted at the
individual level. A study conducted by Tao, Yeh and Sun (2006) display that today,
researchers and practitioners still abide by the three-level framework although terms may
49
have altered over time – operations analysis is now task or work analysis and man
analysis is individual or person analysis. (Holton et al., 2000). Generally, the process of
needs analysis, show that public service training is not strategic (Balisi, 2014). The most
effective needs assessment should take into consideration all three levels of analysis
starting from the organisation level.
Ferdous and Razzak (2012) found that TNA is a pre-requisite for an effective training that
helps organisational growth and development. Akther et al. (2018) indicate that TNA is
important to improve employee’s skills and capability to meet future challenges. However,
because most organisations lack the resources to address all their training needs, the
needs assessment stage of training has become increasingly important. Therefore, the
assessment of training needs should provide a focal point and direction to the
organisation in investing on its employees (Akther et al., 2018). The assessment of
training needs of administrative staff should provide a crucial direction to HSU since TNA
is important for employees to enhance their skills to meet future challenges.
In order to ensure the success of TNA, areas such as performance gap assessment, root
cause assessment, need assessment and lastly the recommendations of whether training
is the best option or not must be addressed (Akther et al., 2018). Besides, the purpose of
training need assessment is to add value to an organisation. The effectiveness of TNA of
administrative staff such as performance gap should be addressed by providing training
to the employees.
In Pakistan, study found that the process of needs analysis identifies more than one
training need, the training manager, working with management, prioritising the training
based on the urgency of the need (timelines), the extent of the need (how many
employees need to be trained) and the resources available (Masood et al., 2012).
Therefore, training assessment is concerned with the achievement of a desired level of
ability and the success of the required knowledge and skills (Akther et al., 2018).
It is important for HSU to identify more than one training need of administrative staff, in
order for the training to be prioritised based on the urgency of when training is needed,
how many employees and whether the resources are available.
50
According to Akther et al. (2018), TNA maximises the training success. Therefore, training
effectiveness is the study of individual, group, or organisational level factors that influence
learning in training and transfer after training. The training efficiency of administrative staff
will impact learning in training as well as to transfer skills after training. To design training
programme which satisfy both the organisation and its employees, training needs should
be identified by executing three levels of analysis which is organisational, operational and
individual analysis (Jamil & Som, 2007). The training needs of administrative staff at HSU
should be identified by performing the organisation, operational and individual analysis.
TNA should be approached like a research that has to be conducted in a systematic and
continuous manner by employing certain methods. McGehee and Thayer (1961) indicate
that TNA framework is still heavily referred to in training literature and serves as the
foundation for most subsequent TNA models (Jamil & Som, 2007). According to Akther
et al. (2018) TNA models in practice are popular to identify performance gap of the
organisation such as the O-T-P that is considered as foundation framework for the need
assessment of an organisation.
Jamil and Som (2007) state that organisational analysis involves the examination of an
organisation’s mission and strategies to identify training needs, whereas operational
analysis determines whether the skills, knowledge and attitudes (SKAs) required of each
job in an organisation contributes to the achievement of the preset objectives.
Furthermore, the TNA process continue to the third level whereby the performance of
each employee is assessed to determine whether he / she performs according to the
standards and if discrepancies occur, to decide whether training can be used to close the
gap (Jamil & Som, 2007). It is important to identify the TNA on HSU level to determine
whether the skills of administrative staff's job contribute to the organisational goals as well
as to evaluate whether the employees perform according to the required standard.
Jamil and Som (2007) indicate that TNA should be conducted continuously by using the
tripartite framework as is the basis successful method to conduct TNA. However, methods
refer to the instruments that analysts use to collect data for TNA purposes. Therefore,
techniques are the procedures to be carried out in order to identify training needs which
involve the use of data collection methods (Jamil & Som, 2007). It is important for HSU
to use the methods and techniques in order to identify the training needs of administrative
staff to collect data.
51
2.13 CHAPTER SUMMARY
This chapter provided the context of SHRD, which justifies the identification, purpose and
significance of TNA. A definition of TNA was provided. The process of TNA includes
organisation, individual and task analysis.
The chapter went on to discuss the types of training needs, TNA models. In addition, the
chapter examined the importance of TNA in line with three level O-T-P model, Michalak’s
and Yager’s model and the proposed TNA model which served as the theoretical
framework of this study. The previous research findings on the TNA of administrative staff
at universities, the TNA on the demographical variables of administrative staff, historical
theoretical perspectives on TNA, the success factors of TNA and the Success factors and
best practice for TNA. In summary, without evaluation, there is no tool for establishing
and conducting TNA (Erasmus, et al., 2015). The next chapter will focus on talent
management and the management thereof in academic institutions.
52
CHAPTER 3
TALENT MANAGEMENT WITHIN THE CONTEXT OF A HIGHER
EDUCATION INSTITUTION
3.1 INTRODUCTION
This chapter examines the conceptualisation and definition of talent and TM. Different
approaches to the TM, as well as its purpose and significance are analysed. In addition,
the TM processes, specifically in the context of administrative staff in the HE sector, as
well as the effects of demographic variables on TM will be explained. Lastly, the chapter
offers a potential conceptual framework on the interaction and link between effective TNA
and TM. A recent definition by Cappelli and Keller (2014) describes TM, as “a practitioner-
generated term, covering a range of long-standing practices that aim at getting the right
person in the right job at the right time. These practices include workforce planning,
succession planning, employee development and career management” (Cappelli &
Keller, 2014:306).
TM is a significant factor in the development of an organisation’s human capacity and a
strategic priority for businesses and universities to prepare the organisation’s human
capacity for the future. Talented employees are the main assets and critical factors in the
attainment of knowledge and experience organisations focusing on human development
(Yasin, 2014).
3.2 CONCEPTUALISATION OF TALENT AND TALENT MANAGEMENT
Although it is important, the concept of TM is still unclear (Collings & Mellahi, 2009).
Vaiman and Collings (2013) indicate that for many organisations, the context of TM
remains complex, challenging and continually developing. Therefore, it is important to
conceptualise talent and TM clearly, in order to provide sufficient TM theoretical
background to anchor this study. A few important debates have emerged from the recent
attempts to draw conceptual limitations about the term Talent and TM. However, the ideas
of an inclusive versus an exclusive approach of TM is still considerably and seriously
argued by authors on the conceptual framework and the standards about the practices of
TM (Al Ariss, Cascio & Paauwe 2014; Cappelli, 2008a; Lewis & Heckman, 2006; Yener,
53
Gurbuz & Pinar, 2017). Cappelli and Keller (2014) indicate that the practical implication
of these two approaches of TM concerns the investment of rare resources, where whether
is a development for everyone or the organisation should invest in a different way in
certain individuals or jobs.
3.2.1 Conceptualising ‘talent’
According to Nijs, Gallardo-Gallardo, Dries and Sels (2014:182), talent “refers to
systematic developed innate abilities of individuals that are deployed in activities they like,
find important, and in which they want to invest energy. It enables individuals to perform
excellently in one or more domains of human functioning, operationalised as performing
better than other individuals of the same age or experience, or as performing consistently
at their personal best”. Furthermore, talent is seen as the addition of an individual’s skills,
which includes the inherent gifts, abilities, awareness, personality and drive. It also
includes an individual’s capability to learn and grow (Nafei, 2015).
Gallardo-Gallardo, Dries and Gonzalez (2013) and Tetik (2016) describe talent as either
an object or a subject. According to Nijs et al. (2014), viewing talent as an object denotes
that talent is an ability, capacity, proficiency, assurance, competency, influence,
knowledge, potential and skills that are connected to the features of people. Alsakarneh
and Hong (2015) share the same opinion that the talented employees are individuals with
various characteristics that add value to the development of an organisation. At the same
time, Gallardo et al. (2013) indicate that viewing talent as a subject describes talent as
inclusive approach to TM, inclusive of all the people within the organisation and the
exclusive approach of the subgroup of the organisation’s population. The approaches to
talent as a subject are described as follows:
3.2.1.1 Inclusive subject approach: talent as all people
Yost and Chang (2009) argue that organisations should try to help all of their employees
to fulfil their fullest potential since focusing on investments (in terms of time, money and
energy) on only a few people and within a limited set of roles, is an unsafe strategy when
considering at the expected labour market shortages. Therefore, if talent refers to all the
employees, managing talent simply involves proper workforce management and
development of all the organisation’s employees, which is not particularly helpful in
54
specifying how TM is different from SHRM (Garrow & Hirsh, 2008). According to this
subject approach, TM is a collection of typical HR process such as recruitment, selection,
development, training, performance appraisal and retention (Iles, Chuai & Preece, 2010;
Silzer & Dowell, 2010).
3.2.1.2 Exclusive subject approach: talent as few people
The exclusive subject approach is based on the idea of segmentation of the workforce,
and distinguishes talent as an elite subsection of the organisation’s population, for
example "those individuals who can make a difference to organisational performance,
either through their immediate contribution or in the longer-term by demonstrating the
highest levels of potential" (Tansley, Harris, Stewart & Turner, 2007:8).
The topic of TM has started to gain a lot of attention from corporate leaders and
academics since the late 1990s when McKinsey consultants coined the phrase "war of
talent" in referring to their increasing importance role of talented leaders and highly
performing employees played in the success of their organisation globally (Boudreau &
Ramstad, 2007; Scullion, Collings & Caligiuri, 2010; McDonnell, 2011). After the initial
discussion on the war for talent (Chambers, Foulon, Handfield-Jones, Hankin & Michaels,
1998) many researchers and practitioners focused on the phenomenon of TM (Axelrod,
Handfield-Jones & Michaels, 2002; Collings & Mellahi, 2009). Because of the active
competitive environment of the modern business world, TM is seen as a paradigm shift
from old-style HR related sources of competitive advantage, towards the management of
talent. Besides that, within the last years the new shift paradigm increased the
significance of TM (Collings & Mellahi, 2009).
The definitions of talent by Gallardo-Gallardo et al. (2013) and Tetik (2016) are suitable
and appropriate to guide this study. Accordingly, Gallardo et al. (2013) and Tetik (2016)
summarised and discovered the composite form of all talent definitions in the theoretical
literature and they encompass the conceptualisation of talent through two approaches
namely, object approach and subject approach. For example, the authors identify all
employees' characteristics within the organisation, which includes the inherent gifts,
abilities, awareness, personality and drive.
55
The term “talent” is defined in different ways. Dries (2013) argues that it will be impossible
to be persuaded of the importance of TM if the investigators fail to provide a uniform
definition of the word talent. In contrast, Boudreau (2013) argues that the acceptance of
a single definition of talent will not aid in the TM, nor will it enrich the development of
workers. Because talent definition is a shared necessary to future integrative research, at
present, the implied meaning of talent differs, but is often sufficient for organisations to
accomplish very valuable TM contributions (Boudreau, 2013).
Vladescu (2012) believes that some people are considered talented as they retain
excellent and potential competences through which they can influence the efficiency and
effectiveness of the organisation, in which they work. According to Tetik (2016) talent
comprises of those people who can make changes to organisational performance, either
through their instant contribution or in the longer-term by demonstrating the highest levels
of potential. By combining the different viewpoints of talent, which refers to traits such as
ability, capacity, competency, knowledge, and skills of the people, it includes identifying
high potential and high productivity that facilitate the success of the organisational
objectives (Tetik, 2016). Despite that, Morton (2004) and Alruwaili (2018) explained talent
as those employees who have an endogenous capacity (meaning where talent originates
internally) that allows them to make significant and desired changes in the current and
future performance of the organisation.
In addition, Berliandaldo and Hidayat (2017) found that the definition of talent implies that
talent is something that an employee construct and nurture through an organisation’s
training and development programme, as a long-term process, to advance their
performance so that it can drive organisational success. However, different opinions on
talent seem to come from a focus on either the current, or the future abilities of employees
for exemplary performance (Erasmus et al., 2017). Therefore, talented employees are
potential applicants for future senior management and expatriate roles, expected to drive
competitive performance and development (King, 2015).
TM focusses on the current and future abilities of employees for performance, therefore
the talent of employees need to be managed (Alruwaili, 2018; Erasmus et al., 2017). The
next section presents how the literature conceptualises and implements TM.
56
3.2.2 Conceptualising talent management
The concept of TM is lacking in terms of definition and theoretical development, and there
is a comparative lack of practical evidence on the subject of TM (Cappelli 2008a, 2008b;
Cappelli & Keller, 2014; Lewis & Heckman, 2006; Nafei, 2015). In addition, there is still
no consent over its definition, theoretical background and scope (Gallardo-Gallardo &
Thunnissen, 2016; Lewis & Heckman, 2006; Schiemann, 2014). In contrast, Sparrow and
Makram (2015) claim that TM has reached maturity, whereas Gallardo-Gallardo, Nijs,
Dries, and Gallo (2015) declare that TM is expanding to an advanced field. These authors
argue that the understanding of TM is going to change radically and quickly in the future
as it shifts from a “growing” to a “mature” field of study (Gallardo-Gallardo & Thunnissen,
2016).
Vaiman and Collings (2013) are of the view that TM theory improvement is notably
advancing. Turner and Kalman (2015) argue that TM presently is already quite different
from the TM known in the twentieth century. This is due to a number of forces such as
globalisation, demographic changes, market and sector of operating or alterations in the
structure of organisations (Fajcikova, Urbancova & Kucirkova, 2017). However, Dries
(2013) states that no accessible theory has enough scope to capture all its different
elements and no organisational approach to TM is considered superior to others. Collings
and Mellahi (2009), and Dries and Pepermans (2008), agree that despite the need for
unceasing development of the theory and practice of TM, there is still a lack of experiential
studies on TM.
Indeed, Ashton and Morton (2005) noted that there is no sole reliable definition on TM.
However, Lewis and Heckman (2006) provide a critique of the literature on TM and state
that the lack of reliable definitions appears to be the reason why there are so many ways
of construing TM in practice, which may lead to possible confusion within the organisation.
In order to clear up the confusion on TM definition, Hafez, AbouelNeel and Elsaid (2017),
Lewis and Heckman (2006), and Tarique and Schuler (2010), identified three key streams
of thought around the concept of TM as follows:
• Employees who merely substitute the label TM for HRM: This custom often limits
their focus to specific HR practices such as recruitment, leadership development,
succession planning etc. Therefore, this amounts to the rebranding of HRM.
57
• Development of talent pools focusing on projecting employee/staffing needs and
managing the progression of employees through positions: This custom builds on
succession planning literature, while adopting a comparatively narrow focus to
provide a degree of differentiation as to what TM is compared to HRM.
• Management of talented employees: This approach categorises employees by
performance levels e.g. “A”, “B”, “C” levels to signify top, competent, and bottom
performers, respectively (Lewis & Heckman, 2006). However, literature contend
that all roles within the organisation should be filled with “A performers”, referred
to as “top grading” (Smart, 1999) and emphasise the management of “C players”,
or consistently poor performers, out of the organisation (Michaels, Handfield-Jones
& Axelrod, 2001). While the third approach is highly persuasive, researchers
recognise limitations to this approach and argue that it is neither needed nor
appropriate to fill all positions within the organisation with top performers (Collings
& Mellahi, 2009). Above all talent of administrative staff is important to the
university’s success and it will help the HR goal of managing employees to raise
performance.
According to Ariss et al. (2014) and Collings and Mellahi (2009), TM is conceptualised as
the actions and processes that are involved in the streams mentioned above by Hafez et
al. (2017), Lewis and Heckman 2006 and Tarique and Schuler (2010). Al Ariss et al.
(2014), and Collings and Mellahi (2009) added a continuous commitment to the
organisation and well-being of societies, while taking local and national contexts into
accounts. Therefore, in the context of this study, HSU should consider a continuous
obligation in managing the talent and identifying the positions of all administrative staff by
developing their talent which will have a tremendous impact on the university’s
competitive advantage. In this study, talent is seen as all employees in the organisation.
In addition, there are different talents, and each person is at different level such as low,
potential or high talent.
Collings and Mellahi (2009) envision that TM programmes need to move beyond the
performance-based discourse traditionally found in the organisations if they are to make
positive impacts on society as a whole. Also to address the linkages among different
organisational level and individual level. In addition, Chemaiyo (2016) notes that TM
problems have to be addressed at the highest level of the organisation, management of
58
strategic conclusions, and practices need to emphasise on the results, which should
reveal the views and actions.
TM refers to the procedure that assists the identification, development, engagement and
placement of those employees who are of specific value to an organisation (Chemaiyo,
2016). According to Erasmus et al. (2017) managing talent inside the organisation has
been identified as the device capable of enabling the attraction, development, and
retaining of the necessary skills and knowledge within the organisation through complete
strategy, practices, and interventions.
Alternatively, Yasin (2014) indicates that TM is the additional administration, procedures
and opportunities that are offered to individuals in the organisation who are deemed to
be “talent”. Hafez et al. (2017) define TM as the roles, practices and activities that are
normally performed by HR departments; these include training and development,
recruitment, selection, career and succession management. In addition, TM refers to the
implementation of integrated HR strategies to attract, develop, retain and productively
utilise employees with the necessary skills and abilities to meet present and future
employment needs (Barkhuizen et al., 2014; Gallardo-Gallardo & Thunnissen, 2016).
Cappelli and Keller (2014:307) describe TM as “the process through which organisations
anticipate and meet the needs for talent in strategic jobs”. The authors state that two
debates emerged, namely; “inclusive and exclusive”. Emphasises on employees as an
integral part of an organisation’s achievement was researched by Mishra (2008) who
argues that the majority of employees inside the organisation are part of a pool of ignored
talent, and if appropriately engaged, will be able to contribute a great deal to the
organisation.
TM aims at developing and positioning the right people to do the right job, on the right
time, and give them the right setting, to be able to reveal their abilities in the best possible
way for the organisation (Marjani & Safaee, 2016). HR needs to develop an integrated
and active strategic method and ensure that the organisation’s culture supports talent.
Considering the fact that HR also plays a role as a transformation agent, it has to
incorporate TM in any organisation. Therefore, HR has to ensure a continuous
development of human capital which can result in more engaged employees and a lower
turnover (Erasmus et al., 2015). HR should have a plan in place to support the TM of
59
organisational values. Boudreau and Ramstad (2007) state that whether TM is called
people, intellectual capital, HR, talent or some other term, the resource that lies within
employees and how they are organised is progressively recognised as critical to strategic
achievement and competitive advantage.
Moreover, the literature found that TM has been investigated mostly in Europe and slight
has been done in Africa, specifically in the South African public service (Gallardo-Gallardo
& Thunnissen, 2016). Moreover, TM takes place mainly in private sector organisations,
multinationals, and organisations in United States of America contexts (Erasmus et al.,
2017). The discussion above has demonstrated that defining TM is multifaceted. TM is
being executed differently in different organisations (Dries, 2013). Hughes and Rog
(2008), argue that, previously TM can be executed, top leaders need to first have mutual
understanding and agree on the suitable definition of TM for the organisation. As a result,
it was significant to in this research examine how TM could be implemented towards the
support for employee retention of administrative staff because TM is regarded as a plan
to identify, grow and retain talent in the organisation (Poocharoen & Lee, 2013; Saadat &
Eskandari, 2016).
On the other hand, Cappelli and Keller (2014:307), state that TM is “the process through
which organisations anticipate and meet the needs for talent in strategic jobs”. Therefore,
TM represents a component of the HRD strategy which summarises the organisational
policies and administration supporting the accomplishment of TM activities. According to
Erasmus et al. (2017), TM is not a stand-alone programme that exist only within HR, but
a concept that should be filled in the hearts and mind of line managers. Besides, it was
argued by HR managers that HRM systems of employees planning and staffing,
performance management, learning and development, employee relations, and
organisational development should focus on using the organisation’s human talent to
achieve competitive advantage (Bushney, Katz, Knoke, Ludike, Meyer, Nel, Schenk,
Smith, Van Niekerk & Wolfson, 2012).
3.3 DIFFERENT APPROACHES TO TALENT MANAGEMENT
The literature found two prominent methods to TM in the world of work (Al Ariss et al.,
2014; Cappelli & Keller, 2014; Dries, 2013; Gallardo-Garllardo & Thunnissen, 2016;
Takács-György & Takács, 2017; Yener et al., 2017). Gallardo-Gallardo and Thunnissen
60
(2016) hypothesise that the exclusive approach is sometimes referred to as the
differentiation approach, which assumes that TM is focusing simply on those workers who
are considered as top performers and high potential. The inclusive or generic approach
views all workers as talented, and they are all comprised in TM (Gallardo-Gallardo &
Thunnissen, 2016). The practical insinuation of these TM approaches, and concerns on
the investment of scarce resources, is the development for all employees or if the
organisation should differentially invest in certain employees or jobs (Cappelli & Keller,
2014). The two approaches of TM are described below.
3.3.1 Exclusive (elitist) approach
The exclusive approach considers only a small group of high performing, talented
employees important in driving the strategic objectives of the organisation (Al Ariss et al.,
2014; Meyers & Van Woerkom, 2014). The exclusive approach has a longer history,
certainly inspired by the practices in the military, where ranked arrangement is presumed
(Cappelli & Keller, 2014). According to Dries (2013) some people are innately more
talented in a different way than others within the organisation and talent on transferable
viewpoints assume that talented employees will reveal their talent irrespective of the
working environment they are in. Yener et al. (2017) indicate that talent refers exclusively
to a group of employees who are highly significant and unique; while TM is a systematic
effort to ensure the continuous development of talented employees in crucial positions
and to inspire personal development.
According to Al Ariss et al. (2014), the exclusive approach deals only with the talents of
high performing employees who are alienated by their added value to the organisation.
Therefore, employees can be regarded talent if they have high level of main qualifications
for the organisations and are able to give substantially to its development (Moczydlowska,
2012). The exclusive approach to TM is regarded as the “differential management of
employees,” “competent and committed knowledge employees for key positions”, “high
potentials in key positions”, however, the inclusive approach to TM is certainly not often
used (Gallardo-Garllardo & Thunnissen, 2016:45).
According to Al Ariss et al. (2014) the exclusive approach is restricted to high-potential
employees. Specifically, the exclusive approach to TM is said to benefit from what is
called "the Mathew effect". For example, the result whereby the sharing of more
61
resources to the better performers in the organisation leads to higher return on
investment, since more resources are allocated where more returns can be anticipated
(Bothner, Podolny & Smith, 2011). The exclusive approach is opposed to the view that all
employees are regarded as talented (Moczydlowska, 2012).
In addition, employees can be considered as talent if they have a high level of the key
qualifications for the organisation and are capable to add substantively to its development
(Yener et al., 2017). Only the well-qualified, high performing employees are regarded as
adding value to the organisation. The exclusive approach is presumed to create higher
return on investment in terms of profit and productivity, brought about by rises in the
achievement motivation of a star employee (Dries, 2013).
According to Al Ariss et al. (2014), the elitist approach to TM influences the individual
level of TM. It excludes individuals who are in lower ranks in organisations, such as
technical and operational employees who did not have the chance to accumulate social,
cultural, human and numerous other forms of capital. In addition, they will have little
chance to progress within their organisations, and their organisations might miss the
opportunity to advance employees who may have played key roles in areas like
innovation, technical expertise and management (Al Ariss et al., 2014).
3.3.2 Inclusive (egalitarian) approach
Literature indicates that the inclusive approach of TM is related to the management of the
talent among all employees (Cappelli & Keller 2014; Dries, 2013; Yener et al., 2017).
According to the inclusive approach, Meyers and Van Woerkom (2014), Mishra (2008)
and Yener et al. (2017) promote the viewpoint that all employees in the organisation have
the potential to be talented. Therefore, managing all the available talent will lead to the
development and growth of the organisation (Takács-György & Takács, 2017). The
reflection is that each individual is gifted uniquely. In addition, the duty of HR employees
is to identify these talents and ensure that the employees are all developed to use their
potential talent to benefit the organisation. Dries (2013) states that TM leads to a more
pleasurable working environment, characterised by openness, trust, and overall
employee comfort.
62
Some organisation prefer a more inclusive approach of TM and try to address the needs
of employees at all levels of the organisation (Stahl, Björkman, Farndale, Morris, Paauwe,
Stiles & Wright 2012). According to Gallardo-Garllardo and Thunnissen (2016) the
inclusive approach to TM is not frequently implemented. In addition, the inclusive
approach developed more recently, perhaps in reaction to egalitarian concepts during the
1960s and 1970s, as well as workplace regulations demanding equal treatment of
workers in areas such as retirement policies and health benefits (Cappelli & Keller, 2014).
Moreover, Meyers and Van Woerkom (2014) argue that the inclusive approach is
normally used to advance the performance of all workers and it provides an opportunity
for all workers to show their potential. Therefore, regardless of the type of approach
adopted, organisations could clearly communicate their TM philosophy (Meyers & Van
Woerkom, 2014). Regarding the disputed use of performance assessment as a criterion
to recognise and distinguish workers, it is not worthy to say some of them are talented
and others not, as performed typically reflects experience with the job, and not talent. In
addition, Lin (2006) argues that adopting an inclusive approach to TM might create
needless high costs in terms of HR investments. Because of the assumption of the
strength-based approach, crafting a win-win for both employees and organisations may
be flawed. Hence, gap-based and exclusive approaches to TM are often more cost-
effective and effective solutions (Collings & Mellahi, 2009). Likewise, Stahl et al. (2012)
argue that in practice organisations use both the inclusive and exclusive approach,
depending on the specific talent pool, such as senior executives, technical experts etc.
There will usually be different career paths and development strategies for different
categories of careers. While the exclusive conceptualisation appears to be most preferred
by organisations, managers have a duty to attend to all those who are at stake in or have
a claim on the organisation. Therefore, organisations need to choose on in what way their
TM will be approached and implemented (Gallardo-Gallardo & Thunnissen, 2016).
3.4 THE PURPOSE AND SIGNIFICANCE OF TALENT MANAGEMENT
TM has drawn much more consideration from researchers due to its effect on the
competitive advantage of an organisation (Ashton & Morton, 2005; Coulson-Thomas,
2012). Collings and Mellahi (2009:305) state that “the resources and capabilities that
underpins firms’ competitive advantage are directly tied to the capabilities of talented
individuals who make up the firm’s human capital pool”. Ashton and Morton (2005) argue
63
that good TM significantly improves strategy implementation and operational excellence.
Despite this, organisations are facing important challenges arising from the intensification
of competition (Rao, 2017). According to Esmaeili (2016) TM is key in maintaining the
competitive advantage of organisations.
Dries and Pepermans (2012) trust that what constitutes “talent” needs to be agreed upon
by line managers, HR managers, and top managers, all of whom might have different
viewpoints on the sources of competitive advantage for the organisation. Despite that TM
is an important task of the HR department and the organisation as a whole (Alruwaili,
2018). In addition, at the organisational level, TM remains mainly confined to skilled
people, expected to fill the managerial positions (Al Ariss et al., 2014). Rao (2017)
indicates that the purpose of TM is to ensure that an organisation has the right talent with
the right skills, and at the right time.
Organisations should attract and hire individuals who have the innovative skills to create
new thoughts and advance work approaches (Alruwaili, 2018). In addition, virtuous TM
will attract more gifted individuals and increase retention in the organisation ( Hughes &
Rog, 2008). Furthermore, the HRM should work to improve these talents and maintain
them in order for that talent to be deployed within the organisation (Scullion et al., 2010).
Ashton and Morton (2005) considered TM as a complex concept that has been adopted
by the practitioners of HRM because this adoption is a necessary weapon in the war for
talent.
3.5 TALENT MANAGEMENT PROCESS
TM is the process of establishing a continuous supply of highly productive people in the
right job at the right time, including the operation of plans aimed to increase workplace
productivity. Additionally, this includes the improvement of processes for attracting,
emerging, retentive, and utilisation of individuals with essential expertise and abilities to
meet present and future strategic employment needs (Erasmus et al., 2015). Madhuri and
Sundaresan (2018) note that a proper procedure of recognition, judging, educating and
maintaining the effective staffs that have knowledge, wisdom and skills is done through
TM processes.
64
Despite that, through a systematic and all-inclusive approach, TM contains numerous
processes, namely planning, recruitment, placement, orientation, development,
assessment, and management of all employees owned by the organisation (Berliandaldo
& Hidayat, 2017; Collings & Mellahi, 2009; Berger & Berger, 2004; Schiemann, 2014).
However, in order to gain competitive advantage, organisations may increase their output
by employing the right people to the right positions and developing the relevant
capabilities based on the planned goals of the organisation (Collings & Mellahi, 2009;
Farley, 2005; Lewis & Heckman, 2006; Tarique & Schuler, 2010).
Tetik (2016) states that the talent process can be applied in three ways, namely,
attracting, attaining, and finding talents. Developing talent pools are the consequences of
this process. Besides, attraction is the first step of TM by HR department in the
organisation (Dries, 2013). Cappelli and Keller (2014) state that TM is the process through
which organisations expect and meet the requirements for talent in strategic jobs. Despite
that, organisations needs to identify the type of staff and the skills they may need in the
future, and these may be different to those required in the past (Rao, 2017). However,
the study conducted by Alruwaili (2018) found that TM indicates that through training and
management, the organisation’s performance can be enhanced and employees can be
encouraged to develop their talent.
3.5.1 Dimensions/steps in the process of talent management
Van Zyl, Mathafena and Ras (2017) highlighted that once the organisation agrees on
what talent strategies they are going to pursue; it becomes even more critical to develop
action plans for implementation purpose. According to Heinen and O’Neill (2004),
continued competitive advantage comes from TM practices. The operation of TM process
in an organisation include talent planning, recruitment, compensation and rewards,
performance management and employee empowerment, employee engagement and
organisational culture (Nafei, 2015). These TM dimensions are displayed in Figure 3.1,
which is taken from the American International Paper of Social Science (Nafei, 2015:94).
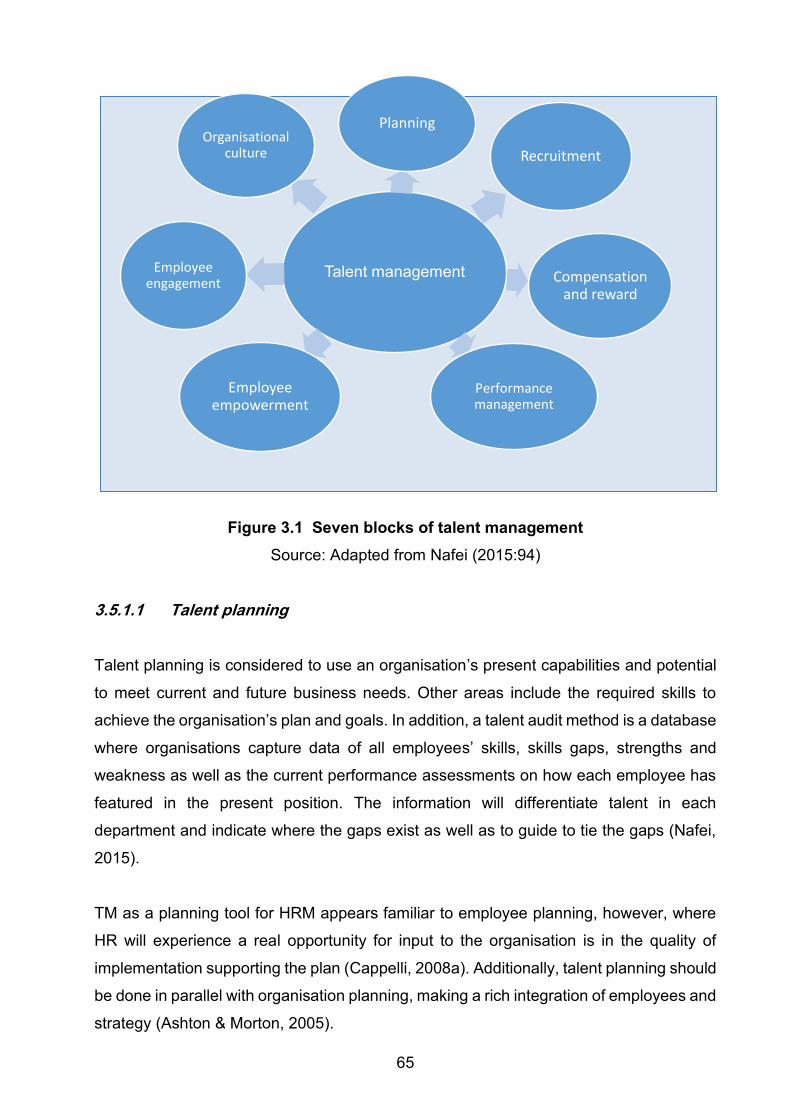
65
Figure 3.1 Seven blocks of talent management
Source: Adapted from Nafei (2015:94)
3.5.1.1 Talent planning
Talent planning is considered to use an organisation’s present capabilities and potential
to meet current and future business needs. Other areas include the required skills to
achieve the organisation’s plan and goals. In addition, a talent audit method is a database
where organisations capture data of all employees’ skills, skills gaps, strengths and
weakness as well as the current performance assessments on how each employee has
featured in the present position. The information will differentiate talent in each
department and indicate where the gaps exist as well as to guide to tie the gaps (Nafei,
2015).
TM as a planning tool for HRM appears familiar to employee planning, however, where
HR will experience a real opportunity for input to the organisation is in the quality of
implementation supporting the plan (Cappelli, 2008a). Additionally, talent planning should
be done in parallel with organisation planning, making a rich integration of employees and
strategy (Ashton & Morton, 2005).
Talent management
Planning
Recruitment
Compensation and reward
Performance management
Employee empowerment
Employee engagement
Organisational culture
66
3.5.1.2 Recruitment
The process of finding the recruitment plan is as the key business goals for the next five
to ten years, determine the skills and talent required to achieve the strategic objectives
and determine whether the current employees have the abilities needed, and whether to
develop them (Nafei, 2015). Wikstrom and Martin (2012) advocate a recruitment strategy
that summarises the overall necessities of the organisation in terms of recruitment.
Despite that, technology tools are now readily available to eradicate and eliminate
tedious, old and long paper-driven processes of recruitment (Robbins & Coulter, 2010).
3.5.1.3 Compensation and reward
Remuneration strategies have to be tied to general business strategy (Caplan, 2011).
Despite that, the rewards and recognition system aids as an imperative factor to build and
retain talent in an organisation. The performance assessment system starts with
individual managers setting performance goals and objectives that are similar with the
organisational plan (Nafei, 2015). Extrinsic rewards are not a sinful but every good
manager should learn how to balance intrinsic and extrinsic rewards (DuBrain, 2005).
3.5.1.4 Performance management
According to Nafei (2015), performance management (PM) is a method for incorporating
the management of organisational and employee performance. PM has five important
aspects; they are:
• the vision, policies and goals of the organisation
• the employee to meet with his manager and discuss how personal goals can be
affiliated to the organisational goal
• the organisation’s value proposition should be guiding aspect in framing
performance standards
• the goals should be smart (specific, measurable, attainable, realistic and time-
bound)
• the performance appraisal should be directed to determine compliance with the
set goals and standards attainments made (Coetsee, 2004)
67
PM should be aligned with the whole organisation’s business strategy (Nafei, 2015).
Therefore, the results of this assessment is used to build the weak areas of an employee
through finding the right training needs of that particular employee (Mathias & Jackson,
2006). Besides, performance management is a vital part of the process of improvement
and identification of talent. However, the communication between employee and line
manager and the feedback create the leading ingredients of performance management,
which lead to unceasing improvement in the organisation (Caplan, 2011).
3.5.1.5 Employee empowerment
Empowerment can only be implemented positively if the two parties, namely, the manager
and the employee, are fully involved (Nafei, 2015). The empowerment method requires
managers to commit to educate their team members and make them aware of their roles,
and ensure that they perform these roles efficiently. However, the manager should ensure
that the team members have all the resources needed to carry out the job (Gomez-Metjia,
Balkin & Robert, 2004).
3.5.1.6 Employee engagement
Employee engagement is the main driver of organisational effectiveness and
performance. Employees need to have a sense of belonging and share in the organisation
vision and then allow an employee to discover their role in the organisation (Kennedy &
Daim, 2010). Therefore, the main aspects of employee commitment include the job itself,
opportunities, quality of life, processes, talent and skill utilisation. HR policies are
important and satisfied employee know what is anticipated (Nafei, 2015). Besides, the
level of employee engagement considerably impacts retention, absenteeism and
customer satisfaction (Wagner, 2006).
3.5.1.7 Organisational culture
According to Nafei (2015), organisational culture includes the environment of the
organisation and is created on the shared values, norms, beliefs and backgrounds that
have been established over time in the organisation. Despite that, a positive culture helps
employees to stay within the organisation. Culture aid employees feel linked to their
organisation and job. Social support, leadership and good work-life balance are part of
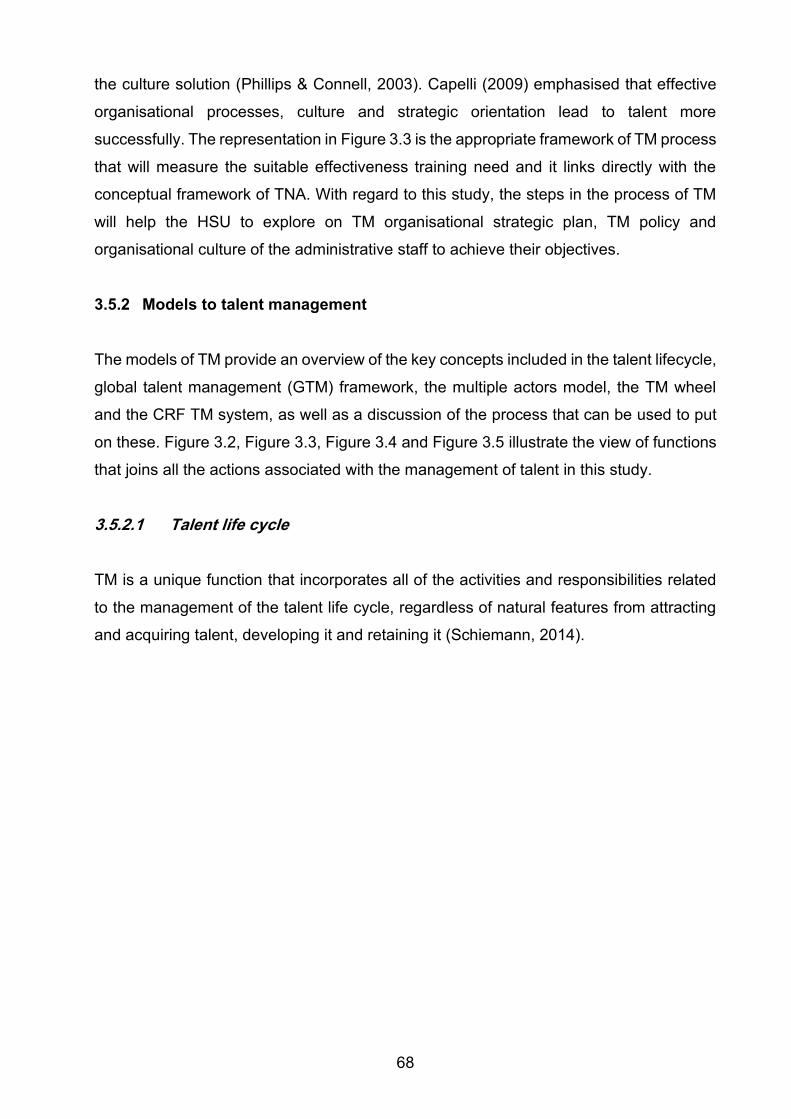
68
the culture solution (Phillips & Connell, 2003). Capelli (2009) emphasised that effective
organisational processes, culture and strategic orientation lead to talent more
successfully. The representation in Figure 3.3 is the appropriate framework of TM process
that will measure the suitable effectiveness training need and it links directly with the
conceptual framework of TNA. With regard to this study, the steps in the process of TM
will help the HSU to explore on TM organisational strategic plan, TM policy and
organisational culture of the administrative staff to achieve their objectives.
3.5.2 Models to talent management
The models of TM provide an overview of the key concepts included in the talent lifecycle,
global talent management (GTM) framework, the multiple actors model, the TM wheel
and the CRF TM system, as well as a discussion of the process that can be used to put
on these. Figure 3.2, Figure 3.3, Figure 3.4 and Figure 3.5 illustrate the view of functions
that joins all the actions associated with the management of talent in this study.
3.5.2.1 Talent life cycle
TM is a unique function that incorporates all of the activities and responsibilities related
to the management of the talent life cycle, regardless of natural features from attracting
and acquiring talent, developing it and retaining it (Schiemann, 2014).
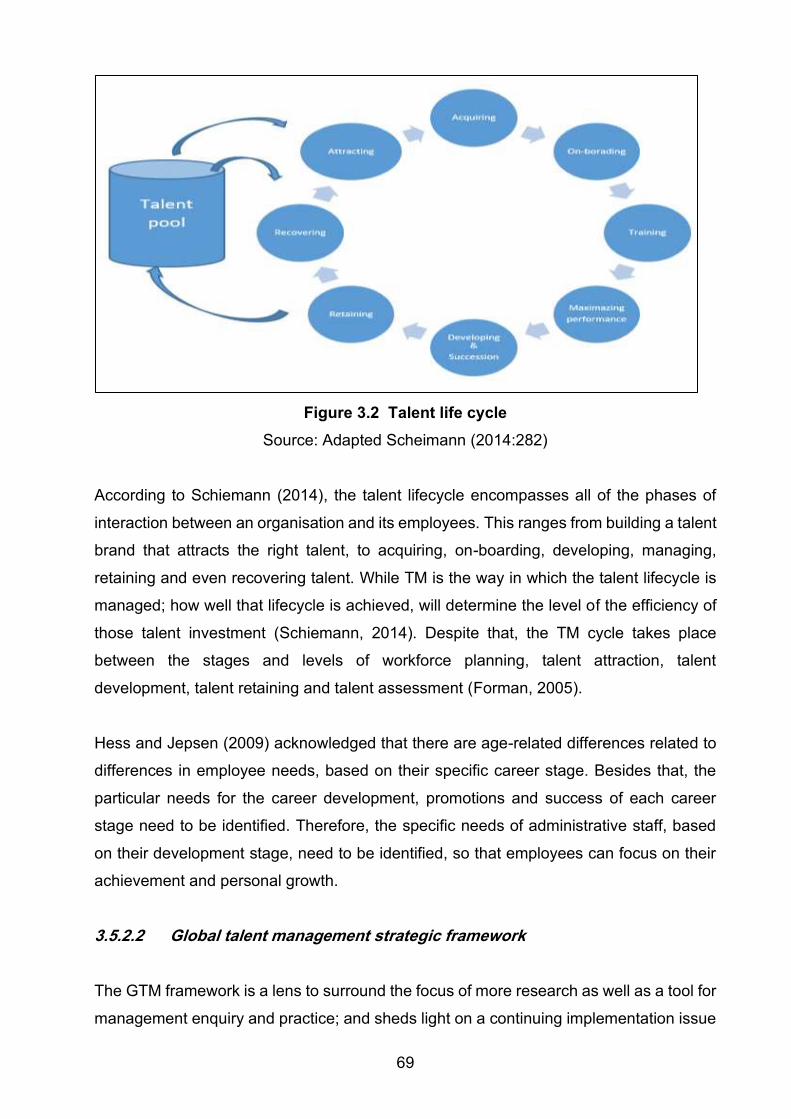
69
Figure 3.2 Talent life cycle
Source: Adapted Scheimann (2014:282)
According to Schiemann (2014), the talent lifecycle encompasses all of the phases of
interaction between an organisation and its employees. This ranges from building a talent
brand that attracts the right talent, to acquiring, on-boarding, developing, managing,
retaining and even recovering talent. While TM is the way in which the talent lifecycle is
managed; how well that lifecycle is achieved, will determine the level of the efficiency of
those talent investment (Schiemann, 2014). Despite that, the TM cycle takes place
between the stages and levels of workforce planning, talent attraction, talent
development, talent retaining and talent assessment (Forman, 2005).
Hess and Jepsen (2009) acknowledged that there are age-related differences related to
differences in employee needs, based on their specific career stage. Besides that, the
particular needs for the career development, promotions and success of each career
stage need to be identified. Therefore, the specific needs of administrative staff, based
on their development stage, need to be identified, so that employees can focus on their
achievement and personal growth.
3.5.2.2 Global talent management strategic framework
The GTM framework is a lens to surround the focus of more research as well as a tool for
management enquiry and practice; and sheds light on a continuing implementation issue
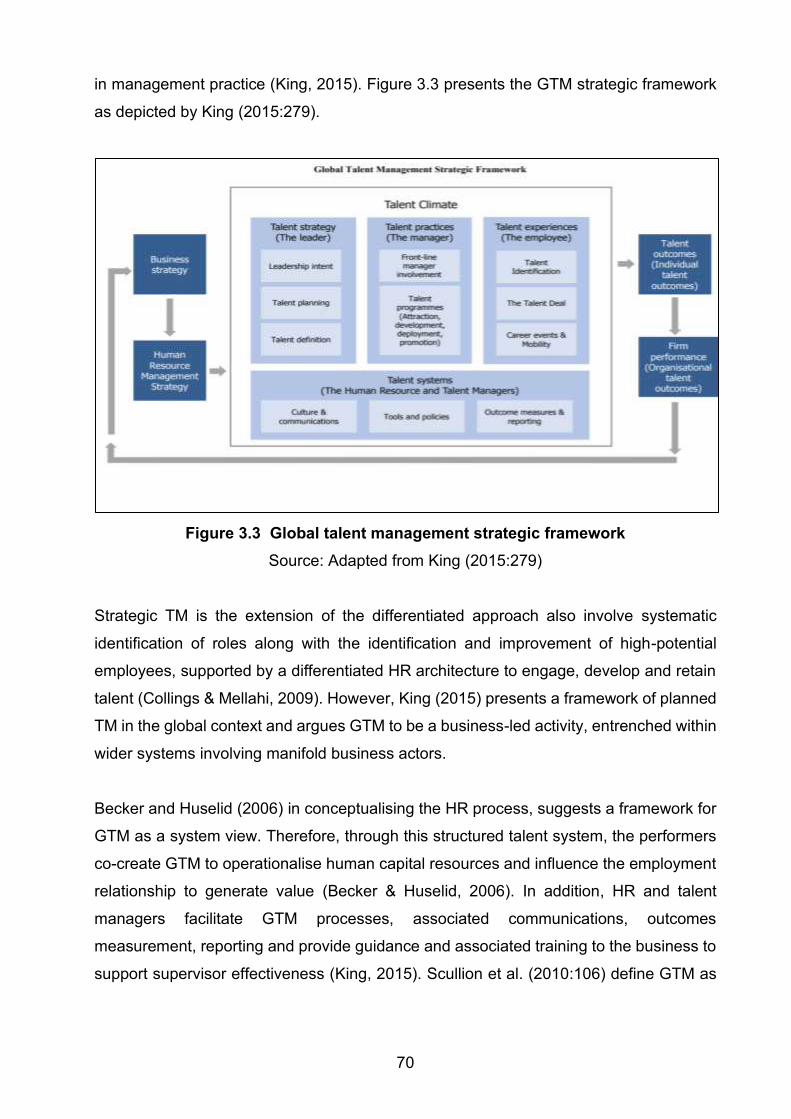
70
in management practice (King, 2015). Figure 3.3 presents the GTM strategic framework
as depicted by King (2015:279).
Figure 3.3 Global talent management strategic framework
Source: Adapted from King (2015:279)
Strategic TM is the extension of the differentiated approach also involve systematic
identification of roles along with the identification and improvement of high-potential
employees, supported by a differentiated HR architecture to engage, develop and retain
talent (Collings & Mellahi, 2009). However, King (2015) presents a framework of planned
TM in the global context and argues GTM to be a business-led activity, entrenched within
wider systems involving manifold business actors.
Becker and Huselid (2006) in conceptualising the HR process, suggests a framework for
GTM as a system view. Therefore, through this structured talent system, the performers
co-create GTM to operationalise human capital resources and influence the employment
relationship to generate value (Becker & Huselid, 2006). In addition, HR and talent
managers facilitate GTM processes, associated communications, outcomes
measurement, reporting and provide guidance and associated training to the business to
support supervisor effectiveness (King, 2015). Scullion et al. (2010:106) define GTM as
71
“all organisational activities for the purpose of attracting, selecting, developing and
retaining the best employees in the strategic roles on a global scale”.
3.5.2.3 The multiple-actors model: employees at the heart of the talent system
Effective management of talent entails the participation of multiple actors in a coherent
and business entrenched activity which facilitates at its core an HRM process but more
considerably, moves beyond process to practices which engender involvement of the
actors and their contribution to individual and organisational outcomes (Thunnissen,
Boselie, & Fruytier, 2013). Figure 3.4 presents the multiple-actors model: employees at
the heart of the talent system (King, 2015:279).
Figure 3.4 The multiple-actors model: employees at the heart of the talent system
Source: Adapted from King (2015:279)
Managers continue to experience challenges in the management of talent (Pfeffer, 2001,
2006). However, both management and academic perspectives agree that management
participation is required for effective TM (Stahl et al., 2012). Despite that, leadership plays
a key role in connecting the strategy and performance through promoting effective
psychological contracts (McDermott, Conway, Rousseau & Flood, 2013). Therefore, the
voice of leadership is central to organisational climate, and arguably to the resulting talent
climate, noticeable by employees in an organisation which performs TM (McDermott et
al., 2013).
72
Despite that, leadership has to make sure that TM strategies are effective, support the
organisational goals and add value to the business imperatives (Van Zyl et al., 2017).
Line managers are directly accountable for identifying, selecting and recommending the
high potential and high performing talented employees in their teams to become part of
the official TM pool (Van Zyl et al., 2017). Despite that, strategic business research has
noted that differences among middle managers has a large impact on organisational
performance (Mollick, 2012) and that front-line manager duties progressively include
previous responsibilities of HR including TM. Because the SHRM and the TM literatures
are limited by current knowledge of business implementation of SHRM, plans regarding
the talent pool and the propensity to ignore the role of multiple actors by focusing on top
management’s role overlook the role of front-line manager in enacting these policies
(Lopez-Cotarelo, 2013) and the employee’s involvement role (Bjorkman, Ehrnrooth,
Houlund, Makela, Smale & Sumelius 2013). Cappelli (2013) further argues the
prospective contribution of supervisor in the talent system.
The supervisor role is anticipated to have meaningful influence on TM results and is
pivotal for the exchange of resources and recognising inconsistency performance (Becker
& Huselid, 1998). Additionally, spanning the relationship between the business and its
workforce, the HR function is debatably a crucial partner to the delivery of strategy
through the employees (King, 2015). Therefore, HR is responsible for the talent strategy
in line with the organisational plan as well as guiding management and leadership teams
in applying the tools, systems and processes of TM (Van Zyl et al., 2017). Besides, there
is a global mobility role for HR within the wider realm of TM. However, a more particular
embedded role as actor in GTM is not clearly well-defined (Farndale, Scullion & Sparrow,
2010).
HR’s role in the management of the organisation’s talent is important, relevant and
enables the interface between performers (King, 2015). Despite that, HR’s role is a
custodian of the employee relationship for the organisation. HR is well-positioned to
facilitate the TM among the other core performers. Firstly, to support the top
management’s active focus on talent and competence requirements, informed by
strategy. Secondly, to support, coach and enable the day-to-day management of talent
by supervisors, who may comprehend the planned imperative but need training,
guidance, support and feedback in their enactment of the strategic imperative and
accountability. Thirdly, to enable employee communications and engagement in talent
73
initiatives. Lastly, in facilitating TM processes and HR’s role necessarily includes
capacities of results and reporting (King, 2015).
According to Van Zyl et al. (2017), organisations need to go as far as assigning TM
activities, tasks and deliverables to the performance management process in the form of
key performance indicators. King (2015) argue that the employee participation is the heart
of GTM, and indeed the employee reaction to talent identification, should be considered.
Therefore, talented employees have a role to play in order to ensure that they obtain
necessary skills, knowledge and experience to assist their career growth aspirations (Van
Zyl et al., 2017). Besides, employees are one of many stakeholders in managing HR
(King, 2015). Collings (2014) argues that a participant may experience direct, and
comparatively near-term consequences in the exchange-based relationship. In support,
King (2015) argues that employee reaction to GTM is essential to effective GTM,
however, is mainly ignored.
3.5.2.4 Talent management wheel
Stahl et al. (2012) argue that talent is pivotal to the operations of any organisation and
this narrates to business survival. According to Al Ariss et al. (2014) each organisation
should align their TM practices with the organisational strategy and values. In their article
titled Leveraging your Talent: Talent Management, Stahl et al. (2012) presents six
principles which they suggest organisations need to consider to align their TM. The
following six principles are depicted in the TM wheel (Stahl et al., 2012:27), presented in
Figure 3.5, that follows:
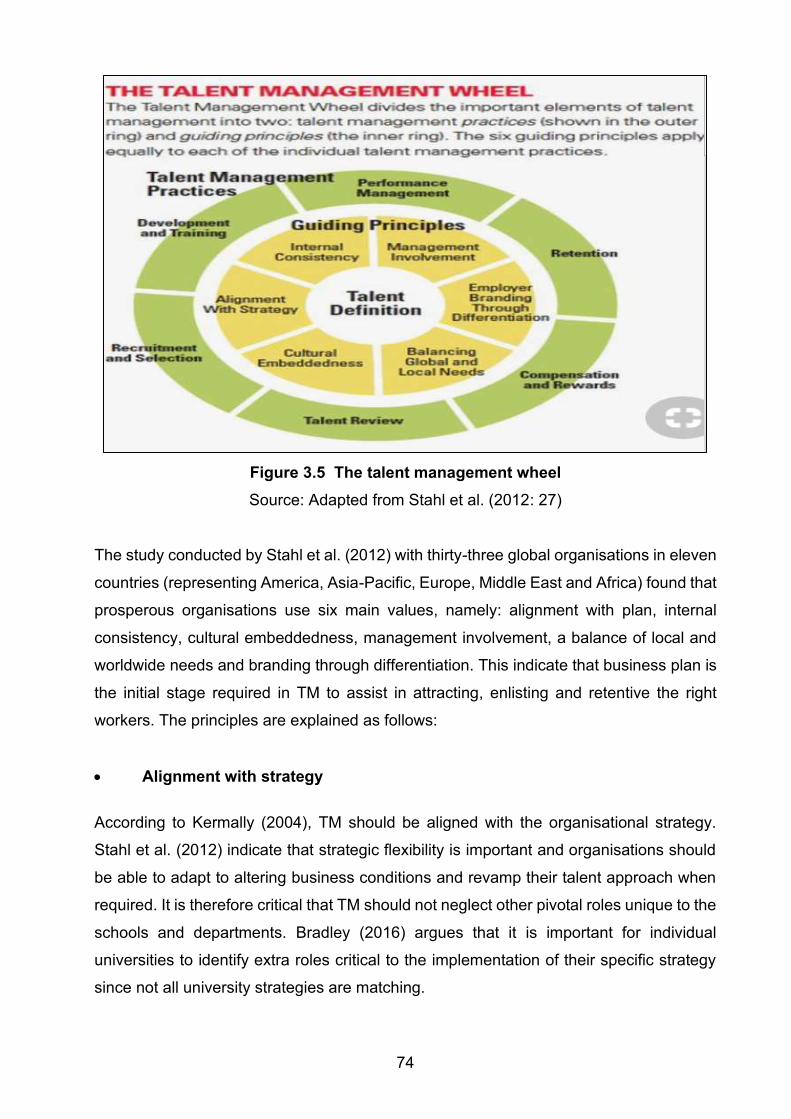
74
Figure 3.5 The talent management wheel
Source: Adapted from Stahl et al. (2012: 27)
The study conducted by Stahl et al. (2012) with thirty-three global organisations in eleven
countries (representing America, Asia-Pacific, Europe, Middle East and Africa) found that
prosperous organisations use six main values, namely: alignment with plan, internal
consistency, cultural embeddedness, management involvement, a balance of local and
worldwide needs and branding through differentiation. This indicate that business plan is
the initial stage required in TM to assist in attracting, enlisting and retentive the right
workers. The principles are explained as follows:
• Alignment with strategy
According to Kermally (2004), TM should be aligned with the organisational strategy.
Stahl et al. (2012) indicate that strategic flexibility is important and organisations should
be able to adapt to altering business conditions and revamp their talent approach when
required. It is therefore critical that TM should not neglect other pivotal roles unique to the
schools and departments. Bradley (2016) argues that it is important for individual
universities to identify extra roles critical to the implementation of their specific strategy
since not all university strategies are matching.
75
• Internal consistency
Stahl et al. (2012) state that consistency is crucial. Therefore, internal consistency refers
to the way the organisation’s TM practices fit with each other. For example, if an
organisation invests considerably in developing and training high-potential employees, it
should emphasise employee retention, competitive compensation and career
management. Likewise, the right people need to be selected and deployed in suitable
positions. Thereafter, sound TM practices, particularly talent development, rewards and
performance management should be maintained through continuous management
commitment (Mokgojwa, Barkhuizen & Schutte, 2017).
• Cultural embeddedness
Stahl et al. (2012) indicate that, leading organisations use training and development not
only to advance employee skills and knowledge, but to manage and streén culture.
Therefore, successful organisations consider their corporate culture as a source of
maintainable competitive advantage. According to Pienaar and Bester (2008) and
Netswera and Rankhumise (2005) universities should create a talent culture conducive
for the attainment of multiple priorities relating to the working environment, such as
recruitment and retention, performance management, succession planning and
engagement, and ensure that these become planned TM imperatives.
• Management involvement
According to Stahl et al. (2012), senior leaders need to be actively involved in the TM
process and make recruitment, succession planning, leadership development and
retention of key employees their top priority. Therefore, TM process needs to have
extensive ownership, not only by HR, but managers at all ranks including chief executives.
However, the level of executive commitment is infrequent (Stahl et al., 2012). Besides,
Joyce and Slocum (2012) argued that senior managers should manage talent in light of
strategic needs and opportunities of their organisations.
• Balance of global and local needs
Organisations need to figure out how to react to local demands while maintaining a
rational HR strategy and management approach. Despite that, organisations that find an
76
equilibrium between worldwide standardisation and integration and local implementation
have the best of both worlds (Stahl et al., 2012).
• Employer branding through differentiation
Competitive advantage in TM does not just come from identifying key activities (for
example, recruiting and training) and then implementing best practices, but successful
organisations adhere to the above mentioned six key principles (Stahl et al., 2012). In
addition, Dries and Pepermans (2012) believe that what constitutes talent, needs to be
agreed upon by line managers, HR managers, and top managers, all of whom might have
different perspectives on the sources of competitive advantage for their organisations.
3.5.2.5 CRF talent management system
According to Scullion et al. (2010), HRM should work to improve these talents and
maintain them in order for that talent to be deployed within the organisation. Organisations
need to go as far as assigning TM activities, tasks and deliverables to the performance
management procedure in the form of key performance indicators (Van Zyl et al., 2017).
According to Ashton and Morton (2005), the integration of TM is critical and research
shows that without integrating TM activities, the effort invested in it will be dissolute with
poor outcomes. Therefore, one way of attaining the system integration and alignment is
the CRF TMS. This system’s view of talent has five elements namely:
• Need – the organisational need derived from the business model and competitive
issues.
• Data collection – the central data and intelligence critical for good talent decisions.
• Planning – talent planning is guided by data analysis.
• Activities – the conversation of plans into incorporated sets of activities.
• Results – costs, measures and effectiveness criteria to judge the value and
impacts of TM.
Figure 3.6 presents the CRF TMS (talent management system) as depicted in the Journal
of Strategic HR Review (Ashton & Morton 2005:31).
77
Figure 3.6 The CRF talent management system
Source: Adapted from Ashton and Morton (2005:31)
Using a CPR system will help TM to become a planned differentiator rather than a normal
set of HR processes. Furthermore, as talent continues to be regarded as a strategic
differentiator, its management will take more of a planned role (Ashton & Morton, 2005).
According to Robbins and Coulter (2010) planning involves the process of defining goals,
finding a strategy for attaining those objectives and emerging the plans to coordinate and
integrate the activities. The role of the HR department at HSU should guide and support
the management team by allocating TM activities and tasks to implement TM models.
HSU specialises in health sciences programmes which are designed for training of
competent professionals in the health care sciences (Sethusa, 2016). However, the
implementation of TM, like many of the fundamental systems and process within a
university, relies on the skills and expertise of professional administrators and academic
managers (Bradley, 2016). It is always a challenge to employ a person with the expected
skills. Personnel with institutional memory are heading for retirement, thus leaving the
talent gaps. Some of the challenges of TM in HSU are recruiting talent, retaining talent,
and training and developing talent amongst the administrative employees.
78
An integrated TMS will be appropriate at a HSU since the management of talent will assist
in identifying the current and future needs of training to nurture administrative employees'
talent in order to link and align TM with the organisational strategy. Therefore, all-inclusive
programme should also recognise and reward talent throughout all administrative roles
(Bradley, 2016).
3.5.3 Advantages and disadvantages of talent management
Ashton and Morton (2005) believe that TM is a required factor by means of which
employees become involved in the activities designed to realise the plan of the
organisation. Below are the advantages and the disadvantages of TM.
3.5.3.1 Advantages
• TM creates a positive effects and performance for all stakeholders – employees,
customers, business partners and investors. Furthermore, TM is complex process,
mainly oriented towards the best interest of the organisation. Therefore, in the
public sector as well it will provide and improve efficiency, reduce risk and costs
(Vladescu, 2012).
• TM guarantee that each employee with their own precise talents and skills has
been placed into a suitable position such as employee development (Esmaeili,
2016). Then, a good integrated TMS should include options for employee learning
and development. It enables employees to take courses, develop their skills and
some cases pursue certifications relevant to their professional development. TMS
solutions also collect data on what skills an employee has and allows the HR team
to assign training which the employee can then access their biographical
information from the system (Vladescu, 2012). Therefore, it is very important to
integrate TMS with all facets of HRM (Alsakarneh & Hong, 2015). HSU should
explore and implement the TMS for administrative staff and it should include the
choice of learning and development.
• TM provide employees with the resources, improving and rewarding them with fair
service compensation, so that the people will have motivation to compete for
improvement in the workplace and feel that they can improve as special and
talented employees (Esmaeili, 2016). All the administrative staff have their own
79
talents which should be explored by setting the success stage for them as there is
no person without talent.
• TM provides better job opportunities for example, it increases employee and
manager engagement, the employee profile empowers employees and managers
to interact with employee’s professional career progression. An integrated TMS
solution encourages them to invest in the organisation and align their daily work
with the business goals while also focusing on their professional goals (Ashton &
Morton, 2005; Esmaeili, 2016).
3.5.3.2 Disadvantages
• Talented employees leave the organisation for many reasons, mainly due to being
unmotivated and dissatisfied with their jobs (Hafez et al., 2017). This has
implications for cost of hiring if the employees leave the institution because they
are generally dissatisfied with current work.
• One of the reasons for the employees to leave their job is less pay. Sometimes
employees compare their pay with the amount of work they do, rather than their
competency of performing the job. In this case, it will be beneficial to look at their
performance through performance management system and offer performance
bonuses or pay increase (Vladescu, 2012).
• Poor retention of TM may be related to recruitment errors. If the institution is not
clear about their expectations, this may make the employee feel that they are not
suitable for the job and they tend to leave the institution without realising that their
full potential is not utilised. Lack of strategic plan and no clear standards for TM
and having a TM plan, but no action (Martel, 2003, Vladescu, 2012).
From the above discussion, it is clear that an organisation should have the capacity to
recognise employees and the ability that may create value and deliver the competitive
advantage for the organisation. In addition, TM aims at emerging and deploying the right
employee at the right job on the right time and provide them with the right environment to
show off their talents in a best possible way for the organisation (Uren & Jackson, 2012).
Moreover, Cappelli (2008a), accentuated the role of internal opportunities concentrating
on development avenues for employees as the plans for TM in organisations.
For the purpose of this study, the researcher has seen TM as holistic and integrated
management practice of balancing the demand for critical skills with the supply of critical
80
skills in both the short-term and long-term. TM includes the proactive identification,
planning, attraction, development, retention and monitoring of both the supply and
demand of critical positions and key talent.
3.6 TALENT MANAGEMENT IN THE CONTEXT OF ADMINISTRATIVE STAFF IN
THE HIGHER EDUCATION SECTOR
According to Chemaiyo (2016), TM empowers organisations to achieve its goals and
satisfy the clients by providing quality products and services by qualified employees. In
addition, the implementation of appropriate TM initiatives in HE can lead to the
development of the human capital of the nation (Rao, 2017). The context of HE and
administrative staff in the HE is described below.
3.6.1 The higher education sector
Higher education institutions (HEIs) are finding it increasingly problematic to attract and
retain skilled, innovative and talented people in the global war for theoretical talent
(Mokgojwa et al., 2017). According to Takács-György and Takács (2017) TM is one of
the responsibilities of HE institutions. TM facilitates the attraction, development and
retention of the necessary skills and knowledge within an organisation through a sound
strategy, practices and involvements (Erasmus et al., 2017). In addition, attracting and
retaining quality is imperative to educational institutions because low retention might
create both financial and academic implications (Barkhuizen et al., 2014).
The top institutions are the organisations that focus on the future and foresee what skills,
attitudes, and behaviours they need from gifted employees (Berliandaldo & Hidayat,
2017). One of the main characteristics of a world-class university is not only the
availability of plentiful resources, but also the concentration of talent, including the
administrative staff and their skill (Jung & Shin, 2015). Furthermore, a study conducted
by Barkhuizen et al. (2014) found that TM practices remain problematical in government
institutions such as HE (Barkhuizen, 2013; Mokgojwa, Barkhuizen & Schutte, 2017; Mtila,
Barkhuizen & Mokgele, 2013).
81
TM is a main factor in the growth of an organisation’s success and a priority for business
and universities. TM in education is a procedure of expectation and implementation of the
main individuals required by the organisation in the future (Yasin, 2014).
An institution with talented personnel can develop a status for being a good place to work,
with great learning environment where quality in education is anticipated. The study
conducted by Rao (2017) argues that the higher education institutions in India are dealing
with the matters of talent crisis and retention of personnel. However, this is happening as
most of the institutions fail to realise the broad dimensions of TM, its proper application
and the value (Rao, 2017).
Any institution that offers HE is driven by quality employees which, becomes an
instrumental asset for that organisation. Furthermore, attracting and retaining quality
talent is very important to educational institution as a low talent retention rate might create
both financial and educational consequences (Barkhuizen et al., 2014). Without well
qualified and committed staff, no academic institution can ensure sustainability and
quality over the long term (Pienaar & Bester, 2008).
In addition, the implementation of appropriate TM initiatives in higher educational
institutions can lead to the improvement of the human capital of the institution. TM in an
institution helps to find the right talent, development of that particular talent and retaining
it in the institution for its achievement and progress (Rao, 2017). However, management
of HEIs should consider that “money spent on TM is an investment not expenses” (Rao,
2017). Furthermore, HEIs need to acknowledge and value talented individuals as a key
resource. The right people need to be selected and deployed in suitable positions. Then,
sound TM practices, especially talent development, rewards and performance
management, should be maintained through continuous management commitment
(Mokgojwa et al., 2017).
3.6.2 Administrative staff in the higher education sector
According to Ablanedo-Ross, Blevins, Gao, Teng & White (2011), Hurlimann et al. (2013),
and Pick, Teo and Yeung (2012) research on administrative staff in HE settings is still
limited, although recognition of the importance of this occupational group is growing
(Sebalj, Holbrook & Bourke, 2012). Despite that, administrative staff face significant
82
problems in HE institutions in terms of career development opportunities, management
support, poor management systems, impractical deadlines, lack of participation in
decision-making, and poor reimbursement (Barkhuizen et al., 2014). However, Smerek
and Peterson (2007) regard administrative staff as the key constituent in higher education
institutions, because they are responsible to take care of the day-to-day operations of the
institution. Therefore, it is almost impossible to attain a department’s goals for the
intellectual and personal development of administrative employees without their
assistance (Rothmann & Essenko, 2007).
Administrative staff is defined as staff that is not involved in academic-scientific work
(Brandenburg, 2016). In addition, administrative staff is the employees in the core area
of management in the university (Omonjo, Oludayo, Eche, Uche & Ohunakin, 2015).
Awino (2016) states that administrative staff are the employees who support academic
staff, and deal with learners on non-academic work in the administrative function such as
finance, human resource and marketing. In particular, their approach and behaviour have
an important influence on students and client satisfaction and perceptions of the quality
of service that the university offers to students and external stakeholders (Burke,
Koyuncu, Fiksenbaum & Yasemin, 2013). Therefore, administrative staff plays a main
role in the formation and enhancement of knowledge and modernisation in HE institutions
(Rothmann & Essenko, 2007).
3.6.2.1 Skills required by administrative staff in higher education
According to Van Antwerpen and Ferreira (2016), the skills related to the jobs of
administrative employees include, but are not limited to typing, computer literacy,
numeracy, communication, planning and time management skills. It is essential for
administrative staff to acquire these job skills. Since the administrative staff in HEs play
a key role in presenting an institution’s client services and competence (Barkhuizen,
Schutte & Smit, 2015). Most policies and analyses ignore administrative staff as a
crucially pertinent component (Brandenburg, 2016). Hurlimann et al. (2013) alluded to the
fact that there is often a complete neglect for administrative staff’s work in HE. Likewise,
the study conducted by Barkhuizen et al. (2014) of administrative staff in HE found that
all the TM practices are poorly applied and large gaps exist between the present
applications versus the perceived significance of between talent review process, retention
practices, talent development and commitment management.
83
Adam (2015) supports the view that secretaries are undoubtedly the best office
management and administration experts in organisations all over the globe Administrative
staff, being an indispensable group of employees, are thus the backbone of any
organisation, including HEIs (Destiny, 2016). Administrative staff are a crucial part of the
organisational structure in universities. Without these employees, universities cannot
achieve their great mission of serving the community through their teaching services,
research and ongoing education (Al Shobaki et al., 2018). Therefore, since technology is
about improving work efficacy within work environments, it means administrative officers
and secretaries have to be active in their profession, and well-informed with the
technological world as soon as any new development is introduced.
However, the fourth industrial revolution offers great opportunities for innovation well
beyond services that may need a new set of approaches in areas such as talent, cyber
risk and competitive disruption (Insights, 2018). Fourth industrial revolution means the
ability to adopt and integrate digital and physical technologies to improve operations,
become more productive, grow and innovate (Insights, 2018). Administrative staff should
adopt the fourth industrial revolution by using the digital technology to respond to
transformation and motivation activities that will assist with both cognitive and non-
cognitive skills required to support human work.
Administrative staff in HE institutions play a significant role in generating a high-quality
customer service and representing the institution’s competency (Barkhuizen et al., 2014).
In particular, their attitudes and behaviours can have a significant influence on students
and client's happiness and views of the quality service (Burke et al., 2013). For example,
assessment of communication skills training need for administrators that links together
their previous and future performance, and guide decisions during improvement effort
(Destiny, 2016). Solomon (2007) gave credence to the significance of communication
skills that they are the skills of reading, speaking, writing and listening which are office
communication skills. Based on the above, customer service and communication skills
training should be offered to administrative staff at HSU.
Many institutions generally expect administrative staff to familiarise themselves with the
changing institutional needs and deliver the required levels of service, with or without the
appropriate training. Training is not only about achieving suitable knowledge and skills,
but also about building team spirit and collective commitment. Therefore, administrative
84
staff will be jointly committed in their work. In addition, when training aligns with policy, it
offers administrative staff not only required skills but also builds their ability and
commitment to making an active contribution to the development and delivery of excellent
services (Hunter, 2018).
Baltaru and Soysal (2018) cite Blümel et al. (2010), who suggest that the increase in
administrative staff reflects a rise in the number of professional and highly qualified
administrative staff, and that this growth is at the cost of technical and administrative staff
with lower levels of qualifications. An increasing literature such as Pienaar and Bester
(2008) and Green (2014) consider how administrative growth leads to changes in
academic identities and drives professionalism and managerialism into the HE sphere.
However, there is little empirical study of the causes of change in the academic and
administrative alignment of university staff. The differences in the number of
administrators across HEIs can be accounted for by their enactment of formal
organisation as a model of institutional identity and purpose (Baltaru & Soysal, 2018).
Hunter (2018) found that there is a general agreement that the present level of
administrative ability is lacking to deliver high quality services and that there is room for
development and improvement everywhere. Most institutions in the current economy
cannot afford to lose senior administrative officers, or prospective high-level
administrators, without suitable replacement given the great costs related to hiring an
applicant from outside the organisation (Rao, 2017).
Against this background, the TM of administrative staff and the impact thereof on their
work and customer service in HE is imperative from a research point of view. The section
that follows provides a discussion of the effects of demographic variables on TM.
3.6.3 Current competency frameworks for higher education administrative staff
The terms “competency” and “competencies” focus on the personal attributes or inputs of
an individual and is defined as "the behaviours and technical attributes that the individuals
must have, or must acquire, to perform effectively at work (Chartered Institute of
Personnel and Development (CIPD), 2016). However, a competency framework is
understood to be the structure that describes each individual competency required by
individuals employed in an organisation (CIPD, 2016).
85
Administrative staff play a critical role in planning, budgeting and international networking,
as well as supporting conservative teaching and research work in the university.
Universities have developed numerous training programmes to improve administrative
staff members’ job competency (Jung & Shin, 2015). Besides that, administrative staff
need to demonstrate professional competency, such as being able to define missions,
objectives and strategies, and be able to manage financial and human resources (Meek,
Goedegebuure, Santiago & Carvalho, 2010). Vathanophas (2007) have established five
main competencies for university administrative staff as follows:
• Organisational understanding
Understanding the affiliated institution is a main component for high-quality job
performance, because organisational changes often demand new knowledge, skills, and
behaviours from employees (Jung & Shin 2015; Cummings & Worley, 2001). Employees
should know the university’s history, present mission and the vision.
• Problem-solving
Problem-solving for administrative staff members involves flexibility coping with changes
and looking for reasonable solutions, such as effectively utilising time and resources, and
determining priorities when facing the problems (Jung & Shin, 2015). Therefore, the
responsibility of the administrative staff is that they should be able to adapt quick, manage
transformation and prioritise work by using the technology such as emails and electronic
diary management faster than before. Administrative staff need to plan, coordinate,
control and implement the activities as well as to manage their office records.
• Interpersonal communication
It involves one’s relationship with others at work including co-workers and senior workers.
Whitchurch and Gordon (2010) describe the importance of interpersonal communication
as a skill because more professional staff are involved in management at the
departmental level, and are likely to experience greater concern about managing people
than managing the departmental budget. The knowledge, skill and problem-solving of
administrative staff are important factors in promoting university’s competitiveness and
effectiveness.
86
• Global competency
It refers to foreign language skills and tasks regarding international departmental
employees and students. The most obvious element of change in HE during recent
decades is the increased internationalisation, in particular the increase in the number of
enrolled foreign students (Rebora & Turri, 2010). However, Volkwein and Zhou (2003)
argued, that the knowledge, skills, and problem-solving ability of staff are significant
factors in promoting the university’s competitiveness and effectiveness.
3.7 EFFECTS OF DEMOGRAPHIC VARIABLES OF ADMINISTRATIVE STAFF ON
TALENT MANAGEMENT
3.7.1 Age
The younger administrative staff expressed more confidence and experience in the
spheres of multimedia usage and manipulation, network and other presentation software,
using mobile devices, using the internet, word processing and email (Erasmus et al.,
2017). On the other hand, compared to younger people, elder employees require more
support in terms of training in the areas of recent management techniques, project
management and in-depth knowledge of the newest information technology field (Soja &
Soja, 2016). However, the younger, more highly educated and less trained employees
are likely to leave their counterparts (Manlove & Guzell, 1997).
3.7.2 Gender
The TM process might also consider numerous forms of diversity, such as gender that
globally mobile professionals possess. With respect to gender, for example, there is
unequal representation of females in science, technology and engineering occupations
across the world (Servon & Visser, 2011). However, at the intersection of the
organisational and individual's levels, barriers to females accessing leadership positions
relate to lack of mentors, challenges in male-dominated environments (for example cargo
movement) and more family responsibilities than male (Al Ariss et al., 2014). The
research conducted by Van Antwerpen and Ferreira (2010) shows that the males have
been under-represented for many years in the administrative staff environment and this
is still the case currently. in this regard, the observation is that the administrative work is
87
dominated by females and younger generation. However, it does not mean that female
administrative staff are more competent or talented than male staff (Amias & Segumpan,
2018).
3.7.3 Job title
According to Hunter (2018), administrative staff positions range from junior to senior level.
The job title of administrative staff at HSU start from assistant admin to principal
administrator.
3.7.4 Qualification
The study conducted by Amias and Segumpan (2018), show that administrative staff with
higher qualification are more competent in doing their jobs. Therefore, the nature of
administrative work inspires innovation and creativity and better performance (Ahmed et
al., 2018). The administrative staff's qualification starts from diploma upwards.
3.7.5 Job level
As mentioned above by Hunter (2018) in terms of job title in HE, the exclusive approach
to TM excludes individuals who are in lower levels in organisations such as technical and
operational workers who did not have the chance to accumulate cultural, human and other
forms of capital that provide sufficient personal characteristics (Al Ariss et al., 2014).
Therefore, administrative staff on lower levels are the operational employees and they
should be included on TM.
3.7.6 Work experience
The performance of administrative staff is correlated with gender, age, scientific
qualification and place of work. The main indicators that indicate the competence of an
administrative staff member is qualification, abilities, experience and compatibility with
the job and functions of the organisation (Al Shobaki et al., 2018).
The study conducted by Hafez et al. (2017) indicate that there is no previous research
that inspects the link between TM and the organisational demographic information such
88
as age, gender, education level and experience with the organisation. The following
section looks at the conceptual framework on the link between TNA and TM.
3.8 CONCEPTUAL FRAMEWORK ON THE LINK BETWEEN TNA AND TM
According to Alsakarneh and Hong (2015), TM and HRM are linked with each other in
theory, however, differ in the analysis as the following:
• TM includes all HRM activities and therefore it can be said that TM reflect a new
term through which the HRM can be renamed. The new name of HRM focused on
managing talent strategically (Iles et al., 2010).
• TM strategies includes many HRM plans (jobs) with a special focus on how to
manage talents and the talented employees. According to this view, TM is an
important point of internal and external environment of the organisation (Cappelli,
2008a).
• TM emphases on the growth efficiency through the management of sustainability,
reserving and development of new talents who are already existed within the
organisation (Cappelli, 2008a).
From the above discussion, it is clear that TM is very important to manage the talents of
the employees and increase their competency through retaining and development of new
talents. The talents of administrative staff in a HSU should be managed and retained
based on the TM strategy. Nilsson and Ellstrom (2012) add that TM is closely related to
old-style definitions of HRM/HRD. Therefore, TM is linked with activities that include
joining new knowledge and doing things more quickly and efficiently (Chuai, Chuai,
Preece & Iles, 2008).
TM is associated with a move from HR activities to all levels in the organisation regarding
recruiting, retaining and developing talent. In addition, it is important to identify the specific
needs in an organisation by constructing needs assessments, conducting detailed job
and talent gap analyses as foundations for training and development (Nilsson & Ellstrom,
2012). The suitable needs of administrative staff should be identified in an organisational
level by conducting the needs analysis and skills audit to close the talent gap with training.
However, talent maybe associated with inherited predispositions, or talent may be
89
acquired and developed through learning and educational activities (Nilsson & Ellstrom,
2012).
According to Nilsson and Ellstrom (2012), identifying, developing, and training high-
performing, competent, employable, and talented employees are complex processes, in
which the HRD practices in an organisation are central. Therefore, training and
developing talent includes career management practices in which individual and
organisational needs are strategically aligned, including defining performance targets,
supporting learning initiatives, and ensuring feedback from line management (Kock &
Ellström, 2011). It is critical that the HSU should identify, align and develop the talents of
administrative staff with the organisation needs through training.
Organisations’ future plans depend upon an efficient and effective human resource
strategy. Therefore, HRM should harmonise between its effective plan and the
organisation’s strategy and it should provide truly talented employees who are able to
meet and achieve current and future goals of the organisation (Alsakarneh & Hong, 2015).
Despite the development, training, rehabilitation, and evaluation programmes adopted by
organisations, most talented employees remain unidentified within the organisation.
Therefore, organisations need to implement effective plans of evaluation that may lead to
the identification of TM opportunities as the main ingredient to attain the organisational
mission (Williamson, 2011).
The primary aim of learning activities is to help the employees of an organisation to master
the knowledge, skills, abilities, and attitudes that are required by the organisation
(Mahapatro, 2010). Therefore, TM is conducted by firstly determining the organisation’s
needs of talent, secondly by finding a source of talent spread to manage the talent, thirdly
by developing employees and their collective talents, and lastly by confirming that
talented staff keep up with the step of TMS that is integrated in the HRM process and the
goals of the organisation (Yasin, 2014).
However, Alruwaili (2018) found that training is the key instrument to polish and direct
talents for the advantage of achieving the organisational objectives. Despite that, the
increasing awareness of the organisation on the existence and shortage of talent, may
trigger a recognition of the importance of talent to the growth of organisation. However,
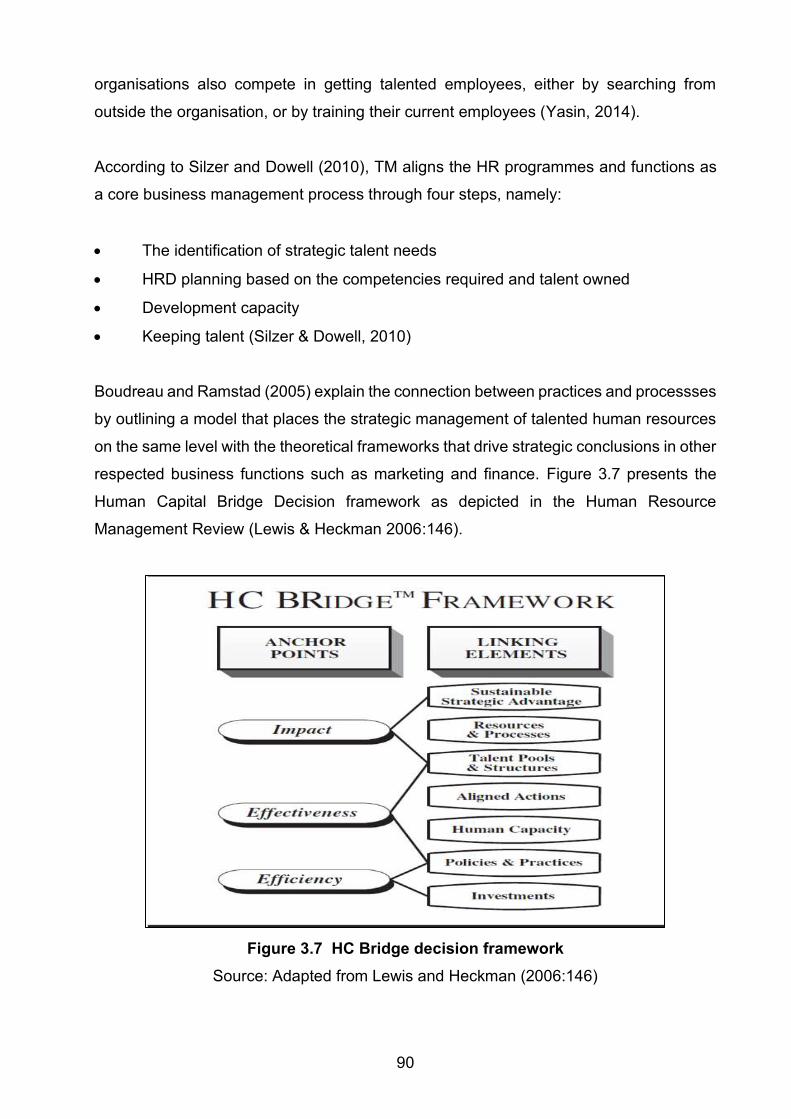
90
organisations also compete in getting talented employees, either by searching from
outside the organisation, or by training their current employees (Yasin, 2014).
According to Silzer and Dowell (2010), TM aligns the HR programmes and functions as
a core business management process through four steps, namely:
• The identification of strategic talent needs
• HRD planning based on the competencies required and talent owned
• Development capacity
• Keeping talent (Silzer & Dowell, 2010)
Boudreau and Ramstad (2005) explain the connection between practices and processses
by outlining a model that places the strategic management of talented human resources
on the same level with the theoretical frameworks that drive strategic conclusions in other
respected business functions such as marketing and finance. Figure 3.7 presents the
Human Capital Bridge Decision framework as depicted in the Human Resource
Management Review (Lewis & Heckman 2006:146).
Figure 3.7 HC Bridge decision framework
Source: Adapted from Lewis and Heckman (2006:146)
91
The HC Bridge decision framework summaries decisions at three independent levels of
analysis (impact, effectiveness and efficiency) and the organisational tools, practices and
resources that affect the verdicts (Boudreau & Ramstad, 2005).
Analysis of the link reflects the differences between capabilities of individual employees
with the needs of the current and future positions. To achieve the plan of the organisation
through TM, employee development programmes should be designed at all levels of the
organisation that meet the needs of the individual and organisation (Yasin, 2014).
Employee development plans of administrative staff should be designed at all levels of
the university and should be mapped with the choices of training that is suitable for their
competencies. The talented employees (administrative staff) should have the training and
development to create the feeling of loyalty to HSU and also feel that leaders of the
organisation give them the adequate care.
Impact refers to the strategic impact of changing a talented group of employees by
providing forty hours of quality training for everyone. Boudreau and Ramstad (2005),
argue that identifying pivotal talent pools, those jobs with small increments in
enhancement in quality or quantity, yield to large returns on measures of strategic interest
and is critical to impact. However, efficiency refers to the degree to which interventions
affect behaviours of the targeted talent pool. Therefore, efficiency means critical skills are
attracted within equitable costs and effective HR solutions, and HR expedites decision
making about talent pools through quantifiable measures (Magau & Roodt, 2010). In this
regard, efficiency focuses on the resources used to bring HR practices into compliance
(Boudreau & Ramstad, 2005).
Training and development interventions address the capacity of the talent or the aligned
actions of the talent. Effectiveness measures are the shared measures in HR. Therefore,
a decision to invest a strategy for talent planning and management is essential in a given
intervention because it is in effect and independent of impact (Boudreau & Ramstad,
2005). As a result, considering efficiency without regard for impact can lead to poor talent
decisions. For example, training programmes that distinctly develop performance of a
superior talent pool, rather than a critical talent pool, will have a slight impact if the
improved performance does not improve the accomplishment of the strategy (Boudreau
& Ramstad, 2005).
92
Boudreau and Ramstad (2005) note that an efficiency focus, lacking a focus on
effectiveness and impact, results in low cost performance, standardised and centralised
HR practices. Decisions are usually made in HR based on efficiency measures, such as
the number of peoples trained per session, cost per hire, and ratio of HR staff to total
employees. Therefore, the linking elements describe the specific strategic components
that support the anchor points. For example, impact needs defining sustainable strategic
achievement, and making the definition specific by understanding the developments,
deployed or where improved process quality, speed would most contribute to the
sustainable strategic success (Boudreau & Ramstad, 2004).
By linking all views of TM, a TM process that includes identifying the high potential and
high performer employees, developing talent pool, providing development practices, and
developing retention practices is proposed (Tetik, 2016). The success of TM on
administrative staff will depend on the availability of training and development. However,
TM begins with the business strategy and carries on with the goal to develop and maintain
a "nursery" of talent, which would require employees' professional qualities, loyalty and
active involvement (Campeanu-Sonea, Sonea, Gabor-Supuran & Muresan, 2011). There
are many strategies for the management of talented people such as encouraging talented
people to share ideas, knowledge and skills with each other. Or to provide coaching and
training programmes for talented people, to make sure that everyone in the organisation
feels valued at work (Salacuse, 2006).
The talent development process starts by identifying the individuals’ potential and
performance (Ross, 2013). Once the development of talent forms part of the plan of the
organisations, key people are developed for the key positions which ensures to gain
competitive advantage (Collings & Mellahi, 2009). Therefore, the strategic development
of talent is nurtured by planned and unplanned development facilities in organisational
setting like learning activities (Tetik, 2016). The need for talent with competencies
(general and specific) is undeniable, as the most important skills, knowledge and
behaviours are necessary to execute the organisation strategy (Vladescu, 2012). There
is a need for TM of the administrative staff to improve their competencies, therefore
training should be planned properly to achieve the organisational competitive advantage.
In addition, learning and performance improvement are the important parts of TM.
Therefore, talent development provides an organisation with skilled, motivated and
competent employees (Tetik, 2016). According to Vladescu (2012), each organisation
93
from the public sector should understand that only by using TM solutions, will they
develop and engage their employees and a real appropriate plan for the management
and talent needs of the next generation.
Furthermore, it is necessary to plan the development of HR staff based on the
competence and talent possessed, the development of strategy aligned with the HR
expertise, and the development of future-oriented HRD system (Berliandaldo & Hidayat,
2017). This HRD process also needs to be integrated with the individual performance
plan (IPP) and aligned in the preparation of TNA. In addition, the HRD process needs to
be evaluated quarterly (every three months) to be known related to the development of
each individual. With the continued development of talent, the organisation has the
availability of talents is good to be able to carry out the work well (Berliandaldo & Hidayat,
2017). IPP of administrative staff should be aligned with their training need and the HRD
process should be evaluated every three months.
Consequently, both TNA and TM are incorporated with the employment plan of the
organisation. Despite that, both TNA and TM are focussed on achieving the goals of the
organisation, identifying the training that needs to be provided to the individual talented
employees based on their jobs (Altarawneh & Aseery, 2016; Alruwaili, 2018; Balisi,
2014; Nwoke et al., 2016). A planned TNA and TM linked with the goals of the
organisation, will address the identified talent gaps of administrative staff by providing
training as is the only solution.
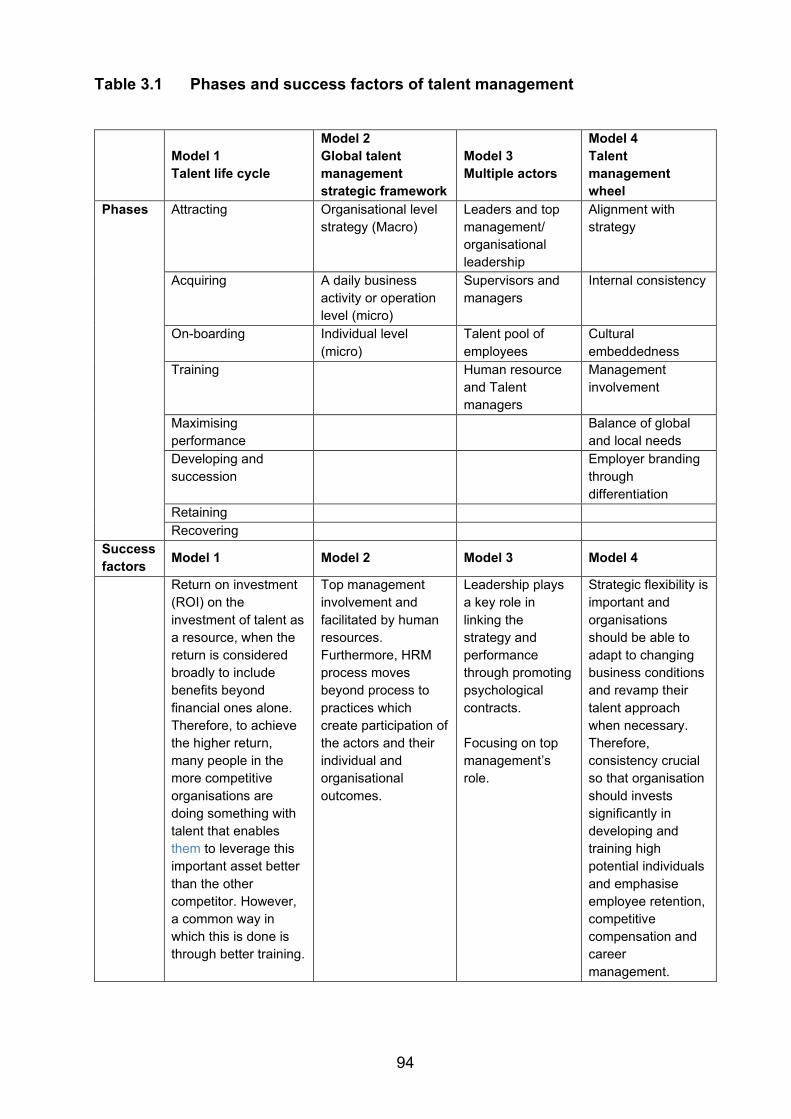
94
Table 3.1 Phases and success factors of talent management
Model 1
Talent life cycle
Model 2
Global talent
management
strategic framework
Model 3
Multiple actors
Model 4
Talent
management
wheel
Phases Attracting Organisational level
strategy (Macro)
Leaders and top
management/
organisational
leadership
Alignment with
strategy
Acquiring A daily business
activity or operation
level (micro)
Supervisors and
managers
Internal consistency
On-boarding Individual level
(micro)
Talent pool of
employees
Cultural
embeddedness
Training Human resource
and Talent
managers
Management
involvement
Maximising
performance
Balance of global
and local needs
Developing and
succession
Employer branding
through
differentiation
Retaining
Recovering
Success
factors Model 1 Model 2 Model 3 Model 4
Return on investment
(ROI) on the
investment of talent as
a resource, when the
return is considered
broadly to include
benefits beyond
financial ones alone.
Therefore, to achieve
the higher return,
many people in the
more competitive
organisations are
doing something with
talent that enables
them to leverage this
important asset better
than the other
competitor. However,
a common way in
which this is done is
through better training.
Top management
involvement and
facilitated by human
resources.
Furthermore, HRM
process moves
beyond process to
practices which
create participation of
the actors and their
individual and
organisational
outcomes.
Leadership plays
a key role in
linking the
strategy and
performance
through promoting
psychological
contracts.
Focusing on top
management’s
role.
Strategic flexibility is
important and
organisations
should be able to
adapt to changing
business conditions
and revamp their
talent approach
when necessary.
Therefore,
consistency crucial
so that organisation
should invests
significantly in
developing and
training high
potential individuals
and emphasise
employee retention,
competitive
compensation and
career
management.
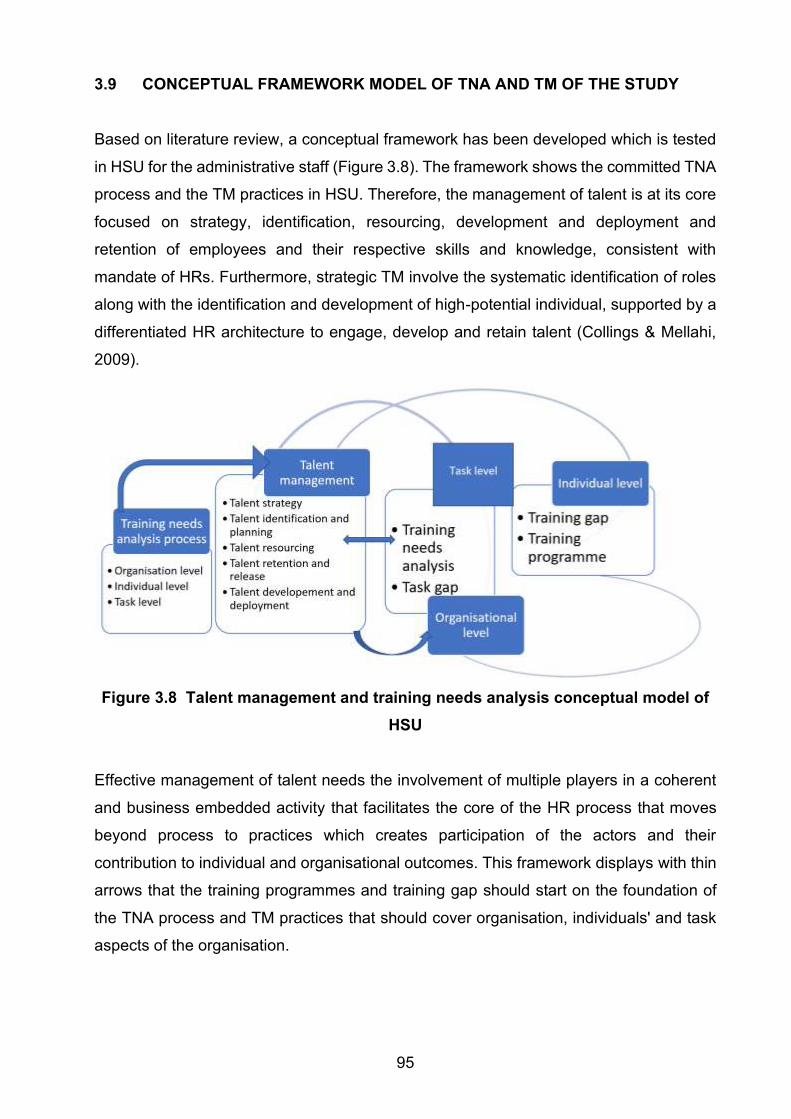
95
3.9 CONCEPTUAL FRAMEWORK MODEL OF TNA AND TM OF THE STUDY
Based on literature review, a conceptual framework has been developed which is tested
in HSU for the administrative staff (Figure 3.8). The framework shows the committed TNA
process and the TM practices in HSU. Therefore, the management of talent is at its core
focused on strategy, identification, resourcing, development and deployment and
retention of employees and their respective skills and knowledge, consistent with
mandate of HRs. Furthermore, strategic TM involve the systematic identification of roles
along with the identification and development of high-potential individual, supported by a
differentiated HR architecture to engage, develop and retain talent (Collings & Mellahi,
2009).
Figure 3.8 Talent management and training needs analysis conceptual model of
HSU
Effective management of talent needs the involvement of multiple players in a coherent
and business embedded activity that facilitates the core of the HR process that moves
beyond process to practices which creates participation of the actors and their
contribution to individual and organisational outcomes. This framework displays with thin
arrows that the training programmes and training gap should start on the foundation of
the TNA process and TM practices that should cover organisation, individuals' and task
aspects of the organisation.
96
On the other hand, the thin arrows of the conceptual HSU model illustrate the expected
weaker relationships between the management of talent and TNA on the individual and
task level. The thick blue arrow shows the expected relationship between the TNA
process and the TM practices. It therefore demonstrates the expected positive
relationship between the perception of administrative staff of the TNA process and TM
practices. Furthermore, it shows that it is expected that there will be a relationship
between the TNA process and TM practices on organisational level concerning the
management of talent based on the TNA and task gap.
3.10 CHAPTER SUMMARY
This chapter presented a range of relevant literature on conceptualisation and definition
of talent and TM, different approaches to TM, the purpose and significance of TM and the
TM process. The chapter also provided the models and a brief introduction to the TM in
the context of administrative staff in the higher education sector as regards its current
specific challenges facing the HSU. The effects of demographic variables on TM, the
conceptual framework on the link of the TNA process and TM practices were, the phases
and success factors of the TM and the conceptual framework model of the TNA and TM
of the study were discussed. The next chapter will focus on the actual overview of the
research process followed in this study.
97
CHAPTER 4
RESEARCH METHODOLOGY AND DESIGN
4.1 INTRODUCTION
This chapter summarises the research methodology that was used to explore the
relationship between the TNA process and TM practice. The methodology selected in this
chapter comprises to: the research philosophy, research design, research approach, the
composition of the research respondents, measuring tools, research procedure and
statistical analysis.
4.2 RESEARCH PHILOSOPHY
Guided by nature of the phenomenon under investigation and the obligation to remain
objective, the current study adheres to a positivistic worldview philosophy. According to
Babbie (2016) positivism describes scientific approach, believing that scientific truths
could be positively verified through empirical observations and the logical analysis of what
is observed. Consequently, in line with positivism, a deductive approach to reasoning
based on the theory was applied. This theoretic logic was useful in describing the
research problem. It also proved useful in constructing a explanation for the nature of the
link between the variables (Babbie, 2010). This deductive positivism was subsequently
quantitatively oriented, making it possible to improve objective and precise indicators as
well as measures. Such indicators and measures frequently utilise quantities to capture
significant aspects of the variables under study (Babbie, 2010).
The assumptions of philosophical, ontological, meta-theoretical and epistemological was
discussed in Chapter one. Drawing from positivism, the study includes descriptive
research, consequently, gaining the potential to measure the impact, effectiveness and
efficiency of the TNA process and TM practices on the administrative staff. Leedy and
Ormrod (2013) provide a detailed explanation on the above, as they assert that the most
effective way to avoid any prejudices and remain objective is for the researcher to opt for
an efficient strategy to measure the phenomenon they are investigating. In this research,
the nature of reality is the respondents’ awareness and understanding regarding the TNA
98
process, TM practice and the required skills of administrative staff. It is expected that the
respondents should give honest answers to research - related questions and freely share
their experiences. The reseacher assumed that the data would be recorded accurately,
and that rational conclusions would be drawn from the available information.
4.3 RESEARCH DESIGN
Research design gives framework to the study to address a particular research problem
or opportunity (Ligthelm, Martins & Van Wyk, 2005). Research design is a significant part
of any scientific study (Spector, 2012). The main concepts on research design were
presented in chapter1 and the researcher employed of exploratory, descriptive,
correlation and Mann-Whitney test. Therefore, the cross-sectional approach adopted
followed an on-line survey for data collection with the intent of generalising from sample
to a population (Creswell, 2014). This methodological choice allowed the researcher to
report on what was happening and why (Cherry, 2018). Theoretical deduction is used to
describe and clarify possible links between the variables − TNA, talent and TM in HSU of
administrative staff (Babbie, 2010).
4.4 RESEARCH APPROACH
The outcomes of the study are deemed beneficial due to the relationship established.
Moreover, the level of significance between the variables is expected to work as a
beneficial source of insight to human resource advisors in identifying training needs, talent
and talent management. This information will help in defining and exploring the best
human resource approaches for enhancing job linked results like training needs, talent
and talent management in the administrative staff at a HSU.
4.5 RESEARCH METHOD
By taking the positivist stand, the researcher selected a research methodology suitable
for achieving the study's objectives. This methodology outlined the procedure for
delineating the research strategy into particular methods and the techniques that were
applied to collect and analyse data (Maylor & Blackmon, 2005).
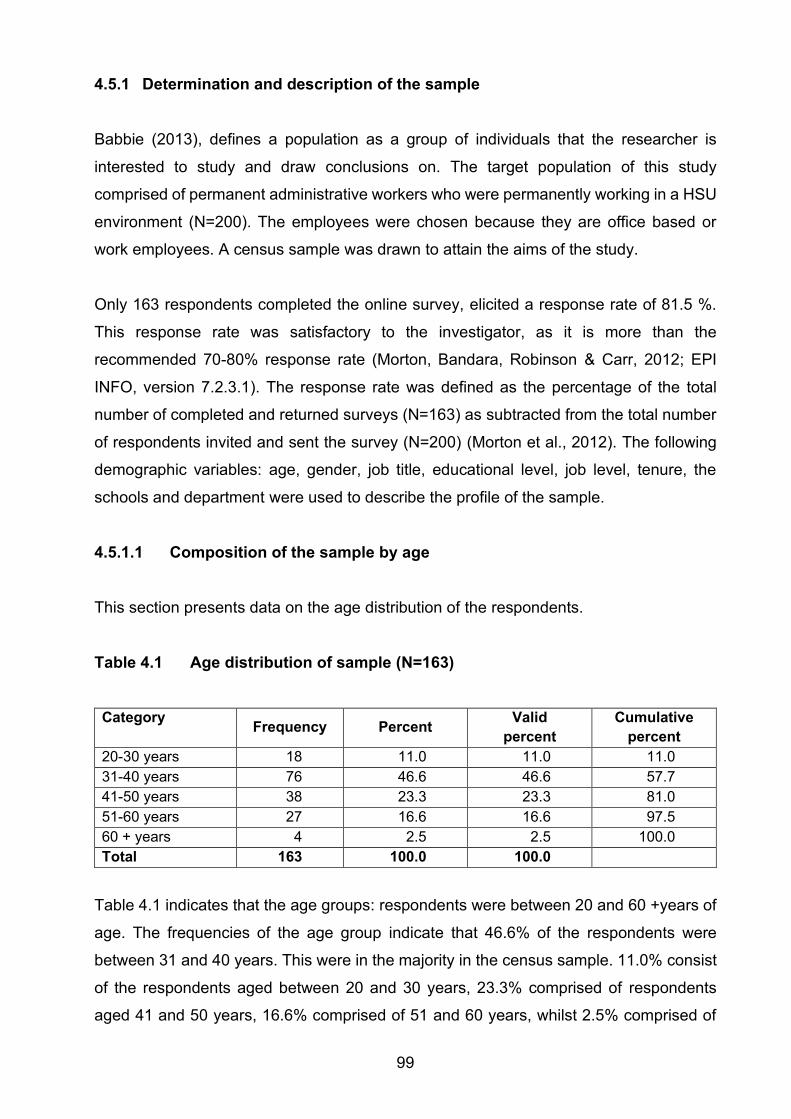
99
4.5.1 Determination and description of the sample
Babbie (2013), defines a population as a group of individuals that the researcher is
interested to study and draw conclusions on. The target population of this study
comprised of permanent administrative workers who were permanently working in a HSU
environment (N=200). The employees were chosen because they are office based or
work employees. A census sample was drawn to attain the aims of the study.
Only 163 respondents completed the online survey, elicited a response rate of 81.5 %.
This response rate was satisfactory to the investigator, as it is more than the
recommended 70-80% response rate (Morton, Bandara, Robinson & Carr, 2012; EPI
INFO, version 7.2.3.1). The response rate was defined as the percentage of the total
number of completed and returned surveys (N=163) as subtracted from the total number
of respondents invited and sent the survey (N=200) (Morton et al., 2012). The following
demographic variables: age, gender, job title, educational level, job level, tenure, the
schools and department were used to describe the profile of the sample.
4.5.1.1 Composition of the sample by age
This section presents data on the age distribution of the respondents.
Table 4.1 Age distribution of sample (N=163)
Category Frequency Percent
Valid
percent
Cumulative
percent
20-30 years 18 11.0 11.0 11.0
31-40 years 76 46.6 46.6 57.7
41-50 years 38 23.3 23.3 81.0
51-60 years 27 16.6 16.6 97.5
60 + years 4 2.5 2.5 100.0
Total 163 100.0 100.0
Table 4.1 indicates that the age groups: respondents were between 20 and 60 +years of
age. The frequencies of the age group indicate that 46.6% of the respondents were
between 31 and 40 years. This were in the majority in the census sample. 11.0% consist
of the respondents aged between 20 and 30 years, 23.3% comprised of respondents
aged 41 and 50 years, 16.6% comprised of 51 and 60 years, whilst 2.5% comprised of
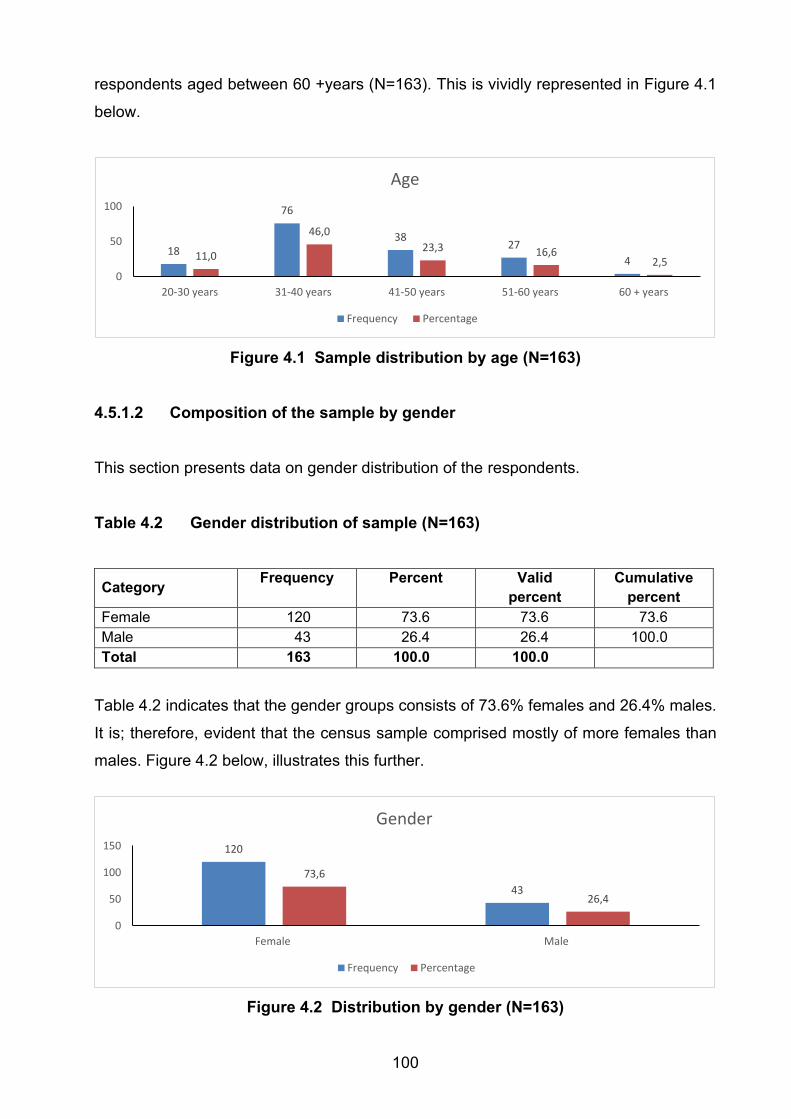
100
respondents aged between 60 +years (N=163). This is vividly represented in Figure 4.1
below.
Figure 4.1 Sample distribution by age (N=163)
4.5.1.2 Composition of the sample by gender
This section presents data on gender distribution of the respondents.
Table 4.2 Gender distribution of sample (N=163)
Category Frequency Percent Valid
percent
Cumulative
percent
Female 120 73.6 73.6 73.6
Male 43 26.4 26.4 100.0
Total 163 100.0 100.0
Table 4.2 indicates that the gender groups consists of 73.6% females and 26.4% males.
It is; therefore, evident that the census sample comprised mostly of more females than
males. Figure 4.2 below, illustrates this further.
Figure 4.2 Distribution by gender (N=163)
18
76
3827
411,0
46,0
23,3 16,62,5
0
50
100
20-30 years 31-40 years 41-50 years 51-60 years 60 + years
Age
Frequency Percentage
120
43
73,6
26,4
0
50
100
150
Female Male
Gender
Frequency Percentage
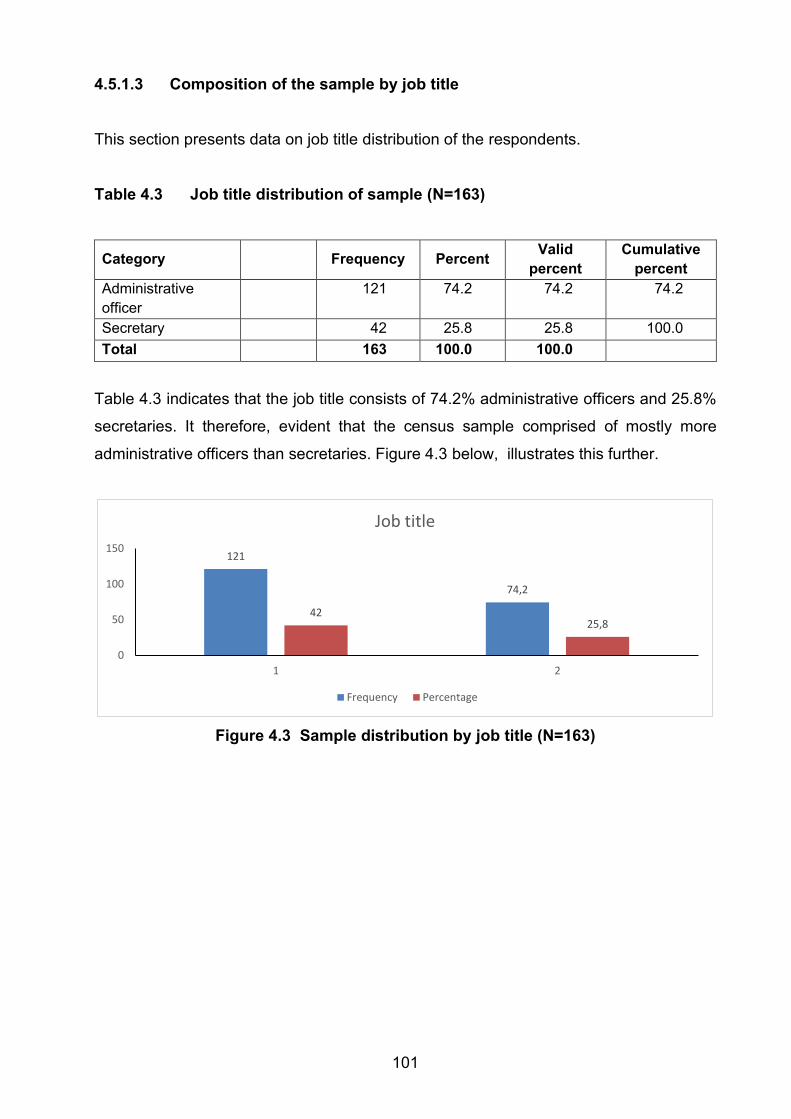
101
4.5.1.3 Composition of the sample by job title
This section presents data on job title distribution of the respondents.
Table 4.3 Job title distribution of sample (N=163)
Category
Frequency Percent Valid
percent
Cumulative
percent
Administrative
officer
121 74.2 74.2 74.2
Secretary 42 25.8 25.8 100.0
Total 163 100.0 100.0
Table 4.3 indicates that the job title consists of 74.2% administrative officers and 25.8%
secretaries. It therefore, evident that the census sample comprised of mostly more
administrative officers than secretaries. Figure 4.3 below, illustrates this further.
Figure 4.3 Sample distribution by job title (N=163)
121
74,2
4225,8
0
50
100
150
1 2
Job title
Frequency Percentage
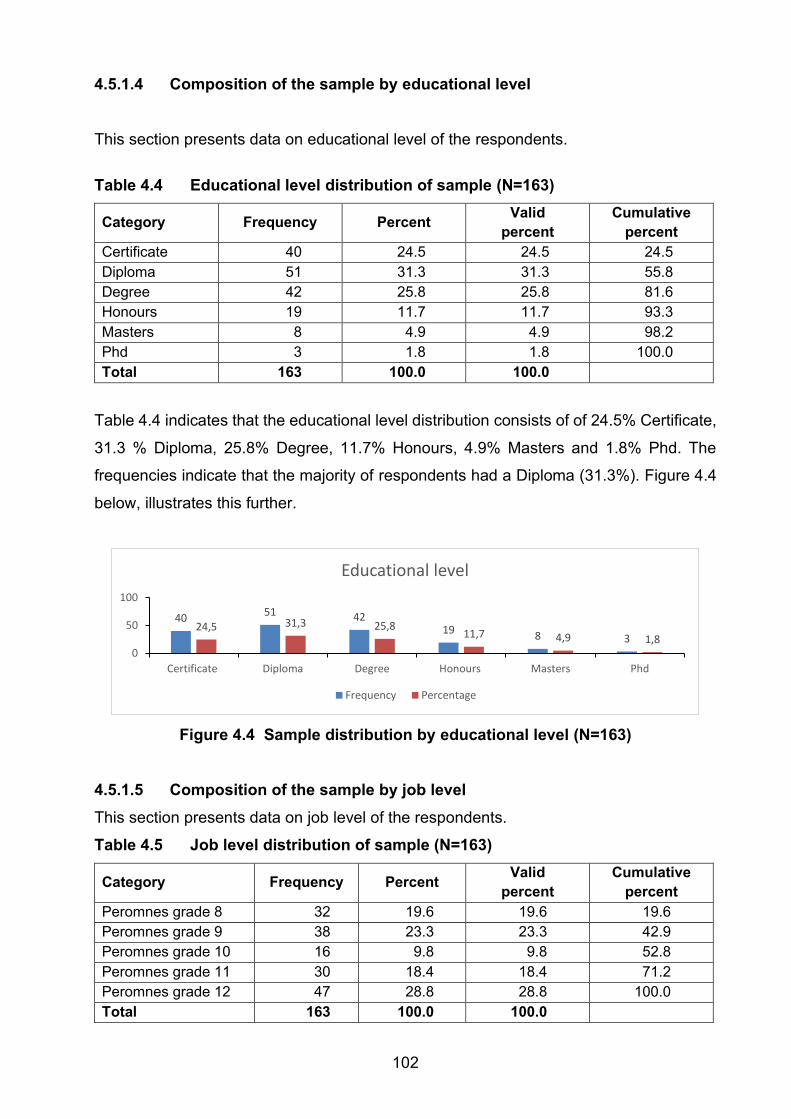
102
4.5.1.4 Composition of the sample by educational level
This section presents data on educational level of the respondents.
Table 4.4 Educational level distribution of sample (N=163)
Category Frequency Percent Valid
percent
Cumulative
percent
Certificate 40 24.5 24.5 24.5
Diploma 51 31.3 31.3 55.8
Degree 42 25.8 25.8 81.6
Honours 19 11.7 11.7 93.3
Masters 8 4.9 4.9 98.2
Phd 3 1.8 1.8 100.0
Total 163 100.0 100.0
Table 4.4 indicates that the educational level distribution consists of of 24.5% Certificate,
31.3 % Diploma, 25.8% Degree, 11.7% Honours, 4.9% Masters and 1.8% Phd. The
frequencies indicate that the majority of respondents had a Diploma (31.3%). Figure 4.4
below, illustrates this further.
Figure 4.4 Sample distribution by educational level (N=163)
4.5.1.5 Composition of the sample by job level
This section presents data on job level of the respondents.
Table 4.5 Job level distribution of sample (N=163)
Category Frequency Percent Valid
percent
Cumulative
percent
Peromnes grade 8 32 19.6 19.6 19.6
Peromnes grade 9 38 23.3 23.3 42.9
Peromnes grade 10 16 9.8 9.8 52.8
Peromnes grade 11 30 18.4 18.4 71.2
Peromnes grade 12 47 28.8 28.8 100.0
Total 163 100.0 100.0
4051 42
198 3
24,5 31,3 25,811,7 4,9 1,8
0
50
100
Certificate Diploma Degree Honours Masters Phd
Educational level
Frequency Percentage
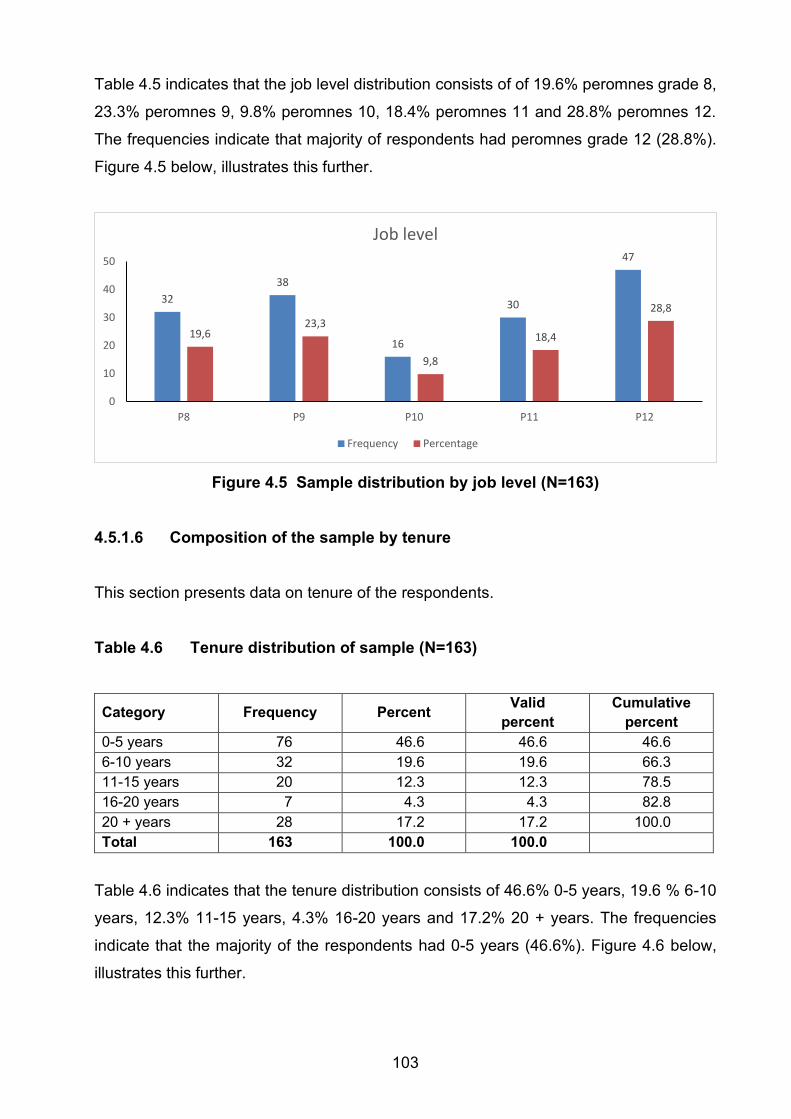
103
Table 4.5 indicates that the job level distribution consists of of 19.6% peromnes grade 8,
23.3% peromnes 9, 9.8% peromnes 10, 18.4% peromnes 11 and 28.8% peromnes 12.
The frequencies indicate that majority of respondents had peromnes grade 12 (28.8%).
Figure 4.5 below, illustrates this further.
Figure 4.5 Sample distribution by job level (N=163)
4.5.1.6 Composition of the sample by tenure
This section presents data on tenure of the respondents.
Table 4.6 Tenure distribution of sample (N=163)
Category Frequency Percent Valid
percent
Cumulative
percent
0-5 years 76 46.6 46.6 46.6
6-10 years 32 19.6 19.6 66.3
11-15 years 20 12.3 12.3 78.5
16-20 years 7 4.3 4.3 82.8
20 + years 28 17.2 17.2 100.0
Total 163 100.0 100.0
Table 4.6 indicates that the tenure distribution consists of 46.6% 0-5 years, 19.6 % 6-10
years, 12.3% 11-15 years, 4.3% 16-20 years and 17.2% 20 + years. The frequencies
indicate that the majority of the respondents had 0-5 years (46.6%). Figure 4.6 below,
illustrates this further.
32
38
16
30
47
19,623,3
9,8
18,4
28,8
0
10
20
30
40
50
P8 P9 P10 P11 P12
Job level
Frequency Percentage
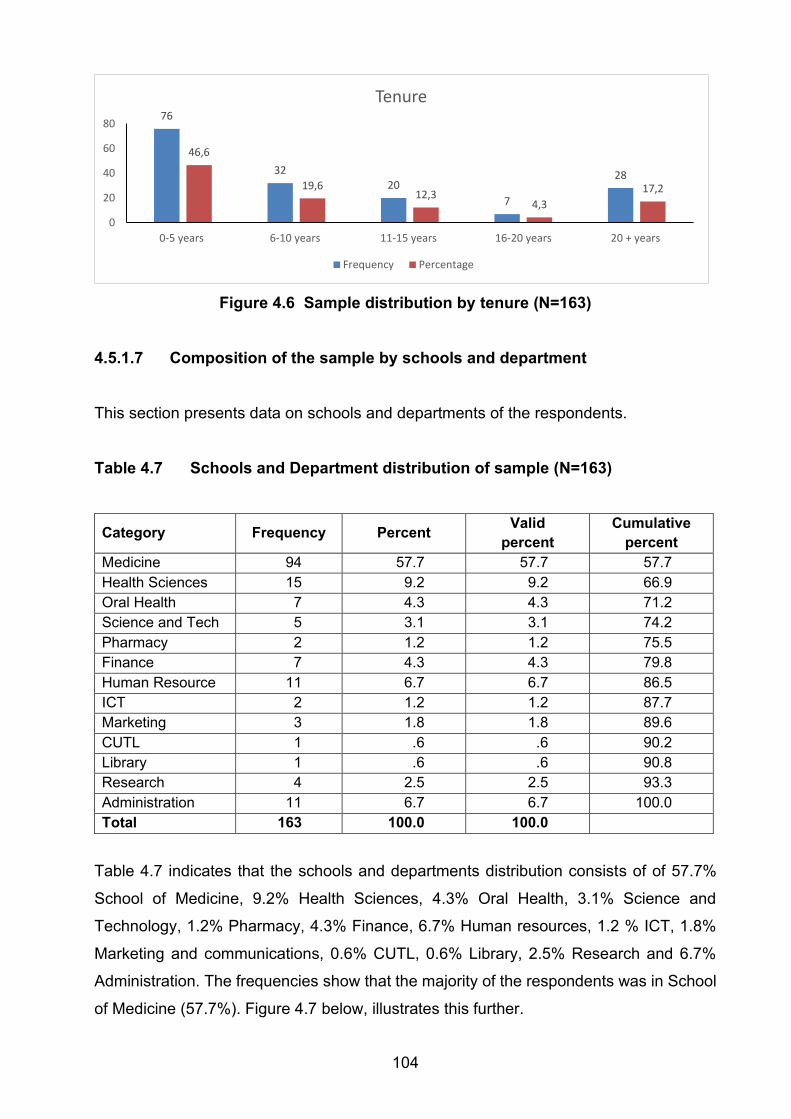
104
Figure 4.6 Sample distribution by tenure (N=163)
4.5.1.7 Composition of the sample by schools and department
This section presents data on schools and departments of the respondents.
Table 4.7 Schools and Department distribution of sample (N=163)
Category Frequency Percent Valid
percent
Cumulative
percent
Medicine 94 57.7 57.7 57.7
Health Sciences 15 9.2 9.2 66.9
Oral Health 7 4.3 4.3 71.2
Science and Tech 5 3.1 3.1 74.2
Pharmacy 2 1.2 1.2 75.5
Finance 7 4.3 4.3 79.8
Human Resource 11 6.7 6.7 86.5
ICT 2 1.2 1.2 87.7
Marketing 3 1.8 1.8 89.6
CUTL 1 .6 .6 90.2
Library 1 .6 .6 90.8
Research 4 2.5 2.5 93.3
Administration 11 6.7 6.7 100.0
Total 163 100.0 100.0
Table 4.7 indicates that the schools and departments distribution consists of of 57.7%
School of Medicine, 9.2% Health Sciences, 4.3% Oral Health, 3.1% Science and
Technology, 1.2% Pharmacy, 4.3% Finance, 6.7% Human resources, 1.2 % ICT, 1.8%
Marketing and communications, 0.6% CUTL, 0.6% Library, 2.5% Research and 6.7%
Administration. The frequencies show that the majority of the respondents was in School
of Medicine (57.7%). Figure 4.7 below, illustrates this further.
76
3220
7
28
46,6
19,612,3
4,3
17,2
0
20
40
60
80
0-5 years 6-10 years 11-15 years 16-20 years 20 + years
Tenure
Frequency Percentage
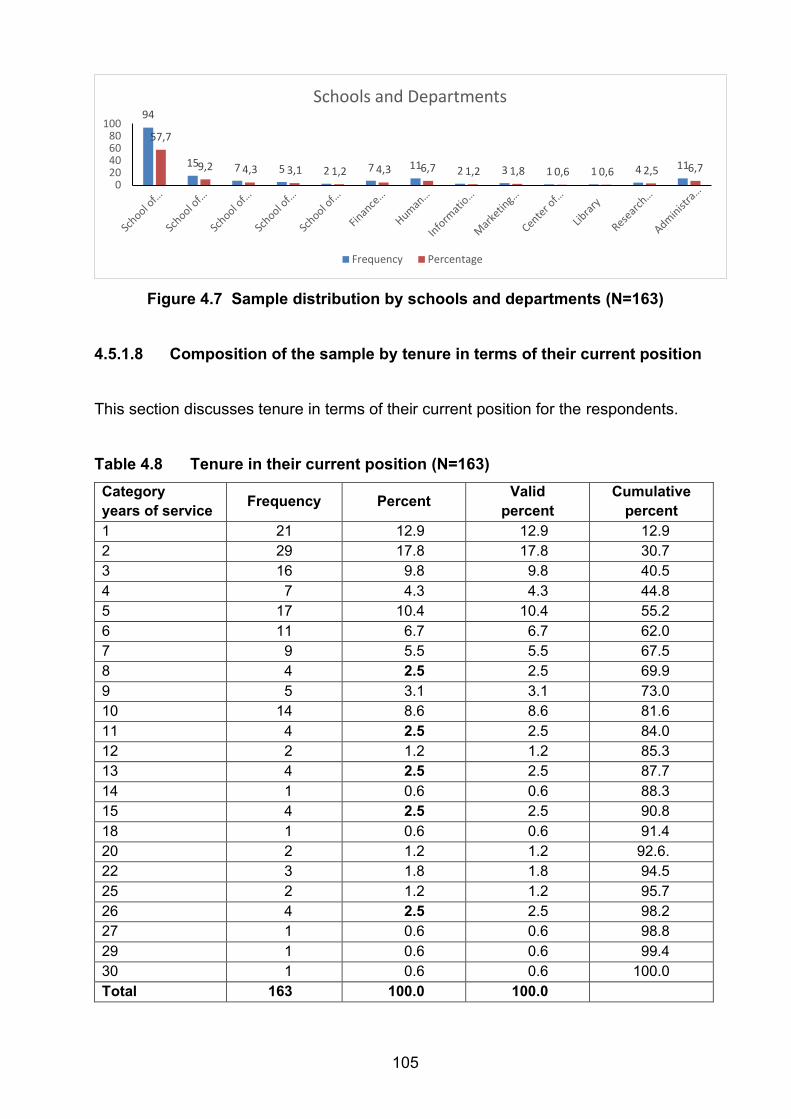
105
Figure 4.7 Sample distribution by schools and departments (N=163)
4.5.1.8 Composition of the sample by tenure in terms of their current position
This section discusses tenure in terms of their current position for the respondents.
Table 4.8 Tenure in their current position (N=163)
Category
years of service Frequency Percent
Valid
percent
Cumulative
percent
1 21 12.9 12.9 12.9
2 29 17.8 17.8 30.7
3 16 9.8 9.8 40.5
4 7 4.3 4.3 44.8
5 17 10.4 10.4 55.2
6 11 6.7 6.7 62.0
7 9 5.5 5.5 67.5
8 4 2.5 2.5 69.9
9 5 3.1 3.1 73.0
10 14 8.6 8.6 81.6
11 4 2.5 2.5 84.0
12 2 1.2 1.2 85.3
13 4 2.5 2.5 87.7
14 1 0.6 0.6 88.3
15 4 2.5 2.5 90.8
18 1 0.6 0.6 91.4
20 2 1.2 1.2 92.6.
22 3 1.8 1.8 94.5
25 2 1.2 1.2 95.7
26 4 2.5 2.5 98.2
27 1 0.6 0.6 98.8
29 1 0.6 0.6 99.4
30 1 0.6 0.6 100.0
Total 163 100.0 100.0
94
15 7 5 2 7 11 2 3 1 1 4 11
57,7
9,2 4,3 3,1 1,2 4,3 6,7 1,2 1,8 0,6 0,6 2,5 6,7
020406080
100
Schools and Departments
Frequency Percentage
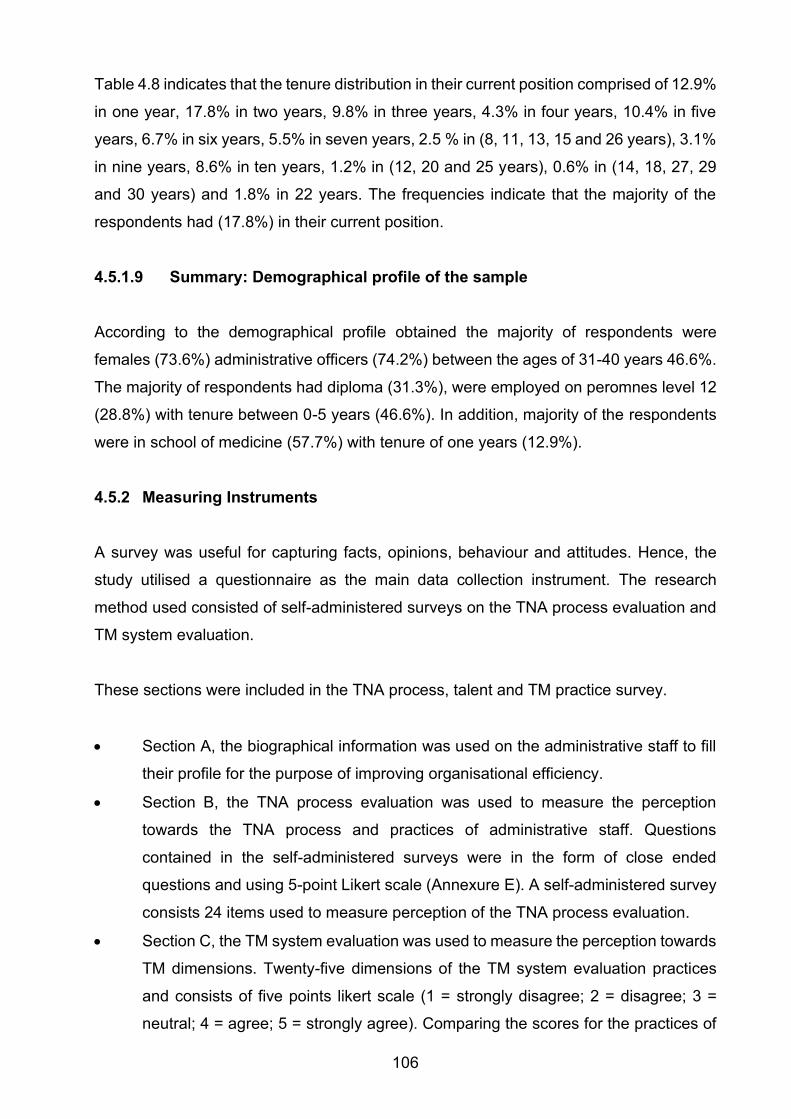
106
Table 4.8 indicates that the tenure distribution in their current position comprised of 12.9%
in one year, 17.8% in two years, 9.8% in three years, 4.3% in four years, 10.4% in five
years, 6.7% in six years, 5.5% in seven years, 2.5 % in (8, 11, 13, 15 and 26 years), 3.1%
in nine years, 8.6% in ten years, 1.2% in (12, 20 and 25 years), 0.6% in (14, 18, 27, 29
and 30 years) and 1.8% in 22 years. The frequencies indicate that the majority of the
respondents had (17.8%) in their current position.
4.5.1.9 Summary: Demographical profile of the sample
According to the demographical profile obtained the majority of respondents were
females (73.6%) administrative officers (74.2%) between the ages of 31-40 years 46.6%.
The majority of respondents had diploma (31.3%), were employed on peromnes level 12
(28.8%) with tenure between 0-5 years (46.6%). In addition, majority of the respondents
were in school of medicine (57.7%) with tenure of one years (12.9%).
4.5.2 Measuring Instruments
A survey was useful for capturing facts, opinions, behaviour and attitudes. Hence, the
study utilised a questionnaire as the main data collection instrument. The research
method used consisted of self-administered surveys on the TNA process evaluation and
TM system evaluation.
These sections were included in the TNA process, talent and TM practice survey.
• Section A, the biographical information was used on the administrative staff to fill
their profile for the purpose of improving organisational efficiency.
• Section B, the TNA process evaluation was used to measure the perception
towards the TNA process and practices of administrative staff. Questions
contained in the self-administered surveys were in the form of close ended
questions and using 5-point Likert scale (Annexure E). A self-administered survey
consists 24 items used to measure perception of the TNA process evaluation.
• Section C, the TM system evaluation was used to measure the perception towards
TM dimensions. Twenty-five dimensions of the TM system evaluation practices
and consists of five points likert scale (1 = strongly disagree; 2 = disagree; 3 =
neutral; 4 = agree; 5 = strongly agree). Comparing the scores for the practices of
107
the TM system evaluation and the perception of the TNA process evaluation,
provides the greatest training needs. Also, the greater the difference in scores, the
greater the training needs (Yousif et al., 2019). The questionnaire in this study was
scored similarly to Yousif and friends’ scoring. According to Bryman and Bell
(2011), the test findings pertaining to the tool should reveal the general internal
consistency reliability for 0.899. In addition, Walker (2010), extended the tool into
computer-generated work designs, and the findings revealed internal consistency
of 0.84. In this study, this was done in Chapter five.
The reliability of the instrument was estimated on scale items using the Statistical
Package for Social Sciences (SPSS). This was done using the SPSS version 25.0,
Cronbach’s Alpha reliability statistics for the various part of the survey and the total
Cronbach’s Alpha reliability statistics were computed (IBM Corp, 2017). According to
Sekaran (2000), Cronbach’s Alpha value less than 0.70 is considered to be poor, but
anything above it, is good and acceptable.
• A self-administered TM system evaluation survey measure was used to assess
the perceived TM practices and the important of the TM practices of the institution
for the administrative staff to predict the impact, effectiveness and the efficiency of
the O-T-P framework that underpinned this study (Barkhuizen et al., 2015). The
measure consisted of 25-item on 5-point Likert scale measures eight talent
management practices, namely: management commitment, talent review process,
workforce planning, staffing, talent acquisition, talent development, performance
management and talent retention. The questionnaire was developed by the
researcher in line with Barkhuizen et al. (2014) questionnaire on their study about
TM on administrative staff (Barkhuizen et al., 2014; Barkhuizen et al., 2015).
4.5.3 Research procedures
The ethical clearance and permission to conduct the study was obtained from the Ethics
committee of the Human Resource Department (Annexure A) and the participating
organisation (HSU) (Annexure C). Post receiving ethical clearance, an electronic mail
explaining the aim of the study and the survey process (Annexure B) was sent to a
gatekeeper (Marketing and Communication Department). According to McFadyen and
Rankin (2016), a gatekeeper is a person who limits or controls the access of researchers
108
to participants. In addition, the two indicate that gatekeepers ensure that researchers are
granted permission to access prospective respondents and sites for their research
projects. Hence, the ethical clearance and permission to conduct this study was sent to
the Marketing and Communication Department for consideration.
Employing a self-administered survey allows respondents to participate on structured and
standardised lists of questions without the interference of the researcher, which could
result into bias. Because of this, the questionnaire of the study was copied into Google
forms (Annexure E), Google forms is a network survey that records responses in a folder
or database (Bryman & Bell, 2011). This online survey form was utilised to allow
respondents convenient access to the questionnaire and to limit possible bias that may
be occur because of the presence of the researcher. Concurrently, a link to the survey
and permission form (Annexure D) was sent to the gatekeeper through an email, and the
gatekeeper administered the survey of the study on behalf of the researcher.
4.5.4 Data analysis
Statistical Package for Social Sciences (SPSS) version 25.0 (IBM Corp, 2017) was used
to analyse the data for this study. The advantages of using SPSS were that the program
provided many ways in which to manipulate quantitative data, and it also contained a
wide variety of statistical measures. In the first stage, the exploratory factor analysis, the
second stage was the descriptive statistics, followed by the correlation and lastly the test
of significant differences.
4.5.4.1 Exploratory factor analysis
The EFA of TNAM and TM was used. Factor analysis is a form of exploratory multivariate
analysis that was used to reduce the number of variables in the results and to detect
relationships among variables (Field, 2018). The variables involved in the factor analysis
of TNAM and TM were not normally distributed. The goal of the analysis was to identify
TNAM and TM factors, which underlie the variables. Therefore, the Bartlett test was used
to show the level of significance of the correlation construction of a construct.
Communality (which is the opposite of uniqueness) is the proportion of the variable that
is accounted for by all the factors of TNA (feedback, organisational analysis, task
109
significance, task analysis and individual analysis) and TM factors (Talent development,
talent selection, talent utilisation and talent retention). A very low communality indicates
that a variable may not belong to any of the factors. Furthermore, the scree plot was
useful in determining four factors to retain. The component matrix table was carried out
for five TNA factors of the test scores load onto the first factor, while all five tend not to
load heavily on the second factor. The purpose of rotating the factors was to get the
variables to load either very high or very low on each factor. A rotated factor matrix of
TNAM with five factors and TM with four factors for varimax rotation and a plot of the
eigenvalues was used. For this reason, four factors of TNAM were retained and three
factors of TM were also retained.
4.5.4.2 Reliability
Reliability refers to the extent to which a data collection technique will retain the
consistent, same results (Bryman & Bell, 2011). According to Jackson (2011), this means
that different researchers should get similar results if they were to redo the similar study.
In this study, the external reliability was guaranteed in establishing measures of internal
consistency (Creswell, 2014). Internal reliability or consistency was guaranteed by means
of the Cronbach’s alpha coefficient. This was based on inter-item correlations which
provide a sign of the average correlation between all items that make up the scale
(Bryman & Bell 2011; Jackson, 2011). A value above 0.8 was considered to be adequate
(Bryman & Bell, 2011).
4.5.4.3 Descriptive statistics
Following a model by Welman, Kruger and Mitchell (2005); sub-dimensions’ statistics
was used to present a description and a summary of the data sets. The scale construct
of the descriptive information consists of means, standard deviations (SD) and graphical
plots. The mean scores represent the average ratings of 163 administrative staff per
item on a 5-point scale. The scales items range from five, which indicates strongly agree
statements to one, indicates a strongly disagree statement. While the SD indicates the
distribution of scores. These were used to indicate the distribution of scores with regard
to skewness and kurtosis (β₂- 3). The skewness value will shows the symmetry of the
distribution, whereas β₂- 3 provides information regarding the shape/peakedness of
distribution, thus indicating in this study that the sample data were taken from a normally
110
distributed population (DeCarlo, 1997). Finally, the descriptive information of the TNA_4
and TM were presented in Chapter five.
4.5.4.4 Correlations
Correlation analysis was used to examine the extent to which two complete variables TM
and their sub-dimensions are linked to each other (Kumar, 2014). Leedy and Ormrod
(2013), state that a correlation exists when one variable rises (training) and another
variable (TM) rises or drops in a, to some extent, foreseeable fashion. This includes
elementary statistical measures for measuring bivariate relationships (Maylor &
Blackmon, 2005:313). Therefore, the hypothesis is used to explain the variance in the
dependent variables so as to foresee the management of talent (Kumar, 2014). The
research findings that relate to bivariate relationships are based on restricted analysis
since a link between two variables has been explored without manipulating for another
variable (Bryman et al., 2011). Consequently, bivariate analysis was conducted to
construct and reinforce the credibility of the research results.
4.5.4.5 Test for significant mean differences
Mann-Whitney test was used for test of the significance in this study. This was based on
the null hypothesis which states that there is no relationship between the TNA process
and TM practices. Therefore, the relationship between the TNA process and TM practice
is presented in Chapter five. In a process of testing hypotheses in research, possible
errors may occur. On the one hand, the error may occur when the null hypothesis is
rejected even though it is in fact true; on the other hand, the error that may occur is when
the null hypothesis is accepted even when it is in fact wrong or false. These types of
errors can be circumvented by increasing the sample size or by adjusting the significant
level to pay off for slight samples (Pallant, 2007).
4.6 ETHICAL CONSIDERATIONS
The University of South Africa's research ethics policy (UNISA Ethical Policy, 2012) was
employed to ensure ethical conduct is observed through the duration of the study, and to
prevent possible harm to respondents at all times. In order to fulfil the institution’s ethical
provisions, respondents were informed that their participation in the study was voluntary,
111
and that their right to privacy will be observed; hence, there was not any form of payment
and confidentiality was maintained at all times. The researcher obtained informed consent
from the respondents, and the consent form explained the nature and the objectives of
the study.
An explanation of the rewards of the research, including those for the respondents and
the entire HSU were outlined. Upon completion of the study, a summary of the results
would be presented to all interested stakeholders including the respondents. Although
the research results were unfavorable, the researcher described and analysed the
statistics fairly irrespective of pressure and prior anticipations. In order to ensure that
moral principles are adhered to, the researcher upheld the following ten general ethics
principles (UNISA Ethical Policy, 2012):
• Essentiality and Relevance: before undertaking research, there was sufficient
thought of the current literature on the topic of the study. Taking into consideration
the inadequacy of resources in South Africa, it was revealed that the research is
necessary to the field of study.
• Maximisation of public Interest and of social justice: the research was carried out
for the benefit of the public especially persons in the area of HRM and HRD. All
efforts made in this study were made in an acceptable manner and form, as well
as at a suitable time; and the findings of the study indicate that this will add value
into social justice related issues.
• Competence, ability and commitment to research: the researcher acted in a
professional manner throughout the study; and the conduct of the researcher
demonstrated clear evidence of competence and commitment in developing
innovative strategies in the area of the study.
• Respect for and protection of the rights and interests of respondents and
Institutions: the researcher did not expose respondents to procedures that were
not directly linked to the study, and the pursuit of knowledge did not disregard the
rights of the respondents.
• Informed and non-coerced consent: all respondents (administrative staff) were
informed about the aims and objectives of the study, and that their participation
was only voluntary. Hence, their participation was completely autonomous, and
consent was granted by them to participate in the study.
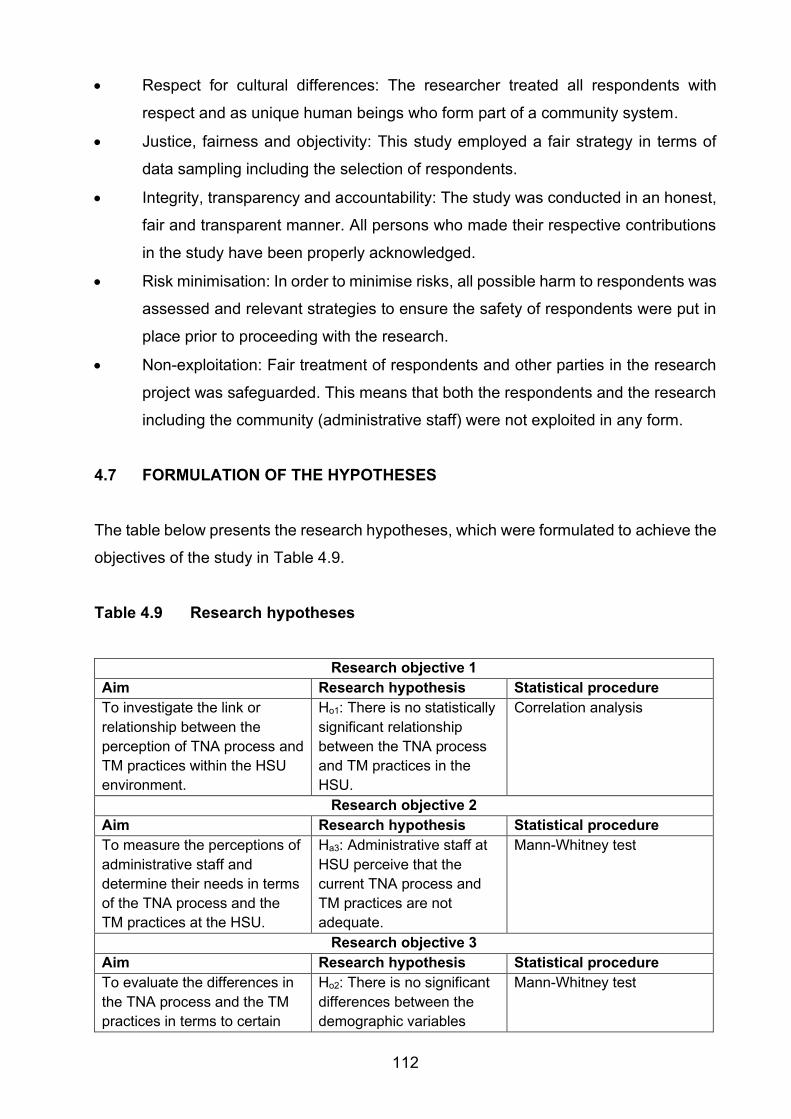
112
• Respect for cultural differences: The researcher treated all respondents with
respect and as unique human beings who form part of a community system.
• Justice, fairness and objectivity: This study employed a fair strategy in terms of
data sampling including the selection of respondents.
• Integrity, transparency and accountability: The study was conducted in an honest,
fair and transparent manner. All persons who made their respective contributions
in the study have been properly acknowledged.
• Risk minimisation: In order to minimise risks, all possible harm to respondents was
assessed and relevant strategies to ensure the safety of respondents were put in
place prior to proceeding with the research.
• Non-exploitation: Fair treatment of respondents and other parties in the research
project was safeguarded. This means that both the respondents and the research
including the community (administrative staff) were not exploited in any form.
4.7 FORMULATION OF THE HYPOTHESES
The table below presents the research hypotheses, which were formulated to achieve the
objectives of the study in Table 4.9.
Table 4.9 Research hypotheses
Research objective 1
Aim Research hypothesis Statistical procedure
To investigate the link or
relationship between the
perception of TNA process and
TM practices within the HSU
environment.
Ho1: There is no statistically
significant relationship
between the TNA process
and TM practices in the
HSU.
Correlation analysis
Research objective 2
Aim Research hypothesis Statistical procedure
To measure the perceptions of
administrative staff and
determine their needs in terms
of the TNA process and the
TM practices at the HSU.
Ha3: Administrative staff at
HSU perceive that the
current TNA process and
TM practices are not
adequate.
Mann-Whitney test
Research objective 3
Aim Research hypothesis Statistical procedure
To evaluate the differences in
the TNA process and the TM
practices in terms to certain
Ho2: There is no significant
differences between the
demographic variables
Mann-Whitney test
113
demographic variables (age,
gender, job title, educational
level, job level and tenure).
responses with regard to
their perceptions on the
TNA process and the TM
practices.
4.8 CHAPTER SUMMARY
This chapter discussed the philosophy of the study including the research design and the
approach applied to achieve the research objectives. It provided information on the
research plan and methodology that was applied to conduct the study. The chapter went
on to explore important principles of Ethical Considerations that would assist in
safeguarding against possible research immoralities. Finally, the chapter presented a
framework of the empirical research. The discussions in this chapter serve as a transition
to Chapter five, which will examine the results of the study.
114
CHAPTER 5
RESEARCH RESULTS
5.1 INTRODUCTION
This chapter examines the results of the study. The primary aim of this study was to
investigate whether the TNA process and TM practice are linked within a HSU
environment. Among other aspects, the chapter examines data analysis including the
data analysed using the exploratory factor analysis, the Cronbach alpha coefficients,
descriptive statistics and the correlations analysis. Lastly, the chapter explores the Mann-
Whitney test that was performed during the data analysis process.
5.2 VALIDITY
Validity is a significant concept in quantitative research studies. As a result, this section
discusses the validity of the research instruments employed during the data collection
and into the data analysis state. The process of ensuring validity involved piloting rigorous
tests in order to determine whether the scale dimension reflected the construct purported
in the primary scales (Bryman et al., 2011). The procedure for measuring the validity of
constructs consists of two levels namely, content validity measures and exploratory factor
analysis.
5.2.1 Content validity measures
Existing standardised instruments during the piloting process were revised for content
validity and reliability. The questions were loaded on Google forms and pre-tested. The
formulated link to the survey was then e-mailed to the statistician and the study
supervisors for expert review and, in respect, approval from the supervisors. The
construction of the survey was received and was deemed to be suitable for assessing
administrative staff’s perceptions. Post approval from the supervisors, the survey was e-
mailed to a sample of 20 administrative staff to establish its relevance for the nature of
data to be collected. Only 18 administrative staff replied. A telephonic follow-up was
conducted to check for possible remarks that would assist in improving the survey in order
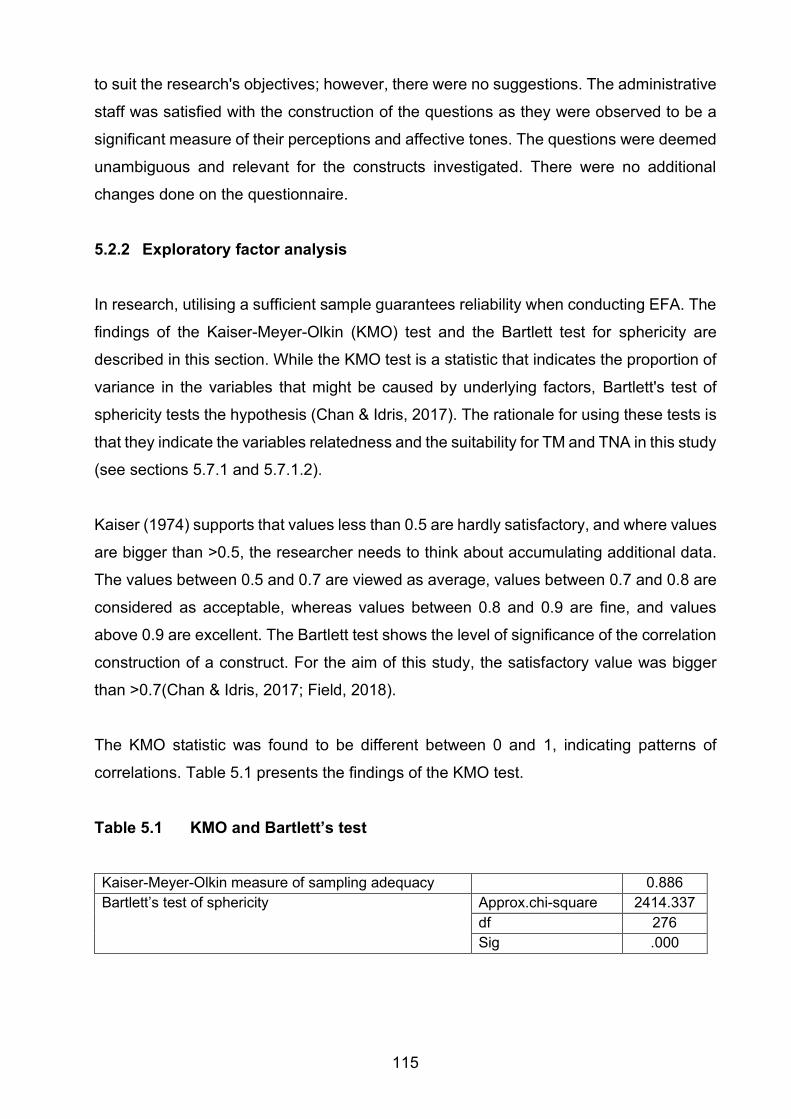
115
to suit the research's objectives; however, there were no suggestions. The administrative
staff was satisfied with the construction of the questions as they were observed to be a
significant measure of their perceptions and affective tones. The questions were deemed
unambiguous and relevant for the constructs investigated. There were no additional
changes done on the questionnaire.
5.2.2 Exploratory factor analysis
In research, utilising a sufficient sample guarantees reliability when conducting EFA. The
findings of the Kaiser-Meyer-Olkin (KMO) test and the Bartlett test for sphericity are
described in this section. While the KMO test is a statistic that indicates the proportion of
variance in the variables that might be caused by underlying factors, Bartlett's test of
sphericity tests the hypothesis (Chan & Idris, 2017). The rationale for using these tests is
that they indicate the variables relatedness and the suitability for TM and TNA in this study
(see sections 5.7.1 and 5.7.1.2).
Kaiser (1974) supports that values less than 0.5 are hardly satisfactory, and where values
are bigger than >0.5, the researcher needs to think about accumulating additional data.
The values between 0.5 and 0.7 are viewed as average, values between 0.7 and 0.8 are
considered as acceptable, whereas values between 0.8 and 0.9 are fine, and values
above 0.9 are excellent. The Bartlett test shows the level of significance of the correlation
construction of a construct. For the aim of this study, the satisfactory value was bigger
than >0.7(Chan & Idris, 2017; Field, 2018).
The KMO statistic was found to be different between 0 and 1, indicating patterns of
correlations. Table 5.1 presents the findings of the KMO test.
Table 5.1 KMO and Bartlett’s test
Kaiser-Meyer-Olkin measure of sampling adequacy 0.886
Bartlett’s test of sphericity Approx.chi-square 2414.337
df 276
Sig .000
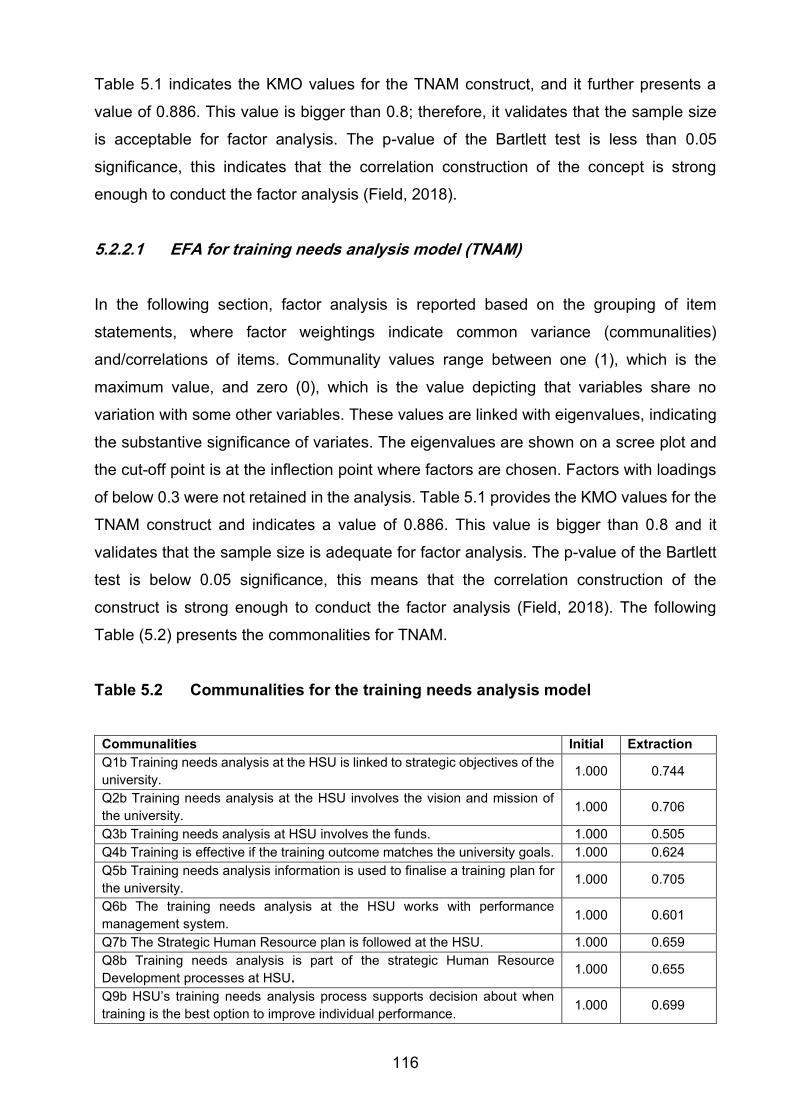
116
Table 5.1 indicates the KMO values for the TNAM construct, and it further presents a
value of 0.886. This value is bigger than 0.8; therefore, it validates that the sample size
is acceptable for factor analysis. The p-value of the Bartlett test is less than 0.05
significance, this indicates that the correlation construction of the concept is strong
enough to conduct the factor analysis (Field, 2018).
5.2.2.1 EFA for training needs analysis model (TNAM)
In the following section, factor analysis is reported based on the grouping of item
statements, where factor weightings indicate common variance (communalities)
and/correlations of items. Communality values range between one (1), which is the
maximum value, and zero (0), which is the value depicting that variables share no
variation with some other variables. These values are linked with eigenvalues, indicating
the substantive significance of variates. The eigenvalues are shown on a scree plot and
the cut-off point is at the inflection point where factors are chosen. Factors with loadings
of below 0.3 were not retained in the analysis. Table 5.1 provides the KMO values for the
TNAM construct and indicates a value of 0.886. This value is bigger than 0.8 and it
validates that the sample size is adequate for factor analysis. The p-value of the Bartlett
test is below 0.05 significance, this means that the correlation construction of the
construct is strong enough to conduct the factor analysis (Field, 2018). The following
Table (5.2) presents the commonalities for TNAM.
Table 5.2 Communalities for the training needs analysis model
Communalities Initial Extraction
Q1b Training needs analysis at the HSU is linked to strategic objectives of the
university. 1.000 0.744
Q2b Training needs analysis at the HSU involves the vision and mission of
the university. 1.000 0.706
Q3b Training needs analysis at HSU involves the funds. 1.000 0.505
Q4b Training is effective if the training outcome matches the university goals. 1.000 0.624
Q5b Training needs analysis information is used to finalise a training plan for
the university. 1.000 0.705
Q6b The training needs analysis at the HSU works with performance
management system. 1.000 0.601
Q7b The Strategic Human Resource plan is followed at the HSU. 1.000 0.659
Q8b Training needs analysis is part of the strategic Human Resource
Development processes at HSU. 1.000 0.655
Q9b HSU’s training needs analysis process supports decision about when
training is the best option to improve individual performance. 1.000 0.699
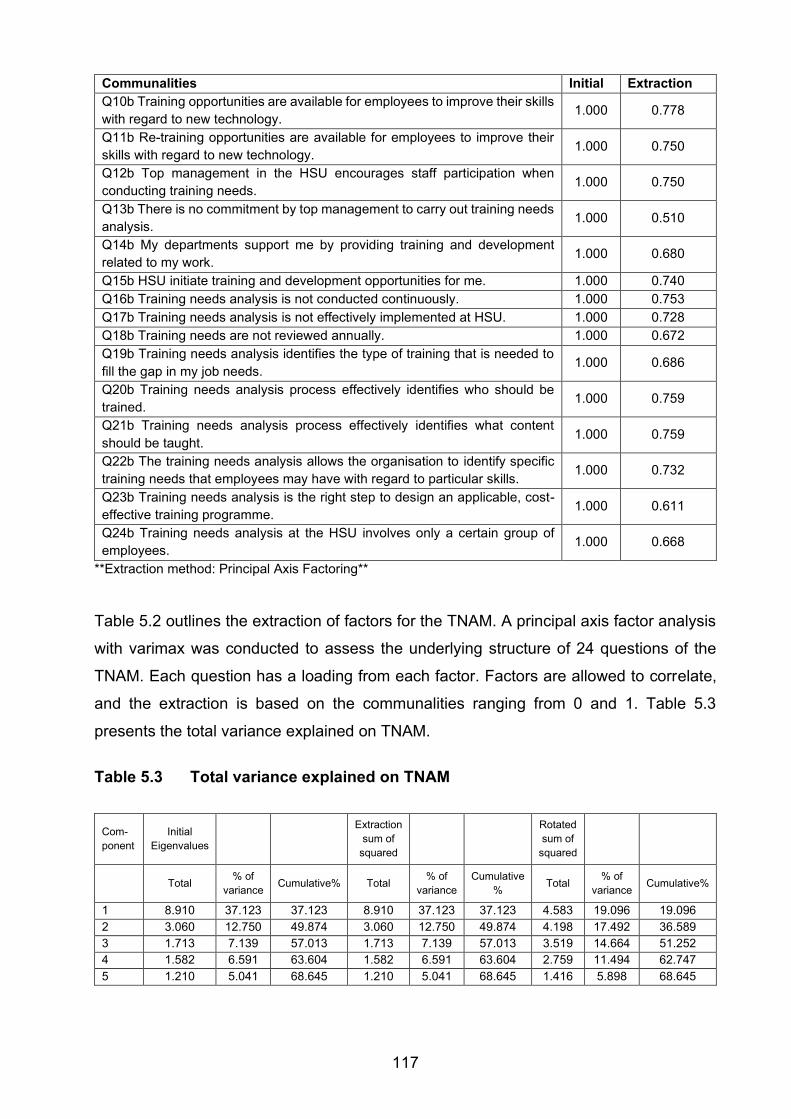
117
Communalities Initial Extraction
Q10b Training opportunities are available for employees to improve their skills
with regard to new technology. 1.000 0.778
Q11b Re-training opportunities are available for employees to improve their
skills with regard to new technology. 1.000 0.750
Q12b Top management in the HSU encourages staff participation when
conducting training needs. 1.000 0.750
Q13b There is no commitment by top management to carry out training needs
analysis. 1.000 0.510
Q14b My departments support me by providing training and development
related to my work. 1.000 0.680
Q15b HSU initiate training and development opportunities for me. 1.000 0.740
Q16b Training needs analysis is not conducted continuously. 1.000 0.753
Q17b Training needs analysis is not effectively implemented at HSU. 1.000 0.728
Q18b Training needs are not reviewed annually. 1.000 0.672
Q19b Training needs analysis identifies the type of training that is needed to
fill the gap in my job needs. 1.000 0.686
Q20b Training needs analysis process effectively identifies who should be
trained. 1.000 0.759
Q21b Training needs analysis process effectively identifies what content
should be taught. 1.000 0.759
Q22b The training needs analysis allows the organisation to identify specific
training needs that employees may have with regard to particular skills. 1.000 0.732
Q23b Training needs analysis is the right step to design an applicable, cost-
effective training programme. 1.000 0.611
Q24b Training needs analysis at the HSU involves only a certain group of
employees. 1.000 0.668
**Extraction method: Principal Axis Factoring**
Table 5.2 outlines the extraction of factors for the TNAM. A principal axis factor analysis
with varimax was conducted to assess the underlying structure of 24 questions of the
TNAM. Each question has a loading from each factor. Factors are allowed to correlate,
and the extraction is based on the communalities ranging from 0 and 1. Table 5.3
presents the total variance explained on TNAM.
Table 5.3 Total variance explained on TNAM
Com-
ponent
Initial
Eigenvalues
Extraction
sum of
squared
Rotated
sum of
squared
Total % of
variance Cumulative% Total
% of
variance
Cumulative
% Total
% of
variance Cumulative%
1 8.910 37.123 37.123 8.910 37.123 37.123 4.583 19.096 19.096
2 3.060 12.750 49.874 3.060 12.750 49.874 4.198 17.492 36.589
3 1.713 7.139 57.013 1.713 7.139 57.013 3.519 14.664 51.252
4 1.582 6.591 63.604 1.582 6.591 63.604 2.759 11.494 62.747
5 1.210 5.041 68.645 1.210 5.041 68.645 1.416 5.898 68.645
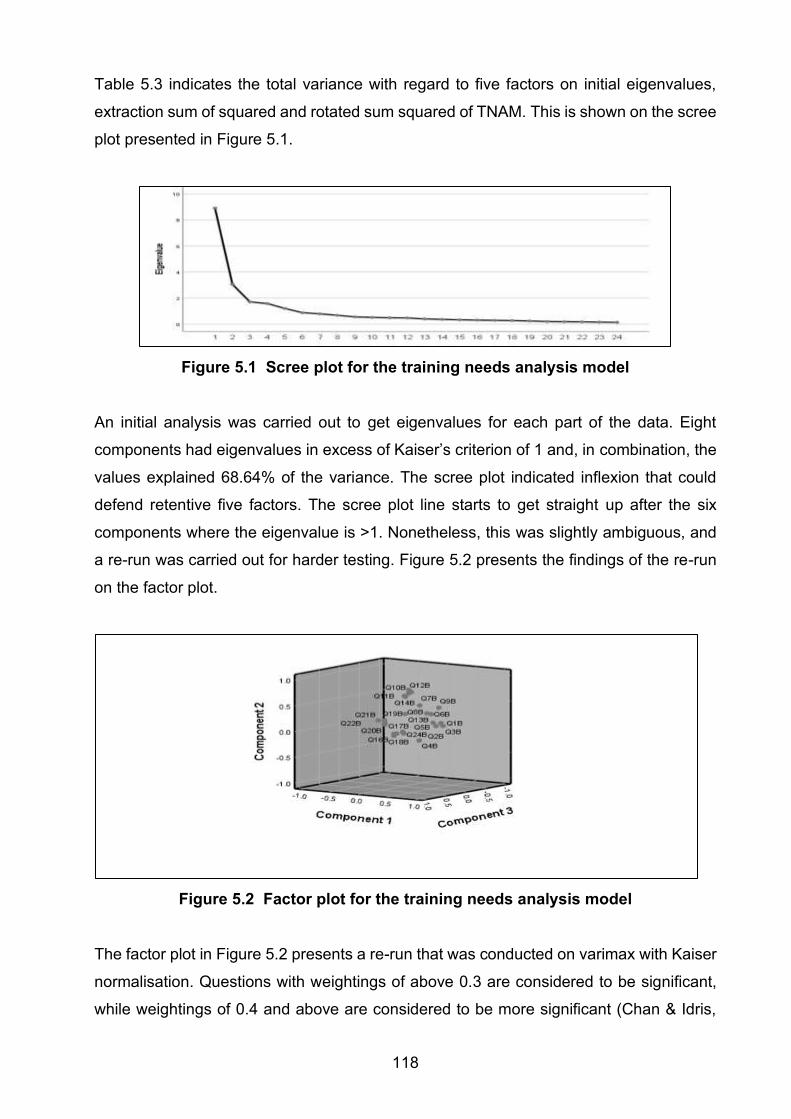
118
Table 5.3 indicates the total variance with regard to five factors on initial eigenvalues,
extraction sum of squared and rotated sum squared of TNAM. This is shown on the scree
plot presented in Figure 5.1.
Figure 5.1 Scree plot for the training needs analysis model
An initial analysis was carried out to get eigenvalues for each part of the data. Eight
components had eigenvalues in excess of Kaiser’s criterion of 1 and, in combination, the
values explained 68.64% of the variance. The scree plot indicated inflexion that could
defend retentive five factors. The scree plot line starts to get straight up after the six
components where the eigenvalue is >1. Nonetheless, this was slightly ambiguous, and
a re-run was carried out for harder testing. Figure 5.2 presents the findings of the re-run
on the factor plot.
Figure 5.2 Factor plot for the training needs analysis model
The factor plot in Figure 5.2 presents a re-run that was conducted on varimax with Kaiser
normalisation. Questions with weightings of above 0.3 are considered to be significant,
while weightings of 0.4 and above are considered to be more significant (Chan & Idris,
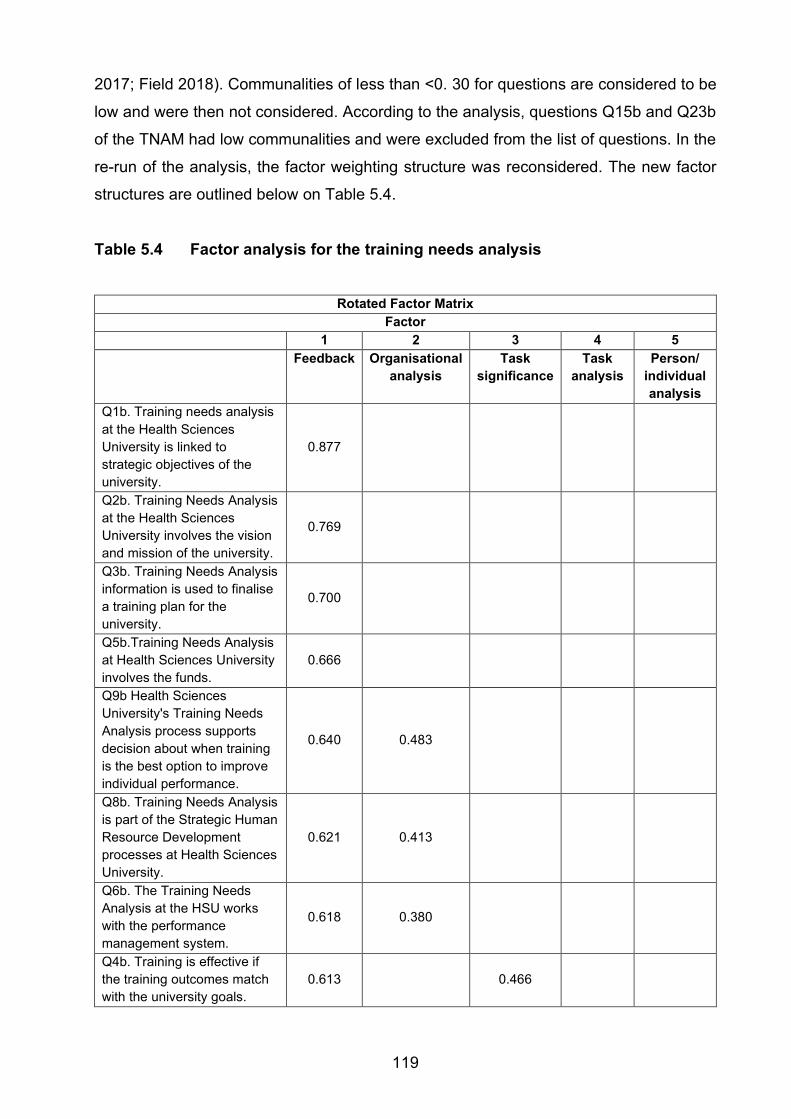
119
2017; Field 2018). Communalities of less than <0. 30 for questions are considered to be
low and were then not considered. According to the analysis, questions Q15b and Q23b
of the TNAM had low communalities and were excluded from the list of questions. In the
re-run of the analysis, the factor weighting structure was reconsidered. The new factor
structures are outlined below on Table 5.4.
Table 5.4 Factor analysis for the training needs analysis
Rotated Factor Matrix
Factor
1 2 3 4 5
Feedback Organisational
analysis
Task
significance
Task
analysis
Person/
individual
analysis
Q1b. Training needs analysis
at the Health Sciences
University is linked to
strategic objectives of the
university.
0.877
Q2b. Training Needs Analysis
at the Health Sciences
University involves the vision
and mission of the university.
0.769
Q3b. Training Needs Analysis
information is used to finalise
a training plan for the
university.
0.700
Q5b.Training Needs Analysis
at Health Sciences University
involves the funds.
0.666
Q9b Health Sciences
University's Training Needs
Analysis process supports
decision about when training
is the best option to improve
individual performance.
0.640 0.483
Q8b. Training Needs Analysis
is part of the Strategic Human
Resource Development
processes at Health Sciences
University.
0.621 0.413
Q6b. The Training Needs
Analysis at the HSU works
with the performance
management system.
0.618 0.380
Q4b. Training is effective if
the training outcomes match
with the university goals.
0.613 0.466
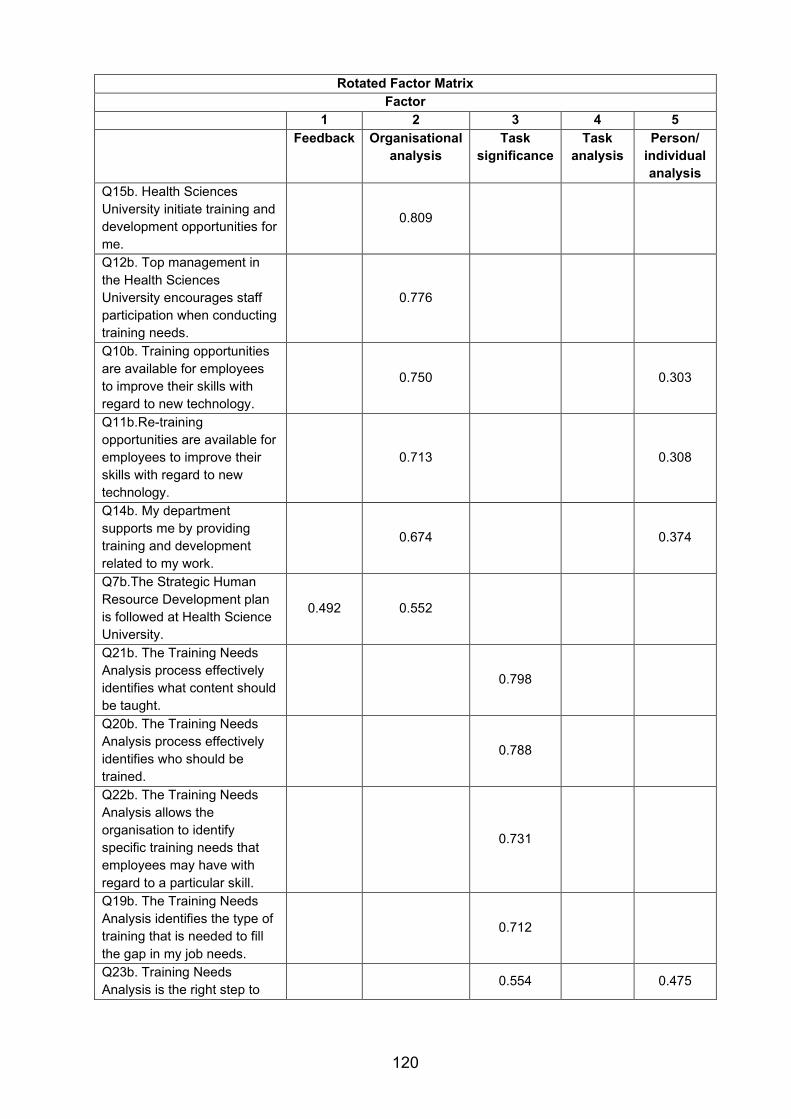
120
Rotated Factor Matrix
Factor
1 2 3 4 5
Feedback Organisational
analysis
Task
significance
Task
analysis
Person/
individual
analysis
Q15b. Health Sciences
University initiate training and
development opportunities for
me.
0.809
Q12b. Top management in
the Health Sciences
University encourages staff
participation when conducting
training needs.
0.776
Q10b. Training opportunities
are available for employees
to improve their skills with
regard to new technology.
0.750 0.303
Q11b.Re-training
opportunities are available for
employees to improve their
skills with regard to new
technology.
0.713 0.308
Q14b. My department
supports me by providing
training and development
related to my work.
0.674 0.374
Q7b.The Strategic Human
Resource Development plan
is followed at Health Science
University.
0.492 0.552
Q21b. The Training Needs
Analysis process effectively
identifies what content should
be taught.
0.798
Q20b. The Training Needs
Analysis process effectively
identifies who should be
trained.
0.788
Q22b. The Training Needs
Analysis allows the
organisation to identify
specific training needs that
employees may have with
regard to a particular skill.
0.731
Q19b. The Training Needs
Analysis identifies the type of
training that is needed to fill
the gap in my job needs.
0.712
Q23b. Training Needs
Analysis is the right step to 0.554 0.475
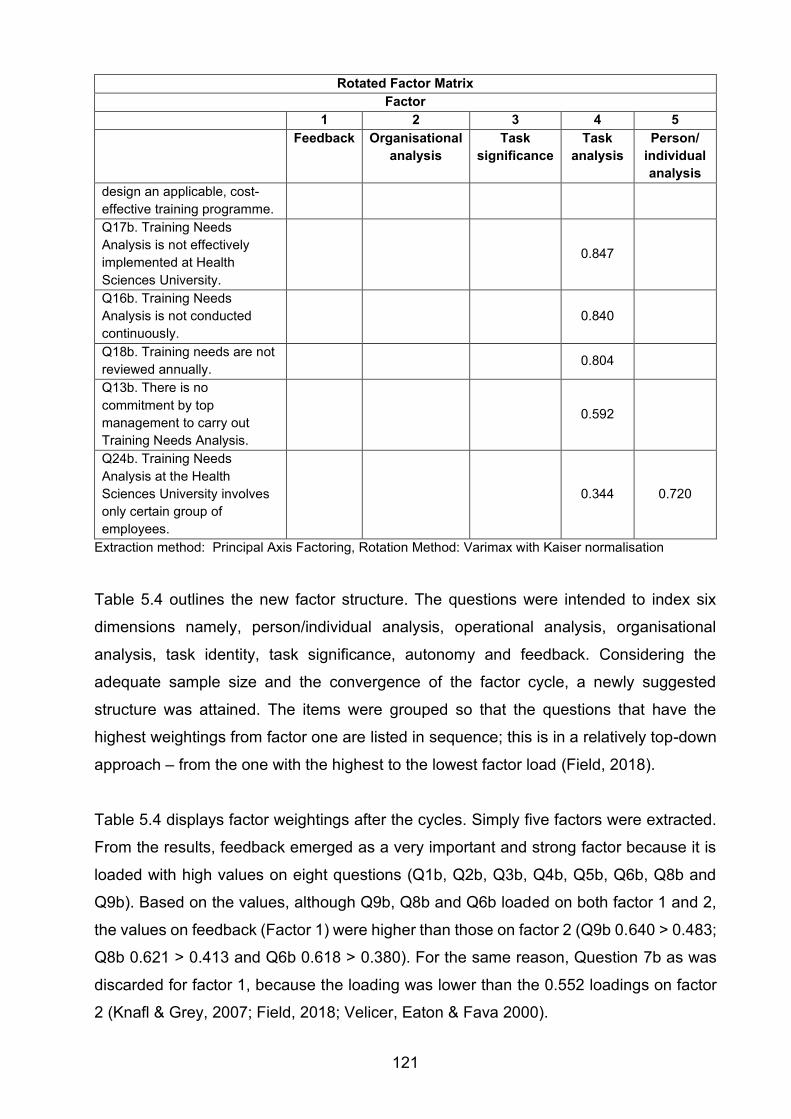
121
Rotated Factor Matrix
Factor
1 2 3 4 5
Feedback Organisational
analysis
Task
significance
Task
analysis
Person/
individual
analysis
design an applicable, cost-
effective training programme.
Q17b. Training Needs
Analysis is not effectively
implemented at Health
Sciences University.
0.847
Q16b. Training Needs
Analysis is not conducted
continuously.
0.840
Q18b. Training needs are not
reviewed annually. 0.804
Q13b. There is no
commitment by top
management to carry out
Training Needs Analysis.
0.592
Q24b. Training Needs
Analysis at the Health
Sciences University involves
only certain group of
employees.
0.344 0.720
Extraction method: Principal Axis Factoring, Rotation Method: Varimax with Kaiser normalisation
Table 5.4 outlines the new factor structure. The questions were intended to index six
dimensions namely, person/individual analysis, operational analysis, organisational
analysis, task identity, task significance, autonomy and feedback. Considering the
adequate sample size and the convergence of the factor cycle, a newly suggested
structure was attained. The items were grouped so that the questions that have the
highest weightings from factor one are listed in sequence; this is in a relatively top-down
approach – from the one with the highest to the lowest factor load (Field, 2018).
Table 5.4 displays factor weightings after the cycles. Simply five factors were extracted.
From the results, feedback emerged as a very important and strong factor because it is
loaded with high values on eight questions (Q1b, Q2b, Q3b, Q4b, Q5b, Q6b, Q8b and
Q9b). Based on the values, although Q9b, Q8b and Q6b loaded on both factor 1 and 2,
the values on feedback (Factor 1) were higher than those on factor 2 (Q9b 0.640 > 0.483;
Q8b 0.621 > 0.413 and Q6b 0.618 > 0.380). For the same reason, Question 7b as was
discarded for factor 1, because the loading was lower than the 0.552 loadings on factor
2 (Knafl & Grey, 2007; Field, 2018; Velicer, Eaton & Fava 2000).
122
Therefore, factor 1 makes a bigger contribution than factor 2 with eight questions.
Organisational analysis has a strong factor loaded high with six questions (Q15b, Q12b,
Q10b, Q11b, Q14b and Q7b). Based on the values, Q10b, Q11b, and Q14b under
individual analyses were discarded and added to factor 2 of organisational analysis.
Factor 3, task significance starts at Q21b, Q20b, Q22b, Q19 and Q23. Based on the
values, Q23 under individual analysis was discarded and fall under factor 3 of task
significance. Factor 4, task analysis starts at Q17b, Q16b, Q18b and Q13b. Based on the
low value of Q24, Q24 was discarded and added under factor 5. However, factor 5 was
discarded due to only one question with a high value and it is not strong enough to retain
it (Knafl & Grey, 2007; Field, 2018; Velicer et al., 2000). During the factor analysis output,
that is, items creating the dimension of TNA, data was divided into three subdivisions of
factors namely, two, four and five. The splitting of data into three subsets provides cross-
validation, which is an incomplete form of validity. As a result, one subset had to be cast-
off (Knafl & Grey, 2007).
The subset of person/individual analysis in factor 5 had high factor scores and as well
comprised of only five items. Subsequently, factor weightings may increase validity issues
scores to the digital office work setting under study (Culbertson, 2013). Additionally,
preconceptions about factor 5 may require modification based on the reverse-coded
indicator items related to the disjoint sets. Factor 5 has been discarded because it has
only one question with a high loading instead of three questions and above, hence, it is
discarded (Knafl & Grey, 2007; Field, 2018). As a rule of thumb, 0.7 or higher factor
loading represents that the factor extracts sufficient variance from that of variable (Velicer
et al., 2000). As recommended above, the subsets for factor 4 were left out (Knafl & Grey,
2007).
Subsequent to the cross-validation, the four-factor (TNA_4) were retained as the new
structures in the final analysis. The items that cluster on factor 1 propose that the
dimension represent feedback, factor 2 organisational analysis, factor 3 task significance
and factor 4 task analysis. All these four-factor TNA have the strong factor and largish
correlations, hence, they are all retained. In other words, the latent constructs represented
by the factors are related. The four-factors of TNA are valid and reliable to continue with
the rest of the final analysis. Table 5.5 represents the final four new factors.
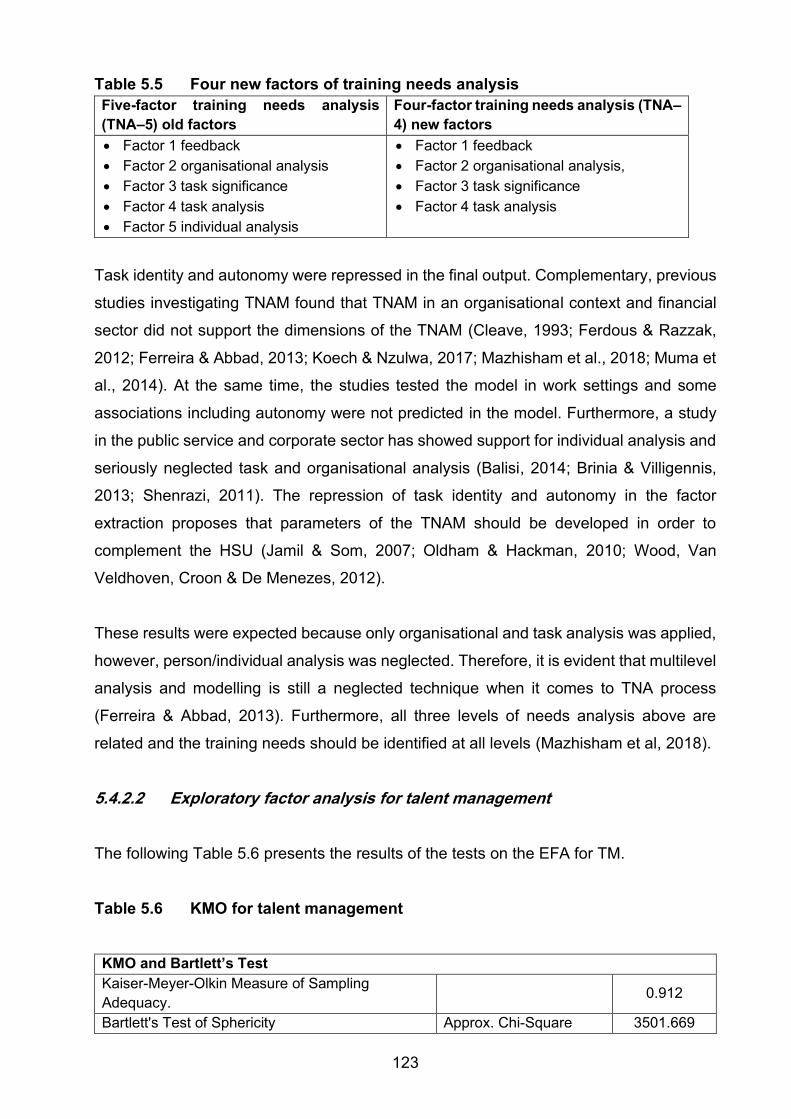
123
Table 5.5 Four new factors of training needs analysis
Five-factor training needs analysis
(TNA–5) old factors
Four-factor training needs analysis (TNA–
4) new factors
• Factor 1 feedback
• Factor 2 organisational analysis
• Factor 3 task significance
• Factor 4 task analysis
• Factor 5 individual analysis
• Factor 1 feedback
• Factor 2 organisational analysis,
• Factor 3 task significance
• Factor 4 task analysis
Task identity and autonomy were repressed in the final output. Complementary, previous
studies investigating TNAM found that TNAM in an organisational context and financial
sector did not support the dimensions of the TNAM (Cleave, 1993; Ferdous & Razzak,
2012; Ferreira & Abbad, 2013; Koech & Nzulwa, 2017; Mazhisham et al., 2018; Muma et
al., 2014). At the same time, the studies tested the model in work settings and some
associations including autonomy were not predicted in the model. Furthermore, a study
in the public service and corporate sector has showed support for individual analysis and
seriously neglected task and organisational analysis (Balisi, 2014; Brinia & Villigennis,
2013; Shenrazi, 2011). The repression of task identity and autonomy in the factor
extraction proposes that parameters of the TNAM should be developed in order to
complement the HSU (Jamil & Som, 2007; Oldham & Hackman, 2010; Wood, Van
Veldhoven, Croon & De Menezes, 2012).
These results were expected because only organisational and task analysis was applied,
however, person/individual analysis was neglected. Therefore, it is evident that multilevel
analysis and modelling is still a neglected technique when it comes to TNA process
(Ferreira & Abbad, 2013). Furthermore, all three levels of needs analysis above are
related and the training needs should be identified at all levels (Mazhisham et al, 2018).
5.4.2.2 Exploratory factor analysis for talent management
The following Table 5.6 presents the results of the tests on the EFA for TM.
Table 5.6 KMO for talent management
KMO and Bartlett’s Test
Kaiser-Meyer-Olkin Measure of Sampling
Adequacy.
0.912
Bartlett's Test of Sphericity Approx. Chi-Square 3501.669
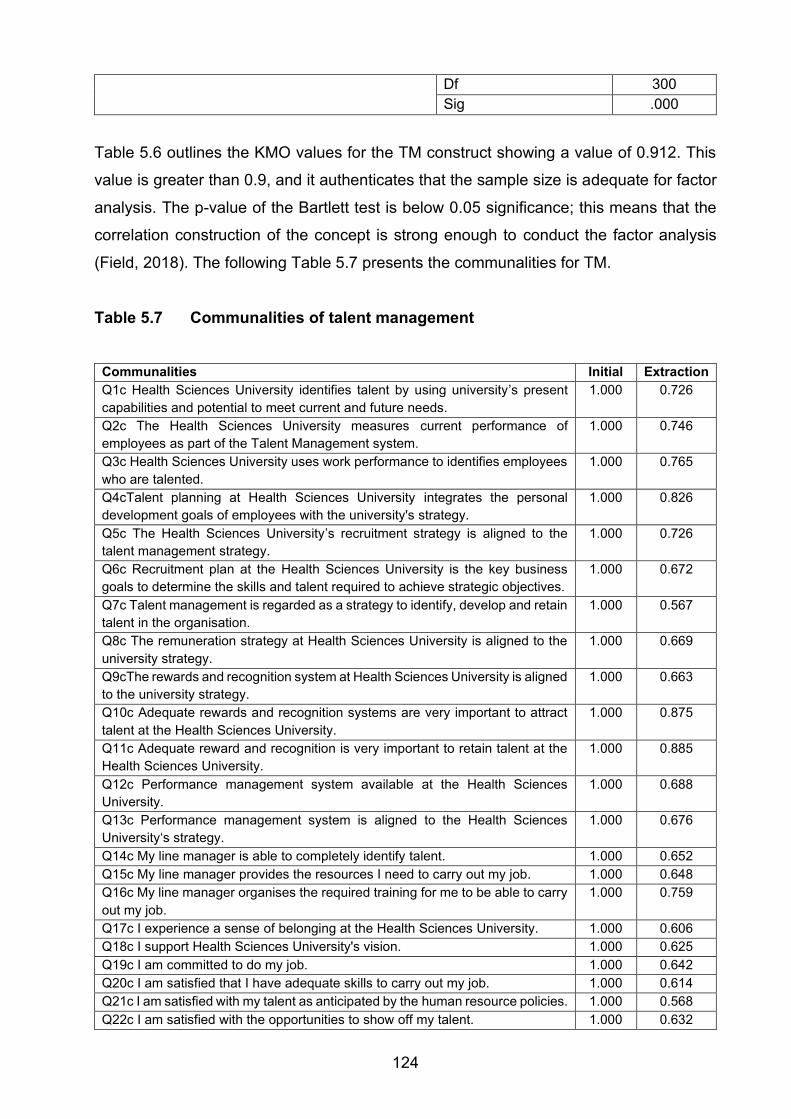
124
Df 300
Sig .000
Table 5.6 outlines the KMO values for the TM construct showing a value of 0.912. This
value is greater than 0.9, and it authenticates that the sample size is adequate for factor
analysis. The p-value of the Bartlett test is below 0.05 significance; this means that the
correlation construction of the concept is strong enough to conduct the factor analysis
(Field, 2018). The following Table 5.7 presents the communalities for TM.
Table 5.7 Communalities of talent management
Communalities Initial Extraction
Q1c Health Sciences University identifies talent by using university’s present
capabilities and potential to meet current and future needs.
1.000 0.726
Q2c The Health Sciences University measures current performance of
employees as part of the Talent Management system.
1.000 0.746
Q3c Health Sciences University uses work performance to identifies employees
who are talented.
1.000 0.765
Q4cTalent planning at Health Sciences University integrates the personal
development goals of employees with the university's strategy.
1.000 0.826
Q5c The Health Sciences University’s recruitment strategy is aligned to the
talent management strategy.
1.000 0.726
Q6c Recruitment plan at the Health Sciences University is the key business
goals to determine the skills and talent required to achieve strategic objectives.
1.000 0.672
Q7c Talent management is regarded as a strategy to identify, develop and retain
talent in the organisation.
1.000 0.567
Q8c The remuneration strategy at Health Sciences University is aligned to the
university strategy.
1.000 0.669
Q9cThe rewards and recognition system at Health Sciences University is aligned
to the university strategy.
1.000 0.663
Q10c Adequate rewards and recognition systems are very important to attract
talent at the Health Sciences University.
1.000 0.875
Q11c Adequate reward and recognition is very important to retain talent at the
Health Sciences University.
1.000 0.885
Q12c Performance management system available at the Health Sciences
University.
1.000 0.688
Q13c Performance management system is aligned to the Health Sciences
University‘s strategy.
1.000 0.676
Q14c My line manager is able to completely identify talent. 1.000 0.652
Q15c My line manager provides the resources I need to carry out my job. 1.000 0.648
Q16c My line manager organises the required training for me to be able to carry
out my job.
1.000 0.759
Q17c I experience a sense of belonging at the Health Sciences University. 1.000 0.606
Q18c I support Health Sciences University's vision. 1.000 0.625
Q19c I am committed to do my job. 1.000 0.642
Q20c I am satisfied that I have adequate skills to carry out my job. 1.000 0.614
Q21c I am satisfied with my talent as anticipated by the human resource policies. 1.000 0.568
Q22c I am satisfied with the opportunities to show off my talent. 1.000 0.632
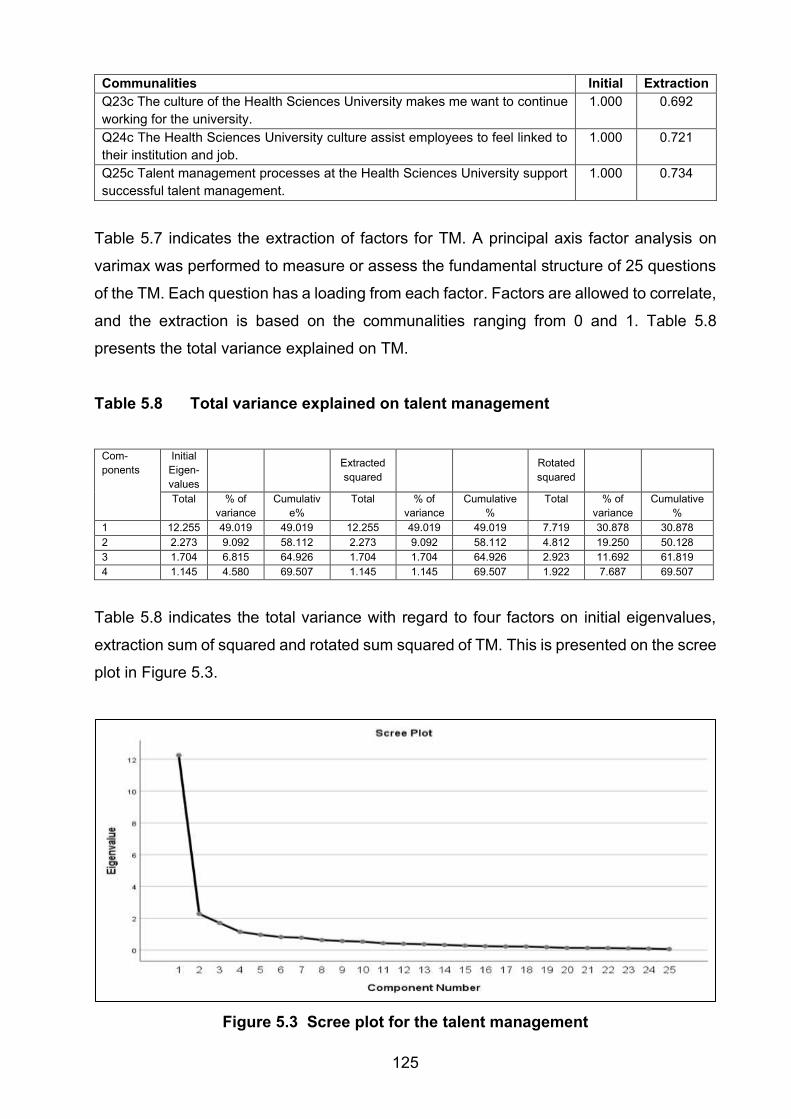
125
Communalities Initial Extraction
Q23c The culture of the Health Sciences University makes me want to continue
working for the university.
1.000 0.692
Q24c The Health Sciences University culture assist employees to feel linked to
their institution and job.
1.000 0.721
Q25c Talent management processes at the Health Sciences University support
successful talent management.
1.000 0.734
Table 5.7 indicates the extraction of factors for TM. A principal axis factor analysis on
varimax was performed to measure or assess the fundamental structure of 25 questions
of the TM. Each question has a loading from each factor. Factors are allowed to correlate,
and the extraction is based on the communalities ranging from 0 and 1. Table 5.8
presents the total variance explained on TM.
Table 5.8 Total variance explained on talent management
Com-
ponents
Initial
Eigen-
values
Extracted
squared
Rotated
squared
Total % of
variance
Cumulativ
e%
Total % of
variance
Cumulative
%
Total % of
variance
Cumulative
%
1 12.255 49.019 49.019 12.255 49.019 49.019 7.719 30.878 30.878
2 2.273 9.092 58.112 2.273 9.092 58.112 4.812 19.250 50.128
3 1.704 6.815 64.926 1.704 1.704 64.926 2.923 11.692 61.819
4 1.145 4.580 69.507 1.145 1.145 69.507 1.922 7.687 69.507
Table 5.8 indicates the total variance with regard to four factors on initial eigenvalues,
extraction sum of squared and rotated sum squared of TM. This is presented on the scree
plot in Figure 5.3.
Figure 5.3 Scree plot for the talent management
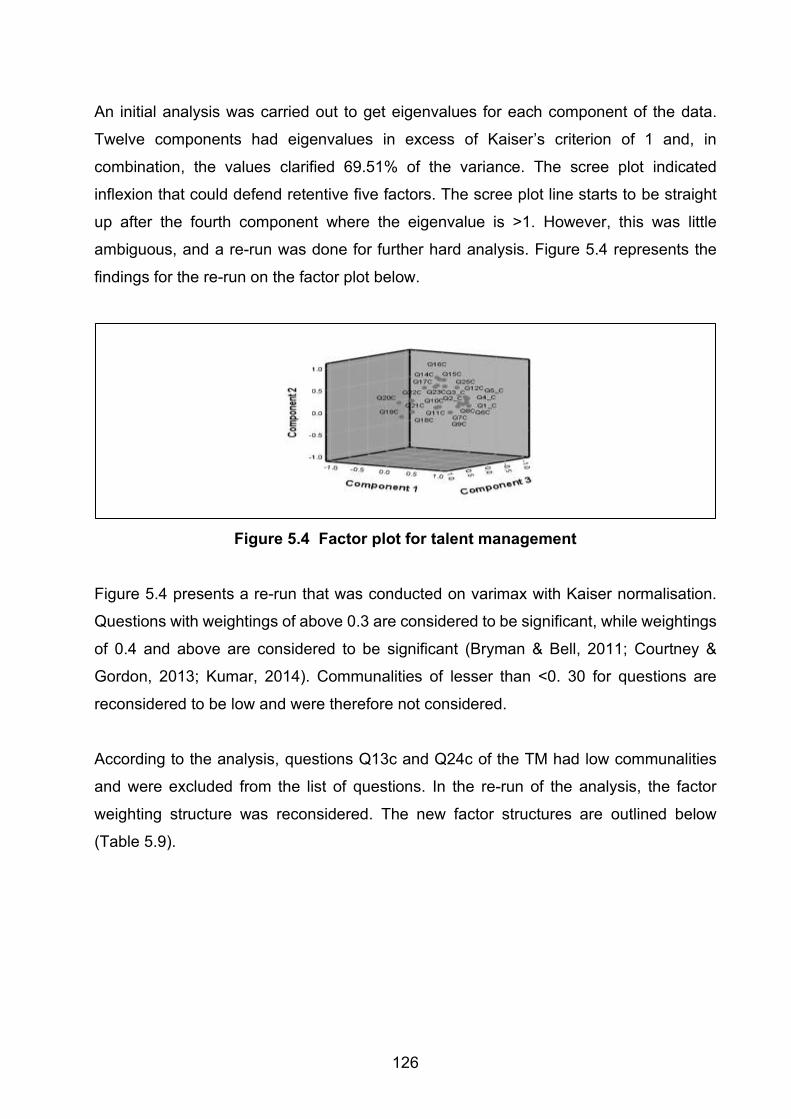
126
An initial analysis was carried out to get eigenvalues for each component of the data.
Twelve components had eigenvalues in excess of Kaiser’s criterion of 1 and, in
combination, the values clarified 69.51% of the variance. The scree plot indicated
inflexion that could defend retentive five factors. The scree plot line starts to be straight
up after the fourth component where the eigenvalue is >1. However, this was little
ambiguous, and a re-run was done for further hard analysis. Figure 5.4 represents the
findings for the re-run on the factor plot below.
Figure 5.4 Factor plot for talent management
Figure 5.4 presents a re-run that was conducted on varimax with Kaiser normalisation.
Questions with weightings of above 0.3 are considered to be significant, while weightings
of 0.4 and above are considered to be significant (Bryman & Bell, 2011; Courtney &
Gordon, 2013; Kumar, 2014). Communalities of lesser than <0. 30 for questions are
reconsidered to be low and were therefore not considered.
According to the analysis, questions Q13c and Q24c of the TM had low communalities
and were excluded from the list of questions. In the re-run of the analysis, the factor
weighting structure was reconsidered. The new factor structures are outlined below
(Table 5.9).
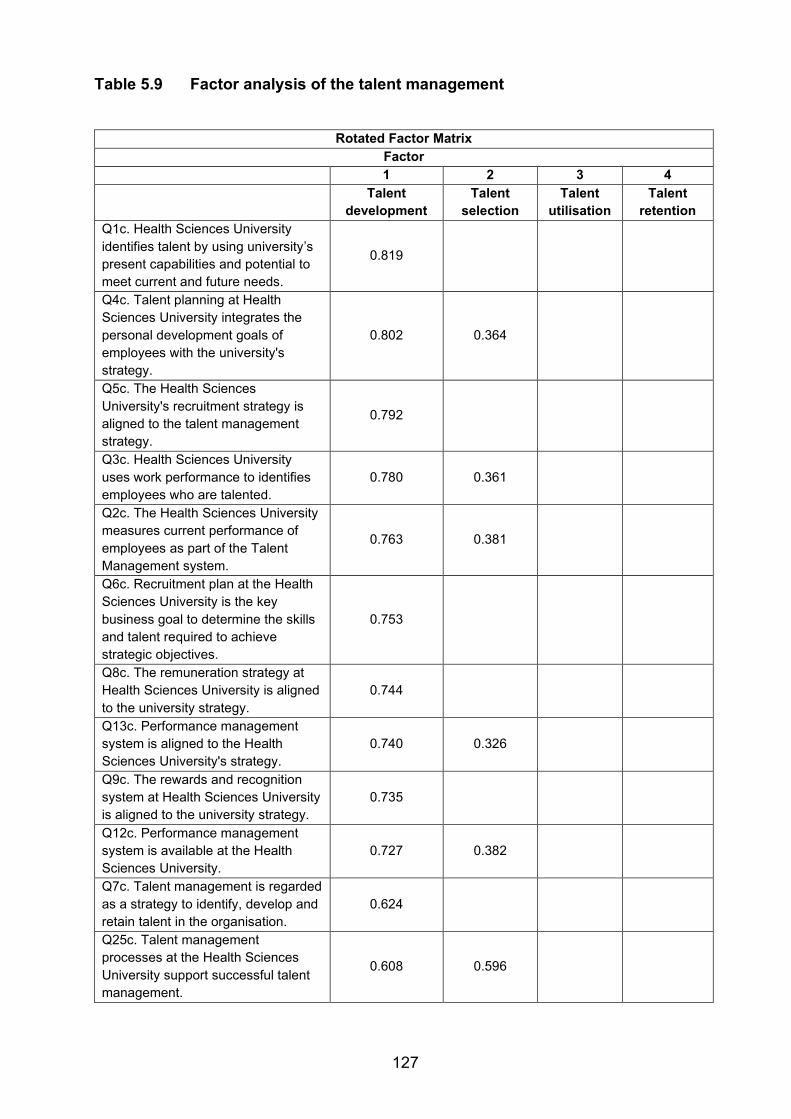
127
Table 5.9 Factor analysis of the talent management
Rotated Factor Matrix
Factor
1 2 3 4
Talent
development
Talent
selection
Talent
utilisation
Talent
retention
Q1c. Health Sciences University
identifies talent by using university’s
present capabilities and potential to
meet current and future needs.
0.819
Q4c. Talent planning at Health
Sciences University integrates the
personal development goals of
employees with the university's
strategy.
0.802 0.364
Q5c. The Health Sciences
University's recruitment strategy is
aligned to the talent management
strategy.
0.792
Q3c. Health Sciences University
uses work performance to identifies
employees who are talented.
0.780 0.361
Q2c. The Health Sciences University
measures current performance of
employees as part of the Talent
Management system.
0.763 0.381
Q6c. Recruitment plan at the Health
Sciences University is the key
business goal to determine the skills
and talent required to achieve
strategic objectives.
0.753
Q8c. The remuneration strategy at
Health Sciences University is aligned
to the university strategy.
0.744
Q13c. Performance management
system is aligned to the Health
Sciences University's strategy.
0.740 0.326
Q9c. The rewards and recognition
system at Health Sciences University
is aligned to the university strategy.
0.735
Q12c. Performance management
system is available at the Health
Sciences University.
0.727 0.382
Q7c. Talent management is regarded
as a strategy to identify, develop and
retain talent in the organisation.
0.624
Q25c. Talent management
processes at the Health Sciences
University support successful talent
management.
0.608 0.596
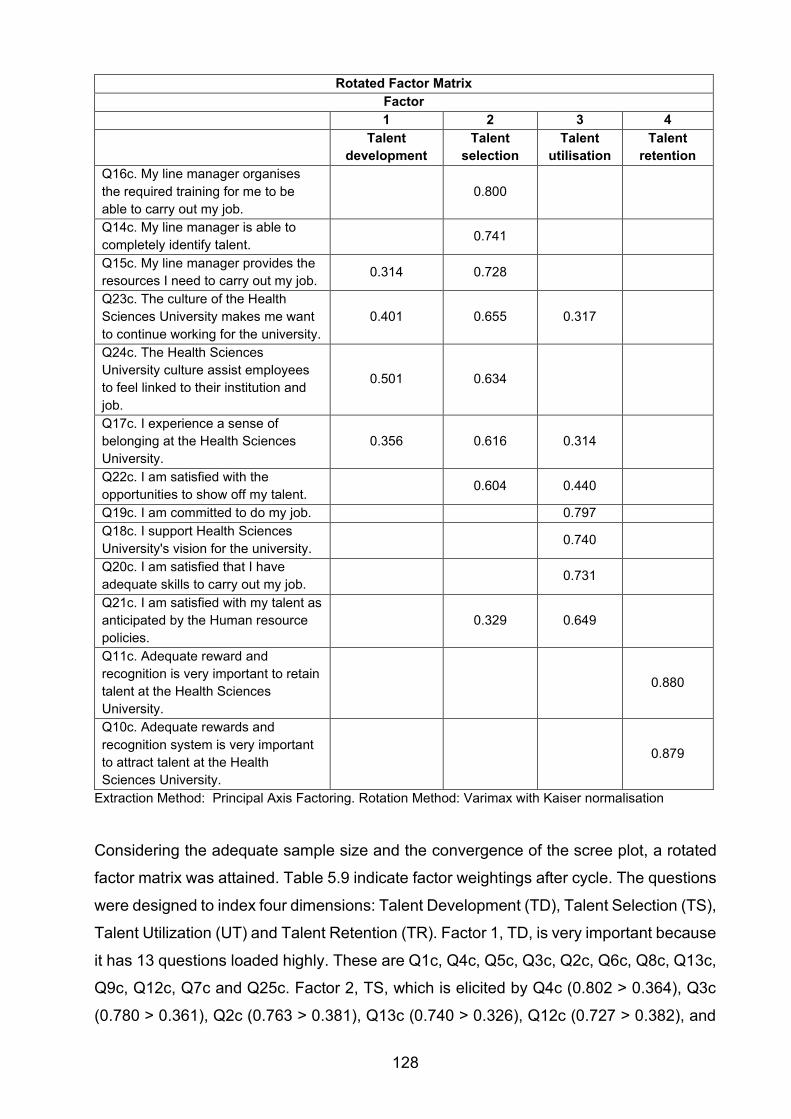
128
Rotated Factor Matrix
Factor
1 2 3 4
Talent
development
Talent
selection
Talent
utilisation
Talent
retention
Q16c. My line manager organises
the required training for me to be
able to carry out my job.
0.800
Q14c. My line manager is able to
completely identify talent. 0.741
Q15c. My line manager provides the
resources I need to carry out my job. 0.314 0.728
Q23c. The culture of the Health
Sciences University makes me want
to continue working for the university.
0.401 0.655 0.317
Q24c. The Health Sciences
University culture assist employees
to feel linked to their institution and
job.
0.501 0.634
Q17c. I experience a sense of
belonging at the Health Sciences
University.
0.356 0.616 0.314
Q22c. I am satisfied with the
opportunities to show off my talent. 0.604 0.440
Q19c. I am committed to do my job. 0.797
Q18c. I support Health Sciences
University's vision for the university. 0.740
Q20c. I am satisfied that I have
adequate skills to carry out my job. 0.731
Q21c. I am satisfied with my talent as
anticipated by the Human resource
policies.
0.329 0.649
Q11c. Adequate reward and
recognition is very important to retain
talent at the Health Sciences
University.
0.880
Q10c. Adequate rewards and
recognition system is very important
to attract talent at the Health
Sciences University.
0.879
Extraction Method: Principal Axis Factoring. Rotation Method: Varimax with Kaiser normalisation
Considering the adequate sample size and the convergence of the scree plot, a rotated
factor matrix was attained. Table 5.9 indicate factor weightings after cycle. The questions
were designed to index four dimensions: Talent Development (TD), Talent Selection (TS),
Talent Utilization (UT) and Talent Retention (TR). Factor 1, TD, is very important because
it has 13 questions loaded highly. These are Q1c, Q4c, Q5c, Q3c, Q2c, Q6c, Q8c, Q13c,
Q9c, Q12c, Q7c and Q25c. Factor 2, TS, which is elicited by Q4c (0.802 > 0.364), Q3c
(0.780 > 0.361), Q2c (0.763 > 0.381), Q13c (0.740 > 0.326), Q12c (0.727 > 0.382), and
129
Q25c (0.608 > 0.596) were added under factor 1. These was done because factor 1 is
greater than factor 2. Q24c under factor 1 was discarded since it is less than factor 2.
Instead, Q24c were added under factor 2 of TS (Knafl & Grey, 2007; Field, 2018; Velicer
et al., 2000).
Factor 2, TS, starts from Q16c, Q14c, Q15c, Q23c, Q24c, Q17 and Q22. Factor 3, TU,
which is elicited by Q23c (0.655 > 0.317), Q17c (0.616 > 0.314) to Q22c (0.604 > 0.440)
was discarded. These was done because the values of factor 2 are greater than factor 3.
Factor 3, TU, starts from Q19c, Q18c, Q20c to Q21c. Factor 4, TR, had only two high
loading values. TR factor was discarded since it is not strong enough to retain. These is
done because there has to be three questions on or more if it has to be retained. However,
most questions had cross weightings, with the strongest load being below the new
dimension.
Most questions had factor weighting of eigenvalues above .03, which is considered
significant according on the criterion set by Kline (1999) and Pallant (2011). As a result,
the questions were not removed. All these three TM factors have the strong factor and
largish correlations, hence, there are retained. In other words, the latent constructs
represented by the factors are related. The three TM factors are deemed valid and reliable
to continue with the rest of the final analysis. Table 5.10 presents the four TM factors.
Table 5.10 Three new factors of talent management
TM old 4 factors 1 TM new 3 factors
Talent development
Talent selection
Talent utilisation
Talent retention
Talent development
Talent selection
Talent utilisation
Of significance in the analysis is true that TD rather than TU has the strongest factor
loadings, and was extracted as the first factor, followed by TS, TU and TR extracted as
the last factor. However, this was expected to some degree; since the TD dimension is
valued further by HSU for their employees. As such, the respondents' TM refers to the
implementation of integrated HR strategies to attract, develop, retain and productively
utilise employees with the necessary expertise and abilities to meet present and future
employment needs (Barkhuizen et al., 2014; Gallardo-Gallardo & Thunnissen, 2016).
130
Furthermore, a study in an organisational context on ranking the driving affecting factors
on TM results showed that TR, TS and TA (talent attraction) were the most important
ones (Marjani & Safaee, 2016).
The results of this study are not unique to HSU. A previous study conducted by
Barkhuizen et al. (2014) on TM, work employment and service excellence orientation of
administrative staff in a higher education institution testing TM showed the largest gaps
between current applications. These were observed between talent review process and
talent retention. Similarly, the one conducted at HSU also showed that the gaps are more
prevalent within the dimension of TR. Furthermore, attracting and retaining quality talent
is very important to educational institution as a low talent retention rate might create both
financial and educational consequences (Barkhuizen et al., 2014).
5.3 RELIABILITY
This section discusses the reliability of the scale items in this study. Cronbach’s alpha (α)
coefficient was employed to measure internal reliability with the intent to assess
consistency based on the inter-item correlations. Items with strong correlation were
translated based on the next α values (Pallant, 2011:59):
• Values above 0.8 reliability are considered good.
• Values between 0.6 and 0.8 reliability are considered acceptable.
• Values below 0.6 reliability are considered unacceptable.
5.3.1 Reliability test for training needs analysis model (TNAM)
This section describes the reliability assessment for the TNA concept. Communalities of
TM present the quantity of cases processed to conduct the reliability test (see Table 5.7
on pages 126 and 127).
5.3.1.1 Reliability for feedback construct
Table 5.11 displays the reliability tests of the feedback construct. The statistical
assessment indicated in the table was important to the primary reliability value for the
TNA construct.
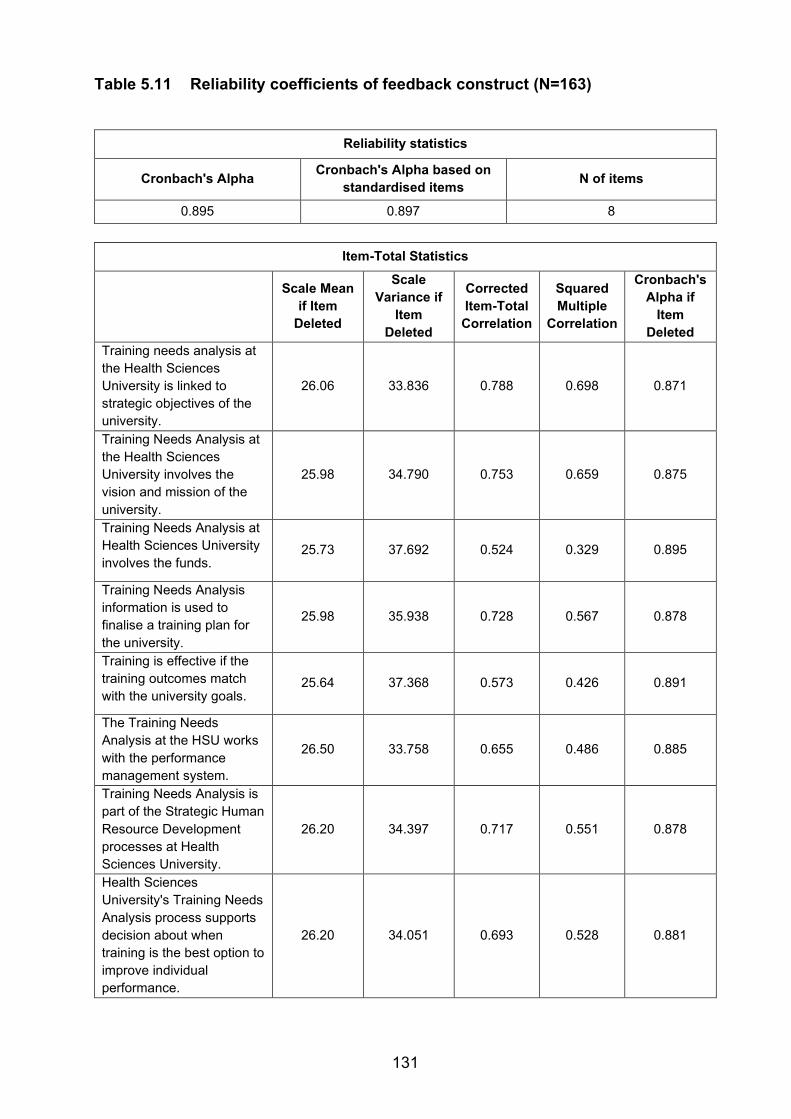
131
Table 5.11 Reliability coefficients of feedback construct (N=163)
Reliability statistics
Cronbach's Alpha Cronbach's Alpha based on
standardised items N of items
0.895 0.897 8
Item-Total Statistics
Scale Mean
if Item
Deleted
Scale
Variance if
Item
Deleted
Corrected
Item-Total
Correlation
Squared
Multiple
Correlation
Cronbach's
Alpha if
Item
Deleted
Training needs analysis at
the Health Sciences
University is linked to
strategic objectives of the
university.
26.06 33.836 0.788 0.698 0.871
Training Needs Analysis at
the Health Sciences
University involves the
vision and mission of the
university.
25.98 34.790 0.753 0.659 0.875
Training Needs Analysis at
Health Sciences University
involves the funds. 25.73 37.692 0.524 0.329 0.895
Training Needs Analysis
information is used to
finalise a training plan for
the university.
25.98 35.938 0.728 0.567 0.878
Training is effective if the
training outcomes match
with the university goals. 25.64 37.368 0.573 0.426 0.891
The Training Needs
Analysis at the HSU works
with the performance
management system.
26.50 33.758 0.655 0.486 0.885
Training Needs Analysis is
part of the Strategic Human
Resource Development
processes at Health
Sciences University.
26.20 34.397 0.717 0.551 0.878
Health Sciences
University's Training Needs
Analysis process supports
decision about when
training is the best option to
improve individual
performance.
26.20 34.051 0.693 0.528 0.881
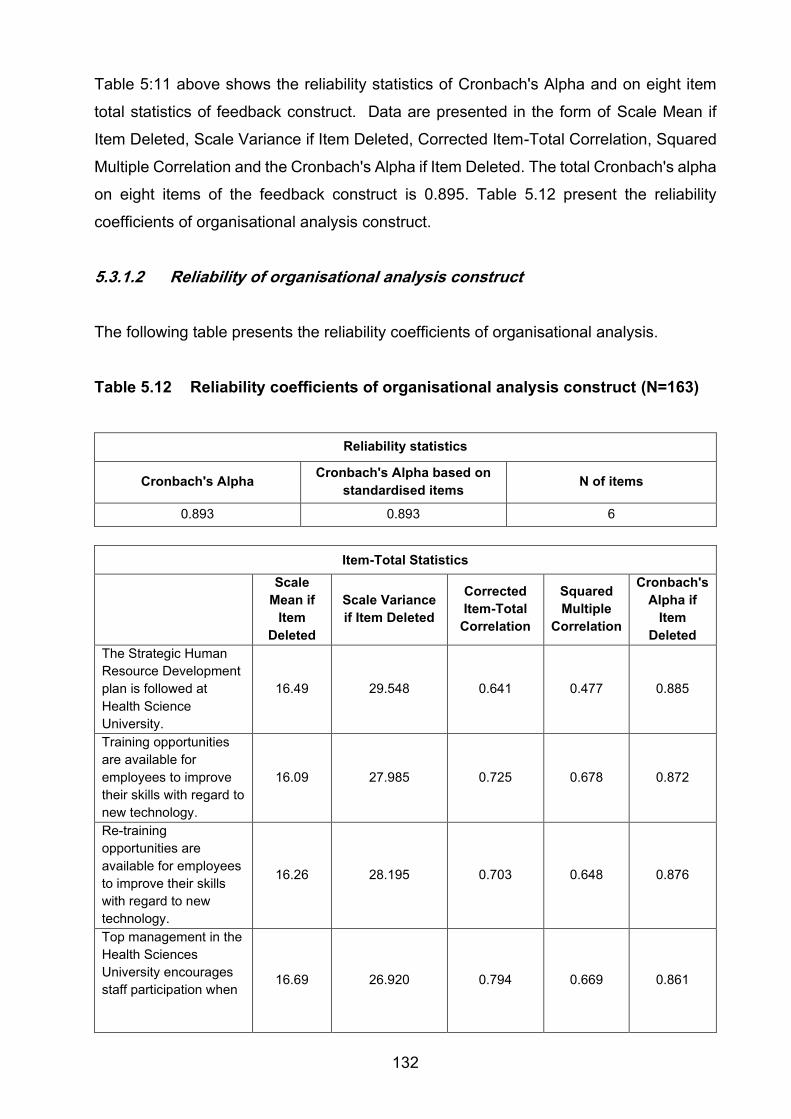
132
Table 5:11 above shows the reliability statistics of Cronbach's Alpha and on eight item
total statistics of feedback construct. Data are presented in the form of Scale Mean if
Item Deleted, Scale Variance if Item Deleted, Corrected Item-Total Correlation, Squared
Multiple Correlation and the Cronbach's Alpha if Item Deleted. The total Cronbach's alpha
on eight items of the feedback construct is 0.895. Table 5.12 present the reliability
coefficients of organisational analysis construct.
5.3.1.2 Reliability of organisational analysis construct
The following table presents the reliability coefficients of organisational analysis.
Table 5.12 Reliability coefficients of organisational analysis construct (N=163)
Reliability statistics
Cronbach's Alpha Cronbach's Alpha based on
standardised items N of items
0.893 0.893 6
Item-Total Statistics
Scale
Mean if
Item
Deleted
Scale Variance
if Item Deleted
Corrected
Item-Total
Correlation
Squared
Multiple
Correlation
Cronbach's
Alpha if
Item
Deleted
The Strategic Human
Resource Development
plan is followed at
Health Science
University.
16.49 29.548 0.641 0.477 0.885
Training opportunities
are available for
employees to improve
their skills with regard to
new technology.
16.09 27.985 0.725 0.678 0.872
Re-training
opportunities are
available for employees
to improve their skills
with regard to new
technology.
16.26 28.195 0.703 0.648 0.876
Top management in the
Health Sciences
University encourages
staff participation when 16.69 26.920 0.794 0.669 0.861
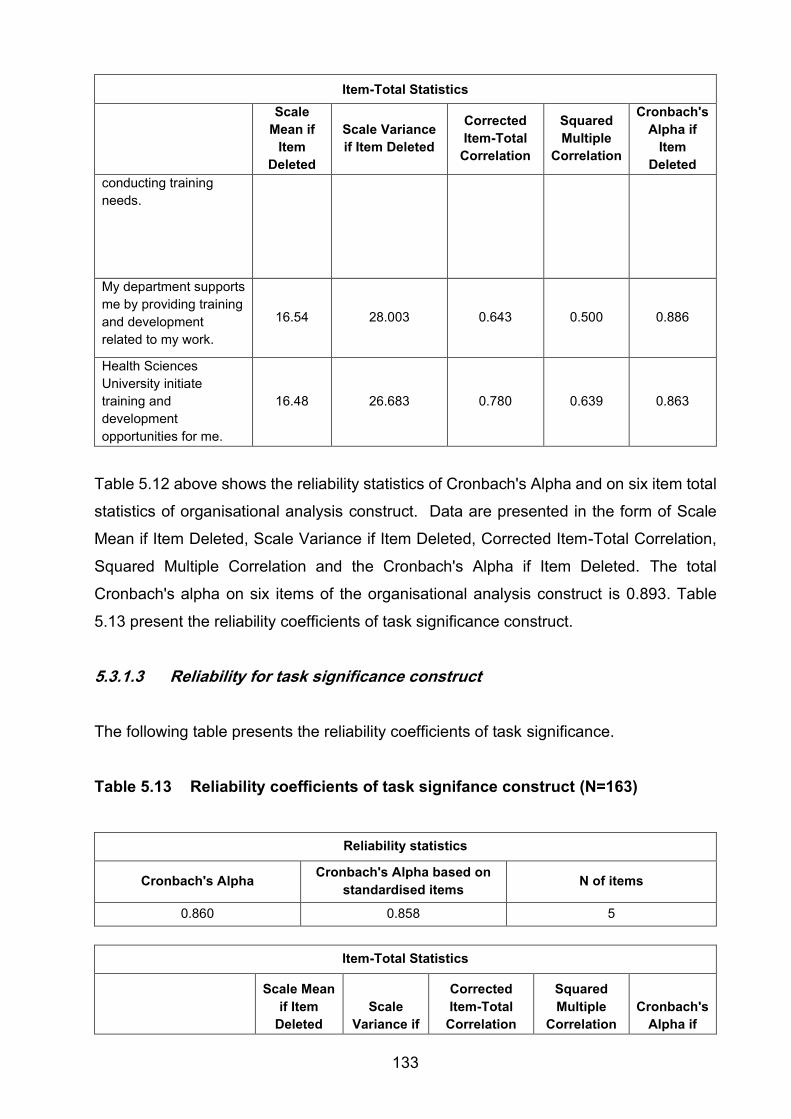
133
Item-Total Statistics
Scale
Mean if
Item
Deleted
Scale Variance
if Item Deleted
Corrected
Item-Total
Correlation
Squared
Multiple
Correlation
Cronbach's
Alpha if
Item
Deleted
conducting training
needs.
My department supports
me by providing training
and development
related to my work.
16.54 28.003 0.643 0.500 0.886
Health Sciences
University initiate
training and
development
opportunities for me.
16.48 26.683 0.780 0.639 0.863
Table 5.12 above shows the reliability statistics of Cronbach's Alpha and on six item total
statistics of organisational analysis construct. Data are presented in the form of Scale
Mean if Item Deleted, Scale Variance if Item Deleted, Corrected Item-Total Correlation,
Squared Multiple Correlation and the Cronbach's Alpha if Item Deleted. The total
Cronbach's alpha on six items of the organisational analysis construct is 0.893. Table
5.13 present the reliability coefficients of task significance construct.
5.3.1.3 Reliability for task significance construct
The following table presents the reliability coefficients of task significance.
Table 5.13 Reliability coefficients of task signifance construct (N=163)
Reliability statistics
Cronbach's Alpha Cronbach's Alpha based on
standardised items N of items
0.860 0.858 5
Item-Total Statistics
Scale Mean
if Item
Deleted
Scale
Variance if
Corrected
Item-Total
Correlation
Squared
Multiple
Correlation
Cronbach's
Alpha if
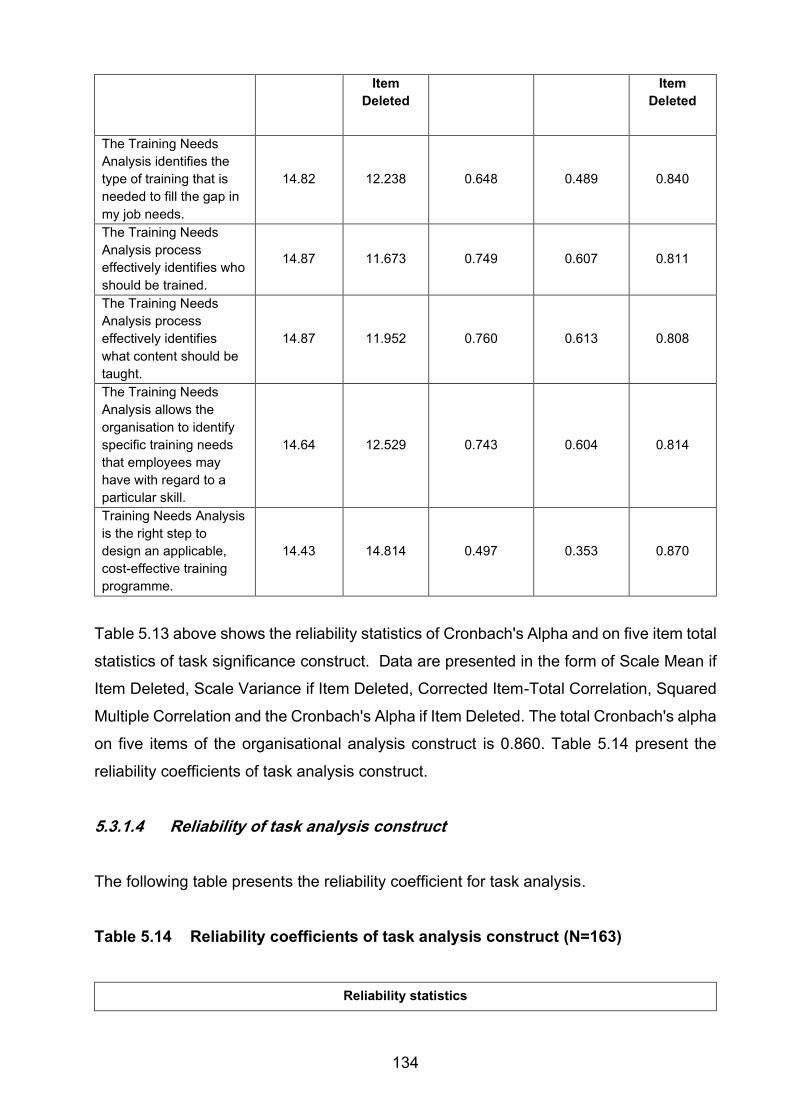
134
Item
Deleted
Item
Deleted
The Training Needs
Analysis identifies the
type of training that is
needed to fill the gap in
my job needs.
14.82 12.238 0.648 0.489 0.840
The Training Needs
Analysis process
effectively identifies who
should be trained.
14.87 11.673 0.749 0.607 0.811
The Training Needs
Analysis process
effectively identifies
what content should be
taught.
14.87 11.952 0.760 0.613 0.808
The Training Needs
Analysis allows the
organisation to identify
specific training needs
that employees may
have with regard to a
particular skill.
14.64 12.529 0.743 0.604 0.814
Training Needs Analysis
is the right step to
design an applicable,
cost-effective training
programme.
14.43 14.814 0.497 0.353 0.870
Table 5.13 above shows the reliability statistics of Cronbach's Alpha and on five item total
statistics of task significance construct. Data are presented in the form of Scale Mean if
Item Deleted, Scale Variance if Item Deleted, Corrected Item-Total Correlation, Squared
Multiple Correlation and the Cronbach's Alpha if Item Deleted. The total Cronbach's alpha
on five items of the organisational analysis construct is 0.860. Table 5.14 present the
reliability coefficients of task analysis construct.
5.3.1.4 Reliability of task analysis construct
The following table presents the reliability coefficient for task analysis.
Table 5.14 Reliability coefficients of task analysis construct (N=163)
Reliability statistics
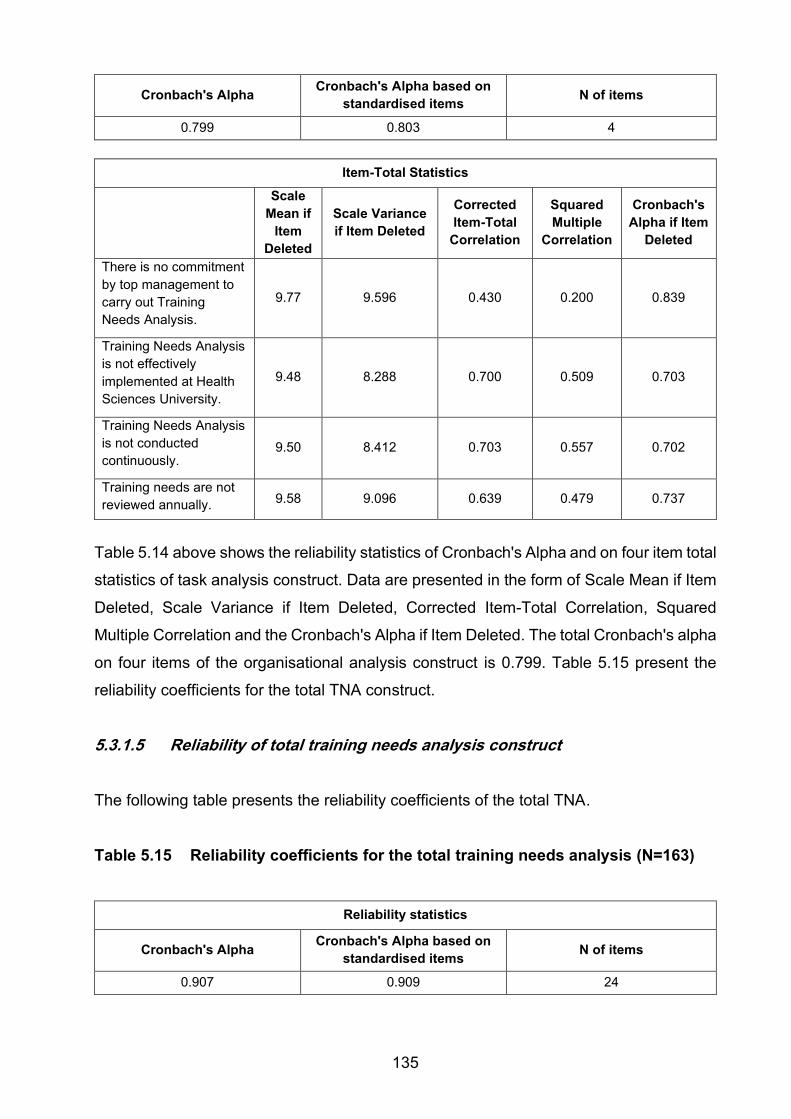
135
Cronbach's Alpha Cronbach's Alpha based on
standardised items N of items
0.799 0.803 4
Item-Total Statistics
Scale
Mean if
Item
Deleted
Scale Variance
if Item Deleted
Corrected
Item-Total
Correlation
Squared
Multiple
Correlation
Cronbach's
Alpha if Item
Deleted
There is no commitment
by top management to
carry out Training
Needs Analysis.
9.77 9.596 0.430 0.200 0.839
Training Needs Analysis
is not effectively
implemented at Health
Sciences University.
9.48 8.288 0.700 0.509 0.703
Training Needs Analysis
is not conducted
continuously. 9.50 8.412 0.703 0.557 0.702
Training needs are not
reviewed annually. 9.58 9.096 0.639 0.479 0.737
Table 5.14 above shows the reliability statistics of Cronbach's Alpha and on four item total
statistics of task analysis construct. Data are presented in the form of Scale Mean if Item
Deleted, Scale Variance if Item Deleted, Corrected Item-Total Correlation, Squared
Multiple Correlation and the Cronbach's Alpha if Item Deleted. The total Cronbach's alpha
on four items of the organisational analysis construct is 0.799. Table 5.15 present the
reliability coefficients for the total TNA construct.
5.3.1.5 Reliability of total training needs analysis construct
The following table presents the reliability coefficients of the total TNA.
Table 5.15 Reliability coefficients for the total training needs analysis (N=163)
Reliability statistics
Cronbach's Alpha Cronbach's Alpha based on
standardised items N of items
0.907 0.909 24
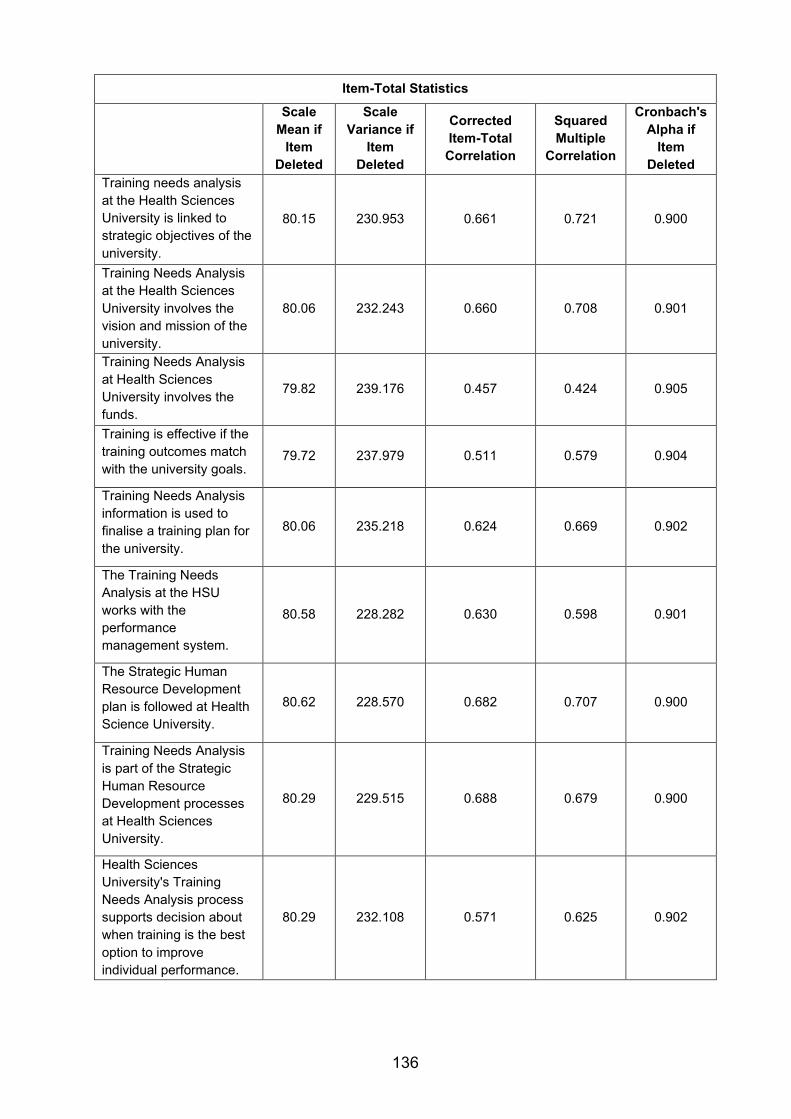
136
Item-Total Statistics
Scale
Mean if
Item
Deleted
Scale
Variance if
Item
Deleted
Corrected
Item-Total
Correlation
Squared
Multiple
Correlation
Cronbach's
Alpha if
Item
Deleted
Training needs analysis
at the Health Sciences
University is linked to
strategic objectives of the
university.
80.15 230.953 0.661 0.721 0.900
Training Needs Analysis
at the Health Sciences
University involves the
vision and mission of the
university.
80.06 232.243 0.660 0.708 0.901
Training Needs Analysis
at Health Sciences
University involves the
funds.
79.82 239.176 0.457 0.424 0.905
Training is effective if the
training outcomes match
with the university goals. 79.72 237.979 0.511 0.579 0.904
Training Needs Analysis
information is used to
finalise a training plan for
the university.
80.06 235.218 0.624 0.669 0.902
The Training Needs
Analysis at the HSU
works with the
performance
management system.
80.58 228.282 0.630 0.598 0.901
The Strategic Human
Resource Development
plan is followed at Health
Science University.
80.62 228.570 0.682 0.707 0.900
Training Needs Analysis
is part of the Strategic
Human Resource
Development processes
at Health Sciences
University.
80.29 229.515 0.688 0.679 0.900
Health Sciences
University's Training
Needs Analysis process
supports decision about
when training is the best
option to improve
individual performance.
80.29 232.108 0.571 0.625 0.902
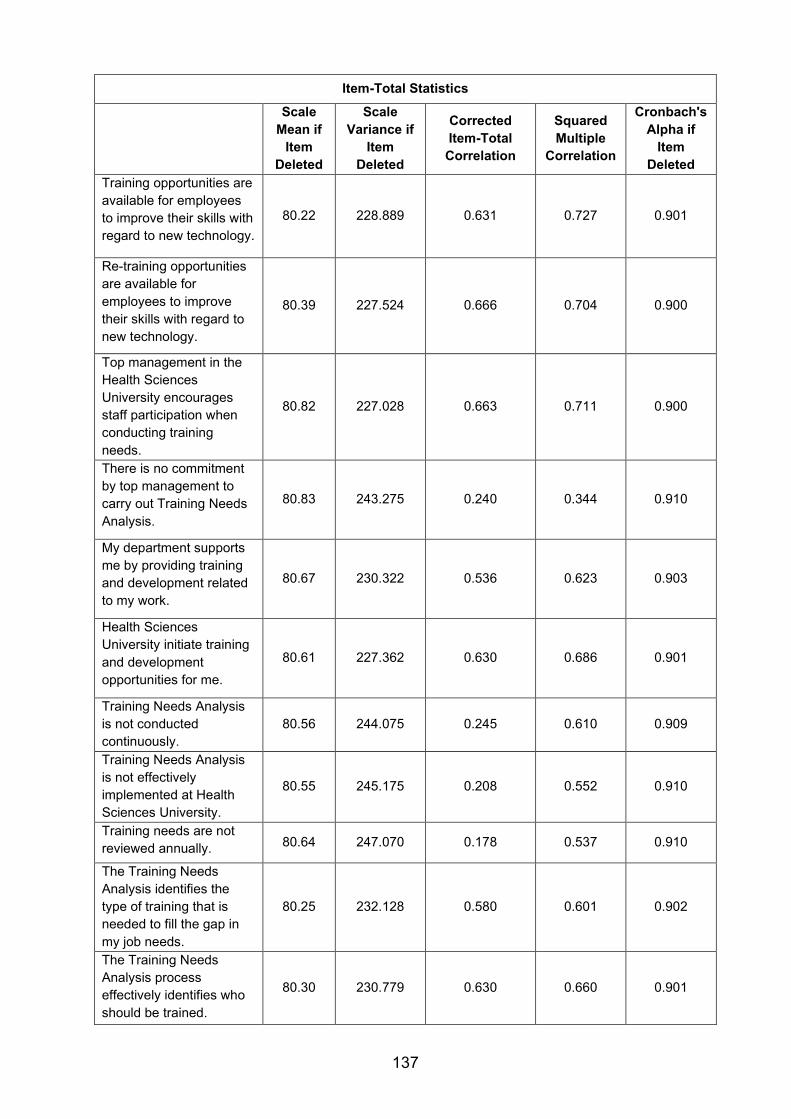
137
Item-Total Statistics
Scale
Mean if
Item
Deleted
Scale
Variance if
Item
Deleted
Corrected
Item-Total
Correlation
Squared
Multiple
Correlation
Cronbach's
Alpha if
Item
Deleted
Training opportunities are
available for employees
to improve their skills with
regard to new technology.
80.22 228.889 0.631 0.727 0.901
Re-training opportunities
are available for
employees to improve
their skills with regard to
new technology.
80.39 227.524 0.666 0.704 0.900
Top management in the
Health Sciences
University encourages
staff participation when
conducting training
needs.
80.82 227.028 0.663 0.711 0.900
There is no commitment
by top management to
carry out Training Needs
Analysis.
80.83 243.275 0.240 0.344 0.910
My department supports
me by providing training
and development related
to my work.
80.67 230.322 0.536 0.623 0.903
Health Sciences
University initiate training
and development
opportunities for me.
80.61 227.362 0.630 0.686 0.901
Training Needs Analysis
is not conducted
continuously.
80.56 244.075 0.245 0.610 0.909
Training Needs Analysis
is not effectively
implemented at Health
Sciences University.
80.55 245.175 0.208 0.552 0.910
Training needs are not
reviewed annually. 80.64 247.070 0.178 0.537 0.910
The Training Needs
Analysis identifies the
type of training that is
needed to fill the gap in
my job needs.
80.25 232.128 0.580 0.601 0.902
The Training Needs
Analysis process
effectively identifies who
should be trained.
80.30 230.779 0.630 0.660 0.901
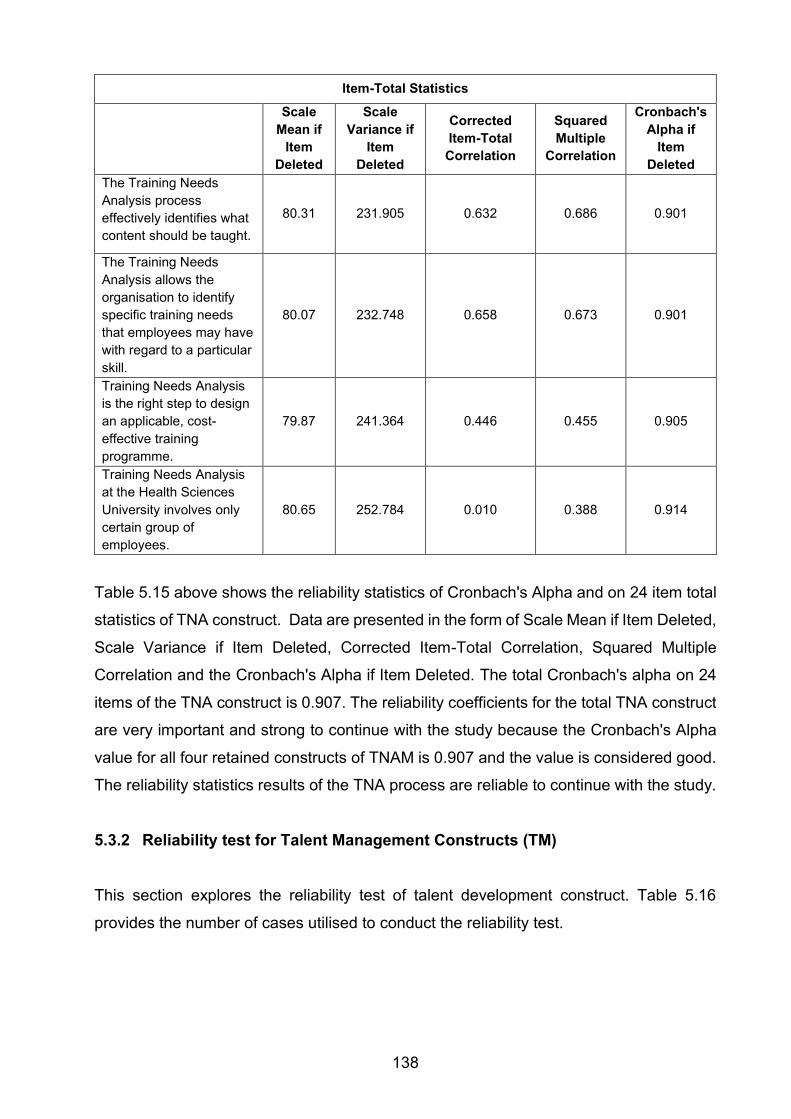
138
Item-Total Statistics
Scale
Mean if
Item
Deleted
Scale
Variance if
Item
Deleted
Corrected
Item-Total
Correlation
Squared
Multiple
Correlation
Cronbach's
Alpha if
Item
Deleted
The Training Needs
Analysis process
effectively identifies what
content should be taught.
80.31 231.905 0.632 0.686 0.901
The Training Needs
Analysis allows the
organisation to identify
specific training needs
that employees may have
with regard to a particular
skill.
80.07 232.748 0.658 0.673 0.901
Training Needs Analysis
is the right step to design
an applicable, cost-
effective training
programme.
79.87 241.364 0.446 0.455 0.905
Training Needs Analysis
at the Health Sciences
University involves only
certain group of
employees.
80.65 252.784 0.010 0.388 0.914
Table 5.15 above shows the reliability statistics of Cronbach's Alpha and on 24 item total
statistics of TNA construct. Data are presented in the form of Scale Mean if Item Deleted,
Scale Variance if Item Deleted, Corrected Item-Total Correlation, Squared Multiple
Correlation and the Cronbach's Alpha if Item Deleted. The total Cronbach's alpha on 24
items of the TNA construct is 0.907. The reliability coefficients for the total TNA construct
are very important and strong to continue with the study because the Cronbach's Alpha
value for all four retained constructs of TNAM is 0.907 and the value is considered good.
The reliability statistics results of the TNA process are reliable to continue with the study.
5.3.2 Reliability test for Talent Management Constructs (TM)
This section explores the reliability test of talent development construct. Table 5.16
provides the number of cases utilised to conduct the reliability test.
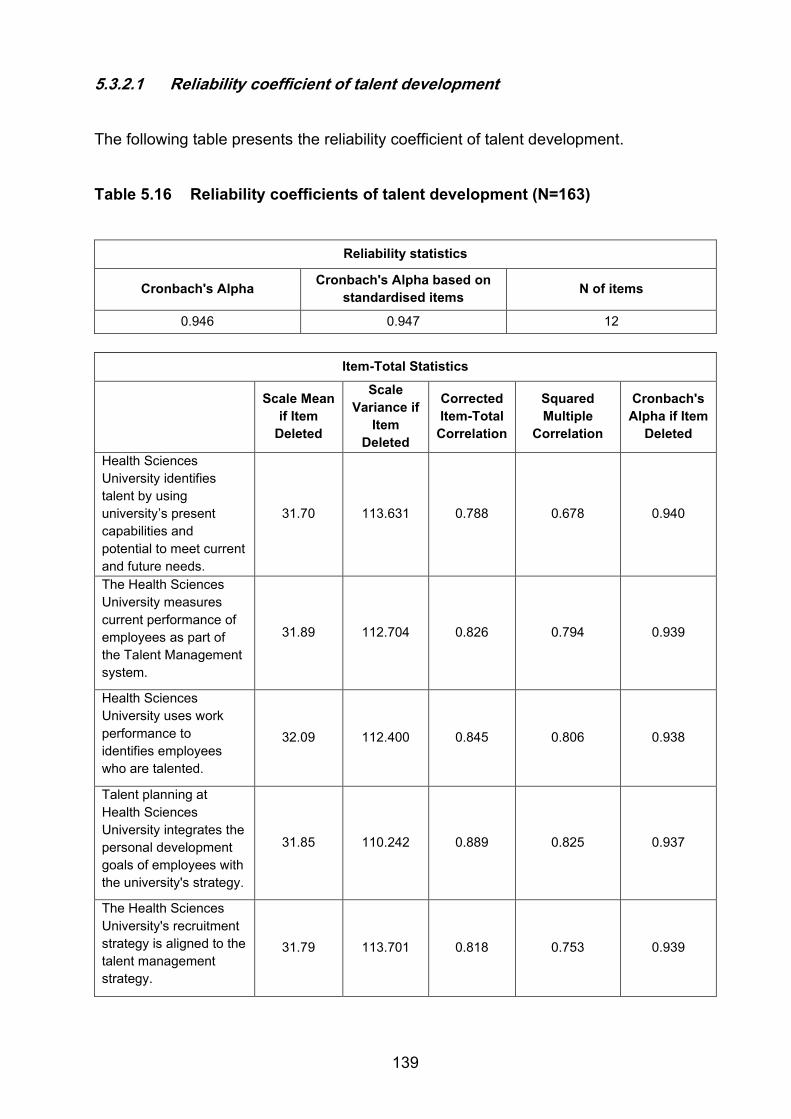
139
5.3.2.1 Reliability coefficient of talent development
The following table presents the reliability coefficient of talent development.
Table 5.16 Reliability coefficients of talent development (N=163)
Reliability statistics
Cronbach's Alpha Cronbach's Alpha based on
standardised items N of items
0.946 0.947 12
Item-Total Statistics
Scale Mean
if Item
Deleted
Scale
Variance if
Item
Deleted
Corrected
Item-Total
Correlation
Squared
Multiple
Correlation
Cronbach's
Alpha if Item
Deleted
Health Sciences
University identifies
talent by using
university’s present
capabilities and
potential to meet current
and future needs.
31.70 113.631 0.788 0.678 0.940
The Health Sciences
University measures
current performance of
employees as part of
the Talent Management
system.
31.89 112.704 0.826 0.794 0.939
Health Sciences
University uses work
performance to
identifies employees
who are talented.
32.09 112.400 0.845 0.806 0.938
Talent planning at
Health Sciences
University integrates the
personal development
goals of employees with
the university's strategy.
31.85 110.242 0.889 0.825 0.937
The Health Sciences
University's recruitment
strategy is aligned to the
talent management
strategy.
31.79 113.701 0.818 0.753 0.939
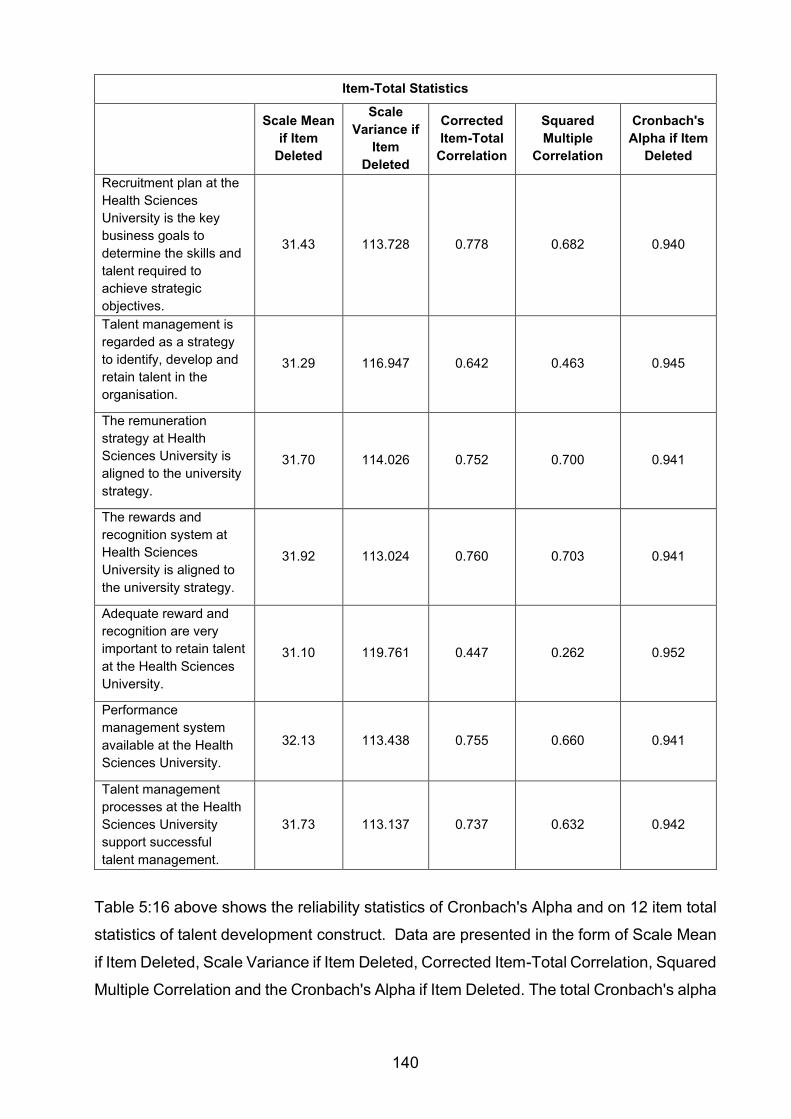
140
Item-Total Statistics
Scale Mean
if Item
Deleted
Scale
Variance if
Item
Deleted
Corrected
Item-Total
Correlation
Squared
Multiple
Correlation
Cronbach's
Alpha if Item
Deleted
Recruitment plan at the
Health Sciences
University is the key
business goals to
determine the skills and
talent required to
achieve strategic
objectives.
31.43 113.728 0.778 0.682 0.940
Talent management is
regarded as a strategy
to identify, develop and
retain talent in the
organisation.
31.29 116.947 0.642 0.463 0.945
The remuneration
strategy at Health
Sciences University is
aligned to the university
strategy.
31.70 114.026 0.752 0.700 0.941
The rewards and
recognition system at
Health Sciences
University is aligned to
the university strategy.
31.92 113.024 0.760 0.703 0.941
Adequate reward and
recognition are very
important to retain talent
at the Health Sciences
University.
31.10 119.761 0.447 0.262 0.952
Performance
management system
available at the Health
Sciences University.
32.13 113.438 0.755 0.660 0.941
Talent management
processes at the Health
Sciences University
support successful
talent management.
31.73 113.137 0.737 0.632 0.942
Table 5:16 above shows the reliability statistics of Cronbach's Alpha and on 12 item total
statistics of talent development construct. Data are presented in the form of Scale Mean
if Item Deleted, Scale Variance if Item Deleted, Corrected Item-Total Correlation, Squared
Multiple Correlation and the Cronbach's Alpha if Item Deleted. The total Cronbach's alpha
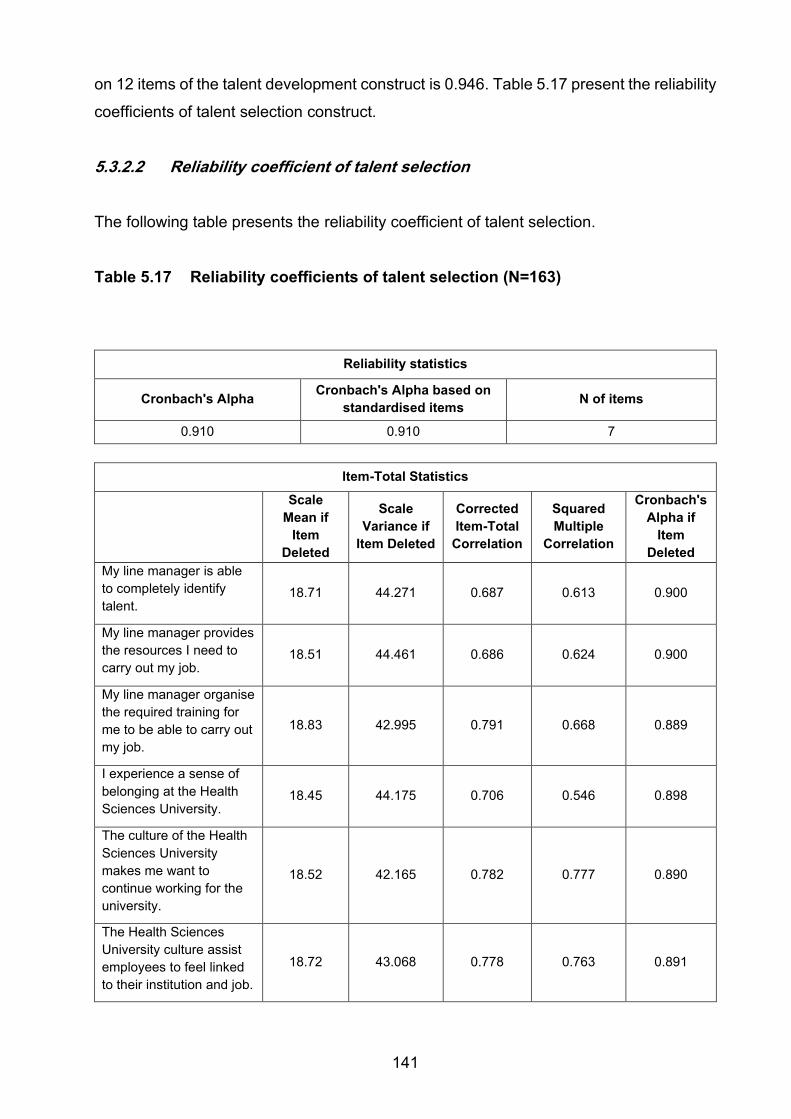
141
on 12 items of the talent development construct is 0.946. Table 5.17 present the reliability
coefficients of talent selection construct.
5.3.2.2 Reliability coefficient of talent selection
The following table presents the reliability coefficient of talent selection.
Table 5.17 Reliability coefficients of talent selection (N=163)
Reliability statistics
Cronbach's Alpha Cronbach's Alpha based on
standardised items N of items
0.910 0.910 7
Item-Total Statistics
Scale
Mean if
Item
Deleted
Scale
Variance if
Item Deleted
Corrected
Item-Total
Correlation
Squared
Multiple
Correlation
Cronbach's
Alpha if
Item
Deleted
My line manager is able
to completely identify
talent. 18.71 44.271 0.687 0.613 0.900
My line manager provides
the resources I need to
carry out my job. 18.51 44.461 0.686 0.624 0.900
My line manager organise
the required training for
me to be able to carry out
my job.
18.83 42.995 0.791 0.668 0.889
I experience a sense of
belonging at the Health
Sciences University. 18.45 44.175 0.706 0.546 0.898
The culture of the Health
Sciences University
makes me want to
continue working for the
university.
18.52 42.165 0.782 0.777 0.890
The Health Sciences
University culture assist
employees to feel linked
to their institution and job.
18.72 43.068 0.778 0.763 0.891
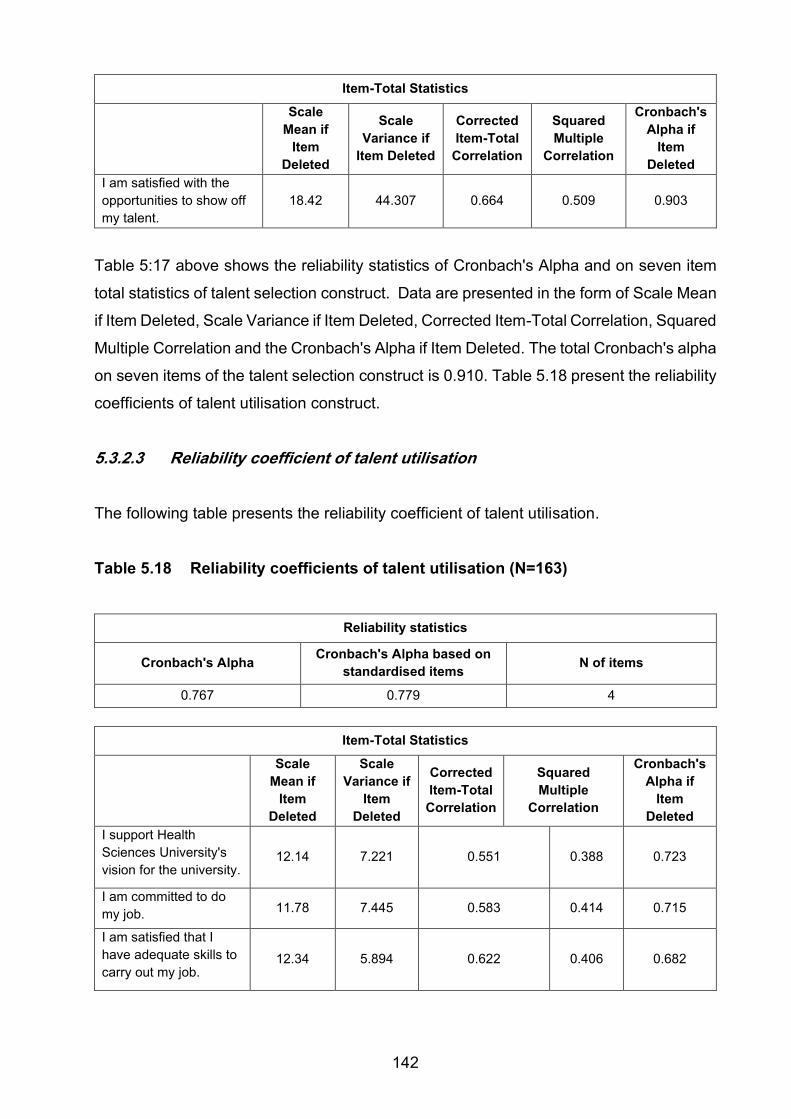
142
Item-Total Statistics
Scale
Mean if
Item
Deleted
Scale
Variance if
Item Deleted
Corrected
Item-Total
Correlation
Squared
Multiple
Correlation
Cronbach's
Alpha if
Item
Deleted
I am satisfied with the
opportunities to show off
my talent.
18.42 44.307 0.664 0.509 0.903
Table 5:17 above shows the reliability statistics of Cronbach's Alpha and on seven item
total statistics of talent selection construct. Data are presented in the form of Scale Mean
if Item Deleted, Scale Variance if Item Deleted, Corrected Item-Total Correlation, Squared
Multiple Correlation and the Cronbach's Alpha if Item Deleted. The total Cronbach's alpha
on seven items of the talent selection construct is 0.910. Table 5.18 present the reliability
coefficients of talent utilisation construct.
5.3.2.3 Reliability coefficient of talent utilisation
The following table presents the reliability coefficient of talent utilisation.
Table 5.18 Reliability coefficients of talent utilisation (N=163)
Reliability statistics
Cronbach's Alpha Cronbach's Alpha based on
standardised items N of items
0.767 0.779 4
Item-Total Statistics
Scale
Mean if
Item
Deleted
Scale
Variance if
Item
Deleted
Corrected
Item-Total
Correlation
Squared
Multiple
Correlation
Cronbach's
Alpha if
Item
Deleted
I support Health
Sciences University's
vision for the university. 12.14 7.221 0.551 0.388 0.723
I am committed to do
my job. 11.78 7.445 0.583 0.414 0.715
I am satisfied that I
have adequate skills to
carry out my job. 12.34 5.894 0.622 0.406 0.682
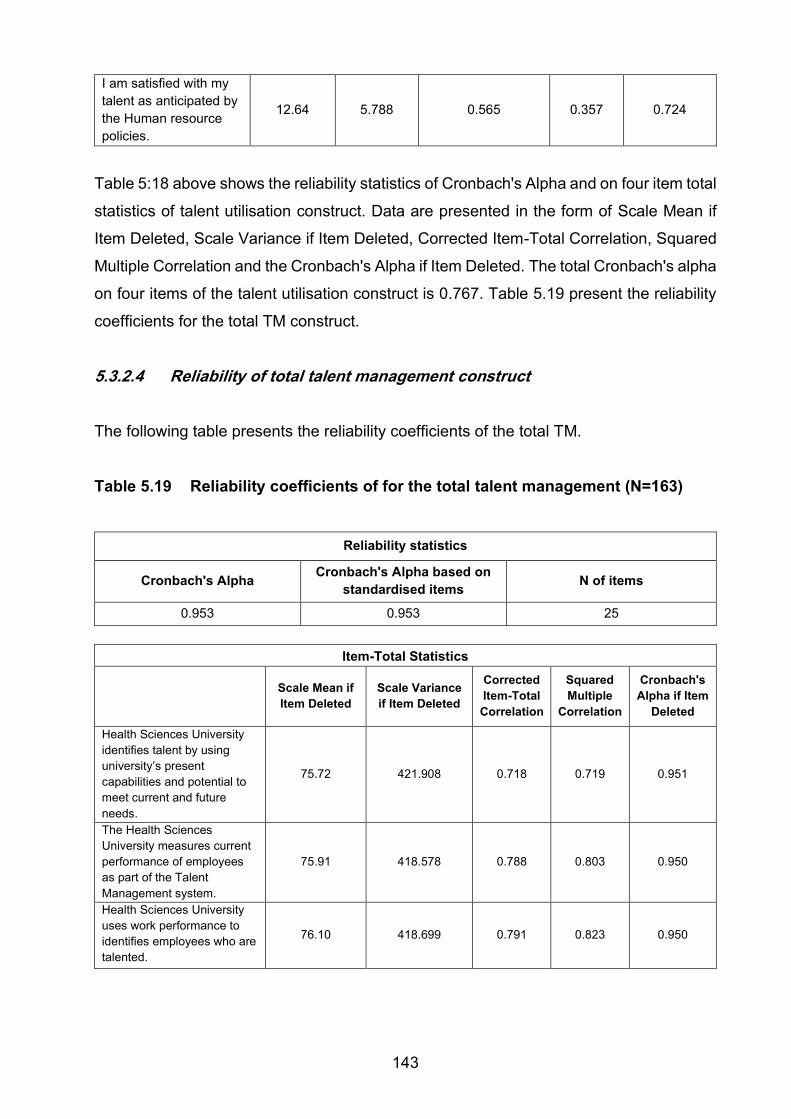
143
I am satisfied with my
talent as anticipated by
the Human resource
policies.
12.64 5.788 0.565 0.357 0.724
Table 5:18 above shows the reliability statistics of Cronbach's Alpha and on four item total
statistics of talent utilisation construct. Data are presented in the form of Scale Mean if
Item Deleted, Scale Variance if Item Deleted, Corrected Item-Total Correlation, Squared
Multiple Correlation and the Cronbach's Alpha if Item Deleted. The total Cronbach's alpha
on four items of the talent utilisation construct is 0.767. Table 5.19 present the reliability
coefficients for the total TM construct.
5.3.2.4 Reliability of total talent management construct
The following table presents the reliability coefficients of the total TM.
Table 5.19 Reliability coefficients of for the total talent management (N=163)
Reliability statistics
Cronbach's Alpha Cronbach's Alpha based on
standardised items N of items
0.953 0.953 25
Item-Total Statistics
Scale Mean if
Item Deleted
Scale Variance
if Item Deleted
Corrected
Item-Total
Correlation
Squared
Multiple
Correlation
Cronbach's
Alpha if Item
Deleted
Health Sciences University
identifies talent by using
university’s present
capabilities and potential to
meet current and future
needs.
75.72 421.908 0.718 0.719 0.951
The Health Sciences
University measures current
performance of employees
as part of the Talent
Management system.
75.91 418.578 0.788 0.803 0.950
Health Sciences University
uses work performance to
identifies employees who are
talented.
76.10 418.699 0.791 0.823 0.950
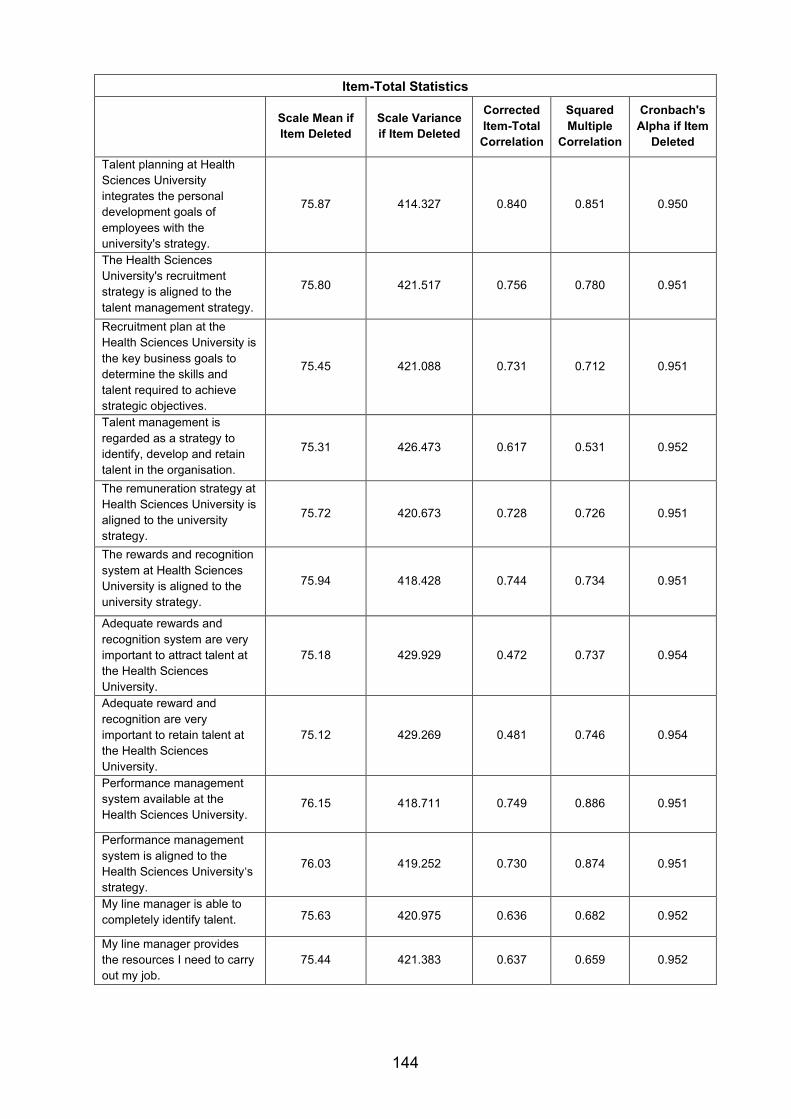
144
Item-Total Statistics
Scale Mean if
Item Deleted
Scale Variance
if Item Deleted
Corrected
Item-Total
Correlation
Squared
Multiple
Correlation
Cronbach's
Alpha if Item
Deleted
Talent planning at Health
Sciences University
integrates the personal
development goals of
employees with the
university's strategy.
75.87 414.327 0.840 0.851 0.950
The Health Sciences
University's recruitment
strategy is aligned to the
talent management strategy.
75.80 421.517 0.756 0.780 0.951
Recruitment plan at the
Health Sciences University is
the key business goals to
determine the skills and
talent required to achieve
strategic objectives.
75.45 421.088 0.731 0.712 0.951
Talent management is
regarded as a strategy to
identify, develop and retain
talent in the organisation.
75.31 426.473 0.617 0.531 0.952
The remuneration strategy at
Health Sciences University is
aligned to the university
strategy.
75.72 420.673 0.728 0.726 0.951
The rewards and recognition
system at Health Sciences
University is aligned to the
university strategy.
75.94 418.428 0.744 0.734 0.951
Adequate rewards and
recognition system are very
important to attract talent at
the Health Sciences
University.
75.18 429.929 0.472 0.737 0.954
Adequate reward and
recognition are very
important to retain talent at
the Health Sciences
University.
75.12 429.269 0.481 0.746 0.954
Performance management
system available at the
Health Sciences University. 76.15 418.711 0.749 0.886 0.951
Performance management
system is aligned to the
Health Sciences University‘s
strategy.
76.03 419.252 0.730 0.874 0.951
My line manager is able to
completely identify talent. 75.63 420.975 0.636 0.682 0.952
My line manager provides
the resources I need to carry
out my job.
75.44 421.383 0.637 0.659 0.952
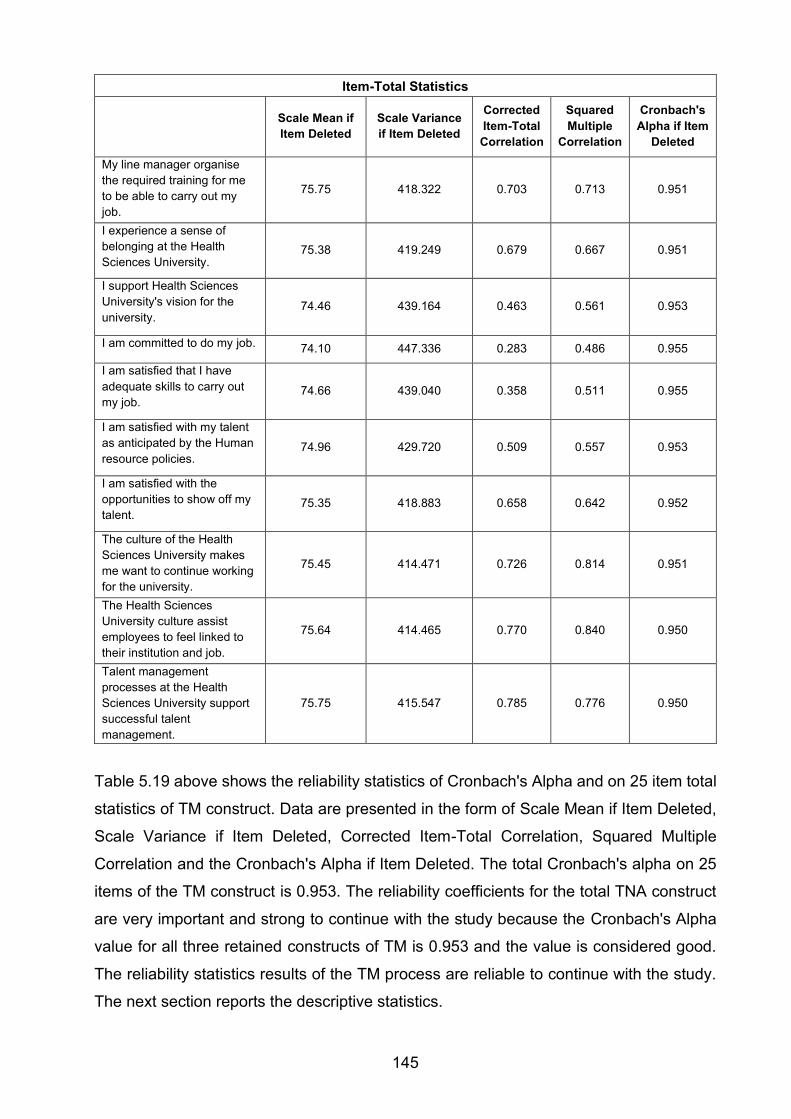
145
Item-Total Statistics
Scale Mean if
Item Deleted
Scale Variance
if Item Deleted
Corrected
Item-Total
Correlation
Squared
Multiple
Correlation
Cronbach's
Alpha if Item
Deleted
My line manager organise
the required training for me
to be able to carry out my
job.
75.75 418.322 0.703 0.713 0.951
I experience a sense of
belonging at the Health
Sciences University. 75.38 419.249 0.679 0.667 0.951
I support Health Sciences
University's vision for the
university. 74.46 439.164 0.463 0.561 0.953
I am committed to do my job. 74.10 447.336 0.283 0.486 0.955
I am satisfied that I have
adequate skills to carry out
my job. 74.66 439.040 0.358 0.511 0.955
I am satisfied with my talent
as anticipated by the Human
resource policies. 74.96 429.720 0.509 0.557 0.953
I am satisfied with the
opportunities to show off my
talent. 75.35 418.883 0.658 0.642 0.952
The culture of the Health
Sciences University makes
me want to continue working
for the university.
75.45 414.471 0.726 0.814 0.951
The Health Sciences
University culture assist
employees to feel linked to
their institution and job.
75.64 414.465 0.770 0.840 0.950
Talent management
processes at the Health
Sciences University support
successful talent
management.
75.75 415.547 0.785 0.776 0.950
Table 5.19 above shows the reliability statistics of Cronbach's Alpha and on 25 item total
statistics of TM construct. Data are presented in the form of Scale Mean if Item Deleted,
Scale Variance if Item Deleted, Corrected Item-Total Correlation, Squared Multiple
Correlation and the Cronbach's Alpha if Item Deleted. The total Cronbach's alpha on 25
items of the TM construct is 0.953. The reliability coefficients for the total TNA construct
are very important and strong to continue with the study because the Cronbach's Alpha
value for all three retained constructs of TM is 0.953 and the value is considered good.
The reliability statistics results of the TM process are reliable to continue with the study.
The next section reports the descriptive statistics.
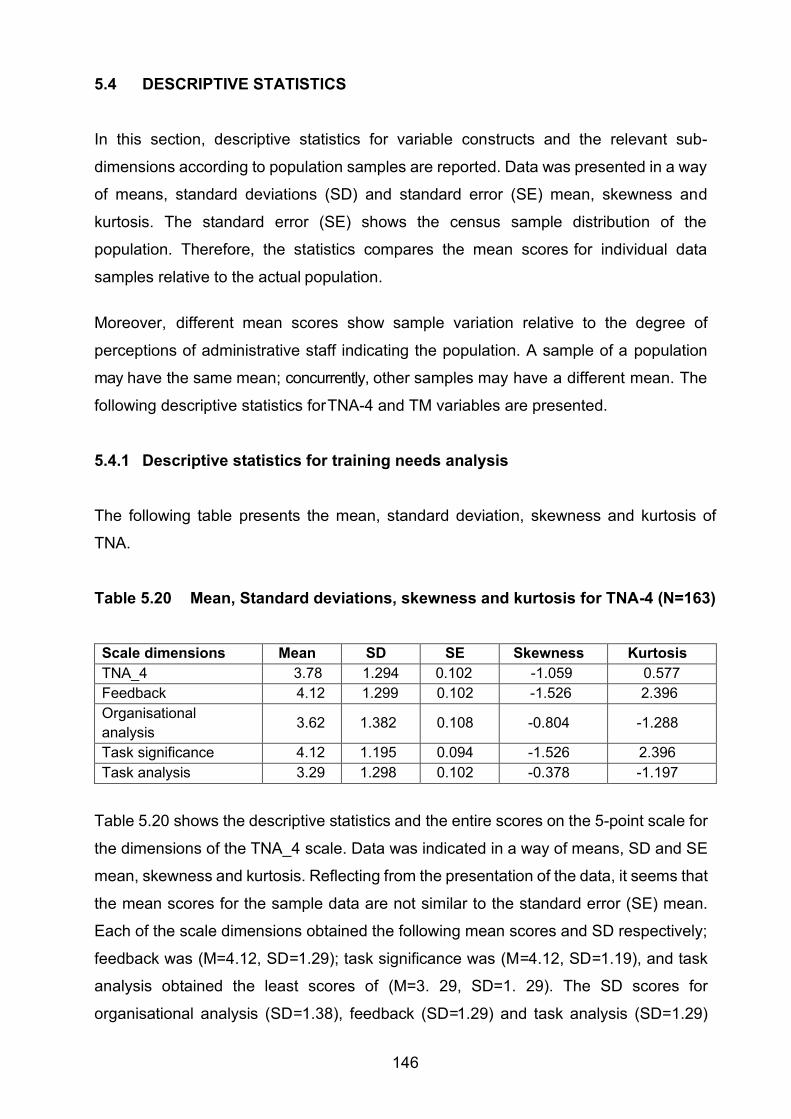
146
5.4 DESCRIPTIVE STATISTICS
In this section, descriptive statistics for variable constructs and the relevant sub-
dimensions according to population samples are reported. Data was presented in a way
of means, standard deviations (SD) and standard error (SE) mean, skewness and
kurtosis. The standard error (SE) shows the census sample distribution of the
population. Therefore, the statistics compares the mean scores for individual data
samples relative to the actual population.
Moreover, different mean scores show sample variation relative to the degree of
perceptions of administrative staff indicating the population. A sample of a population
may have the same mean; concurrently, other samples may have a different mean. The
following descriptive statistics for TNA-4 and TM variables are presented.
5.4.1 Descriptive statistics for training needs analysis
The following table presents the mean, standard deviation, skewness and kurtosis of
TNA.
Table 5.20 Mean, Standard deviations, skewness and kurtosis for TNA-4 (N=163)
Scale dimensions Mean SD SE Skewness Kurtosis
TNA_4 3.78 1.294 0.102 -1.059 0.577
Feedback 4.12 1.299 0.102 -1.526 2.396
Organisational
analysis 3.62 1.382 0.108 -0.804 -1.288
Task significance 4.12 1.195 0.094 -1.526 2.396
Task analysis 3.29 1.298 0.102 -0.378 -1.197
Table 5.20 shows the descriptive statistics and the entire scores on the 5-point scale for
the dimensions of the TNA_4 scale. Data was indicated in a way of means, SD and SE
mean, skewness and kurtosis. Reflecting from the presentation of the data, it seems that
the mean scores for the sample data are not similar to the standard error (SE) mean.
Each of the scale dimensions obtained the following mean scores and SD respectively;
feedback was (M=4.12, SD=1.29); task significance was (M=4.12, SD=1.19), and task
analysis obtained the least scores of (M=3. 29, SD=1. 29). The SD scores for
organisational analysis (SD=1.38), feedback (SD=1.29) and task analysis (SD=1.29)
147
display a comparatively slight deviation comparative to the mean scores of 4.12, 3.62 and
4.12 respectively.
The SD scores for organisational analysis (M=3.62, S =1.38) are above 1, and this
displays a relatively significant deviance from the mean score of the sub-dimensions.
This means that the distribution of the rating scores for the dimension of organisational
analysis has deviated with a number of odd cases. However, compared to the 5-point
scale, the average value of organisational analysis is above 3. This score recommends
that the frequency scores are clustered around the upper values by means of positive
scores (Field, 2009).
The data in Table 5.20 presents variation regarding the perceptions of administrative
staff as compared to the actual population. This variation is validated by the standard
error mean (SE=0.102, SE=0.108, SE=0.094 and SE=0.102). Furthermore, data
variation is more perceived in the entire TNA_4 (M=3.78, SE=1.0), where the mean
scores are comparatively the same to the SE mean. The magnitude of deviation is
relatively small (SD=1.29); hence, it accurately represents variation in the data.
The skewness values of TNA_4 scales indicated that all the scores for the subscales
(feedback, organisational analysis, task significance and task analysis) were negatively
skewed (bounded to the right). The values ranged between -0.378 and -1.526., thus
falling within the -1 and +1 normality range recommended for these coefficients (Field,
2018, Graziano & Raulin, 2014; Howell, 2008). Skewness for the four subscales ranged
between -0.378 and -1.526., thus falling within the -1 and 1 normality range recommended
for these coefficients (Salkind, 2012).
The TNA_4 data scale dimensions scored a high and positive overall kurtosis of 2.3.
Kurtosis values showed that feedback and task significance subscales had a normal
distribution (most scores lie in the middle of the graph) of 2.396. The organisational
analysis and task analysis data scored a negative kurtosis (-1. 288 and -1.197) indicating a
high kurtosis with a flattened shape for the distribution. Therefore, a positive kurtosis value
indicates positive kurtosis whereas a negative one indicates negative kurtosis (Rose et al., 2015).
Finally, in terms of this study, the skewness score for TNA_4 is less skewed, which shows
that the data is not normally distributed.
148
5.4.2 Interpretation of the descriptive results pertaining to training needs analysis
The average mean score of TNA-4 is based on 3.78 and SD on 1.294. The latter data
based on a 3.62 mean rating for organisational analysis, the ratings suggest that, the
respondents perceived that the HSU initiate training and development opportunities for
administrative staff and encourages staff participation when conducting training needs.
Considering the high mean score of 4.12 for feedback, the ratings recommend that
administrative staff observe that the TNA at the HSU involves the vision and mission and
it is linked to the strategic goals of the university. In addition, this suggests that training
needs in office workspaces is very important and needs a feedback for administrative
staff to get the job done. Furthermore, the above mean score of 4.12 for task significance,
recommend that administrative staff observe that the TNA process at the HSU effectively
identifies the actual training needs that are experienced by the administrative staff. In
addition, the administrative staff observe their work to have main penalties for their
managers and touches them in very significant ways (Oldham & Fried, 2016). Therefore,
task significance is an important element of the TNA process in the university.
Lastly, based on the lowest mean score of 3.29 for task analysis, the mediocre ratings
recommend that administrative staff observe that the TNA process at the HSU is not
effectively implemented. In addition, the administrative staff suggest that office work is
important and it requires a task allocation, task complexity or one or more people to
perform a given task.
Taking into account the above discussions, the mean scores are a precise demonstration
of the data with the maximum mediocre score being achieved from the dimensions of
feedback and task significance. Generally, the scores suggest that administrative staff
were given feedback with regard to their identified training needs. Also, that task
significance is very important for them to get the job done.
The descriptive statistics results of TNA process are strong, since, the total mean score
of TNA-4 is 3.78. The next table represents the descriptive statistics of TM.
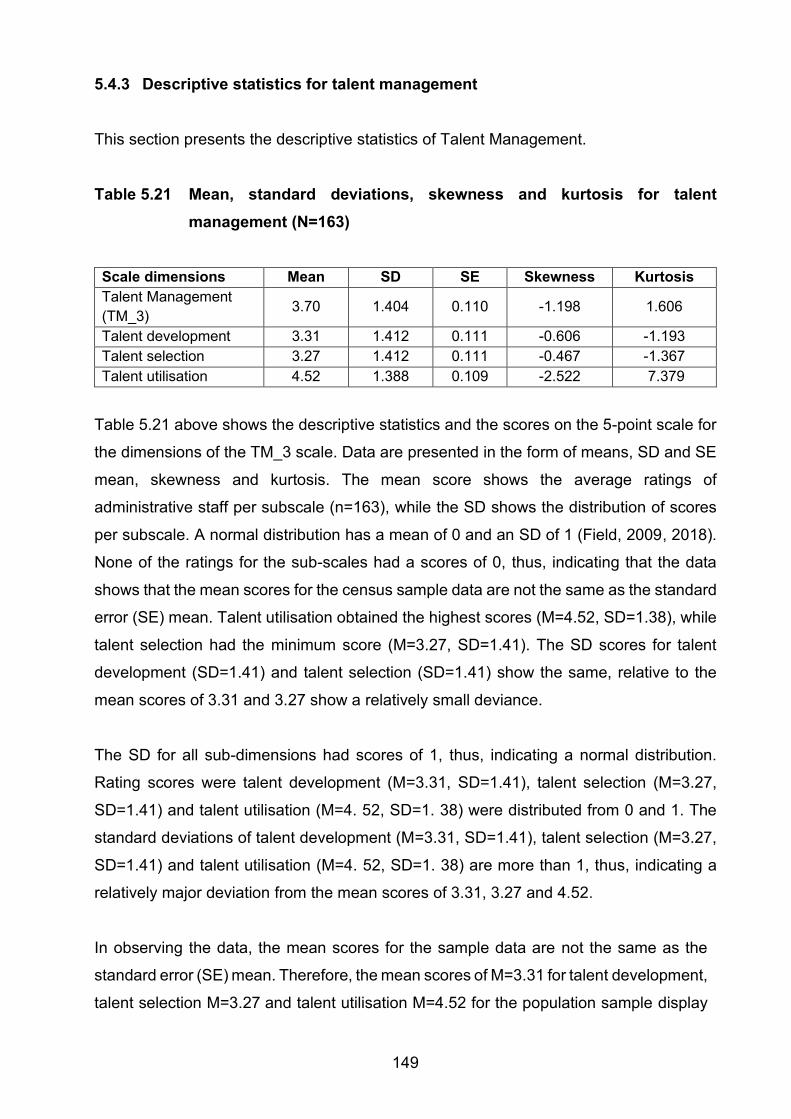
149
5.4.3 Descriptive statistics for talent management
This section presents the descriptive statistics of Talent Management.
Table 5.21 Mean, standard deviations, skewness and kurtosis for talent
management (N=163)
Scale dimensions Mean SD SE Skewness Kurtosis
Talent Management
(TM_3) 3.70 1.404 0.110 -1.198 1.606
Talent development 3.31 1.412 0.111 -0.606 -1.193
Talent selection 3.27 1.412 0.111 -0.467 -1.367
Talent utilisation 4.52 1.388 0.109 -2.522 7.379
Table 5.21 above shows the descriptive statistics and the scores on the 5-point scale for
the dimensions of the TM_3 scale. Data are presented in the form of means, SD and SE
mean, skewness and kurtosis. The mean score shows the average ratings of
administrative staff per subscale (n=163), while the SD shows the distribution of scores
per subscale. A normal distribution has a mean of 0 and an SD of 1 (Field, 2009, 2018).
None of the ratings for the sub-scales had a scores of 0, thus, indicating that the data
shows that the mean scores for the census sample data are not the same as the standard
error (SE) mean. Talent utilisation obtained the highest scores (M=4.52, SD=1.38), while
talent selection had the minimum score (M=3.27, SD=1.41). The SD scores for talent
development (SD=1.41) and talent selection (SD=1.41) show the same, relative to the
mean scores of 3.31 and 3.27 show a relatively small deviance.
The SD for all sub-dimensions had scores of 1, thus, indicating a normal distribution.
Rating scores were talent development (M=3.31, SD=1.41), talent selection (M=3.27,
SD=1.41) and talent utilisation (M=4. 52, SD=1. 38) were distributed from 0 and 1. The
standard deviations of talent development (M=3.31, SD=1.41), talent selection (M=3.27,
SD=1.41) and talent utilisation (M=4. 52, SD=1. 38) are more than 1, thus, indicating a
relatively major deviation from the mean scores of 3.31, 3.27 and 4.52.
In observing the data, the mean scores for the sample data are not the same as the
standard error (SE) mean. Therefore, the mean scores of M=3.31 for talent development,
talent selection M=3.27 and talent utilisation M=4.52 for the population sample display
150
sample variation. Data therefore indicate sample variation in terms of the perceptions of
administrative staff compared to the actual population with SE=0.111, SE=0.111 and
SE=0.109, respectively. However, when observing the scores for talent development,
(SD=1.41), talent selection (SD=1.41) and talent utilisation (SD=1.38) TM, the
magnitude of deviance is relatively small for the sub-dimensions. This is also the case
for the TM score (SD=1.40). These scores authenticate the correct representation of
data. As a result, the scores offset the TM variance seen in the mean (M=3.70) and the
standard error (SE=0.11), where the mean scores are relatively similar to the SE mean.
The magnitude of deviance is relatively small (SD=1.40), and this accurately represents
variation in the data.
The skewness values of TM_3 scales indicated that all the scores for the subscales (talent
development, talent selection, and talent utilisation) were negatively skewed (bounded to
the right). The values ranged between -0.467 and -2.522., thus falling within the -1 and
+1 normality range recommended for these coefficients (Field, 2018, Graziano & Raulin,
2014; Howell, 2016). Skewness for the three subscales ranged between -0.467 and -
2.522., thus falling within the -1 and 1 normality range recommended for these coefficients
(Salkind, 2012).
The TM_3 data scale dimensions scored a high and positive overall kurtosis of 7.3.
Kurtosis values showed that talent utilisation subscales had a normal distribution (scores
lie in the middle of the graph) of 7.379. Talent development and talent selection data
scored a negative kurtosis (-1. 193 and -1.367) indicating a high kurtosis with a flattened shape
for the distribution. Lastly, the skewness score for talent utilisation is highly skewed; this
demonstrates that the data is not normally distributed.
5.4.4 Interpretation of the descriptive results pertaining to talent management
The average mean score of TM is based on 3.70 and SD on 1.404. The above data
based on the high mean score of 4.52 for the talent utilisation sub-dimension suggest that,
the administrative staff are fully committed to their jobs, and to carry out their jobs in
order to support the HSU’s vision. Therefore, the administrative staff strongly agree in
performing their office work in the university.
The mean score of 3.31 (neutral) for talent development, it is slightly positive towards
151
development of talent employees. The ratings suggest that administrative staff perceive that
HSU identifies talent development by using the existing TNA process. As a result,
administrative staff have slightly positive perception towards their talent development
within their office work in the university.
Furthermore, the mean score of 3.27 (neutral) for talent selection, it is slightly positive
towards selection of talent employees. The ratings suggest that administrative staff
perceive that their line managers are able to identify the talent employees. In addition,
administrative staff are slightly positive regarding their talent selection in the university.
Therefore, talent selection plays a huge role and is linked with the talent development
and talent utilisation. However, in all aspects of TM practice, the HSU needs to enhance
their talent selection of administrative staff, as it has scored the lowest mean score of
3.27. These mean scores are an accurate representation of the data with the highest
average score being obtained from talent utilisation. Generally, the score suggest that
administrative staff were committed in their identified training needs in order to get their
job done. The descriptive statistics results of TM practice are good, since, the total mean
score of TM-4 is 3.70.
5.5 CORRELATIONAL ANALYSIS
Correlational analysis was explored to determine the extent to which variables TNAM and
TM, are linked to one another. Correlation coefficient r (Pearson correlation) was
employed to assess the association between variables. The matrix presents the
correlation coefficients for the two variables. The significance value and the sample size
are presented on table 5.22. The coefficients lie between -1 and +1, wherever variables
are flawlessly correlated once r = 1, and adversely correlated when r = -1. Table 5.22
below present the relationship between TNA-4 and TM variables.
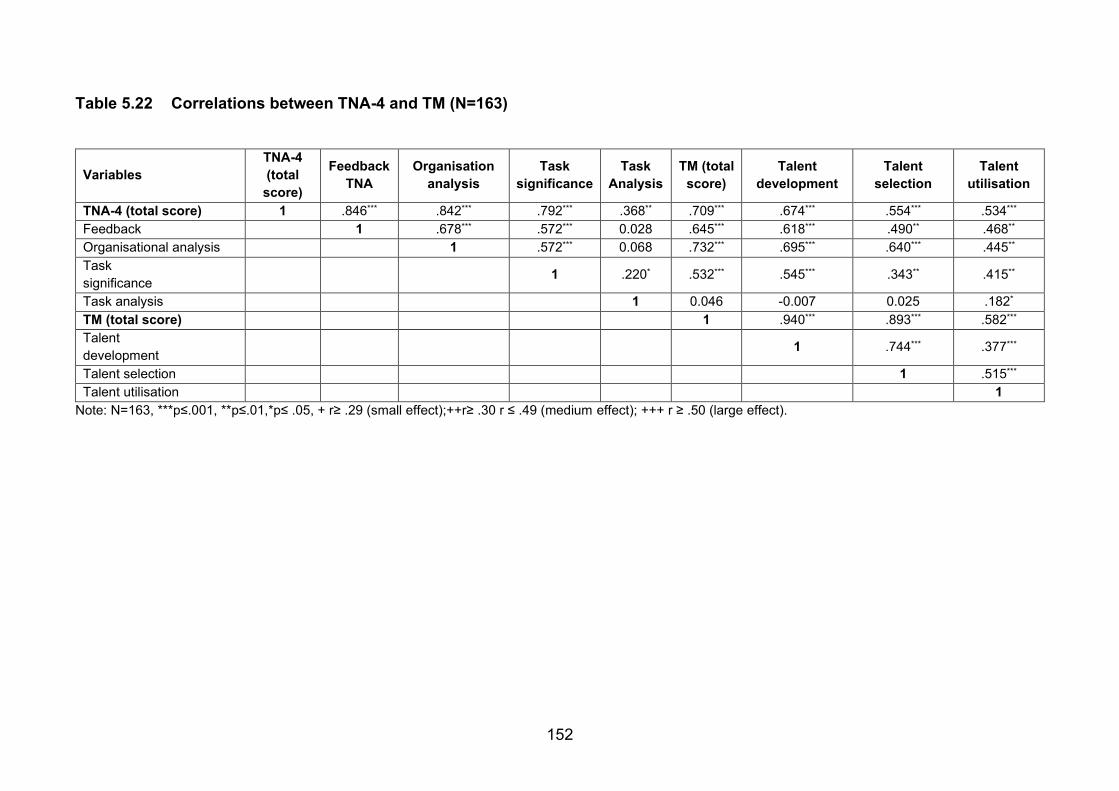
152
Table 5.22 Correlations between TNA-4 and TM (N=163)
Variables
TNA-4
(total
score)
Feedback
TNA
Organisation
analysis
Task
significance
Task
Analysis
TM (total
score)
Talent
development
Talent
selection
Talent
utilisation
TNA-4 (total score) 1 .846*** .842*** .792*** .368** .709*** .674*** .554*** .534***
Feedback 1 .678*** .572*** 0.028 .645*** .618*** .490** .468**
Organisational analysis 1 .572*** 0.068 .732*** .695*** .640*** .445**
Task
significance 1 .220* .532*** .545*** .343** .415**
Task analysis 1 0.046 -0.007 0.025 .182*
TM (total score) 1 .940*** .893*** .582***
Talent
development 1 .744*** .377***
Talent selection 1 .515***
Talent utilisation 1
Note: N=163, ***p≤.001, **p≤.01,*p≤ .05, + r≥ .29 (small effect);++r≥ .30 r ≤ .49 (medium effect); +++ r ≥ .50 (large effect).
153
Table 5.22 presents that the TNA-4 total score, as well as the sub-dimension scores
(feedback, organisational analysis, task significance and task analysis) and TM total
score, as well as the sub-dimensions (talent development, talent selection and talent
utilisation) variables correlated positively and significantly (r≥.182 ≥r ≥.940; a small to
large applied effect; p≤.05).
The findings show that the total TNA correlated significantly, with feedback (r=.846; large
effect; p≤.05), organisational analysis (r=.792; large effect; p≤.05) and task analysis
(r=.368; medium effect; p≤.05) variables. A significant optimistic correlation was found as
well between feedback and organisational analysis (r=.678; large effect; p≤.05), task
significance (r=.572; large effect; p≤.05) variables. A significant optimistic correlation was
found as well between organisational analysis and task significance (r=.572; large effect;
p≤.05) variables. A significant positive correlation was found also among task significance
and task analysis (r=.20; small effect; p≤.05).
The findings demonstrate that total TM correlated significantly, with talent development
(r=.940; large effect; p≤.05), talent selection (r=.893; large effect; p≤.05) and talent
utilisation (r=.582; large effect; p≤.05) variables. A significant positive correlation was
found also between talent development and talent selection (r=.744; large effect; p≤.05),
talent utilisation (r=.377; medium effect; p≤.05) variables. A significant positive correlation
was found also among talent selection and talent utilisation (r=.515; large effect; p≤.05)
variables.
The findings demonstrate that total TNA correlated significantly, with the total TM (r=.709;
large effect; p≤.05), talent development (r=.674; large effect; p≤.05), talent selection
(r=.554; large effect; p≤.05) and talent utilisation (r=.534; large effect; p≤0.05) variables.
A significant positive correlation was found as well between feedback and the entire TM
(r=.645; large effect; p ≤ .05), talent development (r=.618; large effect; p≤.05), talent
selection (r=.490; medium effect; p≤.05) and talent utilisation (r=.468; medium effect;
p≤0.05) variables.
A significant positive correlation was found as well between organisation analysis and the
total TM (r=.732; large effect; p≤.05), talent development (r=.695; large effect; p≤.05),
154
talent selection (r=.640; large effect; p≤.05) and Talent utilisation (r=.445; medium effect;
p≤0.05) variables.
A significant positive correlation was found as well between task significance and total
TM (r=.532; large effect; p≤.05), talent development (r=.545; large effect; p≤.05), talent
selection (r=.343; medium effect; p ≤ .05) and talent utilisation (r=.415; medium effect;
p≤0.05) variables. A significant positive correlation was found as well between task
significance and task analysis (r=.185; small effect; p≤.05).
The above findings are used to test the null hypothesis.
Ho1 tests under correlation analysis between the TNA process and TM practice variables
is a strong, significant and positive relationship. The hypothesis is as follow:
1. Ho1: There is no relationship between the TNA process and TM practices in the
HSU.
Based on the results, the null hypothesis is rejected, because it is true, there is a strong,
significant, and positive relationship between the TNA process and the TM practice on a
total score of 0.709. The following section reports on the test for significant mean
differences.
5.6 TEST FOR SIGNIFICANT MEAN DIFFERENCES
5.6.1 The Mann-Whitney U test
This section reports on the findings of the Mann-Whitney test conducted with the objective
to display the differences in the ranked positions of scores in different groups (Field,
2018). The Mann-Whitney test relies on scores being ranked from the lowest to highest.
The Tables below, presents the Mann-Whitney test statistic for significant mean
differences in terms of the TNA process for age, gender, job title, educational level, job
level and tenure.
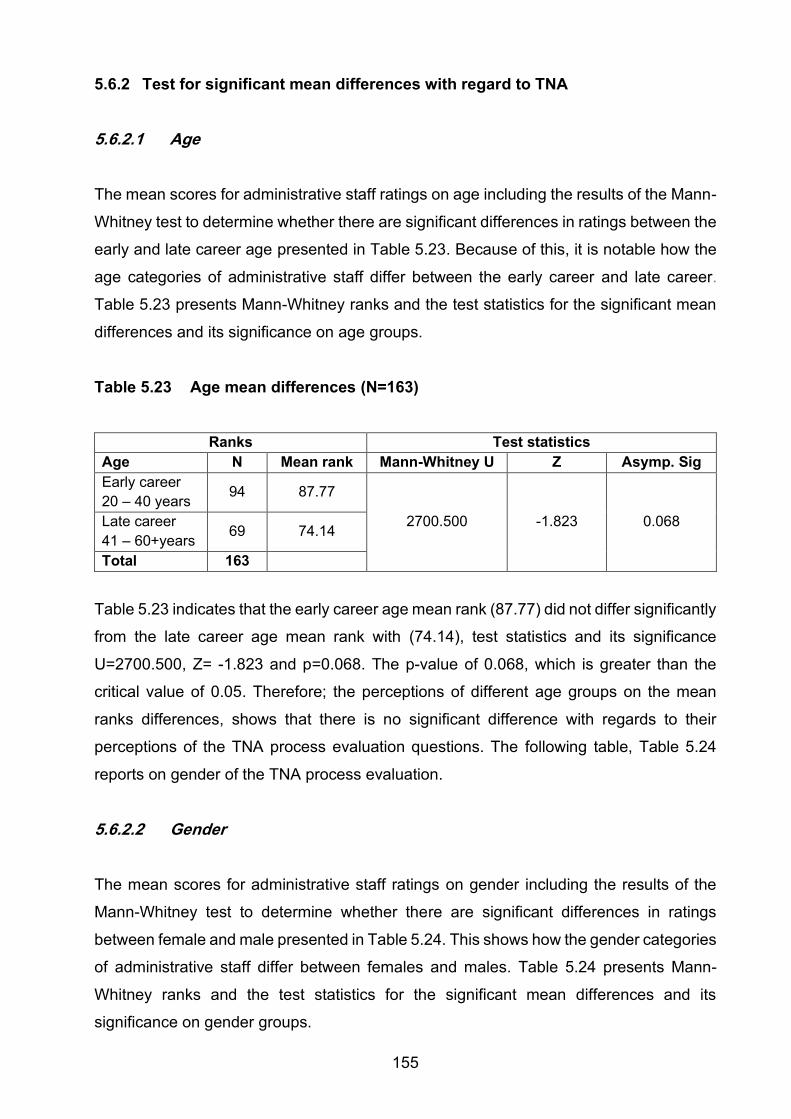
155
5.6.2 Test for significant mean differences with regard to TNA
5.6.2.1 Age
The mean scores for administrative staff ratings on age including the results of the Mann-
Whitney test to determine whether there are significant differences in ratings between the
early and late career age presented in Table 5.23. Because of this, it is notable how the
age categories of administrative staff differ between the early career and late career.
Table 5.23 presents Mann-Whitney ranks and the test statistics for the significant mean
differences and its significance on age groups.
Table 5.23 Age mean differences (N=163)
Ranks Test statistics
Age N Mean rank Mann-Whitney U Z Asymp. Sig
Early career
20 – 40 years 94 87.77
2700.500 -1.823 0.068 Late career
41 – 60+years 69 74.14
Total 163
Table 5.23 indicates that the early career age mean rank (87.77) did not differ significantly
from the late career age mean rank with (74.14), test statistics and its significance
U=2700.500, Z= -1.823 and p=0.068. The p-value of 0.068, which is greater than the
critical value of 0.05. Therefore; the perceptions of different age groups on the mean
ranks differences, shows that there is no significant difference with regards to their
perceptions of the TNA process evaluation questions. The following table, Table 5.24
reports on gender of the TNA process evaluation.
5.6.2.2 Gender
The mean scores for administrative staff ratings on gender including the results of the
Mann-Whitney test to determine whether there are significant differences in ratings
between female and male presented in Table 5.24. This shows how the gender categories
of administrative staff differ between females and males. Table 5.24 presents Mann-
Whitney ranks and the test statistics for the significant mean differences and its
significance on gender groups.
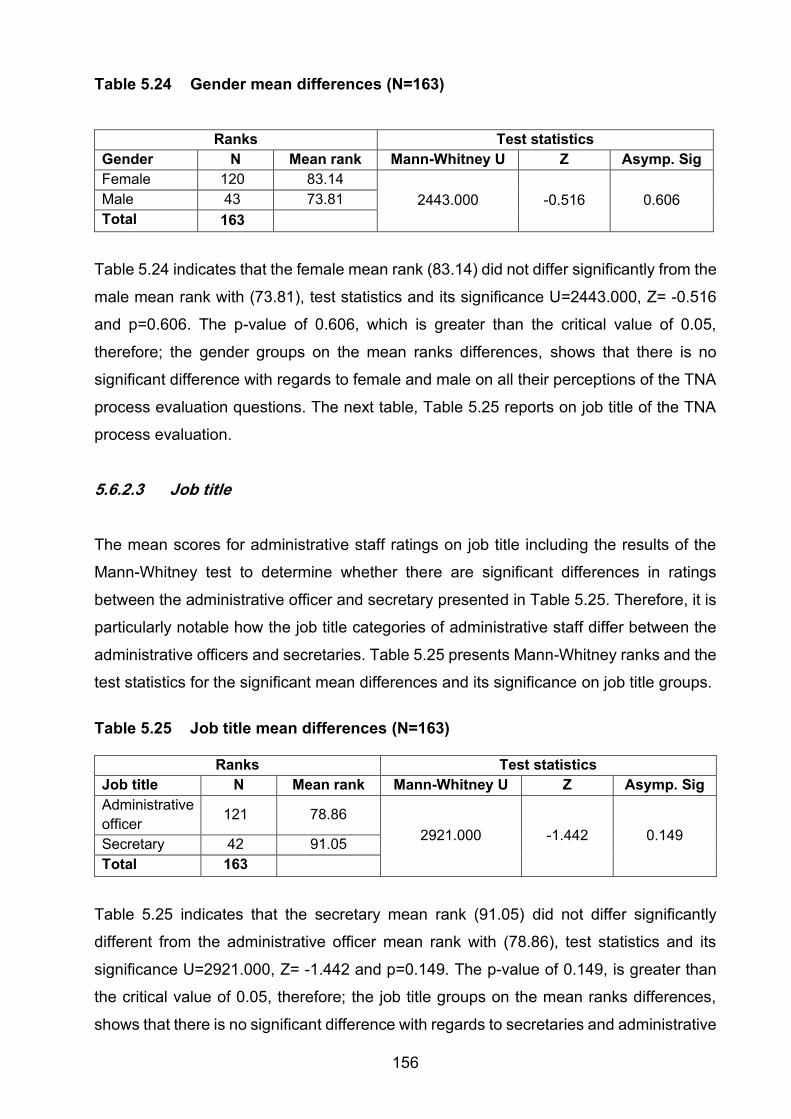
156
Table 5.24 Gender mean differences (N=163)
Ranks Test statistics
Gender N Mean rank Mann-Whitney U Z Asymp. Sig
Female 120 83.14
2443.000 -0.516 0.606 Male 43 73.81
Total 163
Table 5.24 indicates that the female mean rank (83.14) did not differ significantly from the
male mean rank with (73.81), test statistics and its significance U=2443.000, Z= -0.516
and p=0.606. The p-value of 0.606, which is greater than the critical value of 0.05,
therefore; the gender groups on the mean ranks differences, shows that there is no
significant difference with regards to female and male on all their perceptions of the TNA
process evaluation questions. The next table, Table 5.25 reports on job title of the TNA
process evaluation.
5.6.2.3 Job title
The mean scores for administrative staff ratings on job title including the results of the
Mann-Whitney test to determine whether there are significant differences in ratings
between the administrative officer and secretary presented in Table 5.25. Therefore, it is
particularly notable how the job title categories of administrative staff differ between the
administrative officers and secretaries. Table 5.25 presents Mann-Whitney ranks and the
test statistics for the significant mean differences and its significance on job title groups.
Table 5.25 Job title mean differences (N=163)
Ranks Test statistics
Job title N Mean rank Mann-Whitney U Z Asymp. Sig
Administrative
officer 121 78.86
2921.000 -1.442 0.149 Secretary 42 91.05
Total 163
Table 5.25 indicates that the secretary mean rank (91.05) did not differ significantly
different from the administrative officer mean rank with (78.86), test statistics and its
significance U=2921.000, Z= -1.442 and p=0.149. The p-value of 0.149, is greater than
the critical value of 0.05, therefore; the job title groups on the mean ranks differences,
shows that there is no significant difference with regards to secretaries and administrative
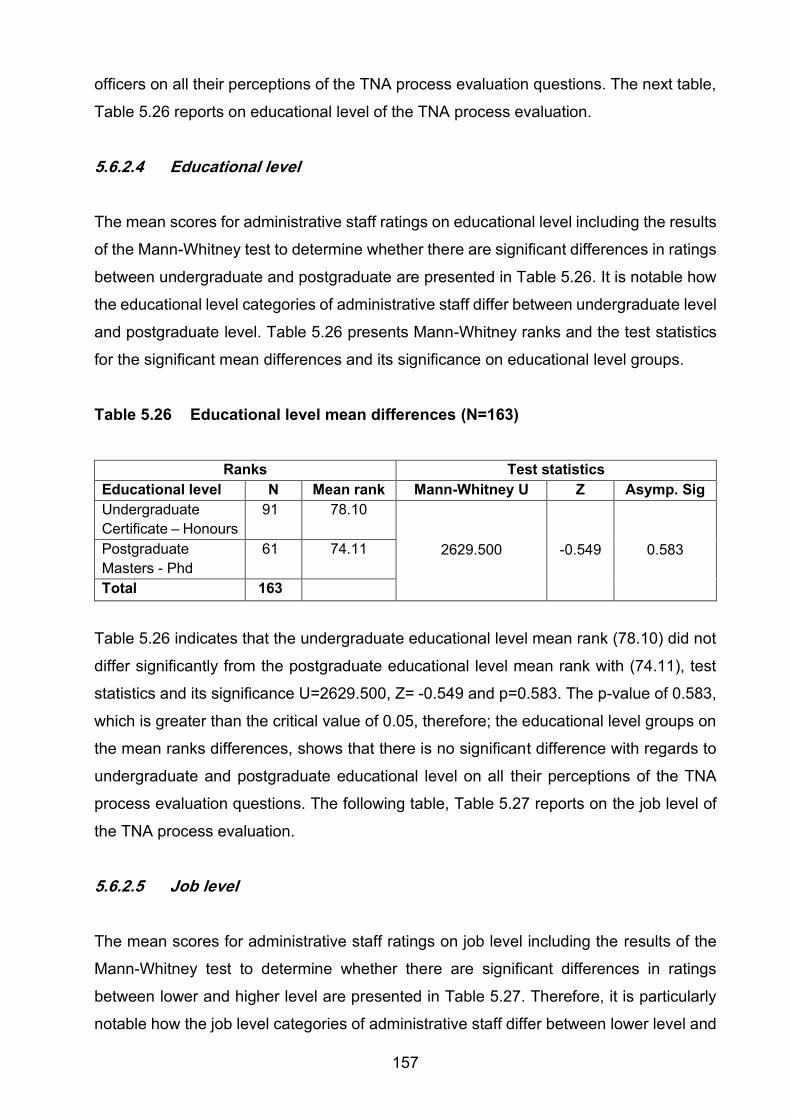
157
officers on all their perceptions of the TNA process evaluation questions. The next table,
Table 5.26 reports on educational level of the TNA process evaluation.
5.6.2.4 Educational level
The mean scores for administrative staff ratings on educational level including the results
of the Mann-Whitney test to determine whether there are significant differences in ratings
between undergraduate and postgraduate are presented in Table 5.26. It is notable how
the educational level categories of administrative staff differ between undergraduate level
and postgraduate level. Table 5.26 presents Mann-Whitney ranks and the test statistics
for the significant mean differences and its significance on educational level groups.
Table 5.26 Educational level mean differences (N=163)
Ranks Test statistics
Educational level N Mean rank Mann-Whitney U Z Asymp. Sig
Undergraduate
Certificate – Honours
91 78.10
2629.500 -0.549 0.583 Postgraduate
Masters - Phd
61 74.11
Total 163
Table 5.26 indicates that the undergraduate educational level mean rank (78.10) did not
differ significantly from the postgraduate educational level mean rank with (74.11), test
statistics and its significance U=2629.500, Z= -0.549 and p=0.583. The p-value of 0.583,
which is greater than the critical value of 0.05, therefore; the educational level groups on
the mean ranks differences, shows that there is no significant difference with regards to
undergraduate and postgraduate educational level on all their perceptions of the TNA
process evaluation questions. The following table, Table 5.27 reports on the job level of
the TNA process evaluation.
5.6.2.5 Job level
The mean scores for administrative staff ratings on job level including the results of the
Mann-Whitney test to determine whether there are significant differences in ratings
between lower and higher level are presented in Table 5.27. Therefore, it is particularly
notable how the job level categories of administrative staff differ between lower level and
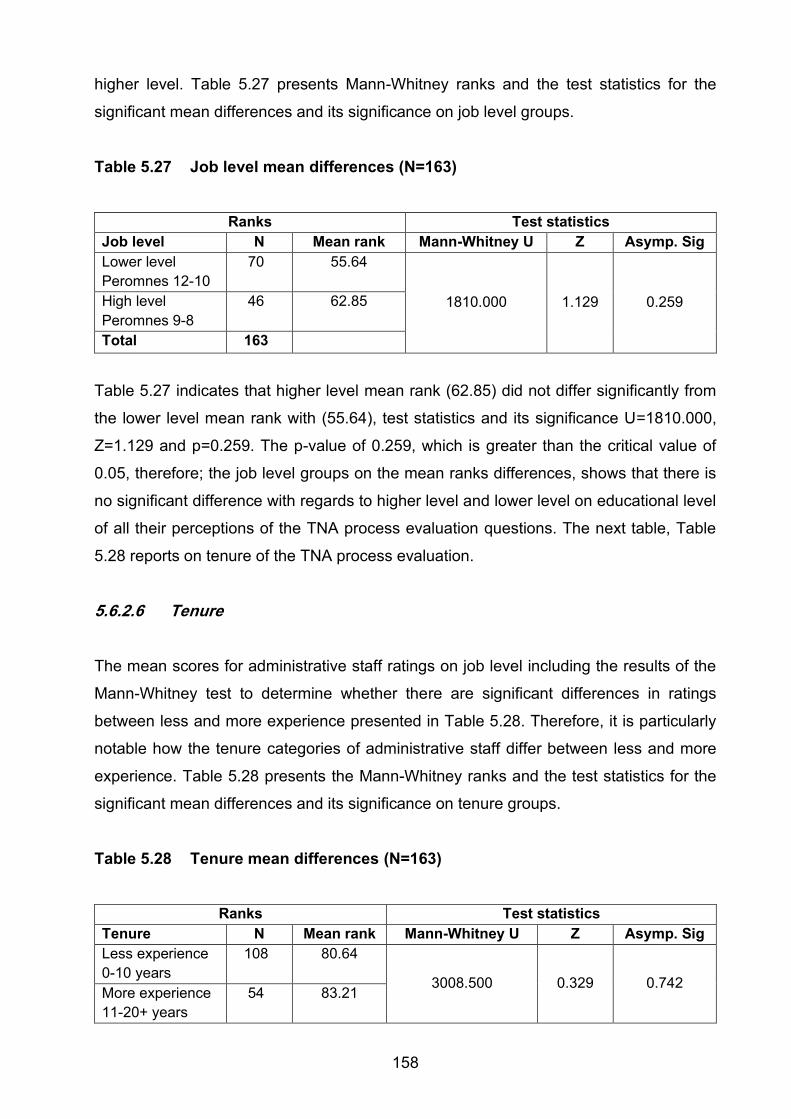
158
higher level. Table 5.27 presents Mann-Whitney ranks and the test statistics for the
significant mean differences and its significance on job level groups.
Table 5.27 Job level mean differences (N=163)
Ranks Test statistics
Job level N Mean rank Mann-Whitney U Z Asymp. Sig
Lower level
Peromnes 12-10
70 55.64
1810.000 1.129 0.259 High level
Peromnes 9-8
46 62.85
Total 163
Table 5.27 indicates that higher level mean rank (62.85) did not differ significantly from
the lower level mean rank with (55.64), test statistics and its significance U=1810.000,
Z=1.129 and p=0.259. The p-value of 0.259, which is greater than the critical value of
0.05, therefore; the job level groups on the mean ranks differences, shows that there is
no significant difference with regards to higher level and lower level on educational level
of all their perceptions of the TNA process evaluation questions. The next table, Table
5.28 reports on tenure of the TNA process evaluation.
5.6.2.6 Tenure
The mean scores for administrative staff ratings on job level including the results of the
Mann-Whitney test to determine whether there are significant differences in ratings
between less and more experience presented in Table 5.28. Therefore, it is particularly
notable how the tenure categories of administrative staff differ between less and more
experience. Table 5.28 presents the Mann-Whitney ranks and the test statistics for the
significant mean differences and its significance on tenure groups.
Table 5.28 Tenure mean differences (N=163)
Ranks Test statistics
Tenure N Mean rank Mann-Whitney U Z Asymp. Sig
Less experience
0-10 years
108 80.64
3008.500 0.329 0.742 More experience
11-20+ years
54 83.21
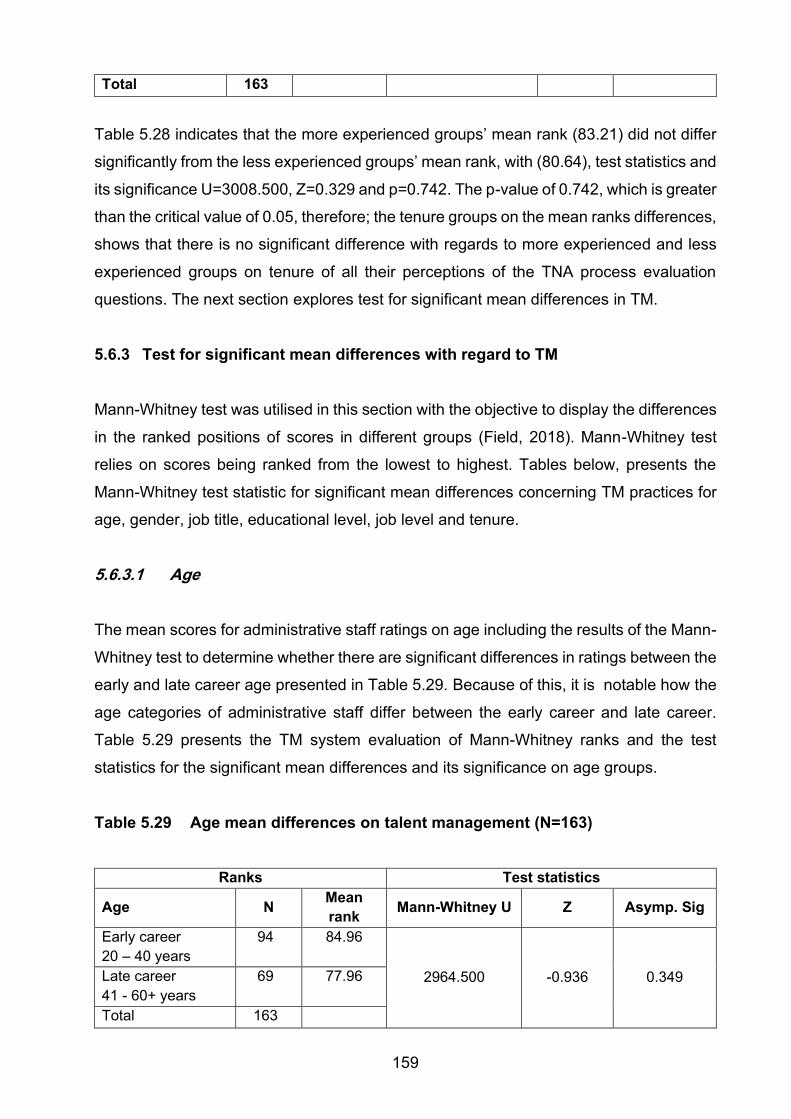
159
Total 163
Table 5.28 indicates that the more experienced groups’ mean rank (83.21) did not differ
significantly from the less experienced groups’ mean rank, with (80.64), test statistics and
its significance U=3008.500, Z=0.329 and p=0.742. The p-value of 0.742, which is greater
than the critical value of 0.05, therefore; the tenure groups on the mean ranks differences,
shows that there is no significant difference with regards to more experienced and less
experienced groups on tenure of all their perceptions of the TNA process evaluation
questions. The next section explores test for significant mean differences in TM.
5.6.3 Test for significant mean differences with regard to TM
Mann-Whitney test was utilised in this section with the objective to display the differences
in the ranked positions of scores in different groups (Field, 2018). Mann-Whitney test
relies on scores being ranked from the lowest to highest. Tables below, presents the
Mann-Whitney test statistic for significant mean differences concerning TM practices for
age, gender, job title, educational level, job level and tenure.
5.6.3.1 Age
The mean scores for administrative staff ratings on age including the results of the Mann-
Whitney test to determine whether there are significant differences in ratings between the
early and late career age presented in Table 5.29. Because of this, it is notable how the
age categories of administrative staff differ between the early career and late career.
Table 5.29 presents the TM system evaluation of Mann-Whitney ranks and the test
statistics for the significant mean differences and its significance on age groups.
Table 5.29 Age mean differences on talent management (N=163)
Ranks Test statistics
Age N Mean
rank Mann-Whitney U Z Asymp. Sig
Early career
20 – 40 years
94 84.96
2964.500 -0.936 0.349 Late career
41 - 60+ years
69 77.96
Total 163
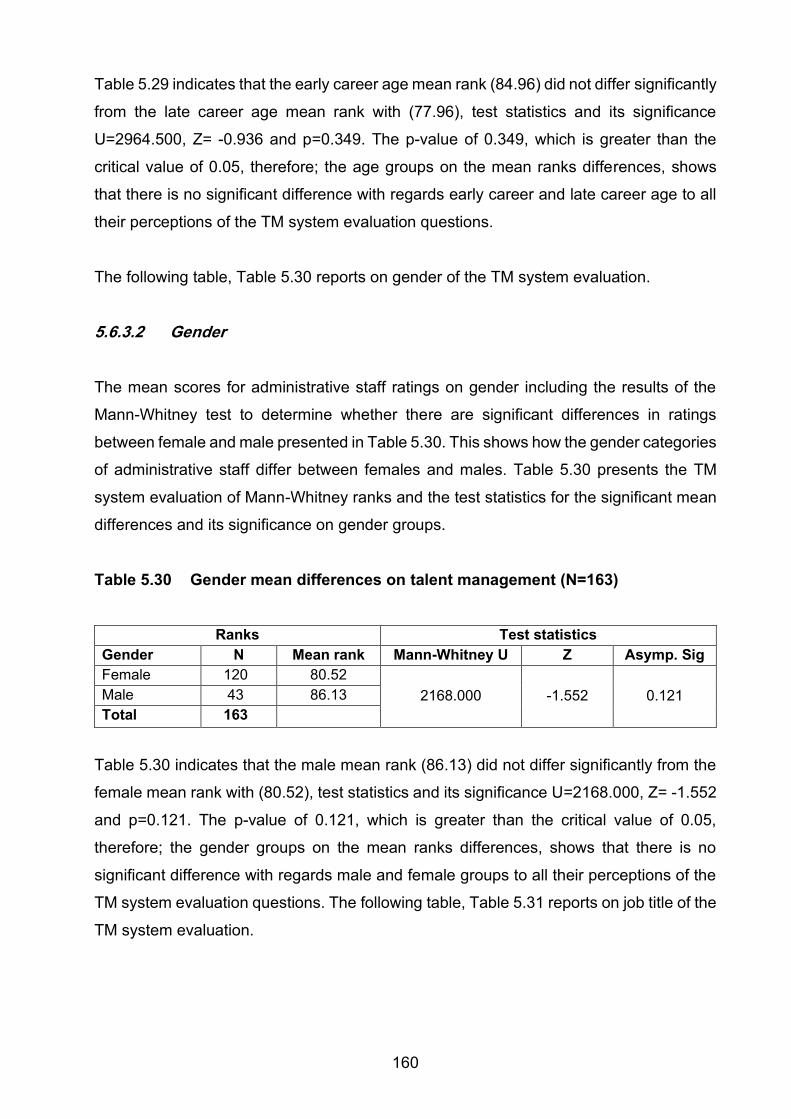
160
Table 5.29 indicates that the early career age mean rank (84.96) did not differ significantly
from the late career age mean rank with (77.96), test statistics and its significance
U=2964.500, Z= -0.936 and p=0.349. The p-value of 0.349, which is greater than the
critical value of 0.05, therefore; the age groups on the mean ranks differences, shows
that there is no significant difference with regards early career and late career age to all
their perceptions of the TM system evaluation questions.
The following table, Table 5.30 reports on gender of the TM system evaluation.
5.6.3.2 Gender
The mean scores for administrative staff ratings on gender including the results of the
Mann-Whitney test to determine whether there are significant differences in ratings
between female and male presented in Table 5.30. This shows how the gender categories
of administrative staff differ between females and males. Table 5.30 presents the TM
system evaluation of Mann-Whitney ranks and the test statistics for the significant mean
differences and its significance on gender groups.
Table 5.30 Gender mean differences on talent management (N=163)
Ranks Test statistics
Gender N Mean rank Mann-Whitney U Z Asymp. Sig
Female 120 80.52
2168.000 -1.552 0.121 Male 43 86.13
Total 163
Table 5.30 indicates that the male mean rank (86.13) did not differ significantly from the
female mean rank with (80.52), test statistics and its significance U=2168.000, Z= -1.552
and p=0.121. The p-value of 0.121, which is greater than the critical value of 0.05,
therefore; the gender groups on the mean ranks differences, shows that there is no
significant difference with regards male and female groups to all their perceptions of the
TM system evaluation questions. The following table, Table 5.31 reports on job title of the
TM system evaluation.
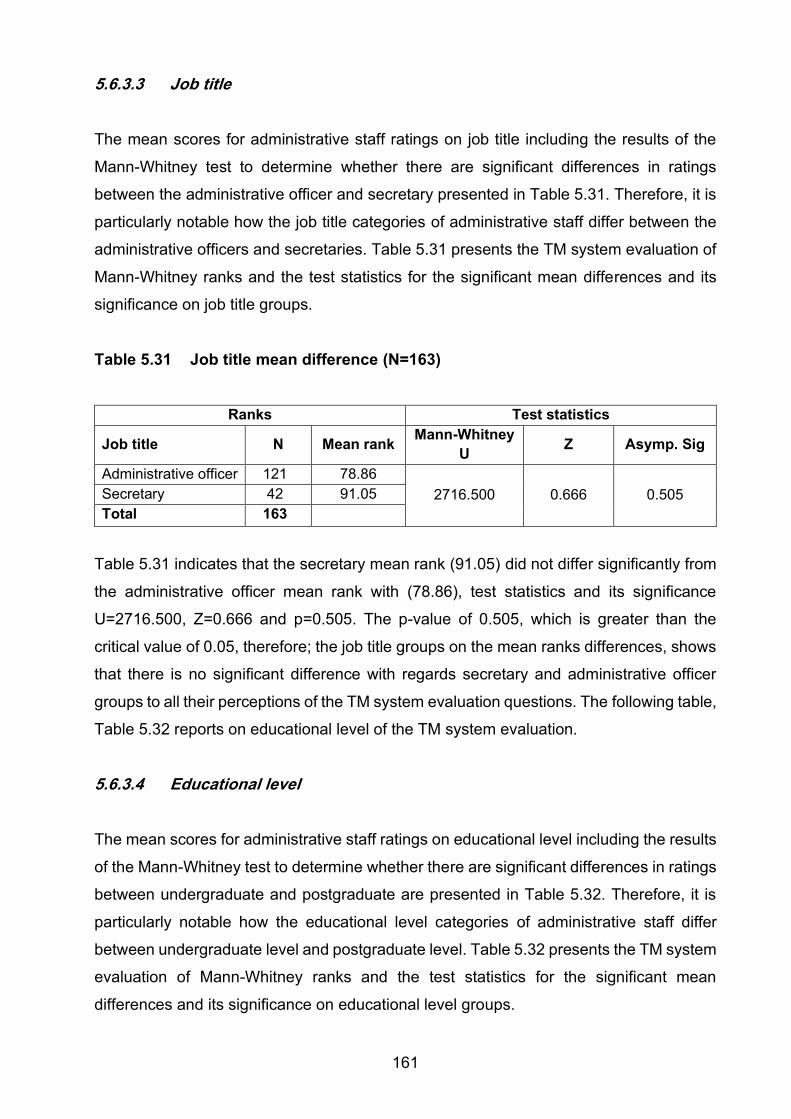
161
5.6.3.3 Job title
The mean scores for administrative staff ratings on job title including the results of the
Mann-Whitney test to determine whether there are significant differences in ratings
between the administrative officer and secretary presented in Table 5.31. Therefore, it is
particularly notable how the job title categories of administrative staff differ between the
administrative officers and secretaries. Table 5.31 presents the TM system evaluation of
Mann-Whitney ranks and the test statistics for the significant mean differences and its
significance on job title groups.
Table 5.31 Job title mean difference (N=163)
Ranks Test statistics
Job title N Mean rank Mann-Whitney
U Z Asymp. Sig
Administrative officer 121 78.86
2716.500 0.666 0.505 Secretary 42 91.05
Total 163
Table 5.31 indicates that the secretary mean rank (91.05) did not differ significantly from
the administrative officer mean rank with (78.86), test statistics and its significance
U=2716.500, Z=0.666 and p=0.505. The p-value of 0.505, which is greater than the
critical value of 0.05, therefore; the job title groups on the mean ranks differences, shows
that there is no significant difference with regards secretary and administrative officer
groups to all their perceptions of the TM system evaluation questions. The following table,
Table 5.32 reports on educational level of the TM system evaluation.
5.6.3.4 Educational level
The mean scores for administrative staff ratings on educational level including the results
of the Mann-Whitney test to determine whether there are significant differences in ratings
between undergraduate and postgraduate are presented in Table 5.32. Therefore, it is
particularly notable how the educational level categories of administrative staff differ
between undergraduate level and postgraduate level. Table 5.32 presents the TM system
evaluation of Mann-Whitney ranks and the test statistics for the significant mean
differences and its significance on educational level groups.
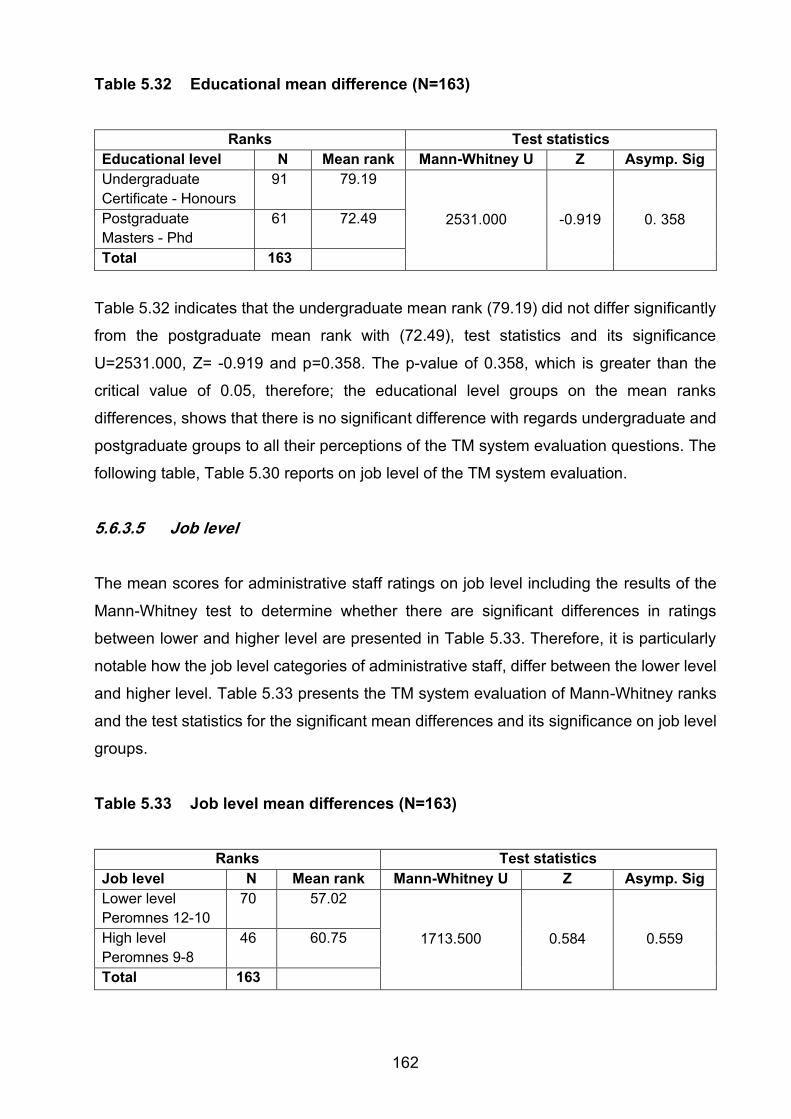
162
Table 5.32 Educational mean difference (N=163)
Ranks Test statistics
Educational level N Mean rank Mann-Whitney U Z Asymp. Sig
Undergraduate
Certificate - Honours
91 79.19
2531.000 -0.919 0. 358 Postgraduate
Masters - Phd
61 72.49
Total 163
Table 5.32 indicates that the undergraduate mean rank (79.19) did not differ significantly
from the postgraduate mean rank with (72.49), test statistics and its significance
U=2531.000, Z= -0.919 and p=0.358. The p-value of 0.358, which is greater than the
critical value of 0.05, therefore; the educational level groups on the mean ranks
differences, shows that there is no significant difference with regards undergraduate and
postgraduate groups to all their perceptions of the TM system evaluation questions. The
following table, Table 5.30 reports on job level of the TM system evaluation.
5.6.3.5 Job level
The mean scores for administrative staff ratings on job level including the results of the
Mann-Whitney test to determine whether there are significant differences in ratings
between lower and higher level are presented in Table 5.33. Therefore, it is particularly
notable how the job level categories of administrative staff, differ between the lower level
and higher level. Table 5.33 presents the TM system evaluation of Mann-Whitney ranks
and the test statistics for the significant mean differences and its significance on job level
groups.
Table 5.33 Job level mean differences (N=163)
Ranks Test statistics
Job level N Mean rank Mann-Whitney U Z Asymp. Sig
Lower level
Peromnes 12-10
70 57.02
1713.500 0.584 0.559 High level
Peromnes 9-8
46 60.75
Total 163
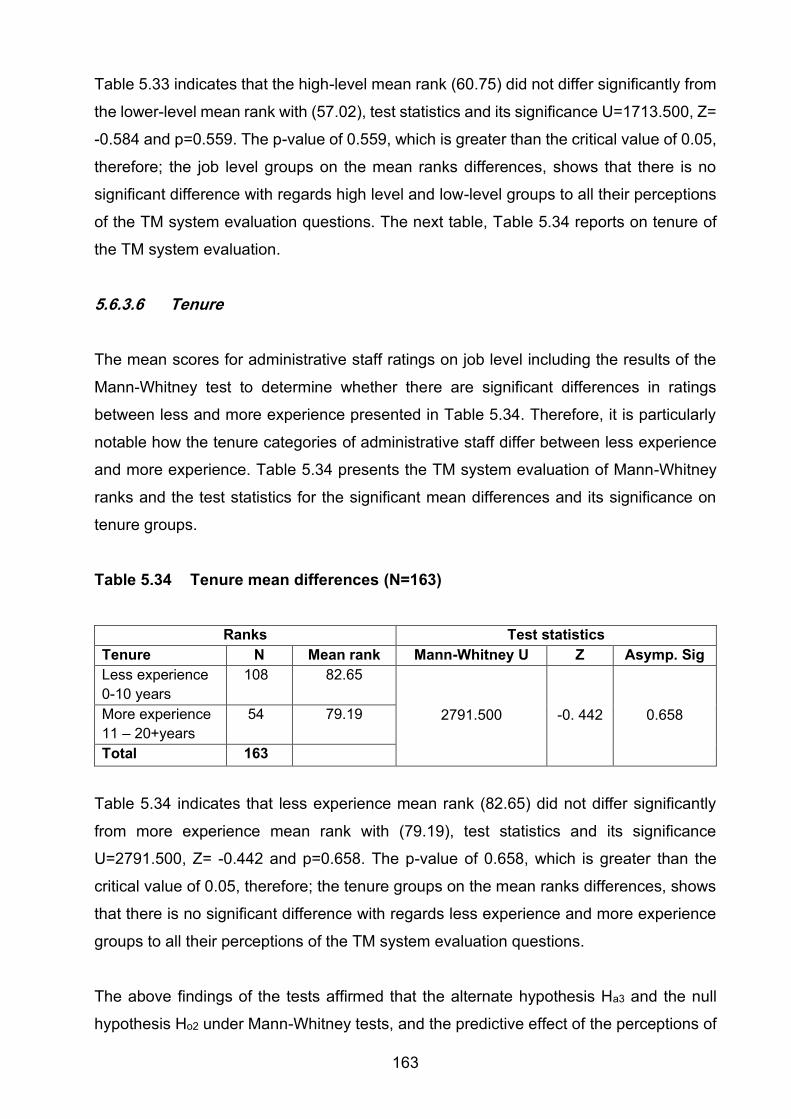
163
Table 5.33 indicates that the high-level mean rank (60.75) did not differ significantly from
the lower-level mean rank with (57.02), test statistics and its significance U=1713.500, Z=
-0.584 and p=0.559. The p-value of 0.559, which is greater than the critical value of 0.05,
therefore; the job level groups on the mean ranks differences, shows that there is no
significant difference with regards high level and low-level groups to all their perceptions
of the TM system evaluation questions. The next table, Table 5.34 reports on tenure of
the TM system evaluation.
5.6.3.6 Tenure
The mean scores for administrative staff ratings on job level including the results of the
Mann-Whitney test to determine whether there are significant differences in ratings
between less and more experience presented in Table 5.34. Therefore, it is particularly
notable how the tenure categories of administrative staff differ between less experience
and more experience. Table 5.34 presents the TM system evaluation of Mann-Whitney
ranks and the test statistics for the significant mean differences and its significance on
tenure groups.
Table 5.34 Tenure mean differences (N=163)
Ranks Test statistics
Tenure N Mean rank Mann-Whitney U Z Asymp. Sig
Less experience
0-10 years
108 82.65
2791.500 -0. 442 0.658 More experience
11 – 20+years
54 79.19
Total 163
Table 5.34 indicates that less experience mean rank (82.65) did not differ significantly
from more experience mean rank with (79.19), test statistics and its significance
U=2791.500, Z= -0.442 and p=0.658. The p-value of 0.658, which is greater than the
critical value of 0.05, therefore; the tenure groups on the mean ranks differences, shows
that there is no significant difference with regards less experience and more experience
groups to all their perceptions of the TM system evaluation questions.
The above findings of the tests affirmed that the alternate hypothesis Ha3 and the null
hypothesis Ho2 under Mann-Whitney tests, and the predictive effect of the perceptions of
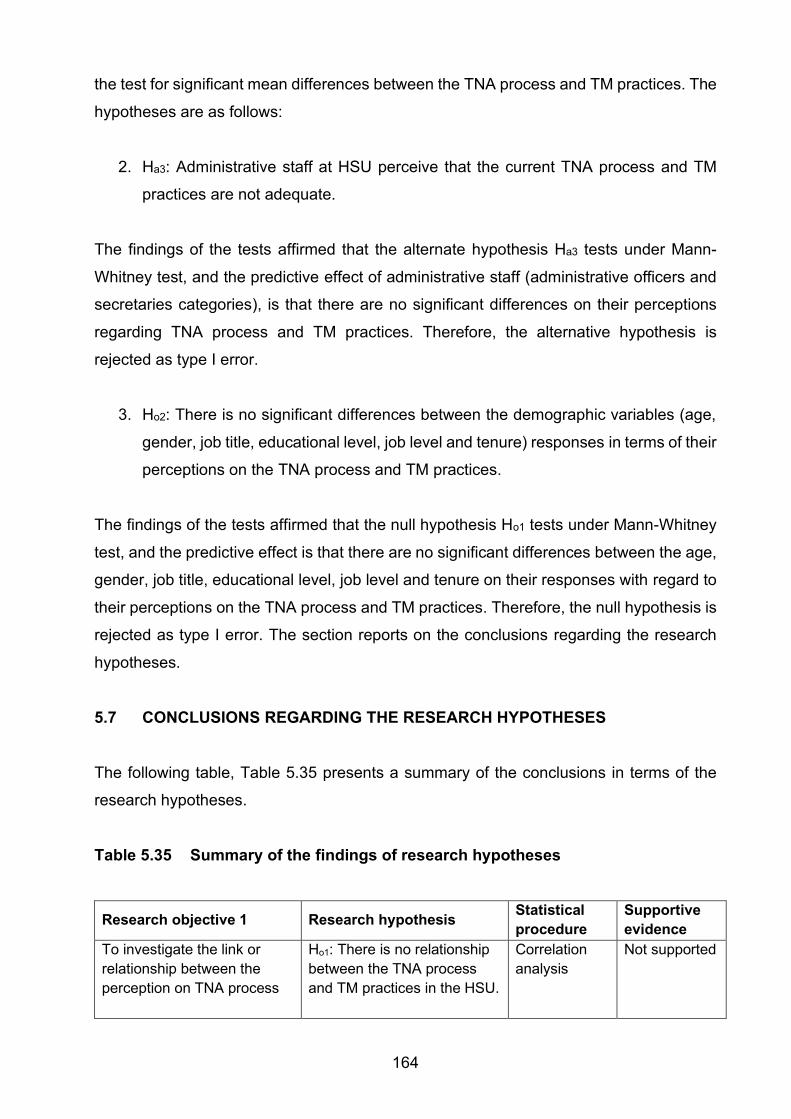
164
the test for significant mean differences between the TNA process and TM practices. The
hypotheses are as follows:
2. Ha3: Administrative staff at HSU perceive that the current TNA process and TM
practices are not adequate.
The findings of the tests affirmed that the alternate hypothesis Ha3 tests under Mann-
Whitney test, and the predictive effect of administrative staff (administrative officers and
secretaries categories), is that there are no significant differences on their perceptions
regarding TNA process and TM practices. Therefore, the alternative hypothesis is
rejected as type I error.
3. Ho2: There is no significant differences between the demographic variables (age,
gender, job title, educational level, job level and tenure) responses in terms of their
perceptions on the TNA process and TM practices.
The findings of the tests affirmed that the null hypothesis Ho1 tests under Mann-Whitney
test, and the predictive effect is that there are no significant differences between the age,
gender, job title, educational level, job level and tenure on their responses with regard to
their perceptions on the TNA process and TM practices. Therefore, the null hypothesis is
rejected as type I error. The section reports on the conclusions regarding the research
hypotheses.
5.7 CONCLUSIONS REGARDING THE RESEARCH HYPOTHESES
The following table, Table 5.35 presents a summary of the conclusions in terms of the
research hypotheses.
Table 5.35 Summary of the findings of research hypotheses
Research objective 1 Research hypothesis Statistical
procedure
Supportive
evidence
To investigate the link or
relationship between the
perception on TNA process
Ho1: There is no relationship
between the TNA process
and TM practices in the HSU.
Correlation
analysis
Not supported
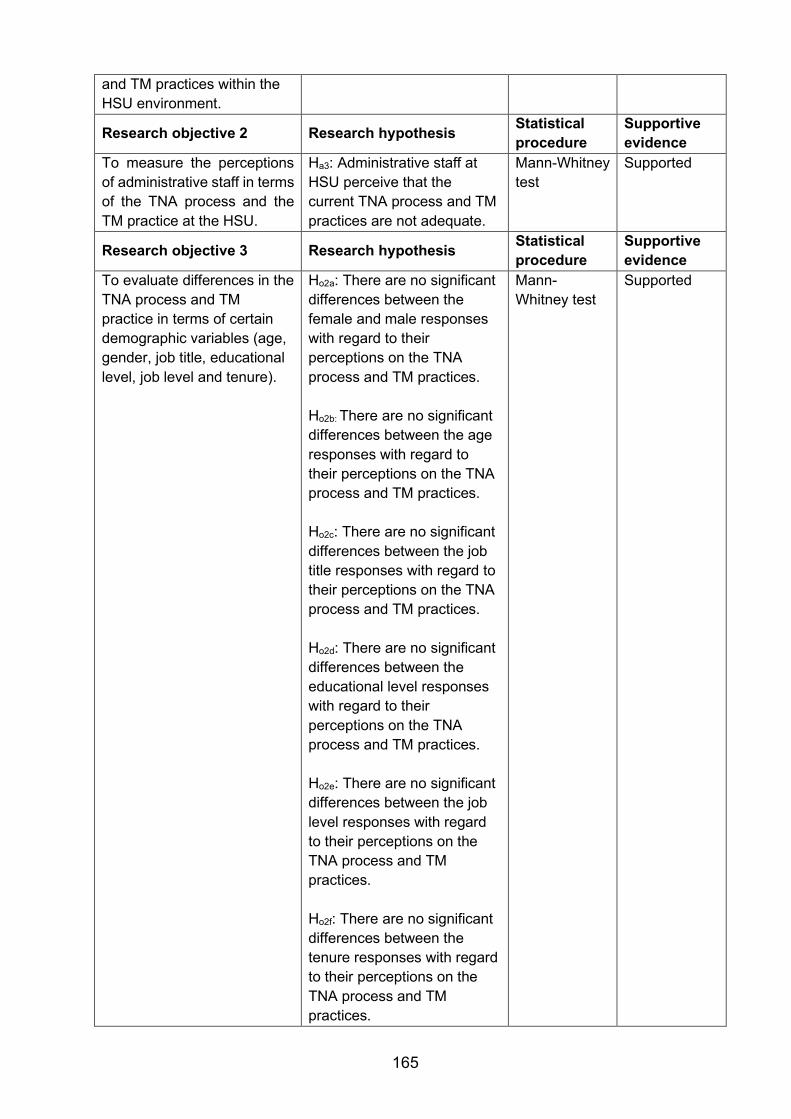
165
and TM practices within the
HSU environment.
Research objective 2 Research hypothesis Statistical
procedure
Supportive
evidence
To measure the perceptions
of administrative staff in terms
of the TNA process and the
TM practice at the HSU.
Ha3: Administrative staff at
HSU perceive that the
current TNA process and TM
practices are not adequate.
Mann-Whitney
test
Supported
Research objective 3 Research hypothesis Statistical
procedure
Supportive
evidence
To evaluate differences in the
TNA process and TM
practice in terms of certain
demographic variables (age,
gender, job title, educational
level, job level and tenure).
Ho2a: There are no significant
differences between the
female and male responses
with regard to their
perceptions on the TNA
process and TM practices.
Ho2b: There are no significant
differences between the age
responses with regard to
their perceptions on the TNA
process and TM practices.
Ho2c: There are no significant
differences between the job
title responses with regard to
their perceptions on the TNA
process and TM practices.
Ho2d: There are no significant
differences between the
educational level responses
with regard to their
perceptions on the TNA
process and TM practices.
Ho2e: There are no significant
differences between the job
level responses with regard
to their perceptions on the
TNA process and TM
practices.
Ho2f: There are no significant
differences between the
tenure responses with regard
to their perceptions on the
TNA process and TM
practices.
Mann-
Whitney test
Supported
166
5.8 CHAPTER SUMMARY
This chapter discussed the findings of the descriptive, correlation and Mann-Whitney test
related to the research study. The findings were reported to incorporate the findings of
the literature review with the findings of the empirical research study that was conducted.
The following research objectives were presented:
• Research objective 1: To investigate the link or relationship between the
perception of TNA process and TM practices within the HSU environment.
• Research objective 2: To measure the perceptions of administrative staff and
determine their needs in terms of the TNA process and the TM practice at the HSU.
• Research objective 3: To evaluate differences in the TNA process and TM
practice in terms of certain demographic variables (age, gender, job title,
educational level, job level and tenure) as established in a census sample of
participants in the HSU environment.
Chapter six focuses on research objective 4, namely, to formulate recommendations to
ensure that the training and management of talent for the administrative staff are
integrated into development plans of employees in the university.
167
CHAPTER 6
CONCLUSIONS, LIMITATIONS AND RECOMMENDATIONS
6.1 INTRODUCTION
The primary aim of this study was to investigate the link between the TNA process and
TM practice of administrative staff in an HSU environment. The study reviewed relevant
literature and employed suitable research methods and data collection instruments in
order to ensure that the envisaged hypothesis are a success. The previous chapter
presented the findings of the statistical data analysis relating to the purposes of the
research study. This chapter provides concluding remarks on the study and all other
important discussions that have been stretched with regard to the literature review,
research philosophy and the findings of the study, among other aspects. Furthermore,
the chapter discusses the limitations of the study as well as possible suggestions to
mitigate the limitations. Finally, recommendations will be presented for future researchers
and interested parties to pursue follow-up studies in the area of TNA process and TM
practice.
The research questions of the study as outlined in chapter one were as follows:
6.1.1 Research questions relating to the literature review
• How are the two constructs of the TNA process and TM practices conceptualised
and explained by theoretical framework in literature?
• Does a theoretical link between the perception of TNA process and TM practices
exist?
• What are the different theoretical frameworks governing the TNA process and TM
practices?
6.1.2 Research questions relating to the empirical study
• Is there an empirically tested relationship between TNA process and TM practices
at the HSU?
• What are the differences with regard to biographical variables (age, gender, job
title, educational level, job level and tenure) of the TNA process and TM practices?
168
In this chapter, the research questions were answered.
6.2 CONCLUSIONS
Conclusions of the research study were drawn based on the empirical results of the
research project and following the objectives of the study as indicated in Chapter One.
6.2.1 Conclusions relating to the literature
This study investigated the link between the perception of TNA process and the TM
practice of administrative staff in an HSU environment. Below, conclusions are drawn on
each of the particular objectives:
Research aim 1:
• To conceptualise the two concepts of TNA and the TM practices from theoretical
models in the literature.
Construct 1: The TNAM was envisage in Chapter Two. The concept was based on the
three-level O-T-P model of organisation, task, and people or individual analysis
(McGehee & Thayer, 1961; Mager & Pipe, 1984; Rossett, 1987; Rummler & Brache,
1995; Taylor et al., 1998; Leigh et al., 2000). Subsequently, the following conclusions
were drawn:
The O-T-P three-level conception of needs by McGehee and Thayer (1961) is considered
the core framework for needs assessment in the theoretical literature (Holton et al. 2000),
and the several models developed, have since been based on this three-level framework
(Mazhisham et al., 2018; Rikkua & Chakrabartyb, 2013). Furthermore, Clarke (2003)
stated that the O-T-P model integrated macro through to micro-analyses. This arises from
an investigation of training needs to meet organisational needs, task, or job needs through
to the specific needs of the individual or person. The model shows that the training
programmes should start on the foundation of the TNA that should cover organisation,
task, and the individual's aspects of the organisation. The organisational analysis consists
169
of, firstly, considering how employee training can help to achieve organisational goals,
and secondly, training is needed in the organisation.
Generally, the TNAM approach is aimed at improving the nature of the training and
development performed through enhancement of TM. As a result, the model suggests
the succeeding six core dimensions as the key need:
• Person/individual analysis – focuses on identifying who should be skilled and what
training is required by the individual.
• Task/operational analysis – entails setting performance standard or criteria,
describing tasks to be completed.
• Organisational analysis – refers to internal organisational environment that affect
the achievement of organisational goals, that has been recognised in accordance
with the vision and mission of the organisation.
• Task significance – refers to the influence that the job has on those who get
advantage from the support provided on the task and leading to better meaning.
• Autonomy – reason the measure to which the needs permit worker and
individuality in planning the training, making decisions and choosing the
approaches utilised to carry out the jobs.
• Feedback – includes understanding of the results of training that was finished.
The existence of the six core dimensions in some of the TNA processes may result in the
employee be subjected to their training need as important and feeling accountable for the
results. In such a case of administrative staff, the training needs such as language,
communication, and technology skills are very critical for office work equate to the
dimension of individual analysis. Individual analysis has an impact on autonomy and
discretion in the choice of the technical skills applied to do office work, and consequently
gives administrative staff switch over their computer-generated work skills. Successively,
the measurement of task significance and task analysis are depicted inside the office
work. Ultimately, the administrative staff develop the knowledge of the results of their job
from line managers who benefit from their services. If this dimension of individual analysis
is present, then the administrative staff will experience the level of TNA process on all
three O-T-P model. Because of this, it is evident that the TM is still influential in the
discipline of TNAM, especially in talent development. This model was extended to the
TNA process of administrative staff to examine the existence of the six core dimensions.
170
Construct 2: TM was envisage in Chapter Three. The concept was based on procedures
of the TM wheel which divide important elements of TM into the TM practices and the
guiding principles (Stahl, et al., 2012). Literature indicates that each organisation should
align its TM practices with the organisational strategy and values (Al Ariss et al., 2014).
The conclusions below were drawn:
TM is the process through which organisations anticipate and meet the needs for talent
in strategic jobs. Therefore, TM represents a component of the HRD strategy which
summarises the organisational policies and administration supporting the
accomplishment of TM activities (Cappelli & Keller, 2014). Generally, TM is the pool of
activities that are instrumental in attracting, selecting, developing, and retaining the best
employees in strategic roles. In this study, these TM activities are influenced by four
dimensions of TM practices, which are as follows (Stahl et al., 2012):
• Talent development – focuses on experience-based development with on-the-job
learning as one of the development processes in a cost-effective manner.
• Talent selection – refers to the process of assessing and aligning employees for
future positions based on the future organisational design and the selection
criteria.
• Talent utilisation – refers to the process that aims to complete practice, realise
talents value and improve talents quality by creating an external environment and
conditions which are a benefit for talents, following talents activity routines, and
establishing mechanisms to stimulate their potentials and qualities.
• Talent retention – refers to the interventions adopted by the institution that
facilitates employee's fulfilment and meaningful employment for a sustained
period.
In conclusion, the abovementioned dimensions of TM practices need to be aligned to the
guiding principles of organisational strategy and values. HSU administrative staff are
geographically dispersed and physically separated within the different departments and
schools. Thus, dimensions of technological and technical support, including
organisational ones are paramount to TM practice as they enable it to adapt to altering
business conditions and revamping their talent approach when required. Considering the
findings of the study, it is suggested that the support mechanisms should be made
171
available and used within the separated and dispersed departments and schools of the
administrative staff.
Research aim 2:
• To conceptualise the theoretical link between the perception of TNA process and
TM practice.
The theoretical link between the perception of TNA process and TM practice was
explained in the summation of the conceptual framework. The conclusions below were
drawn:
The TNAM affects a variety of needs-related outcome such as TM. These are interceding
by the inspirational possessions establish in the five core dimensions of the training
needs. This training needs to stimulate critical management of talent where employees
observe their job as important, feel accountable for the outcome, and have response on
their job. A planned TNA process and TM practice linked with the goals of the
organisation, would address the identified talent gaps of employees by providing training
as the solution.
Research aim 3:
• To conceptualise the different theoretical frameworks governing the TNA process
and TM practices in terms of literature.
Conceptualisation of different theoretical frameworks governing the TNA process and TM
practices were presented in the conclusion of the conceptual framework. The conclusions
below were drawn:
The concepts of TNA and TM reveal the needs pertinent to responses to the work and
the institution. In favour of the needs replies, investigators on organisational analysis have
established the theoretical framework between the two concepts. Therefore, workers who
identified the relevant training, will develop, nurture talent, and enhance performance
within their organisation.
172
6.2.2 Conclusion relating to the empirical results
There are no significant mean differences among administrative staff who hold
undergraduate and postgraduate qualifications, respectively. Academic qualification
revealed that 31% of the administrative staff were having a diploma as undergraduate
degrees. Job level revealed that 28% of the administrative staff are on Peromnes level
12. Work experience revealed that 44% of administrative staff has work experience of 5-
9 years. Most of the administrative staff are at the school of medicine with 57.7%.
The biographical results were simply important to the inferential analysis of data, and that
was with regards to the strategic difference. Therefore, there were limitations with regard
to the effect on the key concept of the research. The strategic difference for age disclosed
that 36.8% of the administrative staff were among the age of 35-41, therefore, decreasing
in the group of the young generation of effective staff. On the other hand, the important
result of sequential age comparative to the TNA process and TM practice within the
administrative office job was examined. The results revealed that there is no significance
age difference with regard to their perception on TNA process and TM practice. The
empirical aims of this study were as follows:
Research aim 1
In order investigate the statistical nature of the link between the TNAM process (signified
by five key dimensions, namely: feedback, organisation, task significant, task analysis,
and individual analysis) and TM practice (represented by talent development, talent
selection, talent utilisation, and talent retention) from a census sample of participants
working in the offices of different departments and schools at the HSU. The empirical
results supplied supportive evidence of the hypothesis Ho1.
Hence, the empirical findings affirmed a strong, significant, and positive relationship
among TNAM and TM. The EFA conducted with for the TNAM discovered that the link
with TM is based on feedback, organisational analysis, task significance, and task
analysis.
In the initial index, task significance had strong factor loadings (3.754) and task analysis
had the lowest (3.195) factor loadings. However, under the four-dimensional TNA,
173
organisational analysis had the strongest (0.908 Cronbach's alpha) factor loading
followed by feedback (0.907 Cronbach's alpha). The factor extraction on the main
dimension of autonomy and individual analysis indicated very low loadings and was then
suppressed in the last output.
The findings of the strong, significant, and positive relationship propose that the
administrative staff's TNA process has been identified to perform their organisational and
tasks appropriately based on their office work. This was ascertained regardless of the
missing individual analysis result on the TNA-4 score. This is contrary to Balisi's (2014)
findings. He found that organisational analysis and task analysis are seriously neglected
or missing.
The positive findings establish in this research are ascribed to feedback. The dimension
had a strong factor weighting which augmented the identified training needs effect of the
general TNA-4 score, and this contributed to the positive correlation using TM. This
suggest that feedback inside office work environment is a critical success factor
compensating for the physical presence and enhancing social support, communication,
and trust. In summation, there is a need to expand feedback channels to all sources,
including managers, service recipients and other co-workers (Collins, Hilslop, &
Cartwright, 2016).
The retained structure of TNA comprising of four new dimensions was tested for reliability
and it was subsequently established that the structure produced an acceptable reliability
score. These TNA processes were establish to be dependable and the extent of
administrative staff's training needs with regard to the four factors (Feedback,
organisational analysis, task significance and task analysis) had identified needs that
evident in the TM in their workspaces.
Moreover, the findings affirm the administrative staff’s inspiration to attain psychological
growth, which refers to their growth need strength (GNS). Bakker and Demerouti (2014),
indicate that the employee's GNS are unable to function in a setting that is described by
tight control. This means that even though autonomy was restricted in this study, the
structural transformation fostered cognitive talent growth of administrative staff. To some
extent, administrative staff have the privilege to identify their training needs to manage
their talent.
174
A correlation between TNA and TM was conducted. Afterwards, a significant positive
relationship was found between the TNA and TM variables. In conclusion, the TNA
process encompasses the actions achieved working under particular circumstances, and
the TNA process impacts TM practice positively. Further statistical analysis was
conducted to test the relationship among the TNA process and TM practices. A strong,
significant, and positive relationship was subsequently found between the TNA process
and TM practice.
In summation, the findings explain how external events, such as feedback, organisational
analysis, task significance, and task analysis take on talent development significance that
motivates TM in administrative staffs directly influencing their commitment to the
institution. It is indicated differently that, to commit to their institution, workers should
identify their individual needs, and affection for the institution is depending on the task
activities executed and the nurturing of talent.
Research aim 2
To investigate if differences exist between TNA (feedback, organisational analysis, task
significance, task analysis, and individual analysis) and TM (talent development, talent
selection, talent utilisation, and talent retention) with regard to biographical variables (age,
gender, job title, educational level, job level and tenure). The following hypotheses of the
group differences below were drawn:
• Ho2: Differences do not exist in the TNA process and TM practices in terms of the
demographic variables.
• Ha2: Differences do exist in the TNA process and TM practices in terms of
demographic variables.
The findings found that there are no significant differences between the mean scores of
the TNA process and TM practices of female and male administrative staff members, and
no significant differences between the administrative officer and secretary. The following
demographical groups of the null hypothesis was affirmed:
• Ho2: Differences do not exist in the TNA process and TM practices in terms of
demographic variables.
175
The findings found that the effect of the TNA that accompany with the office workspaces
conditions have no significant difference effect on the levels of TM among female and
male administrative staff. However, the literature indicates that concerning gender, there
is an unequal representation of females in secretarial and office administration work
across the world (Servon & Visser, 2011).
The conclusion may, therefore, be made that there are no significant differences between
female and male administrative staff's perceptions of the TNA process and TM practices.
Furthermore, the tenure in years of administrative staff with long years (6-10 years) of
service do not differ significantly from those with relatively short (0-5 years) service of
administrative staff in years.
When it comes to office work, there was no significant dissimilarity between the female
and male positions at the institution. It is therefore recommended that there should be
more opportunities for both males and females to persuade them by organising
workshops, seminars, and conferences. Although the occupation by gender is changing,
numerous people still perceive the secretary and administrative officer as a female
orientated profession. Males have been under-represented for many years in the
administrative support and this is still the case currently.
Commonly, most administrative work is dominated by females (Van Antwerpen &
Ferreira, 2016). However, it does not mean that female administrative staff is more
competent or talented than male staff. Still, the secretarial and administrative job roles
are still viewed by many as "female" jobs. The influence of the benefits such as task
analysis on TNA was investigated in the current study. The findings found that there are
no significance differences among the mean scores of female and male administrative
staff's perception of TNA process and the TM practice. It is concluded that there is no
difference in the TNA process and TM practices in terms of demographic variables of
gender and job title.
With regard to age, chronological age has an influence in how employees reply to the
structure of their office workspaces. Elder and young employees from different
generational groups may reply in a different to the same TNA, especially in an office
workspace structure where training plays a major role. Although, there was no planned
176
construct when it comes to chronological age. As such, the predictive effect of
generational groups like ages between 34 years and younger, 35 to 41 and elder
employees was under investigation for the key concepts of the research study. The
results revealed that there are no differences in the TNA process and TM practice in terms
of age.
.
Academic qualification is connected to educational level, and adopts the employee's
needs on the profession as opposed to the hiring institution. The needs to their occupation
was under review, since this has shed light on the mean differences between
administrative staff who hold qualifications in categories of undergraduate and
postgraduate degrees. Therefore, the conclusion is that there are no differences in the
TNA process and the TM practice in terms of educational level.
Research aim 3
In order to make recommendations and to ensure that training and management of talent
for the administrative staff are integrated into the development plans of employees at
HSU. The following hypothesis was affirmed:
Ha3: Administrative staff at HSU perceive that the current TNA process and TM practices are not
adequate.
The findings found that the predictive effect on their perceptions of the TNA process and
TM practices have no significant differences between the administrative officers and
secretaries. Therefore, the conclusion from the Mann-Whitney statistical results for
significant mean differences of administrative staff's perceptions on the TNA process and
TM practices perception are adequate. The empirical study provided supportive evidence
for the Ha3, therefore Ha3 is accepted. The empirical findings provide awareness into the
relationship dynamics between the training and management of talent in terms of TNA
process and TM practices. The information derived from the findings may add a broader
perception on how individuals’ training influences their ability to manage their talent.
Furthermore, the empirical relationship between training and management of talent could
be used by managers in line with HRD section and management to integrate the
development plans of administrative staff at HSU.
177
6.3 THE SIGNIFICANT CONTRIBUTION OF THE STUDY
This research study presents the conclusions with regard to contributions to the section
of HRM and HRD. As a result, the contributions made related to theoretical, empirical and
methodological also as applied perspectives are discussed.
6.3.1 Theoretical contribution
This study is significant from a theoretical perspective as it conceptualised the constructs
of the TNA process, talent and TM practice of administrative staff within HSU
environment. Thus, the study adds value to the body of knowledge by adopting the needs
of the workplace and the theoretical models contributing to the TNA process and TM
practice. In particular, the three O-T-P model and the TM wheel were important in
supporting the predictable training needs of office employees like the administrative staff.
The dimensions of the models were critical for examining the link between the TNA
process and TM practice; and shedding light in the way administrative staff at HSU relate,
work and communicate with their line managers and heads of departments. In building
this theoretical contribution, critical shareholders could had a significantly improved
understanding of how the administrative work environment may impact on the TNA
process and TM practice of support staff such as administrative staff at HSU. The HSU,
on the other hand could establish appropriate training and TM guidelines or procedures.
6.3.2 Empirical contribution
This study methodologically, contributed by empirically testing the validity and reliability
of the dimensions of the TNAM in the administrative workspaces at HSU. The measure
found a scientifically strong, significant, and positive relationship between the perception
of TNA process and TM practices of administrative staff at an HSU environment. The
extracted four-dimensional model creates an opportunity for more research study on the
subject of training needs and its effect on development of talent like TM. This model of
office workspaces could be extended and developed further.
178
6.3.3 Practical contributions
The findings of this research could create a significant practical contribution which can be
used to the department of HRM and HRD section. Practitioners in the field of HRM and
the HRD might create reference to the study results and take awareness of the talent
development impact that TNA has in the office workspaces. HSU should identify a talent
by using university’s capabilities and potential to meet the current needs. Furthermore, it
integrates talent planning on personal development goals of the employees such as
administrative staff within the university's strategy. Thus, the employment link that
develops inside the office workspaces findings in new dimensions that influence the
nurturing of talent development and management of talent. The findings of this research
inspire applied consideration of human resource methods with regard to support and
policies that can increase the TNA process and TM practice for administrative work, thus
offsetting administrative staffs' intention to leave. In the context of this study, this
approaches should aim at developing administrative staff's support, progress, and
commitment to the HSU environment.
6.4 LIMITATIONS
Limitations are restrictions in the study. The following limitations of the literature review
and the empirical investigation are presented below.
6.4.1 Limitations of the literature review
In this study, theoretical models were operationalised mainly in old-style workspaces
environment. The dimensions are perceived to be restricted to the physically work
environment. Like, the dimension of social support from the line managers is an
interpersonal aspect forming part of operational circumstances is mainly perceived to
exist in physical workspaces. Subsequently, the models were restricted for capturing the
noticeable aspects of the office workspaces.
6.4.2 Limitations of the empirical study
The limitations of this research were that it was conducted in one institution of higher
learning in Gauteng province, and therefore the results cannot be generalised to all the
179
institutions/universities and administrative staff or for the country, South Africa. Only the
administrative staff were included in the study. Including Human Resources Managers
who are involved in the TNA process and TM practice could provide a bigger sample and
more comprehensive results. In this study the census sample size was adequate, the
survey was distributed to all 200 respondents. However, only 163 responses were
returned, where this represents 81.5% response rate that had influence on extraction
factors. As such, only a four-factor TNAM was extracted (TNA_4), for the dimensions of
individual analysis and autonomy were excepted.
The absence of individual analysis may propose that administrative staff cannot claim
accountability of identifying their personal development plan of office workspaces from
the beginning to finish. However, this is restricted to the need’s analysis according the
employees' performance, attitude, and observations. To some extent, this makes
ambiguity and then represses the role clarity. The role of administrative staff is confined
to the key constituent in higher education institution because they are responsible to
taking care of the day-to-day operations of the institution. As such, completion of tasks
inside the office, using computer skills, as well as effective communication via emails,
teamwork and computer-generated collaboration seems to have inhibited as research of
individual analysis shows.
Autonomy was restricted to approaches for executing task undertakings. This reflects an
overall measure of the TNA dimension. As such, autonomous factors prevailing within
office workspaces, day to day operations, were sparingly investigated. Moreover, the key
constituent inside office work is mediated by technology and therefore requires different
skills related to the jobs of administrative employees include, but not limited to typing,
computer literacy, numeracy, communication, planning and time management skills (Van
Antwerpen & Ferreira, 2016). Such different skills prompt administrative staff to be active
and able to craft their job. Job crafting has an part of autonomy; however, it did not form
part of the key construct under the study (Nicholson, 2010). Considering the
abovementioned proposes that the investigation of job autonomy was very restricted to
the study.
In terms of organisational support, procedural and technological support is considered as
a successful predictor of TM in the office workspace. Such support helps in the creation
of development and nurturing talent. However, in this research, the dimensions were
180
connected to the TM construct. Somehow this was not inhibiting, and would not be the
reason why development and nurturing talent were internalised as talent development as
opposed to talent utilisation and talent selection within the EFA.
6.5 RECOMMENDATIONS
The findings of the research found that the development of organisational analysis has
changed the TNA. In order to capture the noticeable aspect of the altering TNA process,
employees who occupied the new occupations are in a better place to share valuable
insight about the TNA process and the results of the new dimensions. The research
questions integrating literature review and empirical study were as follows:
• what recommendations can be formulated for conducting the TNA process and
TM practices of administrative staff in a higher education setting?
• what recommendations can be offered to ensure that TNA facilitates TM of the
administrative staff within the university?
Consequently, the abovementioned recommendations were achieved and
recommendations were made as follows:
6.5.1 Recommendation for practice related to TNA process and TM practice in a
higher education setting
• In considering the restrictive effects induced by the shortage of suppression for
some of the dimensions of the TNA, it is essential for the organisation to counter
plate the empirical aspect of training needs. The suppression of individual
analysis and autonomy in the EFA proposes that the parameters of the TNAM
need to be stretched to suit specific training needs. Which this case is the office
workspaces at the HSU. More attention needs to be given to affecting the TNA
processes within organisational setting and to develop a link between theoretical
formulations and practical applications of TNA.
• Application of prescriptive TNA formulae could be improved by expanding their
scope to encompass the organisational context in which decisions are made.
181
• The administrative staff should continuously be given training for their identified
training needs in order to improve, develop and nurture their talent in their office
work environment.
• The TNA process could be applied by the HRD managers on all three-level of O-
T-P model throughout.
• Exchanging information through conferences, workshops, seminars and training
talent development could increase the intensity of awareness and participation in
TM.
• The TNA process and TM practice should continue to expand and be used to help
set training objectives in line with the real needs of administrative staff. Therefore,
by exploring TNA process and TM practices of administrative staff at the HSU, a
reduction in unacceptable work performance will hopefully be witnessed.
• Each employee in all the departments or schools of the university should be
involved in the TNA process and TM practice and the entire exercise should be
regular, thoughtful, purposeful and open. The TNA process should be assessed
jointly by the line manager including top management and human resource
department to ensure that budget for training and nurturing talent is provided.
• The university should identify customer care training for the administrative staff as
is an important and a required skill for them.
• The university should invest TM in relation with Performance agreement.
6.5.2 Recommendation for integration of the TNA process and TM practice within
the plans of the university
• The TNA process and the dimensions of TM practice for the administrative staff
should be written down so that they can be connected to the strategic goals and
aims of the university. Talent development and talent selection constitute a large
contribution to administrative staff's training needs levels; therefore, TNA process
and TM practice should be linked within the identified training needs plans of the
university.
• The university management should follow the required TNA process and TM
practice of the administrative staff and ensure that their training needs are linked
with the task and individual analysis to achieve organisational goals.
182
• This study recommended that there should be a formulation of appropriate TNA
process and TM practice policies by the stakeholders. This will facilitate the
adequately address of the training needs and framework on how to conduct and
implement TNA successfully.
• Both employees and management will experience the significant of training, talent
development and nurturing talent of the general administrative staff to achieve the
organisational goals and objectives.
• The university needs to enhance their TNA process on individual analysis for the
administrative staff by analysing the actual knowledge, skills, and current
performance of each employee while performing tasks to determine who
needs training and in which area/s in order to provide the training.
6.5.3 Recommendation for future research
Further research is needed on the following:
• The experiences of other staff members within the HSU on the TNA process and
TM practices.
• Evaluation of HRD staff knowledge on TNA and TM in relation to university
procedures.
6.6 CHAPTER SUMMARY
The results of this study revealed a need for standard guidelines or procedures for TM
and TNA at HSU. The objective of this study was to investigate whether TNA process and
TM practices of administrative staff are linked within an HSU environment. The results
confirmed that there is a significant relationship between the TNA process and TM
practice in the HSU. The implication for this study is strengthening the TNA and TM for
all staff or communities at large at the HSU. This completes the research project.
6.7 COMMUNICATING THE RESULTS
Communicating the results involves the development and distribution or giving out of a
research report to appropriate audiences. The researcher will communicate the results of
the study to others who may find it useful. The results of the study will be communicated

183
through the research report which will be sent to the Head of HRD at the HSU; as well as
through publication of the research in scientific journal or even presentation at relevant
forums such as workshops, conferences, congresses and updates for human resources
development.
184
LIST OF REFERENCES
Ablanedo-Rosas, J.H., Blevins, R.C., Gao, H., Teng, W.Y. & White, J. (2011). The impact
of occupational stress on academic and administrative staff, and on students: An
empirical case analysis. Journal of Higher Education Policy and Management,33(5), 553-
564.
Adam, A. (2015). The efficacies of secretarial profession by ghana education service and
higher education institutions. Journal of Education and Practice, 6(18), 81-115.
Agnaia, A.A. (1996). Assessment of management training needs and selection for
training: the case of Libyan companies. International Journal of Manpower, 17(3), 31-51.
Agochiya, D. (2009). Every trainer's handbook. India: Sage.
Ahmed, A., Abu-Naser, S.S., El Talla, S.A. & Al Shobaki, M.J. (2018). The impact of
information technology used on the nature of administrators work at Al-Azhar University
in Gaza.
Akther, S., Tariq, J. & Islam, N. (2018). Effectiveness of Training Need Assessment (TNA)
practices in private sector banks of Bangladesh. International Journal of Modern Trends
in Business Research, 1(4), 82-98.
Alagaraja, M. (2013). Mobilizing organizational alignment through strategic human
resource development. Human Resource Development International, 16(1), 74-93.
Al Ariss, A., Cascio, W.F. & Paauwe, J. (2014). Talent management: Current theories and
future research directions. Journal of World Business, 49(2), 173-179.
Aliata, M.I. & Hawa, S.A. (2014). Modern office technology and the performance of the
professional secretary in contemporary organisation in Ghana. Information and
Knowledge Management, 3(4), 52-57.
Alruwaili, N.F. (2018). Talent management and talent building in upgrading employee
performance. European Journal of Sustainable Development, 7(1), 98-106.
185
Alsakarneh, A.A.A. & Hong, S.C. (2015). Talent management in twenty-first century:
theory and practically. International Journal of Applied Research, 1(11), 1036-1043.
Al Shobaki, M., Abu-Naser, S.S., El Talla, S.A. & Abu Amuna, Y.M.A. (2018).
Performance reality of administrative staff in Palestinian universities. International Journal
of Academic Information Systems Research (IJAISR), 2(4), 1-17.
Altarawneh, I.I. & Aseery, A.I.A. (2016). Training needs assessment at assir general
educational directorate, Saudi Arabia. American Journal of Industrial and Business
Management, 6(02), 188.
Altschuld, J.W & Lepicki, T.L. (2010) Needs assessment, in Watkins, R. and Leigh, D.
(Eds), Handbook of improving performance in the workplace: Selecting and implementing
performance interventions. San Francisco, CA: Pfeiffer:771-791.
AlYahya, M.S., Mat, N.B. & Awadh, A.M. (2013). Review of theory of human resource
development training (learning) participation. Journal of WEI Business and Economics,
2(1), 47-58.
Amias, F.L.G. & Segumpan, R.G. (2017). Human resource competency and job
performance: The case of administrative staff in a philippine state university. Australian
Academy of Business and Economics Review, 4(1), 17-28.
Amos-Wilson, P. (1996). Management training in UK NGOs: A small survey. Journal of
European Industrial Training, 20(1), 15-19.
Andoh, R.P.K., Appiah, R. & Adom-Nyankey, M.K. (2016). Effects of training on the
performance of senior administrative staff of University of Cape Coast. Business
Management and Strategy, 7(1), 235-252. (doi:10.5296/bms.v7i1.9510).
Antonius, R. (2013). interpreting quantitative data with IBM SPSS Statistics (2nd edition).
California: Sage.
Asante, E. & Alemna, A. (2015). Training and development issues: Evidence from
Polytechnic Libraries in Ghana. Library Philosophy and Practice (e-journal), 1(8), 1-26.
186
Asfaw, A.M., Argaw, M.D. & Bayissa, L. (2015). The impact of training and development
on employee performance and effectiveness: A case study of district five administration
office, Bole Sub-City, Addis Ababa, Ethiopia. Journal of Human Resource and
Sustainability Studies, 3(04), 188-202.
Ashton, C. & Morton, L. (2005). Managing talent for competitive advantage: Taking a
systemic approach to talent management. Strategic HR Review, 4(5), 28-31.
Asrar Mirza, A. & Riaz, S. (2012). Training needs assessment in Islamic banking sector.
Qualitative Research in Financial Markets, 4(2/3), 142-155.
Awino. M. (2016). Frequency of on-job training (OJT) of administrative staff at mmust: A
human resource practice and promotional tool for organisational performance. European
Journal of Training and Development studies, 3(5), 1-13.
Axelrod, B., Handfield-Jones, H. & Michaels, E. (2002). A new game plan for C players.
Harvard Business Review, 80(1), 80-88.
Babbie, E.R. (2010). The practice of social research. (12th edition). California: Wadsworth
Cengage Learning.
Babbie, E.R. (2013). The practice of social research. Belmont, California: Wadsworth
Cengage Learning.
Babbie, E.R. (2016). The practice of social research. Belmont, California: Wadsworth
Cengage Learning.
Balisi, S. (2014). Training needs assessment in the Botswana public service: A case study
of five state sector ministries. Teaching Public Administration, 32(2), 127-143.
Baltaru, R.D. & Soysal, Y.N. (2018). Administrators in higher education: Organizational
expansion in a transforming institution. Higher Education, 76(2), 213-229.
Bansal, A. & Tripathi, P. (2017). A literature review on training need analysis. IOSR
Journal of Business and Management, 19(10), 50-56.
187
Barkhuizen, E.N. (2013). Employee perceptions of Talent management practices in local
government institutions. In N. Delener, L. Fuxman, F. Lu, S. Rodrigues & L. Rivera (Eds),
15th Annual International Conference on globalising business for the next century:
visualising and developing contemporary approaches to hamess future opportunities,
global business and technology association, Helsinki, Finland, 96-101, ISBN: 1-932917-
08-X. USA, Gbata.
Barkhuizen, N., Mogwere, P. & Schutte, N. (2014). Talent management, work
engagement and service quality orientation of support staff in a higher education
institution. Mediterranean Journal of Social Sciences, 5(4), 69.
Barkhuizen, N., Schutte, N. & Smit, A. (2015). Talent management, motivation and
service quality of support staff in a public higher education institution. Journal of Public
Administration, 50(Special issue 1), 658-673.
Becker, B.E. & Huselid, M.A (1998), High performance work systems and firm
performance: a synthesis of research and managerial implications. Research in
Personnel and Human Resource Management, 16, 53-101.
Becker, B.E. & Huselid, M.A. (2006). Strategic human resources management: where do
we go from here? Journal of Management, 32(6), 898-925.
Berger, L.A. & Berger, D.R. (2004). The talent management handbook. New York:
McGraw-Hill.
Berliandaldo, M. & Hidayat, A. (2017). Implementing talent management approach, to
improve non-tax revenue in center for innovation. International Journal of Business and
General Management (IJBGM), 6(6), 47-56.
Bezuidenhout, A. & Nenungwi, A.L. (2012). A competency framework for the small
business sector in Johannesburg South Africa. African Journal of Business Management,
6(47), 11658-11669.
188
Bhattacharyya, Y. (2015). Employee engagement as a predictor of seafarer retention: A
study among Indian officers. The Asian Journal of Shipping and Logistics, 31(2), 295-
318.
Bjorkman, I., Ehrnrooth, M., Houlund, M., Makela, k., Smale, A. & Sumelius, J. (2013).
Talent or not? Employee reactions to talent identification. Human Resource Management,
52(2), 195-214.
Bless, C., Higson-Smith, C. & Sithole, S.L. (2013). Fundamentals of social research
methods. An African perspective. (5th edition). Cape Town: Juta.
Blanchard, N.P. & Thacker, W.J. (2003). Effective training, systems, strategist, and
practices. Michigan: Pearson Prentice Hall.
Blanchard, N.P. & Thacker, W.J. (2007). Effective training: systems, strategies, and
practices. (3rd edition). Michigan: Pearson Prentice Hall.
Booyens, S.W. & Bezuidenhout, M. (2014). Dimensions of healthcare management. (3rd
edition). Cape Town: Juta.
Botha, J.A., Kiley, J., Truman, K. & Tshilongamulenzhe, M.C. (2013). Practising training
and development in South African organisations. (2nd edition). Cape Town: Juta.
Bothner, M.S., Podolny, J.M. & Smith, E.B. (2011). Organising contests for status: The
matthew effect vs the mark effect. Management. Sciences, 57(3), 439-457.
Boudreau, J.W. (2004). Organisational behaviour, strategy, performance and design in
Management Science. Management Science, 50, 1463-1476.
Boudreau, J.W. & Ramstad, P.M. (2005). Talentship, talent segmentation, and
sustainability: A new HR decision science paradigm for a new strategy definition. Human
Resource Management, 44(2), 129-136.
Boudreau, J.W. & Ramstad, P.M. (2007). Beyond HR: The new science of human capital.
Cambridge, MA: Harvard Business Press.
189
Boudreau, J.W. (2013). Appreciating and ‘retooling’ diversity in talent management
conceptual models: A commentary on “The psychology of talent management: A review
and research agenda”. Human Resource Management Review, 23(4), 286-289.
Bradley, A.P. (2016). Talent management for universities. Australian Universities'
Review, 58(1), 13-19.
Brandenburg, U. (2016). The value of administrative staff for internationalization.
International Higher Education, (85), 15-17.
Brinia, V. & Viligennis, E. (2013). The training needs of officers working in the municipal
police. International Journal of Academic Research in Business and Social Sciences,
3(2), 310-322.
Bryman, A. & Bell, E. (2011). Research methodology: Business and management
contexts. Cape Town: Oxford University Press Southern Africa.
Burke, M.J. & Day, R.R. (1986). A cumulative study of the effectiveness of managerial
training. Journal of Applied Psychology, 71(2), 232.
Burke, R.J., Koyuncu, M., Fiksenbaum, L. & Yasemin, T. (2013). Antecedents and
consequences of work engagement among frontline employees in Turkish hotels. Journal
of Transnational Management, 18(3), 191-203.
Bushney, M., Katz, M., Knoke, G., Ludike, J., Meyer, M., Nel, B., Schenk, H., Smith, S.,
Van Niekerk, J., & Wolfson, R. (2012). Managing human resource development: A
strategic learning approach. South Africa: Lexis Nexis.
Campeanu-Sonea, E., Sonea, A., Gabor-Supuran, R. & Muresan, A. (2011).
Organisational competence: A development framework. Management and Marketing,
6(2), 301-318.
Caplan, J. (2011). The value of talent: Promoting talent management across the
organisation. London: Kogan Page.
190
Cappelli, P. (2008a). Talent management for the twenty-first century. Harvard Business
Review, 86(3), 74.
Cappelli, P. (2008b). Talent on demand: Managing talent in an uncertain age. Boston,
MA: Harvard Business School Press.
Cappelli, P. (2013). HR for neophytes. Harvard Business Review, 91(10), 25-27.
Cappelli, P. & Keller, J.R. (2014). Talent management: Conceptual approaches and
practical challenges. The Annual Review Organisational Psychology and Organisational
Behavior, 1(1), 305-331.
Cekada, T.L. (2010). Training needs assessment: Understanding what employees need
to know. Professional Safety, 55(03), 28-33.
Chambers, E.G., Foulon, M., Handfield-Jones, H., Hankin, S.M. & Michaels, E.G. (1998).
The war for talent. McKinsey Q. 3, 44-57.
Chan, L.L. & Idris, N. (2017). Validity and reliability of the instrument using exploratory
factor analysis and Cronbach’s alpha. International Journal of Academic Research in
Business and Social Sciences, 7(10), 400-410.
Chemaiyo, A.K. (2016). Talent management and its importance in today’s organization in
Kenya perspective. A critical review.
Chiu, W., Thompson, D., Mak, W.M. & Lo, K.L. (1999). Re‐thinking training needs
analysis. Personnel Review.
Chuai, X., Preece, D., & Iles, P. (2008). Is talent management just “old wine in new
bottles?” The case of multinational companies in Beijing. Management Research News,
31(12), 901-911.
CIPD. (2016). Labour market outlook spring 2016-views from employers. London:
Chartered Institute of Personnel and Development.
191
Clardy, A. (2008). The strategic role of human resource development in managing core
competencies. Human Resource Development International,11(2), 183-197.
Clarke, N. (2003). The politics of training needs analysis. Journal of Workplace Learning,
15(4), 141-153.
Cleave, S. (1993). A test of the job characteristics model with administrative positions in
physical education and sport. Journal of Sport Management, 7(3), 228-242.
Clinton, A., Emmanuel, O.A. & Denzel, M.M. (2016). Implementation of Skills
Development Act in the South African Construction Industry, Socioeconomica. The
Scientific Journal for Theory and Practice of Socio-economic Development, 5(9), 53-64.
Cobblah, M.A. & Van der Walt, T.B. (2017). Staff training and development programmes
and work performance in the university libraries in Ghana. Information Development,
33(4), 375-392.
Coetsee, L.D. (2004). Peak performance and productivity: A practical guide for creation
of a motivating climate. (2nd edition). Potchefstroom: Ons Drukkers.
Cole, G.A. (2004). Management theory and practice. (6th edition). London: Book Power.
Cengage Learning EMEA.
Collings, D.G. (2014). Toward mature talent management: beyond shareholder value.
Human Resource Development Quarterly, 25(3), 301-319.
Collings, D.G & Mellahi, K. (2009). Strategic talent management: A review and research
agenda. Human Resource Management Review, 19(4), 304-313.
Collings, D.G., Scullion, H., & Vaiman (2015). Talent management: Progress and
prospects. Human Resource Management Review, 25 (2015), 233-235.
Collins, A.M., Hilslop, D., & Cartwright, S. (2016). Social support in the workplace
between teleworkers, office-based colleagues and supervisors. New Technology, Work
and Employment, 31(2), 161-175.
192
Coulson-Thomas, C. (2012). Talent management and building high performance
organisations. Industrial and Commercial Training, 44(7), 429-438.
Courtney, M. & Gordon, R. (2013). Determining the number of factors to retain in EFA:
Using the SPSS R-menu v2 0 to make more judicious estimations. Practical Assessment,
Research and Evaluation, 18(1), 8.
CPI. (2015). 6 Considerations on how often your organisation should train. (CPI White
Paper), Crisis Prevention Institute.
Creswell, J.W. (2013). Research design: Qualitative, quantitative, and mixed methods
approaches. United states of America: Sage.
Creswell, J.W. (2014). A concise introduction to mixed methods research. United States
of America: Sage.
Culbertson, M.J. (2013). A crash course in factor analysis. Retrieved from:
www.istem.illions.edu (accessed on July 2020).
Cummings, T.G. & Worley, C.G. (2001). Essentials of organization development and
change. Cincinnati, OH: South-Western College Publishing.
DeCarlo, L.T. (1997). On the meaning and use of kurtosis. Psychological Methods, 2(3),
292-307.
Denby, S. (2010). The importance of training needs analysis. Industrial and Commercial
Training, 42(3), 147-150.
Destiny, D. (2016). Assessment of communication skills: A training needs for senior
administrators in tertiary institutions in Rivers State, Nigeria. Journal of Educational Policy
and Entrepreneurial Research, 3(4), 8-13.
193
De Vos, A.S., Strydom, H., Fouché, C.B. & Delport, C.S.L. (2013). Research at grass
roots: For the social sciences and human service professions. (4th edition). Pretoria: Van
Schaik.
Dlamini, W., & Mulaudzi, M.C. (2016). Unravelling procurement skills and capacity
constraints in an open distance learning (ODL) environment. Research Journal of
Business and Management, 3(2), 120-129.
Dries, N. (2013). The psychology of talent management: A review and research agenda.
Human Resource Management Review, 23(4), 272-285.
Dries, N. & Pepermans, R. (2008). Real high-potential careers: An empirical study into
perspectives of organisations and high potentials. Personnel Review, 37(1), 85-108.
Dries, N. & Pepermans, R. (2012). How to identify leadership potential: Development and
testing of a consensus model. Human Resource Management, 51(3), 361-385.
Du Plooy-Cilliers, F., Davis, C. & Bezuidenhout, R. (2014). Research matters. Cape
Town: Juta.
Effah, P. (1998). The training and development of academic libraries in Ghana. Library
Management, 19(1/2), 37-41.
Enojo, A., Ojonemi, P.S. & Williams, J.A. (2016). Training and development in Lokoja
Local Government Council Kogi State, Nigeria 2003-2009, European Journal of Training
and Development Studies, 3(2), 47-66.
EPI INFO. Version 7.2.3.1. Division of Health Informatics and Surveilance (DHIS), Center
for Surveilance, Epidemiology and Laboratory Services, Center for Disease Control
(CDC), USA.
Erasmus, B.J. & Joubert, J.P.R. (2017). Information and communication technology skills
in higher education; the case of a distance learning institution. Journal of Contemporary
Management, 14(1), 1010-1034.
194
Erasmus, B., Loedolff, P., Mda. T. & Nel, P. (2013). Managing training and development.
(6th edition). Cape Town: Oxford University Press Southern Africa.
Erasmus, B., Loedolff, P., Mda. T. & Nel, P. (2015). Managing training and development.
(7th edition). Cape Town: Oxford University Press Southern Africa.
Erasmus, B., Naidoo, L. & Joubert, P. (2017). Talent management implementation at an
open distance e-learning higher educational institution: The views of senior line
managers. International Review of Research in Open and Distributed Learning, 18(3), 83-
98.
Erffmeyer, R.C., Russ, K.R. & Hair, J.F. (Jr). (1991). Needs assessment and evaluation
in sales-training programs Journal of Personal Selling and Sales Management, 11(1), 17-
31.
Esmaeili, N. (2016). Importance of talent management in reducing employees’ turnover
intentions. International Journal of Humanities and Cultural Studies (IJHCS) ISSN 2356-
5926, 2019-2026.
Farndale, E., Scullion, H. & Sparrow, P. (2010). The role of the corporate HR function in
global talent management. Journal of World Business, 45(2), 161-168.
Fajcikova, A., Urbancova, H. & Kucirkova, L. (2017). Implementation of talent
management activities in the Czech Organisations. In Proceedings of the 14th
International Conference on efficiency and responsibility in education. Prague:08-09.
Farley, C. (2005). HRS role in talent management and driving business results.
Employment Relations Today, 32(1), 55-61.
Farooq, M. & Khan, M.A. (2011). Impact of training and feedback on employee
performance. Far East Journal of Psychology and Business, 5(1), 23-33.
Ferdous, T. & Razzak, B.M. (2012). Importance of training needs assessment in the
banking sector of Bangladesh: a case study on National Bank Limited (NBL). International
Journal of Business and Management, 7(10), 63-67.
195
Ferreira, R.R. & Abbad, G. (2013). Training needs assessment: where we are and where
we should go. BAR-Brazilian Administration Review, 10(1), 77-99.
Field, A. (2009). Discovering statistics using SPSS. London: Sage.
Field, A.P. (2018). Discovering statistics using IBM SPSS statistics. Vol Fifth. London:
Sage.
Forman, D.C. (2005). Principles of human capital management. White River, VT: Human
Capital Institute.
Gallardo-Gallardo, E., Dries, N. & González-Cruz, T.F. (2013). What is the meaning of
‘talent’in the world of work? Human Resource Management Review, 23(4), 290-300.
Gallardo-Gallardo, E., Nijs, S., Dries, N. & Gallo, P. (2015). Towards an understanding of
talent management as a phenomenon-driven field using bibliometric and content
analysis. Human Resource Management Review, 25(3), 264-279.
Gallardo-Gallardo, E. & Thunnissen, M. (2016). Standing on the shoulders of giants? A
critical review of empirical talent management research. Employee Relations, 38(1), 31-
56.
Garrow, V., & Hirsch, W. (2008). Talent management: Issues of focus and fit. Public
Personnel Management, 37(4), 389-402.
George, A. & Jacob, S.K. 2016. Training need analysis and job preference of students.
Management, 144, 2.
Ghosh, P. (2015). Training needs analysis: A comparative study of private sector vs.
public sector hotels in Chandigarh. Clear International Journal of Research in Commerce
and Management, 6(6), 68-79.
Goad, T.W. (2010). First-time trainer. The AMACOM Div American Mgmt Assn.
196
Gomez-Metjia, L.R., Balkin, D.B. & Robert, L.C. (2004). Managing human resources. (4th
edition). USA: Prentice Hall.
Hafez, E., AbouelNeel, R. & Elsaid, E. (2017). An exploratory study on how talent
management affects employee retention and job satisfaction for personnel administration
in Ain Shams University Egypt. Journal of Management and Strategy, 8(4), 1.
Hartoyo, R., Efendy, H. & Utama, T.M. (2017). Development of training needs analysis in
organization. Journal of Management Research, 9(4), 140-159.
Heinen, J.S. & O'Neill, C. (2004). Managing talent to maximize performance. Employment
Relations Today, 31, 67-82.
Hess, N. & Jepsen, D.M. (2009). Career stage and generational differences in
psychological contracts. Career Development International, 14(3), 261-283.
Holton, E., Bates, R. & Naquin, S. (2000). Large-scale performance driven training needs
assessment: A case study. Public Personnel Management, 29(2), 249-268.
Hughes, J.C. & Rog, E. (2008). Talent management: A strategy for improving employees
recruitment, retention, and engagement within hospitality organisations. International
Journal of Contemporary Hospitality Management, 20(7), 743-757.
Huka, G.S., Mbugua, Z.K. & Njehia, B. (2015). Effects of business training needs analysis
on competencies of trainees: The Kenyan experience. Journal of Humanities and Social
Science, 20(1), 76-85.
Hunter, F. (2018). Training administrative staff to become key players in the
internationalization of higher education. International Higher Education, (92), 16-17.
Hurlimann, A., March, A. & Robins, J. (2013). University curriculum development–stuck
in a process and how to break free. Journal of Higher Education Policy and Management,
35(6), 639-651.
197
Ibegbulam, I. & Eze, J.U. (2016). Training needs of paraprofessional library staff in
university libraries in South-East Nigeria. Library Management, 37(8/9), 482-495.
IBM Corp. (2017). IBM SPSS statistics for Windows. Version 25.0 Armonk. NY: IBM Corp.
Iles, P., Chuai, X. & Preece, D. (2010). Talent management and HRM in multinational
companies in Beijing: Definitions, differences and drivers. Journal of World Business,
45(2), 179-189.
Insights, D. (2018). The fourth industrial revolution is here—are you ready. Report. UK:
Deloitte Insight, 1-23.
Iqbal, M.Z. & Khan, R.A. (2011). The growing concept and uses of training needs
assessment. Journal of European Industrial Training, 35(5), 439-466.
Jackson, S.L. (2011). Research methods and statistics: A critical thinking approach.
Wadsworth Cengage Learning: Singapore.
Jamil, R. & Som, H.M. (2007). Training needs analysis: Practices of top companies in
Malaysia, International Review of Business Research Papers, 3(3), 162-175.
Joyce, W. F. & Slocum, J.W. (2012). Top management talent, strategic capabilities, and
firm performance. Organizational Dynamics, 41(3), 183-193.
Jung, J., & Shin, J.C. (2015). Administrative staff members’ job competency and their job
satisfaction in a Korean research university. Studies in Higher Education, 40(5), 881-901.
Jusoh, Z., Atek, E.S.B.E., Omar, S.N.M.B.S., Azmi, M.N.B.L. & Abdullah, A.T.H.B. (2018).
Investigation into non-academic staff communication apprehension in using English
language. International Journal of Asian Social Science, 8(9), 677-685.
Kaiser, H.F. (1974). An index of factorial simplicity. Psychometrika, 39(1), 31-36.
Kaur, I. (2015). To study various impact of training and development in organization.
Journal for Studies in Management and Planning, 1(3), 645-657.
198
Kayode, T. (2001). The role of training in change management. Journal of the Institute of
Personnel Management of Nigeria, 10(1), 24-31.
Kennedy, E. & Daim, T.U. (2010). A strategy to assist management in workforce
engagement and employee retention in the high-tech engineering environment.
Evaluation and Program Planning, 33(4), 468-476.
Kermally, S. (2004). Developing and managing talent: A blueprint for business survival.
London: Thorogood.
Khan, A. & Masrek, M.N. (2017). Training needs analysis based on mismatch between
the acquired and required levels of collection management skills of academic librarians.
Collection Building, 36(1), 20-28.
Khan, A., Masrek, M.N. & Nadzar, F.M. (2015). An investigation of the training needs on
emotional intelligence of academic librarians. Library Review, 64(8/9), 597-613.
Khan, W.Z. & Al Zubaidy, S. (2016). Engineering design approach in Marine engineering:
A bridge between training need analysis (TNA) and engineering education. The
International Journal of Engineering and Science (IJES), 5(3), 86-93.
King, K.A. (2015). Global talent management: Introducing a strategic framework and
multiple-actors model. Journal of Global Mobility, (in press), 3(3), 273-288.
Kline, T.J. (1999). The team player inventory: Reliability and validity of a measure of
predisposition toward organisational team-working environments. Journal for Specialists
in Group Work, 24(1), 102-112.
Knafl, G.J. & Grey, M. (2007). Factor analysis model evaluation through likelihood cross-
validation. Statistical Methods in Medical Research, 16(2), 77-102.
Kock, H., & Ellström, P.E. (2011). Formal and integrated strategies for competence
development in SMEs. Journal of European Industrial Training, 35(1), 71-88.
199
Koech, H.K. & Nzulwa, J. (2017). Determinants of staff training needs analysis in kenyan
manufacturing firms: A case of kenya tea development agency limited. The Strategic
Journal of Business and Change Management, 4(2), 20.
Kozlowski, S.W.J. & Salas, E. (2003). A multilevel organisational systems approach for
the implementation and transfer of training. Mahwah, NJ: Lawrence Erlbaum Associates.
Kumar, R. (2014). Research methodology. (4th edition.). London: Sage.
Lai, K.W. & Smith, L.A. (2017). Tertiary students’ understandings and practices of
informal learning: A New Zealand case study. Australasian Journal of Educational
Technology, 33(2).
Leedy, P.D. & Ormrod J.E. (2013). The nature and tools of research. Practical research:
Planning and Design, 1, 1-26.
Leedy, P.D. & Ormrod J.E. (2015). Practical research planning and design. England:
Pearson Education.
Leigh, D., Watkins, R., Platt, W.A. & Kaufman, R. (2000). Alternative Models of Needs
Assessment: Selecting the right one for your Organisation. Human Resource
Development Quarterly, 11(1), 87-94.
Lewis, R.E. & Heckman, R.J. (2006). Talent management: A critical review. Human
Resource Management Review, 16(2), 139-154.
Ligthelm, A.A., Martins, J.H. & Van Wyk, H.D.J. (2005). Marketing research in practice.
Pretoria: Unisa Press:1-749.
Lin, W.Z. (2006). The new key word 'talent management' in retaining top employees.
Human Capital Magazine.
Lopez-Cotarelo, J. (2013). A 'flat' model of organisational routines: examining variation
and repetition across space and over time. 29th EGOS Colloquium, Montreal, July 6.
200
Madhuri, C. & Sundaresan, V. (2018). Factors affecting attrition in the higher education
institutes, Political Science. Abhinav-National Monthly Refereed Journal of Research in
Commerce and Management, 7, 103-111.
Magau, M.D. & Roodt, G. (2010). An evaluation of the human capital BRidgeTM
framework. SA Journal of Human Resource Management, 8(1), 1-10.
Mager, R.F. & Pipe, P. (1984). Analysing performance problems, or, you really oughta
wanna. Belmont, CA: Lake.
Mahapatro, B.B. (2010). Human resources management. New Delhi: New Age
International.
Mahler, W. & Monroe, W. (1952). How industry determines the need for and effectiveness
of training (Report No 929). Kentucky: Personnel Research Branch, Department of the
Army.
Mangkunegara, P. A. (2013). Manajemen sumber daya manusia perusahaan. Bandung:
PT. Remaja Rosdakarya.
Manlove, E. & Guzell, J. (1997). Intention to leave, anticipated reasons for leaving and
12-month turnover of childcare center staff. Early Childhood Research Quarterly, 12(2),
145-167.
Manna, R., Singh, A. & Sharma, P. (2016). Does training need analysis help to minimize
competency gap: an investigation. Amity Journal of Training and Development, 1(1), 109-
131.
Marjani, A.B. & Safaee, N. (2016). Ranking the driving affecting factors on talent
management. Journal of Administrative Management, Education and Training, 12(3),
300-306.
Martel, L. (2003). Finding and keeping high performers: Best practices from 25 best
companies. Employment Relations Today, 30(1), 27.
201
Maylor, H. & Blackmon, K. (2005). Researching business and management: A roadmap
for success. Basingstoke: Palgrave Macmillan.
Mathias, R.L. & Jackson, J.H. (2006). Human resources management. (11th edition).
Thomson South-Western, Cincinnati, Ohio: South-Western Publishing.
Mazhisham, P.H., Khalid, M.Y., Nazli, N N.N.N., Manap, R. & Hussain, N.H.M. (2018).
Identification of training needs assessment in organizational context. International Journal
of Modern Trends in Social Science, 1(5), 20-30.
McDermott, A.M., Conway, E., Rousseau, D.M. & Flood, P.C. (2013). Promoting effective
psychological contracts through leadership: the missing link between HR strategy and
performance. Human Resource Management, 52(2), 289-310.
McDonnell, A. (2011). Still fighting 'the war if talent'? Bridging the science versus practice
gap. Journal of Business and Psychology, 26(2), 169-173.
McFadyen, J. & Rankin, J. (2016). The role of gatekeepers in research: Learning from
reflexivity and reflection. GSTF Journal of Nursing and Health Care, 4(1), 82-88.
McGehee, W. & Thayer, P.W. (1961). Training in business and industry, New York, NY:
Wiley.
McKillip, J. (1987). Need analysis: tools for the human service and education. Applied
social research methods series. Thousand Oaks, CA: Sage.
Meek, V.L., Goedegebuure, L., Santiago, R. & Carvalho, T. (2010). Introduction in the
changing dynamics of higher education middle management, ed. Dordrecht: Springer, 1-
14.
Meyers, M.C. & Van Woerkom, M. (2014). The influence of underlying philosophies on
talent management: Theory, implications for practice, and research agenda. Journal of
World Business, 49(2), 192-203.
202
Michaels, E., Handfield-Jones, H. & Axelrod, B. (2001). The war of talent. Boston: Harvard
Business School Press.
Miller, J. & Osinski, D. (1996). Training needs assessment. Retrieved from: http://www.
ispi. org/pdf/suggestedReading (accessed on 31 November 2018).
Mishra, S. (2008). The talent powered organisation: Strategies for globalisation, talent
management and high performance. Talent Development, 62(1), 80-81.
Moczydlowska, J. (2012). Talent management: Theory and practice of management. The
polish experience. International Journal of Bussiness Economic Research, 3(1), 432-438.
Mokgojwa, D., Barkhuizen, N. & Schutte, N. (2017). The development of a talent risk
management tool for academics in South African education institutions. Readings Book,
525. Esma.
Mollick, E. (2012). People and process, suits and innovators: the role of individuals in firm
performance. Strategic Management Journal, 33(9), 1001-1015.
Moore, M.L. & Dutton, P. (1978). Training needs analysis: review and critique. Academy
of Management Review, 3, 532-545.
Morton, L. (2004). Integrated and integrative talent management: A strategic HR
framework, research report R-134504-RR. New York: Conference Board.
Morton, SMB, Bandara. DK, Robinson, EM & Carr, PEA. 2012. In the 21st Century, what is an acceptable response rate? Australian and New Zealand Journal of Public Health, 36(2). Retrieved from: https://doi.org/10.1111/j.1753-6405.2012.00854.x (accessed on June 2018).
Mouton, J., & Marais, H. C. (1996). Basic concepts in the methodology of the social
sciences. Pretoria.
Mukwawaya, O.Z. (2015). Job satisfaction and organisational commitment in a changing
environment: Insights from employees of Sefako Makgatho Health Sciences University.
(Published master’s thesis). University of Limpopo.
203
Muma, M., Iravo, A. & Omondi, M. (2014). Effect of training needs assessment on
employee commitment in public universities: A case study of Jomo Kenyatta University
of Agriculture and Technology. International Journal of Academic Research in Business
and Social Sciences, 4(9), 233-249.
Nafei, W.A. (2015). Talent management and health service quality from the employee
perspective: a study on teaching hospitals in Egypt. American International Journal of
Social Science, 4(1), 91-110.
Nazli, N.N.N.N., Sipon, S. & Radzi, H.M. (2014). Analysis of training needs in disaster
preparedness. Procedia-Social and Behavioral Sciences, 140, 576-580.
Netswera, F.G. & Rankhumise, E.M. (2005). Employee retention factors for South African
higher education institutions: A case study. SA Journal of Human Resource Management,
3(2), 36-40.
Ngéthe, J.M. (2014). Academic staff retention in public universities in Kenya. PhD Thesis.
Nijs, S., Gallardo-Gallardo, E., Dries, N., & Sels, L. (2014). A multidisciplinary review into
the definition, operationalization, and measurement of talent. Journal of World Business,
49(2), 180-191.
Nilsson, S. & Ellstrom, P.-E. (2012). Employability and talent management: challenges
for HRD practices. European Journal of Training and Development, 36(1), 26-45.
Nicholson, N. (2010). The design of work-an evolutionary perspective. Journal of
Organisational Behavior, 31(2-3), 422-431.
Nudy, B.N. (2015). Impact of training practices on employees and organization
performance in telecommunication companies, Republic of Congo. International Journal
of Technology Enhancements and Emerging Engineering Research, 3(9), 86-90.
204
Nwanzu, C.L. & Uche-Okolo, O.C. (2017). Influence of training and development on job
performance among non-academic staff of Delta State Polytechnic, Ogwashi-Uku,
Nigeria. African Journal for the Psychological Studies of Social Issues, 20(2), 177-187.
Nwoke, N., Worlu, R.E. & Akinbiyi, F. (2016). Effect of talent development on employee
retention in Smes in Ogun State. Journal of Business and Value, 5(2), 129-137.
Nwokoye, E.S. & Uwajumogu, N.R. (2017). Digital mentoring and capacity building of
non-academic staff in Nigerian universities: Insights from Nnamdi Azikiwe University
Awka Anambra State (Unizik), and Federal University, Ndufu-Alike, Ikwo Ebonyi State
(Funai), Nigeria: Fab Anieh Nig. Ltd, Awka.
Obi-Anike, H.O. & Ekwe, M.C. (2014). Impact of training and development on
organizational effectiveness: Evidence from selected public sector organizations in
Nigeria. European Journal of Business and Management, 6(29), 66-75.
O'Driscoll, M. P. P. J. T., & Taylor, P. J. (1992). Congruence between theory and practice
in management training needs analysis. International Journal of Human Resource
Management, 3(3), 593-603.
Okolocha, C.C. & Baba, E.I. (2017). Assessment of skills possessed by secretaries for
effective electronic records management in polytechics in North-Central, Nigeria. Global
Journal of Management and Business Research: A Administration and Management,
17(1), 116-128.
Oldham, G.R. & Hackman, J.R. (2010). Not what it was and not what it will be: The future
of job design research. Journal of Organisational Behavior, 31(2-3), 463-479.
Oldham, G. R., & Fried, Y. (2016). Job design research and theory: Past, present and
future. Organizational Behavior and Human Decision Processes,136, 20–35.
Ologunowa, C.S., Akintunde, B.A. & Adu, B.O. (2015). Manpower training and
development: Pathway to efficient organisational performance. American International
Journal of Research in Humanities, Arts and Social Sciences, 9(1), 44-52.
205
Omonijo, D.O., Oludayo, O.A., Eche, G.A., Uche, O.O.C. & Ohunakin, F. (2015).
Intentional turnover of the administrative staff in a private faith-based higher institution,
Southwest Nigeria. Mediterranean Journal of Social Sciences, 6(2 S1), 424-437.
Pallant, J. (2007). SPSS survival manual: A step by step guide to data analysis using
SPSS for windows. Version 15. (3rd edition). Maidenhead, UK: McGraw Hill/Open
University Press.
Pallant, J. (2011). SPSS survival manual: A step by step guide to data analysis using
SPSS. Crows Nest. New South Wales: Allen & Unwin.
Penalva, J. (2014). The non‐theoretical view on educational theory: Scientific,
epistemological and methodological assumptions. Journal of Philosophy of Education,
48(3), 400-415.
Peterson, N. (2006). Work-based and experiential learning. Reading Package. Faculty of
Education, University of Johannesburg, Johannesburg.
Pfeffer, J. (2001). Fighting the war for talent is hazardous to your organisation's health.
Organisational Dynamics, 29(4), 248-259.
Pfeffer, J. (2006). Stopping the talent drain. Business, 2.0(7), 80-80.
Phillips, J.J. & Connell, A.O. (2003). Managing employee retention: A strategic
accountability approach. Burlington, Butterworth-Heinemann.
Pick, D., Teo, S. & Yeung, M. (2012). Friend or foe? New managerialism and technical,
administrative and clerical support staff in Australian universities. Higher Education
Quartely, 66(1), 3-23.
Pienaar, C. & Bester, C.L. (2008). Addressing career obstacles within a changing higher
education work environment: Perspectives of academic. South African Journal of
Pychology, 39(3), 376-385.
206
Plooy-Cilliers, F., Davis, C. & Bezuidenhout, R. (2014). Research matters. Paarl Media
Paarl, South Africa: Juta.
Poocharoen, O. & Lee, C. (2013). Talent management in the public sector: A comparative
study of Singapore, Malaysia, and Thailand. Public Management Review, 15(8), 1185-
1207.
Punch, K.F. (2014). Introduction to social research: Quantitative and qualitative (3rd
edition). London: Sage.
Rama Devi, V. & Shaik, N. (2012). Evaluating training and development effectiveness: A
measurement model. Asian Journal of Management Research, 2(1), 722-735.
Rao, A.G.S. (2017). Talent management an ongoing issue with higher educational
institutions in India. International Journal of Engineering Technology Science and
Research (IJETSR). Retrieved from: www. ijetsr. com, ISSN, 2394-3386 (accessed on
May 2018).
Raza, H. (2014). Training and development impact on organizational performance:
Empirical evidence from oil and gas sector of Pakistan. IOSR Journal of Business and
Management (IOSR-JBM), 16(1), 67-72.
Rebora, G. & Turri, M. (2010). Change management in universities: More a question of
balance than a pathway. Tertiary Education and Management, 16(4), 285-302.
Reid, M. & Barrington, H. (1994). Handbook of training and development. Gower:
Aldershot.
Rikkua, R. & Chakrabartyb, N. (2013). Training needs analysis: A case study of loco
pilots. Procedia-Social and Behavioral Sciences, 104, 1105-1111.
Robbins, S.P. & Coulter, M. (2010). Management. (11th edition). Upper Saddle River, NJ:
Prentice-Hall.
207
Rothmann, S. & Essenko, N. (2007). Burnout of support staff in a higher education
institution in the North West Province. South African Journal of Psychology, 37, 135-152.
Rothwell, W.J. & Whiteford, A.P. (2012). Corporate employee training and development.
In M. London (Ed.), The Oxford handbook of lifelong learning. Oxford: Oxford University
Press.
Rose, S., Spinks, N., & Canhoto, A. I. (2015). Management research: Applying the
principles. Routledge: Taylor & Francis Group.
Ross, S. (2013). Talent derailment: A multi‐dimensional perspective for understanding
talent. Industrial and Commercial Training, 45(1), 12-17.
Rossett, A. (1987), Training needs assessment. Englewood Cliffs, CA: Educational
Technology Publications.
Rummler, G.A. & Brache, A.P. (1995). Improving performance: how to manage the white
space on the organisation chart. San Francisco, CA: Jossey-Bass.
Saadat, V. & Eskandari, Z. (2016). Talent management: The great challenge of leading
organisations. International Journal of Organisational Leadership, 5(2), 103-109.
Salacuse, J.W. (2006). Leading leaders: How to manage the top talent in your
organization. Ivey Business Journal, 452, 50.
Saleem, Q., Shahid, M. & Naseem, A. (2011). Degree of influence of training and
development on employee’s behavior. International Journal of Computing and Business
Research, 2(3), 2229-6166.
Salkind, N.J. (2012). Exploring research (8th ed). New York, USA: Pearson.
Sanghaik, G.K. (2012). Training as a tool of competency: A study of police training in
Himachal Pradesh. Indian Journal of Public Administration, 58(3), 497-507.
208
Schiemann, W.A. (2014). From talent management to talent optimization. Journal of
World Business, 49(2), 281-288.
Scullion, H., Collings, D.G. & Caligiuri, P (2010). Global talent management. Journal of
World Business, 45(2), 105-108.
Sebalj, D., Holbrook, A. & Bourke, S. (2012). The rise of 'professional staff' and demise
of the 'non-academic': A study of university staffing nomenclature preferences. Journal of
Higher Education Policy and Management, 34(5), 463-472.
Sefako Makgatho Health Sciences University. (2015). Retrieved from:
https://www.intranet.smu.ac.za/document-library (accessed on the 18 March 2020 ).
Sekaran, U. (2000). Research methods for business. New York: John Wiley & Sons.
Sethusa, M.P.S. (2016). Celebrating the first year of Sefako Makgatho Health Sciences
University: Guest editorial. South African Dental Journal, 71(10), 437-437.
Servon, L.J. & Visser, M.A. (2011). Progress hindered: The retention and advancement
of women in science, engineering and technology careers. Human Resource
Management Journal, 21(3), 272-284.
Shaheen, A., Naqvi, S.M.H. & Khan, M.A. (2013). Employees training and organizational
performance: Mediation by employees’ performance, Interdisciplinary Journal of
Contemporary Research in Business, 5 (4), 490-503.
Silzer, R. & Dowell, B.E. (2010). Strategic talent management matters. Strategy-driven
talent management: A leadership imperative, 3-72.
Singh, M.K., Ram, D. & Prasad, A. (2016). Correlates training needs assessment of
assistant agriculture officers of Manipur. Indian Research Journal of Extension Education,
11(21), 120-121.
Smart, B.D. (1999). Topgrading: How leading companies win by hiring, coaching, and
keeping the best people. Paramus, NJ: Prentice Hall Press.
209
Smerek, R.E. & Peterson, M.W. (2007). Examining Herzberg's theory: Job satisfaction
among non-academic employees at a research university. Research in Higher Education,
48(2), 229-250.
Smith‐Jentsch, K.A., Campbell, G.E., Milanovich, D.M. & Reynolds, A.M. (2001).
Measuring teamwork mental models to support training needs assessment, development,
and evaluation: Two empirical studies. Journal of Organizational Behavior: The
International Journal of Industrial, Occupational and Organizational Psychology and
Behavior, 22(2), 179-194.
Soja, E. & Soja, P. (2016). Exploring the role of employee age in improving ICT adoption
projects: Lessons learned from enterprise system practitioners, Twenty-second Americas
Conference on Information Systems, San Diego, 1-10.
Solomon, N.S. (2007). Scholastic listening skills. New York: Scholastic Book Services.
Spector, P.E. (2012). Industrial and organisational psychology: Research and practice.
(6th edition). Singarepore: John Wiley & Sons.
Stahl, G., Björkman, I., Farndale, E., Morris, S. S., Paauwe, J., Stiles, P. & Wright, P.
(2012). Six principles of effective global talent management. Sloan Management Review,
53(2), 25-42.
Stone, R.D. (2009). Achieving results with a performance‐centered design framework.
Performance Improvement, 48(5), 37-44.
Sorenson, S. (2002). Training for the long run. Engineered Systems, 19(6), 32.
South Africa. (1996). The Constitution of the Republic of South Africa 108 of 1996.
Pretoria: Government Printers.
Takács-György, K. & Takács, I. (2017). Talent management in higher education – a case
study from hungary. International Journal of Contemporary Management,16(3), 157-188.
210
Tansley, C., Harris, L., Stewart, J. & Turner, P. (2007). Talent management: Strategies,
policies and practices. London: Chartered Institute of Personnel and Development.
Tao, Y-H., Yeh, R. & Sun, S-I. (2006). Improving training needs assessment processes
via the internet: system design and qualitative study. Internet Research, 16, 427-449.
Retrieved from: http://dx.doi.org/10.1108/10662240610610690043 (accessed on May
2018).
Tarique, I. & Schuler, R. S. (2010). Global talent management: Literature review,
integrative framework, and suggestions for further research. Journal of World Business,
45, 122-133.
Taylor, P.J., O’Driscoll, M.P. & Binning, J.F. (1998). A new integrated framework for
training needs analysis. Human Resource Management Journal, 8, 29-51.
Teffu, M.E. (2014). Aligning employee training needs and workplace skills plan in the
Limpopo Department of Health: A case of Sekhukhune District (Published Master’s
thesis). University of Limpopo.
Terera, S.R. & Ngirande, H. (2014). The impact of training on employee job satisfaction
and retention among administrative staff members: A case of a selected tertiary
institution. Journal of Social Sciences, 39(1), 43-50.
Tetik, S. (2016). Talent management: A review of theoretical perspectives and a guideline
for practioners. Nile Journal of Business and Economics, 2(4), 40-56.
Thunnissen, M. (2016). Talent management: For what, how and how well? An empirical
exploration of talent management in practice. Employee Relations, 38(1), 57-72.
Thunnissen, M., Boselie, P. & Fruytier, B. (2013). Talent management and the relevance
of context: Towards a pluralistic approach. Human Resource Management Review, 23(4),
326-336.
Tracey, W.R. (2004). The human resources glossary: The complete desk reference for
HR executives, managers, and practitioners (3rd edition). New York, NY: CRC Press
211
Turner, P. & Kalman, D. (2015). Make your people before making your products. Human
Resource Management International Digest, 23(1), 28-31.
UNISA Ethical Policy. (2012). University of South Africa, Pretoria.
Uren, L. & Jackson, R. (2012). What talent wants: The journal to talent segmentation.
Jackson Samuel. Retrieved from: www.jacksonsamuel.com; (accessed on 12 June
2018).
Vaiman, V. & Collings, D.G. (2013). Talent management: advancing the field. The
International Journal of Human Resource Management, 24(9), 1737-1743.
Vaiman, V., Haslberger, A., & Vance, C. M. (2015). Recognizing the important role of self-
initiated expatriates in effective global talent management. Human Resource
Management Review, 25(3), 280-286.
Van Antwerpen, S. & Ferreira, E. (2016). Contributing factors to poor service delivery by
administrative employees in the Gauteng public service in South Africa. Africa
Development, 41(1), 81-98.
Van Wyk, B. (2012). Research design and methods Part I. Cape Town: University of
Western Cape.
Van Zyl, E.S., Mathafena, R.B. & Ras, J. (2017). The development of a talent
management framework for the private sector. SA Journal of Human Resource
Management, 15(1), 1-19.
Vathanophas, V. (2007). Competency requirements for effective job performance in Thai
public sector. Contemporary Management Research, 3(1), 45-45.
Velicer, W.F., Eaton, C.A. & Fava, J.L. (2000). Construct explication through factor or
component analysis: A review and evaluation of alternative procedures for determining
the number of factors or components. In R.D. Goffin & E. Helmes (Eds.), Problems and
solutions in human assessment: Honoring Douglas Jackson at seventy. Boston, MA:
Kluwer.
212
Vinesh, E. (2014). Role of training and development in an organisational development.
International Journal of Management and International Business Studies, 4(2), 213-220.
Vladescu, A. (2012). The possibility of implementing talent management in the public
sector. Management and Marketing, 7(2), 351.
Volkwein, J.F. & Zhou, Y. (2003). Testing a model of administrative job satisfaction.
Research in Higher Education, 44(2), 149-171.
Wagner, S.E. (2006). Satisfied to "engaged". Nursing Management Journal, (25).
Retrieved from: www.dirjournal.com/guides/motivating-your-staff (accessed on 4 August
2018).
Walker, R. (2010). Teaching the pronunciation of English as a lingua franca. Oxford:
Oxford University Press, 345.
Wamwayi, S.K., Iravo, M.A., Elegwa, M. & Gichuhi, A.W. (2016). Role of training needs
assessment in the performance of non-teaching employees at management level in
public universities in Kenya. International Journal of Scientific and Research Publications,
6(8), 242-257.
Welman, C., Kruger, F. & Mitchell, B. (2005). Research methodology. (3rd edition). Cape
Town: Oxford University Press.
Whitchurch, C. & Gordon, G. (2010). Diversifying academic and professional identities in
higher education: Some management challenges. Tertiary Education and Management,
16(2), 129-144.
Wikstrom, C. & Martin, H. (2012). Talent management is praktiken. Stockholm: Ekerlids
Forlag.
Williamson, D. (2011). Talent management in the new business world: How organisations
can create the future and not consumed by it. Human Resource Management
International Digest, 19(6), 33-36.
213
Wood, S., Van Veldhoven, M., Croon, M. & De Menezes, L. M. (2012). Enriched job
design, high involvement management and organizational performance: The mediating
roles of job satisfaction and well-being. Human Relations, 65(4), 419-445.
Wright, P. & Gregory, G. (1992). Needs analysis theory and the effectiveness of large-
scale governmental-sponsored training programmes: A case study. Journal of
Management Development, 11(5), 16-27.
Yasin, M. (2014). Talent management to support the transformation of human resource.
Management Studies, 2(6), 387-399.
Yener, M.I., Gurbuz, F.G. & Pinar, A.C.A.R. (2017). Development and validation of a
talent management measurement instrument. Journal of Business Economics and
Finance, 6(3), 233-245.
Yost, P.R. & Chang, G. (2009). Everyone is equal, but some are more equal than others.
Industrial and Organizational Psychology, 2(4), 442-445.
Yousif, A.K., Ahmed, O.Y. & Osman, W.N. (2019). Training needs assessment of
academic teaching staff in faculty of dentistry, University of Gezira, Sudan 2018.
Education in Medicine Journal, 11(1), 31-41.
Zainuddin, H. & Isa, M.M. (2014). Effect of human and technology interaction: computer
vision syndrome among administrative staff in a public university. International Journal of
Business, Humanities and Technology, 4(3), 38-44.

214
ANNEXURES
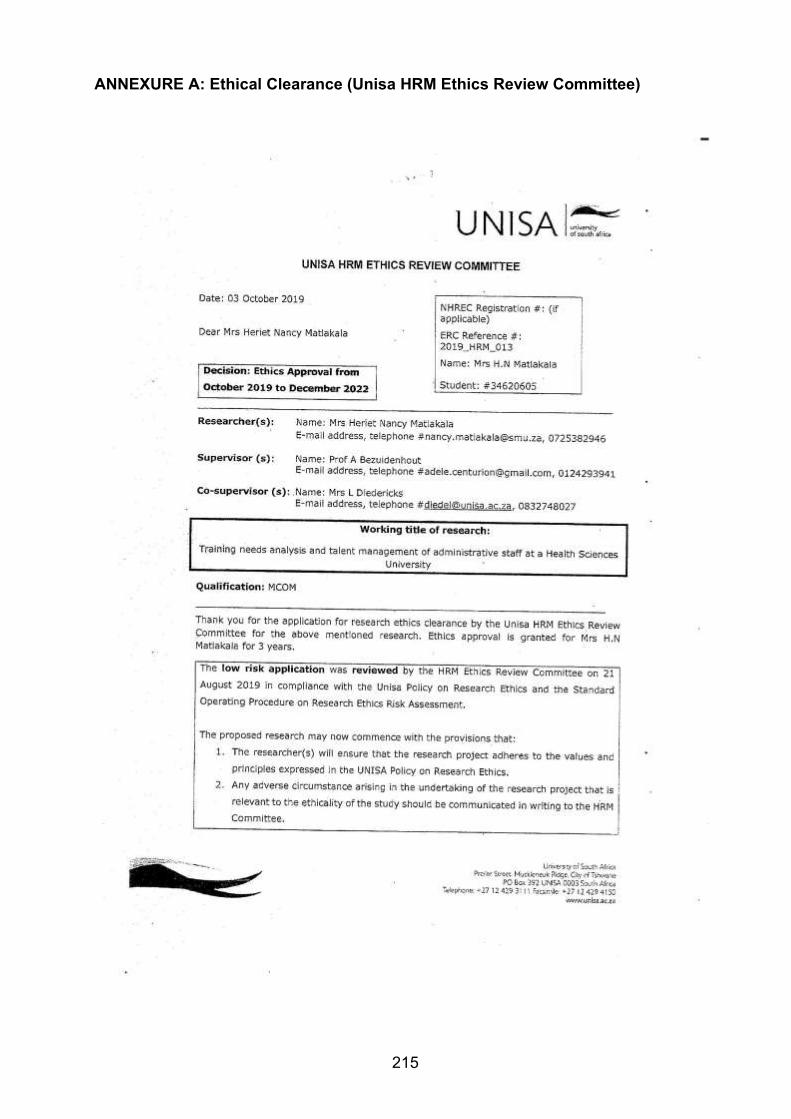
215
ANNEXURE A: Ethical Clearance (Unisa HRM Ethics Review Committee)
216
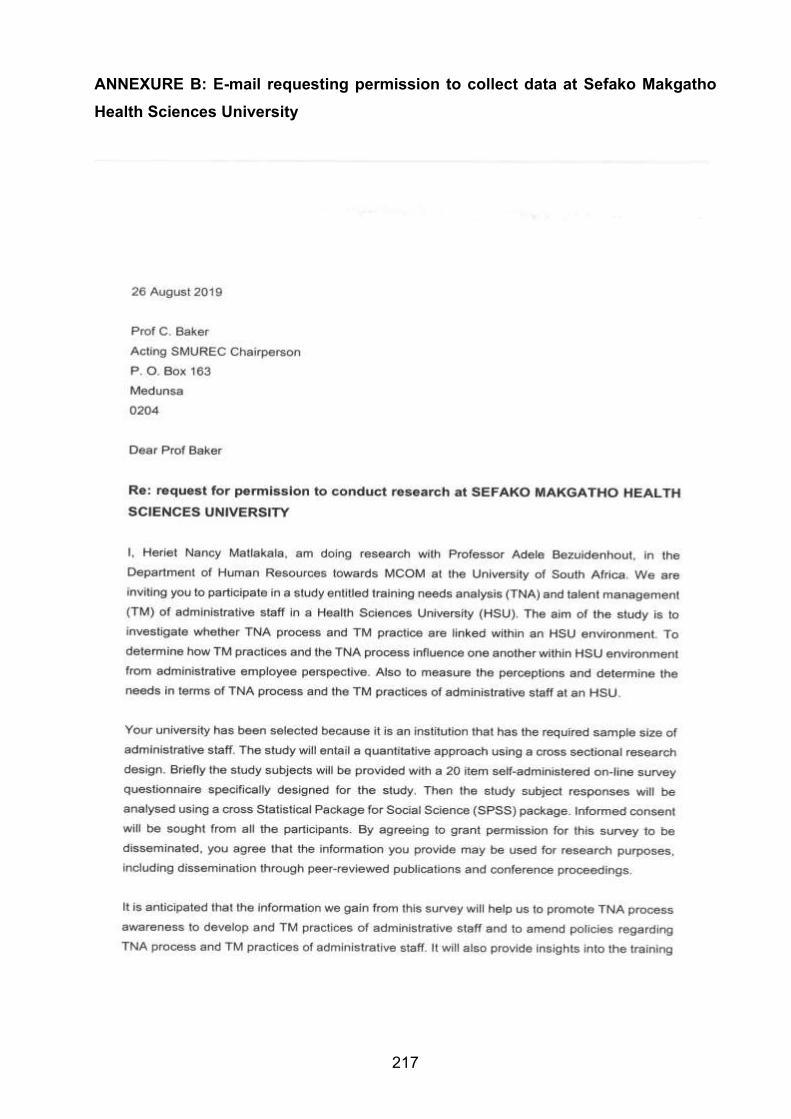
217
ANNEXURE B: E-mail requesting permission to collect data at Sefako Makgatho
Health Sciences University
218
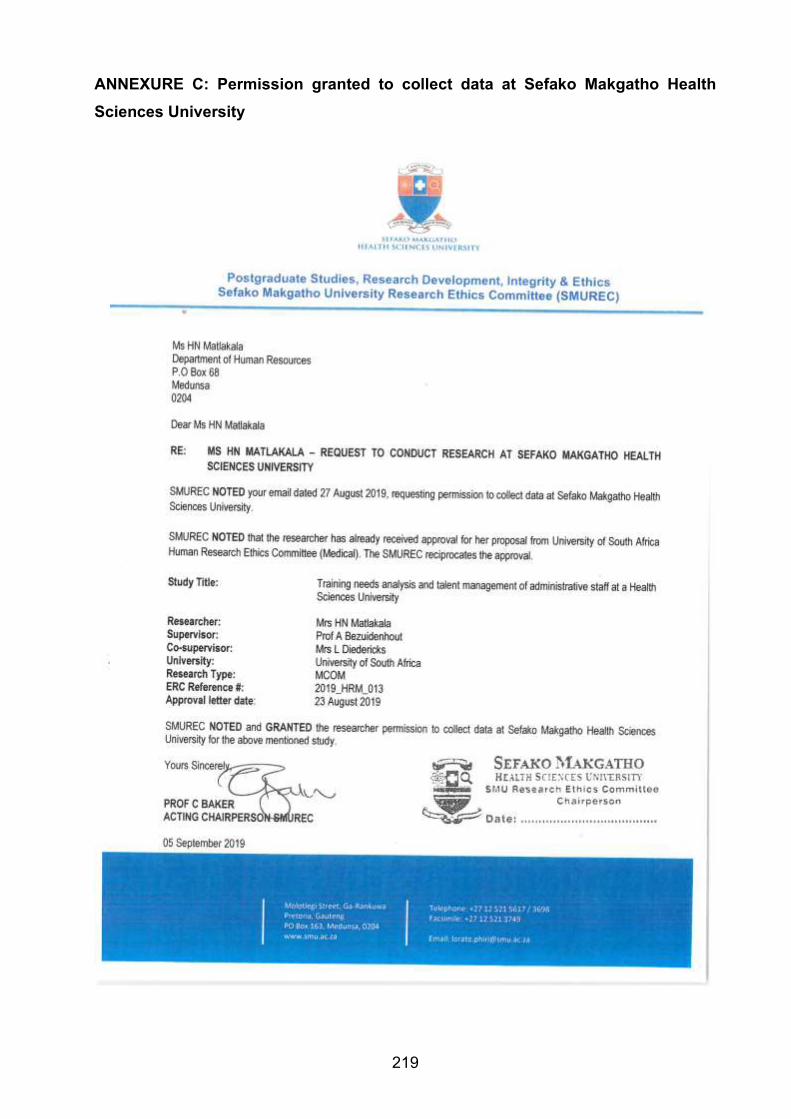
219
ANNEXURE C: Permission granted to collect data at Sefako Makgatho Health
Sciences University
220
ANNEXURE D: Consent letter (administrative staff member)
Dear administrative staff member
We are interested in understanding the elements of training needs analysis and talent
management of administrative staff at a Health Sciences University (HSU). The study will be used
for the Masters Dissertation and publication by the researchers. Furthermore, the study will benefit
the university to explore and improve implementation of best practices of training needs analysis
and talent management. Please note the following information regarding your participation in this
study:
Confidentiality of information received from you will be highly maintained.
Your name will not appear anywhere in the research and you cannot be identified in person on
the basis of your answers. The researchers do not foresee any risks for you as a respondent in
this research project. You will not be required to make any financial contribution to the study.
Your participation in this study is voluntary, and it will only take approximately 25 minutes of your
time. However, you are encouraged to participate as the findings of this study will enhance the
performance of the entire administrative staff.
You have the right to withdraw at any point during the study, for any reason, and without any
prejudice.
You are free to contact the researchers at any time during the research if you have any questions
or if you need more information about this study:
[email protected] Tel: 012 521 4054
[email protected] Tel: 012 429 3941
In order to indicate that you have read and understand the information given above click either
one of the two choices:
I consent, begin the study I do not consent, I do not wish to participate
221
ANNEXURE E: Questionnaire
SECTION A: DEMOGRAPHIC INFORMATION
Kindly fill the information below pertaining to your profile. This information will only be used for
research purposes. Only the results of this study will be shared with Health Sciences University
management for the purpose of improving organisational efficiency. Please do not write your
name or any other information that may facilitate tracing your identity. Please tick below.
1. Gender
o Female
o Male
2. Age in years ______
3. Job title
o Secretary
o Administrative Officer
4. Academic Qualifications
o Certificate
o Diploma
o Degree
o Honours
o Masters
o PHD
5. Job level
o Peromnes grade 11
o Peromnes grade 10
o Peromnes grade 09
o Peromnes grade 08
6. Work experience in years _______
7. Please indicate your department or school _________________________
8. Please indicate how long you have worked at the Health Sciences University
____________________________________________________________
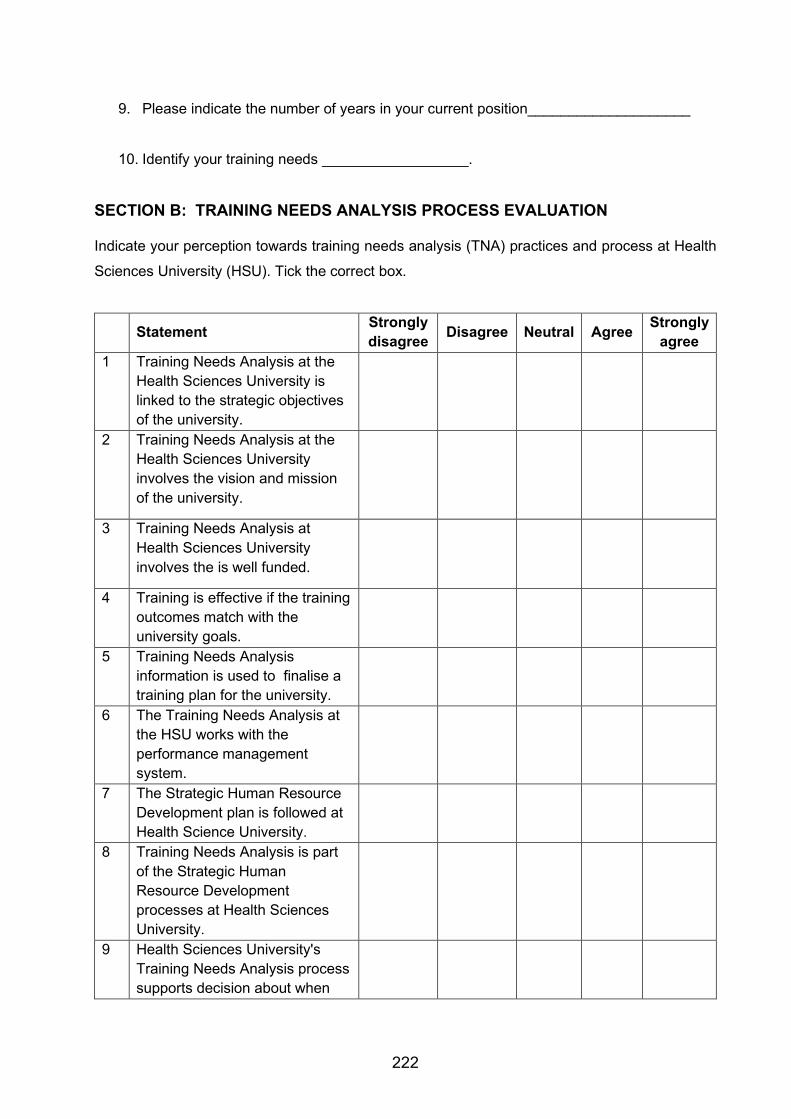
222
9. Please indicate the number of years in your current position____________________
10. Identify your training needs __________________.
SECTION B: TRAINING NEEDS ANALYSIS PROCESS EVALUATION
Indicate your perception towards training needs analysis (TNA) practices and process at Health
Sciences University (HSU). Tick the correct box.
Statement
Strongly
disagree Disagree Neutral Agree
Strongly
agree
1 Training Needs Analysis at the
Health Sciences University is
linked to the strategic objectives
of the university.
2 Training Needs Analysis at the
Health Sciences University
involves the vision and mission
of the university.
3 Training Needs Analysis at
Health Sciences University
involves the is well funded.
4 Training is effective if the training
outcomes match with the
university goals.
5 Training Needs Analysis
information is used to finalise a
training plan for the university.
6 The Training Needs Analysis at
the HSU works with the
performance management
system.
7 The Strategic Human Resource
Development plan is followed at
Health Science University.
8 Training Needs Analysis is part
of the Strategic Human
Resource Development
processes at Health Sciences
University.
9 Health Sciences University's
Training Needs Analysis process
supports decision about when
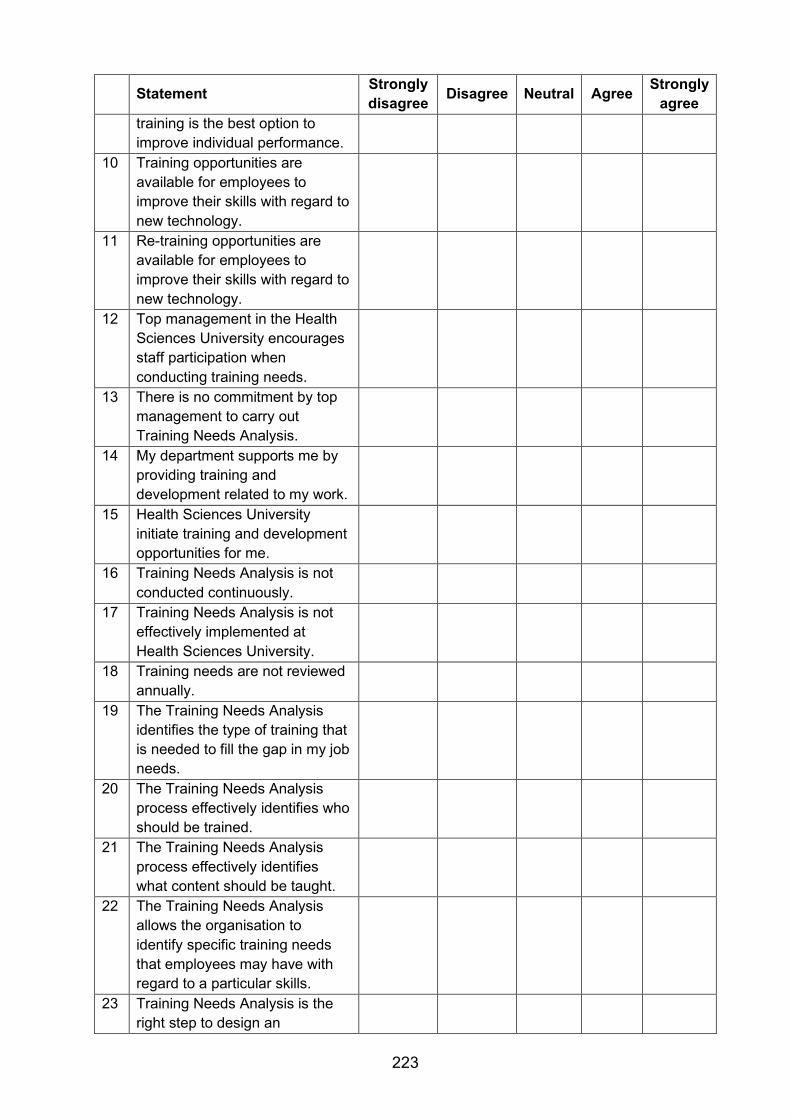
223
Statement
Strongly
disagree Disagree Neutral Agree
Strongly
agree
training is the best option to
improve individual performance.
10 Training opportunities are
available for employees to
improve their skills with regard to
new technology.
11 Re-training opportunities are
available for employees to
improve their skills with regard to
new technology.
12 Top management in the Health
Sciences University encourages
staff participation when
conducting training needs.
13 There is no commitment by top
management to carry out
Training Needs Analysis.
14 My department supports me by
providing training and
development related to my work.
15 Health Sciences University
initiate training and development
opportunities for me.
16 Training Needs Analysis is not
conducted continuously.
17 Training Needs Analysis is not
effectively implemented at
Health Sciences University.
18 Training needs are not reviewed
annually.
19 The Training Needs Analysis
identifies the type of training that
is needed to fill the gap in my job
needs.
20 The Training Needs Analysis
process effectively identifies who
should be trained.
21 The Training Needs Analysis
process effectively identifies
what content should be taught.
22 The Training Needs Analysis
allows the organisation to
identify specific training needs
that employees may have with
regard to a particular skills.
23 Training Needs Analysis is the
right step to design an

224
Statement
Strongly
disagree Disagree Neutral Agree
Strongly
agree
applicable, cost-effective training
programme.
24 Training Needs Analysis at the
Health Sciences University
involves only certain group of
employees.
SECTION C: TALENT MANAGEMENT SYSTEM EVALUATION
Please indicate your level of agreement or disagreement on talent management (TM) dimensions
practices with each statement. Tick the correct box.
Statement
Strongly
disagree Disagree Neutral Agree
Strongly
agree
1 Health Sciences University
identifies talent by using
university’s present capabilities and
potential to meet current and future
needs.
2 The Health Sciences University
measures current performance of
employees as part of the Talent
Management system.
3 Health Sciences University uses
work performance to identifies
employees who are talented.
4 Talent planning at Health Sciences
University integrates the personal
development goals of employees
with the university's strategy.
5 The Health Sciences University's
recruitment strategy is aligned to
the talent management strategy.
6 Recruitment plan at the Health
Sciences University is the key
business goals to determine the
skills and talent required to achieve
strategic objectives.
7 Talent management is regarded as
a strategy to identify, develop and
retain talent in the organisation.

225
Statement
Strongly
disagree Disagree Neutral Agree
Strongly
agree
8 The remuneration strategy at
Health Sciences University is
aligned to the university strategy.
9 The rewards and recognition
system at Health Sciences
University is aligned to the
university strategy.
10 Adequate rewards and recognition
system is very important to attract
talent at the Health Sciences
University.
11 Adequate reward and recognition
are very important to retain talent at
the Health Sciences University.
12 Performance management system
available at the Health Sciences
University.
13 Performance management system
is aligned to the Health Sciences
University‘s strategy.
14 My line manager is able to
completely identify talent.
15 My line manager provides the
resources I need to carry out my
job.
16 My line manager organise the
required training for me to be able
to carry out my job.
17 I experience a sense of belonging
at the Health Sciences University.
18 I support Health Sciences
University's vision for the university.
19 I am committed to do my job.
20 I am satisfied that I have adequate
skills to carry out my job.
21 I am satisfied with my talent as
anticipated by the Human resource
policies.
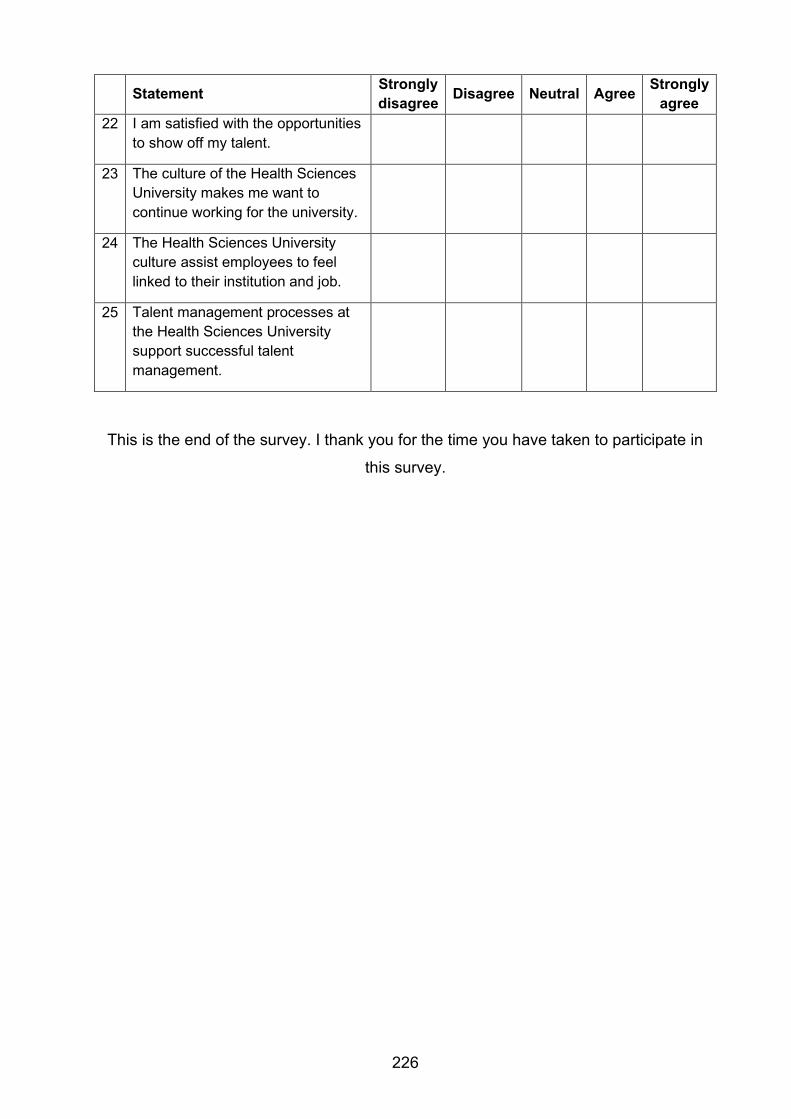
226
Statement
Strongly
disagree Disagree Neutral Agree
Strongly
agree
22 I am satisfied with the opportunities
to show off my talent.
23 The culture of the Health Sciences
University makes me want to
continue working for the university.
24 The Health Sciences University
culture assist employees to feel
linked to their institution and job.
25 Talent management processes at
the Health Sciences University
support successful talent
management.
This is the end of the survey. I thank you for the time you have taken to participate in
this survey.

![Matching Internal Audit talent to organizational needs€¦ · · 2013-07-15Matching Internal Audit talent to organizational needs C] ... organizations have global revenues of $250](https://img.pdfslide.us/doc/110x75/5b0bccd97f8b9a0c4b8e77d2/matching-internal-audit-talent-to-organizational-needs-internal-audit-talent-to.jpg)