Embed Size (px)
Citation preview
A
training needs analysis and quality assurance for smes
WESTERN BALKANS AND TURKEY´S SMALL BUSINESS COMMUNITY EXPERIENCE
The European Union’s IPA Multi – beneficiary Programme
Co-funded by the
European Union
This project is implemented by
SEECEL

B training needs analysis
1
entrepreneurial learning
Training Needs Analysis and Quality Assurance for SMEs
Western Balkans and Turkey’s small business community experience
2 training needs analysis
published bySouth East European Centre for Entrepreneurial LearningSelska 217/IVZagreb, 10000Croatia
for the publisherSandra RončevićSonja Šegvić
©South East European Centre for Entrepreneurial Learning, 2015. All rights reserved.
authorsStjepan Srhoj Efka HederMaja Ljubić
ISBN 978-953-8084-03-4
Copies of this book are available at the SEECEL website at www.seecel.hr
Printed in Zagreb, Croatia 2015Printed by Magnus Gubernator d.o.o.Design & Layout by Jelenko Hercog
A CIP catalogue record for this book is available from the National and University Library in Zagreb under 000913828
3Organisational Profile
The South East European Centre for Entrepreneurial Learning (SEECEL) is a regional think tank for human capital development and lifelong entrepreneurial learning (LLEL).
SEECEL’s mission is to work on the systematic development of LLEL, on entrepreneurship as a key competence, and on the alignment of policies and practices with those of the European Union (EU) by strengthening structural regional cooperation. SEE-CEL’s vision is to build entrepreneurially literate so-cieties by strengthening entrepreneur-friendly envi-ronments and entrepreneurial mind-sets that lead to sustainable economic growth and development.
SEECEL originated from the jointly expressed in-terest of the South East European countries to work on the institutionalisation of regional dialogue and targeted cooperation in the area of lifelong entre-preneurial learning in line with EU policy essentials, particularly within the Small Business Act for Europe (SBA), under Principles 1 and 8.
SEECEL was established in 2009 in Zagreb, Croatia at the initiative of eight pre-accession countries and with the support of the Government of the Republic of Croatia, which took the lead in founding SEECEL with two co-founders: the Ministry of Economy, Labour and Entrepreneurship (today the Ministry of Entrepreneurship and Crafts) and the Croatian Cham-ber of Economy. SEECEL enjoys the full support of all its Member States: Albania, Bosnia and Herzegovina, Croatia, Kosovo*, the former Yugoslav Republic of Macedonia, Montenegro, Serbia and Turkey, and of the European Commission, in particular the Directo-rate General (DG) for Enlargement (recently renamed
the DG Neighbourhood and Enlargement Negotia-tions). SEECEL is governed by an International Steer-ing Committee composed of two representatives of each SEECEL member state – one from the ministry of education and one from the ministry in charge for the implementation of the SBA. This structure ensures policy dialogue between the world of edu-cation and economy, participation in institutional strategic development as well as full ownership of the developments achieved.
SEECEL also closely cooperates with the European Commission, especially with the Directorates General for Neighbourhood and Enlargement Negotiations; Internal Market, Industry, Entrepreneurship and SMEs (DG GROW); Education and Culture (EAC); Re-gional and Urban Policy (REGIO), and Employment, Social Affairs and Inclusion (EMPL) and organisations like the European Training Foundation (ETF), the Or-ganisation for Economic Cooperation and Develop-ment (OECD) and the Regional Cooperation Council (RCC).
SEECEL was the first institution derived from the implementation of the SBA. It shares its develop-ments with all national and regional stakeholders, European and international institutions and agen-cies, EU Member States and other interested parties. Its methodology is based on the Evidence-Based
* This designation is without prejudice to positions on status,
and is in line with UNSCR 1244 and the ICJ Opinion on the
Kosovo Declaration of independence
4 training needs analysis
Policy Making (EBPM) and the Open Method of Co-ordination (OMC). SEECEL’s operations are either in-tegral or complementary part of the following key policy documents: South East Europe 2020 Strategy (SEE 2020 Strategy), the EU Strategy for the Danube Region (EUSDR), the EU Strategy for the Adriatic and Ionian Region (EUSAIR) and the Europe 2020 Strategy.
SEECEL is financially supported primarily by the EU through the Multi-beneficiary Programmes under the Instrument for Pre-Accession Assistance (IPA), the national budget of Croatia, through the Ministry of Entrepreneurship and Crafts and SEECEL member states. In 2011, SEECEL expanded its activities to sup-port the development of women’s entrepreneurship.
Although still quite a young institution, SEECEL has achieved international recognition and awards from the Knowledge Economy Network, the European Commission, the RCC, the European Project Awards, and just recently “Creators for Centuries”, includ-ing the European Commission’s European Enterprise Promotion Award (EEPA) as National Winners in 2014. SEECEL has also been recognised by the European Commission as the best practice for good conceptual solutions in the field of entrepreneurial learning and strategic regional cooperation. As such, SEECEL’s work is featured in numerous European Commission reports and SEECEL participates in high-level work-ing groups on entrepreneurial learning in Europe.
5Organisational Profile
Small and medium sized enterprises (SMEs) are seen as engine for job creation and the overall eco-nomic and social development. The largest number of enterprises in the economy are SMEs, and they contribute significantly in terms of providing a wide variety of jobs in SEECEL member states. At the same time they face unique challenges in the business environment. By their nature, SMEs have more lim-ited human, material and financial resources when compared to large enterprises, so in order to survive and grow in an economically challenging world, SMEs need to be able to change and adapt as inter-nal and external challenges arise.
The development of human capital is increas-ingly seen as key to ensuring competitive advan-tage for long-term labour market productivity and for integrated, inclusive, smart and sustainable growth and economic development. Education and training systems obviously play a crucial role in the increase of human capital, and they should remain flexible and respond accurately to the demands of the labour market. However, the development of human capital within SME’s through up-skilling of entrepreneurs and their employees is of equal importance to foster their competitiveness. And SME skills can neither be equated with skills-needs on the labour market in general nor with the skills needs of large enterprises. Namely, due to specifi-cities in terms of their environment, strategy, struc-ture, technology and culture, SMEs differ markedly from large enterprises with regard to their training and development needs and their resources and capabilities (Roy and Raymond, 2008).
Despite the importance of training for SMEs, insuf-ficient participation in training by SMEs is a Europe-wide problem, as noted by the European Commis-sion:
“Today more than ever before, the skills, motivation and activation of employees are crucial precondi-tions for the sustainable success, productivity and innovation of enterprises. However, the situation of SMEs with regard to training is characterised by a paradox. On the one hand, continuous training and lifelong learning (both for workers and mana-gerial staff) are regarded as crucial elements of competitiveness against the backdrop of globali-sation. On the other hand however, statistics show that continuous training and qualification are less likely to be available to employees working in SMEs than to those in large enterprises.” EC DG Employment, Social Affairs and Equal Opportunities: SME Training Guide, June 2009, p. 3
In SEECEL member states, the development of SME competences has consistently been highlighted in national SME strategies, programmes and action plans among the countries’ economic priorities. However, training and development planning is not always approached in a structured or strategic manner and is rather initiated in response to spe-cific problems. This can be particularly valid for SMEs where the lack of a training function combined with the scarcity of resources often results in ‘ad hoc’ ap-proach that enterprises opt for in the provision of
6 training needs analysis
trainings. Strategic planning can identify the ‘criti-cal success factors’ and specific human capital that enable SMEs to gain competitive advantage in the market (Healy, Ryan, Stewart and Stewart, 2002).
Accurate and relevant data on SME training needs at the national level present the foundation for adopting strategic approach to developing hu-man capital among SMEs. For this reason, SEECEL has been working since 2010 on developing tools for analysing specific training needs of SMEs in the countries of South East Europe and Turkey. In this publication, which presents the second generation of the regional Training Needs Analysis (TNA), the focus is on micro and small enterprises in three sectors: the food and beverage processing and tourism sectors (both of which were identified in the SEE 2020 Strategy as high-potential sectors for the region) and the manufacturing sector.
This publication presents the results and the recommended process which we call the Training Navigation System. It is based on comprehensive regional research (TNA) and current best practice, and is derived from engagement with micro and small enterprises from the three selected sectors. The process is adaptable to a range of scenarios and can be scaled up to include different stakeholders and roles.
A well supported and carefully planned Train-ing Navigation System with the TNA as a baseline is a significant step towards providing SME’s human capital development in the SEECEL member state that is strategic, coordinated, timely, cost-effective and based on real needs.
7Foreword
This document is the result of a broad and com-plex SEET effort to promote economic cooperation and foster the competitiveness of SMEs through the Training Needs Analysis as a key element of inte-grated, inclusive, smart and sustainable growth. It has been a team endeavour.
We would like to thank the governments of:
• Albania, • Bosnia and Herzegovina, • Croatia, • Kosovo, • the former Yugoslav Republic of Macedonia, • Montenegro, • Serbia, • Turkey.
We would like to express our gratitude to SEECEL member states, represented by their respective ministry of education and ministry in charge of SBA (Table 6, in Annex), for their full support and coop-eration, without which this step forward would not have been possible.
We would especially like to thank the European Commission and the Government of the Republic of Croatia represented by the Ministry of Entrepreneur-ship and Crafts for their financial support.
These developments would not have been pos-sible without the contribution, expertise and knowledge of national and international experts. We would therefore like to thank the experts and institutions that form the SEECEL Development and Advisory Network for Enterprises Training (DANET). We
express our gratitude and appreciation to all DANET members for contributing their knowledge and ex-perience: Albanian Investment Development Agency, Training Consultancy Coaching Ltd from Bosnia and Herzegovina, Association of CEFE Trainers in Bosnia and Herzegovina, Croatian Chamber of Economy, Ko-sovo Chamber of Commerce, Business Confederation of Macedonia, Directorate for Development of SMEs, National Agency for Regional Development from Serbia and KOSGEB from Turkey, as well as Ms Tefta Demeti, Ms Sonila Hysi, Ms Edita Perić, Ms Aida Dolić, Mr Zoran Kulundžija, Ms Lenka Radišić, Ms Tajana Kesić Šapić, Ms Vesna Štefica, Ms Olivera Ceni, Ms Gabriela Kostovska Bogoeska, Mr Gadaf Rexhepi, Mr Mile Boškov, Ms Anđela Pušonjić, Ms Ana Maraš, Mr Igor Brkanović, Mr Vladimir Jovanović and Ms Aysegul Celik. Our special thanks go to our two international Key Experts who led and coordinated the work of the working group, Ms Marija Iličković and Mr Igor Nikoloski (Table 7 and Table 8, in Annex).
Finally, we would like to extend our deepest gratitude and acknowledge the invaluable contri-butions of all entrepreneurs and employees who participated in the survey.

8 training needs analysis
BSO – Business Support Organisation COP – Community of Practice DANET - Development and Advisory Network for Enterprises
Training EL – Entrepreneurial Learning EU – European Union EC – European Commission ETF – European Training Foundation FBP – Food and Beverages Processing ICT – Information and Communication Technology LLEL – Lifelong Entrepreneurial Learning NACE – ‘Nomenclature Generale des Activites Economiques
dans I`Union Europeenne’ (General Name for Economic Activities in the European Union)
OECD – Organisation for Economic Development and Cooperation
OMC – Open Method of Coordination RCC – Regional Cooperation Council SBA – The Small Business Act for Europe SEE – South East Europe SEECEL – South East European Centre for Entrepreneurial Learning SEET – South East Europe and Turkey SME – Small and Medium Enterprises TNA – Training Needs Analysis TNAS – Training Needs Analysis System WETNAS – Women Entrepreneurs Training Needs Analysis System WG – Working Group
list of abbreviations
9Table of Contents
contents
3.9. Regression Results 54 3.10. Focus on Job Creators 57 3.10.1. Growing Enterprises 58 3.10.2. Enterprises with Increase in Exports 60 3.10.3. Enterprises Owned by Entrepreneurs
Younger than 30 62 3.10.4. Female-owned Enterprises 64 3.11. Developing the Model of Human
Capital Intervention 66 3.11.1. Training Navigation System 72
4. quality assurance criteria framework 75
5. way forward 81
6. annexes: 84 6.1. Annex 1: Figures 85 6.2. Annex 2: Tables 106 6.3. Annex 3: Questionnaire 121
7. indexes: 145 7.1. Index of Figures 146 7.2. Index of Tables 149
8. bibliography 150
Organisational Profile 2 Foreword 4 Acknowledgements 6 List of Abbreviations 8
1. development context 10 1.1. EU Policy Framework 11 1.2. State of Play in the Region 13
2. tna - methodology and objectives 16
3. findings 21 3.1. Information on the Sample 23 3.2. Perceived Business Environment and
Business Trends in Enterprises 30 3.3. Access to Finance 32 3.4. Networking and Business Partnership 33 3.5. Human Resources and Training 35 3.6. Challenges Influencing Small Business
Community 36 3.7. Trainings Needs of the Small Business
Community 45 3.8. Organisational Benefits Acquired
Through Training 50

10 training needs analysis
11Development Context
The recent global economic developments presented an opportunity for Europe to grow stronger, and promote smart, sustainable and inclusive growth. In order to take advantage of this opportunity, the Eu-rope 2020 Strategy outlined steps which set the tar-gets and key priorities and initiatives. Recognizing that Europe can “count on the talent and creativity of [its] people”, the EU 2020 strategy places a great focus on the development of Europe’s human capi-tal. In particular, it stipulates that promoting smart growth driven by knowledge and innovation ne-cessitates reforms which should improve the qual-ity of education and training, and reforms should contribute to “ensuring that innovative ideas can be turned into new products and services that create growth, quality jobs and help address European and global societal challenges. But, to succeed, this must be combined with entrepreneurship, finance and a focus on user needs and market opportunities.”
In the development of human capital, special fo-cus should be put on the development of a lifelong learning system that supports individuals through
education and training – as defined in the Edu-cation and Training 2020 strategic framework. The basis for this system in Europe is a set of eight key competences that define knowledge, skills and at-titudes necessary for successful life in the knowledge society.
The implementation of the lifelong learning pro-cess was further elaborated in the European Council conclusions on the role of education and training in the implementation of the ‘Europe 2020’ strategy. The conclusion emphasises that: “education and training have a fundamental role to play in achiev-ing the ‘Europe 2020’ objectives of smart, sustain-able and inclusive growth, notably by equip-ping citizens with the skills and competences which the European economy and European society need in order to remain competitive and innovative”. In particular, the ‘An Agenda for new skills and jobs’ initiative “should improve the identification of training needs, increase the labour market relevance of education and training, facilitate individuals’ ac-cess to lifelong learning opportunities and guidance,
1.1.
eu policy framework
12 training needs analysis
and ensure smooth transitions between the world of education, training and employment.” The ini-tiative concludes that: “there is a need to ensure a better long-term match between skills supply and labour market demand.” In ensuring better match between training and labour market needs, busi-nesses should be actively involved in “forecasting skills needs, through an employers survey tool and qualitative studies on the skills needs of business, notably SMEs”.
EU 2020 Strategy and other relevant documents recognize the impact that entrepreneurship has on economy and society and consequently support hu-man capital development in the SME sector as a key driver of competitiveness. This message was further reinforced with the Entrepreneurship 2020 Action Plan. Developing the human capital of SMEs has its roots in a range of policy documents, with the most recent and relevant, the SBA. The SBA builds on Com-mission and Member States policy achievements and creates a new policy framework that integrates the existing SME policy instruments. SBA also promotes
growth of SMEs by helping them tackle the remain-ing problems which hamper their development. The SBA is the policy framework for SMEs for EU Mem-ber States and pre-accession countries alike, and it is composed of ten principles with indicators. The eighth principle focuses on “Enterprise skills and in-novation” and one of its objectives is the establish-ment of a “national policy and support framework to ensure a better fit between supply and demand for training in small enterprises.” As outlined by the principle, it is important to focus on the develop-ment of TNA, which is defined as the “identification of training requirements and the most cost-effective means of meeting those requirements.”
13Development Context
SMEs - the backbone of economies in pre-accession countries - are a priority in all policy documents. As a part of their accession process, countries are fully implementing the SBA for Europe and regularly reporting to the European Commission. Their par-ticipation in the process began in 2003 when they signed the agreement to implement the European Charter for Small Enterprises. The countries took a step further and requested a more strategic approach towards reporting on the implementation of the Eu-ropean Charter for Small Enterprises for the Western Balkans. Following that request, policy indicators were developed and are used as a planning instru-ment for pre-accession countries in their EU acces-sion process. Indicators, otherwise known as the SME Policy Index, were developed jointly by the European Commission, European Training Foundation, SEECEL, European Bank for Reconstruction and Development and OECD, together with National SBA coordinators.
This strong cooperation on a regional level has further resulted in the signing of “A Charter for En-trepreneurial Learning: the Keystone for Growth and
Jobs” (SEECEL, 2012a) – signed at the Entrepreneur-ship-Education Regional Summit, hosted by the Min-istry of Entrepreneurship and Crafts and the SEECEL, in Zagreb on 23 October 2012. The Charter builds on an existing co-operation framework provided by the SEECEL, where each country’s education and economy/entrepreneurship ministries are represented. By sign-ing the Charter, the participating parties reconfirmed their full support to the systematic development of the life-long entrepreneurial learning as a key com-petence through continued policy improvement, good practise sharing and regional cooperation.
All SEECEL member states are making progress towards the development of a national TNA as part of their efforts to develop more efficient national policies and support systems for the training of SMEs following the principles of the SBA. Respecting the OMC and peer learning principle, all SEECEL member states decided to cooperate on system development in this field, through SEECEL activities for the region as a whole that supports national developments. In the development of a regional TNA, it was very important
1.2.
state of play in the region
14 training needs analysis
to account for all differences between SEECEL member states (for example, territory size, population, natural resources, etc.) as this does not present an obstacle to the development but enriches the process.
The key macro-regional and regional strategies relevant to South East Europe and Turkey include an emphasis on human capital development and on developing SME skills. The EU Strategy for the Danube Region covers human capital development through its “Building Prosperity” pillar, whilst in the EU Strategy for the Adriatic Ionian Region a cross-cutting theme of “Strengthening R&D, Innovation and SMEs” is present across four key pillars of the strategy. Furthermore, with the SEE 2020 Strategy– Jobs and Prosperity in a European Perspective, the governments of Albania, Bosnia and Herzegovina, Kosovo, the former Yugoslav Republic of Macedonia, Montenegro and Serbia have embraced the policy approach required to attain the levels of socioeco-nomic growth necessary to improve the prosperity of all its citizens and to facilitate eventual integration with the EU. The Smart Growth Pillar and its Dimen-sion D – Education and Competences within the SEE 2020 Strategy looks at ways to ‘ensure education and training systems better meets economic and labour market needs (and provide learners with labour market relevant skills)’ (RCC, 2013, p. 19).
Pre-accession countries are facing the conse-quences of the global economic crisis that are es-pecially unfavourable for SMEs. In response to the challenges posed by the crisis, countries defined human capital development as one of the key ar-eas for fostering the competitiveness of SMEs which
would represent the basis for sustainable growth. A systematic approach to developing human capi-tal requires the identification of training needs of SMEs through TNA. The New Skills for News Jobs in the Western Balkans position paper highlights that there is an identified need for a region-wide all-encompassing analysis (supply-demand; compe-tences-gaps; current-future needs). Hence, the benefits of a regional TNA is that it identifies the similarities, differences and training needs of SMEs on the SEE level, all of which benefits the home and host countries alike. In order to ensure the success of international SME operations, SMEs need specific training and advisory services.
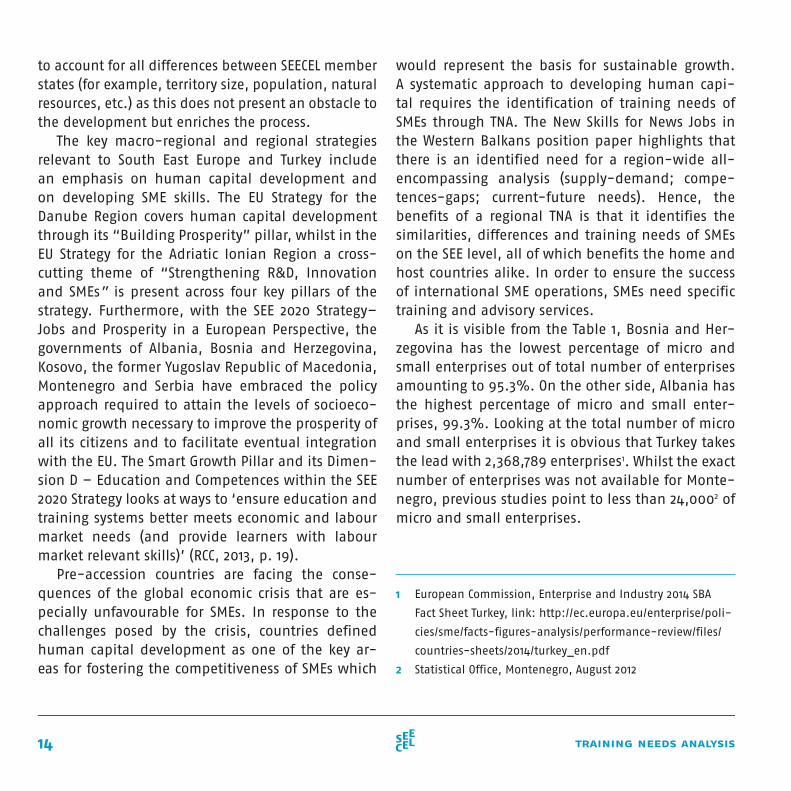
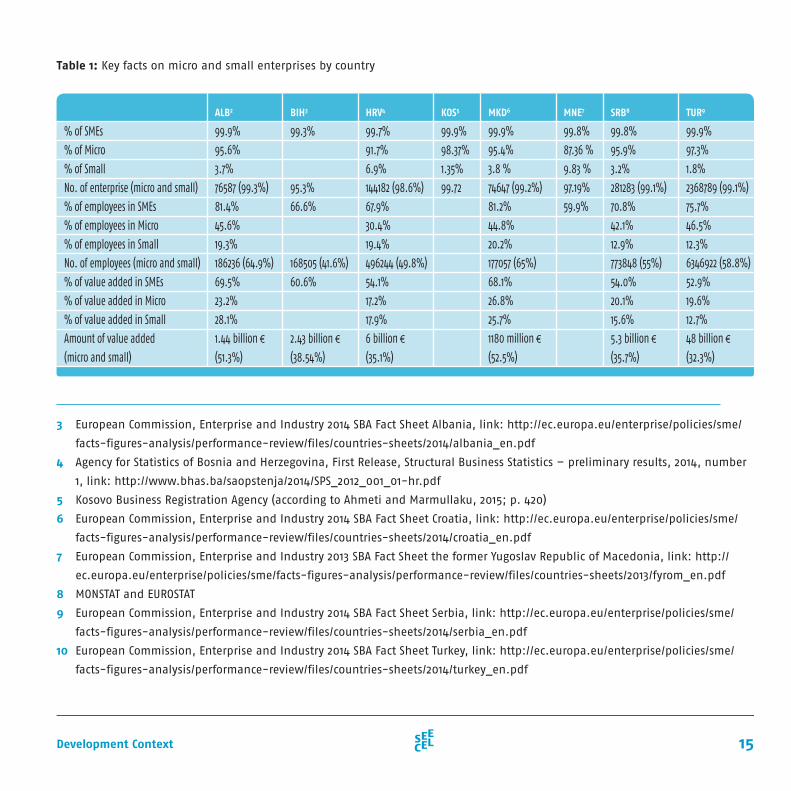
As it is visible from the Table 1, Bosnia and Her-zegovina has the lowest percentage of micro and small enterprises out of total number of enterprises amounting to 95.3%. On the other side, Albania has the highest percentage of micro and small enter-prises, 99.3%. Looking at the total number of micro and small enterprises it is obvious that Turkey takes the lead with 2,368,789 enterprises1. Whilst the exact number of enterprises was not available for Monte-negro, previous studies point to less than 24,0002 of micro and small enterprises.
1 European Commission, Enterprise and Industry 2014 SBA
Fact Sheet Turkey, link: http://ec.europa.eu/enterprise/poli-
cies/sme/facts-figures-analysis/performance-review/files/
countries-sheets/2014/turkey_en.pdf
2 Statistical Office, Montenegro, August 2012
15Development Context
Table 1: Key facts on micro and small enterprises by country
3 European Commission, Enterprise and Industry 2014 SBA Fact Sheet Albania, link: http://ec.europa.eu/enterprise/policies/sme/
facts-figures-analysis/performance-review/files/countries-sheets/2014/albania_en.pdf
4 Agency for Statistics of Bosnia and Herzegovina, First Release, Structural Business Statistics – preliminary results, 2014, number
1, link: http://www.bhas.ba/saopstenja/2014/SPS_2012_001_01-hr.pdf
5 Kosovo Business Registration Agency (according to Ahmeti and Marmullaku, 2015; p. 420)
6 European Commission, Enterprise and Industry 2014 SBA Fact Sheet Croatia, link: http://ec.europa.eu/enterprise/policies/sme/
facts-figures-analysis/performance-review/files/countries-sheets/2014/croatia_en.pdf
7 European Commission, Enterprise and Industry 2013 SBA Fact Sheet the former Yugoslav Republic of Macedonia, link: http://
ec.europa.eu/enterprise/policies/sme/facts-figures-analysis/performance-review/files/countries-sheets/2013/fyrom_en.pdf
8 MONSTAT and EUROSTAT
9 European Commission, Enterprise and Industry 2014 SBA Fact Sheet Serbia, link: http://ec.europa.eu/enterprise/policies/sme/
facts-figures-analysis/performance-review/files/countries-sheets/2014/serbia_en.pdf
10 European Commission, Enterprise and Industry 2014 SBA Fact Sheet Turkey, link: http://ec.europa.eu/enterprise/policies/sme/
facts-figures-analysis/performance-review/files/countries-sheets/2014/turkey_en.pdf
ALB2 BIH3 HRV4 KOS5 MKD6 MNE7 SRB8 TUR9
% of SMEs
% of Micro
% of Small
No. of enterprise (micro and small)
% of employees in SMEs
% of employees in Micro
% of employees in Small
No. of employees (micro and small)
% of value added in SMEs
% of value added in Micro
% of value added in Small
Amount of value added
(micro and small)
99.9%
95.6%
3.7%
76587 (99.3%)
81.4%
45.6%
19.3%
186236 (64.9%)
69.5%
23.2%
28.1%
1.44 billion €
(51.3%)
99.3%
95.3%
66.6%
168505 (41.6%)
60.6%
2.43 billion €
(38.54%)
99.7%
91.7%
6.9%
144182 (98.6%)
67.9%
30.4%
19.4%
496244 (49.8%)
54.1%
17.2%
17.9%
6 billion €
(35.1%)
99.9%
98.37%
1.35%
99.72
99.9%
95.4%
3.8 %
74647 (99.2%)
81.2%
44.8%
20.2%
177057 (65%)
68.1%
26.8%
25.7%
1180 million €
(52.5%)
99.8%
87.36 %
9.83 %
97.19%
59.9%
99.8%
95.9%
3.2%
281283 (99.1%)
70.8%
42.1%
12.9%
773848 (55%)
54.0%
20.1%
15.6%
5.3 billion €
(35.7%)
99.9%
97.3%
1.8%
2368789 (99.1%)
75.7%
46.5%
12.3%
6346922 (58.8%)
52.9%
19.6%
12.7%
48 billion €
(32.3%)

16 training needs analysis
17TNA - Methodology and Objectives
The second generation of the TNA instrument is de-veloped by the working group (WG) representatives via the Community of Practice and in vivo discus-sions during the WG meetings in Zagreb, Croatia on 22 October 2013 and in Ankara, Turkey from 3 to 5 March 2014. The TNA instrument has underpinnings in national and EU policy documents, theoretical knowledge, previous SEECEL experience with devel-oping TNA (SEECEL, 2012) and WETNAS (SEECEL, 2014) as well as national expertise of the WG members. The instrument’s main objective is to identify the training needs and challenges of micro and small enterprises from three strategic sectors from eight countries (Albania, Bosnia and Herzegovina, Croatia, Kosovo, the former Yugoslav Republic of Macedonia, Montenegro, Serbia and Turkey). Three strategic sec-tors were predefined, two out of three originally coming from the SEE 2020 strategy and the third sec-tor was agreed upon by consensus of the national experts during the TNA/QA WG in Zagreb. The target sectors were tourism, manufacturing and food and beverages processing (FBP) sector.
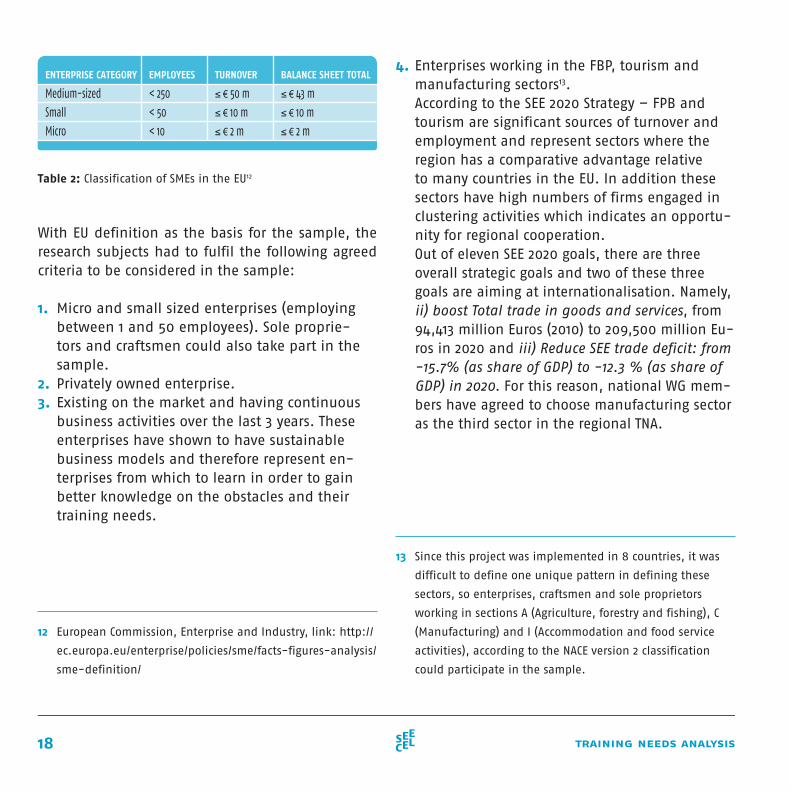
Since more than 95%11 of the total number of en-terprises in all SEECEL Member States are micro and small enterprises, the main selection criterion for the survey enterprises was the number of employ-ees. Furthermore, the EU definition in regards to the number of employees is applied in all SEECEL coun-tries, however, the same definition is not applied in all SEECEL countries when it comes to the turnover or balance sheet. According to the EU definition, micro enterprises employ up to 10 and small enterprises up to 50 employees (Table 2).
11 Based on the SBA Fact Sheets, see Table 1
18 training needs analysis
4. Enterprises working in the FBP, tourism and manufacturing sectors13. According to the SEE 2020 Strategy – FPB and tourism are significant sources of turnover and employment and represent sectors where the region has a comparative advantage relative to many countries in the EU. In addition these sectors have high numbers of firms engaged in clustering activities which indicates an opportu-nity for regional cooperation. Out of eleven SEE 2020 goals, there are three overall strategic goals and two of these three goals are aiming at internationalisation. Namely, ii) boost Total trade in goods and services, from 94,413 million Euros (2010) to 209,500 million Eu-ros in 2020 and iii) Reduce SEE trade deficit: from -15.7% (as share of GDP) to -12.3 % (as share of GDP) in 2020. For this reason, national WG mem-bers have agreed to choose manufacturing sector as the third sector in the regional TNA.
13 Since this project was implemented in 8 countries, it was
difficult to define one unique pattern in defining these
sectors, so enterprises, craftsmen and sole proprietors
working in sections A (Agriculture, forestry and fishing), C
(Manufacturing) and I (Accommodation and food service
activities), according to the NACE version 2 classification
could participate in the sample.
Table 2: Classification of SMEs in the EU12
With EU definition as the basis for the sample, the research subjects had to fulfil the following agreed criteria to be considered in the sample:
1. Micro and small sized enterprises (employing
between 1 and 50 employees). Sole proprie-tors and craftsmen could also take part in the sample.
2. Privately owned enterprise.3. Existing on the market and having continuous
business activities over the last 3 years. These enterprises have shown to have sustainable business models and therefore represent en-terprises from which to learn in order to gain better knowledge on the obstacles and their training needs.
12 European Commission, Enterprise and Industry, link: http://
ec.europa.eu/enterprise/policies/sme/facts-figures-analysis/
sme-definition/
EMPLOYEES ENTERPRISE CATEGORY TURNOVER BALANCE SHEET TOTAL
Medium-sized
Small
Micro
< 250
< 50
< 10
≤ € 50 m
≤ € 10 m
≤ € 2 m
≤ € 43 m
≤ € 10 m
≤ € 2 m
19TNA - Methodology and Objectives
Previously mentioned criteria enable the analysis to reach the data for specific target group and thus assist in making a tailor made analysis. The ques-tionnaire was developed by the DANET members. Building on the previous TNA experience, the brain-storming method was used during the in vivo WGs in order to cover as many human capital-related questions and training sub areas as possible. In the time between the WGs, the delphi method was used via the CoP in order to get further details, new ideas and improvements of the questionnaire. Once the methodology and the questionnaire were finalised, the procedures on the implementation of next ac-tivities were also defined. Given that an indirect goal is to increase the overall digital competencies, it was decided to use online system to conduct the research. Along this line, an electronic online system for data collection has been created, and in order to participate in the survey, entrepreneurs14 had to visit the website where the questionnaire was posted. After the English version of the platform and questionnaire was agreed and approved by all the parties, the WG members translated the question-naire and necessary website features. The platform and the questionnaire were therefore translated into all languages of the participating countries. Before the full scale implementation, online ques-tionnaire was tested and subsequently standardised
14 The word entrepreneur is used in this study synonymously
for both male and female entrepreneurs
and objectivised. The overall process of implemen-tation of the survey was supported and supervised by the predefined business support organisation (BSO) in each country. Each organisation has received 1000 unique survey codes that were disseminated among the enterprises so they could participate in the project. Before accessing the questionnaire, the entrepreneurs had to enter the given code by the or-ganisation. Once the code was accepted the process of answering the questions could begin. Introducing the codes for each enterprise provided additional information to the BSOs regarding the enterprises’ participation rate in the survey per country, but it also reduced the risks of misusing the survey. Ad-ditionally, respondents’ unintentional mistakes were minimised because the system did not allow successful completion of the survey if some of the fields were empty or if there was a logical mismatch between two answers.
The questionnaire is composed of five chapters:
A. General and Personal Information, showing insight in general information about the enter-prises’ sectors of operation and their background and experience;
B. Networking and business partnership, gather-ing information regarding the networking and cooperation and collaboration activities and possibilities;
C. Enterprise Information, collecting data regarding the business performance, demographic struc-ture and market success;
D. Access to finance, gathering information regard-
20 training needs analysis
ing the perception of availability and the us-age of the basic and the alternative financial instruments, as well as regarding the sources of information; and
E. Human resources and training is the main part of the survey, collecting data regarding the car-ried on activities, plans and budget for train-ing, education and skills development, for both managerial and non-managerial staff.
Questions were analysed by using descriptive sta-tistics, factorial analysis (Principal Axes Factoring), inferential statistics (one-way ANOVA) and hierarchi-cal multiple regression. The factor analysis examines the interdependency among a large number of vari-ables, and it tries to explain these variables through a small number of common characteristics. Thus, the purpose of the factor analysis is to summarise a large pool of information into a small number of common characteristics with minimum loss of information, allowing a better understanding among variables. On the other hand, regression can be explained as a statistical measure that attempts to determine the strength of the relationship between one dependent variable and a series of other independent variables. The factor analysis and regression are featured in the section 3, Findings.
Having in mind the differences in countries’ size and the number of enterprises (ranging from ap-
proximately 24,00015 in Montenegro to 2 386 92116 in Turkey) respectively, the sample size for this ac-tion has been set to a minimum of 300 fully filled in questionnaires per country. The sample size was decided based on previous TNA experiences (SEECEL, 2012), as well as WETNAS experience (SEECEL, 2014) where BSOs collected 200 questionnaires filled in by women entrepreneurs only. Therefore, it was reasonable that the BSOs will be able to collect the target sample of 300 micro and small enterprises in tourism, manufacturing and FBP sectors.
15 Analysis of number and structure of business entities in
Montenegro for the second quarter 2012 year, Statistics Of-
fice, Montenegro, August 2012
16 European Commission, Enterprise and Industry 2014 SBA
Fact Sheet Turkey, link: http://ec.europa.eu/enterprise/poli-
cies/sme/facts-figures-analysis/performance-review/files/
countries-sheets/2014/turkey_en.pdf

21Findings
22 training needs analysis
In the following section of the publication, all de-tailed statistical explanations are given in blue boxes. The explanations are extracted because the target audience of the publication comprises a wide range of stakeholders. As such, the goal was to write up the findings in a more popular manner.
23Findings
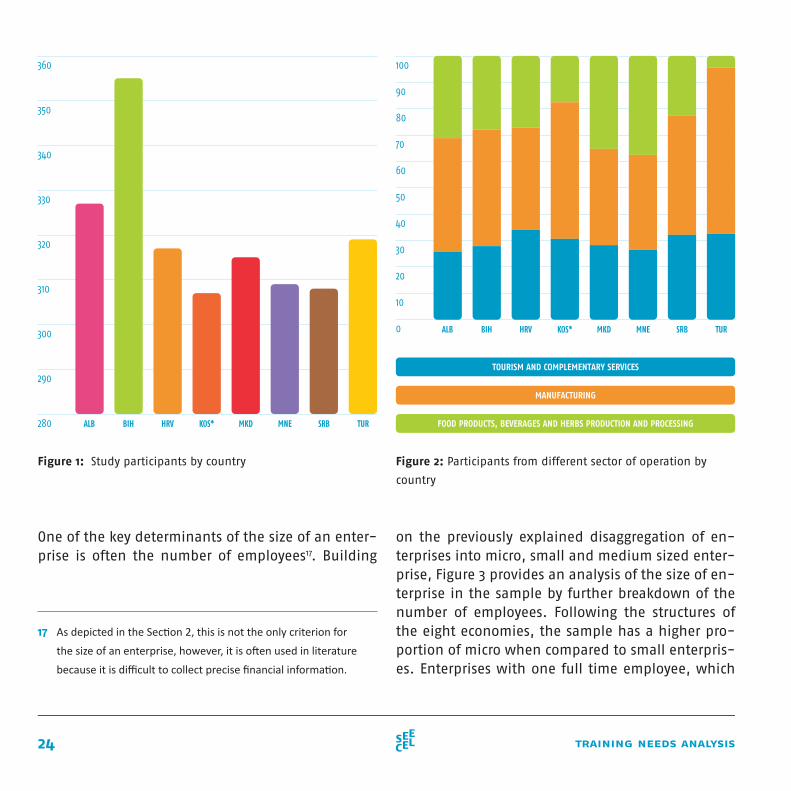
The sample used in this large scale study included 2557 participants from eight countries, with more than 300 participants from each country (Figure 1). All the enterprises participating in the survey are relatively new enterprises, established in the last 6 years (Figure 42, in Annex), whilst 330 out of 2557 enterprises were established three years ago. It was expected that enterprises younger than three years would not be presented, as one of the prerequisites for the survey participation was for an enterprise to be active a minimum of three years.
The sample is characterized with relatively propor-tionate number of participants from enterprises that belong to each of the three sectors of operation: (1) food products, beverages and herbs production and processing (FBP); (2) manufacturing; and (3) tour-ism and complementary services. Turkey and Kosovo have somewhat larger number of participants from the manufacturing enterprises (Figure 2). Turkey is represented by the most manufacturing enterprises which is in line with the strong manufacturing sector in their economy. In general, participants from the
two specific areas of manufacturing (manufacture of wood and paper products and printing and manu-facture of textiles, apparel, leather, footwear and related products) filled somewhat larger number of the overall questionnaires. The most questionnaires from the manufacture of wood and paper products and printing were submitted in Kosovo, Montenegro and Turkey (Figure 43, in Annex), whilst the most questionnaires from the manufacture of textiles, apparel, leather, footwear and related products were submitted in Albania, Turkey and the former Yugoslav Republic of Macedonia. In every country, the number of questionnaires from the tourism sec-tor differs according to the specific tourism areas. For example, enterprises in the catering and restaurant business filled the largest number of questionnaires within the tourism sector in Bosnia and Herzego-vina and Albania. In Croatia, hotels filled the largest number of questionnaires (Figure 44, in Annex).
3.1.
information on the sample
24 training needs analysis
Figure 1: Study participants by country Figure 2: Participants from different sector of operation by
country
360
350
340
330
320
310
300
290
280 TURSRBMNEMKDKOS*BIH HRVALB
100
90
80
70
60
50
40
30
20
10
0
TOURISM AND COMPLEMENTARY SERVICES
MANUFACTURING
FOOD PRODUCTS, BEVERAGES AND HERBS PRODUCTION AND PROCESSING
TURSRBMNEMKDKOS*BIH HRVALB
One of the key determinants of the size of an enter-prise is often the number of employees17. Building
17 As depicted in the Section 2, this is not the only criterion for the size of an enterprise, however, it is often used in literature because it is difficult to collect precise financial information.
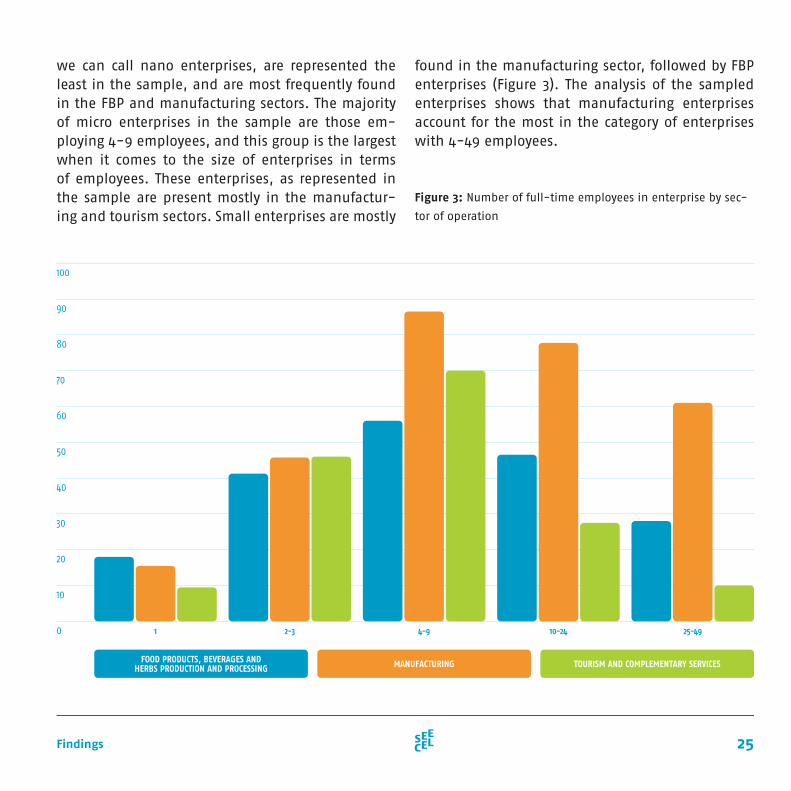
on the previously explained disaggregation of en-terprises into micro, small and medium sized enter-prise, Figure 3 provides an analysis of the size of en-terprise in the sample by further breakdown of the number of employees. Following the structures of the eight economies, the sample has a higher pro-portion of micro when compared to small enterpris-es. Enterprises with one full time employee, which
25Findings
we can call nano enterprises, are represented the least in the sample, and are most frequently found in the FBP and manufacturing sectors. The majority of micro enterprises in the sample are those em-ploying 4-9 employees, and this group is the largest when it comes to the size of enterprises in terms of employees. These enterprises, as represented in the sample are present mostly in the manufactur-ing and tourism sectors. Small enterprises are mostly
Figure 3: Number of full-time employees in enterprise by sec-
tor of operation
found in the manufacturing sector, followed by FBP enterprises (Figure 3). The analysis of the sampled enterprises shows that manufacturing enterprises account for the most in the category of enterprises with 4-49 employees.
100
90
80
70
60
50
40
30
20
10
0 1 2-3 4-9 10-24 25-49
FOOD PRODUCTS, BEVERAGES AND HERBS PRODUCTION AND PROCESSING MANUFACTURING TOURISM AND COMPLEMENTARY SERVICES
26 training needs analysis
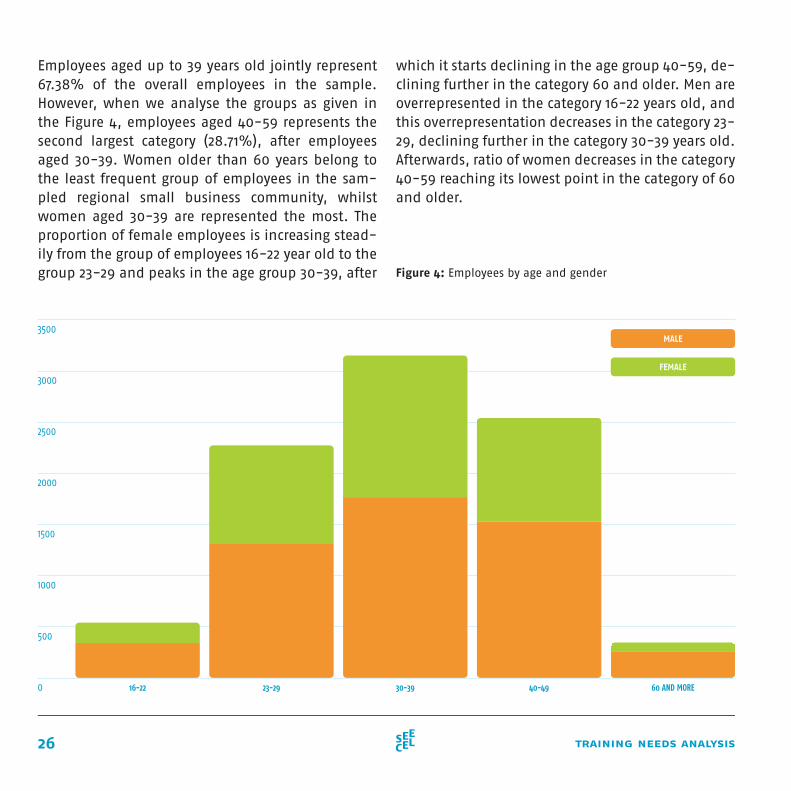
Employees aged up to 39 years old jointly represent 67.38% of the overall employees in the sample. However, when we analyse the groups as given in the Figure 4, employees aged 40-59 represents the second largest category (28.71%), after employees aged 30-39. Women older than 60 years belong to the least frequent group of employees in the sam-pled regional small business community, whilst women aged 30-39 are represented the most. The proportion of female employees is increasing stead-ily from the group of employees 16-22 year old to the group 23-29 and peaks in the age group 30-39, after Figure 4: Employees by age and gender
3500
3000
2500
2000
1500
1000
500
0
which it starts declining in the age group 40-59, de-clining further in the category 60 and older. Men are overrepresented in the category 16-22 years old, and this overrepresentation decreases in the category 23-29, declining further in the category 30-39 years old. Afterwards, ratio of women decreases in the category 40-59 reaching its lowest point in the category of 60 and older.
FEMALE
MALE
16-22 23-29 30-39 40-49 60 AND MORE
27Findings
2500
2000
1500
1000
500
0 PRIMARY EDUCATIONUNFINISHED PRIMARY EDUCATION SECONDARY EDUCATION GRADUATE EDUCATION POST GRADUATE EDUCATION
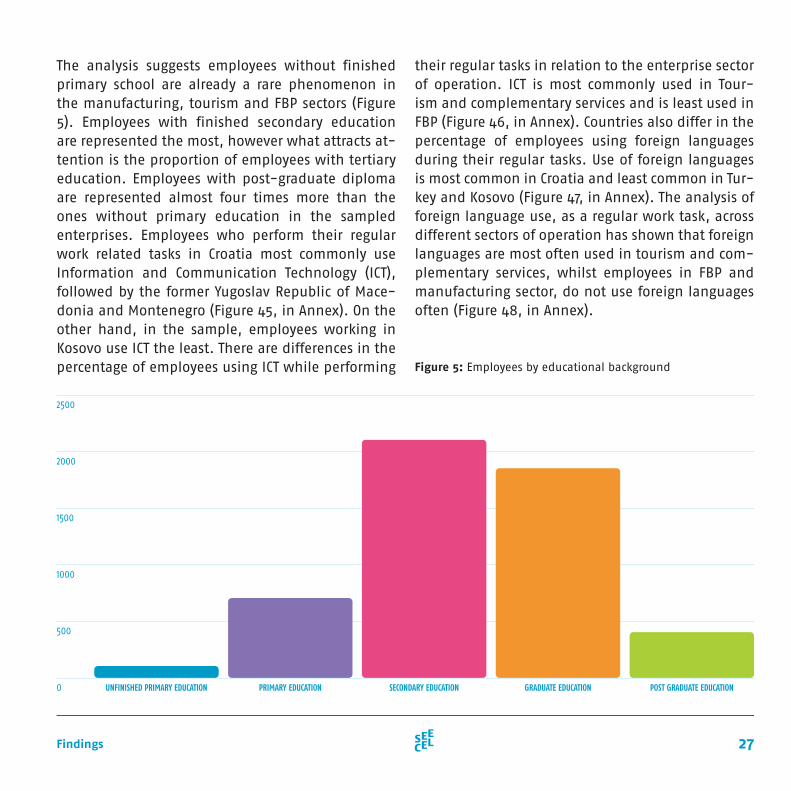
The analysis suggests employees without finished primary school are already a rare phenomenon in the manufacturing, tourism and FBP sectors (Figure 5). Employees with finished secondary education are represented the most, however what attracts at-tention is the proportion of employees with tertiary education. Employees with post-graduate diploma are represented almost four times more than the ones without primary education in the sampled enterprises. Employees who perform their regular work related tasks in Croatia most commonly use Information and Communication Technology (ICT), followed by the former Yugoslav Republic of Mace-donia and Montenegro (Figure 45, in Annex). On the other hand, in the sample, employees working in Kosovo use ICT the least. There are differences in the percentage of employees using ICT while performing
their regular tasks in relation to the enterprise sector of operation. ICT is most commonly used in Tour-ism and complementary services and is least used in FBP (Figure 46, in Annex). Countries also differ in the percentage of employees using foreign languages during their regular tasks. Use of foreign languages is most common in Croatia and least common in Tur-key and Kosovo (Figure 47, in Annex). The analysis of foreign language use, as a regular work task, across different sectors of operation has shown that foreign languages are most often used in tourism and com-plementary services, whilst employees in FBP and manufacturing sector, do not use foreign languages often (Figure 48, in Annex).
Figure 5: Employees by educational background
28 training needs analysis
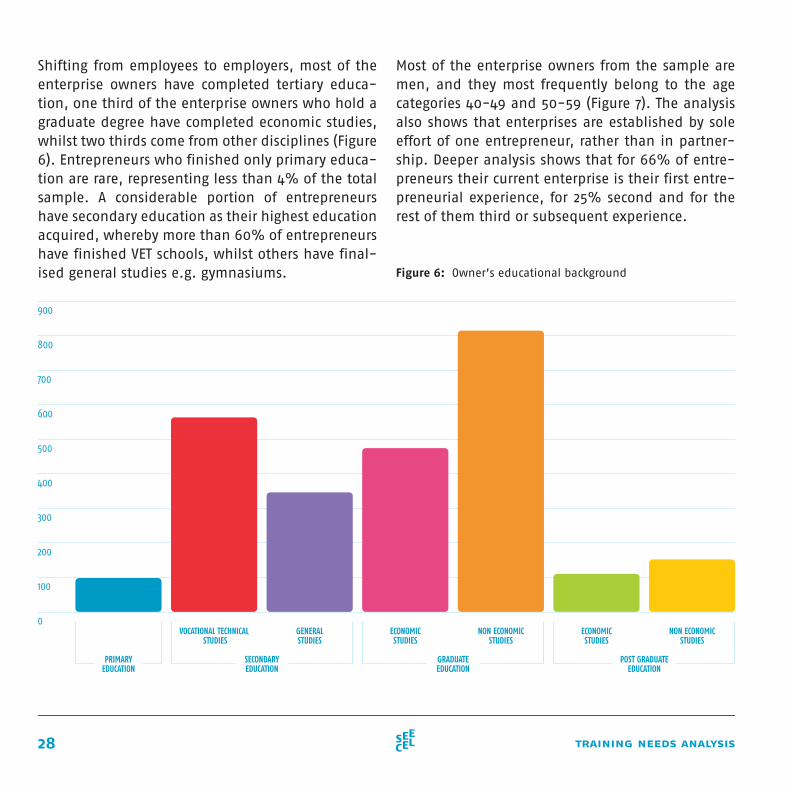
Shifting from employees to employers, most of the enterprise owners have completed tertiary educa-tion, one third of the enterprise owners who hold a graduate degree have completed economic studies, whilst two thirds come from other disciplines (Figure 6). Entrepreneurs who finished only primary educa-tion are rare, representing less than 4% of the total sample. A considerable portion of entrepreneurs have secondary education as their highest education acquired, whereby more than 60% of entrepreneurs have finished VET schools, whilst others have final-ised general studies e.g. gymnasiums. Figure 6: Owner’s educational background
PRIMARYEDUCATION
SECONDARYEDUCATION
GRADUATEEDUCATION
POST GRADUATEEDUCATION
VOCATIONAL TECHNICAL STUDIES
GENERALSTUDIES
ECONOMICSTUDIES
ECONOMICSTUDIES
NON ECONOMICSTUDIES
NON ECONOMICSTUDIES
900
800
700
600
500
400
300
200
100
0
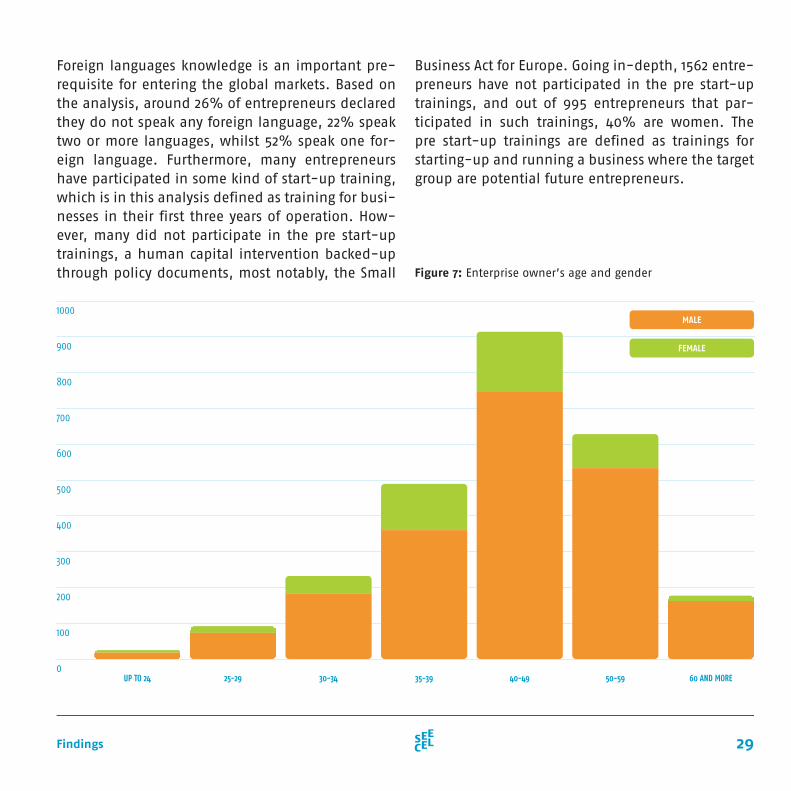
Most of the enterprise owners from the sample are men, and they most frequently belong to the age categories 40-49 and 50-59 (Figure 7). The analysis also shows that enterprises are established by sole effort of one entrepreneur, rather than in partner-ship. Deeper analysis shows that for 66% of entre-preneurs their current enterprise is their first entre-preneurial experience, for 25% second and for the rest of them third or subsequent experience.
29Findings
Foreign languages knowledge is an important pre-requisite for entering the global markets. Based on the analysis, around 26% of entrepreneurs declared they do not speak any foreign language, 22% speak two or more languages, whilst 52% speak one for-eign language. Furthermore, many entrepreneurs have participated in some kind of start-up training, which is in this analysis defined as training for busi-nesses in their first three years of operation. How-ever, many did not participate in the pre start-up trainings, a human capital intervention backed-up through policy documents, most notably, the Small
Business Act for Europe. Going in-depth, 1562 entre-preneurs have not participated in the pre start-up trainings, and out of 995 entrepreneurs that par-ticipated in such trainings, 40% are women. The pre start-up trainings are defined as trainings for starting-up and running a business where the target group are potential future entrepreneurs.
1000
900
800
700
600
500
400
300
200
100
0
Figure 7: Enterprise owner’s age and gender
UP TO 24 25-29 30-34 35-39 40-49 50-59 60 AND MORE
FEMALE
MALE
30 training needs analysis
Perceived business support and the difference among countries are given in the Figure 49 (in An-nex). The question revolved around perceived way national/local authorities create supportive envi-ronment for business development. The environ-ment for business development is evaluated on the 4 point scale, where lower score suggests higher support for business development. The highest perceived support given to business development is experienced by enterprises in Kosovo, Albania and the former Yugoslav Republic of Macedonia. In ad-dition, the analysis of variance (Table 9, in Annex) showed differences between countries, F(7,2549) = 34.580, p = 0.000. Business support is perceived as the least conducive in Bosnia and Herzegovina and Croatia.
In order to determine the business trends of the participating enterprises, the following parameters were analysed: total revenue, number of employ-ees, export and imports linked to the country of enterprise origin as well as the main sector of op-eration. An analysis of variance showed differences
between countries regarding total revenue, num-ber of employees and both exports and imports. The detailed data are presented through figures and statistical data. Furthermore, there are visible differences in total revenue trends reported in the last three years in relation to the country (Figure 50, in Annex). The country with the highest per-centage of enterprises which reported an increase in the total revenue is Turkey (approximately 60% of enterprises), whilst the country with the highest percentage of enterprises which reported decrease in the total revenue is Croatia (approximately 30% of enterprises).
In terms of sectors of operation and revenues, the most enterprises which stated an increase in total revenues come from the manufacturing sec-tor (510), followed by FBP (343) and tourism (275), however, it should be noted that manufacturing enterprises make up for the largest part of the sam-ple (Figure 51, in Annex). Furthermore, there were some differences in the number of employee trends in the last three years from country to country. The
3.2
the business environment and business trends in
enterprises
31Findings
largest increase in number of employees is expe-rienced in enterprises in Bosnia and Herzegovina (around 40% of enterprises). The largest decrease in number of employees is experienced by enterprises in Croatia (around 20% of enterprises) (Figures 52, in Annex). When comparing the differences in the number of employees by different sector of opera-tion, approximately 35% of manufacturing enter-prises are experiencing an increase in the number of employees in the last three years. At the same time, around 15% of manufacturing enterprises have a decrease in the number of employees. Moreover, a very similar share of enterprises in FBP and tourism are experiencing increase, decrease and no changes in the number of employees (Figure 53, in Annex).
The largest increase in exports is visible in Bosnia and Herzegovina, Turkey, Albania and Croatia. At the same time, information on exports is not applicable to approximately 50% of enterprises in the former Yugoslav Republic of Macedonia and Serbia, imply-ing that these enterprises might not export (Figure 54, in Annex). Comparing these trends to the sector of operation, the largest percentage of enterprises, which have an increase of exports are manufactur-ing enterprises, followed by FBP enterprises. Tourism and complementary services is a sector of operation where data on exports are most often not applicable (Figure 55, in Annex). Analysing the import trends in the last three years, a high percentage of enter-prises have stable imports data for the last three years. The largest percentage of enterprises that did not have any changes in import are from Kosovo. Analysing different operating sectors, import data
are not applicable for almost 80% of enterprises in tourism sector, other two sectors are characterized with rather high percentage of enterprises (approxi-mately 30% of enterprises) with stable import data for the last three years, with manufacturing sector having the most enterprises that have an increase in imports (Figures 56 and 57, in Annex). Most of the survey participants (N=1474) earned 100% of their enterprise revenues on the local market, whilst only 43 participants earned 100% of the enterprise rev-enue on the foreign market share. However, many enterprises operate both on domestic and foreign markets (Figure 58, in Annex).
Out of those enterprises that export, Albania and Croatia have the highest percentage (approximately 45%) of enterprises which export their goods to the EU countries. Enterprises in the Montenegrin sam-ple are exporting their goods only to neighbouring countries. Exporting goods to neighbouring coun-tries is typical for 80% of enterprises in Bosnia and Herzegovina, Kosovo and Serbia. Almost 15% of en-terprises in Turkey export their goods to other con-tinents, which is accompanied with another 15% of export to the EU countries (Figure 59, in Annex).
Furthermore, when analysing exports by operat-ing sector (Figure 60, in Annex) it is obvious that neighbouring countries are the most frequent ex-port markets, followed by the EU countries. Out of the three sectors, manufacturing sector exports to the EU the most, in absolute terms of the enter-prises, whilst when looking at the relative terms, tourism sector exports the most to the EU countries and other continents.
32 training needs analysis
Access to finance has been widely recognised as one of the problems of SMEs in general. Therefore, this section tries to give a brief overview of the access to finance in the micro and small enterprises of the region. Out of the total sample, 1228 entrepre-neurs have stated they are partly satisfied with the availability of information about access to finance, 630 are not satisfied at all and 689 entrepreneurs are satisfied. Furthermore, entrepreneurs from the sampled enterprises, gather information on the ac-cess to finance mostly via media and internet, and then through recommendations. Entrepreneurs who participated in this survey used newsletters, confer-ences and fairs least commonly as a source of in-
formation covering access to finance (Figure 61 and Figure 62, in Annex).
Entrepreneurs were also asked to respond to two different issues, the actual usage and perceived availability of finance instruments. Micro financ-ing institutions, as sources of access to financing, are least used, followed by the international and EU funds and public funds. On the other hand, banks are most frequently used by micro and small en-terprises in the region. Analysing the perception of the availability of instruments, micro financing in-stitutions are perceived as the least available in the region (Figure 63 and Figure 64, in Annex).
3.3.
access to finance
33Findings
This section gives an overview of the ways micro and small enterprise owners build their networks. Almost 70 percent of enterprises currently use direct contact for networking and cooperation (Figure 65, in An-nex). The second most commonly used networking tool, used by more than 55% of enterprises, is par-ticipation in business forums, conferences and fairs. The least used tool in the past and at the moment is incubators, technology parks/universities and busi-ness zones. At the same time, survey participants recognize this tool the most desirable instrument for creation of networking and cooperation in the future (Figure 65, in Annex). Survey data indicate relatively
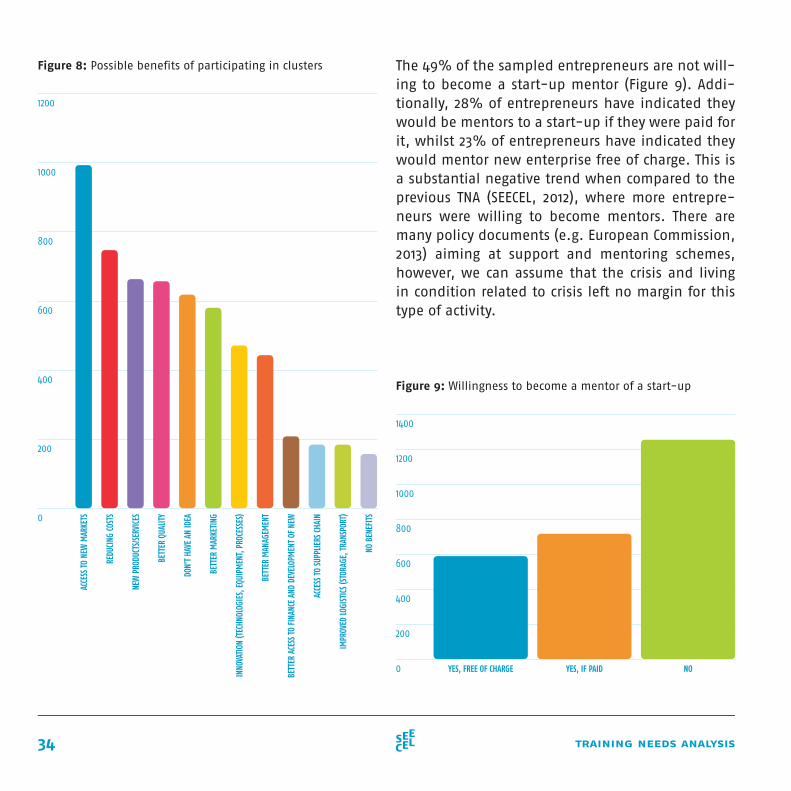
low participation in cluster activities and/or initia-tives (Figure 66, in Annex). Nevertheless, additional data suggest that business owners are aware of possible benefits of participation in clusters. As pre-sented in the Figure 8, the most commonly perceived benefits from participation in clusters are: access to new markets, cost reduction and new products and/or services. The least commonly perceived benefits are: improved logistics and access to supply chain. Survey participants rarely believe there are no ben-efits from participating in clusters.
3.4.
networking and business partnership
34 training needs analysis
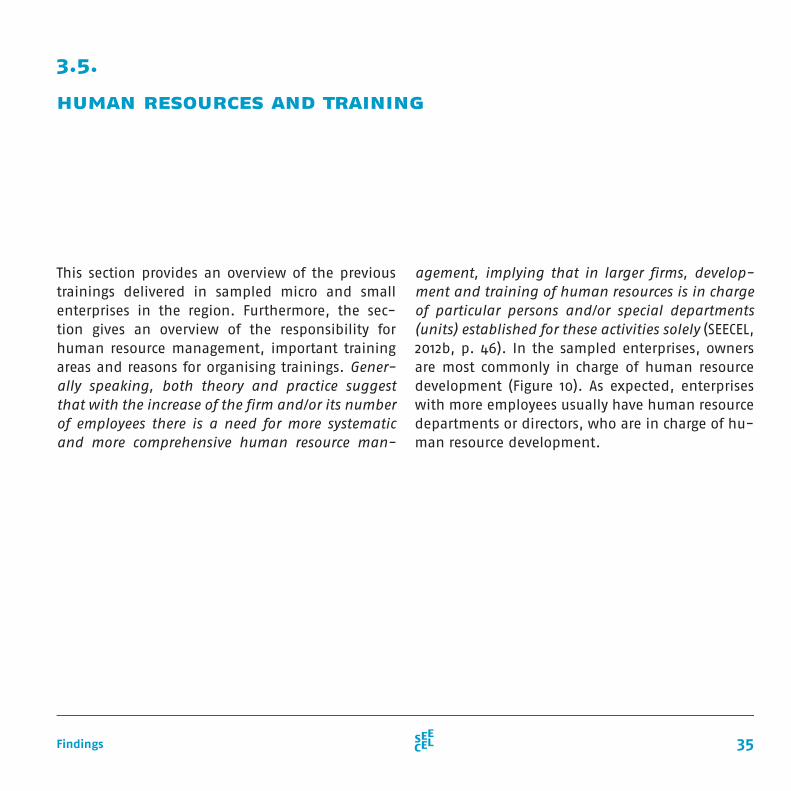
Figure 8: Possible benefits of participating in clusters The 49% of the sampled entrepreneurs are not will-ing to become a start-up mentor (Figure 9). Addi-tionally, 28% of entrepreneurs have indicated they would be mentors to a start-up if they were paid for it, whilst 23% of entrepreneurs have indicated they would mentor new enterprise free of charge. This is a substantial negative trend when compared to the previous TNA (SEECEL, 2012), where more entrepre-neurs were willing to become mentors. There are many policy documents (e.g. European Commission, 2013) aiming at support and mentoring schemes, however, we can assume that the crisis and living in condition related to crisis left no margin for this type of activity.
Figure 9: Willingness to become a mentor of a start-up
ACCE
SS TO
NEW
MAR
KETS
REDU
CING
COST
S
NEW
PRO
DUCT
S/SE
RVIC
ES
BETT
ER Q
UALIT
Y
DON’
T HA
VE A
N ID
EA
BETT
ER M
ARKE
TING
INNO
VATI
ON (T
ECHN
OLOG
IES,
EQU
IPM
ENT,
PROC
ESSE
S)
BETT
ER M
ANAG
EMEN
T
BETT
ER A
CESS
TO F
INAN
CE A
ND D
EVEL
OPM
ENT
OF N
EW
ACCE
SS TO
SUP
PLIE
RS C
HAIN
IMPR
OVED
LOGI
STIC
S (S
TORA
GE, T
RANS
PORT
)
NO B
ENEF
ITS
1200
1000
800
600
400
200
0
1400
1200
1000
800
600
400
200
0 YES, FREE OF CHARGE YES, IF PAID NO
35Findings
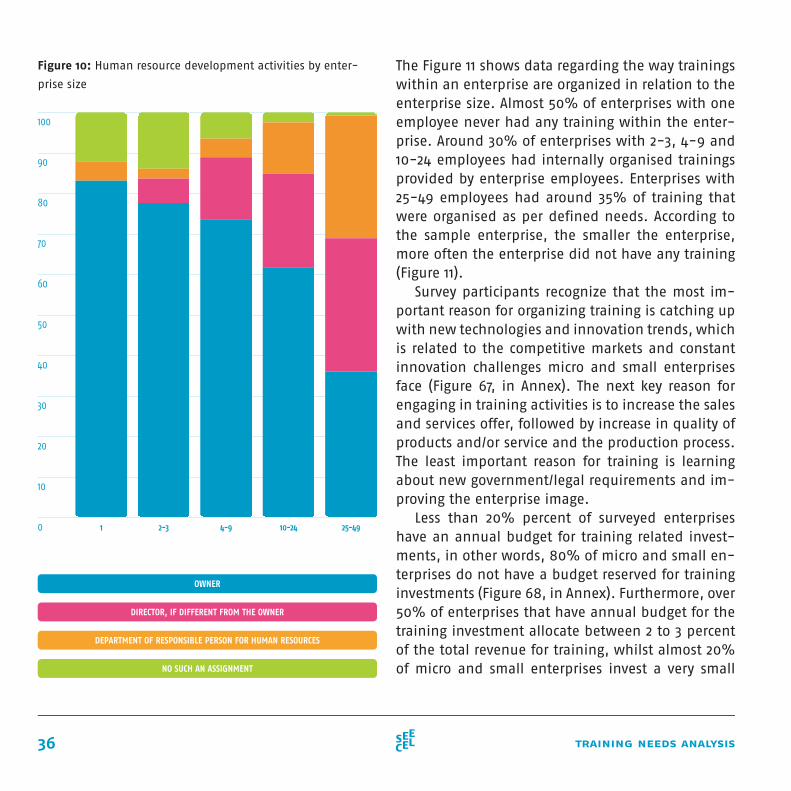
This section provides an overview of the previous trainings delivered in sampled micro and small enterprises in the region. Furthermore, the sec-tion gives an overview of the responsibility for human resource management, important training areas and reasons for organising trainings. Gener-ally speaking, both theory and practice suggest that with the increase of the firm and/or its number of employees there is a need for more systematic and more comprehensive human resource man-
3.5.
human resources and training
agement, implying that in larger firms, develop-ment and training of human resources is in charge of particular persons and/or special departments (units) established for these activities solely (SEECEL, 2012b, p. 46). In the sampled enterprises, owners are most commonly in charge of human resource development (Figure 10). As expected, enterprises with more employees usually have human resource departments or directors, who are in charge of hu-man resource development.
36 training needs analysis
Figure 10: Human resource development activities by enter-
prise size
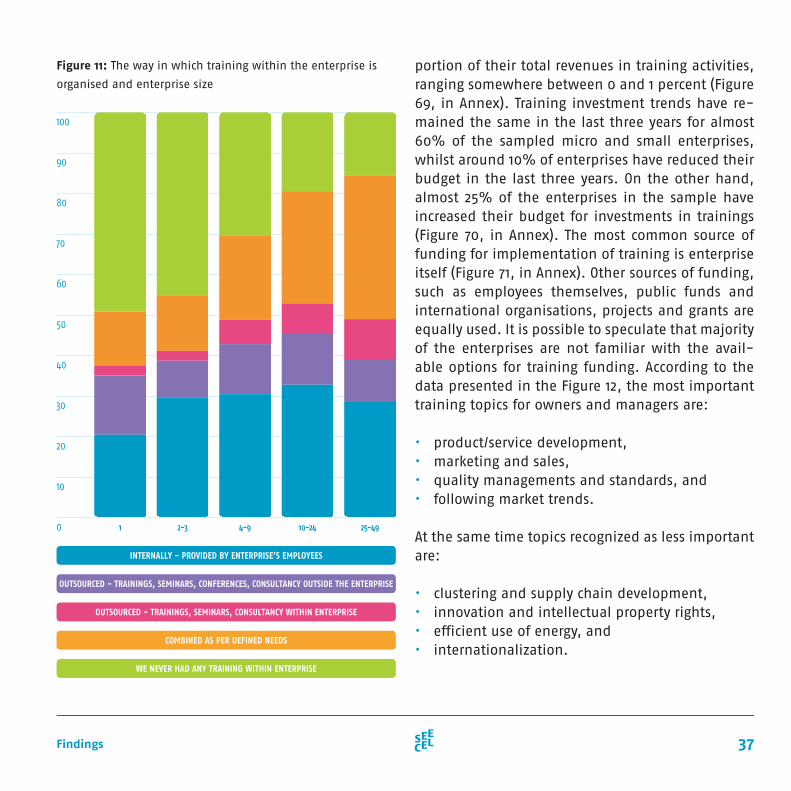
The Figure 11 shows data regarding the way trainings within an enterprise are organized in relation to the enterprise size. Almost 50% of enterprises with one employee never had any training within the enter-prise. Around 30% of enterprises with 2-3, 4-9 and 10-24 employees had internally organised trainings provided by enterprise employees. Enterprises with 25-49 employees had around 35% of training that were organised as per defined needs. According to the sample enterprise, the smaller the enterprise, more often the enterprise did not have any training (Figure 11).
100
90
80
70
60
50
40
30
20
10
0 1 2-3 4-9 10-24 25-49
NO SUCH AN ASSIGNMENT
DEPARTMENT OF RESPONSIBLE PERSON FOR HUMAN RESOURCES
DIRECTOR, IF DIFFERENT FROM THE OWNER
OWNER
Survey participants recognize that the most im-portant reason for organizing training is catching up with new technologies and innovation trends, which is related to the competitive markets and constant innovation challenges micro and small enterprises face (Figure 67, in Annex). The next key reason for engaging in training activities is to increase the sales and services offer, followed by increase in quality of products and/or service and the production process. The least important reason for training is learning about new government/legal requirements and im-proving the enterprise image.
Less than 20% percent of surveyed enterprises have an annual budget for training related invest-ments, in other words, 80% of micro and small en-terprises do not have a budget reserved for training investments (Figure 68, in Annex). Furthermore, over 50% of enterprises that have annual budget for the training investment allocate between 2 to 3 percent of the total revenue for training, whilst almost 20% of micro and small enterprises invest a very small
37Findings
Figure 11: The way in which training within the enterprise is
organised and enterprise size
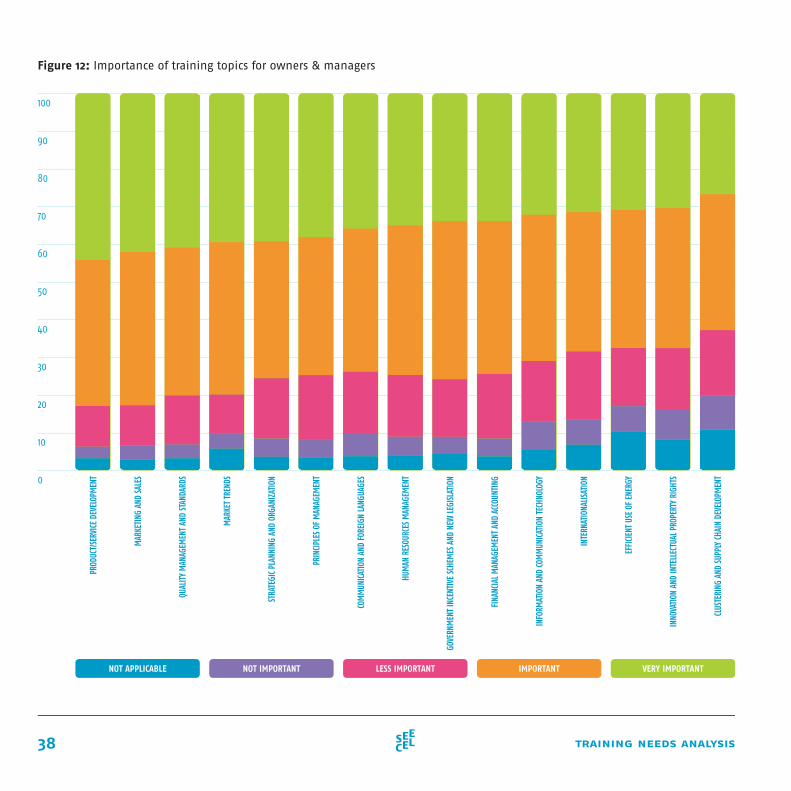
portion of their total revenues in training activities, ranging somewhere between 0 and 1 percent (Figure 69, in Annex). Training investment trends have re-mained the same in the last three years for almost 60% of the sampled micro and small enterprises, whilst around 10% of enterprises have reduced their budget in the last three years. On the other hand, almost 25% of the enterprises in the sample have increased their budget for investments in trainings (Figure 70, in Annex). The most common source of funding for implementation of training is enterprise itself (Figure 71, in Annex). Other sources of funding, such as employees themselves, public funds and international organisations, projects and grants are equally used. It is possible to speculate that majority of the enterprises are not familiar with the avail-able options for training funding. According to the data presented in the Figure 12, the most important training topics for owners and managers are:
• product/service development, • marketing and sales, • quality managements and standards, and • following market trends.
At the same time topics recognized as less important are:
• clustering and supply chain development, • innovation and intellectual property rights, • efficient use of energy, and • internationalization.
100
90
80
70
60
50
40
30
20
10
0 1 2-3 4-9 10-24 25-49
WE NEVER HAD ANY TRAINING WITHIN ENTERPRISE
COMBINED AS PER DEFINED NEEDS
OUTSOURCED - TRAININGS, SEMINARS, CONSULTANCY WITHIN ENTERPRISE
OUTSOURCED - TRAININGS, SEMINARS, CONFERENCES, CONSULTANCY OUTSIDE THE ENTERPRISE
INTERNALLY - PROVIDED BY ENTERPRISE’S EMPLOYEES
38 training needs analysis
Figure 12: Importance of training topics for owners & managers
NOT APPLICABLE NOT IMPORTANT LESS IMPORTANT IMPORTANT VERY IMPORTANT
CLUS
TERI
NG A
ND S
UPPL
Y CH
AIN
DEVE
LOPM
ENT
INNO
VATI
ON A
ND IN
TELL
ECTU
AL P
ROPE
RTY
RIGH
TS
EFFI
CIEN
T US
E OF
ENE
RGY
INTE
RNAT
IONA
LISAT
ION
INF
ORM
ATIO
N AN
D CO
MM
UNIC
ATIO
N TE
CHNO
LOGY
FINA
NCIA
L MAN
AGEM
ENT
AND
ACCO
UNTI
NG
GOVE
RNM
ENT
INCE
NTIV
E SC
HEM
ES A
ND N
EW LE
GISL
ATIO
N
HUM
AN R
ESOU
RCES
MAN
AGEM
ENT
COM
MUN
ICAT
ION
AND
FORE
IGN
LANG
UAGE
S
PRIN
CIPL
ES O
F M
ANAG
EMEN
T
STRA
TEGI
C PLA
NNIN
G AN
D OR
GANI
ZATI
ON
MAR
KET
TREN
DS
PROD
UCT/
SERV
ICE
DEVE
LOPM
ENT
MAR
KETI
NG A
ND S
ALES
QUAL
ITY M
ANAG
EMEN
T AN
D ST
ANDA
RDS
100
90
80
70
60
50
40
30
20
10
0
39Findings
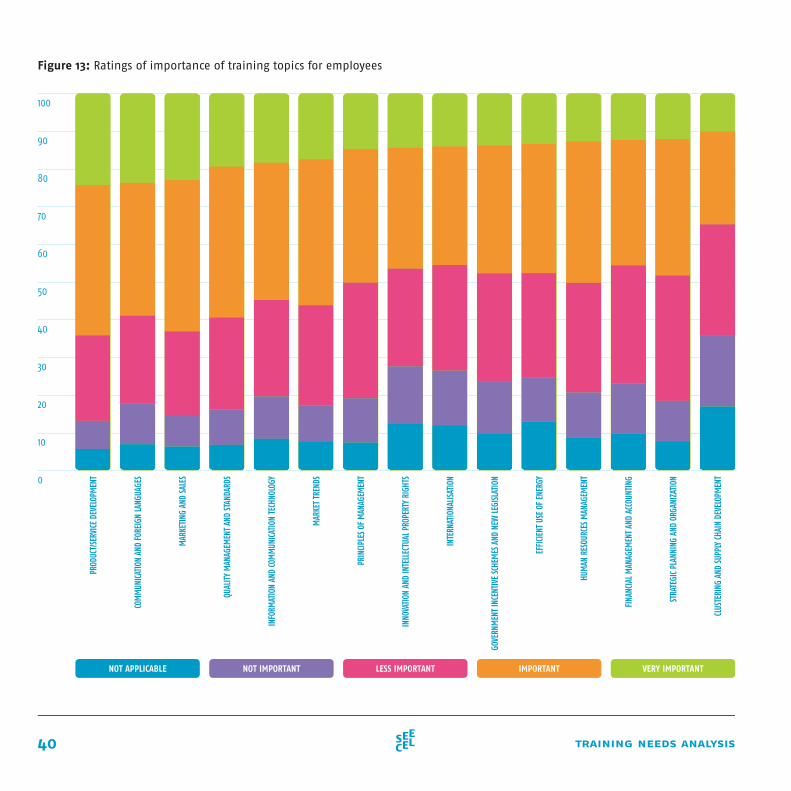
Moving from employers to employees, training top-ics which are recognized as the most important for training of employees are:
• product/service development, • communication and foreign languages, • marketing, and • quality management and standards.
The least important topics are:
• clustering and supply chain development • strategic planning and organization, and • financial management and accounting (Figure 13).
Notably, human resource management is not per-ceived as an important training topic for employees. Although human resource management is important per se, entrepreneurs have stressed the importance of obtaining technical knowledge, process manage-ment and marketing skills for their employees. This could be due to the fact that entrepreneurs them-selves are mostly in charge of human resource man-agement.
40 training needs analysis
Figure 13: Ratings of importance of training topics for employees
100
90
80
70
60
50
40
30
20
10
0
PROD
UCT/
SERV
ICE
DEVE
LOPM
ENT
COM
MUN
ICAT
ION
AND
FORE
IGN
LANG
UAGE
S
MAR
KETI
NG A
ND S
ALES
QUAL
ITY M
ANAG
EMEN
T AN
D ST
ANDA
RDS
INFO
RMAT
ION
AND
COM
MUN
ICAT
ION
TECH
NOLO
GY
MAR
KET
TREN
DS
PRIN
CIPL
ES O
F M
ANAG
EMEN
T
INNO
VATI
ON A
ND IN
TELL
ECTU
AL P
ROPE
RTY
RIGH
TS
INTE
RNAT
IONA
LISAT
ION
GOVE
RNM
ENT
INCE
NTIV
E SC
HEM
ES A
ND N
EW LE
GISL
ATIO
N
EFFI
CIEN
T US
E OF
ENE
RGY
HUM
AN R
ESOU
RCES
MAN
AGEM
ENT
FINA
NCIA
L MAN
AGEM
ENT
AND
ACCO
UNTI
NG
STRA
TEGI
C PLA
NNIN
G AN
D OR
GANI
ZATI
ON
CLUS
TERI
NG A
ND S
UPPL
Y CH
AIN
DEVE
LOPM
ENT
NOT APPLICABLE NOT IMPORTANT LESS IMPORTANT IMPORTANT VERY IMPORTANT
41Findings
Every year, in every economy, new businesses are be-ing set up, some enterprises are growing, whilst the other are declining, and some cease to exist. The more productive ones take place of the less productive ones, which is often explained with the popular term of ‘creative destruction’ (Schumpeter, 1934). The dynam-ics of the market with new enterprises emerging can affect the economy through enhancing the level of innovation. In parallel, by understanding the barri-ers faced by the existing small business community, governments can enterprises grow with different forms of interventions, and thus assist the future new en-terprises. In line with the previously said, this chapter tries to give a deeper, statistically more rigorous analy-sis of the challenges micro and small enterprises face.
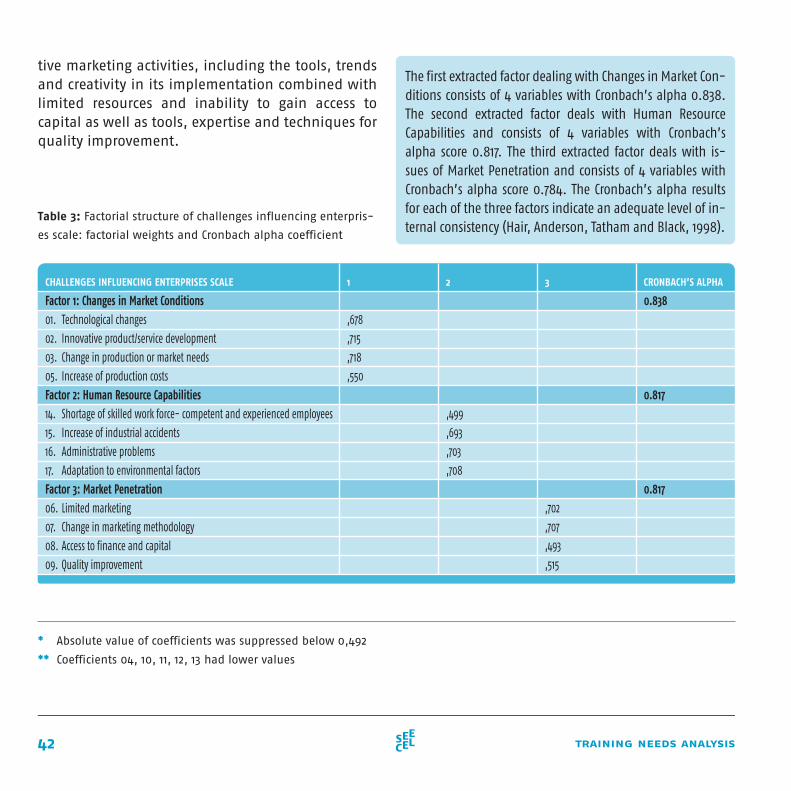
The scale of challenges influencing enterprises consisted of 17 questions. Exploratory factorial anal-ysis was conducted by using principal axis factoring and revealed three factors (Table 3), which account for 50.47% of the common variance. Out of the 17 items, overall 12 items are grouped in three different factors, namely:
• Factor 1: Changes in Market Conditions, • Factor 2: Human Resource Capabilities, and • Factor 3: Market Penetration.
Factor 1: Changes in Market Condition represents the challenges micro and small enterprises face, which occur as a result of constant velocity of changes in meeting customer needs, adjustments to the tech-nological advancements related to the sector, as well as the requirement to constantly make incre-mental innovations and keep track of the innovative achievements of the competitors in the market. Factor 2: Human Resource Capabilities represents the challenges micro and small enterprises face, which occur in relation to employees’ abilities to absorb the administrative requirements towards the state institutions and the enterprise’s clients.
Factor 3: Market Penetration represents the chal-lenges micro and small enterprises face, which occur as a result of limited knowledge in conducting effec-
3.6.
challenges influencing small business community
42 training needs analysis
tive marketing activities, including the tools, trends and creativity in its implementation combined with limited resources and inability to gain access to capital as well as tools, expertise and techniques for quality improvement.
The first extracted factor dealing with Changes in Market Con-ditions consists of 4 variables with Cronbach’s alpha 0.838. The second extracted factor deals with Human Resource Capabilities and consists of 4 variables with Cronbach’s alpha score 0.817. The third extracted factor deals with is-sues of Market Penetration and consists of 4 variables with Cronbach’s alpha score 0.784. The Cronbach’s alpha results for each of the three factors indicate an adequate level of in-ternal consistency (Hair, Anderson, Tatham and Black, 1998).
Table 3: Factorial structure of challenges influencing enterpris-
es scale: factorial weights and Cronbach alpha coefficient
* Absolute value of coefficients was suppressed below 0,492
** Coefficients 04, 10, 11, 12, 13 had lower values
CHALLENGES INFLUENCING ENTERPRISES SCALE 1 2 3 CRONBACH’S ALPHA
Factor 1: Changes in Market Conditions01. Technological changes
02. Innovative product/service development
03. Change in production or market needs
05. Increase of production costs
Factor 2: Human Resource Capabilities14. Shortage of skilled work force- competent and experienced employees
15. Increase of industrial accidents
16. Administrative problems
17. Adaptation to environmental factors
Factor 3: Market Penetration06. Limited marketing
07. Change in marketing methodology
08. Access to finance and capital
09. Quality improvement
,678
,715
,718
,550
0.838
0.817
0.817
,499
,693
,703
,708
,702
,707
,493
,515
43Findings
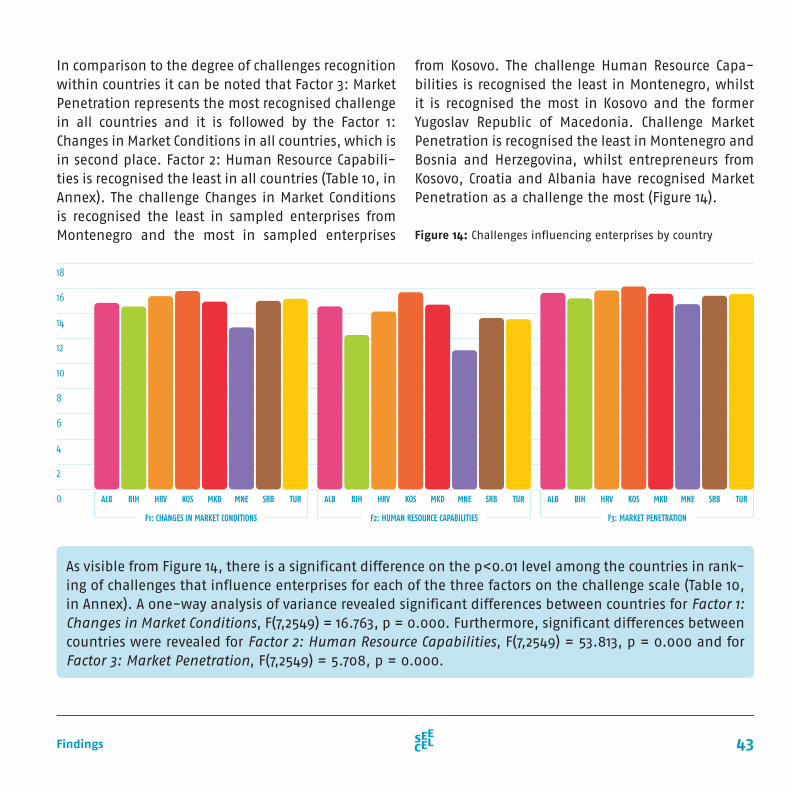
In comparison to the degree of challenges recognition within countries it can be noted that Factor 3: Market Penetration represents the most recognised challenge in all countries and it is followed by the Factor 1: Changes in Market Conditions in all countries, which is in second place. Factor 2: Human Resource Capabili-ties is recognised the least in all countries (Table 10, in Annex). The challenge Changes in Market Conditions is recognised the least in sampled enterprises from Montenegro and the most in sampled enterprises
As visible from Figure 14, there is a significant difference on the p<0.01 level among the countries in rank-ing of challenges that influence enterprises for each of the three factors on the challenge scale (Table 10, in Annex). A one-way analysis of variance revealed significant differences between countries for Factor 1: Changes in Market Conditions, F(7,2549) = 16.763, p = 0.000. Furthermore, significant differences between countries were revealed for Factor 2: Human Resource Capabilities, F(7,2549) = 53.813, p = 0.000 and for Factor 3: Market Penetration, F(7,2549) = 5.708, p = 0.000.
from Kosovo. The challenge Human Resource Capa-bilities is recognised the least in Montenegro, whilst it is recognised the most in Kosovo and the former Yugoslav Republic of Macedonia. Challenge Market Penetration is recognised the least in Montenegro and Bosnia and Herzegovina, whilst entrepreneurs from Kosovo, Croatia and Albania have recognised Market Penetration as a challenge the most (Figure 14).
Figure 14: Challenges influencing enterprises by country
18
16
14
12
10
8
6
4
2
0 TURSRBMNEMKDKOSBIH HRVALB TURSRBMNEMKDKOSBIH HRVALB TURSRBMNEMKDKOSBIH HRVALB
F1: CHANGES IN MARKET CONDITIONS F2: HUMAN RESOURCE CAPABILITIES F3: MARKET PENETRATION
44 training needs analysis
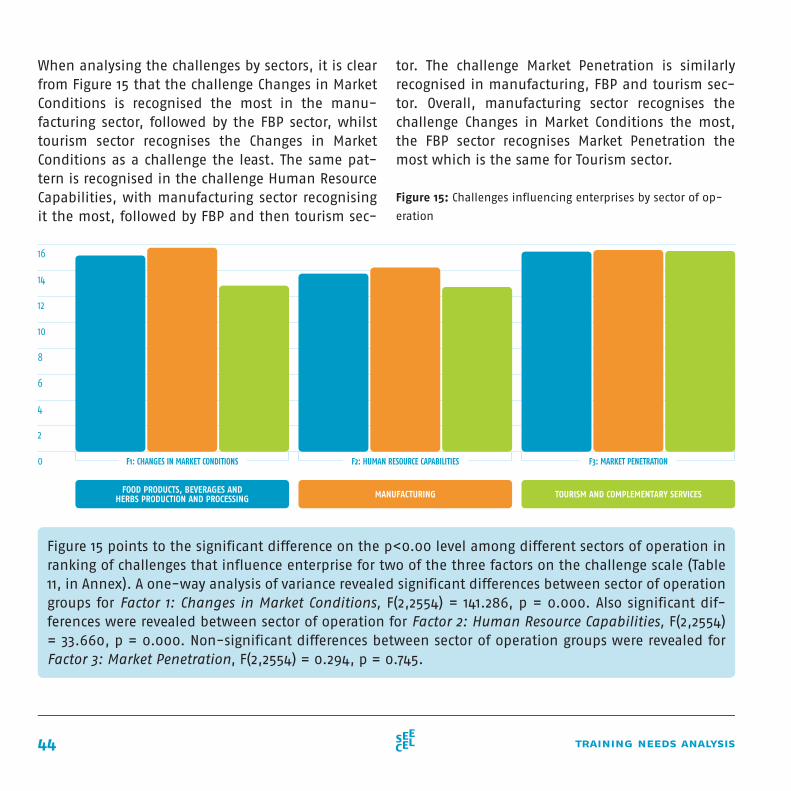
Figure 15 points to the significant difference on the p<0.00 level among different sectors of operation in ranking of challenges that influence enterprise for two of the three factors on the challenge scale (Table 11, in Annex). A one-way analysis of variance revealed significant differences between sector of operation groups for Factor 1: Changes in Market Conditions, F(2,2554) = 141.286, p = 0.000. Also significant dif-ferences were revealed between sector of operation for Factor 2: Human Resource Capabilities, F(2,2554) = 33.660, p = 0.000. Non-significant differences between sector of operation groups were revealed for Factor 3: Market Penetration, F(2,2554) = 0.294, p = 0.745.
tor. The challenge Market Penetration is similarly recognised in manufacturing, FBP and tourism sec-tor. Overall, manufacturing sector recognises the challenge Changes in Market Conditions the most, the FBP sector recognises Market Penetration the most which is the same for Tourism sector.
Figure 15: Challenges influencing enterprises by sector of op-
eration
16
14
12
10
8
6
4
2
0
FOOD PRODUCTS, BEVERAGES AND HERBS PRODUCTION AND PROCESSING MANUFACTURING TOURISM AND COMPLEMENTARY SERVICES
F1: CHANGES IN MARKET CONDITIONS F2: HUMAN RESOURCE CAPABILITIES F3: MARKET PENETRATION
When analysing the challenges by sectors, it is clear from Figure 15 that the challenge Changes in Market Conditions is recognised the most in the manu-facturing sector, followed by the FBP sector, whilst tourism sector recognises the Changes in Market Conditions as a challenge the least. The same pat-tern is recognised in the challenge Human Resource Capabilities, with manufacturing sector recognising it the most, followed by FBP and then tourism sec-
45Findings
This chapter attempts to give an overview of the trainings entrepreneurs from the sampled enterpris-es in eight countries perceive as the most needed. It is these needs that are the voice of the entrepre-neurs for the measures of support but also for the consultants to act upon them.
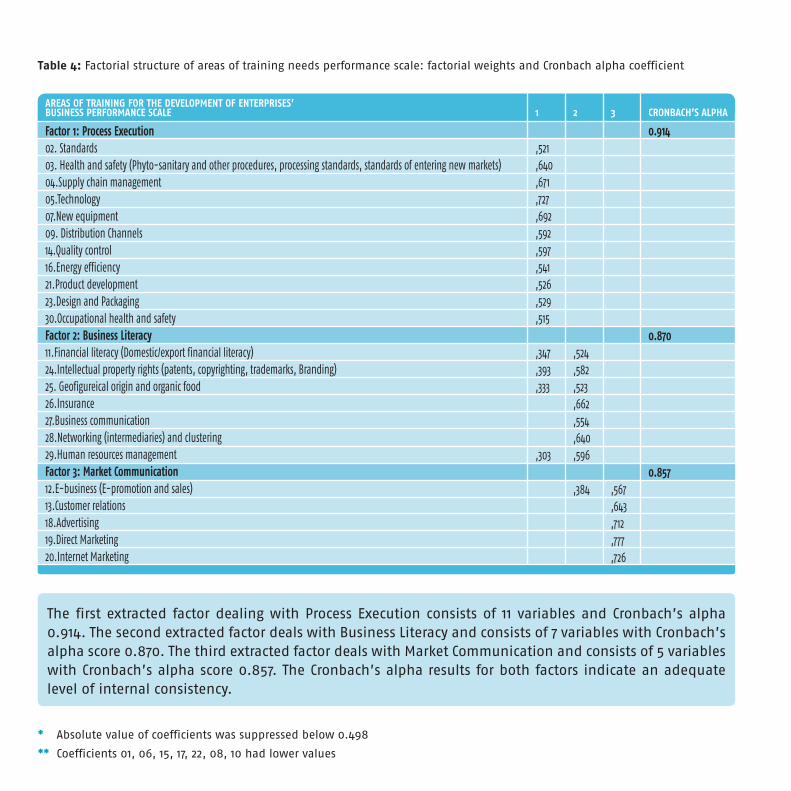
The areas of training for the development of enterprise’s business performance scale consisted of 30 questions. Exploratory factorial analysis was conducted by using the principal axis factoring and revealed three factors (Table 4), which account for 52.48% of the common variance. Out of the 30 items, 23 have a common denominator in the fol-lowing three factors,
• Factor 1: Process Execution, • Factor 2: Business Literacy, and • Factor 3: Market Communication.
Factor 1: Process Execution refers to the trainings that include acquiring practical skills and tech-niques in using the technology and equipment for the increase of productivity levels, design think-
ing and customer development, management of the supply chain and step by step implementation of standards as well as health and safety require-ments.
Factor 2: Business Literacy represents trainings that feature the overall knowledge needed to run a busi-ness professionally and understand the general en-vironment in which the entrepreneur is operating; this refers to understanding financial instruments, intellectual property rights, professional business correspondence, leading and motivating as well as effective networking strategies.
Factor 3: Market Communication represents trainings for effective market positioning of micro and small enterprises, and it refers to business to business as well as business to customer marketing, effective use of internet marketing tools and how to extract valu-able information from and lock in the customers.
3.7.
trainings needs of the small business community
AREAS OF TRAINING FOR THE DEVELOPMENT OF ENTERPRISES’ BUSINESS PERFORMANCE SCALE 1 2 3 CRONBACH’S ALPHA
Factor 1: Process Execution 02. Standards03. Health and safety (Phyto-sanitary and other procedures, processing standards, standards of entering new markets)04.Supply chain management05.Technology07.New equipment09. Distribution Channels14.Quality control16.Energy efficiency21.Product development23.Design and Packaging30.Occupational health and safetyFactor 2: Business Literacy11.Financial literacy (Domestic/export financial literacy)24.Intellectual property rights (patents, copyrighting, trademarks, Branding)25. Geofigureical origin and organic food26.Insurance27.Business communication28.Networking (intermediaries) and clustering29.Human resources managementFactor 3: Market Communication12.E-business (E-promotion and sales)13.Customer relations18.Advertising19.Direct Marketing20.Internet Marketing
,521 ,640 ,671 ,727 ,692 ,592 ,597 ,541 ,526 ,529 ,515
0.914
0.870
0.857
,524,582,523 ,662 ,554 ,640,596
,384
,347 ,393 ,333
,303
,567,643,712,777,726
* Absolute value of coefficients was suppressed below 0.498
** Coefficients 01, 06, 15, 17, 22, 08, 10 had lower values
Table 4: Factorial structure of areas of training needs performance scale: factorial weights and Cronbach alpha coefficient
The first extracted factor dealing with Process Execution consists of 11 variables and Cronbach’s alpha 0.914. The second extracted factor deals with Business Literacy and consists of 7 variables with Cronbach’s alpha score 0.870. The third extracted factor deals with Market Communication and consists of 5 variables with Cronbach’s alpha score 0.857. The Cronbach’s alpha results for both factors indicate an adequate level of internal consistency.
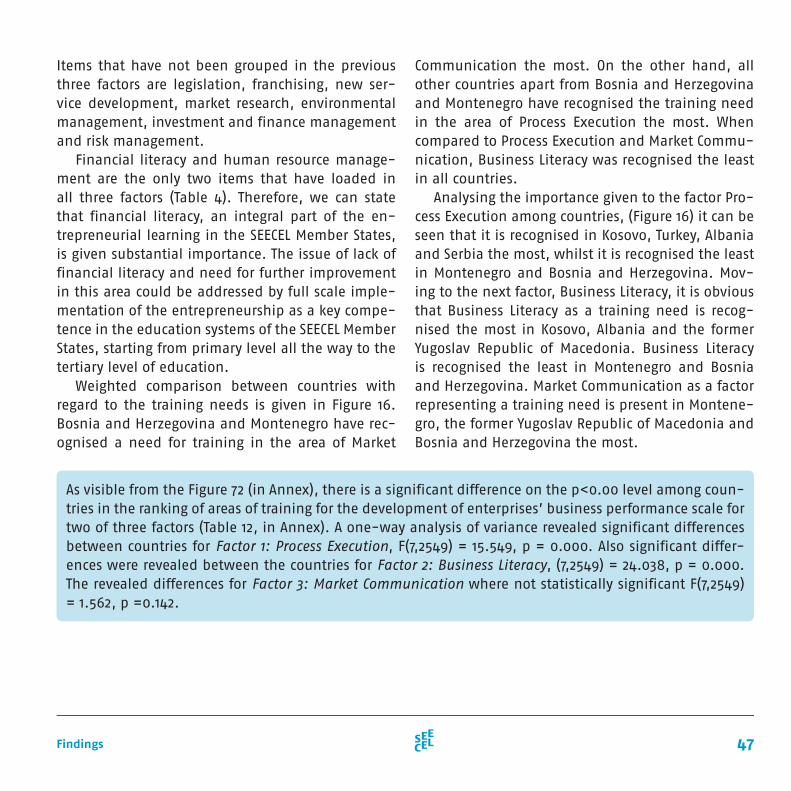
47Findings
Items that have not been grouped in the previous three factors are legislation, franchising, new ser-vice development, market research, environmental management, investment and finance management and risk management.
Financial literacy and human resource manage-ment are the only two items that have loaded in all three factors (Table 4). Therefore, we can state that financial literacy, an integral part of the en-trepreneurial learning in the SEECEL Member States, is given substantial importance. The issue of lack of financial literacy and need for further improvement in this area could be addressed by full scale imple-mentation of the entrepreneurship as a key compe-tence in the education systems of the SEECEL Member States, starting from primary level all the way to the tertiary level of education.
Communication the most. On the other hand, all other countries apart from Bosnia and Herzegovina and Montenegro have recognised the training need in the area of Process Execution the most. When compared to Process Execution and Market Commu-nication, Business Literacy was recognised the least in all countries.
Analysing the importance given to the factor Pro-cess Execution among countries, (Figure 16) it can be seen that it is recognised in Kosovo, Turkey, Albania and Serbia the most, whilst it is recognised the least in Montenegro and Bosnia and Herzegovina. Mov-ing to the next factor, Business Literacy, it is obvious that Business Literacy as a training need is recog-nised the most in Kosovo, Albania and the former Yugoslav Republic of Macedonia. Business Literacy is recognised the least in Montenegro and Bosnia and Herzegovina. Market Communication as a factor representing a training need is present in Montene-gro, the former Yugoslav Republic of Macedonia and Bosnia and Herzegovina the most.
As visible from the Figure 72 (in Annex), there is a significant difference on the p<0.00 level among coun-tries in the ranking of areas of training for the development of enterprises’ business performance scale for two of three factors (Table 12, in Annex). A one-way analysis of variance revealed significant differences between countries for Factor 1: Process Execution, F(7,2549) = 15.549, p = 0.000. Also significant differ-ences were revealed between the countries for Factor 2: Business Literacy, (7,2549) = 24.038, p = 0.000. The revealed differences for Factor 3: Market Communication where not statistically significant F(7,2549) = 1.562, p =0.142.
Weighted comparison between countries with regard to the training needs is given in Figure 16. Bosnia and Herzegovina and Montenegro have rec-ognised a need for training in the area of Market
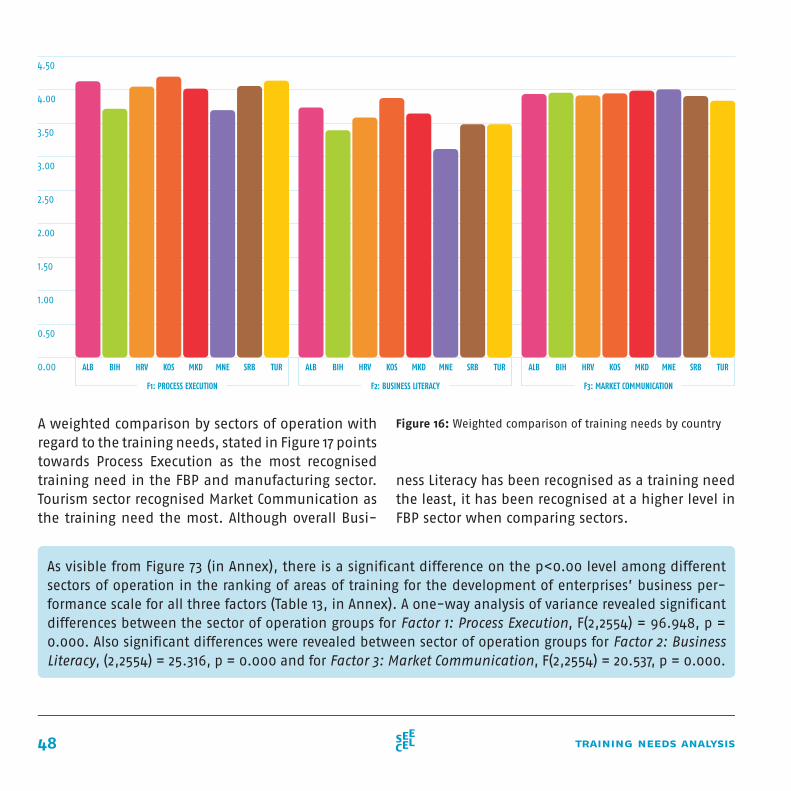
48 training needs analysis
Figure 16: Weighted comparison of training needs by country
As visible from Figure 73 (in Annex), there is a significant difference on the p<0.00 level among different sectors of operation in the ranking of areas of training for the development of enterprises’ business per-formance scale for all three factors (Table 13, in Annex). A one-way analysis of variance revealed significant differences between the sector of operation groups for Factor 1: Process Execution, F(2,2554) = 96.948, p = 0.000. Also significant differences were revealed between sector of operation groups for Factor 2: Business Literacy, (2,2554) = 25.316, p = 0.000 and for Factor 3: Market Communication, F(2,2554) = 20.537, p = 0.000.
ness Literacy has been recognised as a training need the least, it has been recognised at a higher level in FBP sector when comparing sectors.
4.50
4.00
3.50
3.00
2.50
2.00
1.50
1.00
0.50
0.00 TURSRBMNEMKDKOSBIH HRVALB TURSRBMNEMKDKOSBIH HRVALB TURSRBMNEMKDKOSBIH HRVALB
F1: PROCESS EXECUTION F2: BUSINESS LITERACY F3: MARKET COMMUNICATION
A weighted comparison by sectors of operation with regard to the training needs, stated in Figure 17 points towards Process Execution as the most recognised training need in the FBP and manufacturing sector. Tourism sector recognised Market Communication as the training need the most. Although overall Busi-
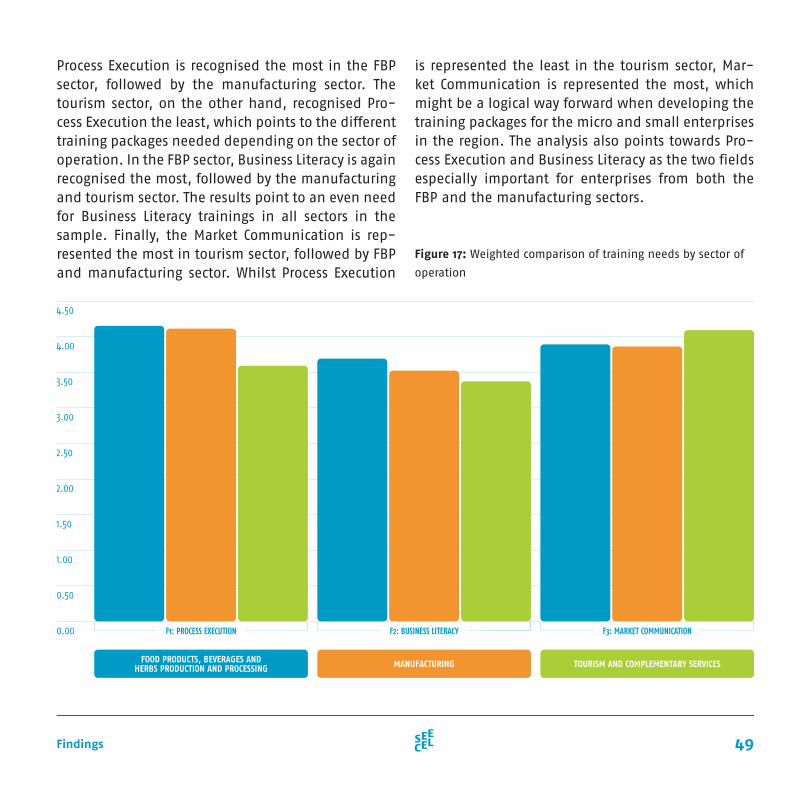
49Findings
F1: PROCESS EXECUTION F2: BUSINESS LITERACY F3: MARKET COMMUNICATION
Process Execution is recognised the most in the FBP sector, followed by the manufacturing sector. The tourism sector, on the other hand, recognised Pro-cess Execution the least, which points to the different training packages needed depending on the sector of operation. In the FBP sector, Business Literacy is again recognised the most, followed by the manufacturing and tourism sector. The results point to an even need for Business Literacy trainings in all sectors in the sample. Finally, the Market Communication is rep-resented the most in tourism sector, followed by FBP and manufacturing sector. Whilst Process Execution
is represented the least in the tourism sector, Mar-ket Communication is represented the most, which might be a logical way forward when developing the training packages for the micro and small enterprises in the region. The analysis also points towards Pro-cess Execution and Business Literacy as the two fields especially important for enterprises from both the FBP and the manufacturing sectors.
Figure 17: Weighted comparison of training needs by sector of
operation
4.50
4.00
3.50
3.00
2.50
2.00
1.50
1.00
0.50
0.00
FOOD PRODUCTS, BEVERAGES AND HERBS PRODUCTION AND PROCESSING MANUFACTURING TOURISM AND COMPLEMENTARY SERVICES
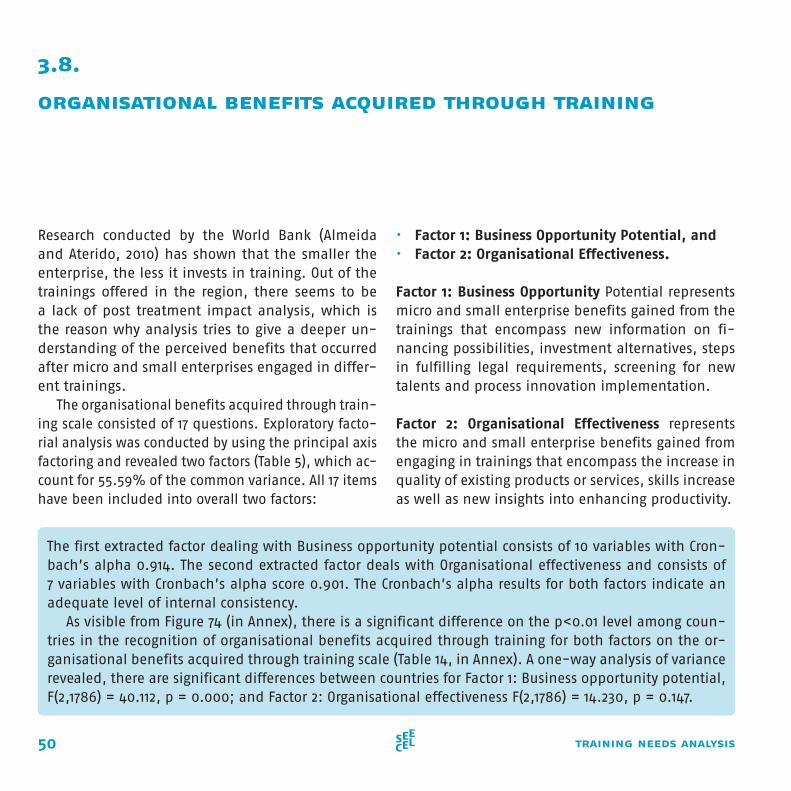
50 training needs analysis
Research conducted by the World Bank (Almeida and Aterido, 2010) has shown that the smaller the enterprise, the less it invests in training. Out of the trainings offered in the region, there seems to be a lack of post treatment impact analysis, which is the reason why analysis tries to give a deeper un-derstanding of the perceived benefits that occurred after micro and small enterprises engaged in differ-ent trainings.
The organisational benefits acquired through train-ing scale consisted of 17 questions. Exploratory facto-rial analysis was conducted by using the principal axis factoring and revealed two factors (Table 5), which ac-count for 55.59% of the common variance. All 17 items have been included into overall two factors:
• Factor 1: Business Opportunity Potential, and • Factor 2: Organisational Effectiveness.
Factor 1: Business Opportunity Potential represents micro and small enterprise benefits gained from the trainings that encompass new information on fi-nancing possibilities, investment alternatives, steps in fulfilling legal requirements, screening for new talents and process innovation implementation.
Factor 2: Organisational Effectiveness represents the micro and small enterprise benefits gained from engaging in trainings that encompass the increase in quality of existing products or services, skills increase as well as new insights into enhancing productivity.
3.8.
organisational benefits acquired through training
The first extracted factor dealing with Business opportunity potential consists of 10 variables with Cron-bach’s alpha 0.914. The second extracted factor deals with Organisational effectiveness and consists of 7 variables with Cronbach’s alpha score 0.901. The Cronbach’s alpha results for both factors indicate an adequate level of internal consistency.
As visible from Figure 74 (in Annex), there is a significant difference on the p<0.01 level among coun-tries in the recognition of organisational benefits acquired through training for both factors on the or-ganisational benefits acquired through training scale (Table 14, in Annex). A one-way analysis of variance revealed, there are significant differences between countries for Factor 1: Business opportunity potential, F(2,1786) = 40.112, p = 0.000; and Factor 2: Organisational effectiveness F(2,1786) = 14.230, p = 0.147.
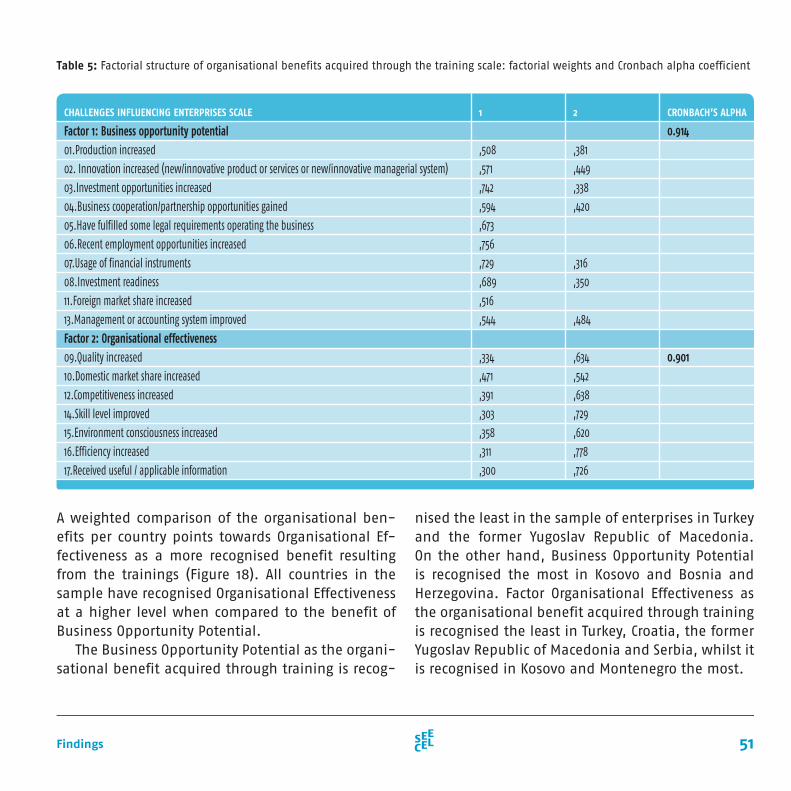
51Findings
Table 5: Factorial structure of organisational benefits acquired through the training scale: factorial weights and Cronbach alpha coefficient
nised the least in the sample of enterprises in Turkey and the former Yugoslav Republic of Macedonia. On the other hand, Business Opportunity Potential is recognised the most in Kosovo and Bosnia and Herzegovina. Factor Organisational Effectiveness as the organisational benefit acquired through training is recognised the least in Turkey, Croatia, the former Yugoslav Republic of Macedonia and Serbia, whilst it is recognised in Kosovo and Montenegro the most.
A weighted comparison of the organisational ben-efits per country points towards Organisational Ef-fectiveness as a more recognised benefit resulting from the trainings (Figure 18). All countries in the sample have recognised Organisational Effectiveness at a higher level when compared to the benefit of Business Opportunity Potential.
The Business Opportunity Potential as the organi-sational benefit acquired through training is recog-
CHALLENGES INFLUENCING ENTERPRISES SCALE 1 2 CRONBACH’S ALPHA
Factor 1: Business opportunity potential01.Production increased
02. Innovation increased (new/innovative product or services or new/innovative managerial system)
03.Investment opportunities increased
04.Business cooperation/partnership opportunities gained
05.Have fulfilled some legal requirements operating the business
06.Recent employment opportunities increased
07.Usage of financial instruments
08.Investment readiness
11.Foreign market share increased
13.Management or accounting system improved
Factor 2: Organisational effectiveness09.Quality increased
10.Domestic market share increased
12.Competitiveness increased
14.Skill level improved
15.Environment consciousness increased
16.Efficiency increased
17.Received useful / applicable information
0.914
0.901
,508
,571
,742
,594
,673
,756
,729
,689
,516
,544
,381
,449
,338
,420
,316
,350
,484
,334
,471
,391
,303
,358
,311
,300
,634
,542
,638
,729
,620
,778
,726
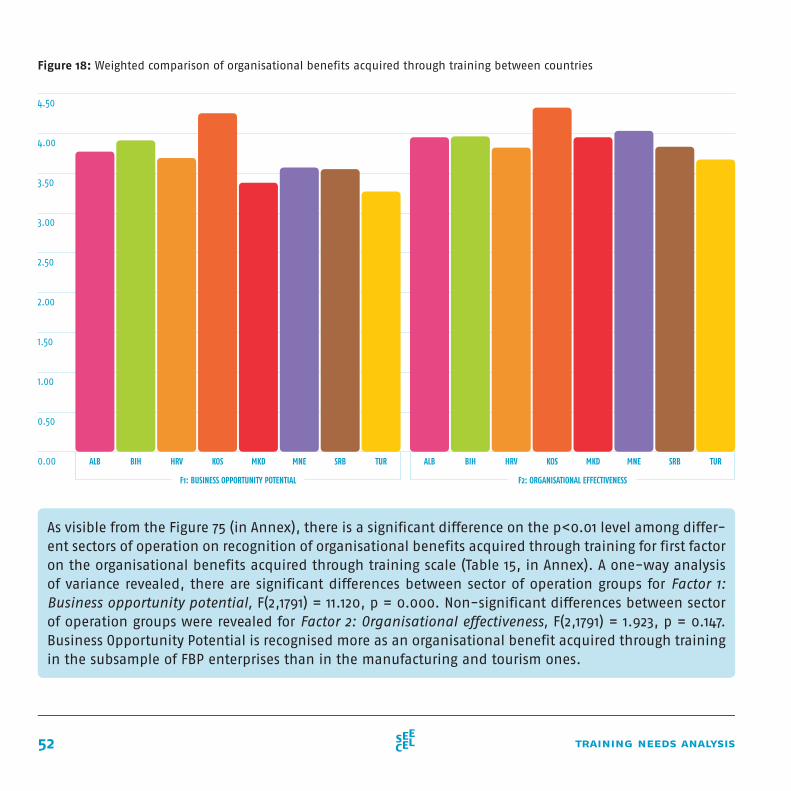
52 training needs analysis
Figure 18: Weighted comparison of organisational benefits acquired through training between countries
As visible from the Figure 75 (in Annex), there is a significant difference on the p<0.01 level among differ-ent sectors of operation on recognition of organisational benefits acquired through training for first factor on the organisational benefits acquired through training scale (Table 15, in Annex). A one-way analysis of variance revealed, there are significant differences between sector of operation groups for Factor 1: Business opportunity potential, F(2,1791) = 11.120, p = 0.000. Non-significant differences between sector of operation groups were revealed for Factor 2: Organisational effectiveness, F(2,1791) = 1.923, p = 0.147. Business Opportunity Potential is recognised more as an organisational benefit acquired through training in the subsample of FBP enterprises than in the manufacturing and tourism ones.
4.50
4.00
3.50
3.00
2.50
2.00
1.50
1.00
0.50
0.00 TUR TURSRB SRBMNE MNEMKD MKDKOS KOSBIH BIHHRV HRVALB ALB
F1: BUSINESS OPPORTUNITY POTENTIAL F2: ORGANISATIONAL EFFECTIVENESS
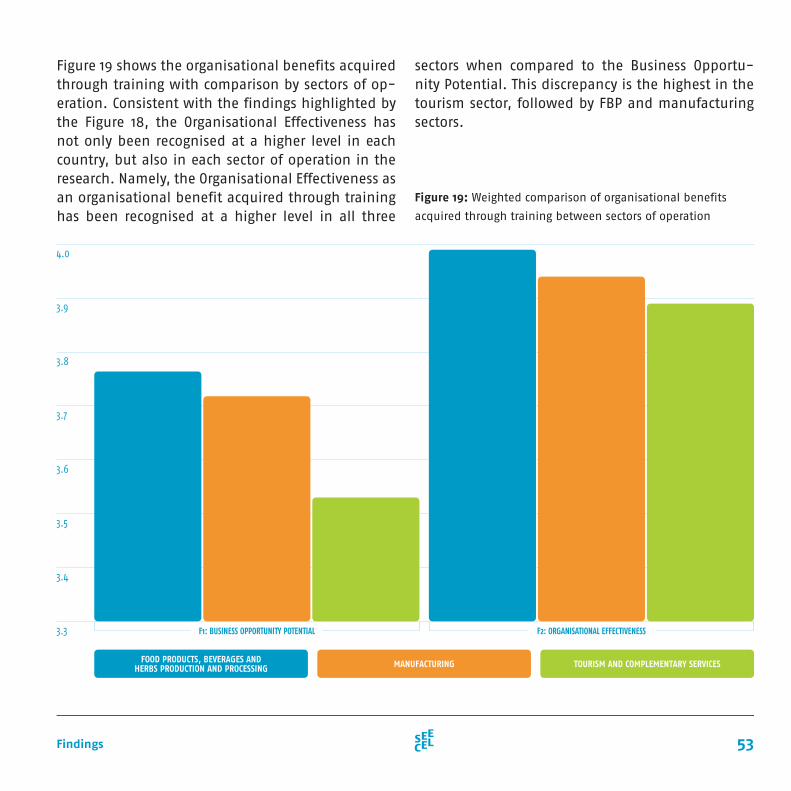
53Findings
Figure 19 shows the organisational benefits acquired through training with comparison by sectors of op-eration. Consistent with the findings highlighted by the Figure 18, the Organisational Effectiveness has not only been recognised at a higher level in each country, but also in each sector of operation in the research. Namely, the Organisational Effectiveness as an organisational benefit acquired through training has been recognised at a higher level in all three
sectors when compared to the Business Opportu-nity Potential. This discrepancy is the highest in the tourism sector, followed by FBP and manufacturing sectors.
Figure 19: Weighted comparison of organisational benefits
acquired through training between sectors of operation
4.0
3.9
3.8
3.7
3.6
3.5
3.4
3.3 F1: BUSINESS OPPORTUNITY POTENTIAL F2: ORGANISATIONAL EFFECTIVENESS
FOOD PRODUCTS, BEVERAGES AND HERBS PRODUCTION AND PROCESSING MANUFACTURING TOURISM AND COMPLEMENTARY SERVICES
54 training needs analysis
The hierarchical multiple regression analysis (Table 16, in Annex) indicated the effect of micro and small enterprise challenge on the recognition of the train-ing need in the process execution dimension. It is likely that micro and small enterprise, which are fac-ing challenges in the area of changes in market con-ditions, would require training in Process Execution. For each unit of increase of recognized challenge in the market condition changes, there will be a .37 units increase in the recognition of need for training in process execution area. Furthermore, training in process execution would also be desired by micro and small enterprises with challenge in area of hu-man resource capabilities (with .28 units increase in the recognition of training need for each unit of rec-ognized problem increase) and market penetration (with .07 units increase in the recognition of training need for each unit of recognized challenge increase).
3.9.
regression results
The hierarchical multiple regression analysis (Ta-ble 17, in Annex) indicated the effect of micro and small enterprise challenge on the recognition of the training need in business literacy. It is likely that an SME with challenges in the area of human re-source capabilities would require training in busi-ness literacy. For each unit of increase of recognized challenge in human resource capabilities, there will be a .37 unit increase in recognition of need for training in business literacy area. Furthermore, training in business literacy would also be desired by micro and small enterprises facing challenge in the changes in market conditions (with .16 units increase in recognition of need for training for each unit of recognized challenge increase) and market penetration (with .15 units increase in recognition of need for training for each unit of recognized chal-lenge increase).
55Findings
The analysis (Table 16, in Annex) shows regression results for recognising Process Execution as a training need. In the first step of hierarchical multiple regressions for the training dimension Process Execution five predictors were entered: participation in cluster activities/initiatives, total revenue, number of employees, exports, imports. This model was statistically significant F (5, 2551) = 27.279; p < .001 and explained 5% of variance in recognition of necessary training in Process Execution. After the entry of three challenge dimensions at Step 2, the total variance explained by the model as a whole was 42% (F (8,2548) = 232.655; p < .001). The introduction of challenge dimensions explained additional 37% variance in recognition of necessary training in the Process Execution, after controlling participation in cluster activities/initiatives, total revenue, number of employees, exports, imports (R2 Change = .371; F (3,2548) = 545.820; p < .001). In the final model five out of eight predictor variables were statistically significant, with Changes in Market Conditions-F1 recording a higher Beta value (β = .369, p < .001) than the Human Resource Capabilities-F2 (β = .282, p < .001), Market Penetration-F3 (β = .070, p < .001) , imports (β = -.067, p < .01) and the total revenue (β = -.053, p < .01). Therefore, perceiving challenges Changes in Market Conditions (β = .369; p < .001), Human Resource Capabilities (β = .282; p < .001) and Market Penetration (β = .070; p < .001) at a higher level has a positive significant effect on recognising Process Execution as a training need, whilst this effect is negative and significant for enterprises with increase in import (β = -.067, p < .01) and total revenue (β = -.053, p < .01). Challenge Changes in Market Condition has the strongest positive effect on recognising the Process Execution as a training need, which is followed by Human Resource Capabilities challenge.
The analysis (Table 17, in Annex) gives regression results for recognising Business Literacy as a training need. In the first step of hierarchical multiple regression for the training dimension Business Literacy five predictors were entered: participation in cluster activities/initiatives, total revenue, number of employees, exports, im-ports. This model was statistically significant F (5, 2551) = 19.317; p < .001 and explained 3 % of variance in the recognition of necessary training in Business Literacy. After the entry of three challenge dimensions at Step 2 the total variance explained by the model as a whole was 37% (F (8,2548) = 189.581; p < .001). The introduc-tion of challenge dimensions explained additional 34 % variance in the recognition of necessary training in Business Literacy, after controlling the participation in cluster activities/initiatives, total revenue, number of employees, exports, imports (R2 Change = .337; F (3, 2548) = 456.123; p < .001). In the final model five out of eight predictor variables were statistically significant, with the Human Resource Capabilities-F2 recording a higher Beta value (β = .372, p < .001) than the Changes in Market Conditions-F1 (β = .162, p < .001), Market Penetration-F3 (β = .159, p < .001), imports (β = -. 094, p < .001) and exports (β = .051, p < .05).
56 training needs analysis
The analysis (Table 18, in Annex) gives regression results for recognising Market Communication as a training need. In the first step of hierarchical multiple regression for the training dimension Market Com-munication, five predictors were entered: participation in cluster activities/initiatives, the total revenue, number of employees, exports, imports. This model was statistically significant F (5,2551) = 9.004; p < .001 and explained 2% of variance in recognition of necessary training in Market Communication. After the entry of the three challenge dimensions at Step 2, the total variance, explained by the model as a whole was 24% (F (8,2548) = 102.995; p < .001). The introduction of challenge dimensions explained additional 22 % variance in the recognition of the necessary training in Market Communication, after controlling for participation in cluster activities/initiatives, total revenue, number of employees, exports, imports (R2 Change = .227; F (3, 2548) = 255.160; p < .001). In the final model four out of eight predictor variables were statistically significant, with the Market Penetration-F3 recording a higher Beta value (β = . 433, p < .001) than the exports (β = . 065, p < .01), the Human Resource Capabilities-F1 (β = .054, p < .05), and number of employees (β = -. 043, p < .05).
lenge, there will be .43 units increase in recognition of need for training in market communication area. Furthermore, training in market communication would also be desired by SMEs with a problem in the area of human resource capabilities (with .05 units increase in recognition of need for training for each unit of recognized challenge increase).
The hierarchical multiple regression analysis (Table 18, in Annex) indicated the effect of micro and small enterprise challenges on the recognition of need for training in market communication. As expected, micro and small enterprises with challenges in the area of market penetration would probably require training in market communication. For each unit of increase of recognized market penetration chal-
57Findings
Different enterprises might face different challenges and consequently different training needs. Enter-prise characteristics, subject of an in-depth analysis in this publication are:
• growing enterprises, • enterprises with export increase, • enterprises with owners aged 30 or younger, and • women owned enterprises.
Growing enterprises, especially the so-called high growth firms (HGFs), have been stressed as the job creation engine (Nightingale and Coad, 2014). As each of the SEECEL Member States gives priority to job crea-tion, the growing enterprises have been thoroughly analysed. Furthermore, export increase is preferable everywhere and most of the countries in the research
stress export importance in their SME strategies, which gives a clear signal to address the potential differences between enterprises that experience ex-port growing trend. Many have stressed the impor-tance of young entrepreneurs and possibilities given to young people to start their businesses. There is a genuine tendency to foster youth entrepreneurship, and assisting the existing young entrepreneurs is a starting point in doing so. The youth unemployment figures in both EU-28 and SEE region are strikingly high, and youth entrepreneurship is emphasised as the best way to lower these figures in the policy doc-uments. Finally, women represent around 50% of the total population in the region, whilst the proportion of women entrepreneurs is lower when compared to the EU average which is the reason why countries in the region see women entrepreneurs as job creators.
3.10.
focus on job creators
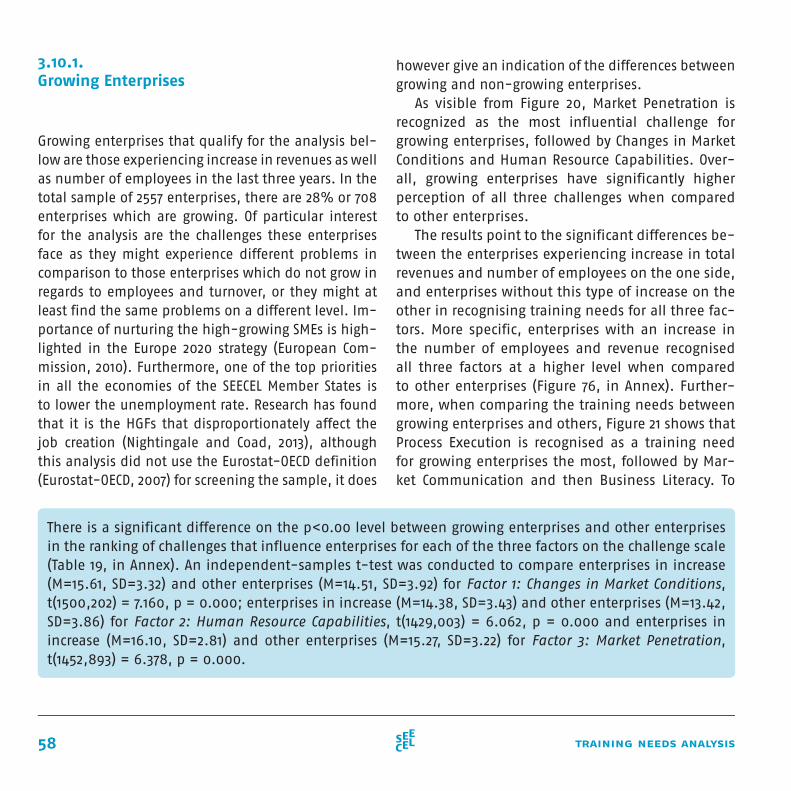
58 training needs analysis
There is a significant difference on the p<0.00 level between growing enterprises and other enterprises in the ranking of challenges that influence enterprises for each of the three factors on the challenge scale (Table 19, in Annex). An independent-samples t-test was conducted to compare enterprises in increase (M=15.61, SD=3.32) and other enterprises (M=14.51, SD=3.92) for Factor 1: Changes in Market Conditions, t(1500,202) = 7.160, p = 0.000; enterprises in increase (M=14.38, SD=3.43) and other enterprises (M=13.42, SD=3.86) for Factor 2: Human Resource Capabilities, t(1429,003) = 6.062, p = 0.000 and enterprises in increase (M=16.10, SD=2.81) and other enterprises (M=15.27, SD=3.22) for Factor 3: Market Penetration, t(1452,893) = 6.378, p = 0.000.
Growing enterprises that qualify for the analysis bel-low are those experiencing increase in revenues as well as number of employees in the last three years. In the total sample of 2557 enterprises, there are 28% or 708 enterprises which are growing. Of particular interest for the analysis are the challenges these enterprises face as they might experience different problems in comparison to those enterprises which do not grow in regards to employees and turnover, or they might at least find the same problems on a different level. Im-portance of nurturing the high-growing SMEs is high-lighted in the Europe 2020 strategy (European Com-mission, 2010). Furthermore, one of the top priorities in all the economies of the SEECEL Member States is to lower the unemployment rate. Research has found that it is the HGFs that disproportionately affect the job creation (Nightingale and Coad, 2013), although this analysis did not use the Eurostat-OECD definition (Eurostat-OECD, 2007) for screening the sample, it does
As visible from Figure 20, Market Penetration is recognized as the most influential challenge for growing enterprises, followed by Changes in Market Conditions and Human Resource Capabilities. Over-all, growing enterprises have significantly higher perception of all three challenges when compared to other enterprises.
3.10.1.Growing Enterprises
The results point to the significant differences be-tween the enterprises experiencing increase in total revenues and number of employees on the one side, and enterprises without this type of increase on the other in recognising training needs for all three fac-tors. More specific, enterprises with an increase in the number of employees and revenue recognised all three factors at a higher level when compared to other enterprises (Figure 76, in Annex). Further-more, when comparing the training needs between growing enterprises and others, Figure 21 shows that Process Execution is recognised as a training need for growing enterprises the most, followed by Mar-ket Communication and then Business Literacy. To
however give an indication of the differences between growing and non-growing enterprises.
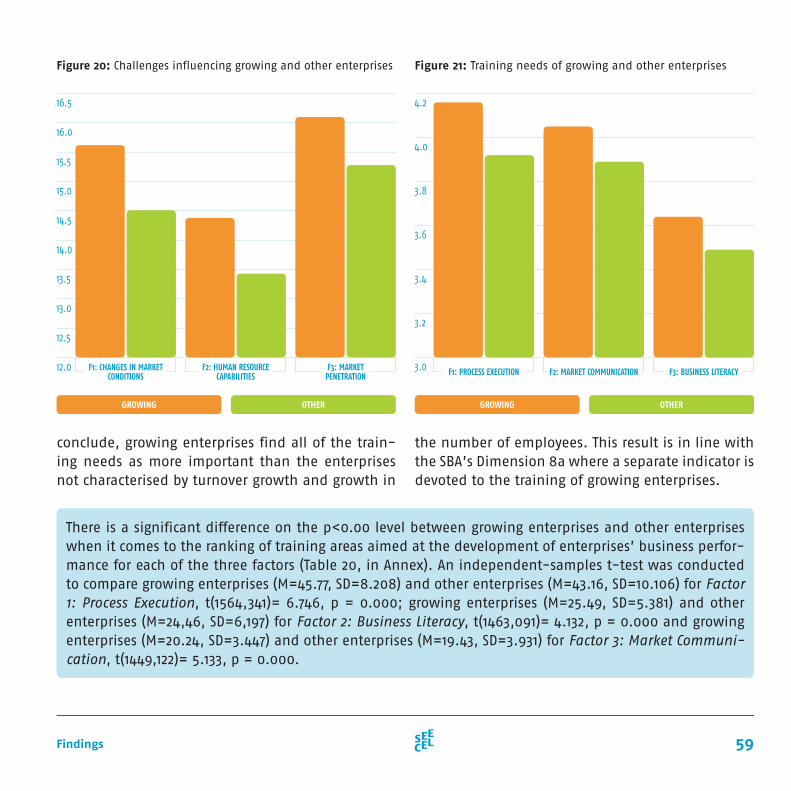
59Findings
Figure 20: Challenges influencing growing and other enterprises Figure 21: Training needs of growing and other enterprises
conclude, growing enterprises find all of the train-ing needs as more important than the enterprises not characterised by turnover growth and growth in
OTHER OTHERGROWING GROWING
16.5
16.0
15.5
15.0
14.5
14.0
13.5
13.0
12.5
12.0 F1: CHANGES IN MARKET CONDITIONS F1: PROCESS EXECUTIONF2: HUMAN RESOURCE
CAPABILITIES F2: MARKET COMMUNICATIONF3: MARKETPENETRATION F3: BUSINESS LITERACY
4.2
4.0
3.8
3.6
3.4
3.2
3.0
There is a significant difference on the p<0.00 level between growing enterprises and other enterprises when it comes to the ranking of training areas aimed at the development of enterprises’ business perfor-mance for each of the three factors (Table 20, in Annex). An independent-samples t-test was conducted to compare growing enterprises (M=45.77, SD=8.208) and other enterprises (M=43.16, SD=10.106) for Factor 1: Process Execution, t(1564,341)= 6.746, p = 0.000; growing enterprises (M=25.49, SD=5.381) and other enterprises (M=24,46, SD=6,197) for Factor 2: Business Literacy, t(1463,091)= 4.132, p = 0.000 and growing enterprises (M=20.24, SD=3.447) and other enterprises (M=19.43, SD=3.931) for Factor 3: Market Communi-cation, t(1449,122)= 5.133, p = 0.000.
the number of employees. This result is in line with the SBA’s Dimension 8a where a separate indicator is devoted to the training of growing enterprises.
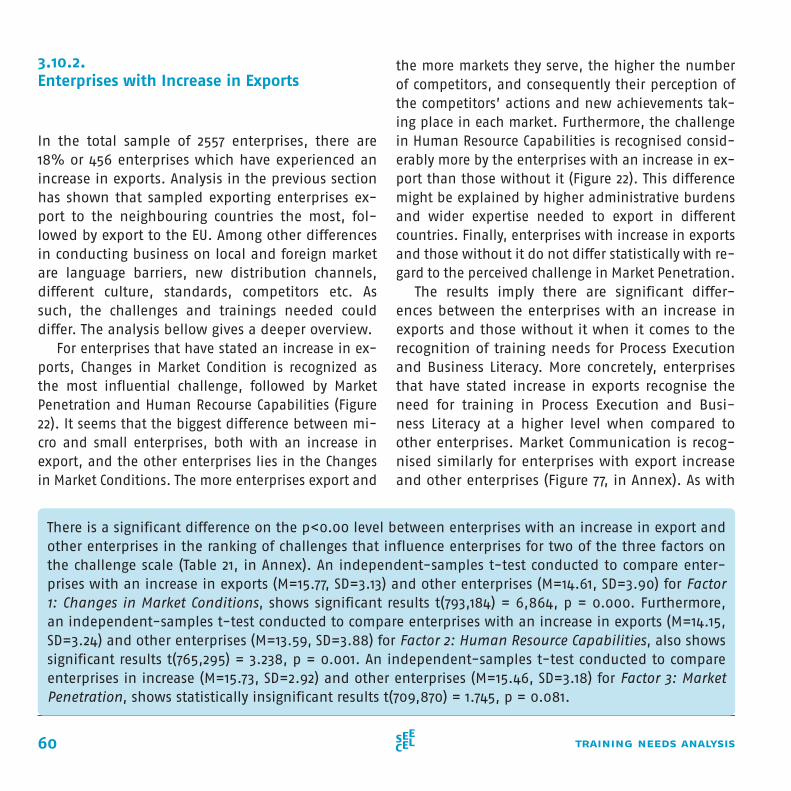
60 training needs analysis
The results imply there are significant differ-ences between the enterprises with an increase in exports and those without it when it comes to the recognition of training needs for Process Execution and Business Literacy. More concretely, enterprises that have stated increase in exports recognise the need for training in Process Execution and Busi-ness Literacy at a higher level when compared to other enterprises. Market Communication is recog-nised similarly for enterprises with export increase and other enterprises (Figure 77, in Annex). As with
3.10.2.Enterprises with Increase in Exports
In the total sample of 2557 enterprises, there are 18% or 456 enterprises which have experienced an increase in exports. Analysis in the previous section has shown that sampled exporting enterprises ex-port to the neighbouring countries the most, fol-lowed by export to the EU. Among other differences in conducting business on local and foreign market are language barriers, new distribution channels, different culture, standards, competitors etc. As such, the challenges and trainings needed could differ. The analysis bellow gives a deeper overview.
the more markets they serve, the higher the number of competitors, and consequently their perception of the competitors’ actions and new achievements tak-ing place in each market. Furthermore, the challenge in Human Resource Capabilities is recognised consid-erably more by the enterprises with an increase in ex-port than those without it (Figure 22). This difference might be explained by higher administrative burdens and wider expertise needed to export in different countries. Finally, enterprises with increase in exports and those without it do not differ statistically with re-gard to the perceived challenge in Market Penetration.
There is a significant difference on the p<0.00 level between enterprises with an increase in export and other enterprises in the ranking of challenges that influence enterprises for two of the three factors on the challenge scale (Table 21, in Annex). An independent-samples t-test conducted to compare enter-prises with an increase in exports (M=15.77, SD=3.13) and other enterprises (M=14.61, SD=3.90) for Factor 1: Changes in Market Conditions, shows significant results t(793,184) = 6,864, p = 0.000. Furthermore, an independent-samples t-test conducted to compare enterprises with an increase in exports (M=14.15, SD=3.24) and other enterprises (M=13.59, SD=3.88) for Factor 2: Human Resource Capabilities, also shows significant results t(765,295) = 3.238, p = 0.001. An independent-samples t-test conducted to compare enterprises in increase (M=15.73, SD=2.92) and other enterprises (M=15.46, SD=3.18) for Factor 3: Market Penetration, shows statistically insignificant results t(709,870) = 1.745, p = 0.081.
For enterprises that have stated an increase in ex-ports, Changes in Market Condition is recognized as the most influential challenge, followed by Market Penetration and Human Recourse Capabilities (Figure 22). It seems that the biggest difference between mi-cro and small enterprises, both with an increase in export, and the other enterprises lies in the Changes in Market Conditions. The more enterprises export and
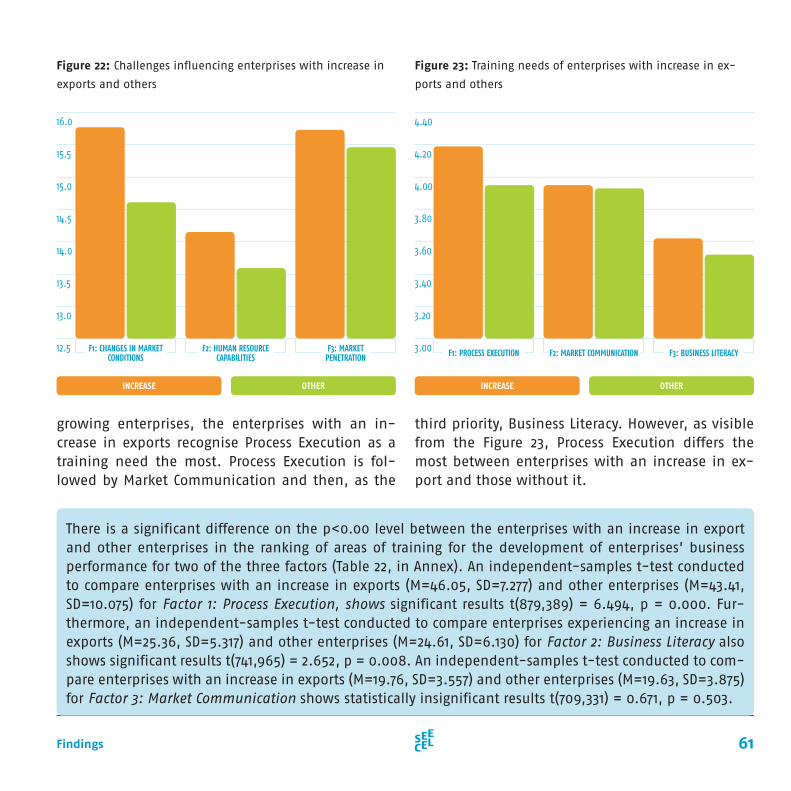
61Findings
Figure 22: Challenges influencing enterprises with increase in
exports and others
There is a significant difference on the p<0.00 level between the enterprises with an increase in export and other enterprises in the ranking of areas of training for the development of enterprises’ business performance for two of the three factors (Table 22, in Annex). An independent-samples t-test conducted to compare enterprises with an increase in exports (M=46.05, SD=7.277) and other enterprises (M=43.41, SD=10.075) for Factor 1: Process Execution, shows significant results t(879,389) = 6.494, p = 0.000. Fur-thermore, an independent-samples t-test conducted to compare enterprises experiencing an increase in exports (M=25.36, SD=5.317) and other enterprises (M=24.61, SD=6.130) for Factor 2: Business Literacy also shows significant results t(741,965) = 2.652, p = 0.008. An independent-samples t-test conducted to com-pare enterprises with an increase in exports (M=19.76, SD=3.557) and other enterprises (M=19.63, SD=3.875) for Factor 3: Market Communication shows statistically insignificant results t(709,331) = 0.671, p = 0.503.
Figure 23: Training needs of enterprises with increase in ex-
ports and others
OTHER OTHERINCREASE INCREASE
16.0
15.5
15.0
14.5
14.0
13.5
13.0
12.5
4.40
4.20
4.00
3.80
3.60
3.40
3.20
3.00F1: CHANGES IN MARKET CONDITIONS
F2: HUMAN RESOURCE CAPABILITIES
F3: MARKETPENETRATION
growing enterprises, the enterprises with an in-crease in exports recognise Process Execution as a training need the most. Process Execution is fol-lowed by Market Communication and then, as the
third priority, Business Literacy. However, as visible from the Figure 23, Process Execution differs the most between enterprises with an increase in ex-port and those without it.
F1: PROCESS EXECUTION F2: MARKET COMMUNICATION F3: BUSINESS LITERACY
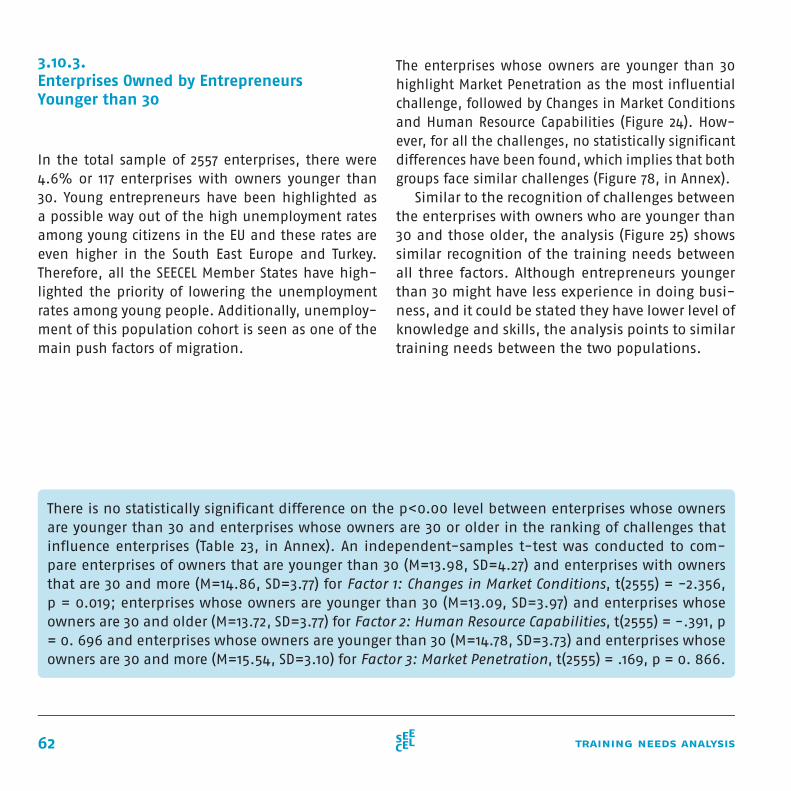
62 training needs analysis
3.10.3.Enterprises Owned by Entrepreneurs Younger than 30
In the total sample of 2557 enterprises, there were 4.6% or 117 enterprises with owners younger than 30. Young entrepreneurs have been highlighted as a possible way out of the high unemployment rates among young citizens in the EU and these rates are even higher in the South East Europe and Turkey. Therefore, all the SEECEL Member States have high-lighted the priority of lowering the unemployment rates among young people. Additionally, unemploy-ment of this population cohort is seen as one of the main push factors of migration.
There is no statistically significant difference on the p<0.00 level between enterprises whose owners are younger than 30 and enterprises whose owners are 30 or older in the ranking of challenges that influence enterprises (Table 23, in Annex). An independent-samples t-test was conducted to com-pare enterprises of owners that are younger than 30 (M=13.98, SD=4.27) and enterprises with owners that are 30 and more (M=14.86, SD=3.77) for Factor 1: Changes in Market Conditions, t(2555) = -2.356, p = 0.019; enterprises whose owners are younger than 30 (M=13.09, SD=3.97) and enterprises whose owners are 30 and older (M=13.72, SD=3.77) for Factor 2: Human Resource Capabilities, t(2555) = -.391, p = 0. 696 and enterprises whose owners are younger than 30 (M=14.78, SD=3.73) and enterprises whose owners are 30 and more (M=15.54, SD=3.10) for Factor 3: Market Penetration, t(2555) = .169, p = 0. 866.
The enterprises whose owners are younger than 30 highlight Market Penetration as the most influential challenge, followed by Changes in Market Conditions and Human Resource Capabilities (Figure 24). How-ever, for all the challenges, no statistically significant differences have been found, which implies that both groups face similar challenges (Figure 78, in Annex).
Similar to the recognition of challenges between the enterprises with owners who are younger than 30 and those older, the analysis (Figure 25) shows similar recognition of the training needs between all three factors. Although entrepreneurs younger than 30 might have less experience in doing busi-ness, and it could be stated they have lower level of knowledge and skills, the analysis points to similar training needs between the two populations.
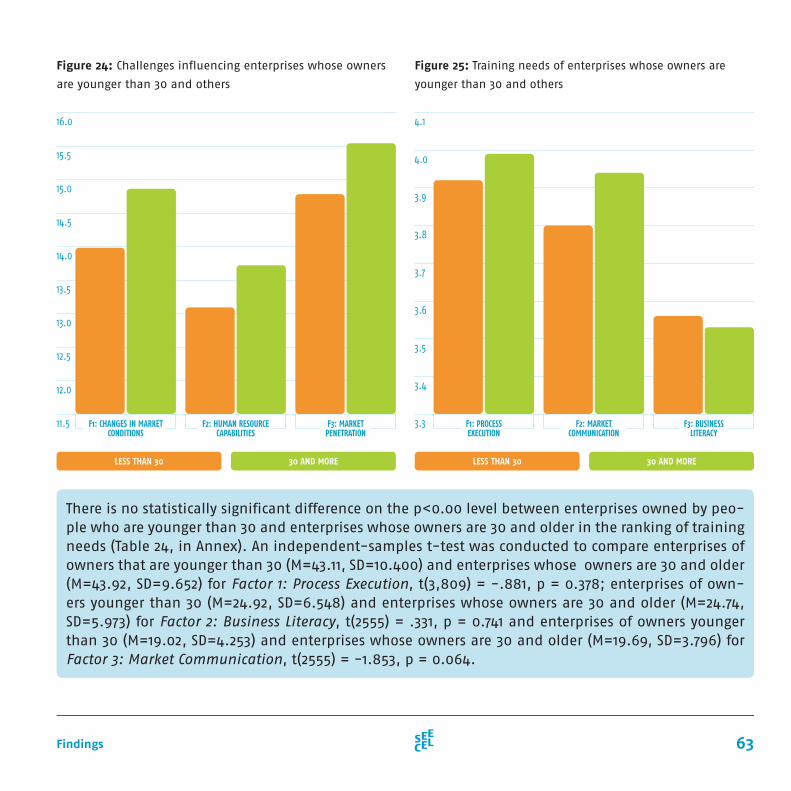
63Findings
There is no statistically significant difference on the p<0.00 level between enterprises owned by peo-ple who are younger than 30 and enterprises whose owners are 30 and older in the ranking of training needs (Table 24, in Annex). An independent-samples t-test was conducted to compare enterprises of owners that are younger than 30 (M=43.11, SD=10.400) and enterprises whose owners are 30 and older (M=43.92, SD=9.652) for Factor 1: Process Execution, t(3,809) = -.881, p = 0.378; enterprises of own-ers younger than 30 (M=24.92, SD=6.548) and enterprises whose owners are 30 and older (M=24.74, SD=5.973) for Factor 2: Business Literacy, t(2555) = .331, p = 0.741 and enterprises of owners younger than 30 (M=19.02, SD=4.253) and enterprises whose owners are 30 and older (M=19.69, SD=3.796) for Factor 3: Market Communication, t(2555) = -1.853, p = 0.064.
Figure 24: Challenges influencing enterprises whose owners
are younger than 30 and others
30 AND MORE 30 AND MORELESS THAN 30 LESS THAN 30
16.0
15.5
15.0
14.5
14.0
13.5
13.0
12.5
12.0
11.5
4.1
4.0
3.9
3.8
3.7
3.6
3.5
3.4
3.3F1: CHANGES IN MARKET CONDITIONS
F1: PROCESSEXECUTION
F2: HUMAN RESOURCE CAPABILITIES
F2: MARKETCOMMUNICATION
F3: MARKETPENETRATION
F3: BUSINESSLITERACY
Figure 25: Training needs of enterprises whose owners are
younger than 30 and others
64 training needs analysis
3.10.4.Female-owned Enterprises
There is a significant difference on the p<0.00 level among enterprises owned by female owners and enterprises owned by male owners in the ranking of challenges that influence enterprises for two of the three factors on the challenge scale (Table 25, in Annex). An independent-samples t-test was conducted to compare enterprises led by female owners (M=14.95, SD=3.72) and enterprises led by male owners (M=14.24, SD=4.09) for Factor 1: Changes in Market Conditions, is showing significant results t(2555) = 3.698, p = 0.000. In addition, an independent-samples t-test comparing enterprises led by female owners (M=13.79, SD=3.76) and enterprises led by male owners (M=13.25, SD=3.83) for Factor 2: Human Resource Capabilities, is showing significant results t(710,188) = 2.843, p = 0.005. An independent-samples t-test conducted to compare enterprises led by female owners (M=15.53, SD=3.12) and enterprises led by male owners (M=15.41, SD=3.20) for Factor 3: Market Penetration, is showing no significant results t(707,605) = .722, p = 0.471.
In enterprises led by female owners, Market Penetra-tion is recognized as the most influential challenge, followed by Changes in Market Conditions and Hu-man Recourse Capabilities (Figure 26). However, chal-lenges where female and male entrepreneurs differ are the Changes in Market Conditions and the Human Resource Capabilities. Namely, enterprises which are run by female owners perceive these two challenges at a lower level when compared to the male entrepre-neurs. Market penetration is recognised at a similar level for both male and female entrepreneurs.
In the total sample of 2557 enterprises, there are 19% or 481 enterprises which are owned by female owners. Women entrepreneurs are stressed as an important untapped potential because they represent around 50% of population in the region, whilst in compari-son to the EU the region has a lower percentage of active women entrepreneurs. The countries of the re-gion have had experience in conducting the women entrepreneurs training needs analysis (SEECEL, 2014). Anyhow, an evidence based policy making approach towards nurturing women entrepreneurs in each of the respective countries stresses the importance of hearing the voice of women entrepreneurs (OECD et al., 2012). A tailor-made approach could therefore be based on finding the differences between male and female owned and led enterprises. These differences might point towards undertaking a bit different ap-proach for women entrepreneurs.
To conclude, there is a difference between male and female entrepreneurs with regard to the train-ing needs in Process Execution and Market Commu-nication. Process Execution is recognised by female owners at a lower level, whilst Market Communica-tion remains a training need that female entrepre-neurs recognised at a statistically higher level (Figure 79, in Annex). Furthermore, as visible from the Fig-ure 27, for the enterprises owned by women, Market Communication seems to be the most recognised training need, followed by Process Execution.
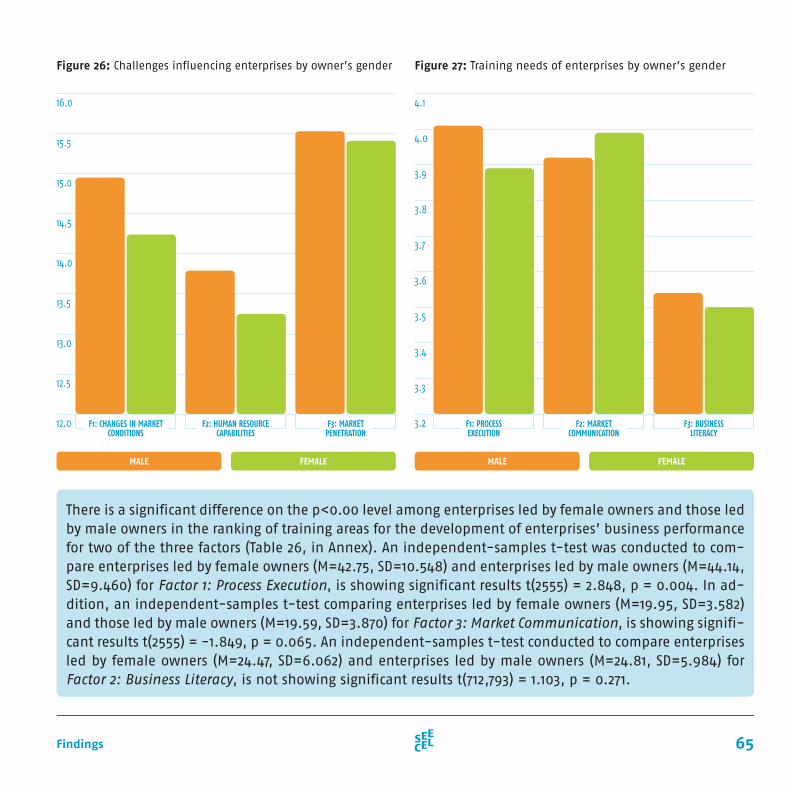
65Findings
Figure 26: Challenges influencing enterprises by owner’s gender
There is a significant difference on the p<0.00 level among enterprises led by female owners and those led by male owners in the ranking of training areas for the development of enterprises’ business performance for two of the three factors (Table 26, in Annex). An independent-samples t-test was conducted to com-pare enterprises led by female owners (M=42.75, SD=10.548) and enterprises led by male owners (M=44.14, SD=9.460) for Factor 1: Process Execution, is showing significant results t(2555) = 2.848, p = 0.004. In ad-dition, an independent-samples t-test comparing enterprises led by female owners (M=19.95, SD=3.582) and those led by male owners (M=19.59, SD=3.870) for Factor 3: Market Communication, is showing signifi-cant results t(2555) = -1.849, p = 0.065. An independent-samples t-test conducted to compare enterprises led by female owners (M=24.47, SD=6.062) and enterprises led by male owners (M=24.81, SD=5.984) for Factor 2: Business Literacy, is not showing significant results t(712,793) = 1.103, p = 0.271.
FEMALE FEMALEMALE MALE
16.0
15.5
15.0
14.5
14.0
13.5
13.0
12.5
12.0
4.1
4.0
3.9
3.8
3.7
3.6
3.5
3.4
3.3
3.2F1: CHANGES IN MARKET CONDITIONS
F1: PROCESSEXECUTION
F2: HUMAN RESOURCE CAPABILITIES
F2: MARKETCOMMUNICATION
F3: MARKETPENETRATION
F3: BUSINESSLITERACY
Figure 27: Training needs of enterprises by owner’s gender
66 training needs analysis
This section gives information on the factors that affect entrepreneurs’ decision making in regards to trainings selection, preferred training time, training methods and other training characteristics necessary for good policy modelling. For the reasons of com-prehensive tailoring, both content and delivery of trainings is equally important, therefore, the analy-sis bellow gives a deeper understanding on how to
offer the trainings. As depicted in Figure 28, the most common factors influencing a decision on the selec-tion of training are expected benefits of the training, trainers’ quality and training price. The least impor-tant factors are proper timing, duration of the pro-gramme and training location. As expected, for micro and small enterprises expected benefits are the most important reasons for engaging in the training.
3.11.
developing the model of human capital intervention
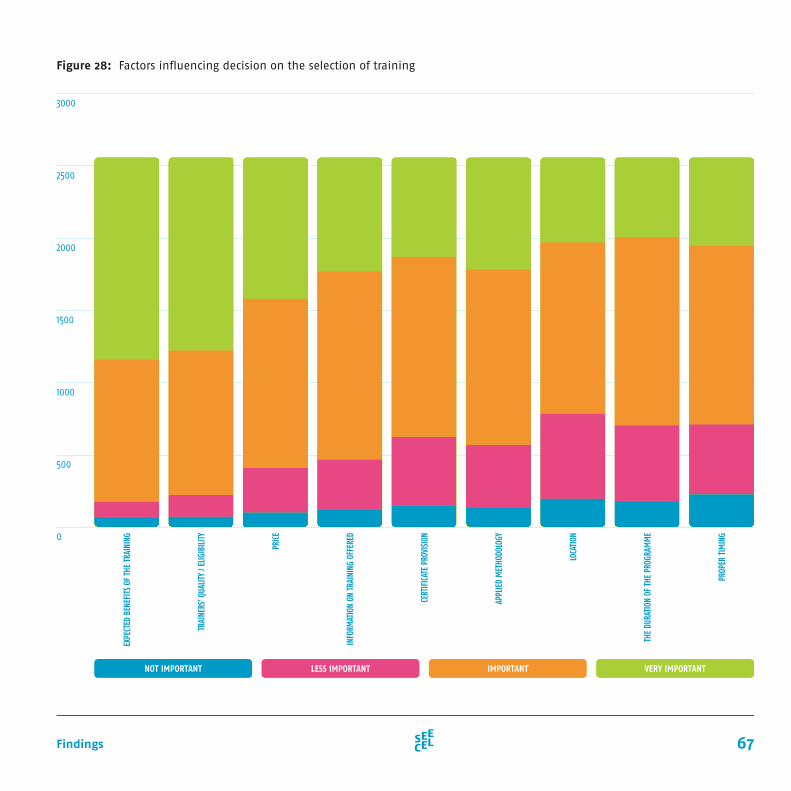
67Findings
Figure 28: Factors influencing decision on the selection of training
NOT IMPORTANT LESS IMPORTANT IMPORTANT VERY IMPORTANT
3000
2500
2000
1500
1000
500
0
EXPE
CTED
BEN
EFIT
S OF
THE
TRA
ININ
G
TRAI
NERS
’ QUA
LITY
/ ELIG
IBILI
TY
PRIC
E
INFO
RMAT
ION
ON T
RAIN
ING
OFFE
RED
CERT
IFIC
ATE
PROV
ISIO
N
APPL
IED
MET
HODO
LOGY
LOCA
TION
THE
DURA
TION
OF
THE
PROG
RAM
ME
PROP
ER T
IMIN
G
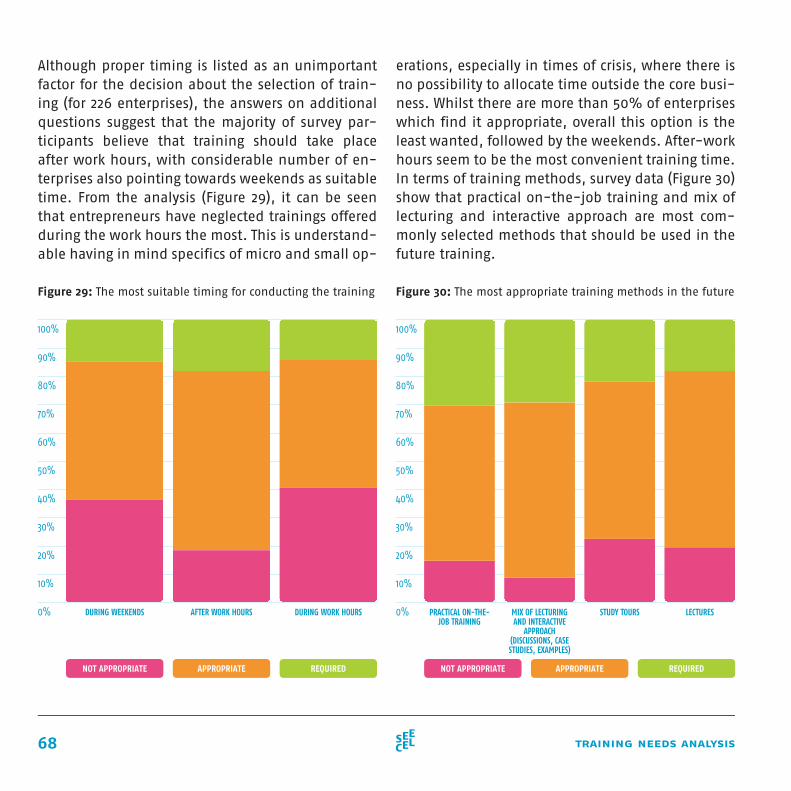
68 training needs analysis
Although proper timing is listed as an unimportant factor for the decision about the selection of train-ing (for 226 enterprises), the answers on additional questions suggest that the majority of survey par-ticipants believe that training should take place after work hours, with considerable number of en-terprises also pointing towards weekends as suitable time. From the analysis (Figure 29), it can be seen that entrepreneurs have neglected trainings offered during the work hours the most. This is understand-able having in mind specifics of micro and small op-
erations, especially in times of crisis, where there is no possibility to allocate time outside the core busi-ness. Whilst there are more than 50% of enterprises which find it appropriate, overall this option is the least wanted, followed by the weekends. After-work hours seem to be the most convenient training time. In terms of training methods, survey data (Figure 30) show that practical on-the-job training and mix of lecturing and interactive approach are most com-monly selected methods that should be used in the future training.
Figure 29: The most suitable timing for conducting the training Figure 30: The most appropriate training methods in the future
NOT APPROPRIATE NOT APPROPRIATEAPPROPRIATE APPROPRIATEREQUIRED REQUIRED
100%
90%
80%
70%
60%
50%
40%
30%
20%
10%
0%
100%
90%
80%
70%
60%
50%
40%
30%
20%
10%
0% PRACTICAL ON-THE-JOB TRAINING
MIX OF LECTURING AND INTERACTIVE
APPROACH (DISCUSSIONS, CASE STUDIES, EXAMPLES)
DURING WORK HOURS STUDY TOURSAFTER WORK HOURS LECTURESDURING WEEKENDS
69Findings
Figure 31 provides an overview of the most and the least important statements for the business de-velopment of the sampled enterprises. The entre-preneurs had the task to tick five most important and five least important statements from the list of statements for their business development. Accord-ing to the results, participants have highlighted the following most important statements:
• generating alternative solutions to problems and challenges,
• understanding and responding to customer needs, and
• becoming more effective in satisfying customer needs.
The least important statements are:
• seeking and utilizing opportunities for lifelong learning,
• employees always respond positive to changes, and
• selection of the appropriate techniques for analysis.
The most important statements identified by the small business community are connected to the training need factor - Process Execution which refers to the trainings that include adoption of practical skills and techniques in the use of technology and equipment for raising productivity levels, the design thinking and customer development, management of the supply chain and step by step implementa-
tion of standards as well as health and safety re-quirements. As visible from the explanation of the factor Process Execution, among other, it also re-fers to the implementation of the design thinking and customer development techniques, business techniques developed and most commonly used in United States of America (Brown, 2008; Blank, 2013). It can be noted that small business community highlighted the use of design thinking and customer development for the understanding of the problems and needs of customers, and consequently provid-ing solutions to these problems and needs, when asked to rank the most important statements for their business development. This is a signal that a training package – Process Execution is probably the most important training package recognised by the small business community.
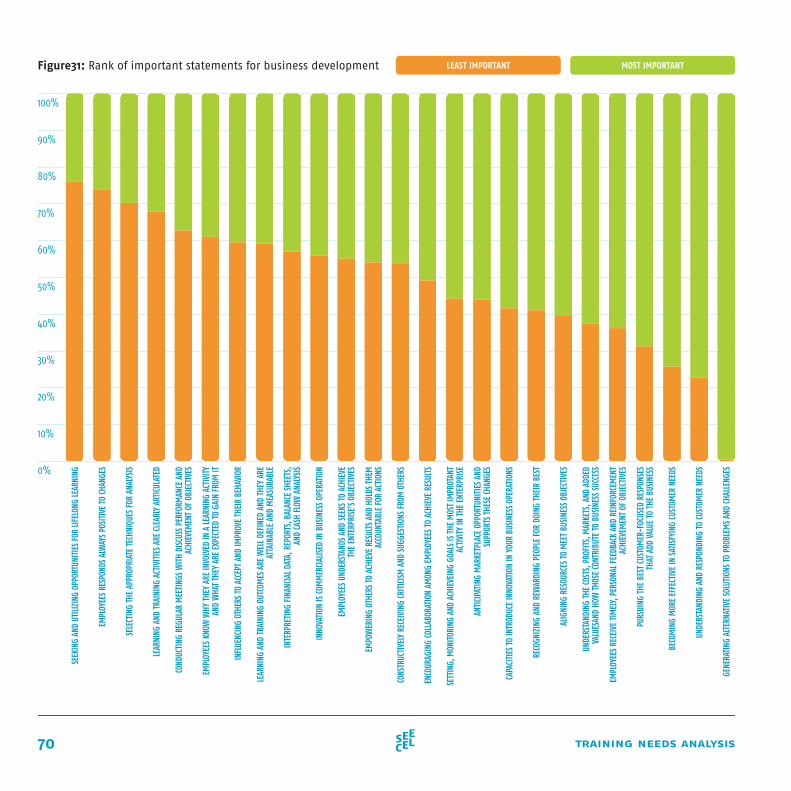
70 training needs analysis
Figure31: Rank of important statements for business developmentSE
EKIN
G AN
D UT
ILIZI
NG O
PPOR
TUNI
TIES
FOR
LIFE
LONG
LEAR
NING
EMPL
OYEE
S RE
SPON
DS A
LWAY
S PO
SITI
VE TO
CHA
NGES
SELE
CTIN
G TH
E AP
PROP
RIAT
E TE
CHNI
QUES
FOR
ANA
LYSI
S
LEAR
NING
AND
TRA
ININ
G AC
TIVI
TIES
ARE
CLE
ARLY
ART
ICUL
ATED
COND
UCTI
NG R
EGUL
AR M
EETI
NGS
WIT
H DI
SCUS
S PE
RFOR
MAN
CE A
ND
ACHI
EVEM
ENT
OF O
BJEC
TIVE
S
EMPL
OYEE
S KN
OW W
HY T
HEY
ARE
INVO
LVED
IN A
LEAR
NING
ACT
IVITY
AN
D W
HAT
THEY
ARE
EXP
ECTE
D TO
GAI
N FR
OM IT
INFL
UENC
ING
OTHE
RS TO
ACC
EPT
AND
IMPR
OVE
THEI
R BE
HAVI
OR
LEAR
NING
AND
TRA
ININ
G OU
TCOM
ES A
RE W
ELL D
EFIN
ED A
ND T
HEY
ARE
ATTA
INAB
LE A
ND M
EASU
RABL
E
INTE
RPRE
TING
FIN
ANCI
AL D
ATA,
REP
ORTS
, BAL
ANCE
SHE
ETS,
AN
D CA
SH F
LOW
ANA
LYSI
S
INNO
VATI
ON IS
COM
MER
CIAL
ISED
IN B
USIN
ESS
OPER
ATIO
N
EM
PLOY
EES
UNDE
RSTA
NDS A
ND S
EEKS
TO A
CHIE
VE
THE
ENTE
RPRI
SE’S
OBJ
ECTI
VES
EMPO
WER
ING
OTHE
RS TO
ACH
IEVE
RES
ULTS
AND
HOL
DS T
HEM
AC
COUN
TABL
E FO
R AC
TION
S
CONS
TRUC
TIVE
LY R
ECEI
VING
CRI
TICI
SM A
ND S
UGGE
STIO
NS F
ROM
OTH
ERS
ENCO
URAG
ING
COLL
ABOR
ATIO
N AM
ONG
EMPL
OYEE
S TO
ACHI
EVE
RESU
LTS
SETT
ING,
MON
ITOR
ING
AND
ACHI
EVEI
NG G
OALS
IS T
HE M
OST
IMPR
OTAN
T AC
TIVI
TY IN
THE
ENT
ERPR
ISE
ANTI
CIPA
TING
MAR
KETP
LACE
OPP
ORTU
NITI
ES A
ND
SUPP
ORTS
THE
SE C
HANG
ES
CAPA
CITI
ES TO
INTR
ODUC
E IN
NOVA
TION
IN Y
OUR
BUSI
NESS
OPE
RATI
ONS
RECO
GNIZ
ING
AND
REW
ARDI
NG P
EOPL
E FO
R DO
ING
THEI
R BE
ST
ALIG
NING
RES
OURC
ES TO
MEE
T BU
SINE
SS O
BJEC
TIVE
S
UNDE
RSTA
NDIN
G TH
E CO
STS,
PRO
FITS
, MAR
KETS
, AND
ADD
ED
VALU
ESAN
D HO
W T
HOSE
CONT
RIBU
TE TO
BUS
INES
S SU
CCES
S
EMPL
OYEE
S RE
CEIV
E TI
MEL
Y, PE
RSON
AL F
EEDB
ACK
AND
REIN
FORC
EMEN
TAC
HIEV
EMEN
T OF
OBJ
ECTI
VES
PURS
UING
THE
BES
T CU
STOM
ER-F
OCUS
ED R
ESPO
NSES
TH
AT A
DD V
ALUE
TO T
HE B
USIN
ESS
BECO
MIN
G M
ORE
EFFE
CTIV
E IN
SAT
ISFY
ING
CUST
OMER
NEE
DS
UNDE
RSTA
NDIN
G AN
D RE
SPON
DING
TO C
USTO
MER
NEE
DS
GENE
RATI
NG A
LTER
NATI
VE S
OLUT
IONS
TO P
ROBL
EMS A
ND C
HALL
ENGE
S
100%
90%
80%
70%
60%
50%
40%
30%
20%
10%
0%
LEAST IMPORTANT MOST IMPORTANT
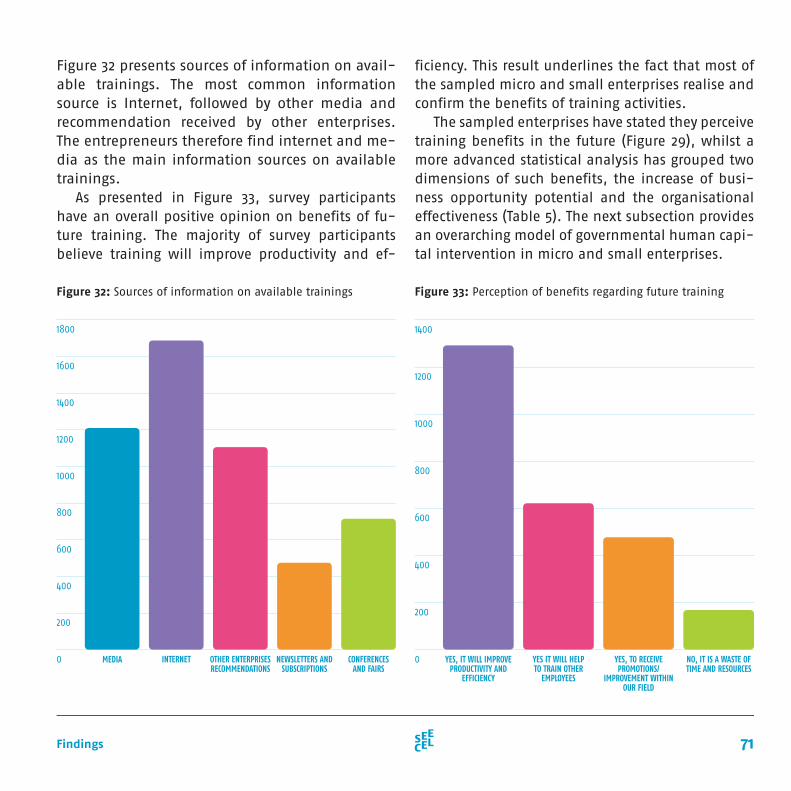
71Findings
Figure 32 presents sources of information on avail-able trainings. The most common information source is Internet, followed by other media and recommendation received by other enterprises. The entrepreneurs therefore find internet and me-dia as the main information sources on available trainings.
ficiency. This result underlines the fact that most of the sampled micro and small enterprises realise and confirm the benefits of training activities.
Figure 32: Sources of information on available trainings Figure 33: Perception of benefits regarding future training
As presented in Figure 33, survey participants have an overall positive opinion on benefits of fu-ture training. The majority of survey participants believe training will improve productivity and ef-
The sampled enterprises have stated they perceive training benefits in the future (Figure 29), whilst a more advanced statistical analysis has grouped two dimensions of such benefits, the increase of busi-ness opportunity potential and the organisational effectiveness (Table 5). The next subsection provides an overarching model of governmental human capi-tal intervention in micro and small enterprises.
1800
1600
1400
1200
1000
800
600
400
200
0
1400
1200
1000
800
600
400
200
0MEDIA YES, IT WILL IMPROVE PRODUCTIVITY AND
EFFICIENCY
YES IT WILL HELP TO TRAIN OTHER
EMPLOYEES
YES, TO RECEIVE PROMOTIONS/
IMPROVEMENT WITHIN OUR FIELD
NO, IT IS A WASTE OF TIME AND RESOURCES
INTERNET OTHER ENTERPRISES RECOMMENDATIONS
NEWSLETTERS AND SUBSCRIPTIONS
CONFERENCES AND FAIRS
72 training needs analysis
3.11.1.Training Navigation System
development plan). This national, sector or enter-prise characteristic focused analyses will lead to the baseline data on their expressed training needs and challenges faced, but also for forecasting the chal-lenges and training needs. It is critical to understand that these analyses conducted via the Training Needs Analysis System are the voice of entrepreneurs, and as such they give baseline information for the sec-ond component of the SEECEL Training Navigation System, the Co-creation.
The second component, the Co-creation really looks to raise awareness and understanding of dif-ferent challenges faced by different groups of enter-prises. Challenges will probably have many features in common within a specific sector and depending on different group characteristics of the enterprises. For example, this TNA has identified challenges that small business community faces in SEECEL Member States as Challenges in Market Conditions, Market Penetration and Human Resource Capabilities (Ta-ble 3). More concretely, growing enterprises have shown to perceive all three challenges at a higher level, whilst the challenge Changes in Market Con-dition is highlighted to a greater extent within the enterprises with an increase in exporting. However, in line with the TNA Baseline, these challenges should be further explored at the national level with qualitative research methods like focus groups or in-depth interviews, but also round tables and conferences. Doing so, quality of input will increase, but also the sense of ownership due to the active partnership between small business community and governmental institutions. The critical point is that
Based on the whole TNA process and results present-ed in the previous sections, SEECEL has developed the SEECEL Training Navigation System for increas-ing the efficiency level of governmental human cap-ital interventions in the micro and small enterprises which consequently affects the efficiency of public money spent, whilst respecting the Open Method of Coordination. The SEECEL Training Navigation Sys-tem consists of five core components:
• TNA Baseline, • Co-creation, • Training Envelope, • Training Scoreboard, and a crosscutting compo-
nent, • Quality Assurance (Figure 30).
The TNA Baseline depicts the critical issue underly-ing the effective public policy, which is the Evidence Based Policy Making. In particular, the TNA Baseline consists of the Training Needs Analysis System and subsequent deeper national analysis of the gath-ered sample. However, when defining the sample, and further on when analysing the results, it is criti-cal to take into consideration the strategic indus-try sectors and specific enterprise characteristics as defined by the wider national SME strategy and/or equivalent national policy document (e.g. national
73Findings
these national qualitative researches enable further understanding of the challenges and training needs and provide information to model the third compo-nent of the SEECEL Training Navigation System, the Training Envelope.
The third component of the SEECEL Training Navi-gation System, builds on the TNA Baseline evidence and the national specifics gathered through Training Needs Analysis System. For example, this TNA analy-sis has yielded three different training priorities, the Process Execution, the Market Communication and the Business Literacy (Table 4). Building on this, Co-creation adds to the evidence-backed informa-tion on the training needs to polish the offer of the training content that will be delivered. Furthermore, another critical point besides the content should not be ignored, and that is the delivery of trainings. The timing of training offer in regards to the period of the year, but also in regards to the time during the day is critical as core operations of small business com-munity might not allow the entrepreneurs and their employees to participate on the trainings during their work hours. Additionally, entrepreneurs have expressed training offer should be more practical, enriched with case studies and on-the-job training, which are characteristics that should be taken into account (see Section 3.10). Finally, how to approach entrepreneurs with information on the availability of such trainings is important, this TNA has unveiled media and internet as key sources, but this might differ country to country. All the before mentioned subcomponent make a good Training Envelope, the final product that is given to the end users – enter-
prises, with aim to increase their competitiveness.The fourth component has shown to be the least developed area within the human capital interven-tions in enterprise skills in SEECEL Member States. This fourth component – Training Scoreboard refers to the monitoring and evaluation of the training de-livery. The premise behind the Training Scoreboard is that governmental human capital interventions towards micro and small enterprises should be treated like an investment and as any investment they should be evaluated. This TNA has yielded two related but again different dimensions that repre-sent benefits from the previous trainings in which the micro and small enterprises have engaged these two dimensions are Organisational Effectiveness and Business Opportunity Potential (Table 5). Ac-knowledging the difficulties behind measurement of training efficiency, we firmly believe these two dimensions can represent basis upon which evalua-tions and monitoring systems should be built.
A crosscutting component, the Quality Assurance aims to ensure the independent assessment look-ing at quality of the process, research instruments and robustness of the analysis. Quality Assurance represents an overarching mechanism across all of the SEECEL Training Navigation System, but the key point is to make sure the SEECEL Training Navigation System maintains the level of quality with constant, incremental improvements, as depicted in the Figure 30. We strongly believe that ensuring quality of the process along all the elements impacts the efficiency and effectiveness of the governmental human capi-tal interventions towards small business community.
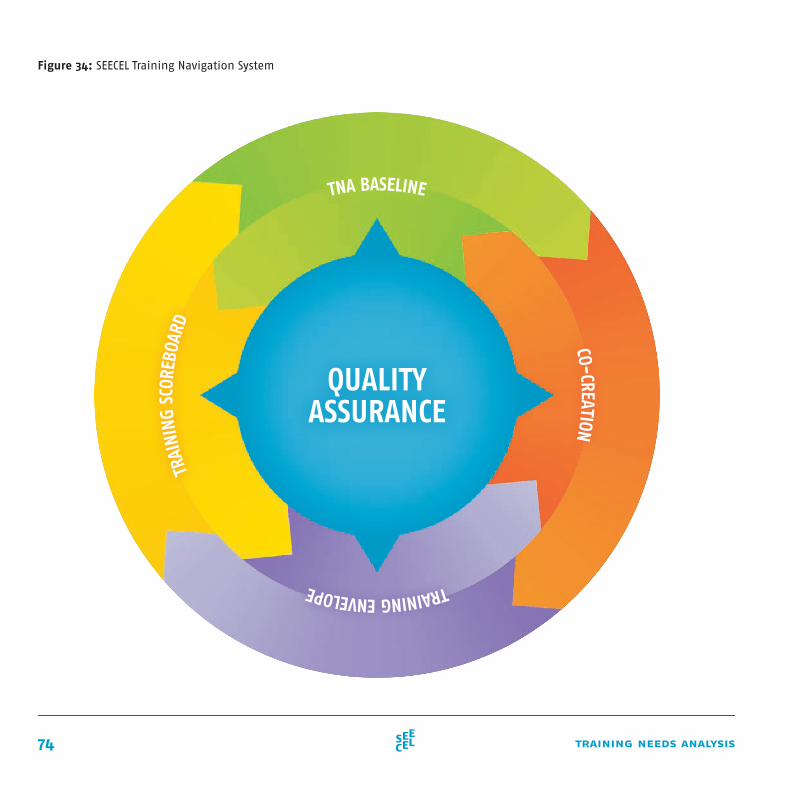
74 training needs analysis
Figure 34: SEECEL Training Navigation System
QUALITYASSURANCE
TNA BASELINETR
AINI
NG S
CORE
BOAR
DTRAINING ENVELOPECO-CREATION

75Quality Assurance Criteria Framework
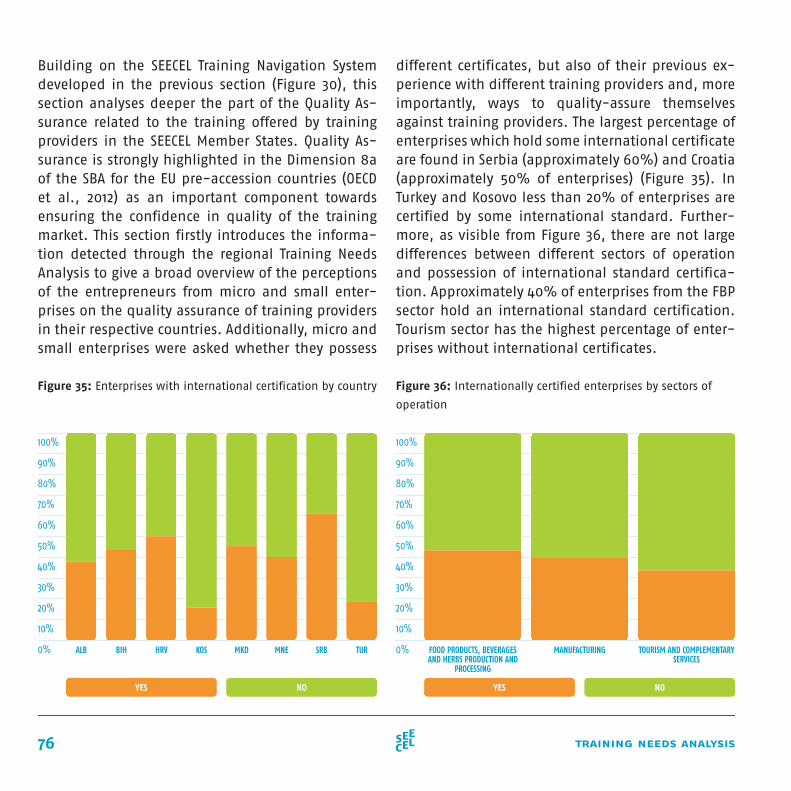
76 training needs analysis
Building on the SEECEL Training Navigation System developed in the previous section (Figure 30), this section analyses deeper the part of the Quality As-surance related to the training offered by training providers in the SEECEL Member States. Quality As-surance is strongly highlighted in the Dimension 8a of the SBA for the EU pre-accession countries (OECD et al., 2012) as an important component towards ensuring the confidence in quality of the training market. This section firstly introduces the informa-tion detected through the regional Training Needs Analysis to give a broad overview of the perceptions of the entrepreneurs from micro and small enter-prises on the quality assurance of training providers in their respective countries. Additionally, micro and small enterprises were asked whether they possess
different certificates, but also of their previous ex-perience with different training providers and, more importantly, ways to quality-assure themselves against training providers. The largest percentage of enterprises which hold some international certificate are found in Serbia (approximately 60%) and Croatia (approximately 50% of enterprises) (Figure 35). In Turkey and Kosovo less than 20% of enterprises are certified by some international standard. Further-more, as visible from Figure 36, there are not large differences between different sectors of operation and possession of international standard certifica-tion. Approximately 40% of enterprises from the FBP sector hold an international standard certification. Tourism sector has the highest percentage of enter-prises without international certificates.
Figure 36: Internationally certified enterprises by sectors of
operation
Figure 35: Enterprises with international certification by country
100%
90%
80%
70%
60%
50%
40%
30%
20%
10%
0%
100%
90%
80%
70%
60%
50%
40%
30%
20%
10%
0%
YES YESNO NO
TURSRBMNEMKDKOSBIH HRVALB FOOD PRODUCTS, BEVERAGES AND HERBS PRODUCTION AND
PROCESSING
MANUFACTURING TOURISM AND COMPLEMENTARY SERVICES
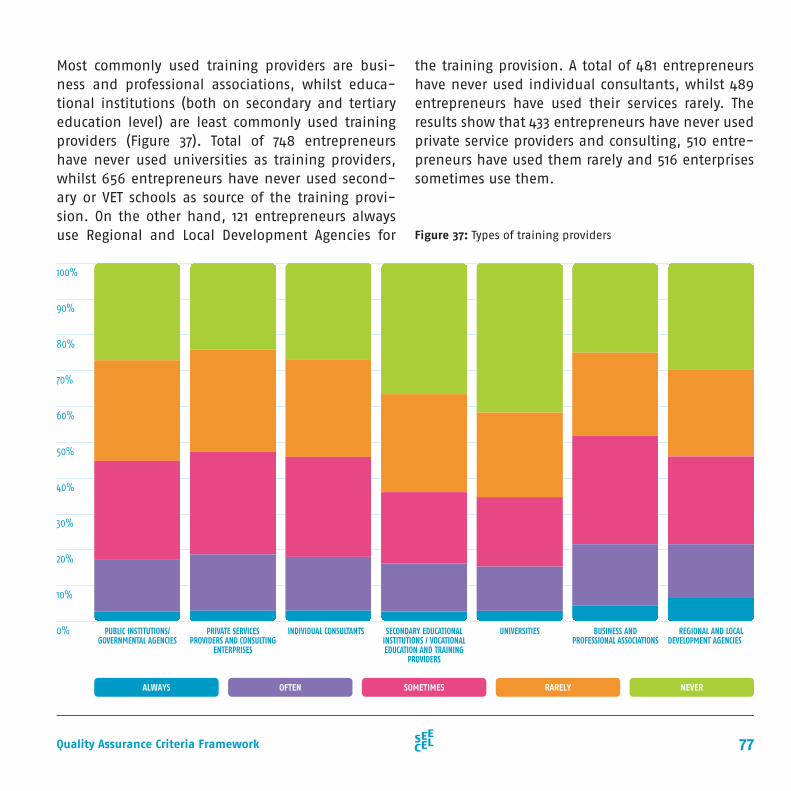
77Quality Assurance Criteria Framework
the training provision. A total of 481 entrepreneurs have never used individual consultants, whilst 489 entrepreneurs have used their services rarely. The results show that 433 entrepreneurs have never used private service providers and consulting, 510 entre-preneurs have used them rarely and 516 enterprises sometimes use them.
100%
90%
80%
70%
60%
50%
40%
30%
20%
10%
0%
Most commonly used training providers are busi-ness and professional associations, whilst educa-tional institutions (both on secondary and tertiary education level) are least commonly used training providers (Figure 37). Total of 748 entrepreneurs have never used universities as training providers, whilst 656 entrepreneurs have never used second-ary or VET schools as source of the training provi-sion. On the other hand, 121 entrepreneurs always use Regional and Local Development Agencies for Figure 37: Types of training providers
PUBLIC INSTITUTIONS/GOVERNMENTAL AGENCIES
PRIVATE SERVICES PROVIDERS AND CONSULTING
ENTERPRISES
INDIVIDUAL CONSULTANTS SECONDARY EDUCATIONAL INSTITUTIONS / VOCATIONAL EDUCATION AND TRAINING
PROVIDERS
UNIVERSITIES BUSINESS AND PROFESSIONAL ASSOCIATIONS
REGIONAL AND LOCAL DEVELOPMENT AGENCIES
ALWAYS OFTEN SOMETIMES RARELY NEVER
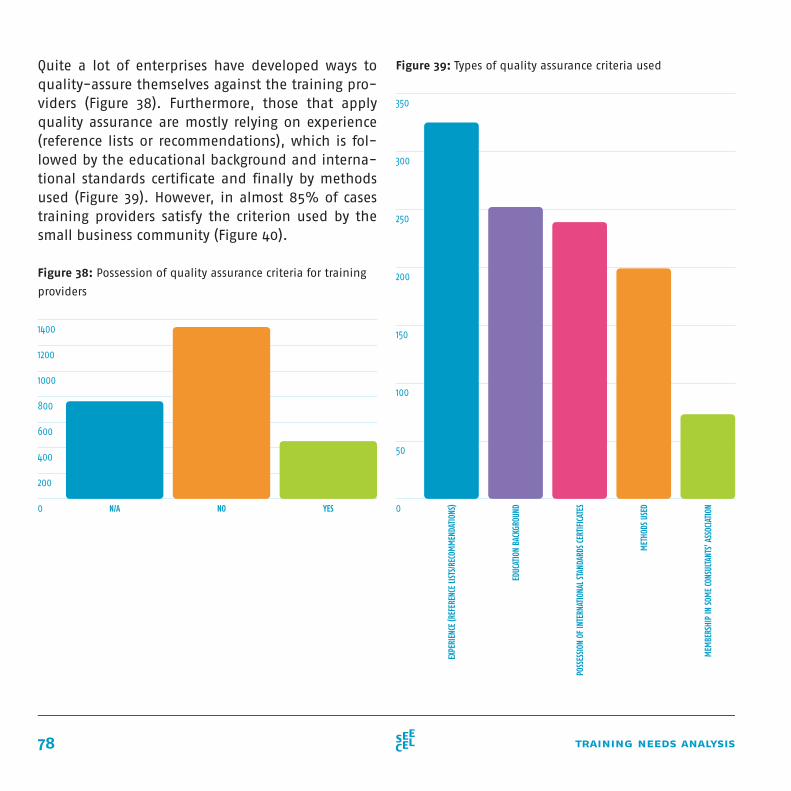
78 training needs analysis
Quite a lot of enterprises have developed ways to quality-assure themselves against the training pro-viders (Figure 38). Furthermore, those that apply quality assurance are mostly relying on experience (reference lists or recommendations), which is fol-lowed by the educational background and interna-tional standards certificate and finally by methods used (Figure 39). However, in almost 85% of cases training providers satisfy the criterion used by the small business community (Figure 40).
Figure 39: Types of quality assurance criteria used
Figure 38: Possession of quality assurance criteria for training
providers
EXPE
RIEN
CE (R
EFER
ENCE
LIST
S/RE
COM
MEN
DATI
ONS)
EDUC
ATIO
N BA
CKGR
OUND
POSS
ESSI
ON O
F IN
TERN
ATIO
NAL S
TAND
ARDS
CER
TIFI
CATE
S
MET
HODS
USE
D
MEM
BERS
HIP
IN S
OME
CONS
ULTA
NTS’
ASS
OCIA
TION
350
300
250
200
150
100
50
0
1400
1200
1000
800
600
400
200
0 N/A NO YES
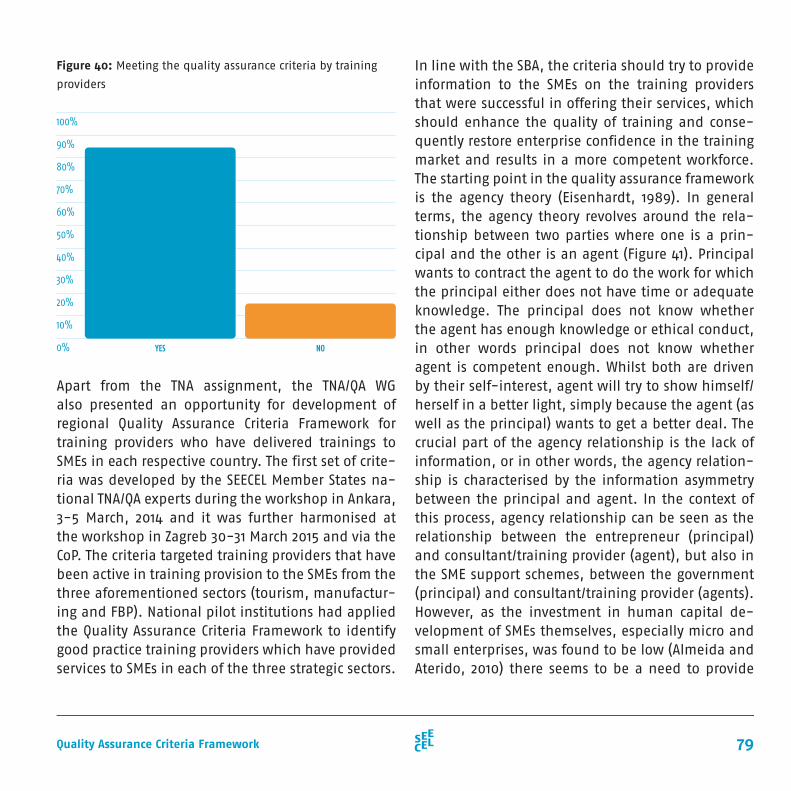
79Quality Assurance Criteria Framework
Figure 40: Meeting the quality assurance criteria by training
providers
In line with the SBA, the criteria should try to provide information to the SMEs on the training providers that were successful in offering their services, which should enhance the quality of training and conse-quently restore enterprise confidence in the training market and results in a more competent workforce. The starting point in the quality assurance framework is the agency theory (Eisenhardt, 1989). In general terms, the agency theory revolves around the rela-tionship between two parties where one is a prin-cipal and the other is an agent (Figure 41). Principal wants to contract the agent to do the work for which the principal either does not have time or adequate knowledge. The principal does not know whether the agent has enough knowledge or ethical conduct, in other words principal does not know whether agent is competent enough. Whilst both are driven by their self-interest, agent will try to show himself/herself in a better light, simply because the agent (as well as the principal) wants to get a better deal. The crucial part of the agency relationship is the lack of information, or in other words, the agency relation-ship is characterised by the information asymmetry between the principal and agent. In the context of this process, agency relationship can be seen as the relationship between the entrepreneur (principal) and consultant/training provider (agent), but also in the SME support schemes, between the government (principal) and consultant/training provider (agents). However, as the investment in human capital de-velopment of SMEs themselves, especially micro and small enterprises, was found to be low (Almeida and Aterido, 2010) there seems to be a need to provide
Apart from the TNA assignment, the TNA/QA WG also presented an opportunity for development of regional Quality Assurance Criteria Framework for training providers who have delivered trainings to SMEs in each respective country. The first set of crite-ria was developed by the SEECEL Member States na-tional TNA/QA experts during the workshop in Ankara, 3-5 March, 2014 and it was further harmonised at the workshop in Zagreb 30-31 March 2015 and via the CoP. The criteria targeted training providers that have been active in training provision to the SMEs from the three aforementioned sectors (tourism, manufactur-ing and FBP). National pilot institutions had applied the Quality Assurance Criteria Framework to identify good practice training providers which have provided services to SMEs in each of the three strategic sectors.
100%
90%
80%
70%
60%
50%
40%
30%
20%
10%
0% YES NO
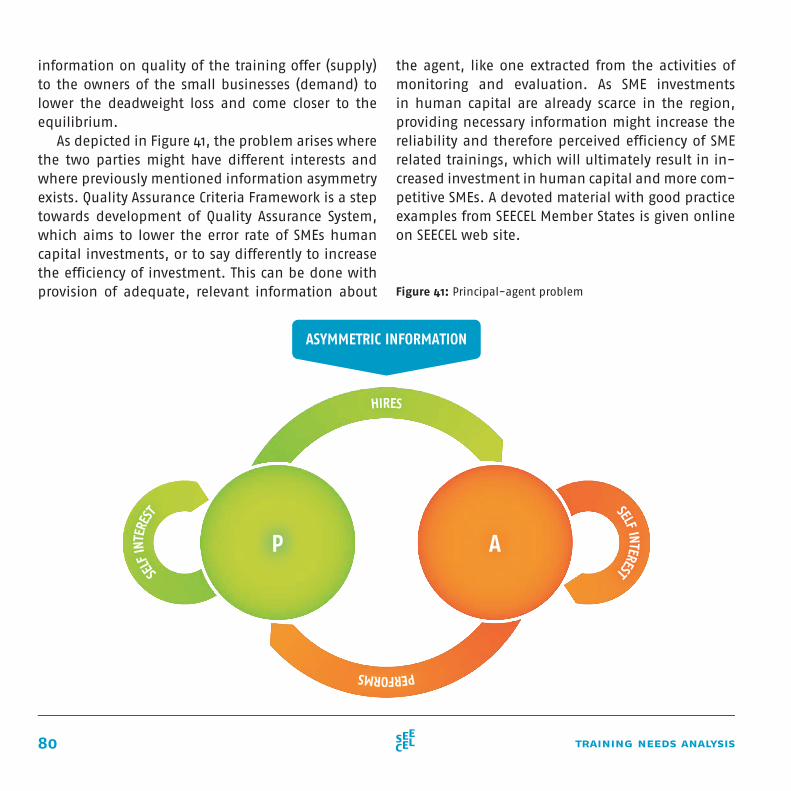
80 training needs analysis
information on quality of the training offer (supply) to the owners of the small businesses (demand) to lower the deadweight loss and come closer to the equilibrium.
Figure 41: Principal-agent problem
SELF INTERESTSELF
INTE
REST
HIRES
PERFORMS
P A
ASYMMETRIC INFORMATION
As depicted in Figure 41, the problem arises where the two parties might have different interests and where previously mentioned information asymmetry exists. Quality Assurance Criteria Framework is a step towards development of Quality Assurance System, which aims to lower the error rate of SMEs human capital investments, or to say differently to increase the efficiency of investment. This can be done with provision of adequate, relevant information about
the agent, like one extracted from the activities of monitoring and evaluation. As SME investments in human capital are already scarce in the region, providing necessary information might increase the reliability and therefore perceived efficiency of SME related trainings, which will ultimately result in in-creased investment in human capital and more com-petitive SMEs. A devoted material with good practice examples from SEECEL Member States is given online on SEECEL web site.

81Way Forward
82 training needs analysis
lowering the entrepreneurs’ time requirement to fulfil the TNA questionnaire. Furthermore, the future efforts should be focused on the ways to tackle the training needs recognised by the sampled entrepre-neurs in the regional TNA. A share of the findings from the TNA could be translated to further improve learning outcomes of the entrepreneurship as a key competence. Looking at the business demographics and employment trends in public service sector we can assume that a substantial part of children will either work for an SME and some will start their own in the future, which means that the training needs of today’s entrepreneurs and their employees repre-sent the basis for smart review of entrepreneurship learning outcomes.
Based on the elements presented in the SEECEL Training Navigation System, efforts should be put into conducting an even deeper analysis of the challenges and training needs of micro and small enterprises. This analysis could be conducted by in-depth interviews, expert groups discussions (experts includes SME ‘winners’), focus groups and then,
The knowledge, skills and attitudes of the entrepre-neurs in SEECEL Member States will continue to have a large effect on the success of the region’s economy through competitiveness of their enterprises. Human capital within their enterprises has the utmost effect on achieving each countries priority goals, competi-tiveness, job creation and raising living standards. The regional training needs analysis of the micro and small enterprises from tourism, manufacturing and FBP sectors encompassed 2557 enterprises from eight countries to provide more detailed information on the status of these enterprises and their needs. The en-terprises are faced with challenges in coping with the changes in the market, raising the capabilities of their employees and accessing market penetration exper-tise. In order to address these challenges, a timely offer of training packages addressing their needs in a logistically sound manner enhanced with evaluation and monitoring might be important for each country, as presented in SEECEL Training Navigation System.
Following the knowledge gained from the pro-cess, the future efforts should be directed towards
83Way Forward
development of tailor-made training modules for micro and small enterprises in the tourism, manu-facturing and FBP sectors. Lessons learned show that quality assurance mechanisms play a crucial role in better targeting and increase of impact of train-ings in different sectors and groups of enterprises. Training provision enhanced with monitoring and evaluation systems provides decision makers with relevant information on the quality and effective-ness of the services.
Quality assurance criteria framework contain-ing best practice examples of training provision in small business community has been successfully de-veloped and piloted, however, a set of criteria in a vacuum cannot be enough to fully assess the quality of training providers. Even so, pilot institutions and experts from the region have recognised the need to provide entrepreneurs with more concrete infor-mation. The training provision in the SEECEL Member States lacks a serious evaluation of publicly funded trainings, whilst private training providers have usu-ally been assessed based on the recommendations
and reference lists. This is a cherry picked evaluation of the training providers’ best moments, lacking a clearer picture of both good and bad training ex-periences. However, in addressing this issue work-ing group experts have called for a solution that is market oriented and less administrative. Future ef-forts should be focused on tackling this issue in line with the recommendations from the SEECEL Member States experts.

84 training needs analysis

85Annexes
Figure 42: Time when the business was established
Figure 43: Number of employees from manufacturing sector by
country
2500
2000
1500
1000
500
0 3 YEARS AGO 4-6 YEARS AGO
100%
90%
80%
70%
60%
50%
40%
30%
20%
10%
0% TURSRBMNEMKDKOSBIH HRVALB
METAL PROCESSING
MANUFACTURE OF RUBBER AND PLASTICS PRODUCTS, AND OTHER NON-METALLIC MINERAL PRODUCTS
MANUFACTURE OF COMPUTER, ELECTRONIC AND OPTICAL PRODUCTS, ELECTRICAL AND TRANSPORT EQUIPMENT AND MACHINERY
MANUFACTURE OF CHEMICALS AND CHEMICAL PRODUCTS
MANUFACTURE OF WOOD AND PAPER PRODUCTS, AND PRINTING
MANUFACTURE OF TEXTILES, APPAREL, LEATHER, FOOTWEAR AND RELATED PRODUCTS
6.1.
annex 1: figures
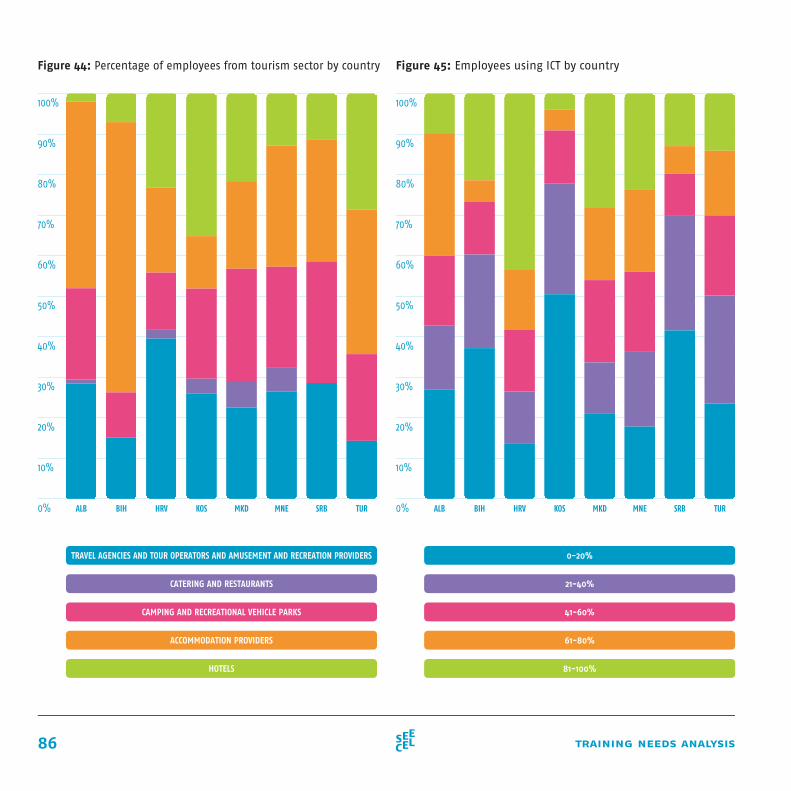
86 training needs analysis
100%
90%
80%
70%
60%
50%
40%
30%
20%
10%
0%
Figure 44: Percentage of employees from tourism sector by country Figure 45: Employees using ICT by country
100%
90%
80%
70%
60%
50%
40%
30%
20%
10%
0% TUR TURSRB SRBMNE MNEMKD MKDKOS KOSBIH BIHHRV HRVALB ALB
TRAVEL AGENCIES AND TOUR OPERATORS AND AMUSEMENT AND RECREATION PROVIDERS 0-20%
CATERING AND RESTAURANTS 21-40%
CAMPING AND RECREATIONAL VEHICLE PARKS 41-60%
ACCOMMODATION PROVIDERS 61-80%
HOTELS 81-100%
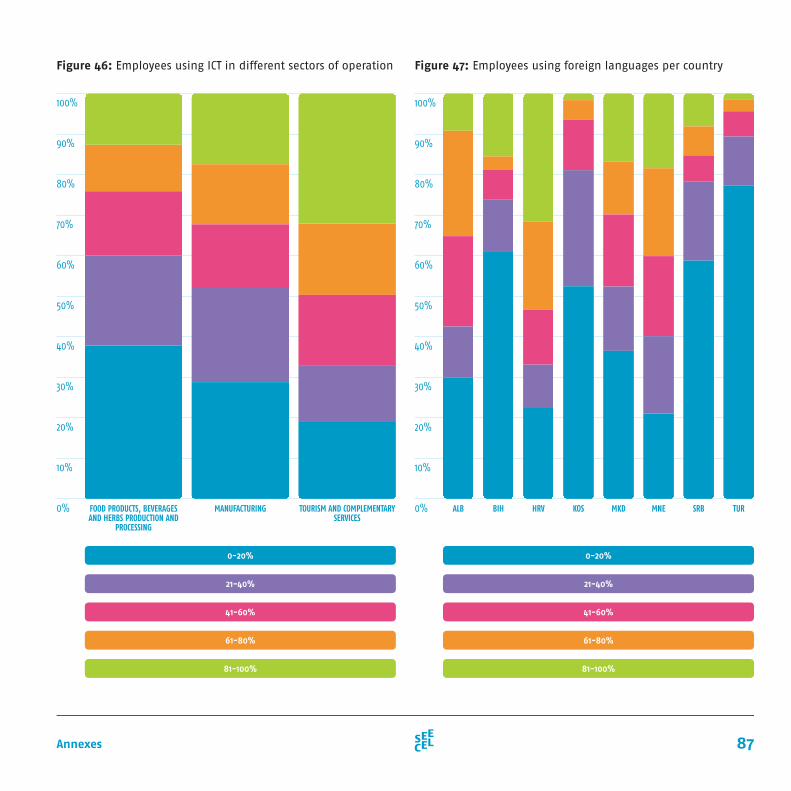
87Annexes
100%
90%
80%
70%
60%
50%
40%
30%
20%
10%
0%
100%
90%
80%
70%
60%
50%
40%
30%
20%
10%
0%
Figure 46: Employees using ICT in different sectors of operation Figure 47: Employees using foreign languages per country
TURSRBMNEMKDKOSBIH HRVALB
0-20% 0-20%
21-40% 21-40%
41-60% 41-60%
61-80% 61-80%
81-100% 81-100%
FOOD PRODUCTS, BEVERAGES AND HERBS PRODUCTION AND
PROCESSING
MANUFACTURING TOURISM AND COMPLEMENTARY SERVICES
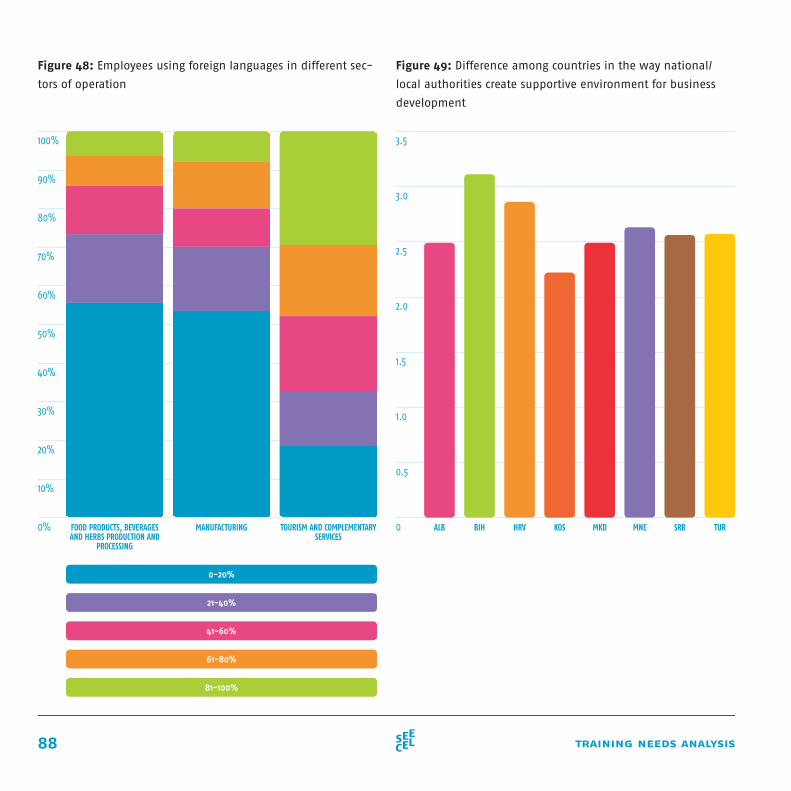
88 training needs analysis
Figure 48: Employees using foreign languages in different sec-
tors of operation
Figure 49: Difference among countries in the way national/
local authorities create supportive environment for business
development
100%
90%
80%
70%
60%
50%
40%
30%
20%
10%
0%
3.5
3.0
2.5
2.0
1.5
1.0
0.5
0
0-20%
21-40%
41-60%
61-80%
81-100%
FOOD PRODUCTS, BEVERAGES AND HERBS PRODUCTION AND
PROCESSING
MANUFACTURING TOURISM AND COMPLEMENTARY SERVICES
TURSRBMNEMKDKOSBIH HRV ALB
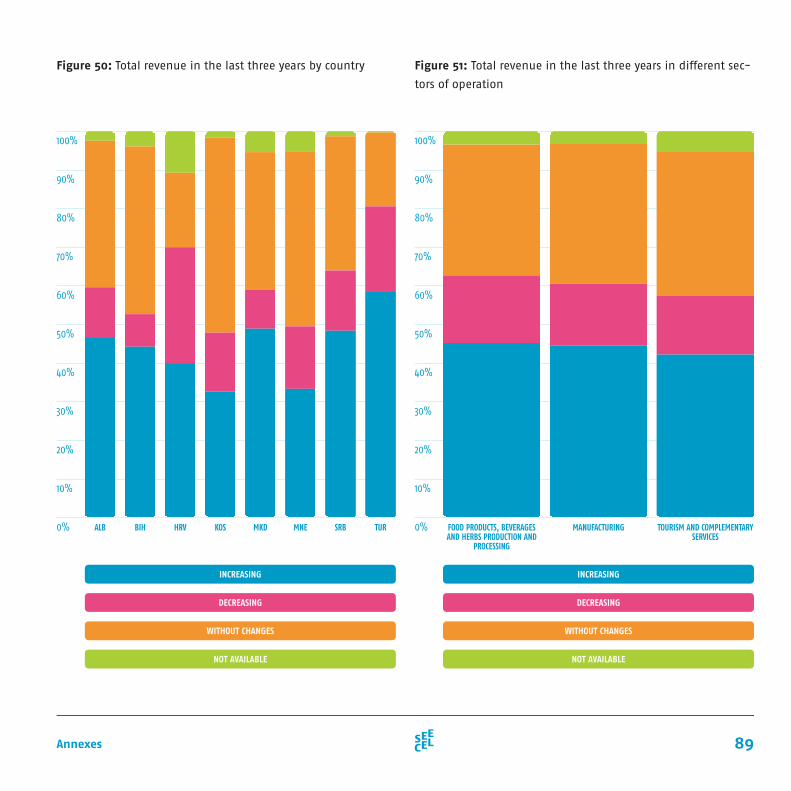
89Annexes
Figure 50: Total revenue in the last three years by country Figure 51: Total revenue in the last three years in different sec-
tors of operation
100%
90%
80%
70%
60%
50%
40%
30%
20%
10%
0%
100%
90%
80%
70%
60%
50%
40%
30%
20%
10%
0%
INCREASING INCREASING
DECREASING DECREASING
WITHOUT CHANGES WITHOUT CHANGES
NOT AVAILABLE NOT AVAILABLE
FOOD PRODUCTS, BEVERAGES AND HERBS PRODUCTION AND
PROCESSING
MANUFACTURING TOURISM AND COMPLEMENTARY SERVICES
TURSRBMNEMKDKOSBIH HRVALB
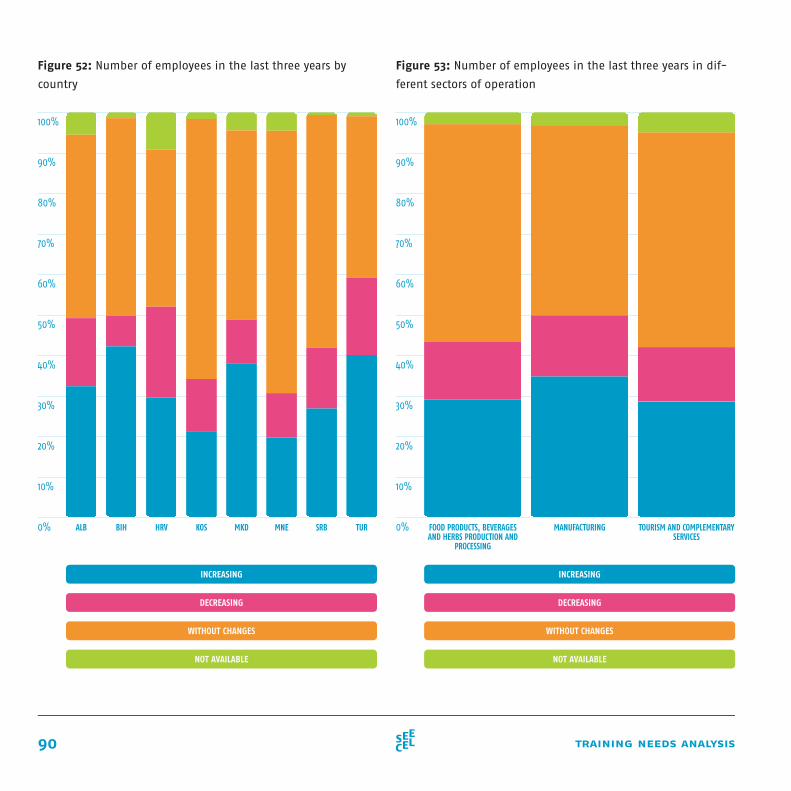
90 training needs analysis
Figure 52: Number of employees in the last three years by
country
Figure 53: Number of employees in the last three years in dif-
ferent sectors of operation
100%
90%
80%
70%
60%
50%
40%
30%
20%
10%
0%
100%
90%
80%
70%
60%
50%
40%
30%
20%
10%
0% FOOD PRODUCTS, BEVERAGES AND HERBS PRODUCTION AND
PROCESSING
MANUFACTURING TOURISM AND COMPLEMENTARY SERVICES
INCREASING INCREASING
DECREASING DECREASING
WITHOUT CHANGES WITHOUT CHANGES
NOT AVAILABLE NOT AVAILABLE
TURSRBMNEMKDKOSBIH HRVALB
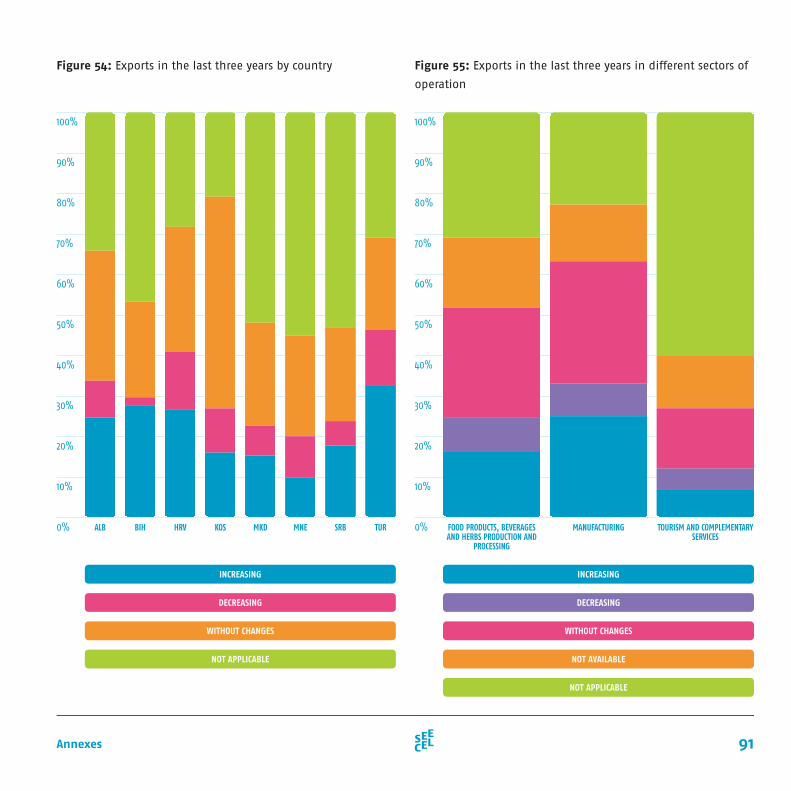
91Annexes
Figure 54: Exports in the last three years by country Figure 55: Exports in the last three years in different sectors of
operation
100%
90%
80%
70%
60%
50%
40%
30%
20%
10%
0%
100%
90%
80%
70%
60%
50%
40%
30%
20%
10%
0%
INCREASING
DECREASING
WITHOUT CHANGES
NOT AVAILABLE
NOT APPLICABLE
FOOD PRODUCTS, BEVERAGES AND HERBS PRODUCTION AND
PROCESSING
MANUFACTURING TOURISM AND COMPLEMENTARY SERVICES
INCREASING
DECREASING
WITHOUT CHANGES
NOT APPLICABLE
TURSRBMNEMKDKOSBIH HRVALB
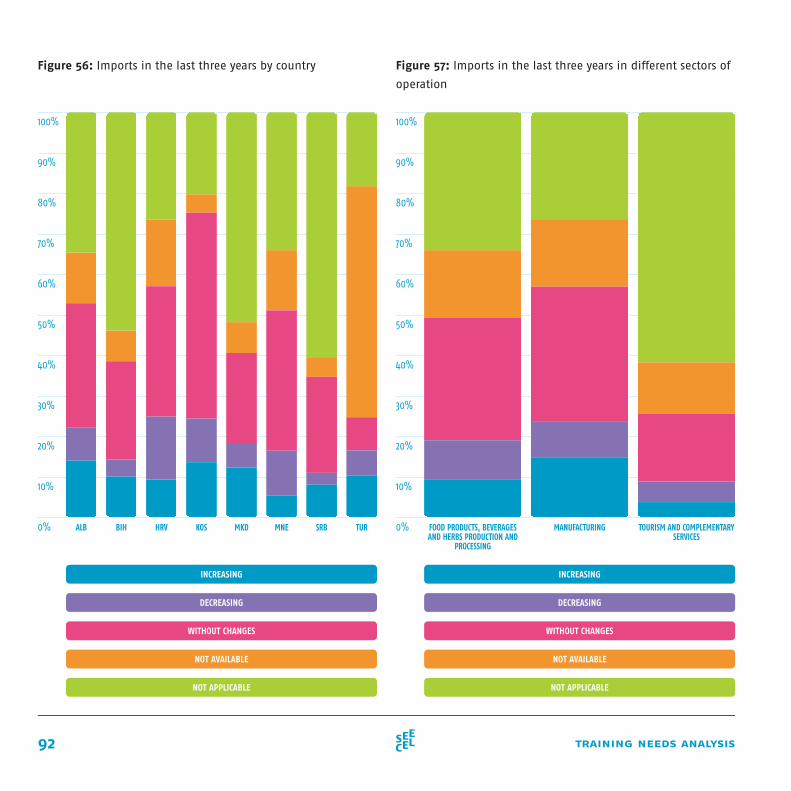
92 training needs analysis
Figure 56: Imports in the last three years by country Figure 57: Imports in the last three years in different sectors of
operation
100%
90%
80%
70%
60%
50%
40%
30%
20%
10%
0%
INCREASING
DECREASING
WITHOUT CHANGES
NOT AVAILABLE
NOT APPLICABLE
TURSRBMNEMKDKOSBIH HRVALB
100%
90%
80%
70%
60%
50%
40%
30%
20%
10%
0%
INCREASING
DECREASING
WITHOUT CHANGES
NOT AVAILABLE
NOT APPLICABLE
FOOD PRODUCTS, BEVERAGES AND HERBS PRODUCTION AND
PROCESSING
MANUFACTURING TOURISM AND COMPLEMENTARY SERVICES
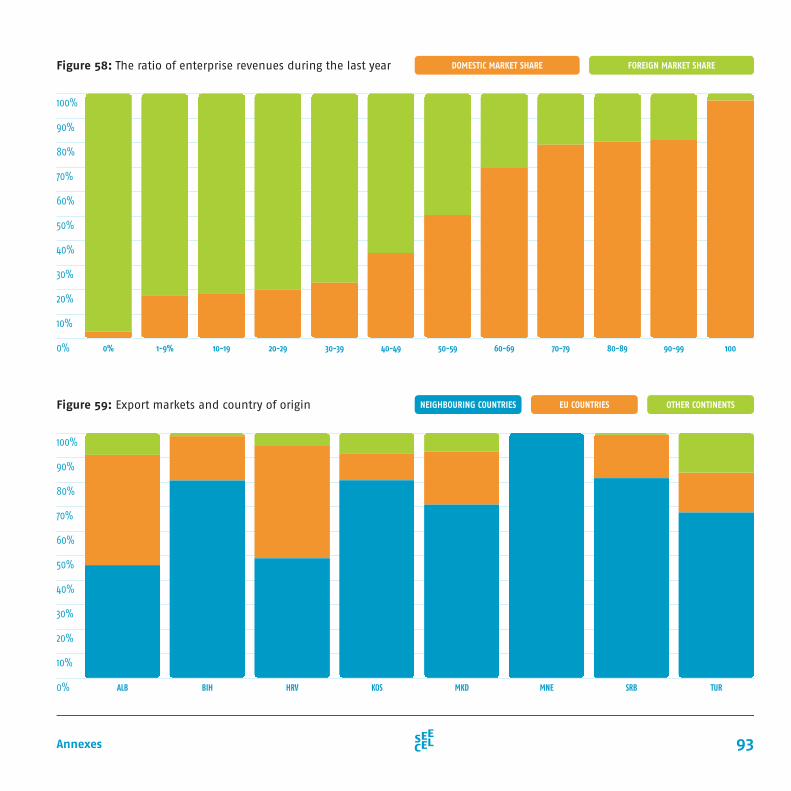
93Annexes
Figure 58: The ratio of enterprise revenues during the last year
Figure 59: Export markets and country of origin
100%
90%
80%
70%
60%
50%
40%
30%
20%
10%
0%
100%
90%
80%
70%
60%
50%
40%
30%
20%
10%
0%
DOMESTIC MARKET SHARE FOREIGN MARKET SHARE
0% 1-9% 10-19 20-29 30-39 40-49 50-59 60-69 70-79 80-89 90-99 100
NEIGHBOURING COUNTRIES EU COUNTRIES OTHER CONTINENTS
ALB HRVBIH KOS MKD MNE SRB TUR
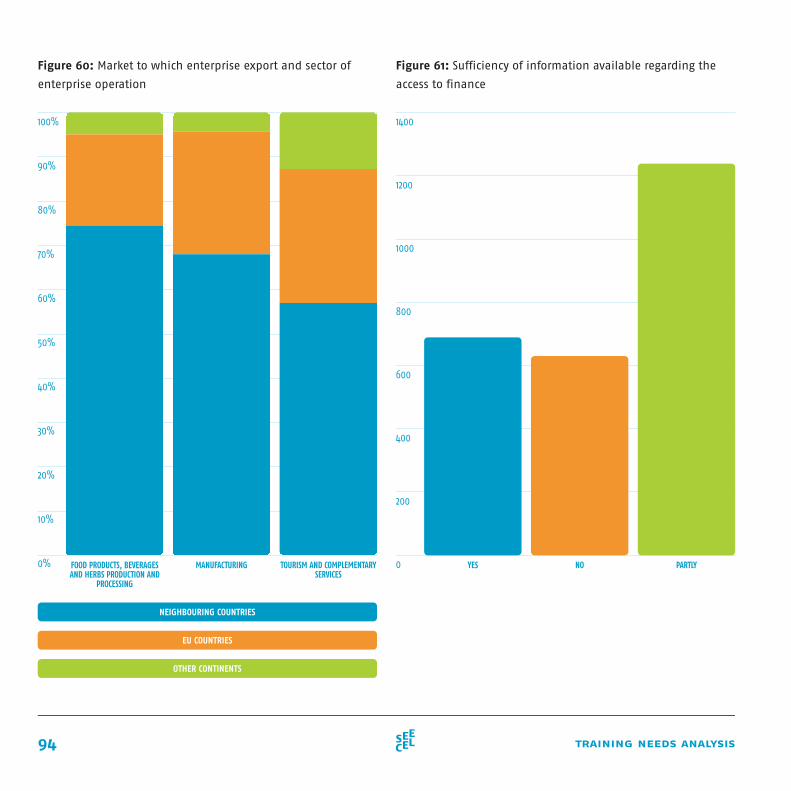
94 training needs analysis
Figure 60: Market to which enterprise export and sector of
enterprise operation
Figure 61: Sufficiency of information available regarding the
access to finance
NEIGHBOURING COUNTRIES
EU COUNTRIES
OTHER CONTINENTS
100%
90%
80%
70%
60%
50%
40%
30%
20%
10%
0%
1400
1200
1000
800
600
400
200
0FOOD PRODUCTS, BEVERAGES AND HERBS PRODUCTION AND
PROCESSING
YESMANUFACTURING NOTOURISM AND COMPLEMENTARY SERVICES
PARTLY
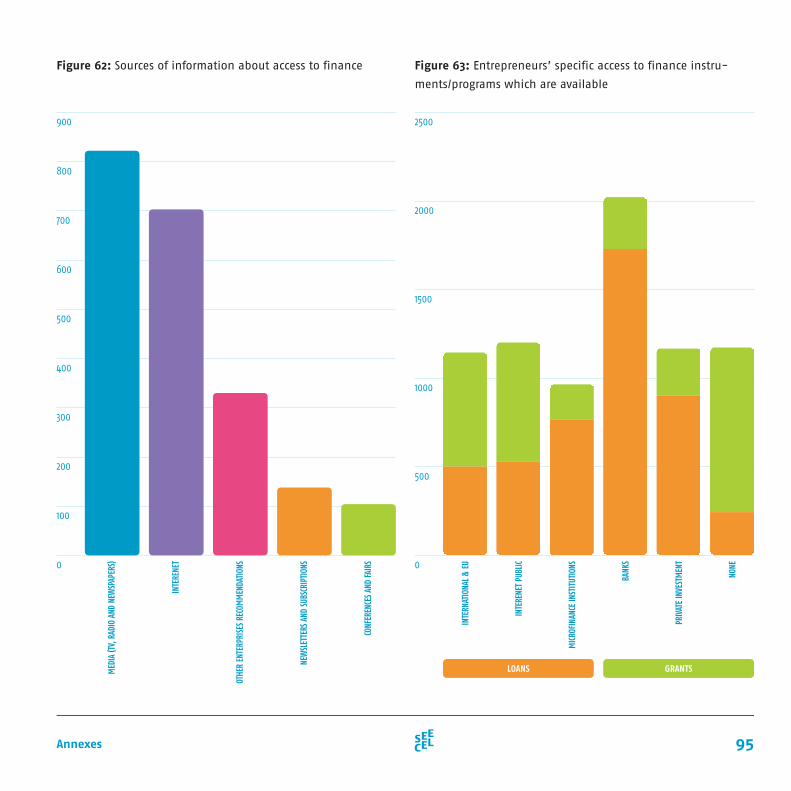
95Annexes
Figure 62: Sources of information about access to finance Figure 63: Entrepreneurs’ specific access to finance instru-
ments/programs which are available
LOANS GRANTS
900
800
700
600
500
400
300
200
100
0
2500
2000
1500
1000
500
0
MED
IA (T
V, R
ADIO
AND
NEW
SPAP
ERS)
INTE
RNAT
IONA
L & E
U
INTE
RENE
T
INTE
RENE
T PU
BLIC
OTHE
R EN
TERP
RISE
S RE
COM
MEN
DATI
ONS
MIC
ROFI
NANC
E IN
STIT
UTIO
NS
NEW
SLET
TERS
AND
SUB
SCRI
PTIO
NS
BANK
S
CONF
EREN
CES A
ND FA
IRS
PRIV
ATE
INVE
STM
ENT
NONE
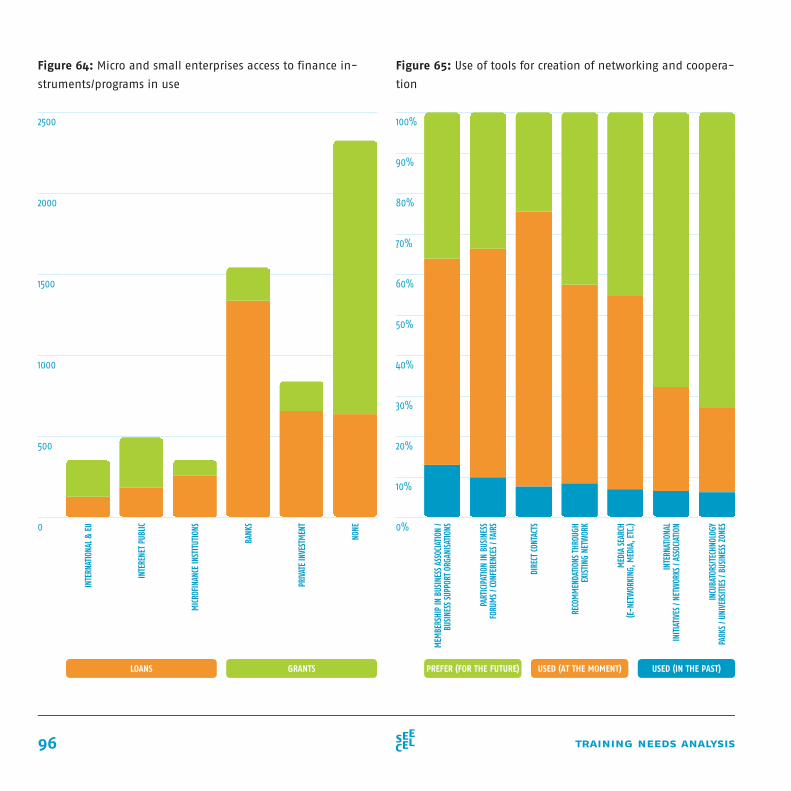
96 training needs analysis
Figure 64: Micro and small enterprises access to finance in-
struments/programs in use
Figure 65: Use of tools for creation of networking and coopera-
tion
MEM
BERS
HIP
IN B
USIN
ESS A
SSOC
IATI
ON /
BUSI
NESS
SUP
PORT
ORG
ANIS
ATIO
NS
PART
ICIP
ATIO
N IN
BUS
INES
SFO
RUM
S / C
ONFE
RENC
ES /
FAIR
S
DIRE
CT CO
NTAC
TS
RECO
MM
ENDA
TION
S THR
OUGH
EXIS
TING
NET
WOR
K
MED
IA S
EARC
H(E
-NET
WOR
KING
, MED
IA, E
TC.)
INTE
RNAT
IONA
LIN
ITIA
TIVE
S / N
ETW
ORKS
/ AS
SOCI
ATIO
N
INCU
BATO
RS/T
ECHN
OLOG
YPA
RKS
/ UNI
VERS
ITIE
S / B
USIN
ESS Z
ONES
USED (IN THE PAST)USED (AT THE MOMENT)PREFER (FOR THE FUTURE)
100%
90%
80%
70%
60%
50%
40%
30%
20%
10%
0%
2500
2000
1500
1000
500
0
LOANS GRANTS
INTE
RNAT
IONA
L & E
U
INTE
RENE
T PU
BLIC
MIC
ROFI
NANC
E IN
STIT
UTIO
NS
BANK
S
PRIV
ATE
INVE
STM
ENT
NONE
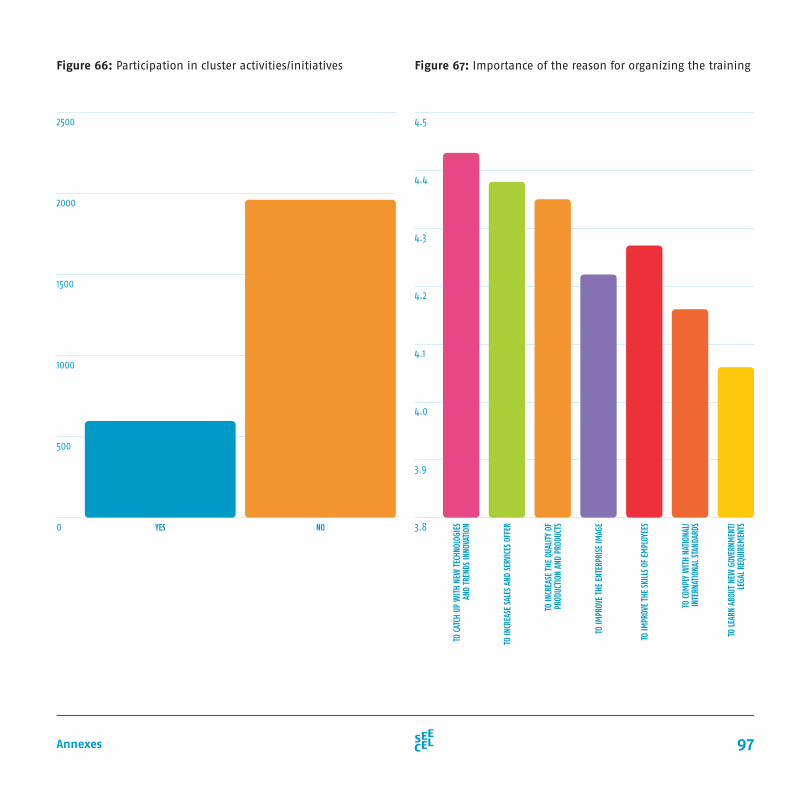
97Annexes
Figure 66: Participation in cluster activities/initiatives Figure 67: Importance of the reason for organizing the training
TO C
ATCH
UP
WIT
H NE
W T
ECHN
OLOG
IES
AND
TREN
DS IN
NOVA
TION
TO IN
CREA
SE S
ALES
AND
SER
VICE
S OF
FER
TO IN
CREA
SE T
HE Q
UALIT
Y OF
PR
ODUC
TION
AND
PRO
DUCT
S
TO IM
PROV
E TH
E EN
TERP
RISE
IMAG
E
TO IM
PROV
E TH
E SK
ILLS
OF E
MPL
OYEE
S
TO CO
MPL
Y W
ITH
NATI
ONAL
/IN
TERN
ATIO
NAL S
TAND
ARDS
TO LE
ARN
ABOU
T NE
W G
OVER
NMEN
T/LE
GAL R
EQUI
REM
ENTS
4.5
4.4
4.3
4.2
4.1
4.0
3.9
3.8
2500
2000
1500
1000
500
0 YES NO
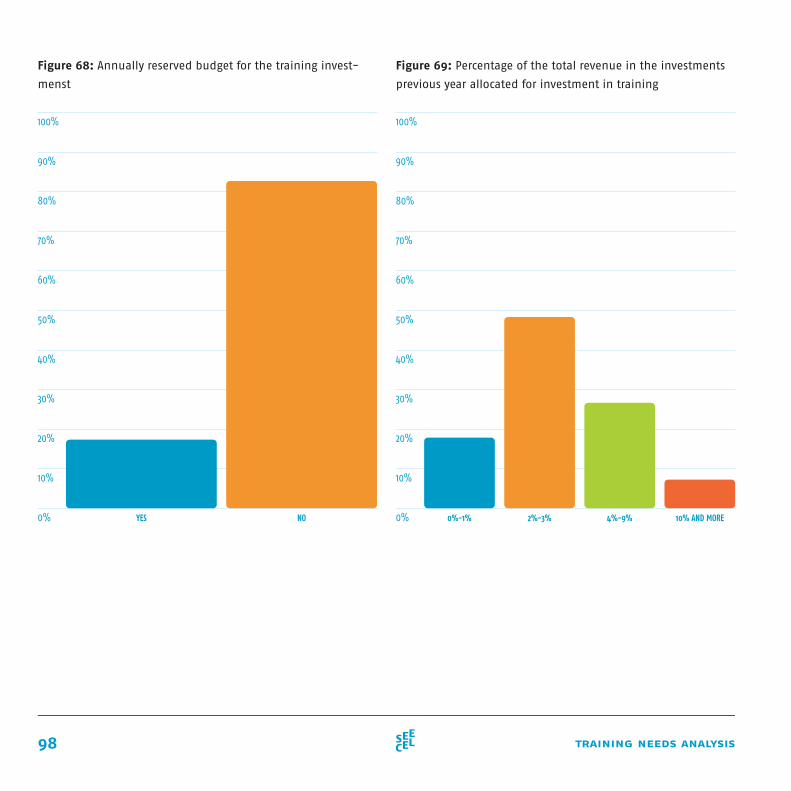
98 training needs analysis
Figure 68: Annually reserved budget for the training invest-
menst
Figure 69: Percentage of the total revenue in the investments
previous year allocated for investment in training
100%
90%
80%
70%
60%
50%
40%
30%
20%
10%
0%
100%
90%
80%
70%
60%
50%
40%
30%
20%
10%
0% YES 0%-1% 2%-3% 4%-9% 10% AND MORENO
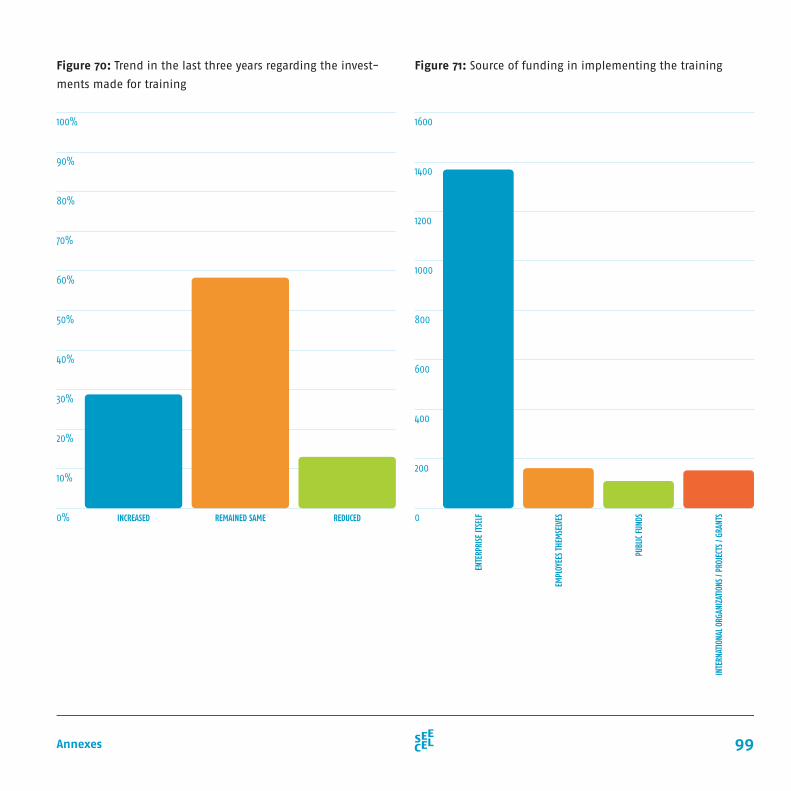
99Annexes
Figure 70: Trend in the last three years regarding the invest-
ments made for training
Figure 71: Source of funding in implementing the training
1600
1400
1200
1000
800
600
400
200
0
ENTE
RPRI
SE IT
SELF
EMPL
OYEE
S THE
MSE
LVES
PUBL
IC F
UNDS
INTE
RNAT
IONA
L ORG
ANIZ
ATIO
NS /
PROJ
ECTS
/ GR
ANTS
100%
90%
80%
70%
60%
50%
40%
30%
20%
10%
0% INCREASED REMAINED SAME REDUCED
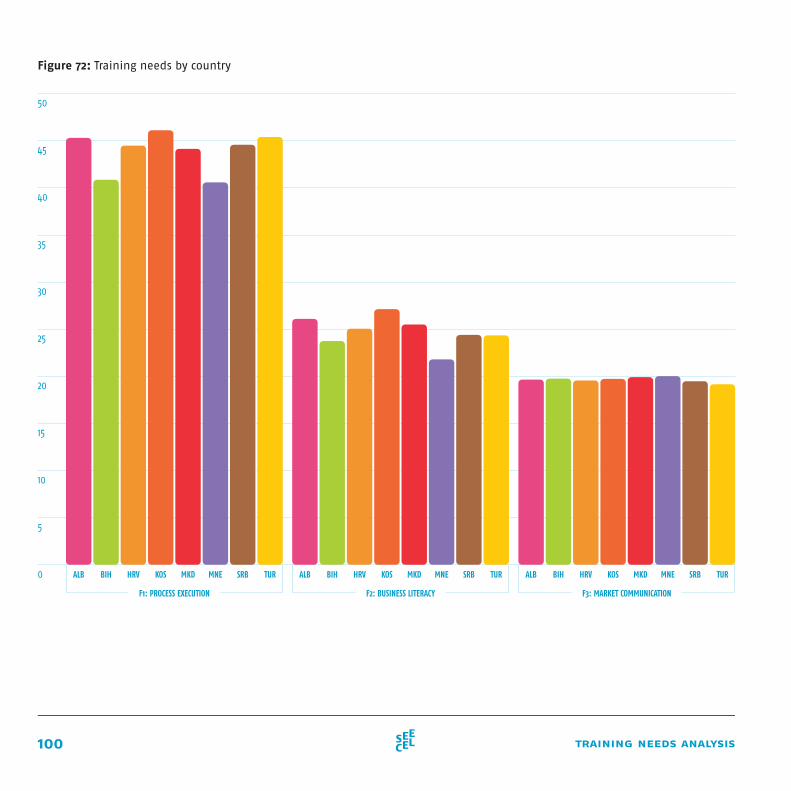
100 training needs analysis
Figure 72: Training needs by country
50
45
40
35
30
25
20
15
10
5
0 TURSRBMNEMKDKOSBIH HRVALB TURSRBMNEMKDKOSBIH HRVALB TURSRBMNEMKDKOSBIH HRVALB
F1: PROCESS EXECUTION F2: BUSINESS LITERACY F3: MARKET COMMUNICATION
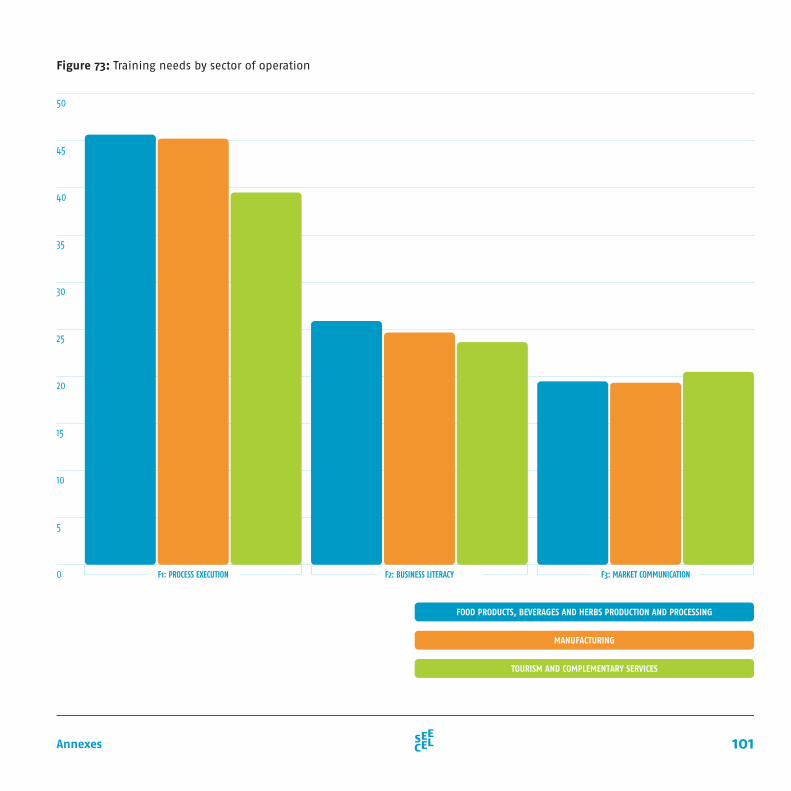
101Annexes
F1: PROCESS EXECUTION F2: BUSINESS LITERACY F3: MARKET COMMUNICATION
Figure 73: Training needs by sector of operation
50
45
40
35
30
25
20
15
10
5
0
FOOD PRODUCTS, BEVERAGES AND HERBS PRODUCTION AND PROCESSING
MANUFACTURING
TOURISM AND COMPLEMENTARY SERVICES
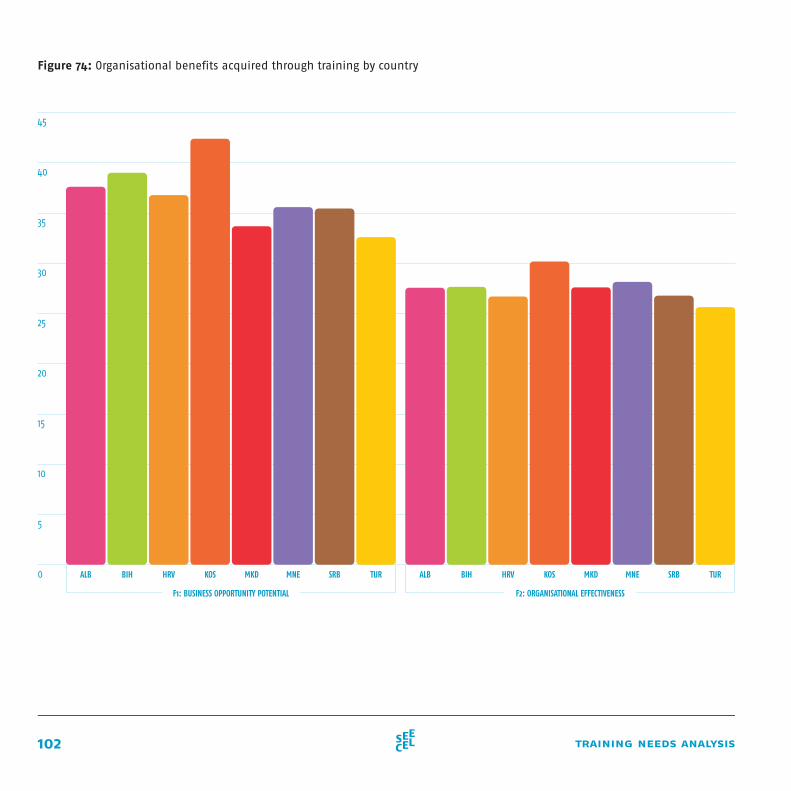
102 training needs analysis
Figure 74: Organisational benefits acquired through training by country
TUR TURSRB SRBMNE MNEMKD MKDKOS KOSBIH BIHHRV HRVALB ALB
F1: BUSINESS OPPORTUNITY POTENTIAL F2: ORGANISATIONAL EFFECTIVENESS
45
40
35
30
25
20
15
10
5
0
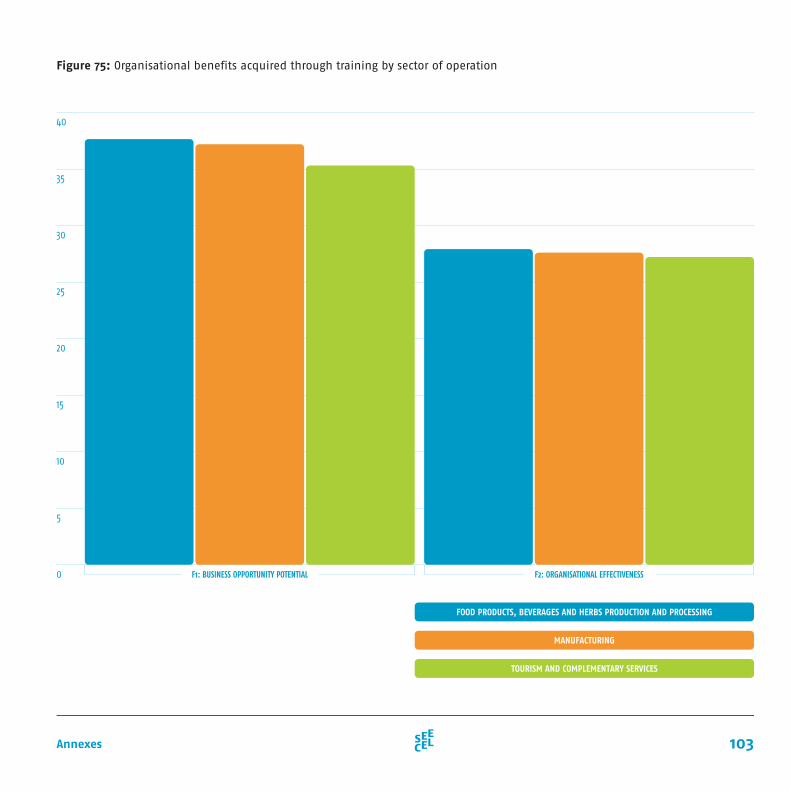
103Annexes
Figure 75: Organisational benefits acquired through training by sector of operation
F1: BUSINESS OPPORTUNITY POTENTIAL F2: ORGANISATIONAL EFFECTIVENESS
FOOD PRODUCTS, BEVERAGES AND HERBS PRODUCTION AND PROCESSING
MANUFACTURING
TOURISM AND COMPLEMENTARY SERVICES
40
35
30
25
20
15
10
5
0
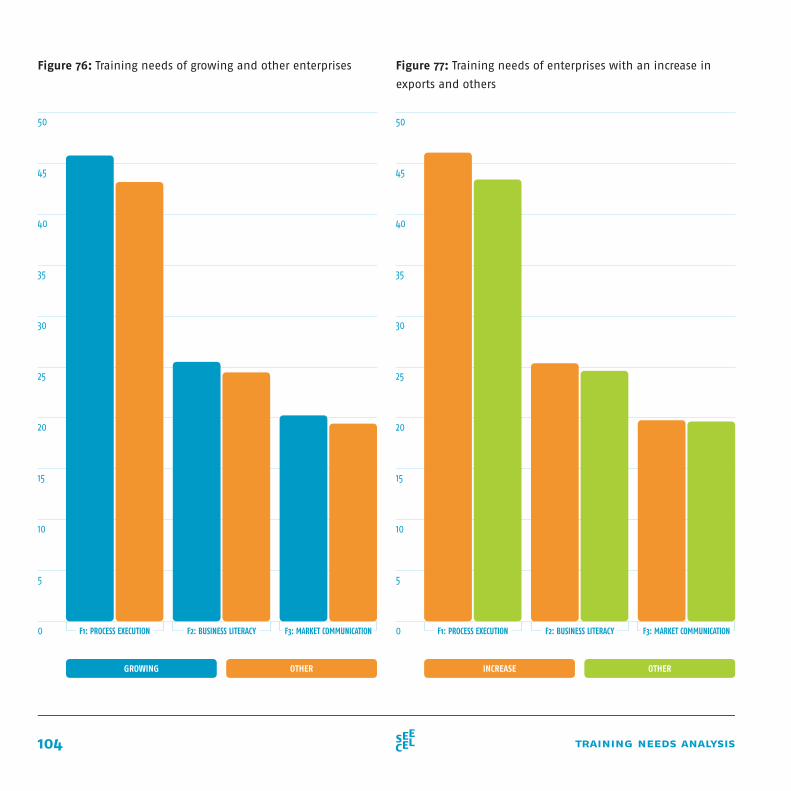
104 training needs analysis
Figure 76: Training needs of growing and other enterprises Figure 77: Training needs of enterprises with an increase in
exports and others
50
45
40
35
30
25
20
15
10
5
0
50
45
40
35
30
25
20
15
10
5
0F1: PROCESS EXECUTION F1: PROCESS EXECUTIONF2: BUSINESS LITERACY F2: BUSINESS LITERACYF3: MARKET COMMUNICATION F3: MARKET COMMUNICATION
GROWING INCREASEOTHER OTHER
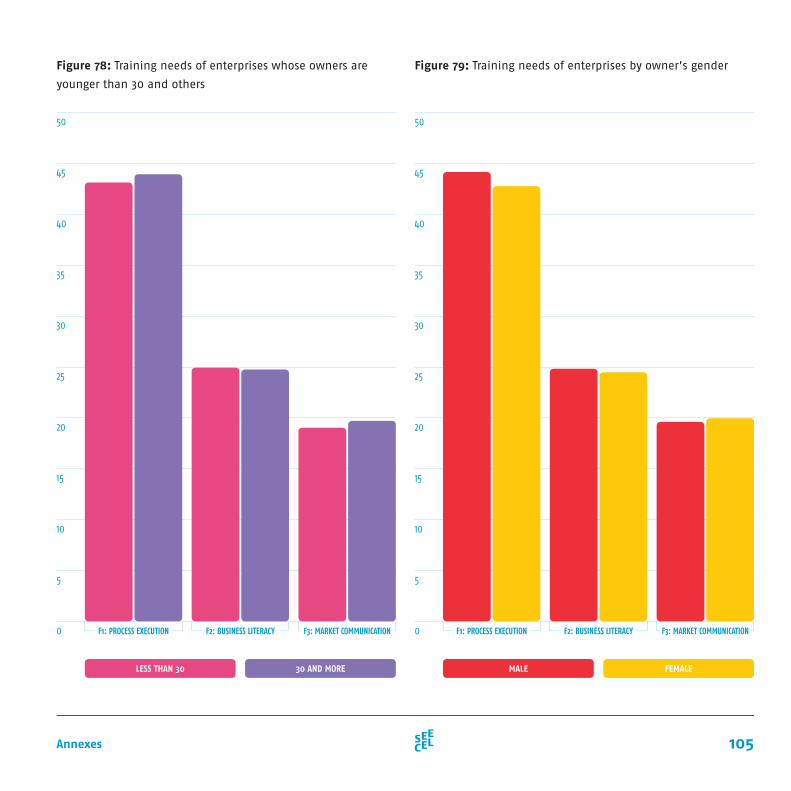
105Annexes
Figure 78: Training needs of enterprises whose owners are
younger than 30 and others
Figure 79: Training needs of enterprises by owner’s gender
50
45
40
35
30
25
20
15
10
5
0
50
45
40
35
30
25
20
15
10
5
0F1: PROCESS EXECUTION F1: PROCESS EXECUTIONF2: BUSINESS LITERACY F2: BUSINESS LITERACYF3: MARKET COMMUNICATION F3: MARKET COMMUNICATION
LESS THAN 30 MALE30 AND MORE FEMALE
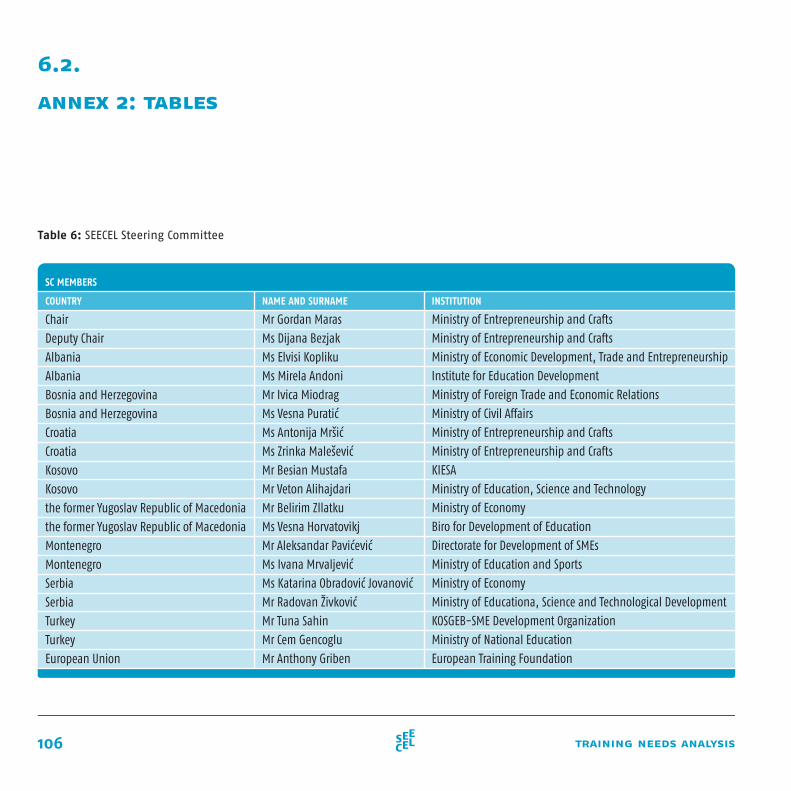
106 training needs analysis
Table 6: SEECEL Steering Committee
6.2.
annex 2: tables
COUNTRY
SC MEMBERS
NAME AND SURNAME INSTITUTION
Chair
Deputy Chair
Albania
Albania
Bosnia and Herzegovina
Bosnia and Herzegovina
Croatia
Croatia
Kosovo
Kosovo
the former Yugoslav Republic of Macedonia
the former Yugoslav Republic of Macedonia
Montenegro
Montenegro
Serbia
Serbia
Turkey
Turkey
European Union
Mr Gordan Maras
Ms Dijana Bezjak
Ms Elvisi Kopliku
Ms Mirela Andoni
Mr Ivica Miodrag
Ms Vesna Puratić
Ms Antonija Mršić
Ms Zrinka Malešević
Mr Besian Mustafa
Mr Veton Alihajdari
Mr Belirim Zllatku
Ms Vesna Horvatovikj
Mr Aleksandar Pavićević
Ms Ivana Mrvaljević
Ms Katarina Obradović Jovanović
Mr Radovan Živković
Mr Tuna Sahin
Mr Cem Gencoglu
Mr Anthony Griben
Ministry of Entrepreneurship and Crafts
Ministry of Entrepreneurship and Crafts
Ministry of Economic Development, Trade and Entrepreneurship
Institute for Education Development
Ministry of Foreign Trade and Economic Relations
Ministry of Civil Affairs
Ministry of Entrepreneurship and Crafts
Ministry of Entrepreneurship and Crafts
KIESA
Ministry of Education, Science and Technology
Ministry of Economy
Biro for Development of Education
Directorate for Development of SMEs
Ministry of Education and Sports
Ministry of Economy
Ministry of Educationa, Science and Technological Development
KOSGEB-SME Development Organization
Ministry of National Education
European Training Foundation
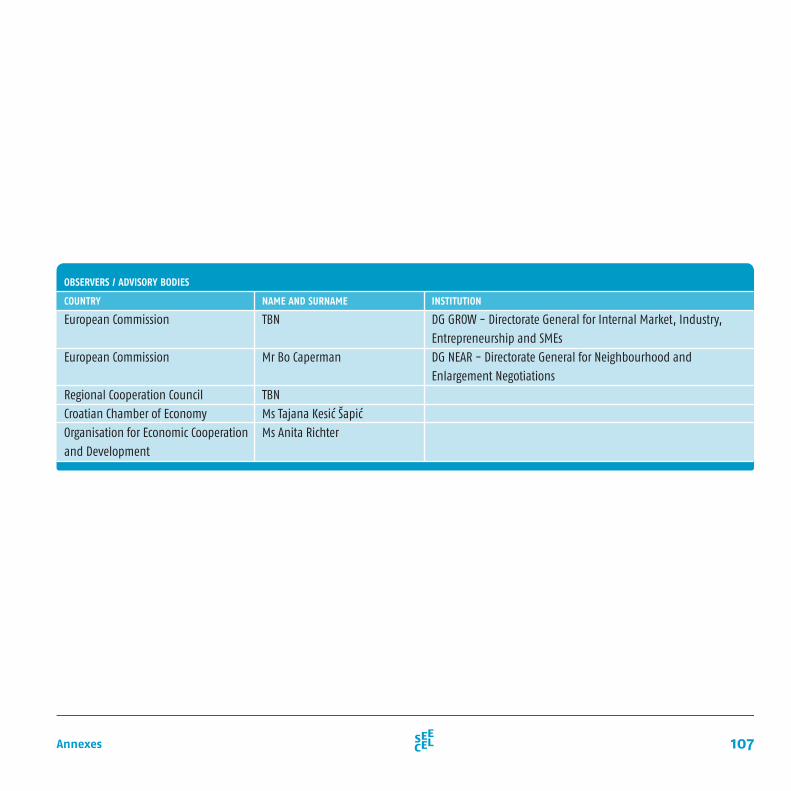
107Annexes
European Commission
European Commission
Regional Cooperation Council
Croatian Chamber of Economy
Organisation for Economic Cooperation
and Development
TBN
Mr Bo Caperman
TBN
Ms Tajana Kesić Šapić
Ms Anita Richter
DG GROW - Directorate General for Internal Market, Industry,
Entrepreneurship and SMEs
DG NEAR - Directorate General for Neighbourhood and
Enlargement Negotiations
OBSERVERS / ADVISORY BODIES
COUNTRY NAME AND SURNAME INSTITUTION
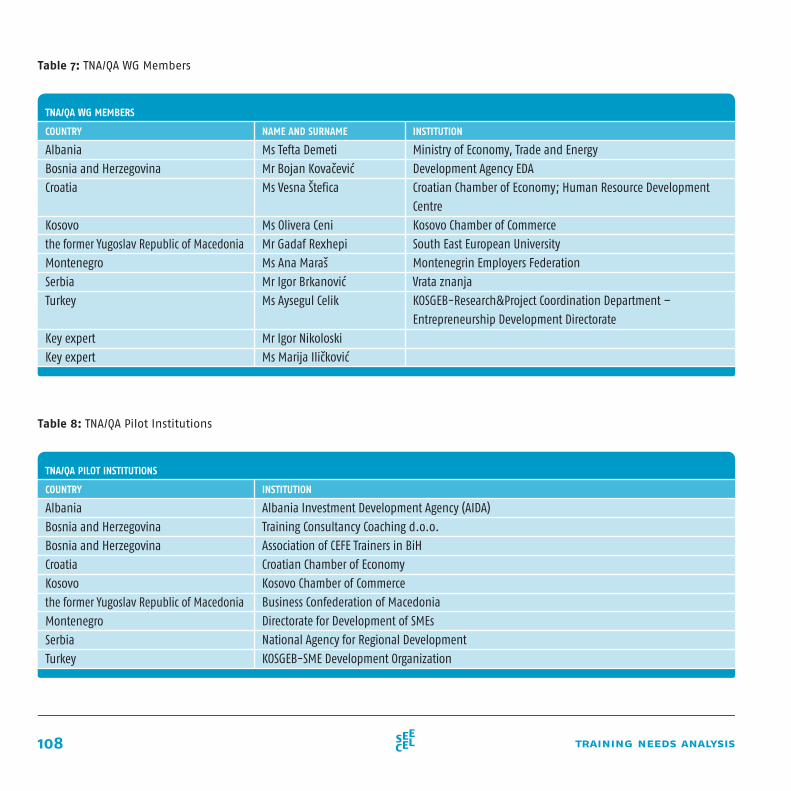
108 training needs analysis
Table 7: TNA/QA WG Members
COUNTRY
COUNTRY
TNA/QA WG MEMBERS
TNA/QA PILOT INSTITUTIONS
NAME AND SURNAME INSTITUTION
INSTITUTION
Albania
Bosnia and Herzegovina
Croatia
Kosovo
the former Yugoslav Republic of Macedonia
Montenegro
Serbia
Turkey
Key expert
Key expert
Albania
Bosnia and Herzegovina
Bosnia and Herzegovina
Croatia
Kosovo
the former Yugoslav Republic of Macedonia
Montenegro
Serbia
Turkey
Ms Tefta Demeti
Mr Bojan Kovačević
Ms Vesna Štefica
Ms Olivera Ceni
Mr Gadaf Rexhepi
Ms Ana Maraš
Mr Igor Brkanović
Ms Aysegul Celik
Mr Igor Nikoloski
Ms Marija Iličković
Ministry of Economy, Trade and Energy
Development Agency EDA
Croatian Chamber of Economy; Human Resource Development
Centre
Kosovo Chamber of Commerce
South East European University
Montenegrin Employers Federation
Vrata znanja
KOSGEB-Research&Project Coordination Department –
Entrepreneurship Development Directorate
Albania Investment Development Agency (AIDA)
Training Consultancy Coaching d.o.o.
Association of CEFE Trainers in BiH
Croatian Chamber of Economy
Kosovo Chamber of Commerce
Business Confederation of Macedonia
Directorate for Development of SMEs
National Agency for Regional Development
KOSGEB-SME Development Organization
Table 8: TNA/QA Pilot Institutions
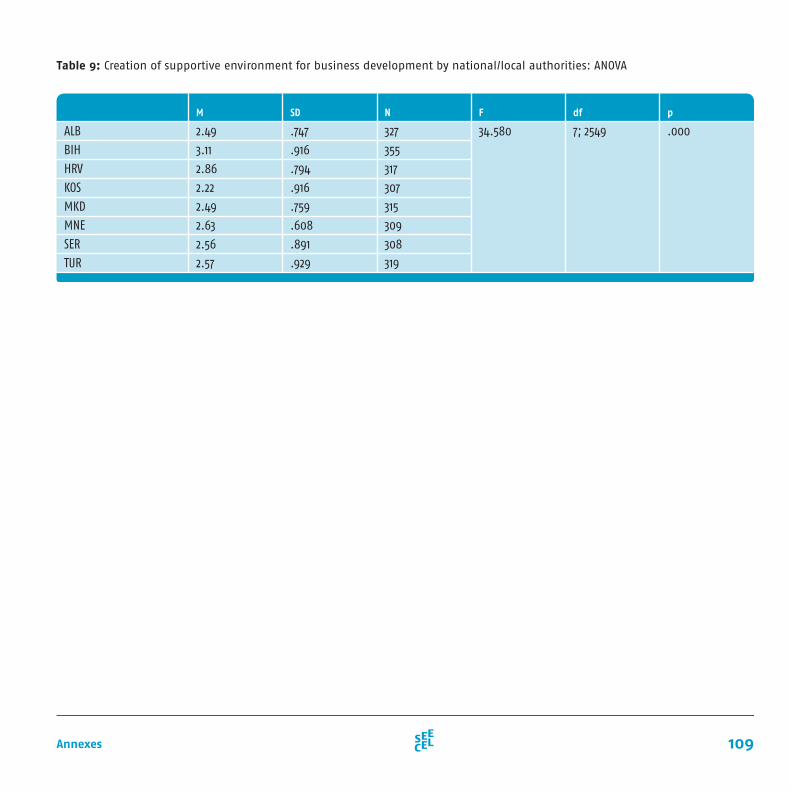
109Annexes
Table 9: Creation of supportive environment for business development by national/local authorities: ANOVA
M SD N F df p
ALB
BIH
HRV
KOS
MKD
MNE
SER
TUR
2.49
3.11
2.86
2.22
2.49
2.63
2.56
2.57
.747
.916
.794
.916
.759
.608
.891
.929
327
355
317
307
315
309
308
319
34.580 7; 2549 .000
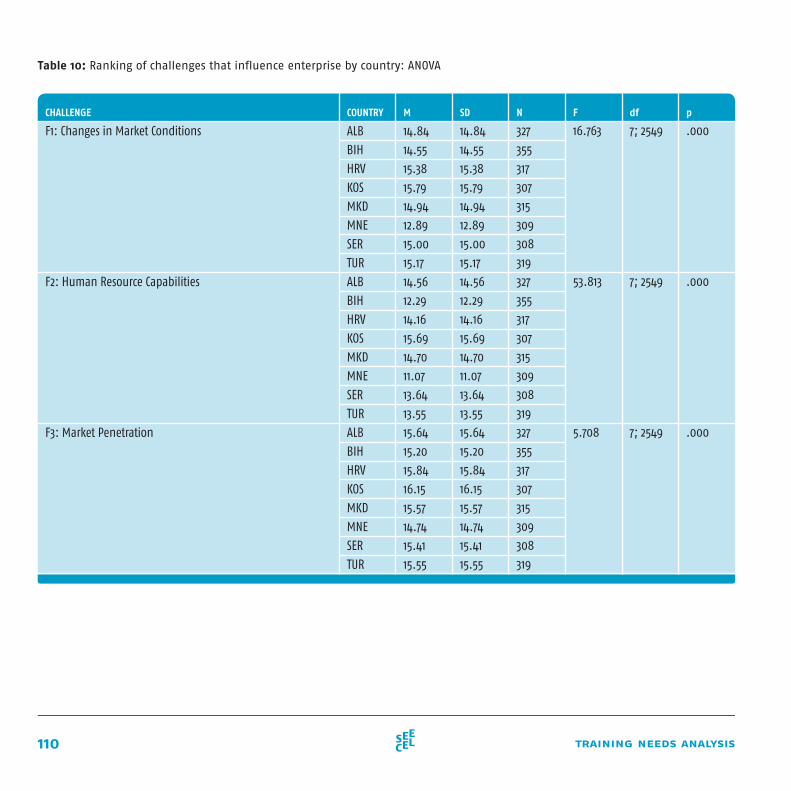
110 training needs analysis
Table 10: Ranking of challenges that influence enterprise by country: ANOVA
MCOUNTRYCHALLENGE SD N F df p
ALB
BIH
HRV
KOS
MKD
MNE
SER
TUR
ALB
BIH
HRV
KOS
MKD
MNE
SER
TUR
ALB
BIH
HRV
KOS
MKD
MNE
SER
TUR
F1: Changes in Market Conditions
F2: Human Resource Capabilities
F3: Market Penetration
14.84
14.55
15.38
15.79
14.94
12.89
15.00
15.17
14.56
12.29
14.16
15.69
14.70
11.07
13.64
13.55
15.64
15.20
15.84
16.15
15.57
14.74
15.41
15.55
14.84
14.55
15.38
15.79
14.94
12.89
15.00
15.17
14.56
12.29
14.16
15.69
14.70
11.07
13.64
13.55
15.64
15.20
15.84
16.15
15.57
14.74
15.41
15.55
327
355
317
307
315
309
308
319
327
355
317
307
315
309
308
319
327
355
317
307
315
309
308
319
16.763
53.813
5.708
7; 2549
7; 2549
7; 2549
.000
.000
.000
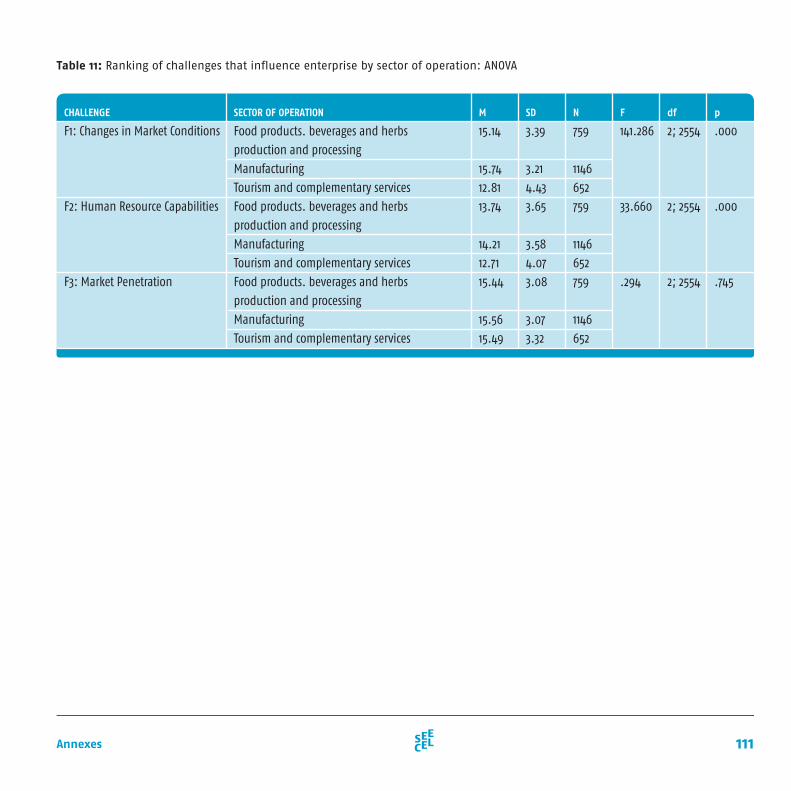
111Annexes
Table 11: Ranking of challenges that influence enterprise by sector of operation: ANOVA
MSECTOR OF OPERATIONCHALLENGE SD N F df p
Food products. beverages and herbs
production and processing
Manufacturing
Tourism and complementary services
Food products. beverages and herbs
production and processing
Manufacturing
Tourism and complementary services
Food products. beverages and herbs
production and processing
Manufacturing
Tourism and complementary services
F1: Changes in Market Conditions
F2: Human Resource Capabilities
F3: Market Penetration
15.14
15.74
12.81
13.74
14.21
12.71
15.44
15.56
15.49
3.39
3.21
4.43
3.65
3.58
4.07
3.08
3.07
3.32
759
1146
652
759
1146
652
759
1146
652
141.286
33.660
.294
2; 2554
2; 2554
2; 2554
.000
.000
.745
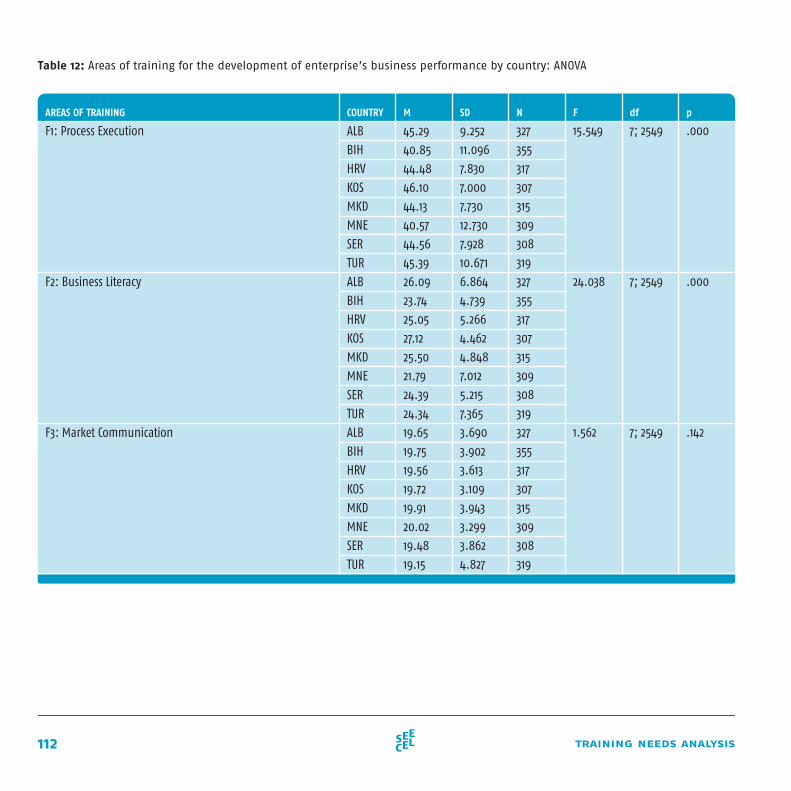
112 training needs analysis
Table 12: Areas of training for the development of enterprise’s business performance by country: ANOVA
MCOUNTRYAREAS OF TRAINING SD N F df p
ALB
BIH
HRV
KOS
MKD
MNE
SER
TUR
ALB
BIH
HRV
KOS
MKD
MNE
SER
TUR
ALB
BIH
HRV
KOS
MKD
MNE
SER
TUR
F1: Process Execution
F2: Business Literacy
F3: Market Communication
45.29
40.85
44.48
46.10
44.13
40.57
44.56
45.39
26.09
23.74
25.05
27.12
25.50
21.79
24.39
24.34
19.65
19.75
19.56
19.72
19.91
20.02
19.48
19.15
9.252
11.096
7.830
7.000
7.730
12.730
7.928
10.671
6.864
4.739
5.266
4.462
4.848
7.012
5.215
7.365
3.690
3.902
3.613
3.109
3.943
3.299
3.862
4.827
327
355
317
307
315
309
308
319
327
355
317
307
315
309
308
319
327
355
317
307
315
309
308
319
15.549
24.038
1.562
7; 2549
7; 2549
7; 2549
.000
.000
.142
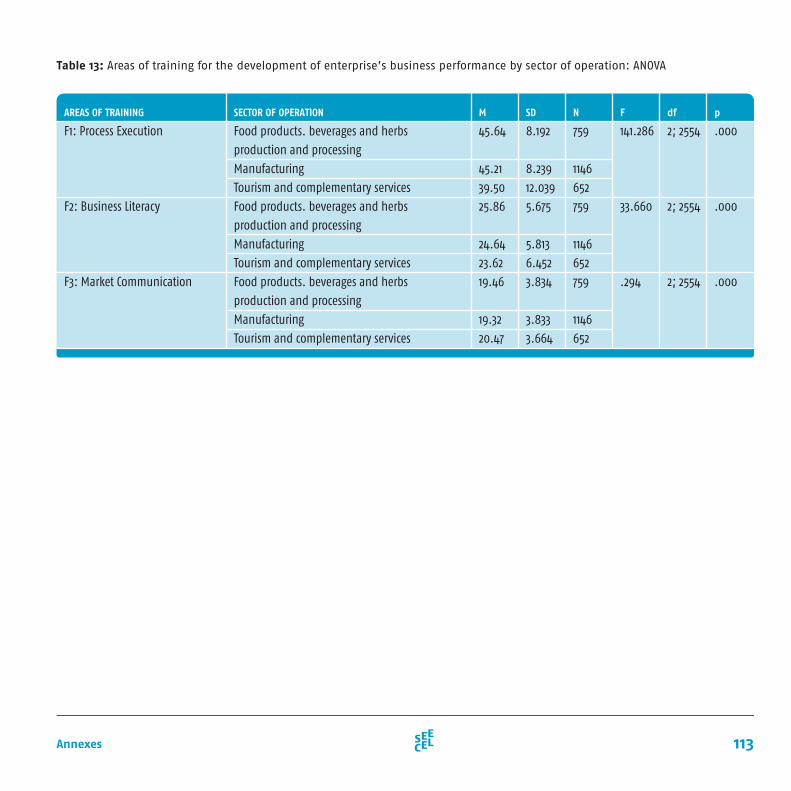
113Annexes
Table 13: Areas of training for the development of enterprise’s business performance by sector of operation: ANOVA
MSECTOR OF OPERATIONAREAS OF TRAINING SD N F df p
Food products. beverages and herbs
production and processing
Manufacturing
Tourism and complementary services
Food products. beverages and herbs
production and processing
Manufacturing
Tourism and complementary services
Food products. beverages and herbs
production and processing
Manufacturing
Tourism and complementary services
F1: Process Execution
F2: Business Literacy
F3: Market Communication
45.64
45.21
39.50
25.86
24.64
23.62
19.46
19.32
20.47
8.192
8.239
12.039
5.675
5.813
6.452
3.834
3.833
3.664
759
1146
652
759
1146
652
759
1146
652
141.286
33.660
.294
2; 2554
2; 2554
2; 2554
.000
.000
.000
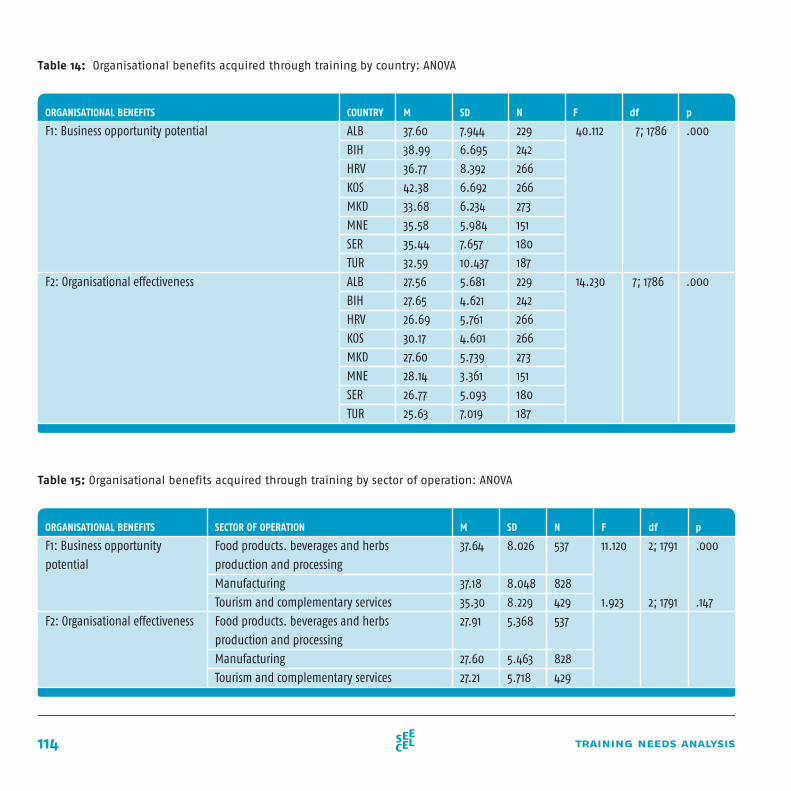
114 training needs analysis
Table 14: Organisational benefits acquired through training by country: ANOVA
Table 15: Organisational benefits acquired through training by sector of operation: ANOVA
MCOUNTRYORGANISATIONAL BENEFITS SD N F df p
ALB
BIH
HRV
KOS
MKD
MNE
SER
TUR
ALB
BIH
HRV
KOS
MKD
MNE
SER
TUR
F1: Business opportunity potential
F2: Organisational effectiveness
37.60
38.99
36.77
42.38
33.68
35.58
35.44
32.59
27.56
27.65
26.69
30.17
27.60
28.14
26.77
25.63
7.944
6.695
8.392
6.692
6.234
5.984
7.657
10.437
5.681
4.621
5.761
4.601
5.739
3.361
5.093
7.019
229
242
266
266
273
151
180
187
229
242
266
266
273
151
180
187
40.112
14.230
7; 1786
7; 1786
.000
.000
MSECTOR OF OPERATIONORGANISATIONAL BENEFITS SD N F df p
Food products. beverages and herbs
production and processing
Manufacturing
Tourism and complementary services
Food products. beverages and herbs
production and processing
Manufacturing
Tourism and complementary services
F1: Business opportunity
potential
F2: Organisational effectiveness
37.64
37.18
35.30
27.91
27.60
27.21
8.026
8.048
8.229
5.368
5.463
5.718
537
828
429
537
828
429
11.120
1.923
2; 1791
2; 1791
.000
.147
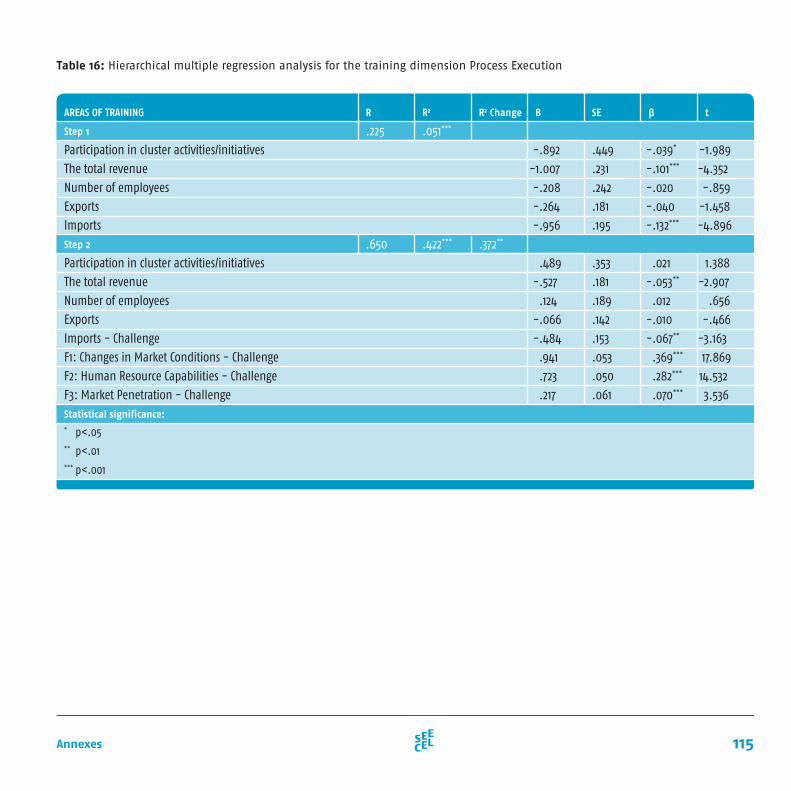
115Annexes
Table 16: Hierarchical multiple regression analysis for the training dimension Process Execution
R2RAREAS OF TRAINING
Step 1
Step 2
Statistical significance:* p<.05** p<.01*** p<.001
R2 Change B SE β t
.225
.650
Participation in cluster activities/initiatives
The total revenue
Number of employees
Exports
Imports
Participation in cluster activities/initiatives
The total revenue
Number of employees
Exports
Imports - Challenge
F1: Changes in Market Conditions - Challenge
F2: Human Resource Capabilities - Challenge
F3: Market Penetration - Challenge
.051***
.422*** .372**
-.892
-1.007
-.208
-.264
-.956
.489
-.527
.124
-.066
-.484
.941
.723
.217
.449
.231
.242
.181
.195
.353
.181
.189
.142
.153
.053
.050
.061
-.039*
-.101***
-.020
-.040
-.132***
.021
-.053**
.012
-.010
-.067**
.369***
.282***
.070***
-1.989
-4.352
-.859
-1.458
-4.896
1.388
-2.907
.656
-.466
-3.163
17.869
14.532
3.536
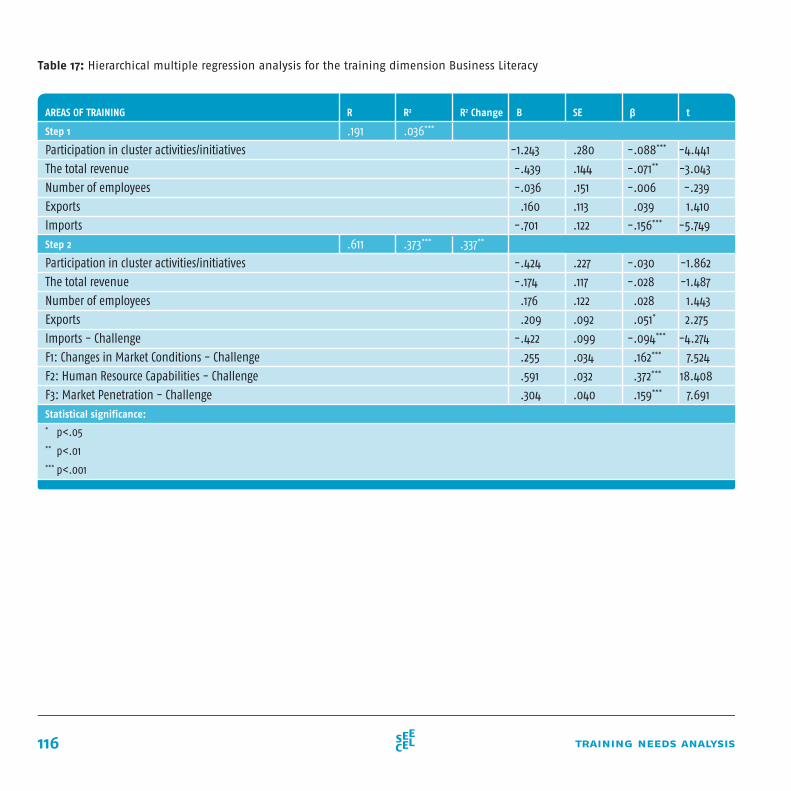
116 training needs analysis
Table 17: Hierarchical multiple regression analysis for the training dimension Business Literacy
R2RAREAS OF TRAINING
Step 1
Step 2
Statistical significance:* p<.05** p<.01*** p<.001
R2 Change B SE β t
.191
.611
Participation in cluster activities/initiatives
The total revenue
Number of employees
Exports
Imports
Participation in cluster activities/initiatives
The total revenue
Number of employees
Exports
Imports - Challenge
F1: Changes in Market Conditions - Challenge
F2: Human Resource Capabilities - Challenge
F3: Market Penetration - Challenge
.036***
.373*** .337**
-1.243
-.439
-.036
.160
-.701
-.424
-.174
.176
.209
-.422
.255
.591
.304
.280
.144
.151
.113
.122
.227
.117
.122
.092
.099
.034
.032
.040
-.088***
-.071**
-.006
.039
-.156***
-.030
-.028
.028
.051*
-.094***
.162***
.372***
.159***
-4.441
-3.043
-.239
1.410
-5.749
-1.862
-1.487
1.443
2.275
-4.274
7.524
18.408
7.691

117Annexes
Table 18: Hierarchical multiple regression analysis for the training dimension Market Communication
R2RAREAS OF TRAINING
Step 1
Step 2
Statistical significance:* p<.05** p<.01*** p<.001
R2 Change B SE β t
.132
.494
Participation in cluster activities/initiatives
The total revenue
Number of employees
Exports
Imports
Participation in cluster activities/initiatives
The total revenue
Number of employees
Exports
Imports - Challenge
F1: Changes in Market Conditions - Challenge
F2: Human Resource Capabilities - Challenge
F3: Market Penetration - Challenge
.017***
.244*** .227**
-.201
-.239
-.323
.231
-.021
.007
-.076
-.175
.170
.075
.030
.055
.527
.180
.093
.097
.073
.078
.159
.082
.085
.064
.069
.024
.022
.028
-.022
-.061*
-.080**
.089**
-.007
.001
-.019
-.043*
.065**
.026
.030
.054*
. 433***
-1.117
-2.574
-3.331
3.173
-.266
.044
-.927
-2.055
2.648
1.092
1.261
2.446
19.036
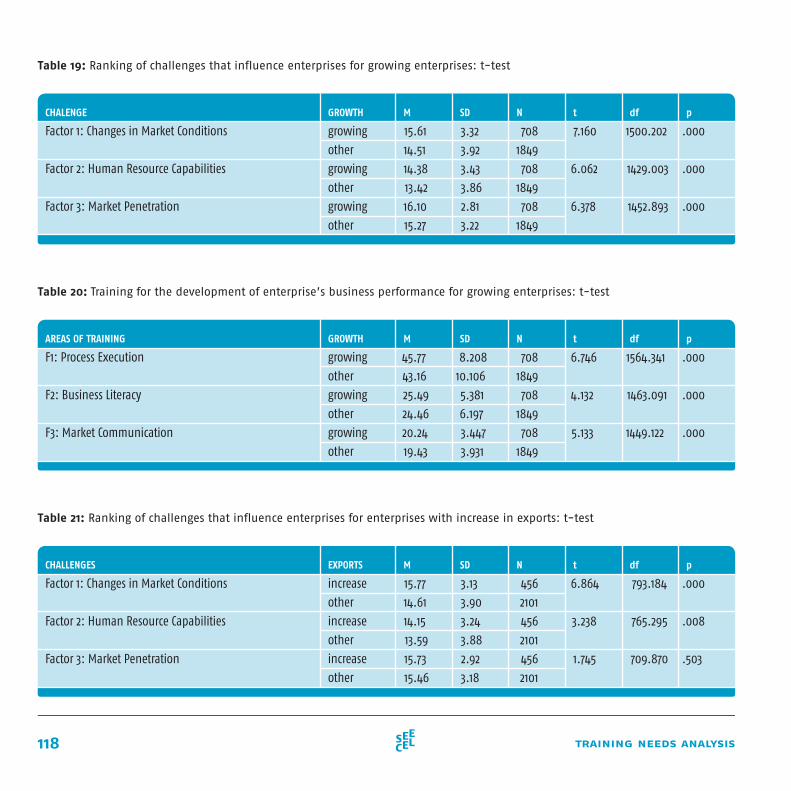
118 training needs analysis
Table 19: Ranking of challenges that influence enterprises for growing enterprises: t-test
Table 20: Training for the development of enterprise’s business performance for growing enterprises: t-test
M
M
M
GROWTH
GROWTH
EXPORTS
CHALENGE
AREAS OF TRAINING
CHALLENGES
SD
SD
SD
N
N
N
t
t
t
df
df
df
p
p
p
growing
other
growing
other
growing
other
growing
other
growing
other
growing
other
increase
other
increase
other
increase
other
Factor 1: Changes in Market Conditions
Factor 2: Human Resource Capabilities
Factor 3: Market Penetration
F1: Process Execution
F2: Business Literacy
F3: Market Communication
Factor 1: Changes in Market Conditions
Factor 2: Human Resource Capabilities
Factor 3: Market Penetration
15.61
14.51
14.38
13.42
16.10
15.27
45.77
43.16
25.49
24.46
20.24
19.43
15.77
14.61
14.15
13.59
15.73
15.46
3.32
3.92
3.43
3.86
2.81
3.22
8.208
10.106
5.381
6.197
3.447
3.931
3.13
3.90
3.24
3.88
2.92
3.18
708
1849
708
1849
708
1849
708
1849
708
1849
708
1849
456
2101
456
2101
456
2101
7.160
6.062
6.378
6.746
4.132
5.133
6.864
3.238
1.745
1500.202
1429.003
1452.893
1564.341
1463.091
1449.122
793.184
765.295
709.870
.000
.000
.000
.000
.000
.000
.000
.008
.503
Table 21: Ranking of challenges that influence enterprises for enterprises with increase in exports: t-test
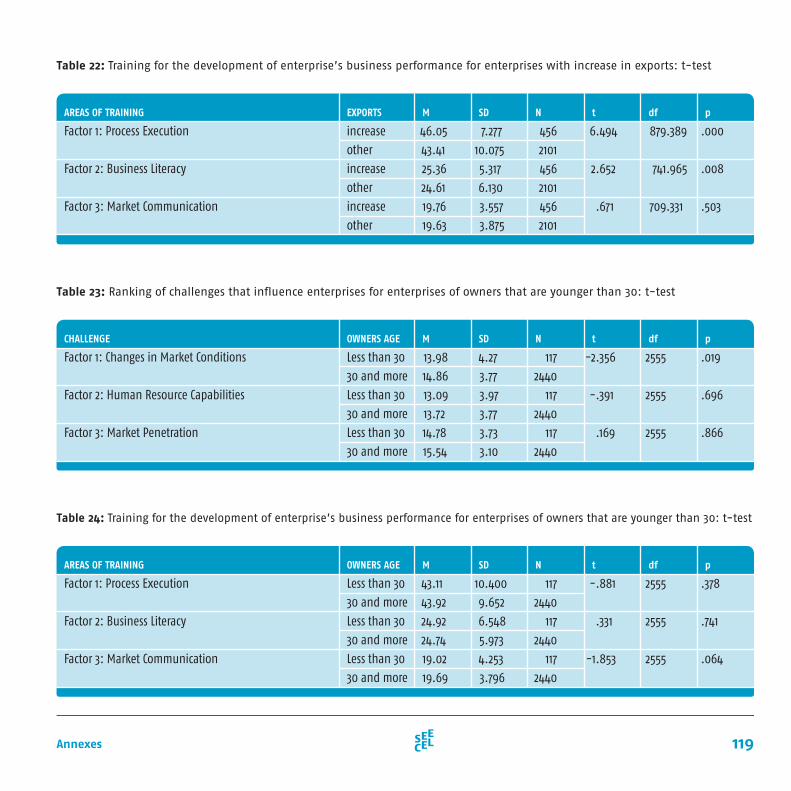
119Annexes
M
M
M
OWNERS AGE
EXPORTS
OWNERS AGE
CHALLENGE
AREAS OF TRAINING
AREAS OF TRAINING
SD
SD
SD
N
N
N
t
t
t
df
df
df
p
p
p
Less than 30
30 and more
Less than 30
30 and more
Less than 30
30 and more
increase
other
increase
other
increase
other
Less than 30
30 and more
Less than 30
30 and more
Less than 30
30 and more
Factor 1: Changes in Market Conditions
Factor 2: Human Resource Capabilities
Factor 3: Market Penetration
Factor 1: Process Execution
Factor 2: Business Literacy
Factor 3: Market Communication
Factor 1: Process Execution
Factor 2: Business Literacy
Factor 3: Market Communication
13.98
14.86
13.09
13.72
14.78
15.54
46.05
43.41
25.36
24.61
19.76
19.63
43.11
43.92
24.92
24.74
19.02
19.69
4.27
3.77
3.97
3.77
3.73
3.10
7.277
10.075
5.317
6.130
3.557
3.875
10.400
9.652
6.548
5.973
4.253
3.796
117
2440
117
2440
117
2440
456
2101
456
2101
456
2101
117
2440
117
2440
117
2440
-2.356
-.391
.169
6.494
2.652
.671
-.881
.331
-1.853
2555
2555
2555
879.389
741.965
709.331
2555
2555
2555
.019
.696
.866
.000
.008
.503
.378
.741
.064
Table 22: Training for the development of enterprise’s business performance for enterprises with increase in exports: t-test
Table 23: Ranking of challenges that influence enterprises for enterprises of owners that are younger than 30: t-test
Table 24: Training for the development of enterprise’s business performance for enterprises of owners that are younger than 30: t-test
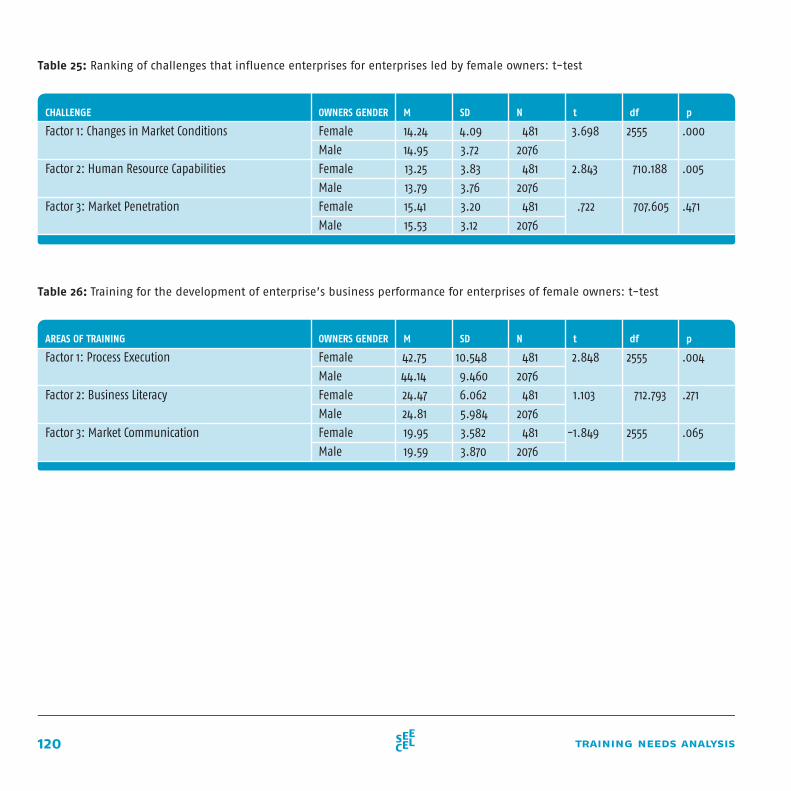
120 training needs analysis
Table 25: Ranking of challenges that influence enterprises for enterprises led by female owners: t-test
Table 26: Training for the development of enterprise’s business performance for enterprises of female owners: t-test
M
M
OWNERS GENDER
OWNERS GENDER
CHALLENGE
AREAS OF TRAINING
SD
SD
N
N
t
t
df
df
p
p
Female
Male
Female
Male
Female
Male
Female
Male
Female
Male
Female
Male
Factor 1: Changes in Market Conditions
Factor 2: Human Resource Capabilities
Factor 3: Market Penetration
Factor 1: Process Execution
Factor 2: Business Literacy
Factor 3: Market Communication
14.24
14.95
13.25
13.79
15.41
15.53
42.75
44.14
24.47
24.81
19.95
19.59
4.09
3.72
3.83
3.76
3.20
3.12
10.548
9.460
6.062
5.984
3.582
3.870
481
2076
481
2076
481
2076
481
2076
481
2076
481
2076
3.698
2.843
.722
2.848
1.103
-1.849
2555
710.188
707.605
2555
712.793
2555
.000
.005
.471
.004
.271
.065
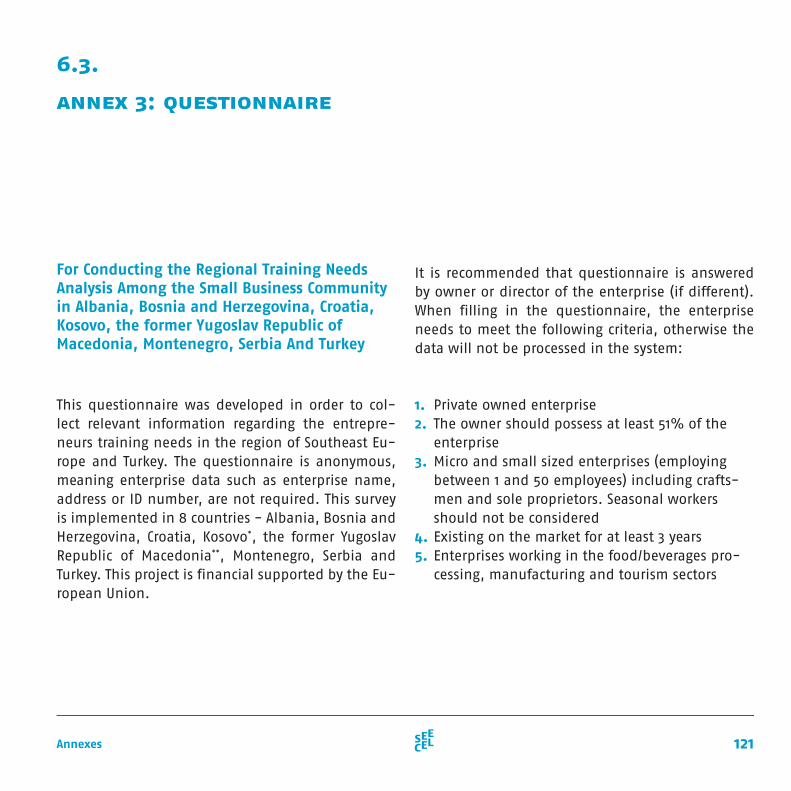
121Annexes
6.3.
annex 3: questionnaire
This questionnaire was developed in order to col-lect relevant information regarding the entrepre-neurs training needs in the region of Southeast Eu-rope and Turkey. The questionnaire is anonymous, meaning enterprise data such as enterprise name, address or ID number, are not required. This survey is implemented in 8 countries - Albania, Bosnia and Herzegovina, Croatia, Kosovo*, the former Yugoslav Republic of Macedonia**, Montenegro, Serbia and Turkey. This project is financial supported by the Eu-ropean Union.
It is recommended that questionnaire is answered by owner or director of the enterprise (if different). When filling in the questionnaire, the enterprise needs to meet the following criteria, otherwise the data will not be processed in the system:
1. Private owned enterprise 2. The owner should possess at least 51% of the
enterprise 3. Micro and small sized enterprises (employing
between 1 and 50 employees) including crafts-men and sole proprietors. Seasonal workers should not be considered
4. Existing on the market for at least 3 years 5. Enterprises working in the food/beverages pro-
cessing, manufacturing and tourism sectors
For Conducting the Regional Training Needs Analysis Among the Small Business Community in Albania, Bosnia and Herzegovina, Croatia, Kosovo, the former Yugoslav Republic of Macedonia, Montenegro, Serbia And Turkey
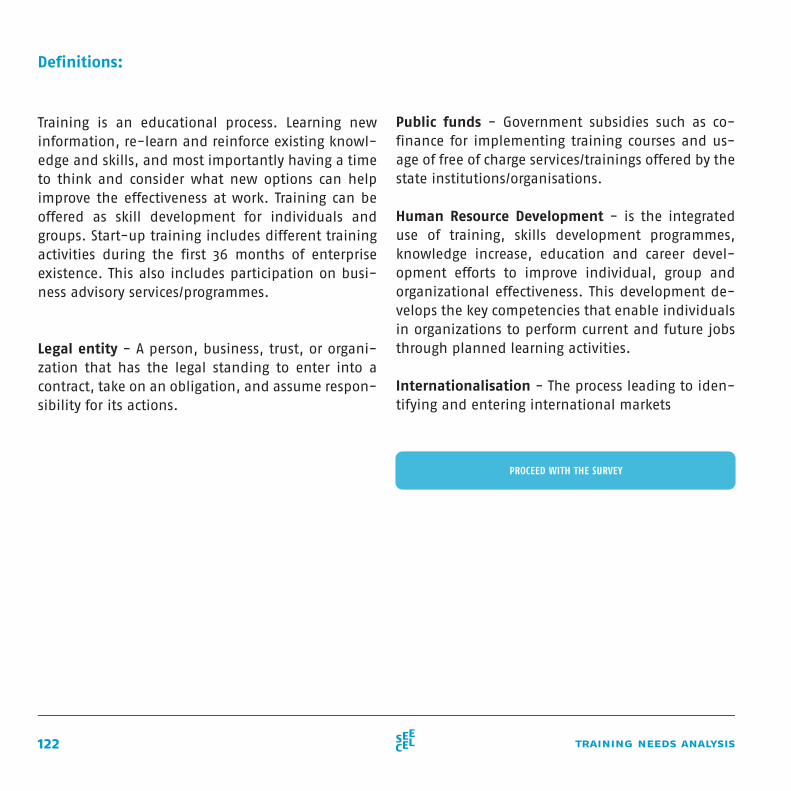
122 training needs analysis
Definitions:
Training is an educational process. Learning new information, re-learn and reinforce existing knowl-edge and skills, and most importantly having a time to think and consider what new options can help improve the effectiveness at work. Training can be offered as skill development for individuals and groups. Start-up training includes different training activities during the first 36 months of enterprise existence. This also includes participation on busi-ness advisory services/programmes.
Legal entity - A person, business, trust, or organi-zation that has the legal standing to enter into a contract, take on an obligation, and assume respon-sibility for its actions.
Public funds - Government subsidies such as co-finance for implementing training courses and us-age of free of charge services/trainings offered by the state institutions/organisations.
Human Resource Development - is the integrated use of training, skills development programmes, knowledge increase, education and career devel-opment efforts to improve individual, group and organizational effectiveness. This development de-velops the key competencies that enable individuals in organizations to perform current and future jobs through planned learning activities.
Internationalisation - The process leading to iden-tifying and entering international markets
PROCEED WITH THE SURVEY
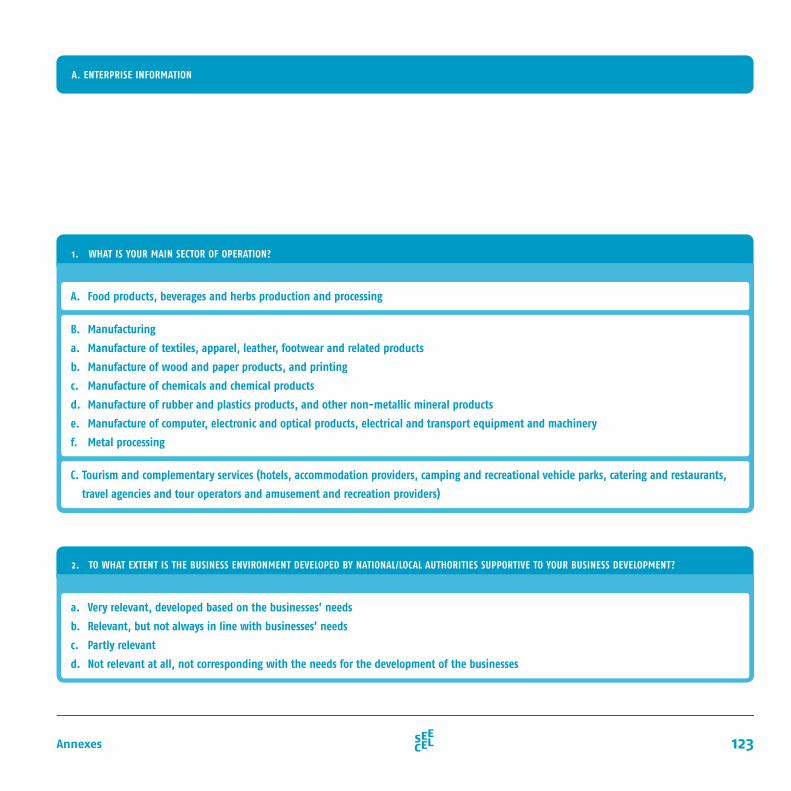
123Annexes
1. WHAT IS YOUR MAIN SECTOR OF OPERATION?
2. TO WHAT EXTENT IS THE BUSINESS ENVIRONMENT DEVELOPED BY NATIONAL/LOCAL AUTHORITIES SUPPORTIVE TO YOUR BUSINESS DEVELOPMENT?
A. Food products, beverages and herbs production and processing
a. Very relevant, developed based on the businesses’ needs
b. Relevant, but not always in line with businesses’ needs
c. Partly relevant
d. Not relevant at all, not corresponding with the needs for the development of the businesses
B. Manufacturing
a. Manufacture of textiles, apparel, leather, footwear and related products
b. Manufacture of wood and paper products, and printing
c. Manufacture of chemicals and chemical products
d. Manufacture of rubber and plastics products, and other non-metallic mineral products
e. Manufacture of computer, electronic and optical products, electrical and transport equipment and machinery
f. Metal processing
C. Tourism and complementary services (hotels, accommodation providers, camping and recreational vehicle parks, catering and restaurants,
travel agencies and tour operators and amusement and recreation providers)
A. ENTERPRISE INFORMATION
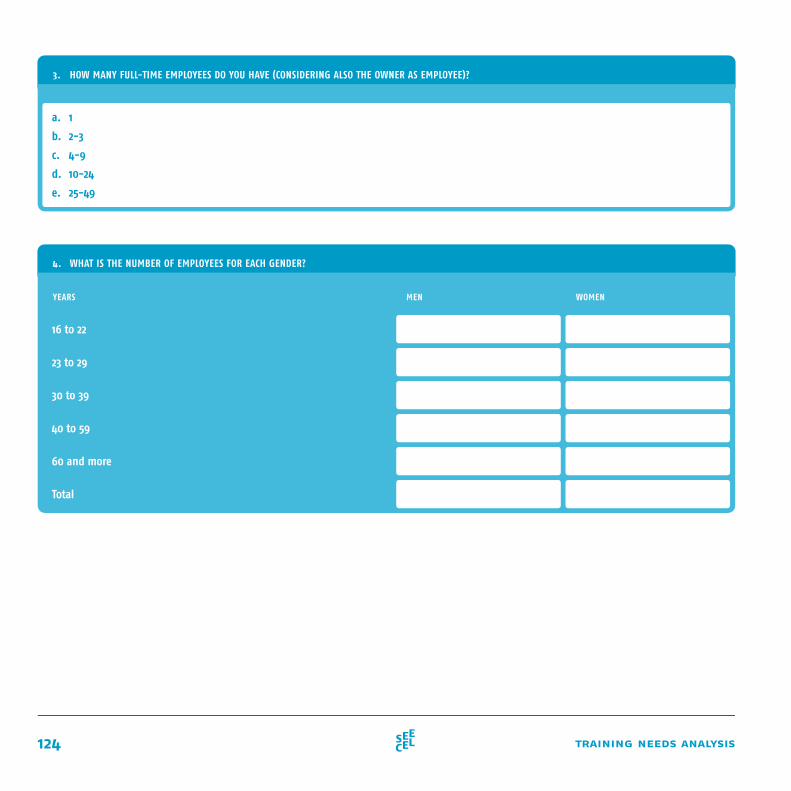
124 training needs analysis
3. HOW MANY FULL-TIME EMPLOYEES DO YOU HAVE (CONSIDERING ALSO THE OWNER AS EMPLOYEE)?
4. WHAT IS THE NUMBER OF EMPLOYEES FOR EACH GENDER?
a. 1
b. 2-3
c. 4-9
d. 10-24
e. 25-49
16 to 22
23 to 29
30 to 39
40 to 59
60 and more
Total
YEARS MEN WOMEN
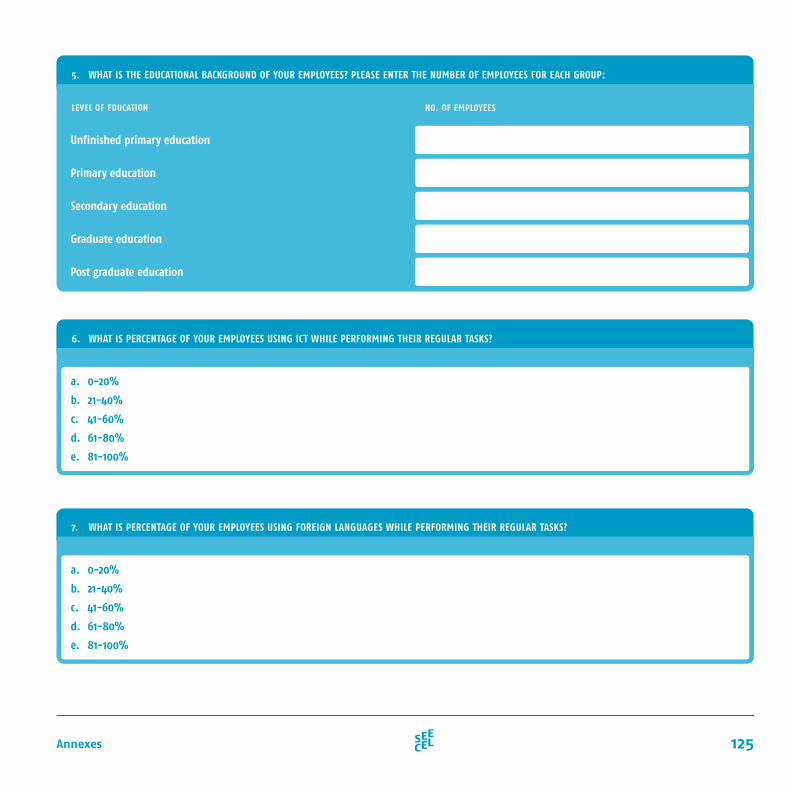
125Annexes
6. WHAT IS PERCENTAGE OF YOUR EMPLOYEES USING ICT WHILE PERFORMING THEIR REGULAR TASKS?
7. WHAT IS PERCENTAGE OF YOUR EMPLOYEES USING FOREIGN LANGUAGES WHILE PERFORMING THEIR REGULAR TASKS?
5. WHAT IS THE EDUCATIONAL BACKGROUND OF YOUR EMPLOYEES? PLEASE ENTER THE NUMBER OF EMPLOYEES FOR EACH GROUP:
a. 0-20%
b. 21-40%
c. 41-60%
d. 61-80%
e. 81-100%
a. 0-20%
b. 21-40%
c. 41-60%
d. 61-80%
e. 81-100%
Unfinished primary education
Primary education
Secondary education
Graduate education
Post graduate education
LEVEL OF EDUCATION NO. OF EMPLOYEES
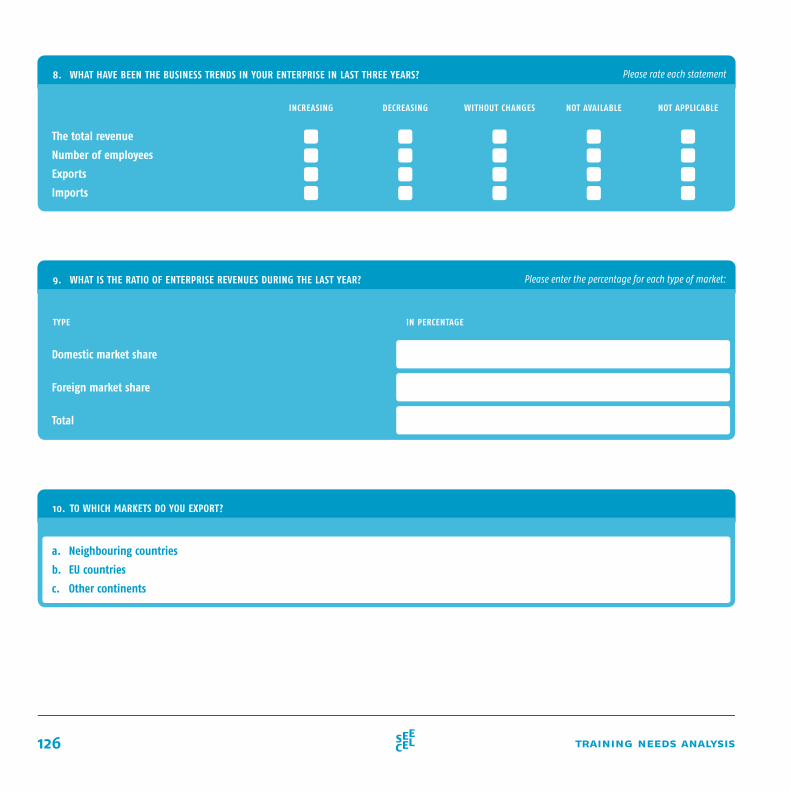
126 training needs analysis
8. WHAT HAVE BEEN THE BUSINESS TRENDS IN YOUR ENTERPRISE IN LAST THREE YEARS?
The total revenue
Number of employees
Exports
Imports
INCREASING DECREASING WITHOUT CHANGES NOT AVAILABLE NOT APPLICABLE
Please rate each statement
9. WHAT IS THE RATIO OF ENTERPRISE REVENUES DURING THE LAST YEAR?
Domestic market share
Foreign market share
Total
TYPE IN PERCENTAGE
Please enter the percentage for each type of market:
10. TO WHICH MARKETS DO YOU EXPORT?
a. Neighbouring countries
b. EU countries
c. Other continents
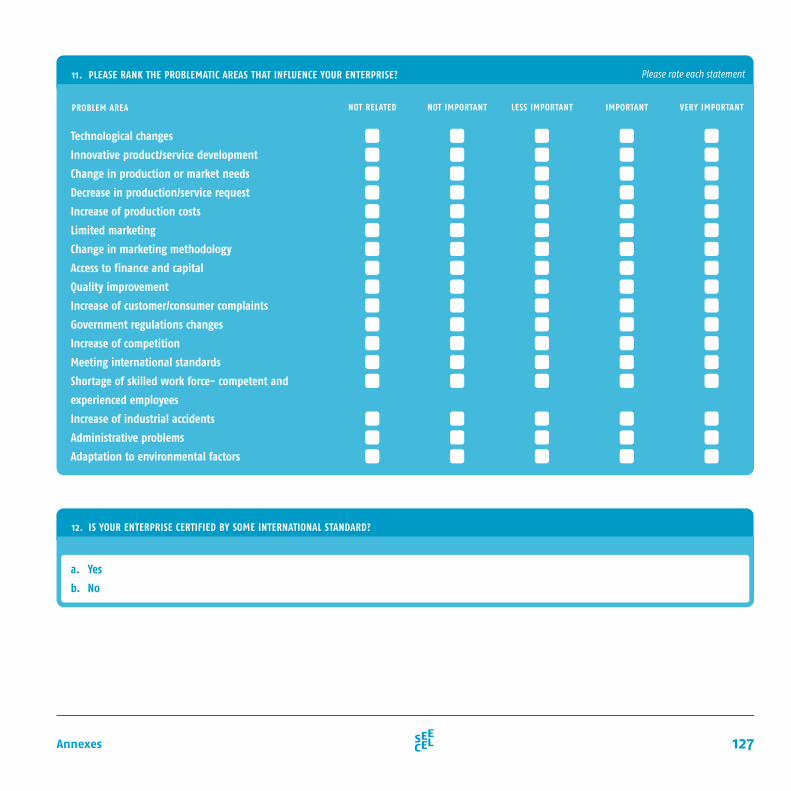
127Annexes
11. PLEASE RANK THE PROBLEMATIC AREAS THAT INFLUENCE YOUR ENTERPRISE?
NOT RELATED NOT IMPORTANT LESS IMPORTANT IMPORTANT VERY IMPORTANT
Technological changes
Innovative product/service development
Change in production or market needs
Decrease in production/service request
Increase of production costs
Limited marketing
Change in marketing methodology
Access to finance and capital
Quality improvement
Increase of customer/consumer complaints
Government regulations changes
Increase of competition
Meeting international standards
Shortage of skilled work force- competent and
experienced employees
Increase of industrial accidents
Administrative problems
Adaptation to environmental factors
PROBLEM AREA
Please rate each statement
12. IS YOUR ENTERPRISE CERTIFIED BY SOME INTERNATIONAL STANDARD?
a. Yes
b. No
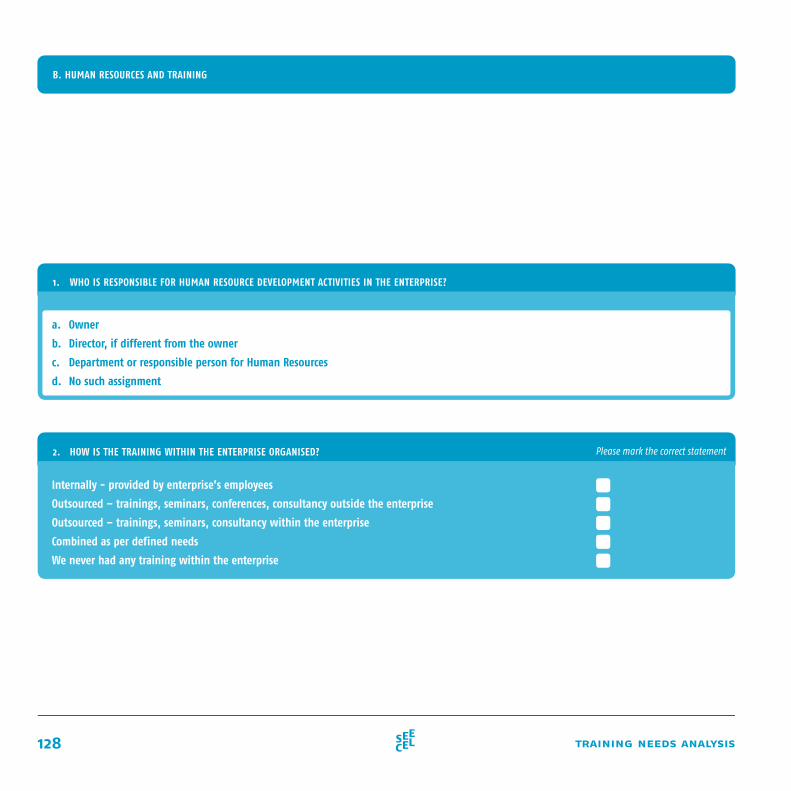
128 training needs analysis
B. HUMAN RESOURCES AND TRAINING
1. WHO IS RESPONSIBLE FOR HUMAN RESOURCE DEVELOPMENT ACTIVITIES IN THE ENTERPRISE?
a. Owner
b. Director, if different from the owner
c. Department or responsible person for Human Resources
d. No such assignment
2. HOW IS THE TRAINING WITHIN THE ENTERPRISE ORGANISED?
Internally - provided by enterprise’s employees
Outsourced – trainings, seminars, conferences, consultancy outside the enterprise
Outsourced – trainings, seminars, consultancy within the enterprise
Combined as per defined needs
We never had any training within the enterprise
Please mark the correct statement
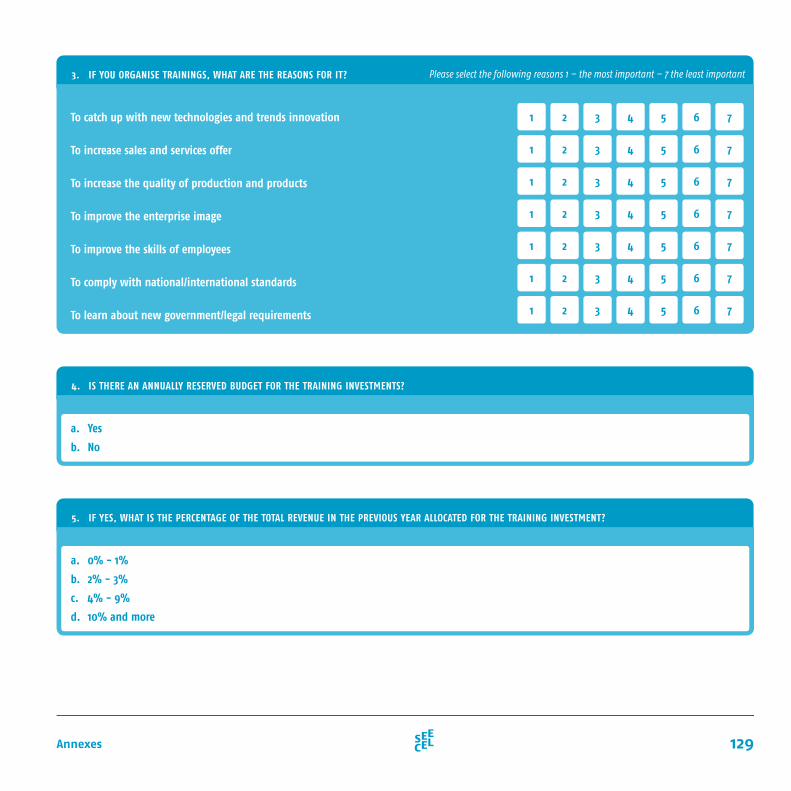
129Annexes
4. IS THERE AN ANNUALLY RESERVED BUDGET FOR THE TRAINING INVESTMENTS?
5. IF YES, WHAT IS THE PERCENTAGE OF THE TOTAL REVENUE IN THE PREVIOUS YEAR ALLOCATED FOR THE TRAINING INVESTMENT?
a. Yes
b. No
a. 0% - 1%
b. 2% - 3%
c. 4% - 9%
d. 10% and more
3. IF YOU ORGANISE TRAININGS, WHAT ARE THE REASONS FOR IT?
To catch up with new technologies and trends innovation
To increase sales and services offer
To increase the quality of production and products
To improve the enterprise image
To improve the skills of employees
To comply with national/international standards
To learn about new government/legal requirements
Please select the following reasons 1 – the most important – 7 the least important
1 2 3 4 5 6 7
1 2 3 4 5 6 7
1 2 3 4 5 6 7
1 2 3 4 5 6 7
1 2 3 4 5 6 7
1 2 3 4 5 6 7
1 2 3 4 5 6 7
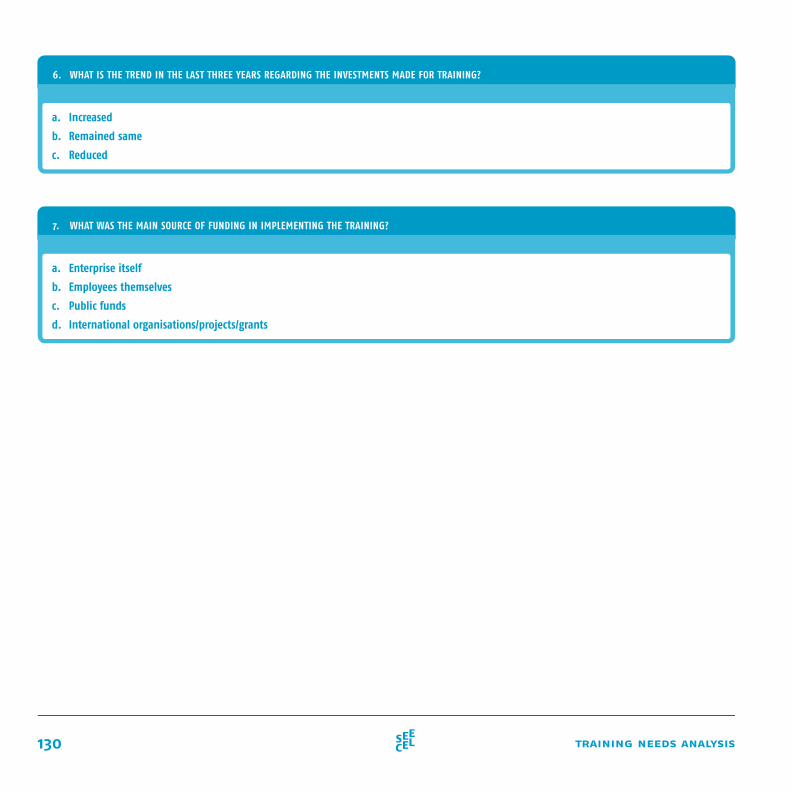
130 training needs analysis
6. WHAT IS THE TREND IN THE LAST THREE YEARS REGARDING THE INVESTMENTS MADE FOR TRAINING?
7. WHAT WAS THE MAIN SOURCE OF FUNDING IN IMPLEMENTING THE TRAINING?
a. Increased
b. Remained same
c. Reduced
a. Enterprise itself
b. Employees themselves
c. Public funds
d. International organisations/projects/grants

131Annexes
9. PLEASE RATE THE IMPORTANCE OF THE FOLLOWING TRAINING TOPICS?
Market trends
Marketing and sales
Internationalisation
Financial management and accounting
Principles of management
Product/Service development
Innovation and Intellectual property rights
Information and Communication Technology
Government incentive schemes and new legislation
Communication and foreign languages
Quality management and standards
Human resources management
Strategic planning and organization
Efficient use of energy
Clustering and supply chain development
OTHERS EMPLOYEESOWNERS & MANAGERS
TRAINING TOPICS NOT
APP
LICA
BLE
NOT
IM
PORT
ANT
LESS
IM
PORT
ANT
IMPO
RTAN
T
VERY
IM
PORT
ANT
NOT
APP
LICA
BLE
NOT
IM
PORT
ANT
LESS
IM
PORT
ANT
IMPO
RTAN
T
VERY
IM
PORT
ANT
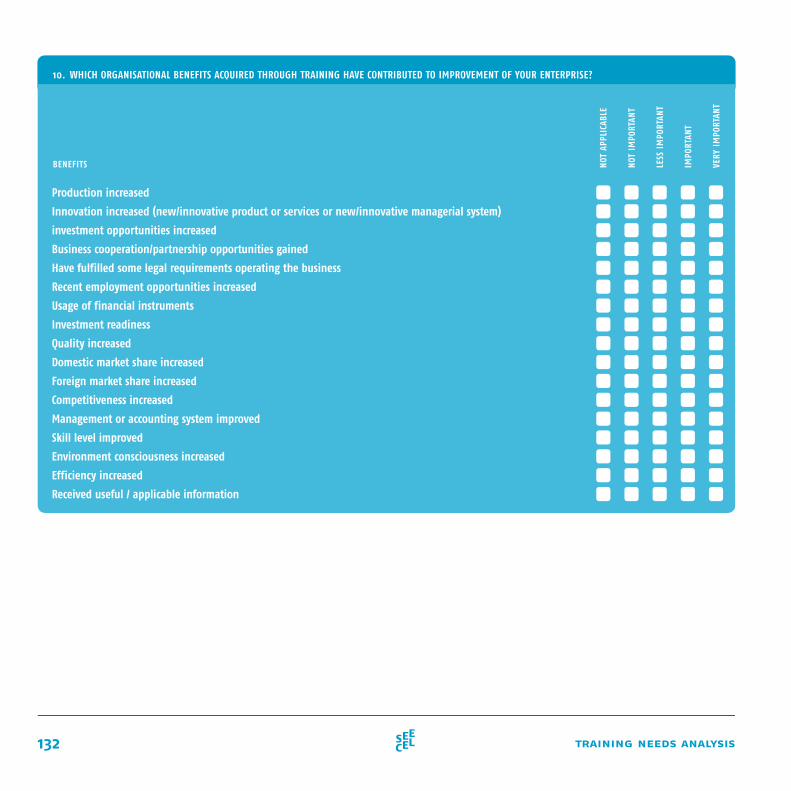
132 training needs analysis
10. WHICH ORGANISATIONAL BENEFITS ACQUIRED THROUGH TRAINING HAVE CONTRIBUTED TO IMPROVEMENT OF YOUR ENTERPRISE?
Production increased
Innovation increased (new/innovative product or services or new/innovative managerial system)
investment opportunities increased
Business cooperation/partnership opportunities gained
Have fulfilled some legal requirements operating the business
Recent employment opportunities increased
Usage of financial instruments
Investment readiness
Quality increased
Domestic market share increased
Foreign market share increased
Competitiveness increased
Management or accounting system improved
Skill level improved
Environment consciousness increased
Efficiency increased
Received useful / applicable information
BENEFITS NOT
APP
LICA
BLE
NOT
IM
PORT
ANT
LESS
IM
PORT
ANT
IMPO
RTAN
T
VERY
IM
PORT
ANT
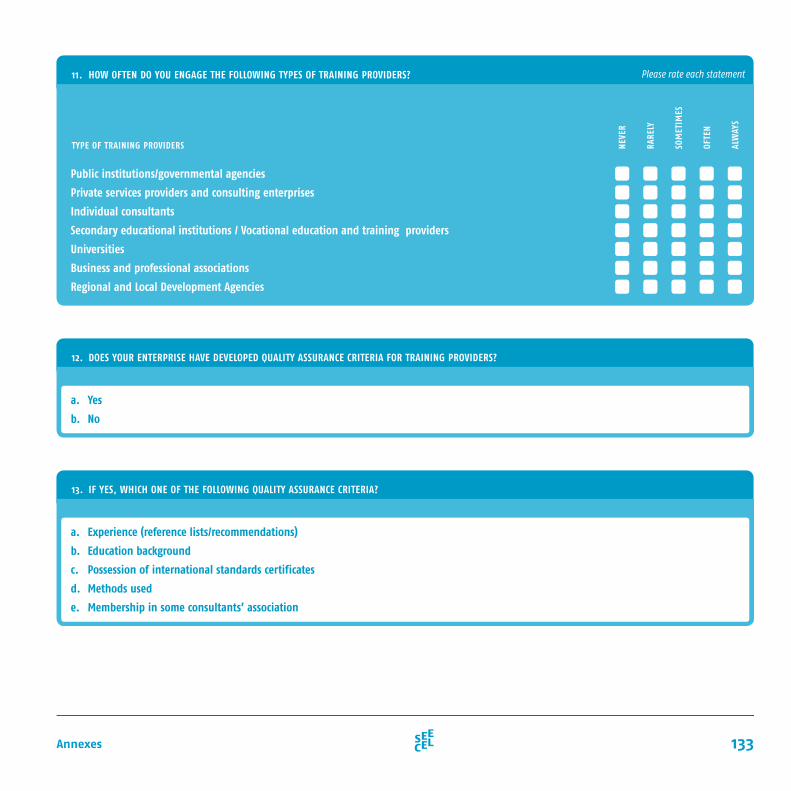
133Annexes
11. HOW OFTEN DO YOU ENGAGE THE FOLLOWING TYPES OF TRAINING PROVIDERS?
Public institutions/governmental agencies
Private services providers and consulting enterprises
Individual consultants
Secondary educational institutions / Vocational education and training providers
Universities
Business and professional associations
Regional and Local Development Agencies
TYPE OF TRAINING PROVIDERS NEV
ER
RARE
LY
SOM
ETIM
ES
OFTE
N
ALW
AYS
Please rate each statement
13. IF YES, WHICH ONE OF THE FOLLOWING QUALITY ASSURANCE CRITERIA?
a. Experience (reference lists/recommendations)
b. Education background
c. Possession of international standards certificates
d. Methods used
e. Membership in some consultants’ association
12. DOES YOUR ENTERPRISE HAVE DEVELOPED QUALITY ASSURANCE CRITERIA FOR TRAINING PROVIDERS?
a. Yes
b. No
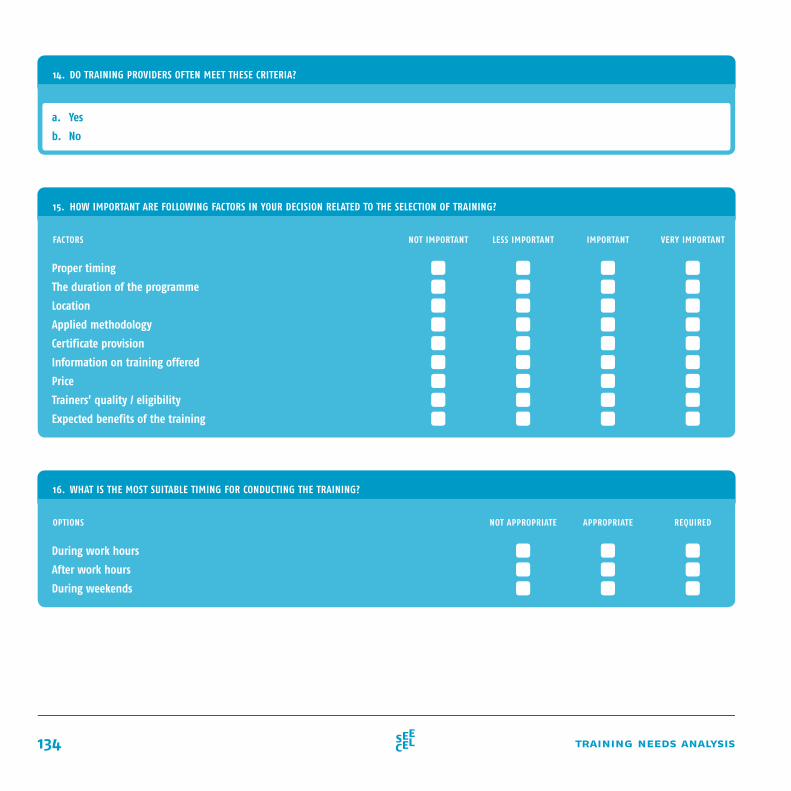
134 training needs analysis
14. DO TRAINING PROVIDERS OFTEN MEET THESE CRITERIA?
a. Yes
b. No
15. HOW IMPORTANT ARE FOLLOWING FACTORS IN YOUR DECISION RELATED TO THE SELECTION OF TRAINING?
16. WHAT IS THE MOST SUITABLE TIMING FOR CONDUCTING THE TRAINING?
Proper timing
The duration of the programme
Location
Applied methodology
Certificate provision
Information on training offered
Price
Trainers’ quality / eligibility
Expected benefits of the training
During work hours
After work hours
During weekends
FACTORS
OPTIONS
NOT IMPORTANT LESS IMPORTANT
NOT APPROPRIATE
IMPORTANT
APPROPRIATE
VERY IMPORTANT
REQUIRED
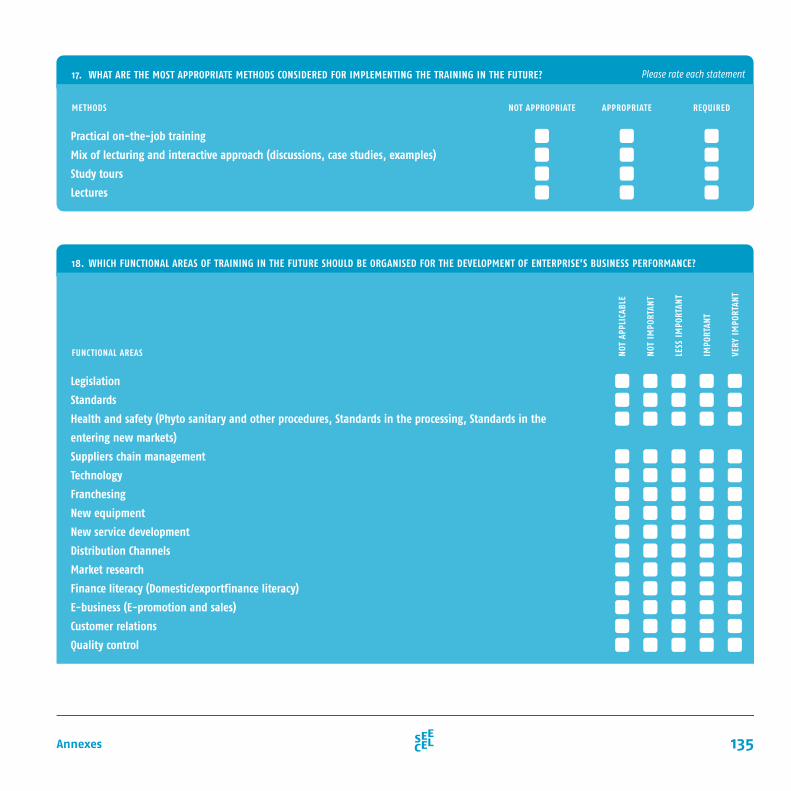
135Annexes
17. WHAT ARE THE MOST APPROPRIATE METHODS CONSIDERED FOR IMPLEMENTING THE TRAINING IN THE FUTURE?
Practical on-the-job training
Mix of lecturing and interactive approach (discussions, case studies, examples)
Study tours
Lectures
METHODS NOT APPROPRIATE APPROPRIATE REQUIRED
Please rate each statement
18. WHICH FUNCTIONAL AREAS OF TRAINING IN THE FUTURE SHOULD BE ORGANISED FOR THE DEVELOPMENT OF ENTERPRISE’S BUSINESS PERFORMANCE?
Legislation
Standards
Health and safety (Phyto sanitary and other procedures, Standards in the processing, Standards in the
entering new markets)
Suppliers chain management
Technology
Franchesing
New equipment
New service development
Distribution Channels
Market research
Finance literacy (Domestic/exportfinance literacy)
E-business (E-promotion and sales)
Customer relations
Quality control
FUNCTIONAL AREAS NOT
APP
LICA
BLE
NOT
IM
PORT
ANT
LESS
IM
PORT
ANT
IMPO
RTAN
T
VERY
IM
PORT
ANT
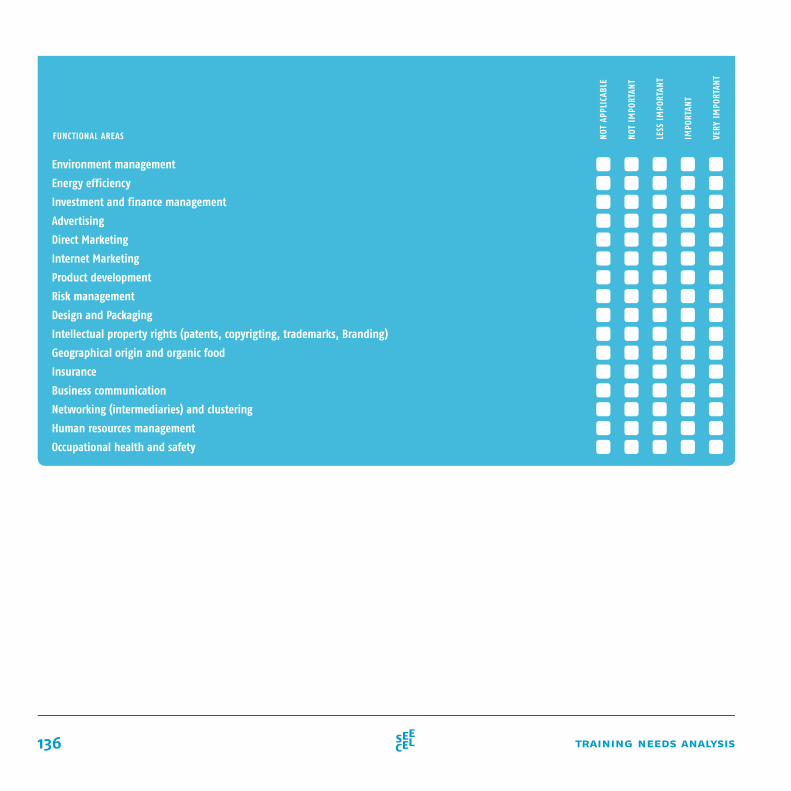
136 training needs analysis
Environment management
Energy efficiency
Investment and finance management
Advertising
Direct Marketing
Internet Marketing
Product development
Risk management
Design and Packaging
Intellectual property rights (patents, copyrigting, trademarks, Branding)
Geographical origin and organic food
Insurance
Business communication
Networking (intermediaries) and clustering
Human resources management
Occupational health and safety
FUNCTIONAL AREAS NOT
APP
LICA
BLE
NOT
IM
PORT
ANT
LESS
IM
PORT
ANT
IMPO
RTAN
T
VERY
IM
PORT
ANT
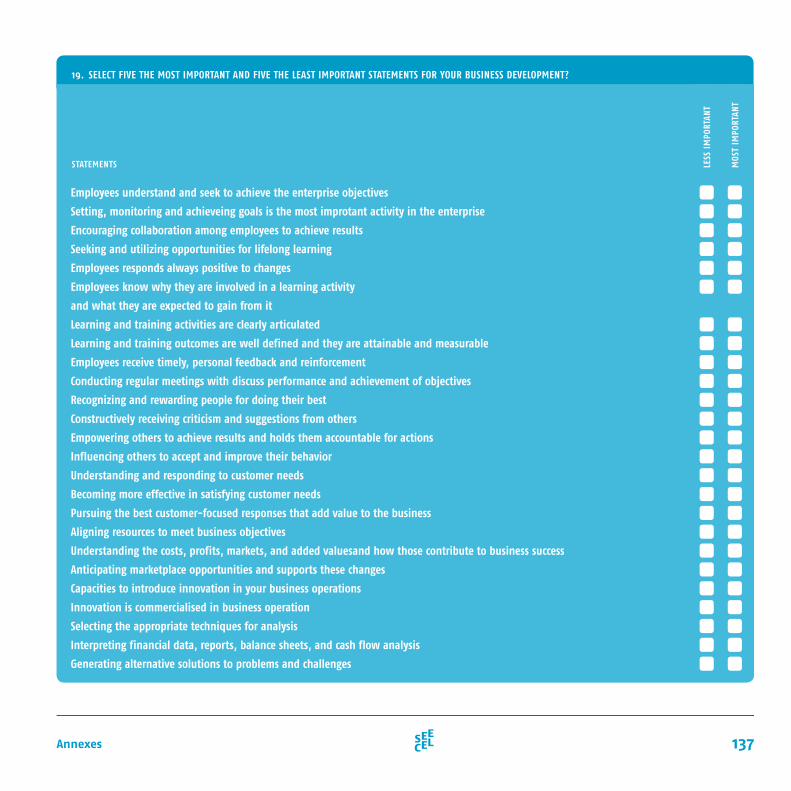
137Annexes
19. SELECT FIVE THE MOST IMPORTANT AND FIVE THE LEAST IMPORTANT STATEMENTS FOR YOUR BUSINESS DEVELOPMENT?
Employees understand and seek to achieve the enterprise objectives
Setting, monitoring and achieveing goals is the most improtant activity in the enterprise
Encouraging collaboration among employees to achieve results
Seeking and utilizing opportunities for lifelong learning
Employees responds always positive to changes
Employees know why they are involved in a learning activity
and what they are expected to gain from it
Learning and training activities are clearly articulated
Learning and training outcomes are well defined and they are attainable and measurable
Employees receive timely, personal feedback and reinforcement
Conducting regular meetings with discuss performance and achievement of objectives
Recognizing and rewarding people for doing their best
Constructively receiving criticism and suggestions from others
Empowering others to achieve results and holds them accountable for actions
Influencing others to accept and improve their behavior
Understanding and responding to customer needs
Becoming more effective in satisfying customer needs
Pursuing the best customer-focused responses that add value to the business
Aligning resources to meet business objectives
Understanding the costs, profits, markets, and added valuesand how those contribute to business success
Anticipating marketplace opportunities and supports these changes
Capacities to introduce innovation in your business operations
Innovation is commercialised in business operation
Selecting the appropriate techniques for analysis
Interpreting financial data, reports, balance sheets, and cash flow analysis
Generating alternative solutions to problems and challenges
STATEMENTS LESS
IM
PORT
ANT
MOS
T IM
PORT
ANT
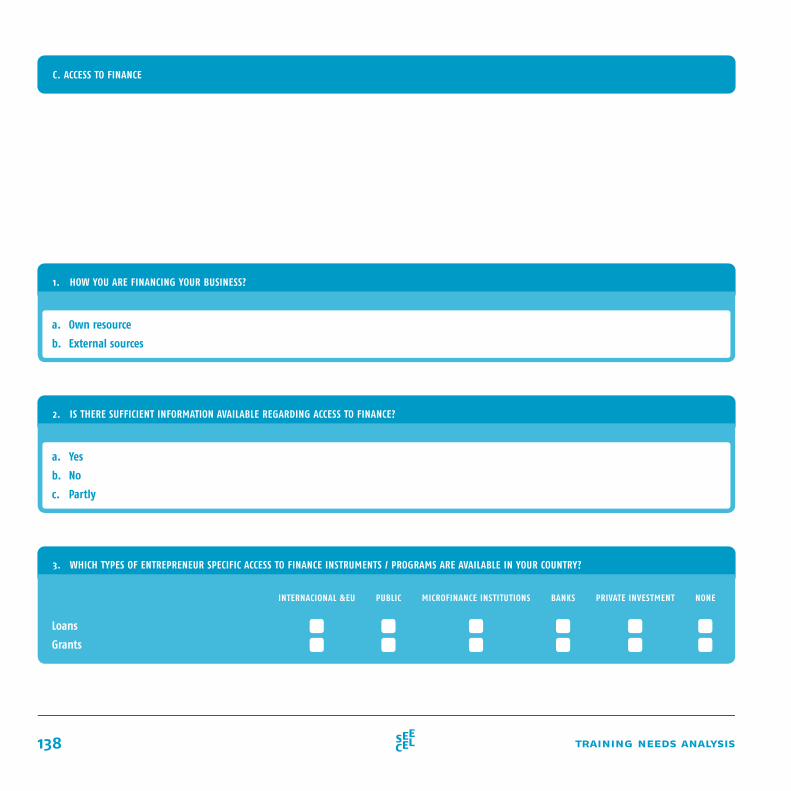
138 training needs analysis
C. ACCESS TO FINANCE
1. HOW YOU ARE FINANCING YOUR BUSINESS?
2. IS THERE SUFFICIENT INFORMATION AVAILABLE REGARDING ACCESS TO FINANCE?
a. Own resource
b. External sources
a. Yes
b. No
c. Partly
3. WHICH TYPES OF ENTREPRENEUR SPECIFIC ACCESS TO FINANCE INSTRUMENTS / PROGRAMS ARE AVAILABLE IN YOUR COUNTRY?
Loans
Grants
INTERNACIONAL &EU PUBLIC MICROFINANCE INSTITUTIONS BANKS PRIVATE INVESTMENT NONE
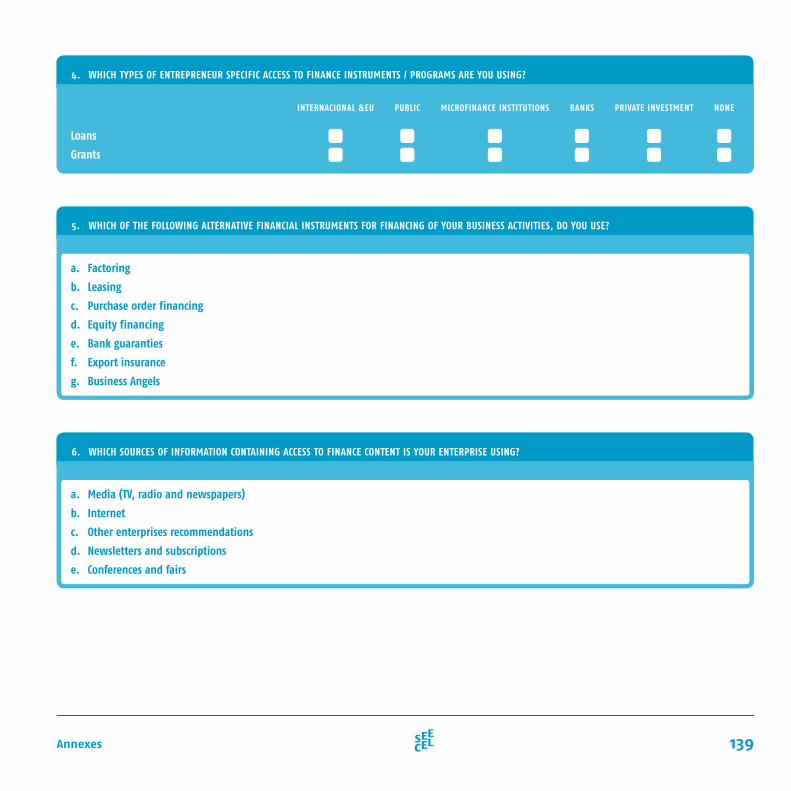
139Annexes
4. WHICH TYPES OF ENTREPRENEUR SPECIFIC ACCESS TO FINANCE INSTRUMENTS / PROGRAMS ARE YOU USING?
Loans
Grants
INTERNACIONAL &EU PUBLIC MICROFINANCE INSTITUTIONS BANKS PRIVATE INVESTMENT NONE
5. WHICH OF THE FOLLOWING ALTERNATIVE FINANCIAL INSTRUMENTS FOR FINANCING OF YOUR BUSINESS ACTIVITIES, DO YOU USE?
6. WHICH SOURCES OF INFORMATION CONTAINING ACCESS TO FINANCE CONTENT IS YOUR ENTERPRISE USING?
a. Factoring
b. Leasing
c. Purchase order financing
d. Equity financing
e. Bank guaranties
f. Export insurance
g. Business Angels
a. Media (TV, radio and newspapers)
b. Internet
c. Other enterprises recommendations
d. Newsletters and subscriptions
e. Conferences and fairs
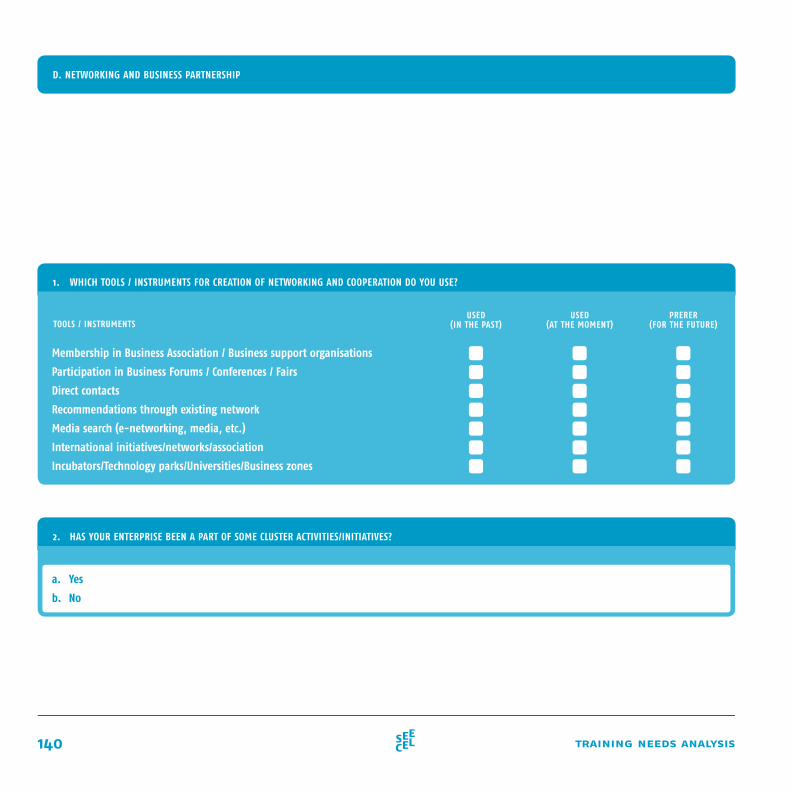
140 training needs analysis
1. WHICH TOOLS / INSTRUMENTS FOR CREATION OF NETWORKING AND COOPERATION DO YOU USE?
Membership in Business Association / Business support organisations
Participation in Business Forums / Conferences / Fairs
Direct contacts
Recommendations through existing network
Media search (e-networking, media, etc.)
International initiatives/networks/association
Incubators/Technology parks/Universities/Business zones
USED(IN THE PAST)TOOLS / INSTRUMENTS
USED(AT THE MOMENT)
PRERER(FOR THE FUTURE)
D. NETWORKING AND BUSINESS PARTNERSHIP
2. HAS YOUR ENTERPRISE BEEN A PART OF SOME CLUSTER ACTIVITIES/INITIATIVES?
a. Yes
b. No
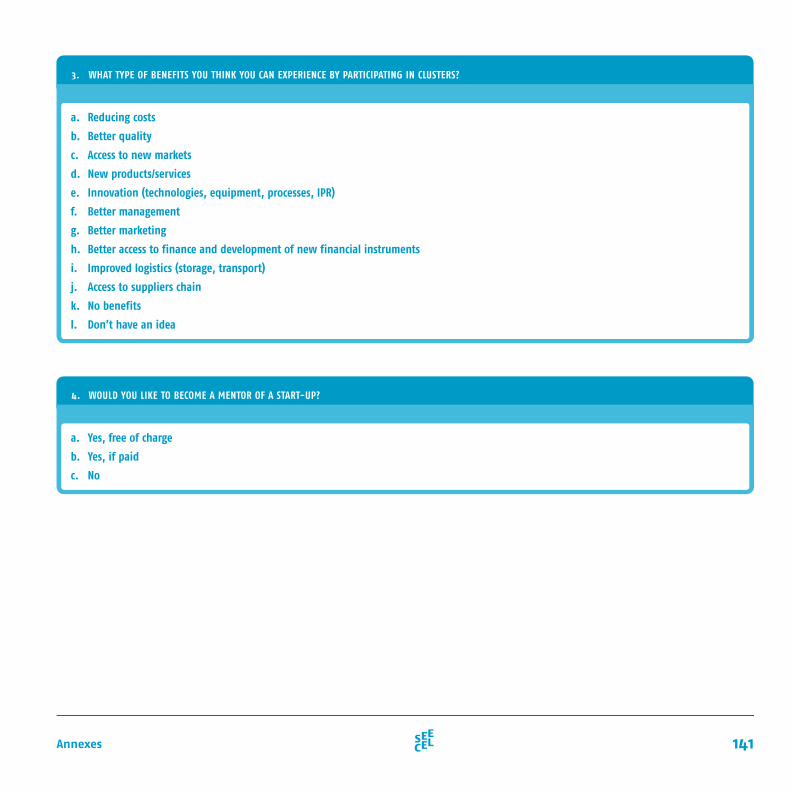
141Annexes
3. WHAT TYPE OF BENEFITS YOU THINK YOU CAN EXPERIENCE BY PARTICIPATING IN CLUSTERS?
4. WOULD YOU LIKE TO BECOME A MENTOR OF A START-UP?
a. Reducing costs
b. Better quality
c. Access to new markets
d. New products/services
e. Innovation (technologies, equipment, processes, IPR)
f. Better management
g. Better marketing
h. Better access to finance and development of new financial instruments
i. Improved logistics (storage, transport)
j. Access to suppliers chain
k. No benefits
l. Don’t have an idea
a. Yes, free of charge
b. Yes, if paid
c. No
142 training needs analysis
1. WHAT IS THE ENTERPRISE OWNER’S AGE?
2. WHAT IS THE OWNER’S GENDER?
a. up to 24;
b. 25 - 29;
c. 30 - 34;
d. 35 - 39;
e. 40 - 49;
f. 50 - 59;
g. 60 and more
a. Male
b. Female
3. HOW DID THE OWNER START THE BUSINESS?
a. Alone
b. With a business partner (family member, friend, relative & others)
c. Other legal entity invested in your business
143Annexes
4. WHEN DID THE OWNER START-UP THE BUSINESS?
a. 3 years ago
b. 4 – 6 years ago
c. 7 – 9 years ago
d. 10 to 14
e. 15 to 20
f. More than 20
6. WHAT IS THE OWNER’S EDUCATIONAL BACKGROUND?
a. Primary education
b. Secondary education a. Vocational technical studies b. general studies
c. Graduate education a. Economic studies b. non-economic studies
d. Post-graduate education a. Economic studies b. non-economic studies
5. HAS THE OWNER PARTICIPATED IN ANY START-UP TRAINING ?
Yes
No
BEFORE ESTABLISHING
DURING THE FIRST YEAR
DURING THE FIRST TWO YEARS
DURING THE FIRST THREE YEARS
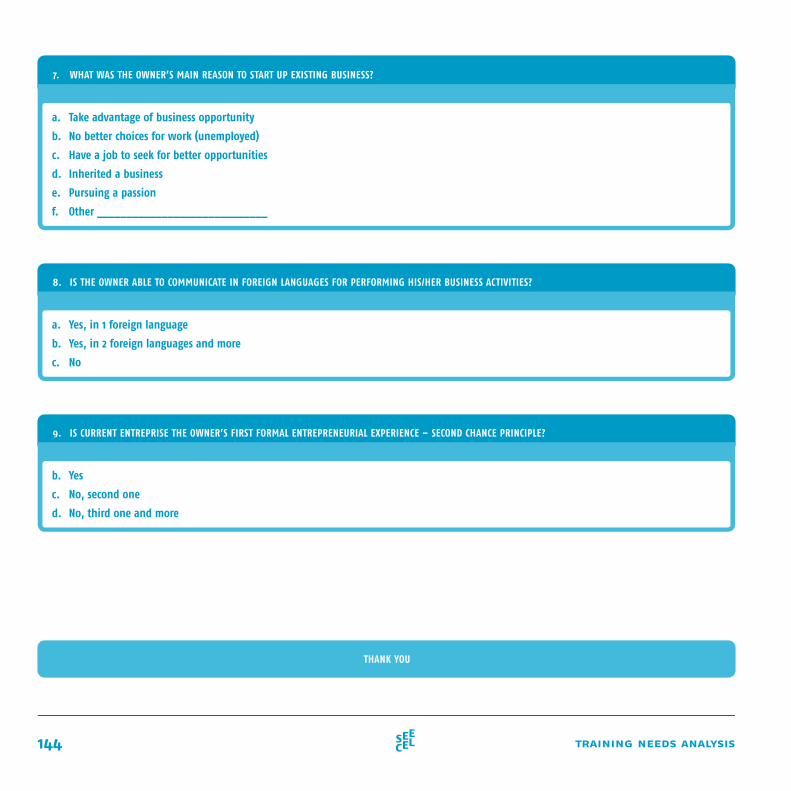
144 training needs analysis
7. WHAT WAS THE OWNER’S MAIN REASON TO START UP EXISTING BUSINESS?
8. IS THE OWNER ABLE TO COMMUNICATE IN FOREIGN LANGUAGES FOR PERFORMING HIS/HER BUSINESS ACTIVITIES?
9. IS CURRENT ENTREPRISE THE OWNER’S FIRST FORMAL ENTREPRENEURIAL EXPERIENCE – SECOND CHANCE PRINCIPLE?
a. Take advantage of business opportunity
b. No better choices for work (unemployed)
c. Have a job to seek for better opportunities
d. Inherited a business
e. Pursuing a passion
f. Other _____________________________
a. Yes, in 1 foreign language
b. Yes, in 2 foreign languages and more
c. No
b. Yes
c. No, second one
d. No, third one and more
THANK YOU

145Indexes

146 training needs analysis
7.2.
index of figures
Figure 1: Study participants by country .............................................................................................................................24
Figure 2: Participants from different sector of operation by country ........................................................................................24
Figure 3: Number of full-time employees in enterprise by sector of operation ...........................................................................25
Figure 4: Employees by age and gender ........................................................................................................................... 26
Figure 5: Employees by educational background ................................................................................................................. 27
Figure 6: Owner’s educational background ....................................................................................................................... 28
Figure 7: Enterprise owner’s age and gender .................................................................................................................... 29
Figure 8: Possible benefits of participating in clusters ......................................................................................................... 34
Figure 9: Willingness to become a mentor of a start-up ...................................................................................................... 34
Figure 10: Human resource development activities by enterprise size ...................................................................................... 36
Figure 11: The way in which training within the enterprise is organised and enterprise size ..........................................................37
Figure 12: Importance of training topics for owners & managers ............................................................................................ 38
Figure 13: Ratings of importance of training topics for other employees ................................................................................... 40
Figure 14: Challenges influencing enterprises by country .......................................................................................................43
Figure 15: Challenges influencing enterprises by sector of operation ........................................................................................ 44
Figure 16: Weighted comparison of training needs by country ................................................................................................ 48
Figure 17: Weighted comparison of training needs by sector of operation ................................................................................. 49
Figure 18: Weighted comparison of organisational benefits acquired through training between countries ........................................52
Figure 19: Weighted comparison of organisational benefits acquired through training between sectors of operation ...........................53
Figure 20: Challenges influencing growing and other enterprises ............................................................................................ 58
Figure 21: Training needs of growing and other enterprises ................................................................................................... 59
Figure 22: Challenges influencing enterprises with increase in exports and others ......................................................................61
147Indexes
Figure 23: Training needs of enterprises with increase in exports and others ..............................................................................61
Figure 24: Challenges influencing enterprises whose owners are younger than 30 and others ....................................................... 63
Figure 25: Training needs of enterprises whose owners are younger than 30 and others .............................................................. 63
Figure 26: Challenges influencing enterprises by owner’s gender ............................................................................................ 65
Figure 27: Training needs of enterprises by owner’s gender ................................................................................................... 65
Figure 28: Factors influencing decision on the selection of training ..........................................................................................67
Figure 29: The most suitable timing for conducting the training ............................................................................................. 68
Figure 30: The most appropriate training methods in the future ............................................................................................. 68
Figure 31: Rank of important statements for business development .........................................................................................70
Figure 32: Sources of information on available trainings ........................................................................................................ 71
Figure 33: Perception of benefits regarding future training ..................................................................................................... 71
Figure 34: SEECEL Training Navigation System .......................................................................................................................74
Figure 35: Enterprises with international certification by country .............................................................................................76
Figure 36: Internationally certified enterprises by sectors of operation ......................................................................................76
Figure 37: Types of training providers ................................................................................................................................ 77
Figure 38: Possession of quality assurance criteria for training providers ...................................................................................78
Figure 39: Types of quality assurance criteria used ................................................................................................................78
Figure 40: Meeting the quality assurance criteria by training providers ......................................................................................79
Figure 41: Principal-agent problem ................................................................................................................................. 80
Figure 42: Time when the business was established ............................................................................................................ 85
Figure 43: Number of employees from manufacturing sector by country ................................................................................... 85
Figure 44: Percentage of employees from tourism sector by country ......................................................................................... 86
Figure 45: Employees using ICT by country ......................................................................................................................... 86
Figure 46: Employees using ICT in different sectors of operation ..............................................................................................87
Figure 47: Employees using foreign languages per country .....................................................................................................87
Figure 48: Employees using foreign languages in different sectors of operation .......................................................................... 88
Figure 49: Difference among countries in the way national/local authorities create supportive environment for business development .. 88
Figure 50: Total revenue in the last three years by country .................................................................................................... 89
Figure 51: Total revenue in the last three years in different sectors of operation ......................................................................... 89
Figure 52: Number of employees in the last three years by country ......................................................................................... 90
Figure 53: Number of employees in the last three years in different sectors of operation .............................................................. 90
Figure 54: Exports in the last three years by country .............................................................................................................91
Figure 55: Exports in the last three years in different sectors of operation ..................................................................................91
148 training needs analysis
Figure 56: Imports in the last three years by country ............................................................................................................ 92
Figure 57: Imports in the last three years in different sectors of operation ................................................................................ 92
Figure 58: The ratio of enterprise revenues during the last year .............................................................................................. 93
Figure 59: Export markets and country of origin .................................................................................................................. 93
Figure 60: Market to which enterprise export and sector of enterprise operation ........................................................................ 94
Figure 61: Sufficiency of information available regarding the access to finance .......................................................................... 94
Figure 62: Sources of information about access to finance ..................................................................................................... 95
Figure 63: Entrepreneurs’ specific access to finance instruments/programs which are available ..................................................... 95
Figure 64: Micro and small enterprises access to finance instruments/programs in use ................................................................ 96
Figure 65: Use of tools for creation of networking and cooperation ......................................................................................... 96
Figure 66: Participation in cluster activities/initiatives ...........................................................................................................97
Figure 67: Importance of the reason for organizing the training ..............................................................................................97
Figure 68: Annually reserved budget for the training............................................................................................................ 98
Figure 69: Percentage of the total revenue in the investments previous year allocated for investment in training .............................. 98
Figure 70: Trend in the last three years regarding the investments made for training .................................................................. 99
Figure 71: Source of funding in implementing the training .................................................................................................... 99
Figure 72: Training needs by country ............................................................................................................................... 100
Figure 73: Training needs by sector of operation .................................................................................................................101
Figure 74: Organisational benefits acquired through training by country ................................................................................. 102
Figure 75: Organisational benefits acquired through training by sector of operation ................................................................... 103
Figure 76: Training needs of growing and other enterprises .................................................................................................. 104
Figure 77: Training needs of enterprises with an increase in exports and others ........................................................................ 104
Figure 78: Training needs of enterprises whose owners are younger than 30 and others ............................................................. 105
Figure 79: Training needs of enterprises by owner’s gender .................................................................................................. 105
149Indexes
7.1.
index of tables
Table 1: Key facts on micro and small enterprises by country ......................................................................................................... 15
Table 2: Classification of SMEs in the EU ....................................................................................................................................18
Table 3: Factorial structure of challenges influencing enterprises scale: factorial weights and Cronbach alpha coefficient ............................42
Table 4: Factorial structure of areas of training needs performance scale: factorial weights and Cronbach alpha coefficient ........................ 46
Table 5: Factorial structure of organisational benefits acquired through the training scale: factorial weights and Cronbach alpha coefficient ... 51
Table 6: SEECEL Steering Committee ........................................................................................................................................ 106
Table 7: TNA/QA WG Members ................................................................................................................................................ 108
Table 8: TNA/QA Pilot Institutions ........................................................................................................................................... 108
Table 9: Creation of supportive environment for business development by national/local authorities: ANOVA .......................................... 109
Table 10: Ranking of challenges that influence enterprise by country: ANOVA .....................................................................................110
Table 11: Ranking of challenges that influence enterprise by sector of operation: ANOVA ...................................................................... 111
Table 12: Areas of training for the development of enterprise’s business performance by country: ANOVA ................................................. 112
Table 13: Areas of training for the development of enterprise’s business performance by sector of operation: ANOVA .................................. 113
Table 14: Organisational benefits acquired through training by country: ANOVA .................................................................................. 114
Table 15: Organisational benefits acquired through training by sector of operation: ANOVA ................................................................... 114
Table 16: Hierarchical multiple regression analysis for the training dimension Process Execution ............................................................ 115
Table 17: Hierarchical multiple regression analysis for the training dimension Business Literacy .............................................................116
Table 18: Hierarchical multiple regression analysis for the training dimension Market Communication ..................................................... 117
Table 19: Ranking of challenges that influence enterprises for growing enterprises: t-test ....................................................................118
Table 20: Training for the development of enterprise’s business performance for growing enterprises: t-test ............................................118
Table 21: Ranking of challenges that influence enterprises for enterprises with increase in exports: t-test ...............................................118
Table 22: Training for the development of enterprise’s business performance for enterprises with increase in exports: t-test ....................... 119
Table 23: Ranking of challenges that influence enterprises for enterprises of owners that are younger than 30: t-test ................................ 119
Table 24: Training for the development of enterprise’s business performance for enterprises of owners that are younger than 30: t-test ........ 119
Table 25: Ranking of challenges that influence enterprises for enterprises led by female owners: t-test.................................................. 120
Table 26: Training for the development of enterprise’s business performance for enterprises of female owners: t-test ............................... 120

150 training needs analysis
151Bibliography
1. Almeida, R. and Aterido, R. (2010). Investment in job
training: why are SMES lagging so much behind?. World
Bank Policy Research Working Paper Series, Vol.
2. Ahmeti, F. and Marmullaku, B. (2015). Human Resource
Management and Practices in SMEs in Developing Countries:
Practices in Kosovo. European Scientific Journal, 11 (7), p.
415-428.
3. Blank, S. (2013). The four steps to the epiphany. K&S Ranch.
4. Block, J. and Wagner, M. (2010). Necessity and opportunity
entrepreneurs in Germany: characteristics and earnings
differentials. Schmalenbach Business Review, 62, pp.
154–174.
5. Brown, T. (2008). Design thinking. Harvard business
review, 86(6), 84.
6. Eisenhardt, K. M. (1989). Agency theory: An assessment and
review.Academy of management review, 14(1), 57-74.
7. European Commission. (2013). Entrepreneurship 2020 Action
Plan: Reigniting the entrepreneurial spirit in Europe.
Bruxelles: European Commission.
8. European Commission. (2010). Europe 2020 A strategy
for smart, sustainable and inclusive growth. COM
(2010), Bruxelles: European Commission.
9. Eurostat-OECD. (2007). Eurostat-OECD Manual on Business
Demography Statistics. Office for Official Publications of the
European Communities: Luxembourg.
10. Hair, J. F., Anderson, R. E., Tatham, R. L. and Black, W. C.
(1998). Multivariate Data Analysis. Englewood Cliffs, NJ:
Prentice Hall.
11. Healy, J., Ryan, W., Stewart, S. and Stewart, R. (2002)
Training needs analysis in an SME in the Irish construction
industry. In: Greenwood, D (Ed.), 18th Annual ARCOM
Conference, 2-4 September 2002, University of Northumbria.
Association of Researchers in Construction Management,
Vol. 2, p. 687-695.
12. Nightingale, P. and Coad, A. (2014). Muppets and gazelles:
political and methodological biases in entrepreneurship
research. Industrial and Corporate Change, 23(1), 113-143.
13. OECD et al. (2012). SME Policy Index: Western Balkans and
Turkey 2012: Progress in the implementation of the Small
Business Act for Europe. OECD.
14. Porter, M. E. (1990). The competitive advantage of
nations. Harvard business review, 68(2), 73-93.
15. Regional Cooperation Council. (2013). South East Europe
2020: Jobs and Prosperity in a European Perspective.
November 2013.
16. Roy, A. and Raymond, L. (2008) Meeting the Training Needs
of SMEs: is e-Learning a Solution?, The Electronic Journal of
e-Learning Volume 6 Issue 2, p. 89 - 98, available online at
www.ejel.org.
17. Schumpeter, J. A. (1934). The theory of economic
development: An inquiry into profits, capital, credit,
interest, and the business cycle (Vol. 55). Transaction
publishers.
18. SEECEL. (2012b). Training Needs Analysis for SMEs – Western
Balkans and Turkey’s Experience. Zagreb: SEECEL.
19. SEECEL. (2012a). A Charter for Entrepreneurial Learning: The
Keystone for Growth and Jobs. Zagreb: SEECEL.
20. SEECEL. (2014) Women Entrepreneurs’ Training Needs
Analysis – A Systematic Approach in the Western Balkans,
Turkey and Molodova. Zagreb: SEECEL.
152 training needs analysis
South East European Centre for Entrepreneurial Learning
Selska cesta 217 / IVHR - 10000 Zagreb, Croatiawww.seecel.hr

EW
EX training needs analysis
Co-funded by the
European Union
“This publication has been produced with a financial assistance of the European Union. The contents of this publication are the
sole responsibility of SEECEL and can under no circumstances be regarded as reflecting the position of the European Union.”
This project is supported by the Ministry of
Entrepreneurship and Crafts of the Republic of Croatia
This project is implemented
by SEECEL
9 789538 084034