Embed Size (px)
Citation preview

UNDP Human Development Report Office
OCCASIONAL PAPER
This document was originally compiled in 2011 with information from a range of Human
Development Reports and other publications by UNDP. The Oxford Poverty and Human
development Initiative (OPHI) researchers Diego Zavaleta and Joanne Tomkinson edited source
materials for this draft, with support from Sabina Alkire, Melissa Friedman, Gisela Robles Aguilar,
Sarah Valenti, Maria Emma Santos, and others at HDRO including Amie Gaye and Tim Scott. The final
draft was revised by Milorad Kovacevic and Cecilia Calderon in March 2015.
Training Material for Producing National Human Development Reports March 2015

Training Material for Producing National Human Development Reports
Human Development Report Office 2 OCCASIONAL PAPER
The Human Development Index (HDI)
Purpose: To measure the level of achievements in three basic aspects of human development in a given country. Dimensions: Four indicators belonging to three dimensions: Long and healthy life, knowledge and decent standard of living. Versions of the Human Development Index (HDI):
1. Human Development Index (HDI): Calculated using globally comparable data, the global HDI compares the situation of countries in the areas of health, knowledge and living standards. The methodology and indicators for calculating the HDI were revised in the 2010 and 2014 Human Development Reports (HDR), and this primer reflects the current method.
2. Regional or national HDIs: The HDI may be adapted to local realities,
needs and the data available. Its purpose is to assess levels of human development in specific regions or countries in the dimensions most relevant and feasible locally.

Training Material for Producing National Human Development Reports
Human Development Report Office OCCASIONAL PAPER 3
HDI: Contents
1. Overview 2. Components of the global HDI
2.1 Long and healthy life 2.2 Knowledge 2.3 Decent standard of living 2.4 Aggregation and weights 2.5 Data sources
3. Measurement 3.1 Calculating the dimension indices 3.2 Aggregation 3.3 Examples 3.4 Interpretation 3.5 The hybrid HDI for historical analysis
4. Potential innovations 4.1 Creating regional, national and sub-national HDIs 4.2 Adapting the HDI - Argentina 4.3 New indices – Colombia’s violence- adjusted HDI 4.4 New indices – Costa Rica’s security-corrected HDI
5. Analysis and data presentation 5.1 Disaggregation 5.2 Trends
6. Changes to the HDI and limitations 6.1 Changes introduced in 2010 6.2 Changes introduced in 2014 6.3 Limitations of the HDI
7. References

Training Material for Producing National Human Development Reports
Human Development Report Office 4 OCCASIONAL PAPER
1. Overview
The Human Development Index (HDI) measures achievements in three aspects of human development: health, education and living standards. The global HDI, first presented in the 1990 Human Development Report (HDR), measures a country's success in the following human development achievements for its citizens: a long and healthy life (using health data), access to knowledge (using education data) and a decent standard of living (using income per capita). The HDI was introduced as an alternative to conventional measures of economic development such as income per capita and the rate of economic growth. While income has the potential to expand people’s choices, it is also an imperfect guide to the human development successes of a given country or region. In many instances, countries with higher average incomes do have higher health and educational achievements and consequently a higher HDI. But although there is a definite correlation between income and human well-being, this relationship breaks down in many societies and inter-country comparisons. Some countries, for example, have high levels of income per capita but low levels of other human development indicators (and vice versa), while some countries at similar levels of average income have vastly different levels of human development. Consequently, the manner in which income is distributed and spent within countries is decisive. Moreover, an excessive attention to the growth of income per capita can obscure the ultimate objective of enriching human lives. Given the imperfect nature of economic wealth as a gauge of human development, the HDI offers a powerful alternative to conventional measures for measuring well-being and socio-economic progress. In structure, the HDI is a summary composite index. The breakthrough for the HDI was the creation of a single statistic which was to serve as a frame of reference for both social and economic development. The HDI sets a minimum and a maximum value for each dimension and then shows where each country stands in relation to these values, expressed as a number between 0 and 1.1 The higher a country’s HDI score, the higher its level of human development (and vice versa). The HDI indicators and functional form have evolved over time, most recently in 2010. The HDI is the oldest and most prominent index of the family of measures present since the first HDR. Its strengths include its transparency, simplicity and popular resonance. Yet its prominence doesn’t imply that it is the only possible measure of human development.2 It doesn’t, for example, capture many aspects of life that people value and have reason to value, such as economic, social and political freedom, and protection against violence, insecurity and discrimination. These limitations, as well as the potential of national and regional HDIs to overcome such shortcomings, are explored below. Key changes to the HDI indicators and functional form introduced in 2010 and 2014 are also explained.
1 This process is known as normalization. This refers to the transformation of indicators expressed in different units to quantities taking values between 0 and 1. 2 This is amply illustrated by the inclusion of the other measures in the HDR. The Gender Inequality Index (GII), Inequality-adjusted HDI (IHDI), Multidimensional Poverty Index (MPI) and HDI are together a family of human development measures providing complementary information.

Training Material for Producing National Human Development Reports
Human Development Report Office OCCASIONAL PAPER 5
2. Components of the Global HDI
Since 1990 the HDI has had three dimensions: a long and healthy life, knowledge, and a decent standard of living. The indicators used to inform each dimension have, however, changed over time—most recently in the 2010 HDR (box 2 at the end of this note describes these changes, and section 6 discusses the refinements introduced in 2010 and 2014 in greater depth). Four indicators are currently used to capture the three dimensions: life expectancy at birth (long and healthy life); mean years of schooling of population of ages 25 and over (knowledge), expected years of schooling for children (knowledge); and Gross National Income (GNI) per capita3 adjusted by purchasing power parity (PPP) (standard of living).4 The knowledge dimension uses two indicators, while the others use just one.5 Figure 1. HDI Dimensions and indicators
Source: UNDP (2010). p.215
Step 1: The first step of calculating the HDI is to create three separate indices for each of the three dimensions. These dimension indices (one for long and healthy life, one for knowledge and one for decent standard of living) are then used to calculate the global HDI. In each of the three dimension indices, a country’s achievements are normalized to a score between 0 and 1 using the minimum and maximum values outlined below.
3 GNI per capita is “(the) sum of value added by all resident producers in the economy plus any product taxes (less subsidies) not included in the valuation of output plus net receipts of primary income (compensation of employees and property income) from abroad, divided by midyear population. Value added is the net output of an industry after adding up all outputs and subtracting intermediate inputs” (UNDP. 2010. p. 224). 4 Purchasing power parity (PPP) rates of exchange are used to take account of price differences between countries. Unlike market exchange rates (e.g. US$1 = INR 63), PPP adjusts the exchange rate to consider variations in prices between countries. This is important because what a person can buy with US$1 in the United States greatly differs from what INR 63 can buy in India. Through different methods, the exchange rate can be adjusted so that, in theory, 1 PPP dollar (or international dollar) has the same purchasing power in the domestic economy of a country as US$1 has in the United States economy. The HDI figures on GNI per capita, adjusted by 2011 PPP, are taken from the World Bank’s World Development Indicators (for an explanation of how this is calculated see World Bank. 2014. The HDI is calculated for 187 countries and areas, all of which have very different price levels. To compare economic statistics across countries therefore, the data must first be converted into a kind of common currency. Adjusting the GNI per capita by PPP US$ therefore better reflects the living standards of people in each country. However, there are important drawbacks and concerns with the method of adjusting prices by PPP, including problems with measuring the value of non-market services and its urban bias (see UNDP. 2008. p. 8). 5 All three dimensions use indicators which provide an approximate guide to the levels of development in each area. For example, the health data used in the health dimension are not intended to comprehensively cover all aspects of what would constitute a long and healthy life (such as data on different kinds of diseases). Rather the indicator selected, such as life expectancy at birth, provides a useful “proxy” of how well a country is doing in that particular dimension.

Training Material for Producing National Human Development Reports
Human Development Report Office 6 OCCASIONAL PAPER
Step 2: These three indices are then aggregated to create the global HDI. To do this, the three dimension indices are multiplied together and their cube root is taken. This produces the geometric mean of dimension indices.
The following three sections introduce the current indicators in each dimension, and the minimum and maximum values that are used to normalise them in the HDI.6 2.1 Long and healthy life The long and healthy life dimension uses life expectancy at birth as its indicator, defind as “the number of years a new-born infant could expect to live if prevailing patterns of age-specific mortality rates at the time of birth were to stay the same throughout the child’s life” (UNDP. 2010. p. 224). The life expectancy index is calculated using a minimum value of 20 years and a maximum value of 85 years. These maximum and minimum values are fixed goalposts adopted in the 2014 HDR7 (see section 3 for details on calculating each dimension index and section 6 for further details on maximum and minimum values). The minimum value for life expectancy (20 years) is based on long-run historical evidence from Maddison (2010) and Riley (2005) which shows that if a society or a sub-group of society has a life expectancy below the typical age of reproduction, then that society would fail to reproduce itself.8 The minimum level of 20 years is therefore the life expectancy needed for ] society to survive. The maximum value is fixed at 85 years, as that can be interpreted as an aspirational goal for societies (at least for the next 5-10 years - see below). 2.2 Knowledge The education component of the HDI is measured by two indicators: mean years of schooling for adults aged 25 years and older,9 and the expected years of schooling for children of school-entering age.10 Estimates for mean years of schooling are based on the duration of schooling at each level of education. Expected years of schooling estimates are based on two factors: enrolment by age at all levels of education and the number of children of school age in the population for each level of education. It is important to note that the duration of each level of education may differ from country to country and this is taken into account when calculating mean and expected years of schooling. The two indicators are first normalized using a minimum value of 0 and maximum value of 15 for mean years of schooling and 18 for expected years of schooling. As societies can exist without formal education, the minimum value of 0 years is used for both education variables.
6 Note that the IHDI uses the same minimum and maximum values as the HDI for its base index, although it uses slightly different indicators to calculate the inequality adjustment factors. See “Training Material for Producing National Human Development Reports: The Inequality-adjusted Human Development Index.” 7 Since the 2010 HDR and before the 2014 HDR, the goalposts used to normalize all four indicators of the HDI were observed
values from countries in the time series 1980-2012. This time series (1980-2012) was used to determine maximum values for all
HDI indicators, plus the minimum value for the standard of living indicator.
8 Lower values have occurred during some crises, such as the Rwandan genocide, but these were exceptional cases that were not sustainable. 9 “Average number of years of education received by people ages 25 and older in their lifetime based on education attainment levels of the population converted into years of schooling based on theoretical durations of each level of education attended.” (UNDP. 2010. p. 224). 10 “Number of years of schooling that a child of school entrance age can expect to receive if prevailing patterns of age-specific enrolment rates were to stay the same throughout the child’s life.” (UNDP. 2010. p. 223).

Training Material for Producing National Human Development Reports
Human Development Report Office OCCASIONAL PAPER 7
The maximum values were set to aspirational fixed goalposts in the 2014 HDR11. Both indicators are then combined to produce an education index, which is the arithmetic mean of the two (equally-weighted) sub-indices of education. 2.3 Decent standard of living The decent standard of living component is measured using an income based measure. Income is, of course, not an outcome measure reflecting a person’s capability or human development directly. Yet income is an important means and can proxy aspects of living standard that are provided by markets. The income component is measured using the natural logarithm of GNI per capita adjusted by PPP. For this component, the minimum value is PPP $100, this low value is justified by the considerable amount of unmeasured subsistence and nonmarket production in economies close to the minimum, which is not captured in the official data. The maximum value is set at PPP $75,000, Kahneman and Deaton (2010) have shown that there is a virtually no gain in human development and well-being from annual income above $75,000. Assuming an annual growth rate of 5 percent, only three countries are projected to exceed the $75,000 ceiling in the next five years, at which point the income index will be capped at 1. The HDI takes the natural logarithm of income to reflect the diminishing importance of income among richer countries (an extra dollar of income is worth much more to a poor person than a rich one - that is, the ability to transform additional income into equivalently valuable functionings declines as incomes rise). Thus the index is computed by normalizing the natural logarithm of GNI with respect to the natural logarithm of the minimum and maximum values.
2.4 Aggregation and weights After calculating the indices for the three dimensions, the scores are aggregated into a composite index using a geometric mean, which is the cube root of the product of the three dimension indices (box 1 explains the geometric mean). The global HDI assigns equal weight to all three dimension indices, as it has since 1990. The two education “sub-indices” (the indices for each indicator) are also weighted equally (section 6 explains changes to the HDI calculation over time). The choice of equal weights is based on the normative judgement that all three dimensions are equally important. For the education index, both components have been equally weighted since 2010. Previously, adult literacy was weighted at 1/3 and school attendance at 2/3. The lighter weight on adult literacy—a stock variable—was justified because because adult literacy rates provide rates do little if anything – to discriminate between a person with two years of schooling and a person with a PhD or medical qualification. And so, in the case of very high HDI countries, they barely discriminate among countries where literacy rates are at almost 100%. The new indicator “mean years of schooling” better portrays the educational achievements of people 25 years and above and so better discriminates between countries. It was, therefore, given an equal weight with its “expected years of schooling counterpart”. Alternatively the indicators could be weighted according to the proportion of their populations who are over 25 or “of school-going age”; however, by using equal weighting the HDI is both easier to interpret and also gives more importance to the youth than would be the case from a
11 The mean (expected) years of schooling index is capped at 1 if the observed value of mean (expected) years of schooling is
larger than the fixed goalpost of 15 (18).

Training Material for Producing National Human Development Reports
Human Development Report Office 8 OCCASIONAL PAPER
population based weighting. This can be justified because the schooling levels of the young are easier to affect. Moreover their educational achievements will influence their own lives and their country for many years to come. 2.5 Data sources The following data sources were used in the calculation of the global HDI in 2014. Life expectancy at birth: World Population Prospects 1950–2050: The 2012 Revision (UNDESA 2013), the official source of UN population estimates and projections.
Expected years of schooling: United Nations Educational, Scientific and Cultural Organization (UNESCO) Institute for Statistics (2013). The estimates are based on enrolment by age at all levels of education, and population of official school age for all levels of education.12
Mean years of schooling: Usually from the United Nations Educational, Scientific and Cultural Organization (UNESCO) Institute for Statistics (2013). In the absence of data on mean years of schooling for some countries from this source, the HDR uses estimates based on data on educational attainment from UNESCO Institute for Statistics and Barro and Lee (2013) methodology. They are presented in six categories: no formal education, incomplete primary, complete primary, first cycle of secondary, second cycle of secondary, and tertiary. Barro and Lee use country-specific information about duration of schooling at each level to calculate the estimates.
GNI per capita: The World Bank’s World Development Indicators database (2014), the International Monetary Fund’s World Economic Outlook Database (2014), UNSD (2014), and UNDESA (2013).
3. Measurement
Step 1: The first step in calculating the HDI is to create the dimension indices for the three dimensions. This is done by normalizing the indicators into indices whose values range from 0 to 1, using the minimum and maximum values outlined above. Step 2: The overall HDI is then calculated by taking the geometric mean of normalized indices measuring achievements in each dimension. Because the geometric mean is used for aggregation, any change in the maximum value for the normalisation will not affect the ranking ofcountries (though changes in the maximum would affect the absolute value of the HDI). The minimum values will affect comparisons, so values that can be appropriately conceived of as subsistence values or “natural” zeros are used.
12 As previously mentioned, cross-country comparison of expected years of schooling should be made with caution because the length of the school year and the quality of education are not the same in every country and because the indicator does not directly take into account the effects of repetition (some countries have automatic promotion while others do not). Coverage of different types of continuing education and training also varies across countries. Thus, where possible, the indicator should be interpreted in the context of complementary indicators, such as repetition rates, as well as indicators of the quality of education.

Training Material for Producing National Human Development Reports
Human Development Report Office OCCASIONAL PAPER 9
Box 1. The geometric mean
The geometric mean is a particular case of the family of “general means.” The attribute it averages can be income or any other cardinal variable.13 Given the distribution of an attribute x among n people:
The general mean is defined as follows:
When the coefficient equals 1, the general mean is called the arithmetic mean and takes the form of a simple average (the sum of all the elements of the distribution divided by the total number of elements in the distribution). In other words, the mean is the amount of income or any other attribute that each person would have if the total amount were perfectly equally distributed.
When < 1, the general mean places more weight on its elements with lower values, in effect, penalizing for the existing inequality within the distribution. When there is no inequality within
the distribution, the general mean with any ≠ 1 coincides with the arithmetic mean ( = 1). However, whenever the elements are unequally distributed within the distribution, the general
mean with < 1 will be lower than the arithmetic mean. The geometric mean is a particular
case with = 0. Its multiplicative form is easier to interpret in comparison to the other general
means for < 1. In addition, the geometric mean satisfies several useful properties.
When > 1, the general mean places a higher weight on the elements with larger values in the distribution. This implies that the final result will be leaning towards the higher end of the
distribution. The general means within this range of are not used for welfare evaluations because they “reward” existing inequality. The following example illustrates the basic differences between the arithmetic, the geometric and other general means. Imagine the following three distributions, each having three elements:
Distribution A = (0.1, 0.5, 0.9)
Distribution B = (0.2, 0.6, 0.7)
Distribution C = (0.5, 0.5, 0.5)
The arithmetic mean (when = 1) is the sum of the three elements of each distribution divided by the total number of observations. Thus, the arithmetic means of the three distributions are:
Arithmetic mean of A or = (0.1 + 0.5 + 0.9)/3 = 0.5
Arithmetic mean of B or = (0.2 + 0.6 + 0.7)/3 = 0.5
13 Cardinal variables are those whose quantitative values have a meaning in themselves and are not mere categories, as is the case for ordinal variables. For example, an income of 10 means that a person’s income is 10 monetary units.
1/
1 2
1/
1 2
( ) ( ) ... ( )0
( )
... 0
n
n
n
x x x
nx
x x x
for
for
When = 1, is arithmetic mean.
When > 1, gives more weight on higher
values of x
When < 1, gives more weight on lower
values of x (as for the GII)
A particular case is when = 0. This is called
the geometric mean— it has a different formula, and is used in the formulation of the HDI and the IHDI.
1 2( , ,...., )nx x x x
1( ) A
1( ) B
1( ) C

Training Material for Producing National Human Development Reports
Human Development Report Office 10 OCCASIONAL PAPER
Arithmetic mean of C or = (0.5 + 0.5 + 0.5)/3 = 0.5
The geometric means (when = 0), in turn, are:14
Geo Mean of A, or = 1/3(0.1×0.5×0.9) 0.36
Geo Mean of B or = 1/3(0.2 0.6 0.7) 0.44
Geo Mean of C or = 1/3(0.5 0.5 0.5) 0.5
Note how the averages have changed and the geometric mean of A is the lowest due to the higher inequality of its distribution, followed by B. The geometric and the arithmetic means for C coincide because there is perfect equality within this distribution.
The general means for lower values of , such as = (-1), will be even lower for A (the most unequal of the three distributions above) and B, but will be equal to the arithmetic mean for distribution C.
The means produced by different for each distribution are depicted in the following graph. As can be observed, because distribution C is perfectly equal, all general mean values, regardless of
the value of , are the same and equal to the arithmetic mean. Contrastingly, distributions A and
B have the same arithmetic mean as C but have lower general mean values for < 1 — the
lower the value of , the lower the value of general means. Also, for each in the range of < 1, the general mean value of A is lower than the general mean value of B because distribution A has higher inequality.
Source: Alkire and Santos in Deneulin and Shahani. 2009. p. 131 (with modification to the notation).
14 The geometric means may also be written Geo Mean (A) = √(0.1)(0.5)(0.9)3
, Geo Mean (B) = √(0.2)(0.6)(0.7)3
and Geo Mean (C) = √(0.5)(0.5)(0.5)3
0 ( ) A
0 ( ) B
0 ( ) C

Training Material for Producing National Human Development Reports
Human Development Report Office OCCASIONAL PAPER 11
This example clearly shows the rationale for using the geometric mean instead of the arithmetic mean for the HDI calculations. The geometric mean penalizes inequality in achievements across dimensions.15 In fact, the three distributions A, B and C above can also be seen as dimension indices of the HDI. If there are high inequalities between achievements in income as compared to achievements in health and education, this will yield a lower HDI than if —having the same average achievement —the results are about the same in all three dimensions, as it is the case of distribution C. Note that the geometric mean will also penalises countries that have high achievements in terms of health and education if they have relatively low income. The arithmetic mean also treats the dimensions as perfect substitutes for each other. That is it assumes that a decrease in one component can be compensated by an equal increase in another, to yield the same level of overall achievement. This is important when comparing achievement across different periods of time. Consider distributions A and C above and imagine a country moved from distribution A to distribution C If the arithmetic mean is used to assess the overall achievement, then this would reflect no change in the overall HDI. However, if the geometric mean was used the country would have seen an improvement: the geometric mean rewards overall balance. That is, the geometric mean requires a larger improvement in one element to compensate for a loss in another element. Thus, if we need to retain the level of overall achievement unchanged at, say 0.5, then compensating for a 0.4 units loss in the first element would require more than 0.4 units of improvement in another dimension(s). (Box ends here) 3.1 Calculating the dimension-specific indices The fixed boundaries used for each indicator of the global HDI in 2014 are summarised in table 1 below. Table 1. Minimum and maximum values
Source: UNDP (2014), Technical Note 1. p.2
Having first defined the minimum and maximum values, the dimension-specific indices are then calculated as follows: Equation 1: HDI dimension index calculation
.
15 The same technique is used by the Inequality-adjusted HDI (IHDI), which takes this process one step further. While the HDI penalizes for inequality between dimensions, the IHDI penalizes for both inequality across dimensions and inequality across people within each dimension (the chapter on the IHDI gives a fuller explanation of this process).

Training Material for Producing National Human Development Reports
Human Development Report Office 12 OCCASIONAL PAPER
For health, equation 1 is applied using the actual value (the value observed in the country) and the minimum and maximum values presented in the table. For education, equation 1 is applied to each of the two sub-components, then the arithmetic mean of the two sub-indices is created. For income, equation 1 is modified to incorporate the natural logarithm (ln) of all entries: Equation 1.1: HDI index calculation for income
The natural logarithm is taken because the transformation function from income to capabilities is likely to be concave (Anand and Sen. 2000). The logarithmic transformation has the effect of lowering the contribution of very high incomes to human development.

Training Material for Producing National Human Development Reports
Human Development Report Office OCCASIONAL PAPER 13
3.2 Aggregation The HDI is the geometric mean of the three dimension indices. First multiply the three sub-indices together. Next, you take the cube root of the product (this parallels how the previous arithmetic HDI divided the sum of the sub-indices by 3). Equation 2: Aggregation formula for HDI
3HDI I I I health education income
Where I = Dimension Index Equation 2 embodies imperfect substitutability across all HDI dimensions. In this way, it addresses one of the most serious criticisms of the previous linear aggregation formula, which implied that all dimensions were perfect substitutes. With this new formula, some substitutability is allowed, but not perfect substitutability as was the case in the old HDI.16 3.3 Examples This section illustrates how the HDI was calculated in the 2014 HDR for one country—in this case, Argentina. Table 2 presents the actual values of Argentina’s four indicators. Table 2. Indicator values for Argentina
Indicator Argentina
Life expectancy at birth (years) 76.3
Mean years of schooling (years) 9.8
Expected years of schooling (years) 16.4
GNI per capita ( 2011 PPP US$) 17,297
Note: Values are rounded.
Step 1: Calculating each dimension index The first step is to calculate each dimension index using equation 1 with Argentina’s actual values for each index. For the life expectancy index:
𝐿𝑖𝑓𝑒 𝑒𝑥𝑝𝑒𝑐𝑡𝑎𝑛𝑐𝑦 𝑖𝑛𝑑𝑒𝑥 = 76.3 − 20
85 − 20= 0.8662
Where 76.3 corresponds to the actual value of life expectancy at birth in Argentina, and 85 and 20 correspond to the maximum and minimum values for life expectancy presented in table 1.
16 See section 6 for a discussion of the new features of the 2010 HDI.

Training Material for Producing National Human Development Reports
Human Development Report Office 14 OCCASIONAL PAPER
For the education index: The first step is to calculate each sub-index using Equation 1 with Argentina’s actual values:
𝑀𝑒𝑎𝑛 𝑦𝑒𝑎𝑟𝑠 𝑜𝑓 𝑠𝑐ℎ𝑜𝑜𝑙𝑖𝑛𝑔 𝑖𝑛𝑑𝑒𝑥 = 9.8 − 0
15 − 0= 0.6533
𝐸𝑥𝑝𝑒𝑐𝑡𝑒𝑑 𝑦𝑒𝑎𝑟𝑠 𝑜𝑓 𝑠𝑐ℎ𝑜𝑜𝑙𝑖𝑛𝑔 𝑖𝑛𝑑𝑒𝑥 = 16.4 − 0
18 − 0= 0.9111
Where 9.8 and 16.4 correspond to the actual values of mean years of schooling and expected years of schooling in Argentina respectively (from table 2); the other values correspond to the maximum and minimum fixed values for both indicators presented in table 1. The second step is to calculate the education index which is the artihmetic mean of the two subindices:
𝐸𝑑𝑢𝑐𝑎𝑡𝑖𝑜𝑛 𝑖𝑛𝑑𝑒𝑥 = 𝑀𝑒𝑎𝑛 𝑦𝑒𝑎𝑟𝑠 𝑜𝑓 𝑠𝑐ℎ𝑜𝑜𝑙𝑖𝑛𝑔 𝑖𝑛𝑑𝑒𝑥 + 𝐸𝑥𝑝𝑒𝑐𝑡𝑒𝑑 𝑦𝑒𝑎𝑟𝑠 𝑜𝑓 𝑠𝑐ℎ𝑜𝑜𝑙𝑖𝑛𝑔 𝑖𝑛𝑑𝑒𝑥
2
=0.6533+0.9111
2= 0.7822
For the income index: For the income index, equation 1.1 is used:
𝐼𝑛𝑐𝑜𝑚𝑒 𝑖𝑛𝑑𝑒𝑥 = ln [17,297] − ln [100]
ln [75,000] − ln [100]= 0.7784
Where 17,297 corresponds to the actual value of GNI per capita (PPP US$) in Argentina, and 75,000 and 100 correspond to the maximum and minimum values for GNI per capita (PPP US$) presented in table 1.
Step 2: Aggregating the dimension indices The second step to produce the HDI is the aggregation of the dimension indices. For this, the geometric mean of the three dimension indices is used:
𝐻𝐷𝐼 = √0.8662 ∗ 0.7822 ∗ 0.77843
= 0.808

Training Material for Producing National Human Development Reports
Human Development Report Office OCCASIONAL PAPER 15
3.4 Interpretation The HDI was created to emphasize that people and their capabilities should be the ultimate criteria for assessing the development of a country, not economic growth alone. The HDI can also be used to question national policy choices, asking how two countries with the same level of income per person can end up with such different human development outcomes. For example, Bahrain and New Zealand have similar levels of income per person, but life expectancy and expected years of schooling differ greatly between the two countries. New Zealand as a result has a much higher HDI score than Bahrain. Such striking contrasts can stimulate debate about government policy priorities.
4. Potential Innovations
The functional form of the HDI is highly flexible and allows the index to be used for multiple purposes. The global HDI is chiefly intended for international comparisons between countries and the rest of the world and thus its dimensions and indicators are fixed across countries. This is useful because it provides policy-relevant information for both national governments and the international community. National teams can also disaggregate the global HDI score for their country to compare different sub-populations or sub-regions within the country ( if appropriate data at the level of disaggregation are available). Indeed, the HDI methodology has also highlighted internal disparities within countries, prompting national debates. Yet often the HDI indicators (particularly GNI per capita and life expectancy at birth) are not available sub-nationally. Also, countries (or regions) may want to assess context-specific aspects of human development. In such cases, the formula of the global HDI can be easily applied to an alternative set of indicators. In this way, the HDI is similar to other well-being, inequality or poverty measures. The methodology and formulae underpinning the index can easily incorporate different (or additional) indicators and dimensions. These adaptations are possible if two important conditions are first met: if data are available and if calculations adhere to sound statistical principles. Both kinds of exercises—international and national—are extremely valuable in obtaining different and complementary information. Thus, while national teams are encouraged to use the global HDI methodology for international comparisons, they are also urged to design national HDIs that use the indicators that are most relevant to their country’s specific needs and aspirations. National-level exercises may, for instance, provide more accurate information in certain areas because the data limitations imposed by international comparability do not apply. 4.1 Creating national and sub-national HDIs As stated, countries are encouraged to innovate when creating national-level HDIs. However, it is important to stress that innovation should be consistent with rigorous statistical standards. In particular, HDI adjustments should utilize the same methods of weighting and normalization as the global HDI, making use of well-justified maximum and minimum values to create an index for any new component and clearly defining the weights.17 These requirements leave plenty of room for innovation to better reflect the priorities and problems relevant to a country's level of development. Adjustments to the HDI could involve:
17 Using the same methods does not imply using the same values or equal weights. Each country should define what their maximum and minimum values are and set the weights to their dimensions according to national realities and priorities.

Training Material for Producing National Human Development Reports
Human Development Report Office 16 OCCASIONAL PAPER
Adding new indicators to dimension indices Introducing indicators that show short-term changes in human development could be advantageous. As it stands, the global HDI does not usually react quickly to short term changes in human development because three of its four components—life expectancy, mean years of schooling and expected years of schooling—typically change slowly. To address this limitation, indicators that are more sensitive to short-term changes could be added to the national-level HDI. For example, the life expectancy category could use other health indicators such as the daily caloric intake as a percentage of recommended intake, access to health services, under-five mortality rates or maternal mortality rates. The standard of living component could be adjusted to reflect unemployment, the incidence of income poverty or wealth, and the knowledge component could be adapted to include indicators of the quality of education or skills
Adding new dimensions With only three dimensions, the HDI offers a limited view of human development, which is usually seen as much broader than health, education and command over resources. Since 1990 additional dimensions have been proposed, including political freedom, the environment, safety from violence, work, cultural liberty, and so on (for details see Alkire 2010). The HDR website allows users to experiment with adding dimensions to the HDI. And national level HDIs can include additional dimensions. Sections 4.2 – 4.4 provide examples of how countries have incorporated new dimensions. Changing indicator-specific weights or values National policy priorities may require the customization of indicator-specific weights. For example, a country may want to assign a greater weight to education or health. Moreover, minimum and maximum values can be altered to better reflect national data rather than the international values established for the global HDI. Calculating for sub-national areas The same innovations are also possible for sub-national levels if the data are available. Such national and sub-national adaptations will greatly enhance the usefulness and versatility of the HDI as an analytical tool for human development. Several National HDRs (NHDRs) have extended and adapted the global HDI to include country-specific indicators. Others have assessed broader aspects of well-being at the national level, creating their own indices. 4.2 Adapting the HDI - Argentina Argentina’s 2002 NHDR18 provides a useful example of national adaptation of the HDI. After a decade of high economic growth during the 1990s, Argentina entered a severe recession and several years of political instability. In just two years, unemployment had reached record levels and the poverty rate had doubled. Moreover, the analysis of the effects of the crisis unmasked severe inequalities between regions and between the urban and rural areas. The team putting together the 2002 Argentinean NHDR set out to adapt the global HDI and develop an index that could better inform public policy in this context. The creators of the index sought to capture the effects of Argentina’s rapid changes while also taking account of the more
18 “Contributions to Human Development in Argentina.” UNDP Argentina. 2002.

Training Material for Producing National Human Development Reports
Human Development Report Office OCCASIONAL PAPER 17
structural inequalities in the country. To this end, new indicators were added to each of the then-global HDI’s dimensions.19 In the knowledge dimension, two new indicators were added alongside adult literacy and gross enrolment rates:
A “quality of education” indicator based on the evaluation of test results in mathematics and Spanish (the official language).
The over-age enrolment rate (the percentage of students older than the expected age at the school year in which they are enrolled).
The new indicators better reflected the disparity in educational achievements in a country where primary educational enrolment had already been achieved in urban areas (which represented over 90 per cent of the total population). In the health dimension, a new indicator— infant mortality rate due to reducible causes—was added alongside the life expectancy at birth indicator. This indicator refers to the proportion of deaths of children younger than one attributable to reducible causes accounted in one year (and divided by the total number of children born alive in the same year and multiplied by one thousand). In the decent standard of living dimension, employment and unemployment rates were introduced alongside GDP per capita. All of the additional indicators correlated with the global HDI yet allowed for better differentiation between sub-national levels. For example, using the global HDI to compare provinces used to yield a difference of approximately 0.10 between the best province in the year 2000 (Buenos Aires 0.85) and the worst (Formosa 0.75). The extended HDI introduced in 2002 allowed for better observations of the severe differences between the same regions. With the new index, Buenos Aires scored 0.86 and Formosa 0.15.
19 The global HDI indicators changed in 2010. This discussion corresponds to the indicators used during 2002. For an overview of the changes in the HDI indicators, see section 6.2.

Training Material for Producing National Human Development Reports
Human Development Report Office 18 OCCASIONAL PAPER
Figure 2. Extended HDI, provinces of Argentina and city of Buenos Aires, 2000
Source: UNDP. 2002. p. 19.
4.3 New indices – Colombia’s violence- adjusted HDI Other countries, meanwhile, have created their own indices. The 2003 Colombia NHDR20 introduced a new index—the violence-adjusted HDI—which sought to demonstrate the effects of armed conflict on people’s lives using data on homicide, displacement, crimes committed under conflict, governability and violence. Drawing on social dialogues with communities across the country, it analysed the underlying causes of conflict and identified possible solutions.
Features The violence-adjusted HDI used the same indicators and weights as the global HDI for the three standard dimensions—education, health and income. However, the minimum and maximum values used differed as follows:
Life expectancy: 25 and 85 years
Income: US $100 and US$40 000
Adult literacy: 0% and 100%
Gross school enrolment: 0% and 100%.
In addition to the standard HDI dimensions, a new dimension was added which focused on homicide and adjusted the HDI for violence. This dimension-specific index (the homicide index) is constructed as follows:
20 “Understand in Order to Transform the Local Roots of Conflict." UNDP. Colombia. 2003.

Training Material for Producing National Human Development Reports
Human Development Report Office OCCASIONAL PAPER 19
In the violence-adjusted HDI, each of the dimensions is independent as the overall index is composed of the simple average of the dimension indices.
Th is the rate of homicides per 100, 000 inhabitants. For international comparison, the th min (or minimum value) is 0 and th
max (or maximum value) is 85. For comparison between regions within Colombia, the maximum homicide rate was lower, th
max = 20, in order to capture the differences among them better.
Table 4. Constructing Colombia’s violence-adjusted HDI
Country Dimensions Indicators Cut-offs Weights
Colombia: Violence-adjusted Human Development Index21
Four:
Income (I)
Health (H)
Education (E)
Violence (Hom)
* Education is the only dimension to use two indicators.
Five:
Income (USD, adjusted by PPP)
Life expectancy
Literacy rate
Gross combined enrolment
Homicide rate per 100,000 inhabitants
Standardized with national minimum and maximum values
One quarter per dimension
(I+E+H+Hom)/4
In addition to the violence-adjusted HDI, the 2003 Colombian NHDR proposed the addition of new indices for displacement, degradation not attributable to war, governability and violence.
4.4 New indices – Costa Rica’s security-corrected HDI The 2005 Costa Rica NHDR22 introduced the security-corrected HDI which explored the relationship between citizen insecurity and human development. The report responded directly to national public concerns about deteriorating quality of life and the part played by citizen
21 UNDP Colombia. 2003. p. 485. 22 “Overcoming Fear: Citizen (In)Security and Human Development in Costa Rica.” UNDP Costa Rica. 2005.

Training Material for Producing National Human Development Reports
Human Development Report Office 20 OCCASIONAL PAPER
insecurity in those experiences. The goal of the new index was to bring human development concepts and measurement closer to the lives and day-to-day needs of people in Costa Rica. The report, which won the “Excellence in Human Development Innovations—Concepts or Measurement” prize at the 2007 Human Development Awards, introduced new tools to measure citizen insecurity at the district level, including security (especially violence and theft), perceptions of insecurity and individual liberties. It focused on the specific types of vulnerability caused by violence and dispossession, and the protection of a basic core of fundamental rights.
Features The report defines citizen security as “the personal, objective and subjective condition of being free from violence or from the threat of intentional violence or dispossession by others.”23 To incorporate this into the HDI, a new dimension was added to the three traditional HDI dimensions. This new dimension, the cantonal security index (CSI), revealed differences in the geographical distribution of violence and dispossession within the country. By looking deeper into the situation within Costa Rica's cantons (or districts), it showed how victimization and criminality affected people unequally. In terms of construction, the CSI itself has three indicators:
Police interventions due to domestic violence (rate per 100,000 people)
Victims of homicide (rate per 100,000 people)
Robbery and mugging (rate per 100,000 people)
The dimension index for the CSI is then calculated as follows:
PI H RM
13
CSI
The dimensions and indicators used by the security-corrected HDI are provides in tables 5 and 6.
23 UNDP Costa Rica. 2005. p.14-15 (English version)
PI = Police interventions
H = Victims of homicides
RM = Robbery and muggings

Training Material for Producing National Human Development Reports
Human Development Report Office OCCASIONAL PAPER 21
Table 5. Constructing Costa Rica’s security-corrected HDI
Index Dimensions Indicators Cut-offs Weights
Costa Rica: Security- corrected Human Development Index24
Four:
Income (I)
Health (H)
Education (E)
Security (CSI)
Nine:
Purchasing power index (electricity consumption per client standardized)
Life expectancy index (life expectancy, gross mortality rate, proportion of population 65 years or older)
Knowledge index (2/3 literacy rate and 1/3 global net enrolment)
Cantonal security index (indicators outlined below)
Global HDR standard minimum and maximum values were used, except for the health index, where the minimum value used was 50 instead of 0.
One quarter per dimension
(I+E+H+CSI)/4
Table 6. Cantonal security index in focus
Dimension index
Indicators Cut-offs Weights
Cantonal Security Index25
Three:
Police interventions (PI): Police interventions due to domestic violence rate per 100,000 people
Victims of homicide (H): Victims of homicide rate per 100,000 people
Robbery and mugging (RM): Robbery and mugging rate per 100,000 people
Each indicator is normalized, using 0 and 1 as its minimum and maximum values.
Each indicator is then weighted a third (0.33) and aggregated to create the index. This is then subtracted from one as follows:
CSI = 1- [(0,33 × PI) +( 0,33 × H) +
(0,33 × RM)]
5. Analysis and Data Presentation
Despite its simplicity, the HDI provides for varied and powerful statistical analysis. Some of the potential uses and data presentations26 include:
24 UNDP Costa Rica. 2005. p. 515-521 (Spanish version) 25 UNDP Costa Rica. 2005. p. 513-514 (Spanish version) 26 For an in-depth discussion of potential and innovative ways of presenting HDI data see Hidalgo. 2010.

Training Material for Producing National Human Development Reports
Human Development Report Office 22 OCCASIONAL PAPER
5.1 Disaggregation A country’s overall HDI ranking can conceal great disparities in levels of human development between different individuals and groups. Disaggregated HDIs provide a window into sometimes highly significant disparities and gaps—gaps among regions, between the sexes, between urban and rural areas and among ethnic groups. To create a disaggregated HDI, data for each HDI dimension is used for each separate group—in effect, treating each group as if it were a separate country. Such groups may be defined relative to income, geographical or administrative regions, urban or rural residence, gender and ethnicity. Using disaggregated HDIs at the national and sub-national levels can therefore help to guide policy and action to address gaps and inequalities. Disaggregated HDIs have been used extensively for analysis since their inception, including in countries such as Brazil, Colombia, Egypt, Gabon, Germany, India, Kazakhstan, Malaysia, Mexico, Nigeria, Papua New Guinea, Poland, South Africa, Trinidad and Tobago, Turkey, Ukraine and USA. For example, NHDRs in China (2008)27 and Kenya (2001)28 have found wide provincial and urban versus rural disparities, while a similar study in Guatemala (2005)29 has shown that those disparities apply to ethnic groups as well. Examples findings from disaggregated analysis include:
In Bolivia, the richest 20 per cent of the population has a HDI rank 97 positions higher than the poorest 20 per cent.
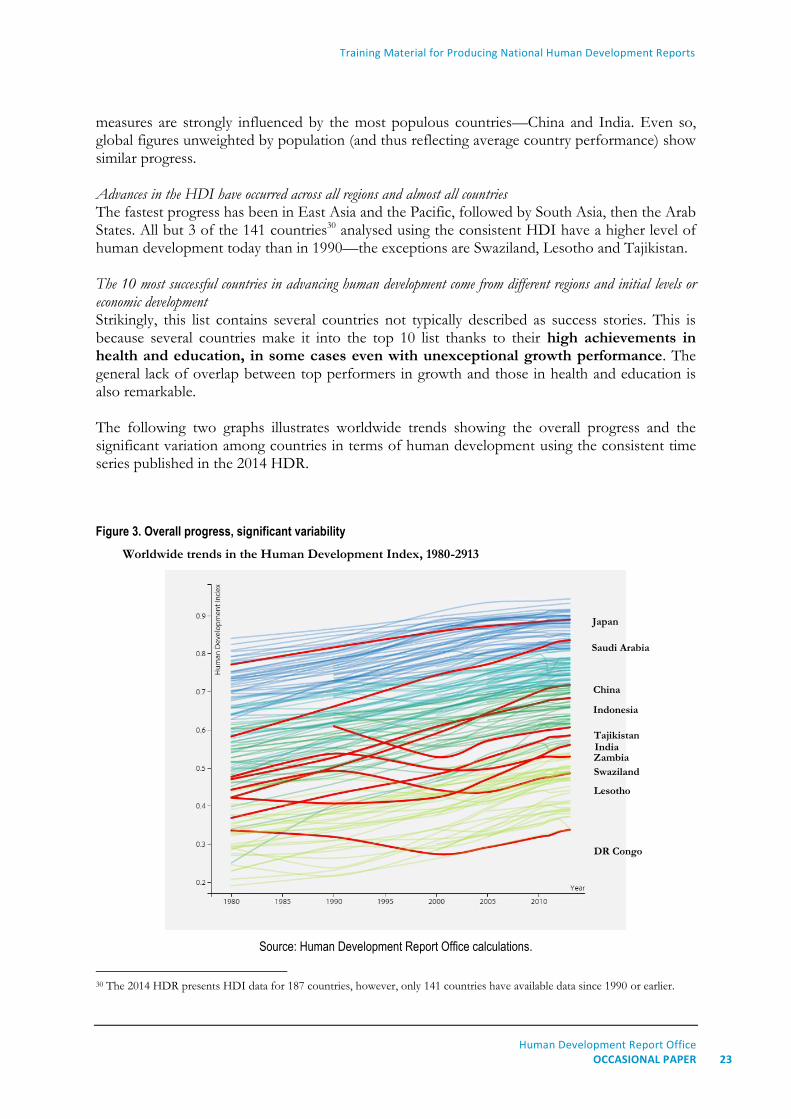
In South Africa, the top quintile ranks 101 positions above the lowest quintile. 5.2 Trends A systematic review of patterns and trends in human development reveals powerful insights. For example, the 2010 HDR included an extensive analysis of overall temporal HDI patterns shedding light on aspects such as overall tendencies, convergences between countries and strong local variability. Needless to say, trend analysis requires comparable data through time so some adjustments may be needed. The 2014 HDR included a consistent time series of the HDI. This means that the same indicators (life expectancy at birth, mean years of schooling, expected years of schooling and GNI per capita), aggregation method (geometric mean) and fixed goalposts (the ones presented in Table 1) were applied to all the years between 1980 and 2013. An equivalent exercise could also be performed for national-level HDIs. Some examples of key results from the trend analysis provided in the 2014 HDR are outlined below. Overall trends Measured in terms of the HDI, progress around the world has been impressive. The world average HDI rose to 0.702 in 2013 from 0.597 in 1990, continuing the upward trend from 1980, when it stood at 0.559. This increase reflects aggregate expansions of about a quarter in the health and education indicators, and a doubling of income per capita. The aggregate global
27 “Access for all: Basic public services for 1.3 billion people.” UNDP China. 2008. 28 “Addressing social and economic disparities for human development.” UNDP Kenya. 2001. 29 “Ethnic and cultural diversity: Citizenship in a plural state.” UNDP Guatemala. 2005.
Training Material for Producing National Human Development Reports
Human Development Report Office OCCASIONAL PAPER 23
measures are strongly influenced by the most populous countries—China and India. Even so, global figures unweighted by population (and thus reflecting average country performance) show similar progress. Advances in the HDI have occurred across all regions and almost all countries The fastest progress has been in East Asia and the Pacific, followed by South Asia, then the Arab States. All but 3 of the 141 countries30 analysed using the consistent HDI have a higher level of human development today than in 1990—the exceptions are Swaziland, Lesotho and Tajikistan. The 10 most successful countries in advancing human development come from different regions and initial levels or economic development Strikingly, this list contains several countries not typically described as success stories. This is because several countries make it into the top 10 list thanks to their high achievements in health and education, in some cases even with unexceptional growth performance. The general lack of overlap between top performers in growth and those in health and education is also remarkable. The following two graphs illustrates worldwide trends showing the overall progress and the significant variation among countries in terms of human development using the consistent time series published in the 2014 HDR. Figure 3. Overall progress, significant variability
Worldwide trends in the Human Development Index, 1980-2913
Source: Human Development Report Office calculations.
30 The 2014 HDR presents HDI data for 187 countries, however, only 141 countries have available data since 1990 or earlier.
Japan
Saudi Arabia
China
Indonesia
Tajikistan India Zambia
Swaziland
Lesotho
DR Congo

Training Material for Producing National Human Development Reports
Human Development Report Office 24 OCCASIONAL PAPER
Progress to higher human development groups since 1990

Training Material for Producing National Human Development Reports
Human Development Report Office OCCASIONAL PAPER 25
Convergence The HDI can be used to assess the gaps between countries, regions or groups. The global HDI, for example, can help assess whether poor countries are closing the gap with rich countries. This question is generally answered by looking at some measure of difference in a specific indicator between poor and rich countries or by assessing whether less developed countries are advancing more rapidly than more developed ones. Many researchers have investigated this question using GDP as a measure of development. They have generally concluded that the gap is widening. But the HDI tells a more optimistic story. Overall, poor countries are catching up with rich countries in the HDI. The HDI gap between developing and developed countries narrowed by about a fifth between 1990 and 2013. For example, the HDI more than doubled for Mali (from 0.232 to 0.407), Mozambique (from 0.216 to 0.393) and Uganda (from 0.310 to 0.484). Good news indeed and this occurred despite the large divergence in incomes. In contrast, incomes show increased divergence. On average then, living in a developing country today is more similar—at least for these basic health and education indicators—to living in a developed country than was the case 40 or even 20 years ago. However, this is not true for all developing countries. Local variability Not all countries have seen rapid progress, and the variation is striking. Between 1990 and 2013, about a third of developing countries saw their HDI increase less than 20 per cent, while around 10% of developing countries experienced a more than 40 per cent increase. Since 1990, 3 countries have seen a decline in the HDI. The recent global financial crisis and the East Asian financial crisis of 1997–1998 remind us that progress is not linear, even for countries that perform well. Economic crises can throw countries off track. So can shocks that affect health and education directly, such as epidemics and natural disasters. To some extent, these differences in rates of progress reflect different starting points—convergence means that less developed countries tend, on average, to improve more rapidly than more developed ones. However, half the variation in HDI progress is unexplained by initial HDI level, and countries with similar starting points experience remarkably different evolutions over time. This evidence suggests that country factors such as institutions, geography and policies—and even pure luck (good and bad)—are important in determining outcomes.

Training Material for Producing National Human Development Reports
Human Development Report Office 26 OCCASIONAL PAPER
Figure 4. Diversity of paths: Evolution from similar starting points in 1990
Source: Human Development Report Office calculations.
Comparisons with income or economic growth The HDI can also be used for comparisons with income levels and economic growth. For example, comparing the HDI and per capita income ranks of countries, regions or ethnic groups within countries is useful as it highlights the relationship between material wealth on the one hand and human development on the other. A negative gap implies a potential for redirecting resources to human development. The HDI can also be used to identify how achievements in income growth are related to progress in other HDI dimensions. This can be done by using an index similar to the HDI but calculated with only the health and education indicators to compare changes with economic growth. Examples of key results comparing income and human development from the 2014 consistent HDI time series are discussed below. Average income growth around the world has been high, but it has been variable across countries, while progress has been more consistent for health and education. Many developing countries have attained levels of health and education similar to those in developed countries, but crossing the divide that separates income-poor from income-rich countries is much harder. Therefore, countries have improved their HDI through two broad routes: fast income growth or rapid progress in health and education. These findings suggest that over the past 23 years the forces driving improvements in health and education are different from those driving improvements in income. Had these processes had the same drivers, the processes would have broadly coincided. But the 2013 HDI time series shows that they did not.
0.1
0.2
0.3
0.4
0.5
0.6
0.7
0.8
HD
I
0.1
0.2
0.3
0.4
0.5
0.6
0.7
0.8
HD
I
Congo, DR
Bangladesh
0.1
0.2
0.3
0.4
0.5
0.6
0.7
0.8
HD
I Haiti
Viet Nam
Niger
Rwanda

Training Material for Producing National Human Development Reports
Human Development Report Office OCCASIONAL PAPER 27
The results of new analysis confirm a central contention of the HDRs from the outset: that human development is different from economic growth and that great achievements are possible even without fast economic growth. The first HDR pointed to countries such as Costa Rica, Cuba and Sri Lanka, which had attained much higher human development than other countries at the same income levels. These achievements were possible because growth was decoupled from the processes determining progress in other dimensions of human development. These results also refute one of the criticisms often levelled at the HDI. From the outset some economists have regarded the non-income dimensions as redundant, because the snapshot of development that the HDI reveals is not systematically different from that emerging from comparing income levels. But the HDI gives a very different picture from GDP when we look at changes over time—and in the end these are precisely the changes that development policy tries to influence. Figure 5. Weak relationship between economic growth and changes in health and education Relationship between economic growth and the HDI and its nonincome components. 1990-2013
Note: Income growth, HDI change and nonincome HDI change are expressed as the percentage average annual growth rate.
Source: Human Development Report Office calculations.
6. Changes to the HDI and Limitations
6.1 Changes introduced in 2010 Improvements are also regularly made to the indicators and functional specifications of the HDI. Reforms resulting from new knowledge reinforce the value and centrality of the HDI as an approach to thinking about development. Better data are also now available for a larger number of countries, so new and better indicators can be incorporated. As in past HDRs, the HDI remains a composite index that measures progress in the three basic dimensions of long and healthy life, knowledge and decent standard of living. The 2010 HDR introduced three

Training Material for Producing National Human Development Reports
Human Development Report Office 28 OCCASIONAL PAPER
important kinds of changes to the HDI: (i) changes to indicators, (ii) changes to the aggregation method and (iii) changes to minimum and maximum values. The 2011 brought changes in the GNI expression and its minimum. Also, expected years of schooling was capped at 18 years. Changes to indicators Indicators used in the knowledge and standard of living dimensions were modified in 2010 and are outlined in box 2. One of the dimensions remains the same—long and healthy life—which still uses life expectancy at birth as its indicator. Knowledge was previously measured by a combination of the adult literacy rate and school enrolment rates (for primary through university years). Since 2010 it combines the expected years of schooling—the years of schooling that a child can expect to receive given the current enrolment rates—with the mean years of schooling for adults aged 25 and older. Moreover, equal weights are now assigned to both indicators (one-half). This is different from the previous HDI, which weighted the previous educational sub-indices differently, with adult literacy weighing one-third and enrolment two-thirds. Finally, the decent standard of living dimension was formerly measured by GDP per capita adjusted for PPP US$ and now uses Gross National Income (GNI) per capita adjusted for PPP. These modifications have numerous benefits. Mean years of schooling is estimated more frequently for more countries and can discriminate better among countries, while expected years of schooling is consistent with the reframing of this dimension in terms of years. Moreover, literacy—the previous indicator—is a binary variable which doesn’t reveal subtle differences within a society. Its capacity to illustrate progress in education had also diminished given that most people, even in the least developed countries, are now literate. Ideally, measures used in the knowledge dimension would go beyond estimating quantity to assessing quality, as Argentina did and several other national and regional HDRs have done. For example, the 2003 Arab States HDR constructed a measure that captures both the quantity and quality of education, adjusting mean years of schooling with average test scores and including indicators related to media, communication and scientists trained. But good measures of education quality do not exist for enough countries—cross-national assessments of science, mathematics and reading levels of young people are valuable but scarce in coverage and irregular in frequency. GNI meanwhile better reflects a country’s economic welfare than previously used GDP. It includes some international transfers and excludes profits generated in the country but repatriated abroad. It provides a more accurate economic picture of many developing countries. This is in contrast to GDP which simply accounts for the monetary value of goods and services produced in a country, irrespective of how much is retained in the country. Changes to the calculation method A key change in 2010 was the shift from an arithmetic mean to a geometric mean (which measures the typical value of a set of numbers) in the calculation of both the overall index and the education index. The 2010 HDI is the geometric mean of the three dimension indices. Poor performance in any dimension is directly reflected in the HDI, and there is no longer perfect substitutability across dimensions. This method captures how well-rounded a country’s performance is across the three dimensions and penalizes for inequality between them. As a basis for comparing achievements, this method is better at respecting intrinsic differences in dimensions than a simple average. It recognizes that

Training Material for Producing National Human Development Reports
Human Development Report Office OCCASIONAL PAPER 29
health, education and income are all important, but also that it is hard to compare these different dimensions of well-being and that we should not let changes in any of them go unnoticed. This is important because human development is defined as the expansion of people’s freedoms to live long, healthy and creative lives and not as the freedom of people to live long or healthy or creative lives. Each dimension of development is intrinsically important and different. They are not perfect substitutes, as the arithmetic mean implies. At most, they are (quite) imperfect substitutes. The geometric mean reduces the level of substitutability between dimensions and at the same time ensures that a one per cent decline in, say, life expectancy at birth index has the same impact on the HDI as a one per cent decline in education index or income index. Adopting the geometric mean produces lower index values, with the largest changes occurring in countries with uneven development across dimensions. However, the introduction of the geometric mean has only a moderate impact on the HDI rankings. 31 The practice of using the log of income is maintained: income is instrumental to human development but higher incomes have a declining contribution to human development. But the new HDI uses the natural logarithm instead of the previously used logarithm with the base of 10. This minor change has no effect on the value of the income index and is motivated by the fact that most of the economic literature uses the natural logarithm of income. Changes in maximum and minimum values The maximum values in each dimension have also shifted to the observed maximum, rather than a predefined cut-off beyond which achievements would be ignored. The significance of this change is particularly evident in the income dimension. Previously, a fixed value was assigned to set a “cap” on the standard of living component (at PPP $40,000). However, this had been replaced in 2010 by an “observed maximum” per capita income level (PPP $108,211 in the United Arab Emirates). The cap on the income component of the HDI was lifted for several reasons. The original cap was tied to the understanding that income is instrumental to human development, but that its contribution diminishes as incomes rise. The previous HDI placed the PPP $40,000 cap on income to reflect the view that beyond some upper set amount, additional income does not expand human development opportunities. A further consideration was that while literacy rates and school enrolment (the indicators used in the previous HDI) and life expectancy have “natural” caps (100 per cent, mortality limits and so forth), the highest incomes would continue rising, skewing the upper ranks of the HDI to increasingly income-driven values and rankings over time. But countries were increasingly bunched at the cap. This made it hard to distinguish among the increasing number of countries at the top of the distribution (in 2007, for example, the GDP of 13 countries exceeded the cap). Thus, the discriminatory power of capped income has been weakened, especially for discrimination between very highly developed countries. The cap was not originally intended to be binding in the sense of totally disregarding additional income beyond a particular level. For example, the income cap of PPP $40,000 was not binding on countries when it was introduced in the mid-1990s but rather was an upper bound used to normalize the income dimension index. Moreover, the use of the geometric mean intensifies the diminishing returns of the logarithmic transformation of GNI compared to the arithmetic mean.
31 For a further discussion on the effects of the changes on country rankings see Klugman, Rodriguez and Choi 2011a and Zambrano 2011.

Training Material for Producing National Human Development Reports
Human Development Report Office 30 OCCASIONAL PAPER
The use of observed maximum values instead of caps allows the resulting indices to vary in similar ranges so that their implicit weights are more similar than had been the case under the previous method. On the other hand, observed maxima may change every year and may affect the values of the HDI. Although, the entire series of HDI is recalculated every year using the consistent data and methodology for that year, still there are difficulties in convincing users not to compare values (and ranks) published in different Reports, but instead to use the consistent time series. In turn, the minimum levels for the dimension indicators were set in 2010 as follows:
Life expectancy was set at 20 years, rather than 25. Historical evidence indicates that 20 years as the minimum required for a society to subsist.
Both education variables were set at 0 (since societies can subsist without formal education).
GNI per capita at PPP was set at $163, which was the observed minimum (the lowest value attained by any country in recent history—Zimbabwe in 2008—and corresponds to less than 45 cents a day, just over a third of the World Bank’s $1.25 a day poverty line). The minimum value for GNI per capita was fixed to $100 in 2011 after realising that the geometric mean degenerates in the proximity of zero.
The choice of minimum values is motivated by the principle of natural zeros below which there is no possibility for human development. As noted already, this way of normalizing has the effect of making the component sub-indices of these dimensions vary along a similar range. National HDR teams are advised to regularly consult Human Development Report Office (HDRO) to get updated versions of the minimum and maximum values. 6.2 Changes introduced in 2014 The 2014 HDR did not introduce changes to indicators or changes to the aggregation method to the HDI. Though it did introduce one important modification: changes to minimum and maximum values (goalposts) which are now fixed rather than set at the observed values. Minimum and maximum goalposts act as the ‘natural zeros’ and ‘aspirational goals’, respectively, from which component indicators are standardized. Table 1 (earlier) shows the fixed goalpost used to calculate the HDI published in the 2014 HDR. In turn, as mentioned before, the minimum and maximum levels for the dimension indicators are currently set as follows:
Life expectancy: the minimum value is still set at 20 years. The maximum value is now fixed at 85 years.
The minimum value for both education variables are still set at 0 (since societies can survive without formal education). The maximum values for mean years and expected years of schooling are currently fixed at 15 and 18 years, respectively.
GNI per capita (2011 PPP): the minimum value stayed at $100; this low value is justified by the considerable amount of unmeasured subsistence and nonmarket production in economies close to the minimum. The maximum value is capped at $75,000 since there is virtually no gain in human development and well-being from annual income beyond that amount.

Training Material for Producing National Human Development Reports
Human Development Report Office OCCASIONAL PAPER 31
In addition, the arithmetic (instead of the geometric) mean is used to calculate the education index from the mean years of schooling and expected years of schooling indices. 6.3 Limitations of the HDI Over the past 20 years the HDI has received its share of criticism. Some take issue with its construction and composition. Objections have been raised about, for example, the choice of indicators; the mixture of variables used, which include stock, flow, inputs and outputs; the lack of indicators of quality; the substitutability assumptions; the normalization of indicators; the asymmetric treatment of income; and the choice of weights. Others suggest that it should be expanded to include more dimensions, ranging from gender equity to biodiversity.32 Many concerns are valid. But the objective is not to build an unassailable indicator of well-being—rather it is to redirect attention towards human-centred development and to promote debate over how we advance the progress of societies.33 The index does not, for example, capture many aspects of life that people value and have reason to value, such as economic, social and political freedom, and protection against violence, insecurity and discrimination. Important data constraints currently prevent many of these desirable additional dimensions from being incorporated (e.g. political freedom and the absence of discrimination). There are also important conceptual and cultural differences, such as over what constitutes “political freedom” and what would be an appropriate international measure of discrimination. Yet the HDI is an important step forward.. A sizeable academic literature has emerged around the HDI and related topics. Regional and national HDRs have also helped improve understanding in different contexts by creating innovative measures of human development. The more we discuss what should or should not be included in the HDI—whether it makes sense to lump distinct categories together, how much importance to accord to each category, how to obtain more and better data—the more the debate moves away from the single-minded focus on growth that pervaded thinking about development.
32 For a detailed review of the criticisms of the HDI see Klugman, Rodriguez and Choi 2011a, 2011b and Kovacevic 2010. See also Ravallion 2010, 2011, Chakravarty 2011 and Zambrano 2011. 33 For a thorough review of the evolution of the definition of human development and the critiques attached to it, see Alkire 2010.

Training Material for Producing National Human Development Reports
Human Development Report Office 32 OCCASIONAL PAPER
Box 2. An evolving measure - changes to the Human Development Index, 1990–2014
HDR Maximum and minimum values
Indicators Treatment of Income
Dimensional Index Formulas HDI formula Health Education
(weights in brackets) [years]
Income
1990 Observed Life expectancy at birth
Adult literacy rate [25+] Real GDP per capita PPP $ (log)
Logarithmic transformation with a cap set at poverty level
Normalization: = 𝑀𝑎𝑥𝑖𝑚𝑢𝑚 𝑉𝑎𝑙𝑢𝑒−𝐴𝑐𝑡𝑢𝑎𝑙 𝑉𝑎𝑙𝑢𝑒
𝑀𝑎𝑥𝑖𝑚𝑢𝑚 𝑉𝑎𝑙𝑢𝑒−𝑀𝑖𝑛𝑖𝑚𝑢𝑚 𝑉𝑎𝑙𝑢𝑒
Aggregation of the three dimensional indices: Arithmetic mean
𝐻𝐷𝐼 = 1 − 𝐼 Where I = Average Deprivation Indicator
𝐼 = Iℎ + I𝑒 + I𝑦
3
1991–1993
(2/3) Adult literacy rate (1/3) Mean years of schooling
Real GDP per capita PPP $ (adjusted)
Atkinson formula* with threshold value derived from poverty line
Aggregation of education indicators: arithmetic mean of un-normalized indicators to produce a measure of educational achievements. The result is then normalized to produce the ‘Educational Deprivation Index’.
1994 Fixed (2/3) Adult literacy rate (1/3) Mean years of schooling
Atkinson formula* with threshold y* value being the global average real GDP per capita PPP $
Normalization: = 𝐴𝑐𝑡𝑢𝑎𝑙 𝑉𝑎𝑙𝑢𝑒−𝑀𝑖𝑛𝑖𝑚𝑢𝑚 𝑉𝑎𝑙𝑢𝑒
𝑀𝑎𝑥𝑖𝑚𝑢𝑚 𝑉𝑎𝑙𝑢𝑒−𝑀𝑖𝑛𝑖𝑚𝑢𝑚 𝑉𝑎𝑙𝑢𝑒
Aggregation of education indicators: Arithmetic mean of normalized indicators to produce the ‘Educational Attainment Index’.
𝐻𝐷𝐼 = 𝐼 Where I = Average Achievement Indicator
𝐼 = Iℎ + I𝑒 + I𝑦
3
1995–1998
Fixed (Minimum value for income reduced from 1994 value).
(2/3) Adult literacy rate (1/3) Combined gross enrolment ratio with a cap starting to bind in 1996

Training Material for Producing National Human Development Reports
Human Development Report Office OCCASIONAL PAPER 33
1999 Real GDP per capita PPP $ (log)
Logarithmic transformation with a cap starting to bind in 2001
2000–2009
(2/3) Adult literacy rate [15+] (1/3) Combined gross enrolment ratio with a cap starting to bind in 1996
2010 Upper: observed Lower: Fixed (Minimum value for life expectancy reduced from 2009 value).
(1/2) Mean years of schooling (1/2) Expected years of schooling
Real GNI per capita PPP $ (In)
Natural logarithm without a cap
Aggregation of education indicators: geometric mean of normalized indicators to produce the ‘Educational Attainment Index’, which is then re-normalized. Aggregation of the three dimensional indices: Geometric mean
𝐻𝐷𝐼 = 𝐼 Where I = Average Achievement Indicator
𝐼 = √(Iℎ) × (I𝑒) × (3
I𝑦)
2011 Lower: Fixed (Minimum value for income, set at $100, reduced from 2010 observed value)
Expected years of schooling with a cap at 18 years
2014 Fixed (Upper and lower values)
Natural logarithm with a cap
Aggregation of education indicators: arithmetic mean of normalized indicators to produce the ‘Educational Attainment Index’
Source: Authors building on Klugman, Rodriguez and Choi (2011).

Training Material for Producing National Human Development Reports
Human Development Report Office 34 OCCASIONAL PAPER
* The HDI used an explicit formulation to capture the diminishing returns of rising income from 1991 to 1998 based on the Atkinson formulation for the utility of income W(y) = 1
1−∈× 𝑦1−∈ (where W(y) is the
utility or well-being derived from income, and the parameter ∈ measures the extent of diminishing returns). For the HDI, the value of ∈ is increased as income rises. For this, the full range of income was divided into multiples of a set poverty line (𝑦∗). All incomes below the poverty line were not affected by diminishing returns (∈ = 0). All incomes above the poverty line were affected in the following way: (∈ = 1/2) is
assigned to incomes between the poverty line and twice the amount of the poverty line; (∈ = 2/3) is assigned to incomes between twice the amount of the poverty line and three times the amount of the poverty line; and so on. This gives: W(y) = 𝑦 for 0< 𝑦 ≤ 𝑦∗
W(y) = 𝑦∗+ 2(𝑦 − 𝑦∗)1/2 for 𝑦∗≤ 𝑦 ≤ 2𝑦∗
W(y) = 𝑦∗+ 2(𝑦∗)1/2+3(𝑦 − 2𝑦∗)1/3 for 2𝑦∗≤ 𝑦 ≤3𝑦∗ and so on.

Human Development Report Office OCCASIONAL PAPER 35
REFERENCES
Alkire, S. 2010. “Human Development: Definitions, Critiques, and Related Concepts.” Human Development Research Papers, 2010/01. UNDP, New York. Alkire, S., and ME. Santos. 2009. “Poverty and Inequality Measurement.” In An Introduction to the Human Development and Capability Approach: Freedom and Agency, eds., S. Deneulin and L. Shahani. London: Earthscan. Anand, S., and A.K. Sen. 1999. “The Income Component in the HDI—Alternative Formulations.” Occasional Paper. UNDP, New York. Anand, S. and Sen, A.K. 2000. “The Income Component of the Human Development Index.” Journal of Human Development, 1(1): 83–106. Barro, RJ., and JW. Lee. 2013. “A New Data Set of Educational Attainment in the World, 1950–2010.” NBER Working Paper 15902. Cambridge, MA: National Bureau of Economic Research. http://www.barrolee.com/ Chakravarty, S. 2011. “A Reconsideration of the Trade-offs in the New Human Development Index.” Journal of Economic Inequality. 9(3): 471-474. Hidalgo, C.A. 2010. “Graphical Statistical Methods for the Representation of the Human Development Index and its Components.” Human Development Research Paper 39. UNDP-HDRO, New York. IMF (International Monetary Fund). 2014. World Economic Outlook database. http://www.imf.org/external/pubs/ft/weo/2014/01/weodata/index.aspx Kahneman, D., and A. Deaton. 2014. “High Income Improves Evaluation of Life But Not Emotional well-being. Psychological and Cognitive Sciences.” Proceedings of National Academy of Sciences 107(38) 16489–16493.
Klugman, J., F. Rodriguez and H. Choi. 2011a. “The HDI 2010: New Controversies, Old Critiques.” Journal of Economic Inequality. 9(2): 249-288. Klugman, J., F. Rodriguez and H. Choi. 2011b. “Response to Martin Ravallion.” Journal of Economic Inequality. 9(3): 497-499.
Kovacevic, M. 2010. “Review of HDI Critiques and Potential Improvements.” Human Development Research Paper 33. UNDP-HDRO, New York. Maddison, A. 2010. Historical Statistics of the World Economy: 1–2008 AD. Organisation for Economic Co-operation and Development, Paris. Ravallion, M. 2010. “Troubling Tradeoffs in the Human Development Index.” Policy Research Working Paper, 5484. World Bank, Washington, DC. Ravallion, M. 2011. “The Human Development Index: A Response to Klugman, Rodriguez and Choi.” Journal of Economic Inequality. 9(3): 475-478. Riley, J.C. 2005. Poverty and Life Expectancy. Cambridge, UK: Cambridge University Press. United Nations Department of Economic and Social Affairs. 2013. World Population Prospects: The 2012 Revision. UNDESA, New York. United Nations Development Programme Kenya. 2001. Addressing Social and Economic Disparities for Human Development. UNDP, New York. United Nations Development Programme Argentina. 2002. Contributions to Human Development in Argentina UNDP, New York. United Nations Development Programme Colombia. 2003. Understand in Order to Transform the Local Roots of Conflict. UNDP, New York. UNDP (United Nations Development Programme) Costa Rica. 2005. Overcoming Fear: Citizen (In)security and Human Development in Costa Rica. UNDP, New York. UNDP (United Nations Development Programme) Guatemala. 2005. Ethnic and cultural diversity: Citizenship in a plural state. UNDP, New York. UNDP (United Nations Development Programme) China and Renmin University of China. 2008. Human Development Report China 2007/08: Access for All: Basic Public Services for 1.3 Billion People. Beijing: China Translation and Publishing Corporation.

Human Development Report Office 36 OCCASIONAL PAPER
UNDP (United Nations Development Programme). 2008. Human Development Indices: A Statistical Update 2008. UNDP, New York. UNDP (United Nations Development Programme). 2010. Human Development Report 2010. The Real Wealth of Nations: Pathways to Human Development. UNDP, New York. UNDP (United Nations Development Programme).
2014. Human Development Report 2014. Sustaining
Human Progress: Reducing Vulnerabilities and
Building Resilience. UNDP, New York.
UNESCO (United Nations Educational, Scientific and Cultural Organization) Institute for Statistics (2013). Data Centre. http://stats.uis.unesco.org United Nations Statistics Division. 2014. National Accounts Main Aggregate Database. http://unstats.un.org/unsd/snaama World Bank. 2014. Purchasing Power Parities and Real Expenditures of World Economies: Summary of Results and Findings of the 2011 International Comparison Program. http://siteresources.worldbank.org/ICPINT/Resources/270056-1183395201801/Summary-of-Results-and-Findings-of-the-2011-International-Comparison-Program.pdf World Bank. 2014a. World Development Indicators data-base. Washington, D.C. http://data.worldbank.org Zambrano, E. 2011. “Measuring HDI Measurements: Why the New Model Works Best.” Retrieved from: http://HDR.undp.org/en/humandev/lets-talk-hd/2011-01b/

UNDP Human Development Report Office 304 E. 45th Street, 12th Floor New York, NY 10017, USA Tel: +1 212-906-3661 Fax: +1 212-906-5161 http://hdr.undp.org/ Copyright © 2015 by the United Nations Development Programme 1 UN Plaza, New York, NY 10017, USA All rights reserved. No part of this publication may be reproduced, stored in a retrieval system or transmitted, in any form or by any means, electronic, mechanical, photocopying, recording or otherwise without prior permission. This paper does not represent the official views of the United Nations Development Programme, and any errors or omissions are the authors’ own.


![Human Development Research Paper 2009/43 Restrictive ...hdr.undp.org/sites/default/files/hdrp_2009_43.pdf · two languages [because] unlike past immigrant groups, Mexicans and other](https://img.pdfslide.us/doc/110x75/5f2f11718e60ab788c2f9e07/human-development-research-paper-200943-restrictive-hdrundporgsitesdefaultfileshdrp200943pdf.jpg)