Embed Size (px)
Citation preview

TRAINING IN ALTERNATIVE ENERGY TECHNOLOGIES
Solar Energy Laboratory
University of Florida
Gainesville
UNIVERSITY OF FLORIDA
AGENCY FOR INTERNATIONAL DEVELOPMENT
(A.I.D.)
TRAINING IN ALTERNATIVE ENERGY TECHNOLOGIES
(TAET)
Second Session Sept. - Dec. 1980
GROUP PROJECT
RESOURCES ASSESSMENT
Eng. Fernando Gonzalez Instituto Nacional De Energia (INE) Quito - Ecuador
Eng. Joaquin Santaella INDOTEC (Central Bank) Santo Domingo - Rep. Dominicana
Eng. Eduardo Sibaja Instituto Costarricense De Electricidad (ICE) San Jose - Costa Rica
DECEMBER 1980

"Nevertheless, despite all the uncertainties, we must prepare for the
future"
Eduardo Sibaja Fernando Gonzalez Joaquin Santaella

ACKNOWLEDGMENTS
We are especially grateful for generous help provided by:
Dr. Erich Farber, Dr. An!. Rajvanshi, Dr. Roberto Pagano and
Eng. Donald Peterson for their time and expertise.
Thanks should also be extended to Mary Keith for her assistance
in the typing of the numerous drafts of this report.
And finally, we are grateful for the help provided by TREEO staff.
CONTENTS
Summary
Introduction .........................................................
Brief Remarks About Energy Resources Assessment .................. 4
1.1 Hydropower ................................................. 5
1.1.1 Conventional Hydropower ............................ 5
1.1.2 Mini-Hydro ......................................... 5
1.2 Solar Power ................................................ 7
1.3 Biomass .................................................... 10
1.4 Fossil Fuels .....................................;........... 11
1.4.1 Coal, Peat and Lignite ............................. 11
1.4.2 Oil and Gas ........................................ 11
1.5 Other Resources ............................................ 13
1.5.1 Wind ............................................... 13
1.5.2 Geothermal ............................... ...........13
2 Sectorial Energy Consumption ..................................... 14
2.1 Industry ................................................... 15
2.2 Transportation ............................................. 18
2.3 Commercial Sector .......................................... 20
2.4 Rural and Urban Sector ..................................... 22
3 Tables for Data Gathering ..........................................26
3.1 Data Gathering for Industrial Sector ........................ 27
3.2 Data Gathering for Urban Household .......................... 35
3.3 Data Gathering for Rural Sector ............................. 42
4 Conclusions and Recommendations ................................... 47
5 References ....................................................... 50

SUMMARY
The purpose of this report is to identify the major needs for
improved data on energy consumption, to specify the types of data that
should be collected, and to suggest some general methods of collecting
and organizing these dat,' for use in designing and evaluating an energy
public policy in less devewuping countries (L.D.C.'s).
INTRODUCTION
Improved energy consumption data are needed for several purposes.
1) Data are needed to describe and moLlitor energy consumption.
2) Data are needed to model and predict changes in patterns of
energy use, both short-term and long-term.
3) Data are needed to assess the effects of policy changes.
All three functions -- monitoring, modeling and assessment -- involve
the culection and analysis data. Each function requires different types
of data, and those data are further differentiated by the needs of data
users -- individuals, firms, or governmental agencies at the local, state,
or national level.
DESCRIBING AND MONITORING ENERGY CONSUMPTION
Accurate description of energy consumption patterns is basic to the
formulation and implementation of effective policies. Monitoring energy
consumption provides information about the total amount of energy con
sumed, the forms in which energy is consumed, and the end uses served.
Moreover, monitoring implies continuous or repeated measurement, so that
information is provided about both the rate of consumption from one time
to another. Such data can be used to describe what happens to actual
rates of energy consumption over time.
The limitations of monitoring for purposes of policy making are
inherent in its all-inclusiveness: monitoring data reflect all the fac
tors that influence energy consumption. The changes in energy consumption
from one monitored time to another incorporaLe the effects of old policies
as well as recent ones, changes in supplies and prices, public information
about energy stocks and future trends, and many other institutional,
social and economic factors that influence energy consumption.
MODELING ENERGY CONSUMPTION
Policy makers must be aware of changes in consumption, but they
require a more complex kind of information as well -- information that
helps to explain the cause of such changes. The purpose of explanation,
in contrast to description, is accomplished by the various analytic
procedures called modeling. To model something is to identify its major
causes and show how each of them enters into the processes that affect
the outcomes.
Models of energy use are devices -- such as statements of statistical
relationships, mathematical functions, physical or engineering relation
ships, and the like -- for explaining the factors that have affected
energy consumption in the past and may determine future consumption under
various possible circumstances. A model of energy consumption for the
household sector, for example, would be based on analyses of how housing
characteristics, appliance stocks, income levels, household composition
and energy prices affect household consumption of various forms of energy.
Such a model could ge;ierate estimates of how changes in energy prices or
subsidies for the replacement of existing appliance stocks would affect
consumpt ion.
Empirical models of energy consumption can provide explanations and
even estimates of the effects of public policies, but models are always
simplified versions of reality and their estimates are subject to error.
Unanticipated events or forces not incorporated into a model may substan
tially weaken its ability to mimic real processes. Policy outcomes typi
cally remain problematic to some degree, even when a model has apparently
2

predicted or explained them.
ASSESSMENT OF ENERGY POLICY
Responsible policy assessment requires knowing "not only how and why"
patterns of energy consumption change, but also how those changes may
affect other economic, social and institutional aspects of national life.
Not all assessment activities require the collection of data different
from those needed for monitoring and modeling: a good monitoring system
can sometimes be used to assess changes rest iting from a given policy,
using statistical procedures to isolate the effects of the policy from the
effects of other factors; and data collected for modeling are often useful
for assessing the effects of policies. However, some assessment activi
ties require collecting different kinds of data, both experimental and
non-experimental like we do.
The costs of implementing some proposed policies, the almost inevi
table uncertainties and disagreements about their effectiveness, and the
difficulty of identifying their specific effects contribute to the impor
tance of controlled and randomized field experiments as a tool for policy
assessment. Such experiments can be considered extensions of modeling;
they test models and provide empirical estimates of the parameters of
models. More importantly, they permit the testing and evaluation of poli
cies on a relatively small scale -- a scale on which failure or unexpected
results can be tolerated and the information gained can be used to improve
both models and policies.
3

SECTION 1
BRIEF REMARKS ABOUT ENERGY RESOURCES ASSESSMENT
tt /!

1. 1 HYDROPOWER
1.1.1 CONVENTIONAL HYDROPOWER
As a renewable source of energy, water is the only one that has been
exploited by man on a large scale and that has a well developed technolog
ical base to support its continued exploitation (at present, about 23% of
the world's electricity supply is from hydro plants).
For the reliable design of hydropower projects there is a necessary
basic data, like: river flow measurements, sediment content of streams,
geographic location, etc.
Project designs thus far appear to be adequate, although additional
attention must be paid to Lie determination of project generation capa
city, giving full attention to the multipurpose (electrical generation,
irrigation, flood control, etc.) use of the available water.
It is well recognized that hydropower can be a valuable resource to
any country, not only because of its relatively low cost per kilowatt-hour
but also because its increased profit does not require increased depen
dence on external sources of fuel, neither requires excessive imports, it
is nonpolluting and it can provide water for irrigation, municipal uses,
flood control, recreation and production of fish. In fact, in a well
designed electric power system, hydro facilities provide a reliability and
flexibility unmatched by far more expensive power generation systems.
1.1.2 MINI-HYDRO
At present, there are many mini-hydro plants (0 - 10 MW or less)
contributing in local energy supply in many parts of the world. Basi
cally, the assessment and use of mini-hydro requires the same basic data
as that of conventional hydropower. The large number and different
5

character of potential new sites miake it very diffitult on det:ermine which
are the most attractive for development: that is, not two plants are
exactly the same and their costs vary considerably.
Clearly, mini-hydro plants are more attractive when they have a load
center nearby, since the transmission distances are short and existing
infrastructures could be used (i.e. rods, power lines, transformers,
etc.), but in the case of remote areas the importance of the mini-hydro
should be greater because one of these plants can supply energy and power
to a human group, which would not get them in other conventional ways. In
the case of these remote and non-developed zones, a plant of mini-hydro
could occupy a unique position in the development of the region. Many
more mini-hydro sites should be certainly identified and a concerted
effort to fund and develop such sites would provide satisfaction far
beyond that indicated by mere economic analysis.
A mini-hydro plant's site is an asset that could be maintained in
service for many decades by simply rewinding the generator and renewing
mechanical parts. Many hydro plants have operated for 50 years.
6
1.2 SOLAR POWER
All countries in the world receive some solar energy. This amount
varies from a few hundred hours per year to almost four thousand, depend
ing on the location. Solar energy is the ultimate source of most forms of
energy used now and it has many advantages when it is used directly (is
clean, safe, free, etc.).
But, the fact that solar energy is free does not mean it will auto
matically have a low utilizing cost. Several solar device-s are now avail
able in the market and their price varies from country to country. Their
efficiency also varies. That is why it is difficult to name a fixed price
for a solar article. Anyway, a wide line can be drawn out regarding the
market for each type of solar equipment available at present.
For the particular application of solar energy a basic data is
needed also. It includes the quantity of solar radiation falling in a
certain place, the number of sun-hours in the same place, wind velocity,
property of materials, costs, etc.
Solar energy research has been confined to the pure researchers since
the latter years of the last century. Since then, several solar energy
utilizing devices have bhen designed, studied, built and tested, such as
heaters, stoves, stills, dryers, refrigerators, air conditioners, pumps,
photovoltaic cells, etc.
However, only one solar technology well enough established to be
tapped immediately, based upon extensive experience and promising econo
mics, is the hot water heating system.
It should be noted that if the governments of each country provide
investment incentives to stimulate the generalized use of solar water
heaters, they could recover most of their investment over a period of
7
:ilmost ten years, not to i mentLioa the :av ings [n o[1 imports and the
stimulation of the domestic economy through solar heater manufacturing and
installation.
This is because when considering the cost analysis, generally, 1-he
prime consideration is given to the capital investment and, at present,
solar energy devices are still more expensive than any fuel device. But
due to the rising cost of conventional futis this could be changing.
Mentioning other possible useful solar energy applications, the solar
pond should be able to provide heat and/or electrical power as well in the
future. Also, the use of flat plate solar energy collectors for a variety
of applications (like dryers, refrigerators, air conditioners, space
heaters) is becoming profitable. The use of "passive solar energy", that
is, the application of solar energy without any special device should be
very useful if a well designed policy is followed. Intermediate and high
temperature solar applications (evacuated tubular collectors, linear
parabolic troughs, power towers, parabolic and cylindrical concentrators,
etc.) show long-term promise.
Other solar technologies like photovoltaics, water pumping, cooking,
etc. also show promise for the future and are expected to contribute to
the energy supply in the following decades. In the particular case of
photovoltaics it could be very useful but only when the prices decrease
measurably.
Concluding, one of the ir-ajor economic advantages of solar energy is
that it is available in any place of demand, besides, with the use of
solar energy appliances minimum care after construction is needed.
One of the possible ways to improve the profit of solar energy is in
the hands of the governments. They can stimulate its usage by educating
8

the potential consumers and by providing ce rtain investment [ncenttives.
A rational program should include incentives also for the manufacturers,
repair services, financing, etc. in order to reach a real advantage with
the direct use of solar energy.

1.3 BIOMASS
Biomass could be a very important source of fuel, like ethanol and
methane gas, that is, high-quality fuel. At present, it is probably
unrealistic to contemplate extremely large scale deployment of biomass
conversion systems, mostly due to the land requirements and agricultural
problems. Significant quantities of agricultural residues are generated
during harvesting and also during processing operations. It is not
expected that the agricultural residues left in the fields be collected
and used for generation of energy in appreciable amounts for several
reasons:
I - In the collection process there are a lot of difficulties.
2 - The agricultural residues provide very important nutrients for the soil.
3 - Many of these residues are used for animal feed.
4 - The residues protect the ground by acting as a cover, until the next crop.
- In many cases, the agricultural wastes are not well concentrated.
Other kinds of problems to be considered are: conflicts with food
and traditional forest industries, the remoteness of some forests and
principally certain types of social problems since the work with biodi
gesters, .r instance, is not so agreeable to do.
But, anyway, the production of liquid and gas fuel by using organic
wastes like raw material must be well studied and developed because in the
future it will represent a very important source of energy and, maybe,
biomass could be assuming the role of petroleum.
10

1.4 FOSSIL FUELS
It is perfectly known that the world depends in a very large propor
tion on the fossil fuels, as well as is also known that these fuels are
noL inexhaustible; the amount of utilizable fossil fuels must be deter
mined as a function of its accessibility and certain environmental
considerations.
But this is not the principle problem; in talking about fossil fuels
it is necessary to say that their prices are becoming more expensive each
day, and their increasing use may lead to potentially climatic and envi
ronmental changes. Anyway, each country should have a rational assessment
about its specific fossil fuels potential. In order to do this, the fol
lowing subjects should be considered.
1.4.1 COAL, PEAT AND LIGNITE
In this case, the determination of zones cf deposition of these fuels
and the projected cost of power distribution are the most important
aspects. Here, all the properties, uses, exploitation, prices, etc. of
each one of the mentioned fuels should be enclosed.
1.4.2 OIL AND GAS
In the case of oil and gn,, the prosp ct ion i, even more necessary,
but is more expensive than i the other case. Since the oil and gas are
the most common fossil fur ;, their use is more common. That is why, when
talking about fossil fuel , the idea of oil and gas (in that order) imme
diately comes.
The importance of the Fossil fuels for the world, at the present
time, is very well established. Thie governments of each country should
11

adopt as a prudent energy policy a strategy that permits a well organized
way to profit [rom the existent fossil fuels, taking into account all
their advantages and disadvantages.
12
1.5 OTHER RESOURCES
1.5.1 WIND
The basic data for the wind as an energy source includes wind speed
duration, frequency and direction.
In certain regions of the world, the wind energy can make significant
contributions to the energy consumption (especially in rural areas for
water pumping) but, in any case, could become the unique solution to the
energy requirements. The particular design of a "wind machine" will
depend on the data available (preferably from a network of meteorological
stations).
1.5.2 GEOTHERMAL /
At the present time we cannot consider geothermal energy as an inter
esting freak of nature or as a tourist attracticn (geysers, fumaroles).
Geothermal energy could be one of the most attractive energy sources.
Basically, there are three types of geothermal resources: the hydrother
mal convection system, the regional conductive environment and the hot
igneous system. Under actual conditions only the first type is
commercially attractive.
It's possible to find geothermal resources in many types of geologic
formations, and generally they are in different stages of maturity for
commercializat ion.
Anyway, the development of geothermal resources requires a major
effort, including the improvement of existing exploration and assessment
technology, meaning the application of such technology to accelerate the
identification of major types to geothermal resources.
13

SECTION 2
SECTORIAL ENERGY CONSUMPTION
./I/ -,
2 SECTOR[AL ENINCY CONSUMPT[ON
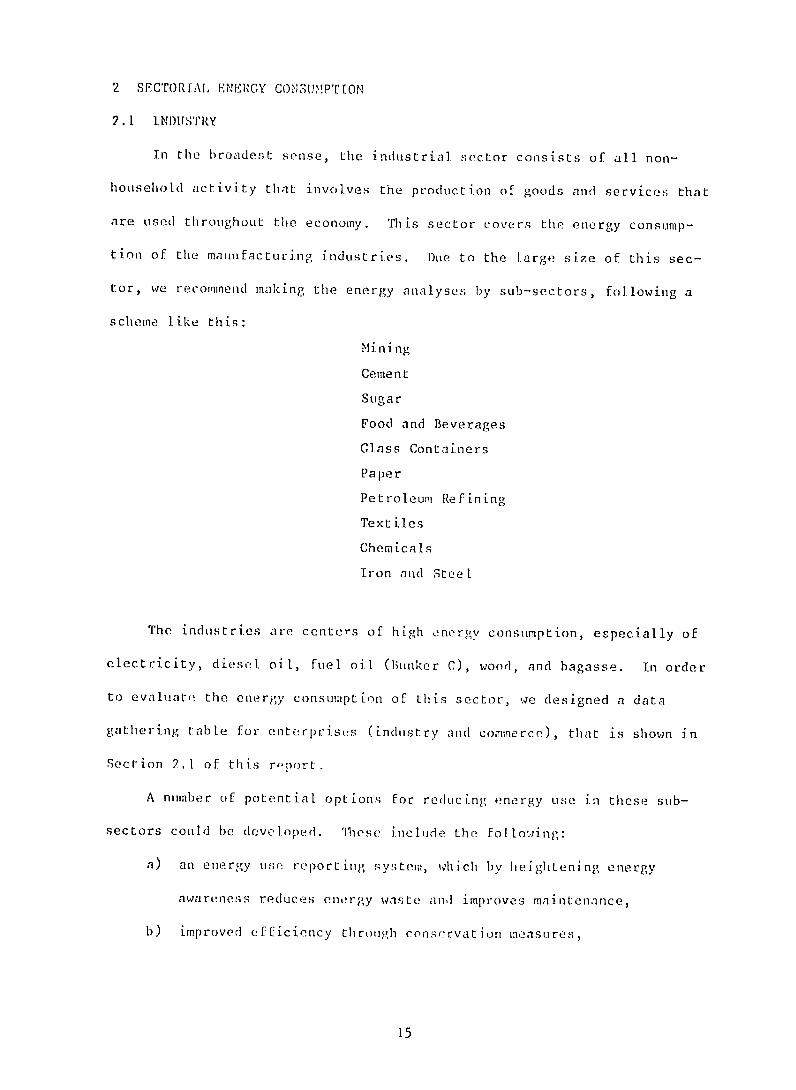
2.1 1NDUSTRY
In the broadest sense, the industrial sector consists of all non
household activity that involves the production of goods and services that
are used throughout the economy. This sector covers the energy consump
tion of the manufacturing industries. Due to the large size of this sec
tor, we recommend making the energy analyses by sub-sectors, following a
scheme like this:
Min ing
Cement
Sugar
Food and Beverages
Glass Containers
Paper
Petroleum Refining
Text iles
Chemicals
Iron and Steel
The industries are centers of high energy consumption, especially of
electricity, diesel oil, fuel oil (Bunker C), wood, and bagasse. In order
to evaluate the energy consumption of this sector, we designed a data
gathering table for enterprise~s (industry and commerce), that is shown in
Section 2.1 of this roport.
A number of potential options for reducing energy use in these sub
sectors could be developed. These include the following:
a) an energy use reporting system, which by heightening energy
awareness reduces energy waste and improves maintenance,
b) improved efficiency through conservation measures,
15
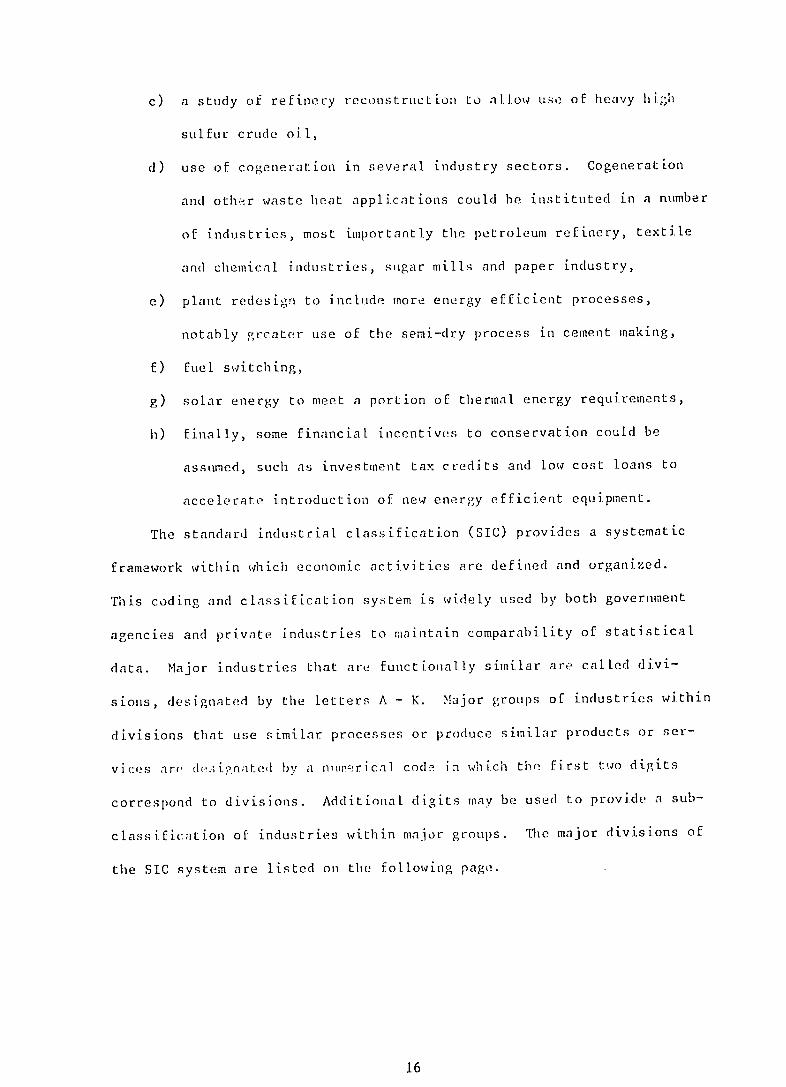
c) a study of refinery reconstructioni to al.l ow use of heavy hi.gh
sulfur crude oil,
d) use of cogeneration in several industry sectors. Cogeneration
and othr waste heat applications could be instituted in a number
of industries, most importantly the petroleum refinery, textile
and chemical industries, sugar mills and paper industry,
e) plant redesign to include more energy efficient processes,
notably grcater use of the semi-dry process in cement making,
f) fuel switching,
g) solar energy to meet a portion of thermal energy requirements,
h) finally, some financial incentives to conservation could be
assumed, such as investment tax credits and low cost loans to
accelerate introduction of new energy efficient equipment.
The standard industrial classification (SIC) provides a systematic
activities are defined and organized.framework within which economic
This coding and classification system is widely used by both government
agencies and private industries to maintain comparability of statistical
data. Major industries that are functionally similar are called divi
sions, designated by the letters A - K. Major groups of industries within
divisions that use similar processes or produce similar products or ser
vices ar, d; t:nated by a niuprical code in which the first t:o digits
correspond to divisions. Additional digits may be used to provide a sub
classification of industries within major groups. The major divisions of
the SIC system are listed on the following page.
16
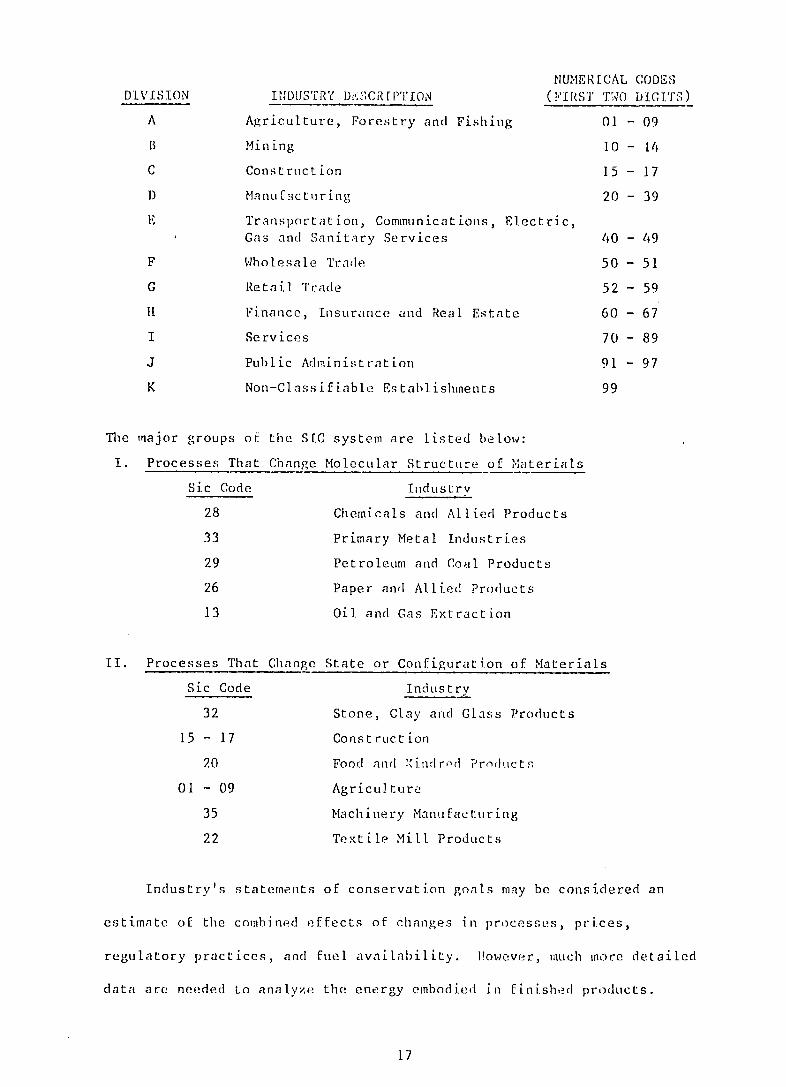
NUMER[CAL CODES DIVISION INDUSTRY DI-LSCR[PTION (FIRST TWO DIGT)
A Agriculture, Forestry and Fishing 01 - 09
B Mining 10 - 14
C Construction 15 - 17
D Manuf-icturing 20 - 39
E Transportation, Communications, Electric,
Gas and Sanitary Services 40 - 49
F Wholesale Trade 50 - 51
G Retail Trade 52 - 59
I Finance, Insurance and Real Estate 60 - 67
I Services 70 - 89
J Public Administration 91 - 97
K Non-Class if iable Establishments 99
The major groups of the SIC system are listed below:
I. Processes That Change Molecular Structure of Materials
Sic Code Industry
28 Chemicals and Allied Products
33 Primary Metal Industries
29 Petroleum and Coal Products
26 Paper and Allied Products
13 Oil. and Gas Extraction
II. Processes That Change State or Configuration of Materials
Sic Code Industry
32 Stone, Clay and Glass Products
15 - 17 Construction
20 Food and Kindrod ProTducts
01 - 09 Agriculture
35 Machinery Manufacturing
22 Textile Mill Products
Industry's statements of conservation goals may be considered an
estimate of the combined effects of changes in processes, prices,
regulatory practices, and fuel availability. However, much more detailed
data are needed to analyze the energy embodied in Finished products.
17
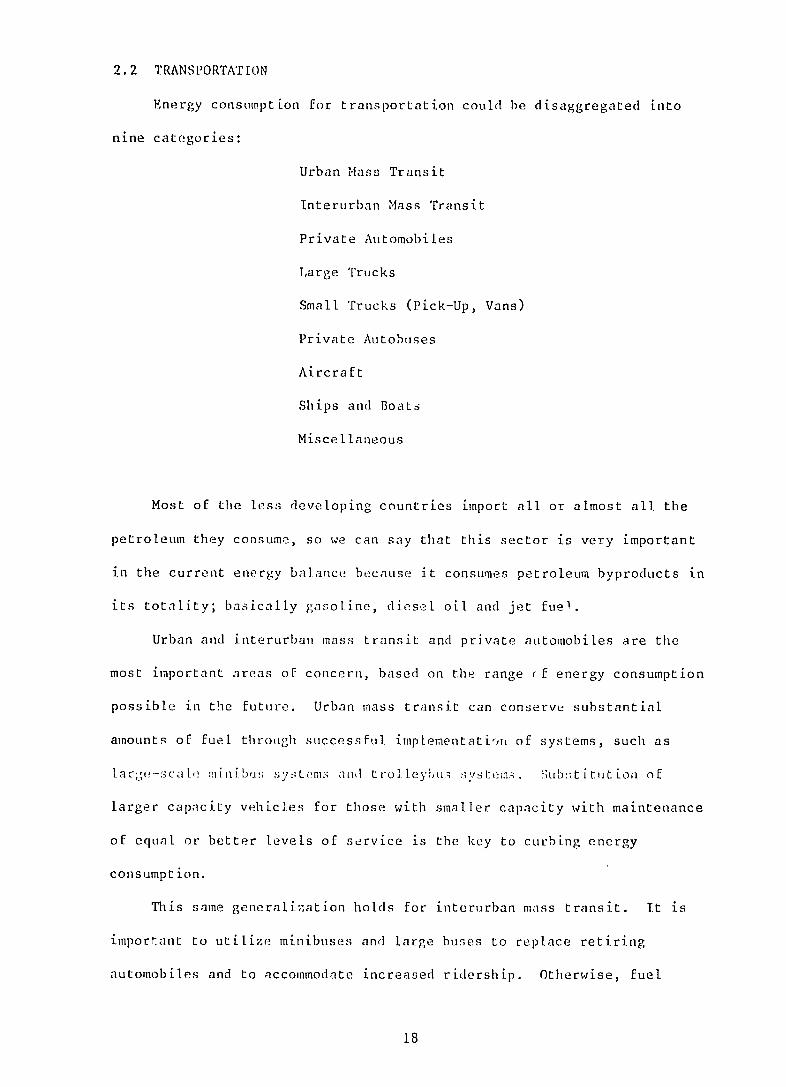
2.2 TRANSPORTATION
Energy consumption for transportation could be disaggregated into
nine categories:
Urban Mass Transit
Interurban Mass Transit
Private Automobiles
Large Trucks
Small Trucks (Pick-Up, Vans)
Private Autobuses
Aircraft
Ships and Boats
Miscellaneous
Most of the less developing countries import all or almost all the
petroleum they consume, so we can say that this sector is very important
in the current energy balance because it consumes petroleum byproducts in
its totality; basically gasotine, diesel oil and jet fuel.
Urban and interurban mass transit and private automobiles are the
most important areas o concern, based on the range f energy consumption
possible in the future. Urban mass transit can conserve substantial
amounts of fuel through successful implementatiorn of systems, such as
large-scao minibus systams nof(d trolleyWi .vs:emg. S;ub:;titltion of
larger capacity vehicles for those with smaller capacity with maintenance
of equal or better levels of service is the key to curbing energy
consumpt ion.
This same generalization holds for interurban mass transit. It is
important to utilize minibuses and large huses to replace retiring
automobiles and to accommodate increased ridership. Otherwise, fuel
18
consump t ion wi I I r ise at an unnecessarily i igh rate.
Private automobiles also have the potential to rapidly increase fuel
usage. For this category it is important to use import tariffs and
licensing and registration fees to encourage the purchasing of the most
efficient atttomobi-s, and to discourage discretionary driving.
Large cargo (arrying trucks have considerable potential to conserve,
but the structure of the trucking system makes it highly unlikely that
more than a small portion of this potential can be realized by year 1990
or even year 2000.
In order to reduce the petroleum consumption in this sector, we sug
gest that the less developing countries, according with their government
energy policies, analyze the possibility of using a new technology in this
field, such as:
a) Electric and Hybrid Vehicles
b) Gasohol
c) Methanol
d) Hydrogen Economy
In the long run, the demand for gas(;oline is derived from the charac
teristics of the stock of motor vehicles. In effect, consumers buy an
entire set of characteristics when they purchase a vehicle. These charac
teristics include size, power, comfort, specific features such as air con
ditioning as well as characteristics such as costs of maintenance, repair,
and fuel. Thlie opti.ial set of characteristics demanded can be expected to
change because of changes in family size and geographic location or because
the cost associated with the various characteristics changes. In general,
higher gasoline prices provide consumers with the incentive to trade size,
performance and comfort for more fuel economy.
19
2.3 COMMERCIAL SECTOR
The commercial sector as defined here consists of the standard
commercial enterprises such as shops, offices, etc. and a residual of
activities not classified elsewhere, such as construction and public
services. This diversity rules out the possibility of characterizing
energy use in the commarcial sector by a single pattern of erd uses.
Somewhat greater uniformity emerges by dividing the sector into the
following subsectors:
a) Standard Commercial Activities - offices, shops, etc.,
b) Construction - mainly the energy demand of equipment and
machinery at construction sites,
c) Government - primarily national and municipal offices,
d) Public Services - water, sewage, garbage, road maintenance,
public lighting, etc.
Primary energy demand in the commercial sector is usually almost
entirely supplied by electricity, LPG and diesel. In order to evaluate
the energy consumption of this sector, we designed a data gathering table
for enterprises (industry and commerce), that is shown in Section 2.1 of
this report.
The problems of energy consumption measurement for commercial
hu id ngi nre more (OFficLit rhan thoso f thme other soctorn covered in
this report, excluding of course the rural sector. These difficulties
stem from several causes:
1) the lack of uniformity in the definition and concept of the
various activities that constitute this sector,
2) the wide diversity of activities covered by the sector and the
diversity in the types of structures and equipment used, and
20
3) the Lack of bas ic dat a necessary to desri ba;en-ergy use even at
the aggregate level.
An examination of tha data currently available for energy consumption
in this sector suggests that data on energy consumption should be col
lected on a sample survey basis to establish benchmark energy consumption
data. The survey design and the sample size should be developed to yield
estimates for the many disparate units of the cozmercial/service sector.
The lack of a consistent definition of the commercial sector seri
ously interferes with careful acccuiating of energy consumption. Energy
used in the commercial/service sector is dominated by commercial activi
ties and the public services. So few details are known about energy use
and the characteristics of energy-consuming structures and equipment in
this sector that the most urgent need is for a benchmark survey of energy
consumption patterns.
Greater consistency would be especially useful in defining and
reporting in those areas of the commercial/service sector that currently
cannot be accurately separpted from the household or industrial sectors.
21
2.4 RIRAL AND [JRI1AN SECTOR
Larger energy supplies and greater efficiency of energy use are
necessary in the rural area of L.D.C.'s (less developing countries) to
meet the basic needs of growing populations. Energy spplies must grow
more rapidly than population in order to raise the quality and quantity of
human diets, increase incomes and employment and relieve human drudgery.
Greater efficiency of energy use, as well as additional sustainable energy
supplies, are needed for cooking, and other domestic activities of rural
households.
In the tropical or sub-tropical climates of most developing coun
tries, more food can be grown on existing cultivated land by double- or
multiple-cropping and by increasing the yield of each crop, that is, the
production per unit area. Both double-cropping and higher yields will
usually require more water for irrigation and larger doses of chemical
fertilizers, as well as use for machinery for seed-bed preparation and
other farm work. All three of these inputs depend upon increasea energy
supplies. In most rural areas, modernization of agriculture also dapends
upon greatly improved transportation to enable the farmer to receive
higher prices for his crops and to lower his costs. Additional energy is
needed to fuel the vehicle (other mode) used in transportation.
Traditionally, nenrly all energy used in rural areas has been of bio
logical origin, in the form of human and animal labor, and wood and other
plant materials. Of these, the greatest untapped potential lies in plant
materials, which are usually designated collectively as Biomass.
Throughout history, the major source of energy for most mankind has
been the photosynthetic conversion of solar into chemical energy. In abso
lute terms, biomass net energy production (photosynthetic production minus
22
plant resprati on) is very large. Mos t of it takes place in the world's
forests.
The quantity of biomass energy that can be utilied in the world
economy is constrained by several factors:
1) the low efficiency of photosynthetic conversion of solar energy,
2) the fact that the sustainable yields from forests are relatively
small fractions of net primary production,
3) the existence of necessary alternative uses for biomas.,
4) the necessity of using non-biomass energy to attain an increase
in sustainable biomass yields,
5) the requirement for substantial investments, if sustainabl.
yields are to be raised,
6) the great distances between many forested areas and the regions
of high energy demand, which require that much energy be used in
transportation of harvested wood to the point of use,
7) the necessity to use some energy in harvesting, and
8) the growing demands for forest land for agriculture and other
human uses.
Another point of view on analysis of energy alternatives for less
developing cuuntries (L.D.C. 's) requires an assessment of present condi
tions and the availability of resources for future energy alternacives, as
well as the identification of socio- techno-economic parameters which have
to be satisfied for tme successful implementation of desirable energy
alternatives.
In fact, the purpose of this report is to identify the major needs
for improved data on energy consumption, to "specify the types of data
that should be collected", and to suggest some general methods of
23
co.lecting and organizing these da ta for use in desi.ging and eva, ati.ng
public policy.
Really, L.D.C.'s total energy consumption depends collectively on
millions of separate decisions and on the social and institutional
structures within which these decisions are made. The use of energy is
deeply rooted in practically every aspect of contemporary social and
economic behavior. Information about how energy is used is inherently
more difficult to collect and organize than information about how energy
is produced. There are several reasons for this:
1) Host energy use decisions are decentralized and highly diverse.
2) Detailed records are seldom kept.
3) Energy costs are a small fraction of the total costs of many
activities.
Accordingly, no single scheme of data classification is likely to be
applicable to the many public policies that may affect how energy is used.
Another thing is that we suggest it useful to discuss energy consumption
in terms of the end users in different sectors of the economy. We
recognize tat the data needed to describe energy consumption is essential
to the formulation of appropriate public policies. For that reason we
designed a data gathering for one of the most important sectors of the
economy, the Rural-Sector (see Section 3.3).
A lot of L.D.C.'s energy use in households falls into relatively
distinct rural and urban consumption patterns. These patterns are
determined, in turn largely by income and the availability of fuels. For
example (Spanish speaking Caribbean island;) in rural households, wood and
to a lesser extent charcoal are predominant energy sources, as these fuels
can be obtained in part at little or no monetary cost.
24
The household sector (urban) is important in an analysis of L[.D.C.'
energy consumption as a direct consumer of energy. In the judgement of
our group project, urban household energy consumption can be modified by a
variety of eimrgy conservation policies that could be adopted in all
levels.
Energy consumption data requiirements for this sector can be classi
fied under two general headings: (1) data required to describe and mea
sure the amount of energy consumed and (2) data required to model and
explain the amount of energy consumed.
On the other hand, explaining the amount of energy consumed in the
household sector requires the data necessary to answer such questions as:
- What would be the effect on the amount of electricity consumed if
the use of natural gas were decontrolled?
- How might households change their use of appliances if they knew
the actual energy costs of operating them?
Answering such questions requires other information besides the
physical amounts of energy consumed. Information is also needed on the
factors that determine the amount of energy consumed (e.g. prices of fuels
and electricity prices of other goods) (see Section 3.2).
25

SECTION 3
TABLES FOR DATA GATHERING
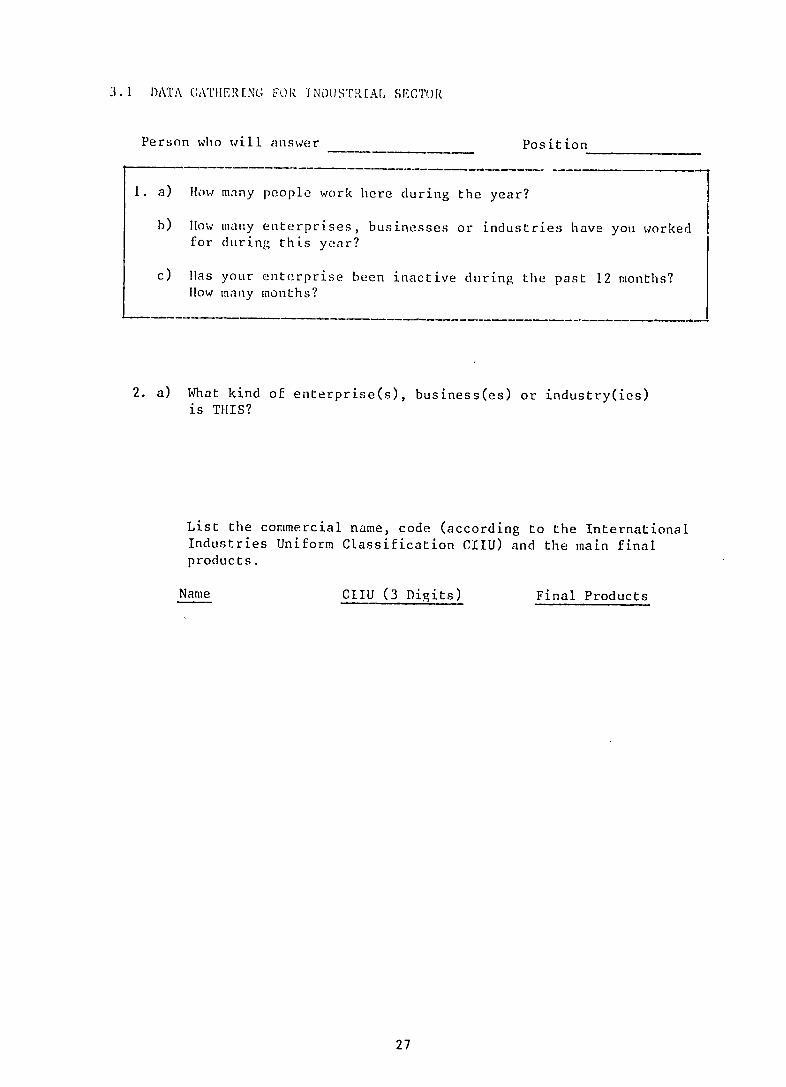
3.1 DATA (;ATHERING FOR INDUSTRAl, SECTOR
Person who will answer Position
1. a) low many people work here during the year?
b) flow many enterprises, businesses or industries have you worked for during this year?
c) Has your enterprise been inactive during the past 12 months? How many months?
2. a) What kind of enterprise(s), business(es) or industry(ies) is THIS?
List the commercial name, code (according to the International Industries Uniform Classification CIIU) and the main final products.
Name CIIU (3 Digits) Final Products
27
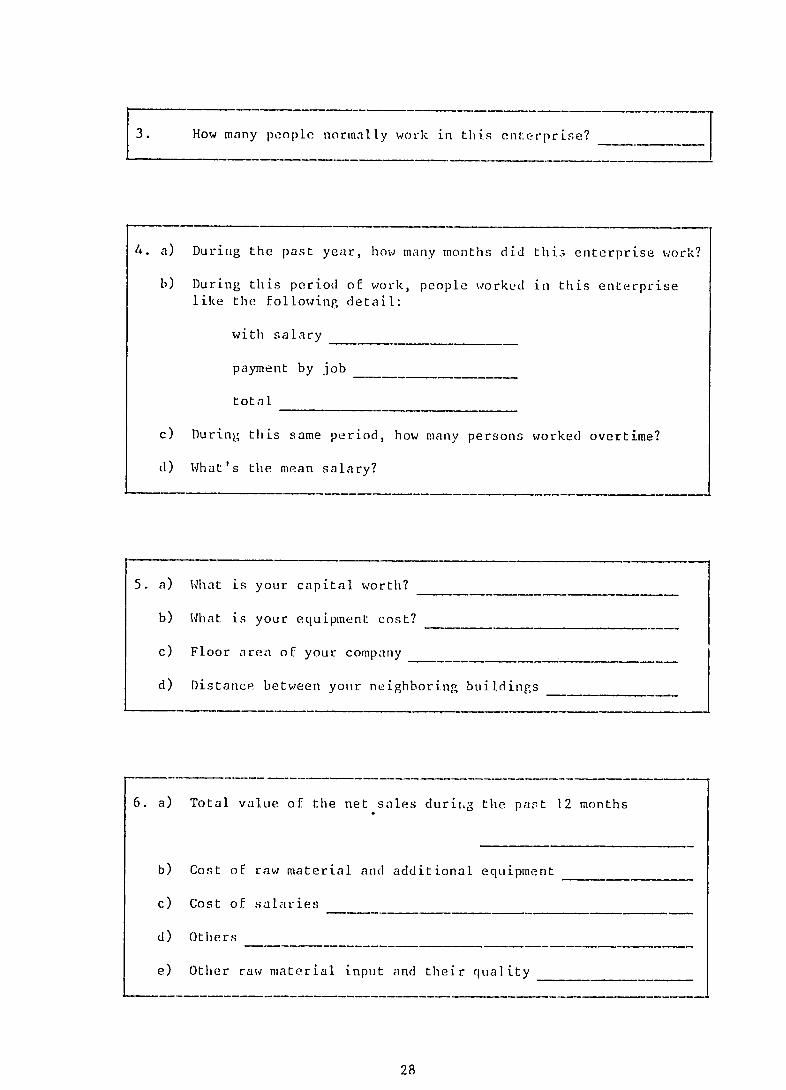
How many people normally work in this enterprise?
4. a) During the past year, how many months did this enterprise work?
b) During this period of work, people worked in this enterprise like tile following detail:
with salary
payment by job
total
c) During this same period, how many persons worked overtime?
d) What's the mean salary?
5. a) What is your capital worth?
b) What is your equipment cost?
c) Floor area of your company
d) Distance between youir neighboring buildings
6. a) Total value of the net sales duriig the part 12 months
b) Cost of raw material and additional equipment
c) Cost of salaries
d) Others
e) Other raw material input and their quality
28
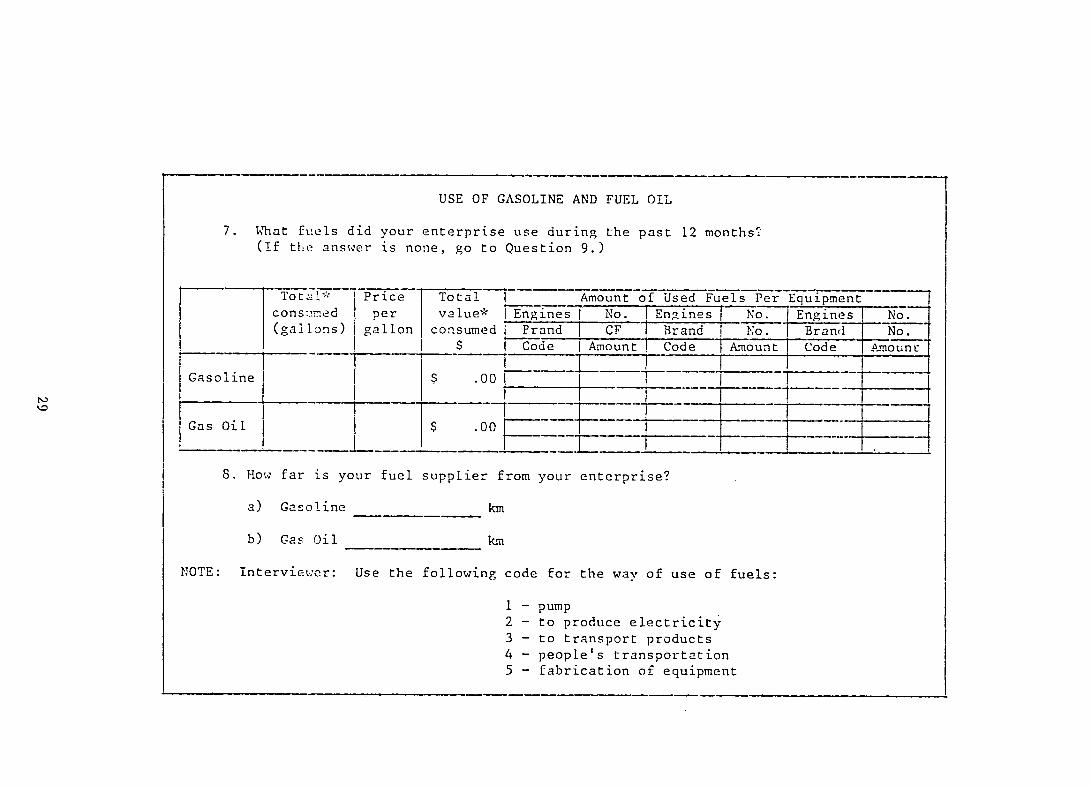
USE OF GASOLINE AND FUEL OIL
7. That fuels did your enterprise use during the past 12 months? (If the answer is none, go to Question 9.)
TotaL*
consumed
Price
per
Total
value*
Amount of Used Fuels Per Equipment Engines I No. Engines No. Engines No.
(gallons) gallon consumed Frand CF Brand No. Brand No. $ Code I Amount Code Amount Code Amounr:
Gasoline $ .00 __ T
Gas Oil $ .00_I __
8. How far is your fuel supplier from your enterprise?
a) Gasoline km
b) Gas Oil km
NOTE: Interviewer: Use the following code for the way of use of fuels:
1 - pump 2 - to produce electricity 3 - to transport products
4 - people's transportation 5 - fabrication of equipment
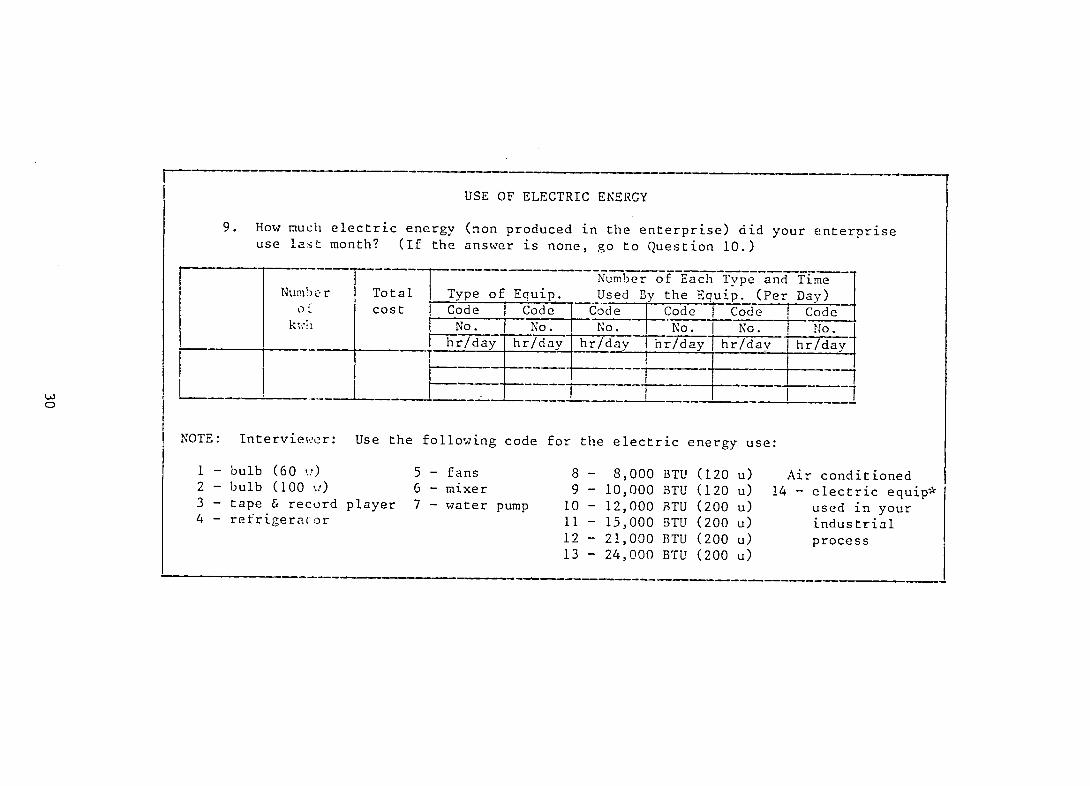
USE OF ELECTRIC ENERGY
9. How much electric energy (non produced in the enterprise) did your enterprise use last month? (If the answer is none, go to Question 10.)
Number of Each Type and Time Number Total Type of Equip. Used By the Equip. (Per Day)
oF cost Code Code 1 Code Code Code Code kh No. No1. No. No. [No. No.
hr/day hr/day hr/day hr/day hr/day hr/day
NOTE: Interviewer: Use the followin code for the electric energy use:
1 -bulb (60 w) 5 - fans 8 - 8,000 BTU (120 u) Air conditioned 2 - bulb (100 .:) 6 - mixer 9 - 10,000 BTU (120 u) 14 - electric equip* 3 - tape & record player 7 - water pump 10 - 12,000 BTU (200 u) used in your 4 - refrigeravor 11 - 15,000 BTU (200 u) industrial
12 - 21,000 BTU (200 u) process 13 - 24,000 BTU (200 u)
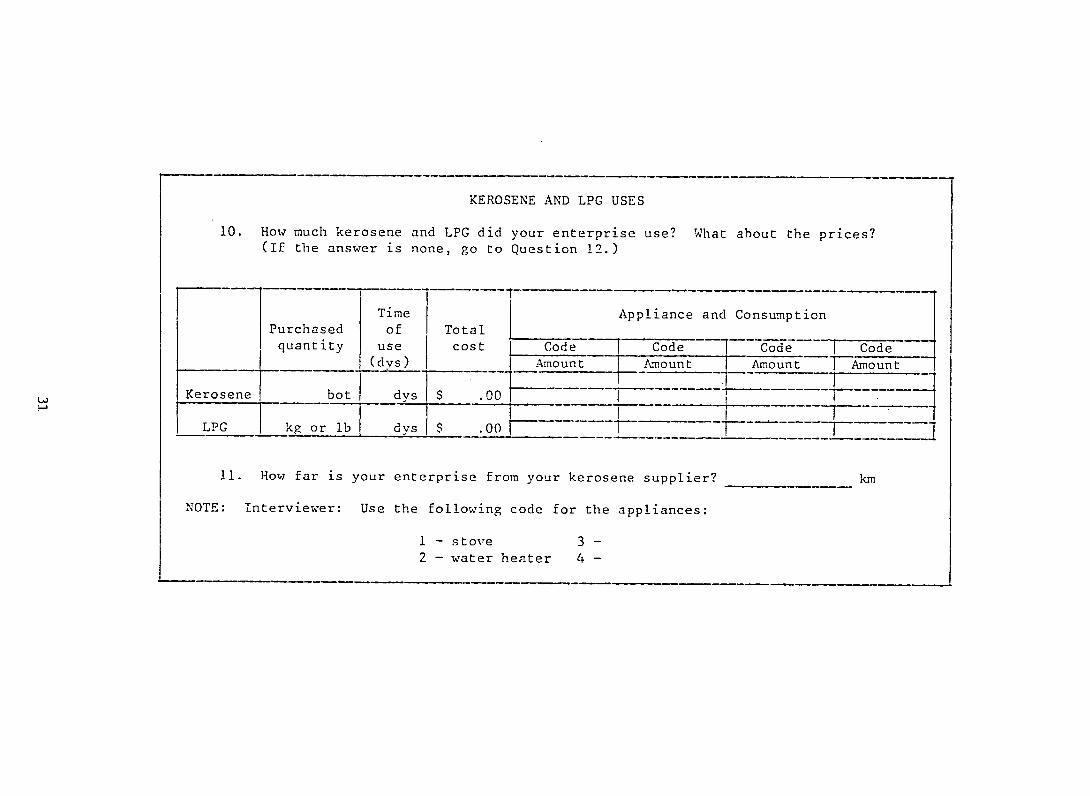
KEROSENE AND LPG USES
10. How much kerosene and LPG did your enterprise use? What about the prices? (If the answer is none, go to Question 12.)
Time Appliance and ConsumptionPurchased 0of Total
quantity use cost Code Code -Code Code
(dys) Amount k-Aount Amount Amount
Kerosene bot dys $ .00__--
LPG kg or lb dys $ .00 ]
11. How far is your enterprise from your kerosene supplier? km
NOTE: Interviewer: Use the following code for the appliances:
1 - stove 3 2 - water heater 4
__
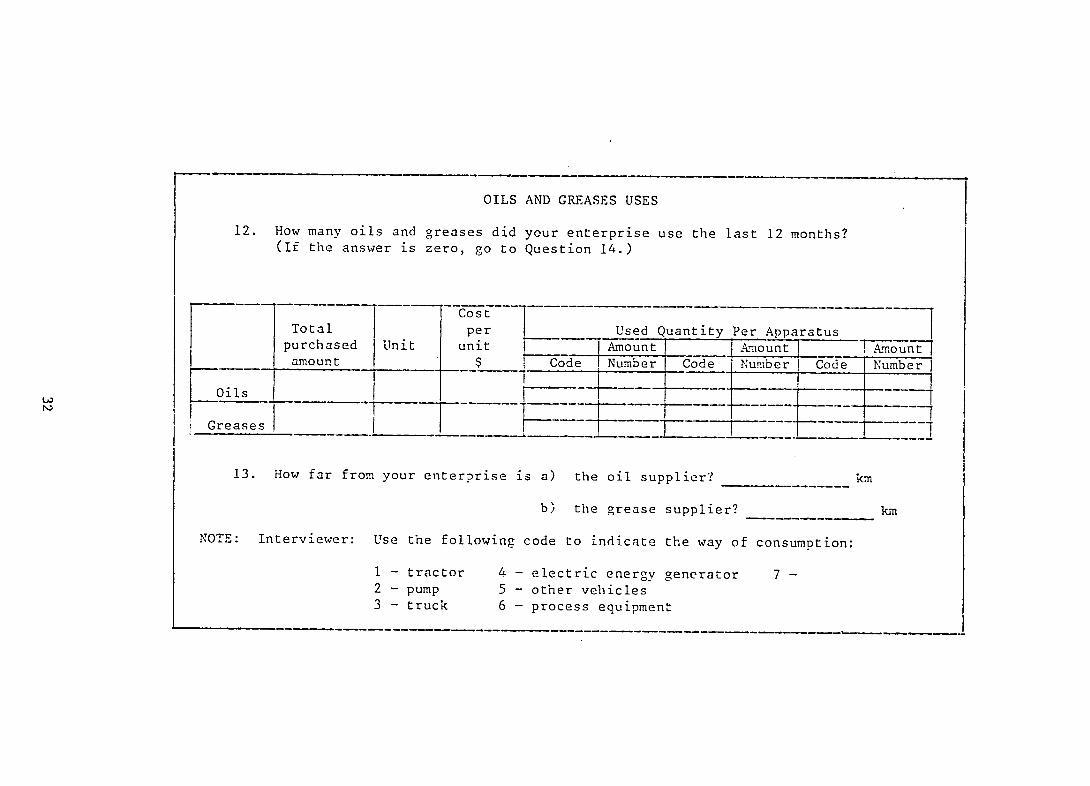
OILS AND GREASES USES
12. How many oils and greases did your enterprise use the last 12 months? (If the answer is zero, go to Question 14.)
Cost Total per Used Quantity Per Apparatus purchased Unit unit Amount Amount IA.mount amount $ Code Number Code Number Code Number
Oils I
Greases ___ _
13. How far from your enterprise is a) the oil supplier? km
b) the grease supplier? km
NOTE: Interviewer: Use the following code to indicate the way of consumption:
1 - tractor 4 - electric energy generator 7
2 - pump 5 - other vehicles 3 - truck 6 - process equipment
7
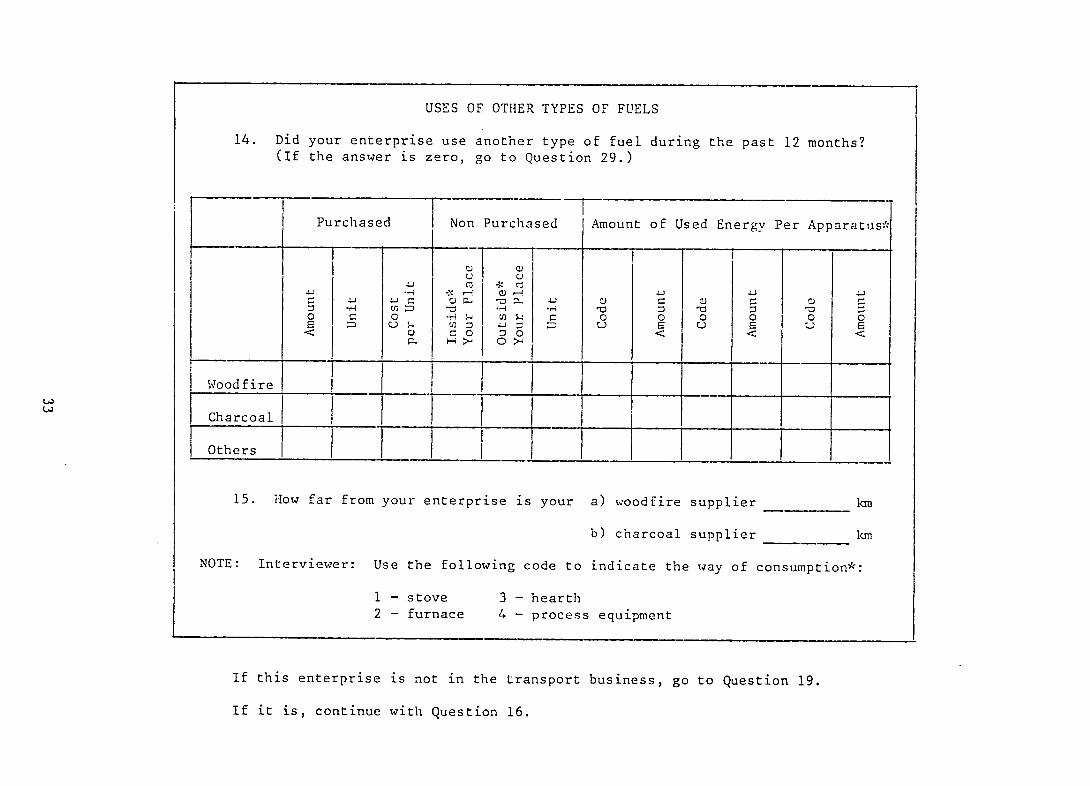
USES OF OTHER TYPES OF FUELS
14. Did your enterprise use another type of fuel during the past 12 months? (If the answer is zero, go to Question 29.)
Purchased Non Purchased Amount of Used Energy Per Apparatus*
C. CM c f0 0 00
o - = = o <0 0
<
Wood fire_
Charcoal[
Others
15. How far from your enterprise is your a) woodfire supplier km
b) charcoal supplier km
NOTE: Interviewer: Use the following code to indicate the way of consumption*:
1 - stove 3 - hearth 2 - furnace 4 - process equipment
If this enterprise is not in the transport business, go to Question 19.
If it is, continue with Question 16.
0
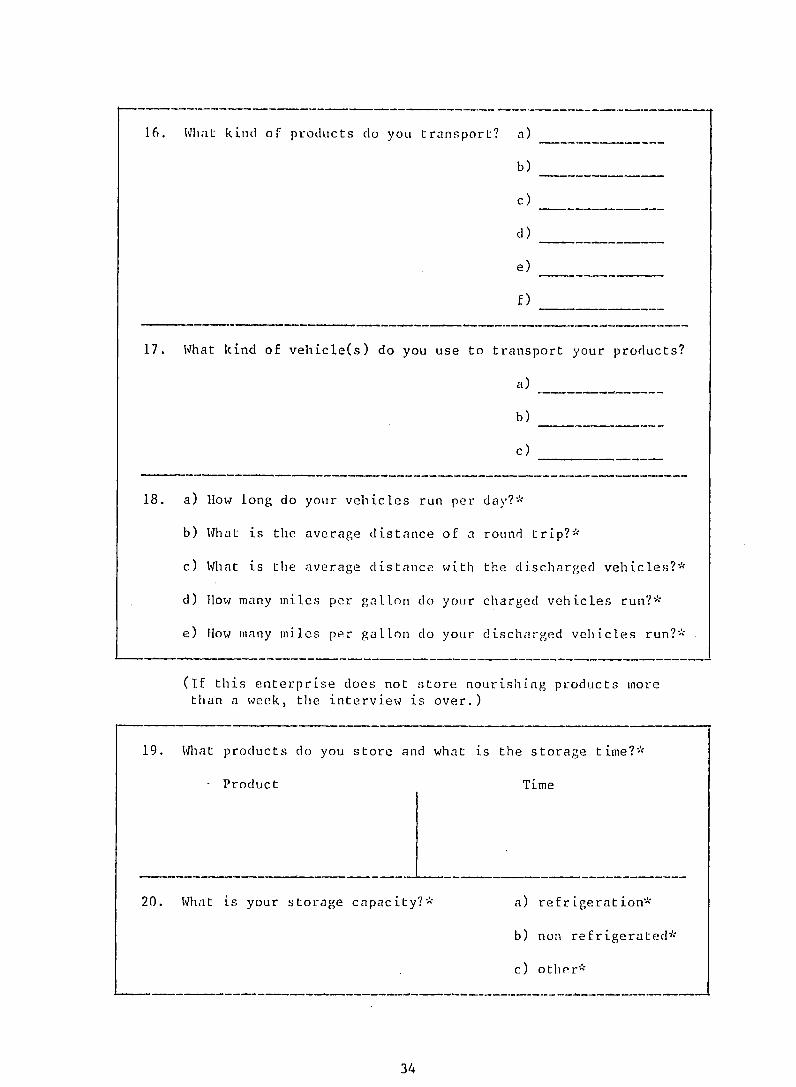
16. What kind of products do you transport? a)
b)
c) --- -
d)
e)
f)
17. What kind of vehicle(s) do you use to transport your products?
a)
b)
c)
18. a) How long do your vehicles run per day?*
b) What is the average distance of a round trip?*
c) iat is the average distance with the discharged vehicles?*
d) How many miles per gallon do your charged vehicles run?*
e) How many miles per gallon do your discharged vehicles run?*
(If this enterprise does not store nourishing products more than a week, the interview is over.)
19. Whiat products do you store and what is the storage time?*
- Product Time
20. What is your storage capacity?* a) refrigeration*
b) non refrigerated*
c) other*
34

3.2 DATA GATHERING FOR URBAN HOUSEHOLD
Date: flour:
Address:
Name of Head of Household:
interview No: Interviewer's Nae:
City: Region:
FAMILY SIZE
1. a) how many persons actually live in your house, including your own family, relatives and friends. Total
b) flow many are over 64 years old?
c) How many are men between 15 and 64?
d) flow many are women between 15 and 64?
e) flow many are under 15 years old?
35
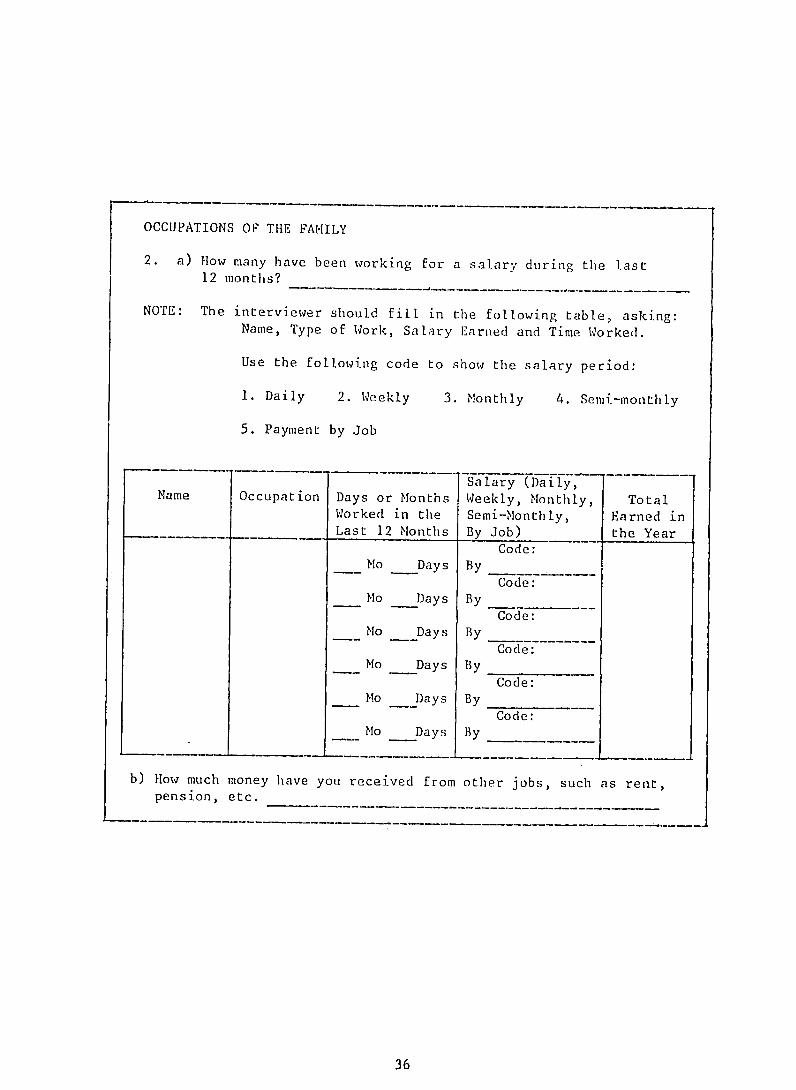
OCCUPATIONS OF THE FAMILY
2. a) How many have been working for a salary during the last 12 months?
NOTE: The interviewer should fill in the following table, asking: Name, Type of Work, Salary Earned and Time Worked.
Use the following code to show the salary period:
1. Daily 2. Weekly 3. Monthly 4. Semi-monthly
5. Paymnent by Job
Name Occupation Days or Months Salary (Daily, Weekly, Monthly, Total
Worked in the Semi-Monthly, Earned in Last 12 Months By Job) the Year
Code: Mo Days By
Code: Mo Days By
Code: Mo _Days By
Code: Mo ____Days By
Code: __ Mo Days By
Code: __ Mo Days By
b) How much money have you received from other jobs, such as rent, pension, etc.
36

WOOD UTILIZATION
3. a) During the last 7 days, how many wood sticks use for domestic purposes in your home?
or logs did you
(If the answer is zero, go to Question 4.)
b)
c)
What was the cost of
Who bought the wood?
the wood used in the last 7 days?
d) How much of the wood was free?
e) How do you obtain the wood?
f) In what way was the wood used?
1. Quantity
2. Qualnt ity_
g)
3.
What type of stove do you use?
Quantity
Interviewer: Sketch the stove:
h) What type (specie) of wood is used?
Type or specie
Type or specie
Type or specie
i) What is the distance you obtain the wood?
(in kin) between your house and the place
j) What is the average diameter of the wood that you use?
37

KEROSEINE UTILIZATION
4. a) How many bottles of kerosene did you use in the last 7 days in your house for domestic purposes?
(If the answer is zero, go to Question 5.)
b) What was the cost of the kerosene used?
c) In what way was the kerosene used?
1. Bottles
2. Bottles
d) What is the distance (in kin) between your house and the . place you obtain the kerosene?
e) What is the size of the container you use to buy the kerosene? i vers
f) How long does the kerosene in the container last? days
'COAL UTILIZTION
5. a) How much coal did you use the last 7 days in your house for domestic purposes? cans sacks
b) What was the cost of the coal used?
c) flow much of the coal was free?
d) In what way was the coal. used?
1. cans sacks
2. cans sacks
e) What is the distance (in kin) between your house and the place you obtain the coal?
f) How many containers of coal do you buy each time?
g) How long does each container last? days
38
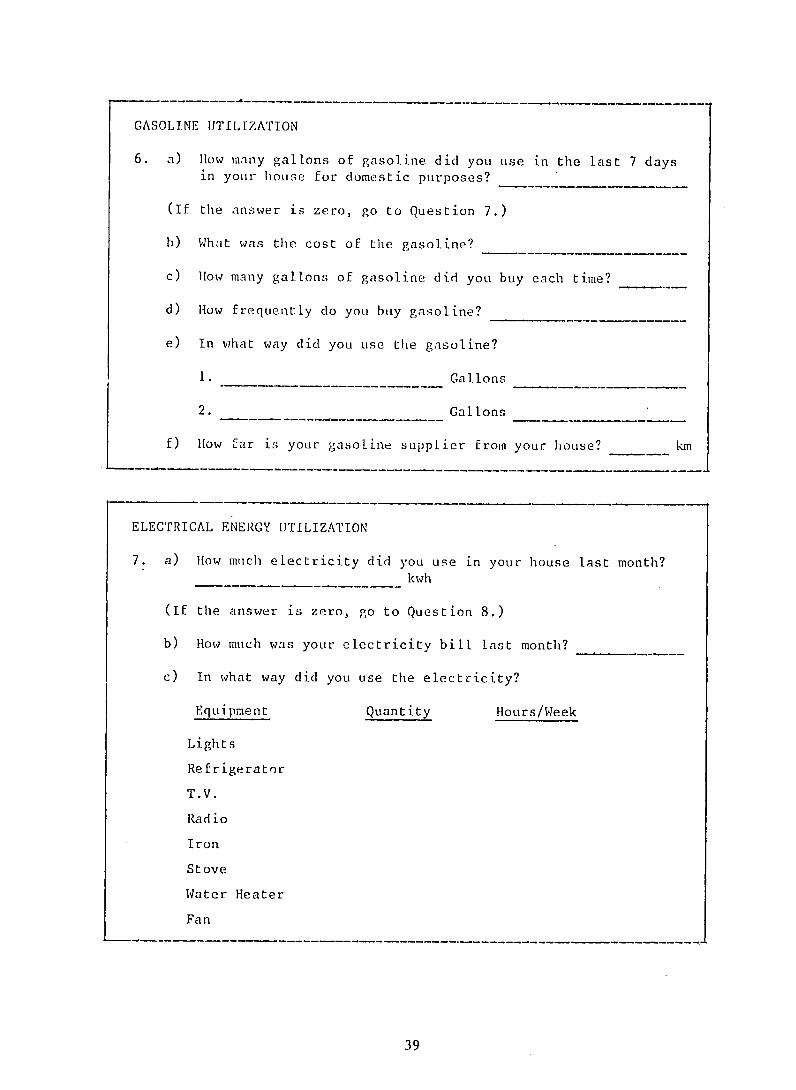
GASOLINE UTILIZATION
6. a) How many gallons of gasoline did you use in the last 7 days in your house for domestic purposes?
(If the answer is zero, go to Question 7.)
b) What was the cost of the gasoline?
c) How many gallons of gasoline did you buy each time?
d) flow frequently do you buy gasoline?
e) In what way did you use the gasoline?
1. Gallons
2. Gallons
f) How far is your gasoline supplier from your hloUse? km
ELECTRICAL ENERGY UTILIZATION
7. a) How much electricity did you use in your house last month? kwh
(If the answer is zero, go to Question 8.)
b) How much was your electricity bill last month?
c) In what way did you use the electricity?
Equipment Quantity Hours/Week
Lights
Refrigerator
T.V.
Rad io
Iron
Stove
Water Heater
Fan
39
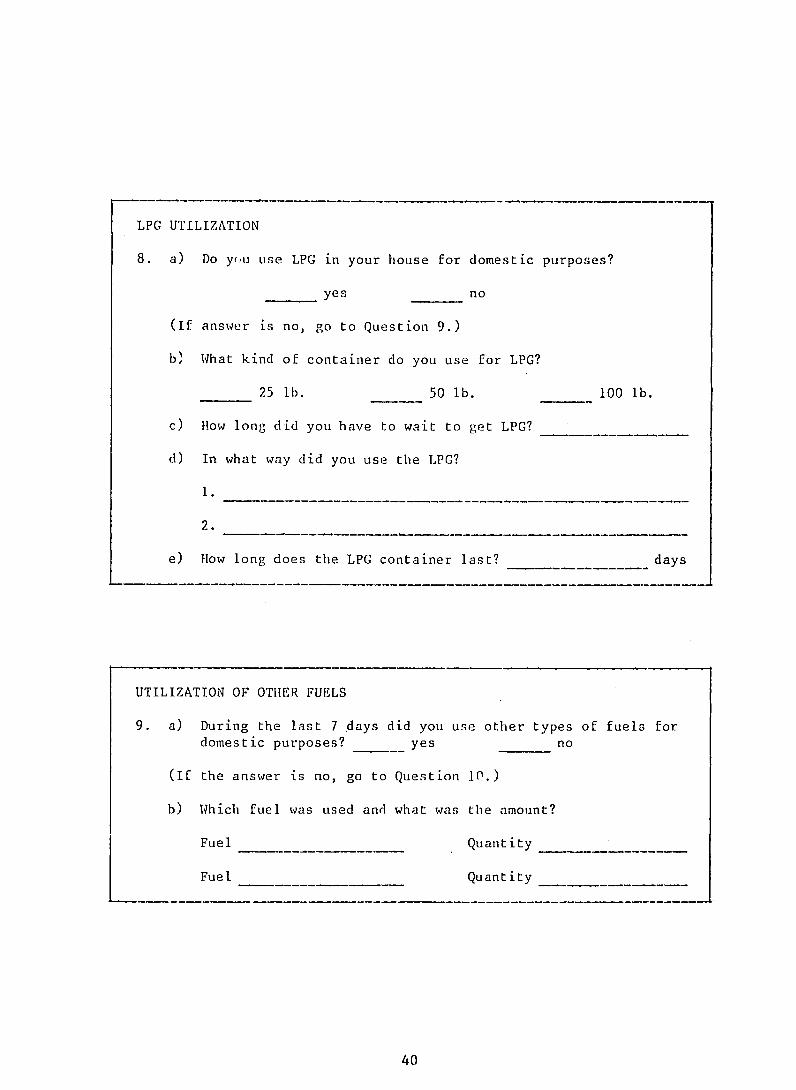
LPG UTILIZATION
8. a) Do yOU use LPG in your house for domestic purposes?
yes no
(If answer is no, go to Question 9.)
b) What kind of container do you use for LPG?
25 lb. 50 lb. 100 lb.
c) How long did you have to wait to get LPG?
d) In what way did you use the LPG?
2.
e) How long does the LPG container last? days
UTILIZATION OF OTHER FUELS
9. a) During the last 7 days did you use other types of fuels for domestic purposes? yes no
(If the answer is no, go to Question 10.)
b) Which fuel was used and what was the amount?
Fuel Quant ity
Fuel Quantity
40
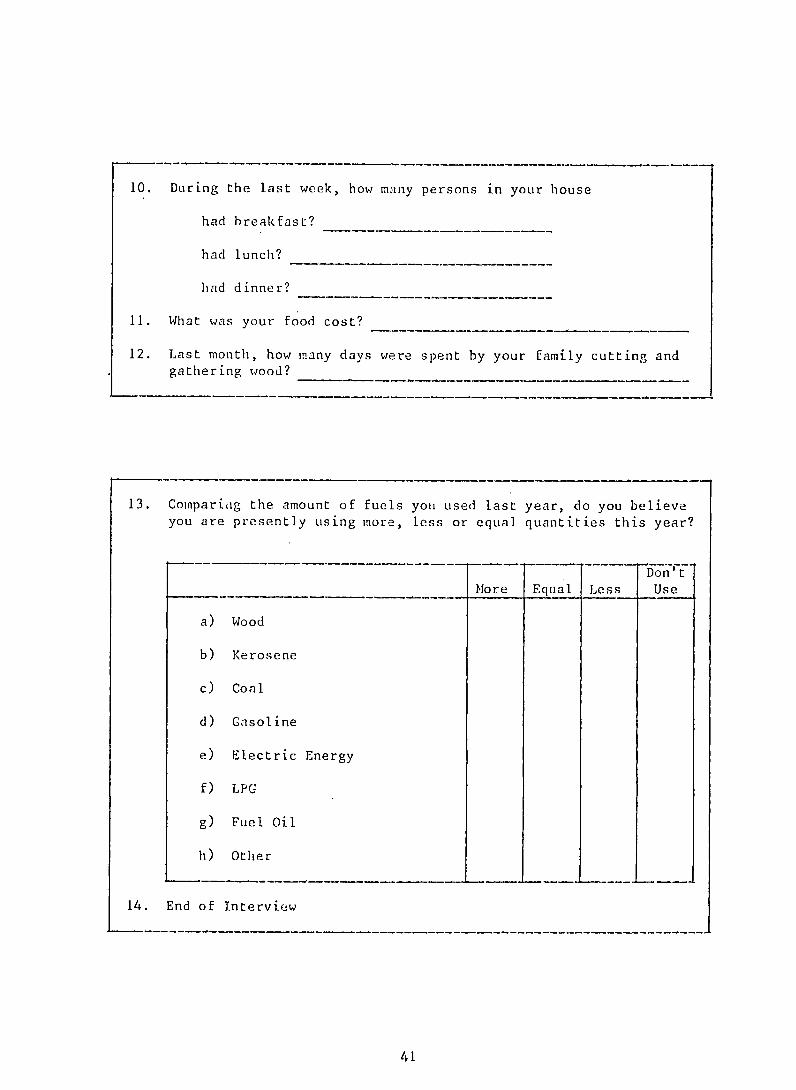
10. During the last week, how many persons in your house
had breakfast?
had lunch?
had dinner?
11. What was your food cost?
12. Last month, how many days were spent by your family cutting and gathering wood?
13. Compariag the amount of fuels you used last year, do you believe you are presently using more, less or equal quantities this year?
Don' t More Equal Less Use
a) Wood
b) Kerosene
c) coal
d) Gasoline
e) Electric Energy
f) LPC
g) Fuel Oil
h) Other
14. End of Interview
41
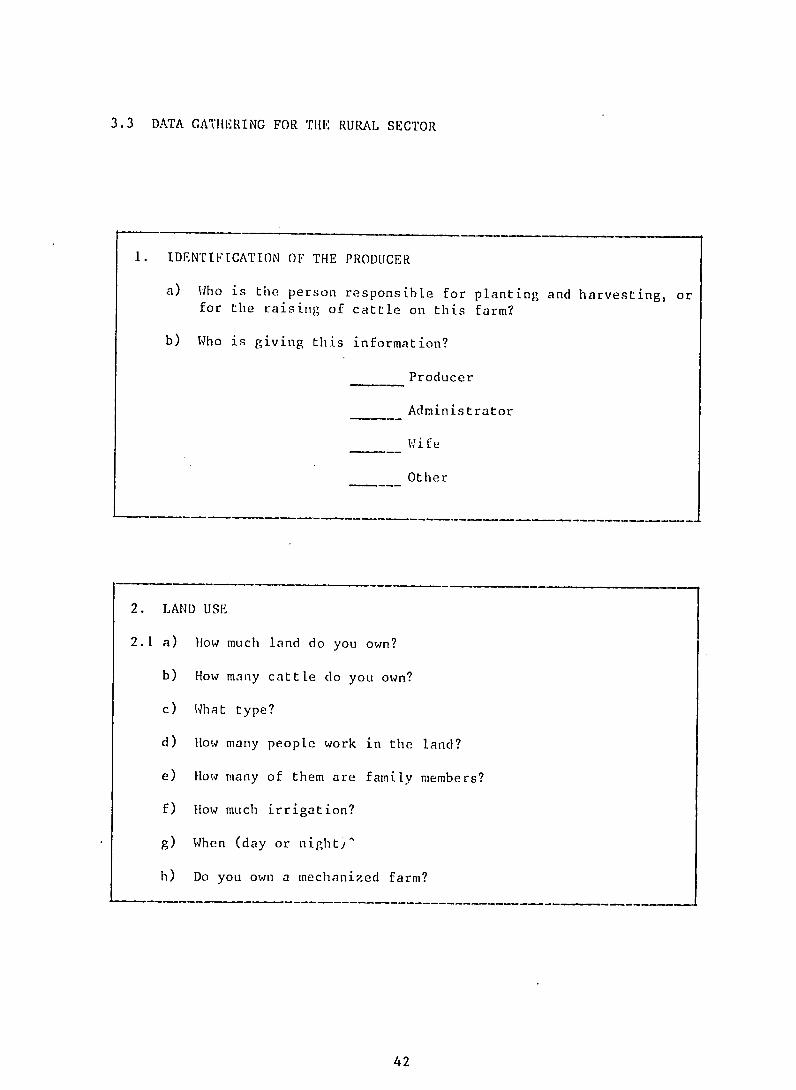
3.3 DATA GATHERING FOR THE RURAL SECTOR
I. IDENTIFICATION OF THE PRODUCER
a) Who is the person responsible for planting and harvesting, or for the raising of cattle on this farm?
b) Who is giving this information?
Producer
Administrator
Wife
Other
2. LAND USE
2.1 a) low much land do you own?
b) How many cattle do you own?
c) What type?
d) How many people work in the land?
e) How many of them are family members?
f) Flow much irrigation?
g) When (day or night j
h) Do you own a mechanized farm?
42
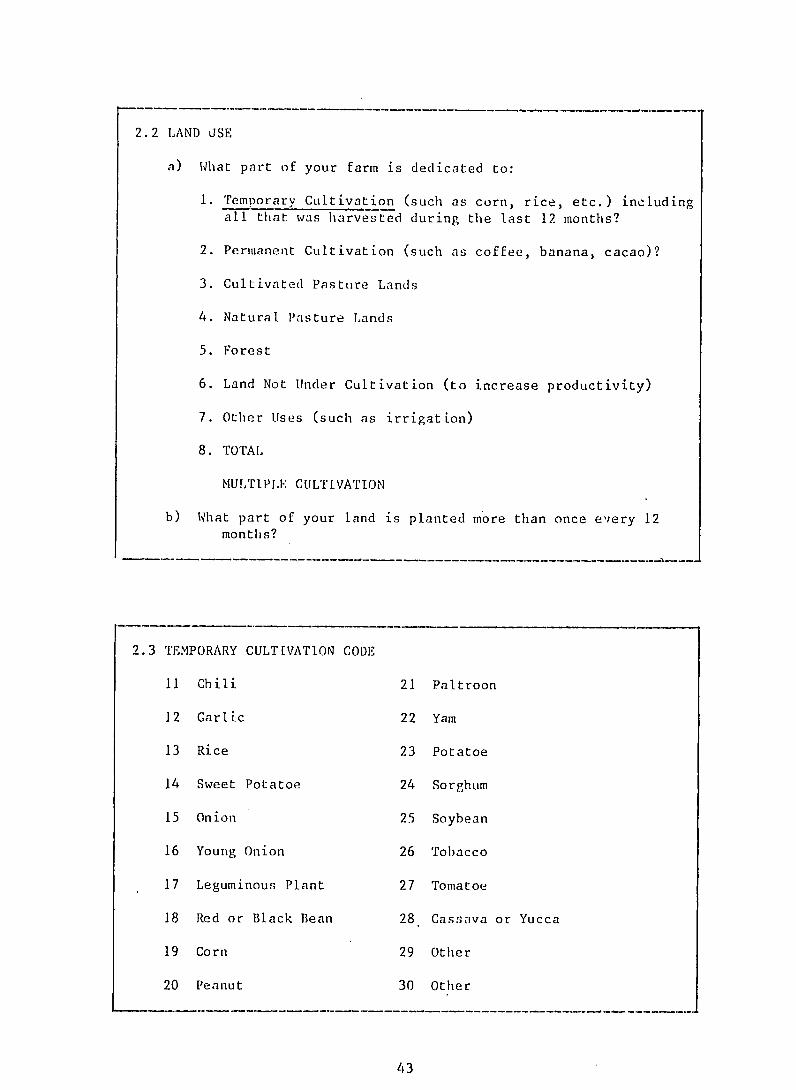
2.2 LAND USE
a) What part of your farm is dedicated to:
1. Temporary Cultivation (such as corn, rice, etc.) including all that was harvested during the last 12 months?
2. Permanent Cultivation (such as coffee, banana, cacao)?
3. Cultivated Pasture Lands
4. Natural Pasture Lands
5. Forest
6. Land Not Under Cultivation (to increase productivity)
7. Other Uses (such as irrigation)
8. TOTAL
MULTIPLE CULTIVATION
b) What part of your land is planted more than once e'very 12 months?
2.3 TEMPORARY CULT[VATION CODE
11 Chili 21 Paltroon
12 Garlic 22 Yam
13 Rice 23 Potatoe
14 Sweet Potatoe 24 Sorghum
15 Onion 25 Soybean
16 Young Onion 26 Tobacco
17 Leguminous Plant 27 Tomatoe
18 Red or Black Bean 28 Cassava or Yucca
19 Corn 29 Other
20 Peanut 30 Other
43
------------- -------------------
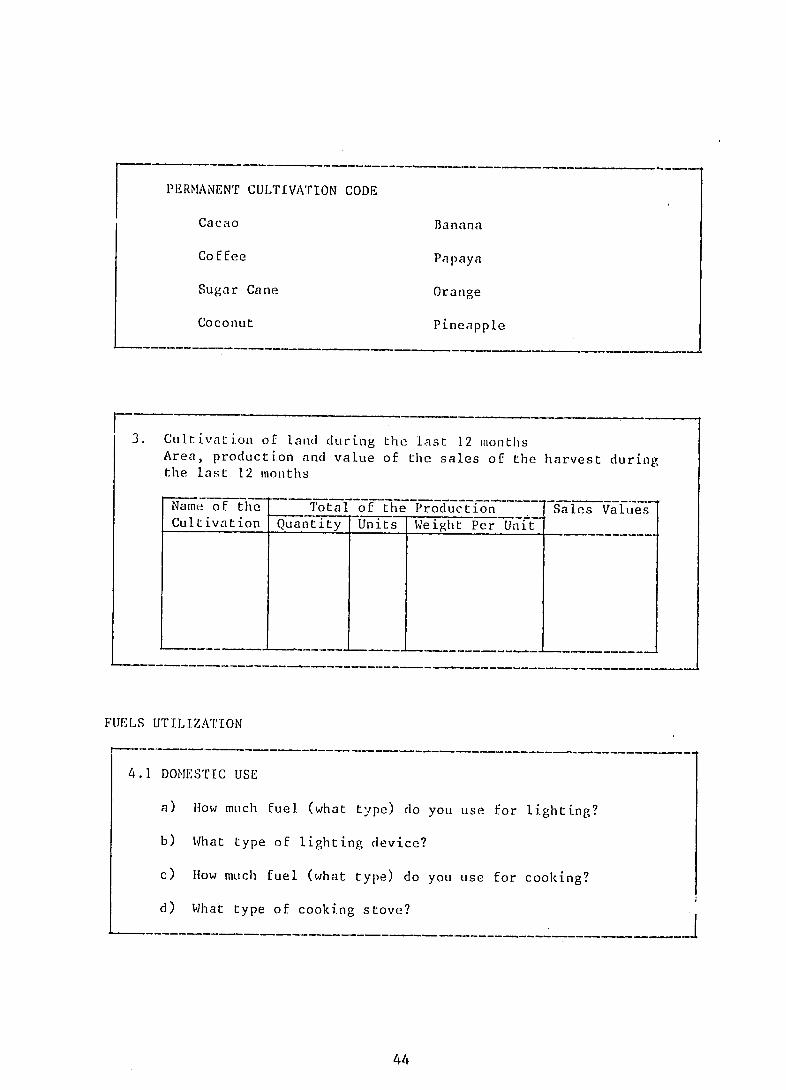
PERMANENT CULTIVATION CODE
Cacao Banana
Coffee Papaya
Sugar Cane Orange
Coconut Pineapple
3. Cultivat ion of laad during the last 12 months Area, production and value of the sales of the harvest during the last 12 months
Name of thle Total of the Production Sales Values Cultivation Quantity Units Weight Per Unit
FUELS UTILIZATION
4.1 DOMESTIC USE
a) How much fuel (what type) do you use for lighting?
b) What type of lighting device?
c) flow much fuel (what type) do you use for cooking?
d) What type of cooking stove?
44
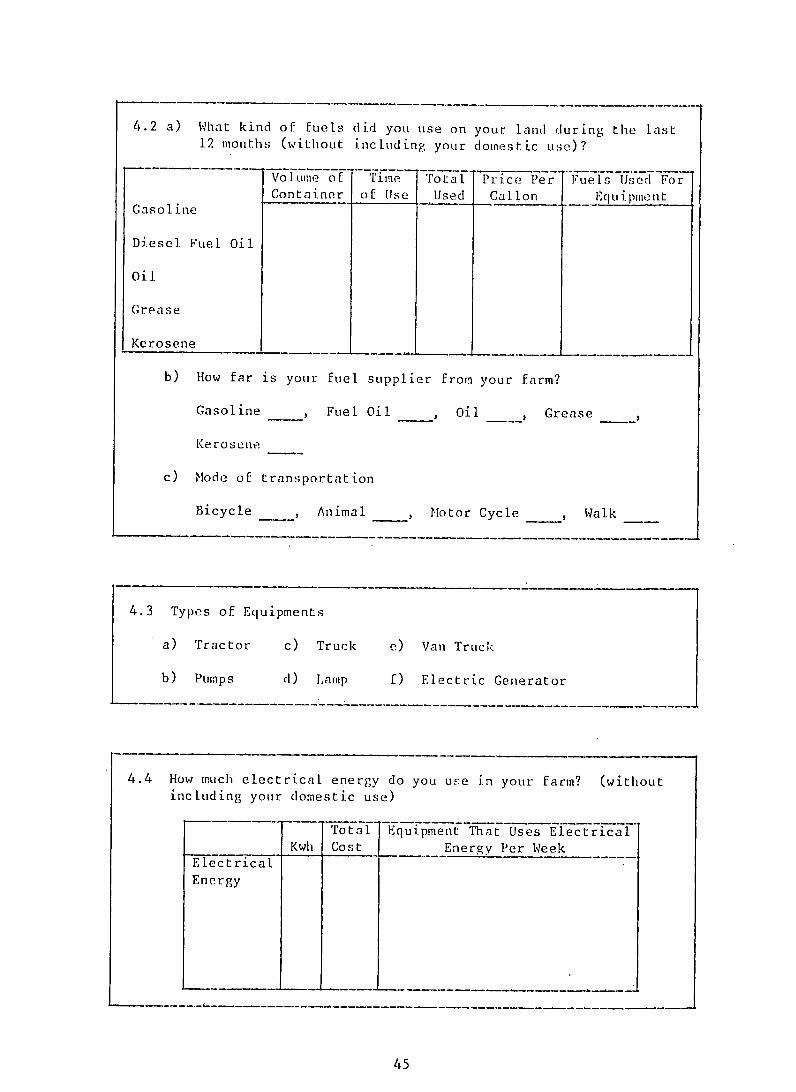
4.2 a) What kind of fuels did you use on your land during the last 12 months (without including your domestic use)?
Volume of Time Total Price Per Fuels Used For Container of Use Used Gallon Equipment
Gasoline
Diesel Fuel Oil
Oil
Grease
Kerosene
b) How far is your fuel supplier from your farm?
Gasoline , Fuel Oil , Oil , Grease
Kerosene
c) Mode of transportation
Bicycle , Animal , Motor Cycle , Walk
4.3 Types of Equipments
a) Tractor c) Truck e) Van Truck
b) Pumps d) Lamp f) Electric Generator
4.4 How much electrical energy do you use in your farm? (without including your domestic use)
Total Equipment That Uses E]ectrical Kwh Cost Energy Per Week
Electrical Energy
45
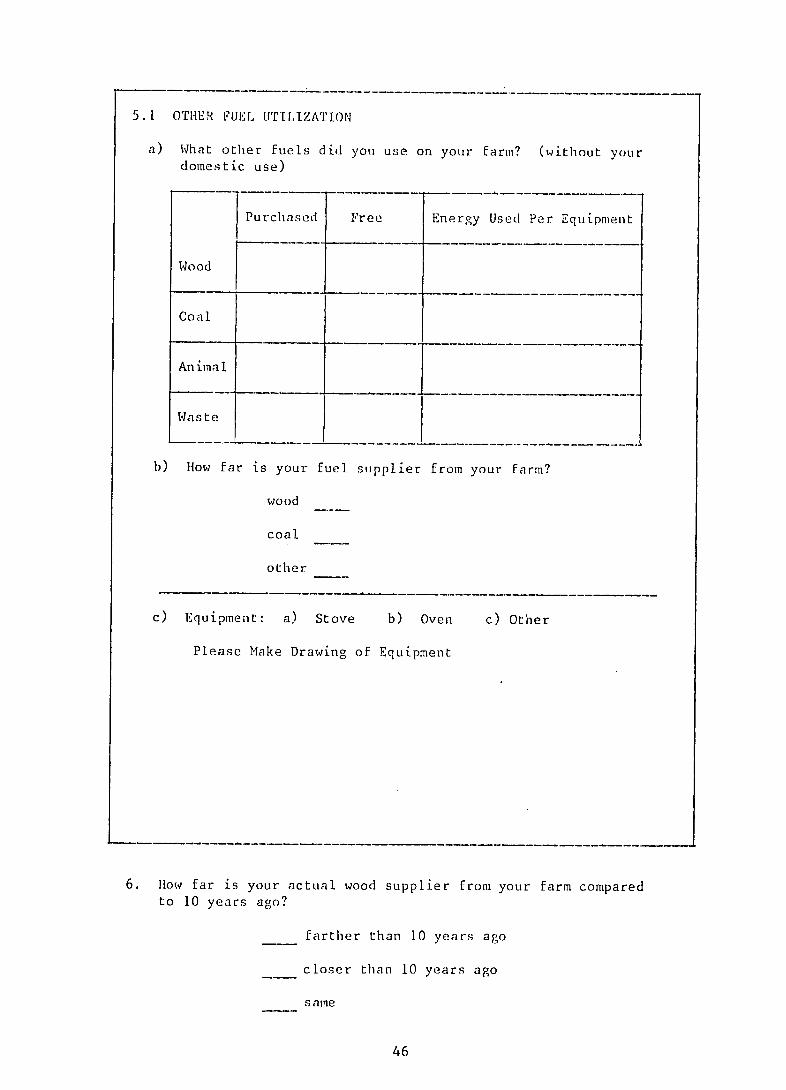
5.1 OTHER FUEL UT[LIZATION
a) What other fuels did you use on your farm? (without your domestic use)
Purchased Free Energy Used Per Equipment
Wood
Coal
An ima I
Waste
b) How far is your fuel supplier from your farm?
wood
coal
other
c) Equipment: a) Stove b) Oven c) Other
Please Make Drawing of Equipment
6. How far is your actual wood supplier from your farm compared
to 10 years ago?
farther than 10 years ago
closer than 10 years ago
same
46

SECTION 4
CONCLUSIONS AND RECOMMENDATIONS
1 .2/-1
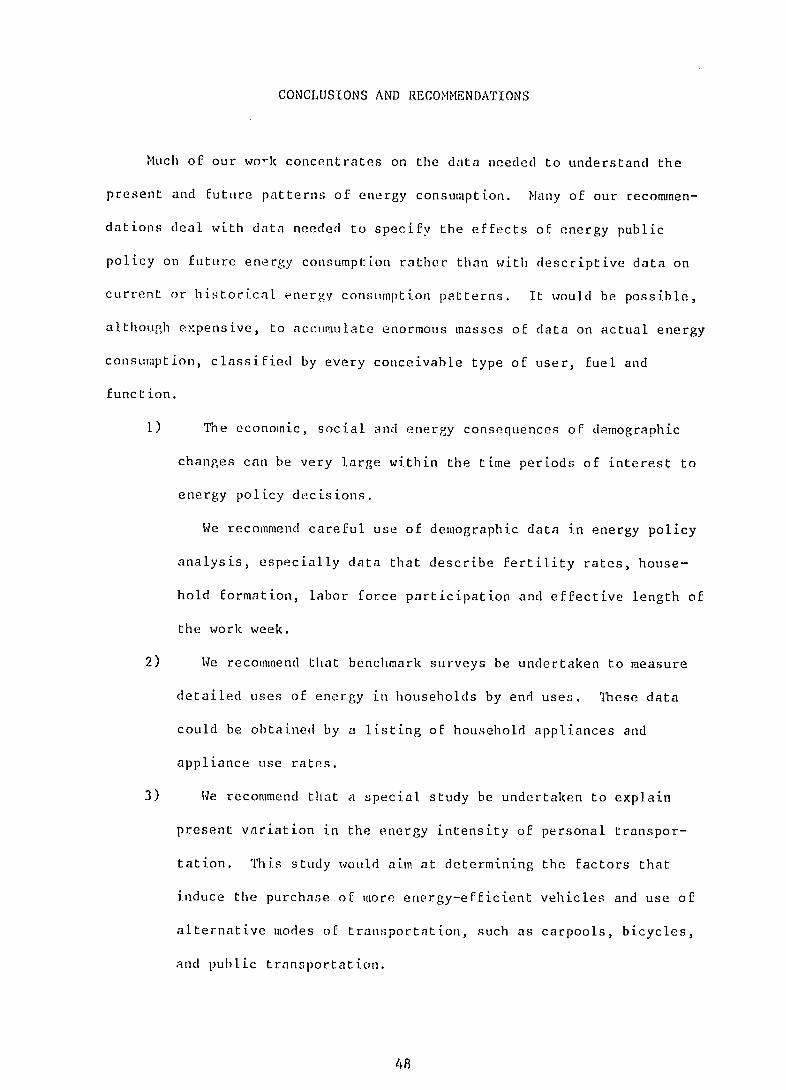
CONCLUSIONS AND RECOMMENDATIONS
Much of our wok concentrates on the data needed to understand the
present and future patterns of energy consumption. Many of our recommen
dations deal with data needed to specify the effects of energy public
policy on future energy consumption rather than with descriptive data on
current or historical energy consumption patterns. It would be possible,
although expensive, to accumulate enormous masses of data on actual energy
consumption, classified by every conceivable type of user, fuel and
function.
1) The economic, social and energy consequences of demographic
changes can be very large within the time periods of interest to
energy policy decisions.
We recommend careful use of demographic data in energy policy
analysis, especially data that describe fertility rates, house
hold formation, labor force participation and effective length of
the work week.
2) We recommend that benchmark surveys be undertaken to measure
detailed uses of energy in households by end uses. These data
could be obtained by a listing of household appliances and
appliance use rates.
3) We recommend that a special study be undertaken to explain
present variation in the energy intensity of personal transpor
tation. T7his study would aim at determining the factors that
induce the purchase of more energy-efficient vehicles and use of
alternative modes of transportation, such as carpools, bicycles,
and public transportation.
48
4) For energy-intensive industries, data are needed on both total
energy consumfption and energy consumption per "nit of specific
product output. These data should be in both physical and ($)
dollar or peso units and should be clas siflied by fuel type. In
general, annual or biennial data would be sufficient for these
industries, since major process changes take place gradually.
Moreover, for some industries, studies should be made to deter
mine the amotnts of energy used for alternative processes that
are in active use for the same basic product but that are signi
ficantly different in energy use.
5) We recommend that a benchmark survey of energy use in
commercial buildings be undertaken. This survey should obtain
information on energy used, with appropriate specification of
sub-categories.
49

SECTION 5
REFERENCE S
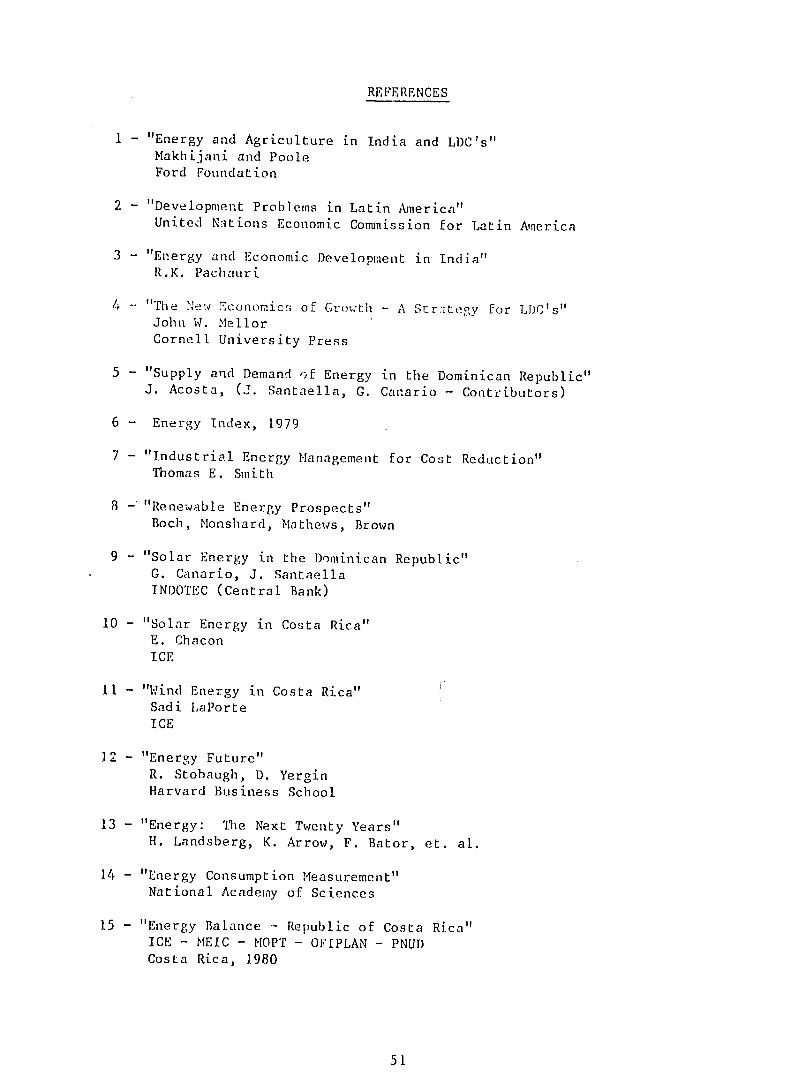
REFERENCES
1 - "Energy and Agriculture in India and LDC's"
Makhijani and Poole Ford Foundation
2 - "Development Problems in Latin America" United Nations Economic Commission for Latin America
3 - "Energy and Economic Development in India" R.K. Pachauri
4 -- "The New Economic j of Growth - A Strategy for L)C'sI' John1 W. Mellor Cornell University Press
5 - "Supply and Demand o.f Energy in the Dominican Republic" J. Acosta, (J. Santaella, G. Canario - Contributors)
6 - Energy Index, 1979
7 - "Industrial Energy Management for Cost Reduction" Thomas E. Smith
8 - "Renewable Energy Prospects" Boch, Monshard, Mathews, Brown
9 - "Solar Energy in the Dominican Republic" G. Canario, J. Santaella INDOTEC (Central Bank)
10 - "Solar Energy in Costa Rica" E. Chacon
ICE
11 - "Wind Energy in Costa Rica" Sadi LaPorte
ICE
12 - "Energy Future" R. Stobaugh, D. Yergin
Harvard Business School
13 - "Energy: The Next Twenty Years" H. Landsberg, K. Arrow, F. Bator, et. al.
14 - "Energy Consumption Measurement" National Academy of Sciences
15 - "Energy Balance - Republic of Costa Rica" ICE - MEIC - MOPT - OFIPLAN - PNUD
Costa Rica, 1980
51

16 - "Energy Problems in the Transportation Sector in Dominican Republic" J. Santaella INDOTEC (Central Bank)
17 - "Construccion de un Sistema Colector - Acumulador de Energia Solar Aplicable al Secado de Productor Agricolas" Fernando Gonzalez Escuela Politecnica Nacional
52