Embed Size (px)
Citation preview
Training course to enhance collection of
fisheries and aquaculture statistics
Module 6 – Tools to support data collection, compilation and analysis
2018
2
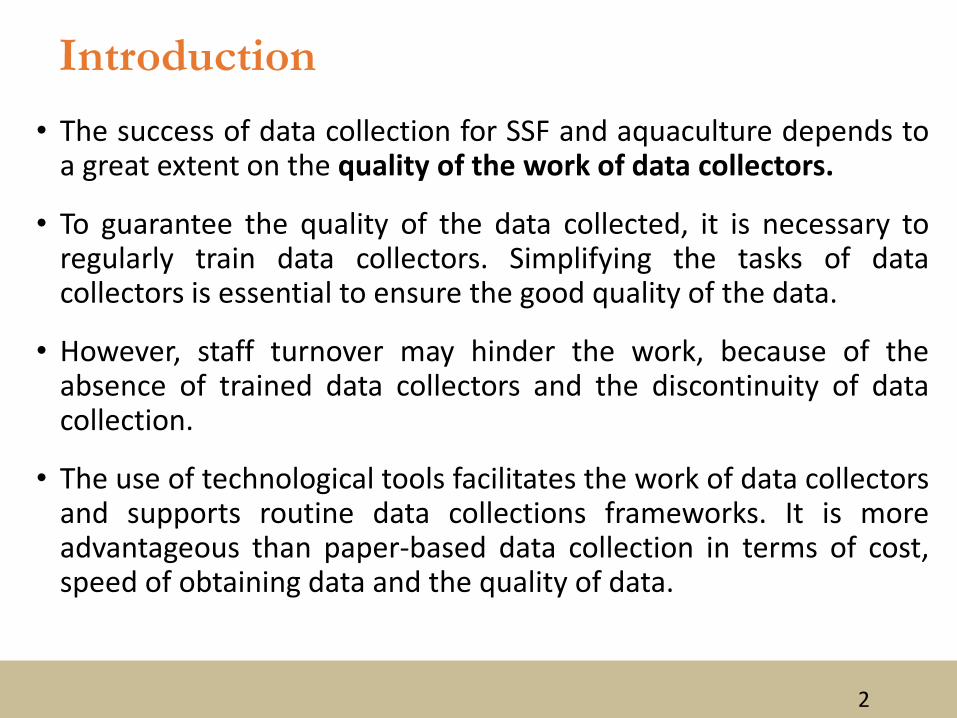
Introduction• The success of data collection for SSF and aquaculture depends to
a great extent on the quality of the work of data collectors.
• To guarantee the quality of the data collected, it is necessary toregularly train data collectors. Simplifying the tasks of datacollectors is essential to ensure the good quality of the data.
• However, staff turnover may hinder the work, because of theabsence of trained data collectors and the discontinuity of datacollection.
• The use of technological tools facilitates the work of data collectorsand supports routine data collections frameworks. It is moreadvantageous than paper-based data collection in terms of cost,speed of obtaining data and the quality of data.
3
Module 6 – Tools to support data collection, compilation and analysis
Outline
1. Role of data collectors of SSF and aquaculture statistics
2. Technological tools for data collection
3. Software for SSF data compilation and analysis
4
Role of data collectors of SSF and aquaculture
statistics 1
5
Role of staff – OFFICE• Primary data collected by field staff are of little or no
utility unless there is an appropriate statistical office infrastructure
• Responsibilities and functions of statistical office staff:− Designing and planning of fishery surveys (implementation
scheduling, training, equipment and logistics support)− Coordinating and monitoring field and office activities
− Data processing (compiling and reviewing primary data obtained from the field, data checking, editing, correcting and analysing data)
− Reporting results of data analysed to stakeholders
6
Role of Staff – FIELD
• The field staff are the data collectors and their supervisors. Theyare the primary interface between fishers (and aquaculture-practicing households) and fisheries management
• They collect and submit data to the fishery statistical office forfurther processing
• The important role of the field staff involved in data collectioncan be summarized as follows:Winning and maintaining cooperation of respondentsEnsuring quality of data by correctly carrying out instructions
on data collection received in regular trainingProviding feedback to office for evaluation
7
Technological tools for data collection 2
8
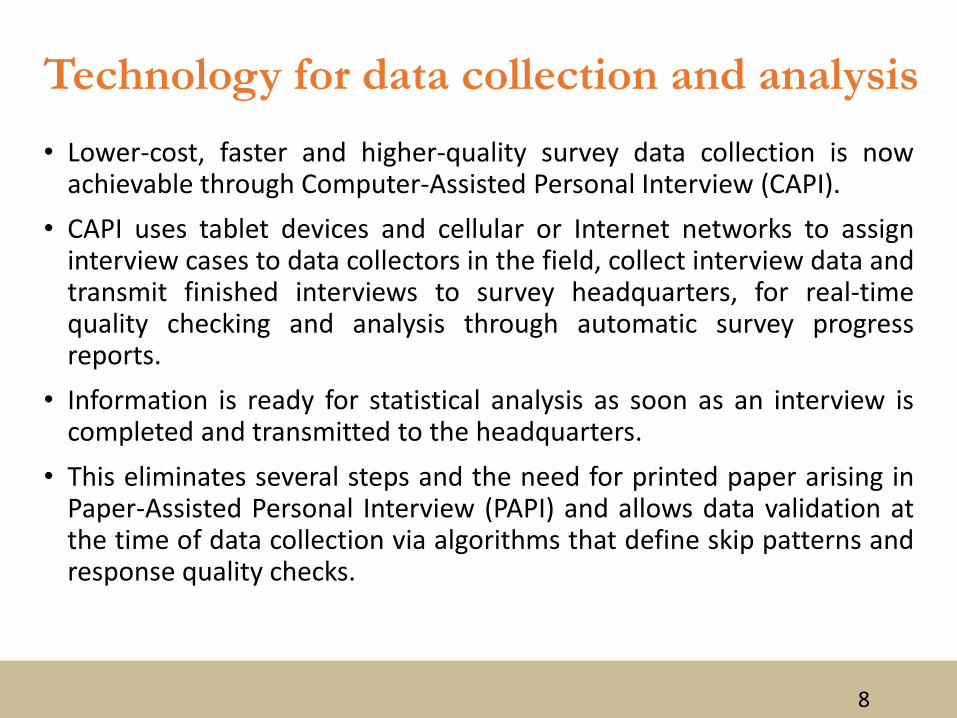
Technology for data collection and analysis• Lower-cost, faster and higher-quality survey data collection is now
achievable through Computer-Assisted Personal Interview (CAPI).• CAPI uses tablet devices and cellular or Internet networks to assign
interview cases to data collectors in the field, collect interview data andtransmit finished interviews to survey headquarters, for real-timequality checking and analysis through automatic survey progressreports.
• Information is ready for statistical analysis as soon as an interview iscompleted and transmitted to the headquarters.
• This eliminates several steps and the need for printed paper arising inPaper-Assisted Personal Interview (PAPI) and allows data validation atthe time of data collection via algorithms that define skip patterns andresponse quality checks.
9
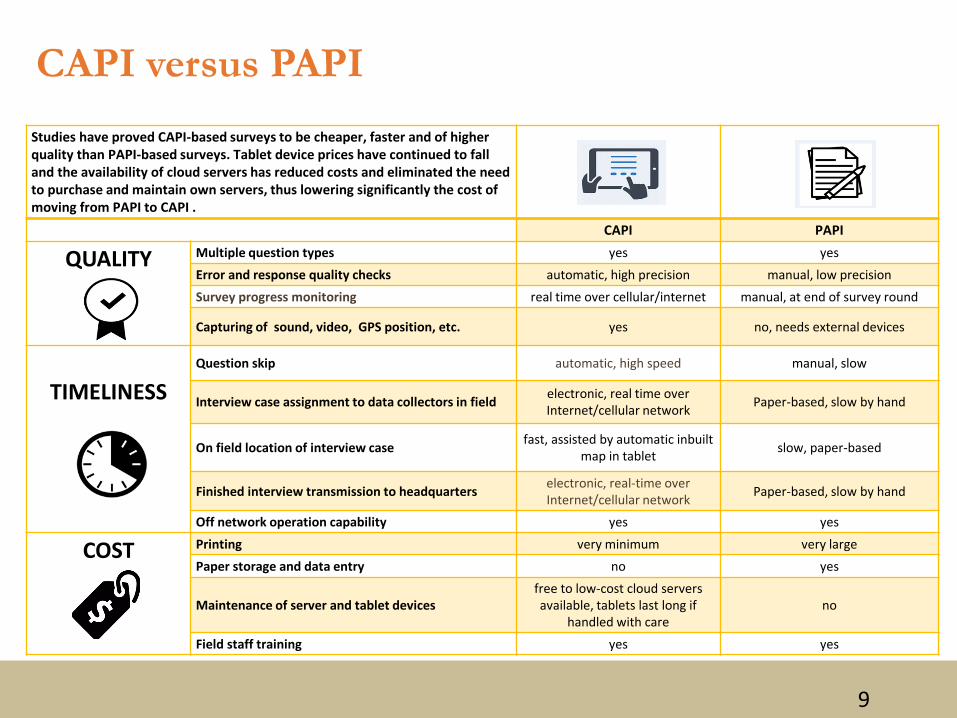
CAPI versus PAPIStudies have proved CAPI-based surveys to be cheaper, faster and of higher quality than PAPI-based surveys. Tablet device prices have continued to fall and the availability of cloud servers has reduced costs and eliminated the need to purchase and maintain own servers, thus lowering significantly the cost of moving from PAPI to CAPI .
CAPI PAPI
QUALITY Multiple question types yes yesError and response quality checks automatic, high precision manual, low precisionSurvey progress monitoring real time over cellular/internet manual, at end of survey round
Capturing of sound, video, GPS position, etc. yes no, needs external devices
TIMELINESSQuestion skip automatic, high speed manual, slow
Interview case assignment to data collectors in field electronic, real time over Internet/cellular network Paper-based, slow by hand
On field location of interview case fast, assisted by automatic inbuilt map in tablet slow, paper-based
Finished interview transmission to headquarters electronic, real-time over Internet/cellular network Paper-based, slow by hand
Off network operation capability yes yes
COST Printing very minimum very largePaper storage and data entry no yes
Maintenance of server and tablet devices free to low-cost cloud servers available, tablets last long if
handled with careno
Field staff training yes yes
10
11
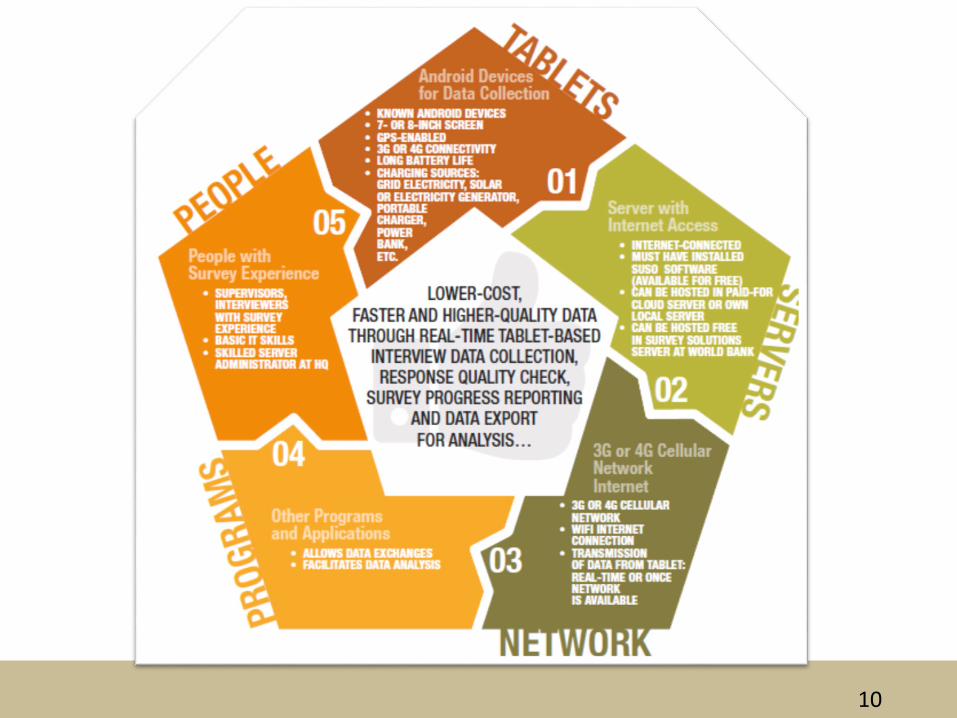
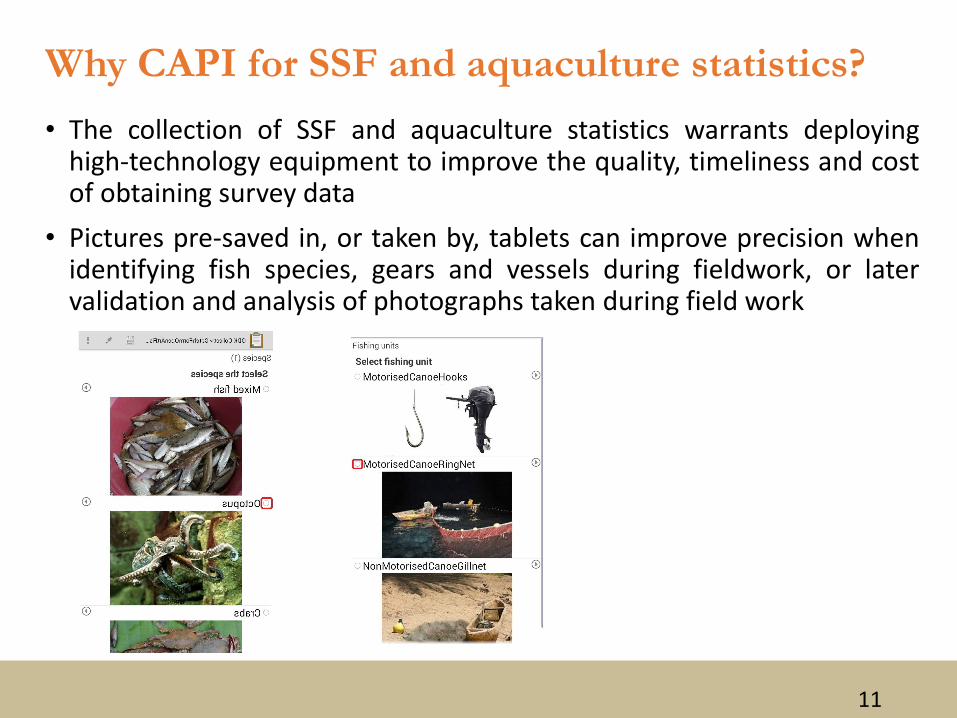
Why CAPI for SSF and aquaculture statistics?• The collection of SSF and aquaculture statistics warrants deploying
high-technology equipment to improve the quality, timeliness and costof obtaining survey data
• Pictures pre-saved in, or taken by, tablets can improve precision whenidentifying fish species, gears and vessels during fieldwork, or latervalidation and analysis of photographs taken during field work
12
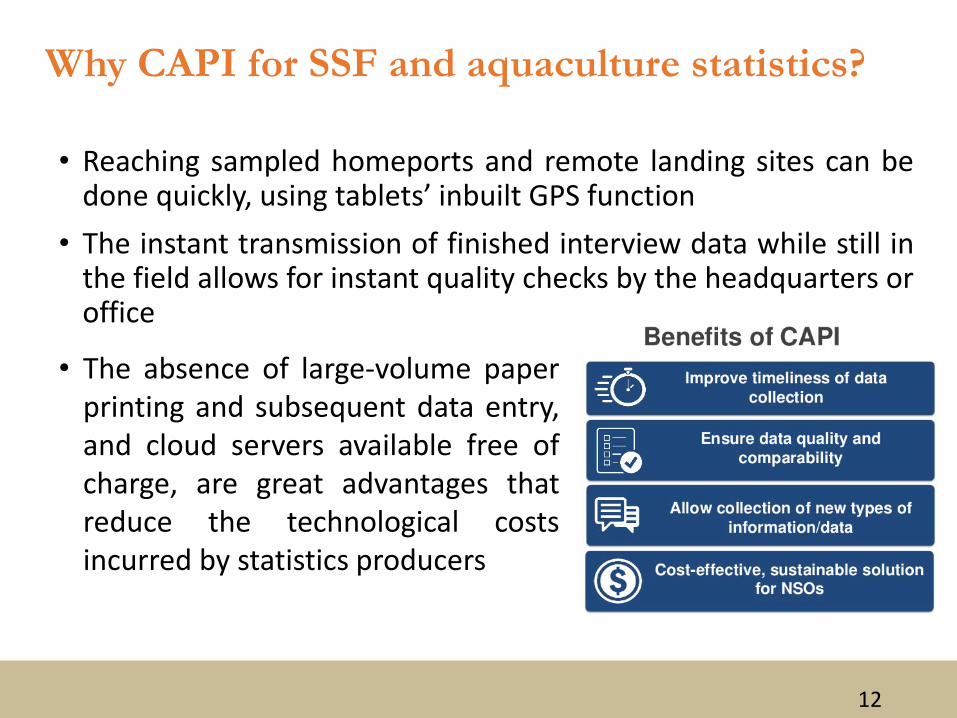
• Reaching sampled homeports and remote landing sites can bedone quickly, using tablets’ inbuilt GPS function
• The instant transmission of finished interview data while still inthe field allows for instant quality checks by the headquarters oroffice
Why CAPI for SSF and aquaculture statistics?
• The absence of large-volume paperprinting and subsequent data entry,and cloud servers available free ofcharge, are great advantages thatreduce the technological costsincurred by statistics producers
13
CAPI applications• Two CAPI applications are worth mentioning:
Survey Solutions (SuSo) and Open Data Kit (ODK)• These two applications provide functions for questionnaire design and
field data collection based on smartphones or tablet devices. Theysupport all types of questions and capturing of data such as picturesand GPS positions.
• They allow for the automatic transmission of collected data to surveyheadquarters through mobile Internet network; otherwise, they maycollect data off the network and transmit it soon as a network isavailable. The requirement of transmitting data over an Internet serveris also met if the office has its own server or a server subscription to acloud server, such as the free SuSo server hosted by the World Bank.
• These free applications are maintained and provided to the end userswith support and training material.
14
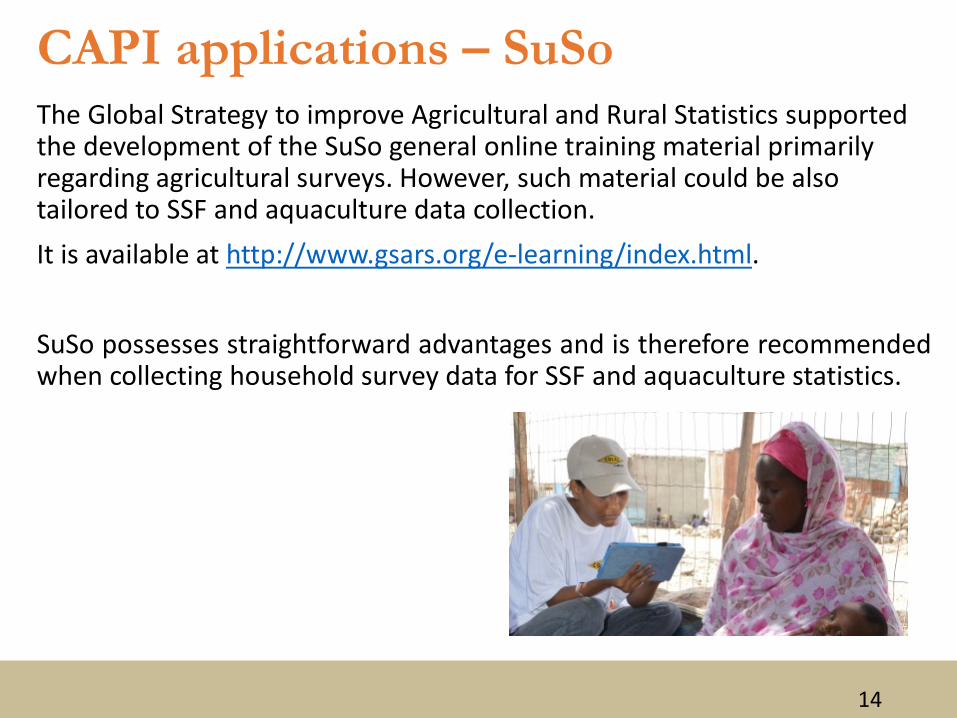
The Global Strategy to improve Agricultural and Rural Statistics supported the development of the SuSo general online training material primarily regarding agricultural surveys. However, such material could be also tailored to SSF and aquaculture data collection.It is available at http://www.gsars.org/e-learning/index.html.
SuSo possesses straightforward advantages and is therefore recommendedwhen collecting household survey data for SSF and aquaculture statistics.
CAPI applications – SuSo
15
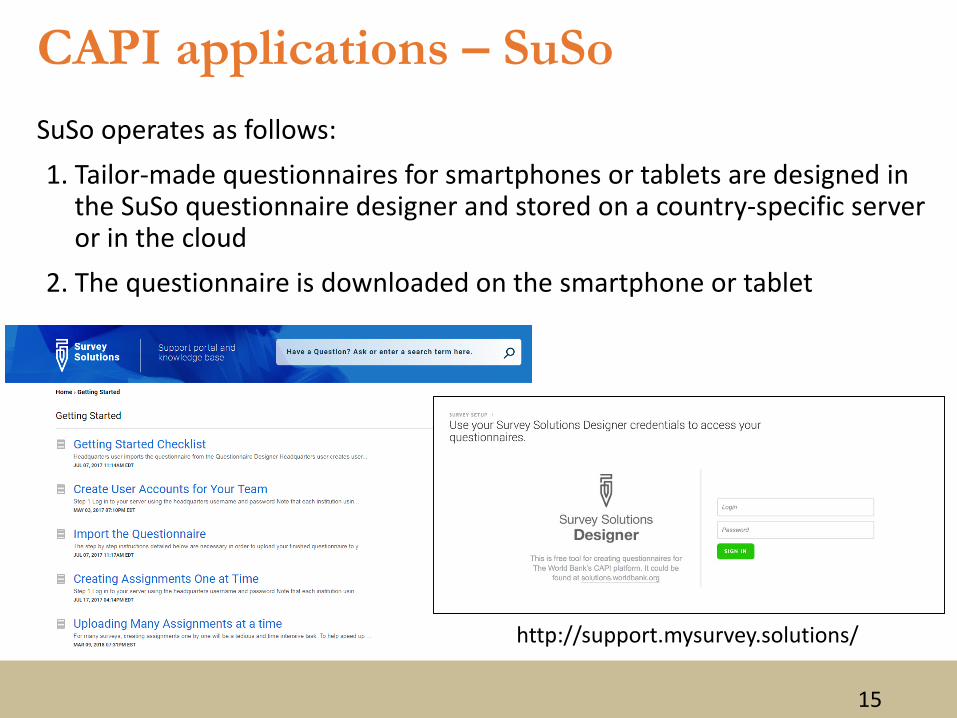
SuSo operates as follows:1. Tailor-made questionnaires for smartphones or tablets are designed in
the SuSo questionnaire designer and stored on a country-specific server or in the cloud
2. The questionnaire is downloaded on the smartphone or tablet
CAPI applications – SuSo
http://support.mysurvey.solutions/
16
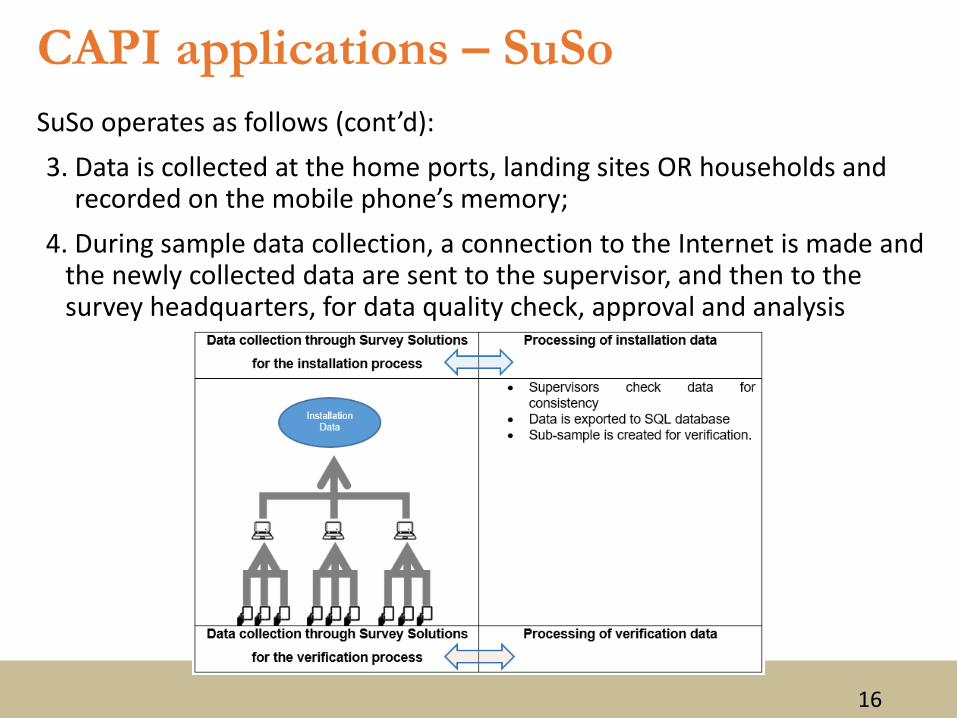
SuSo operates as follows (cont’d):3. Data is collected at the home ports, landing sites OR households and
recorded on the mobile phone’s memory;4. During sample data collection, a connection to the Internet is made and
the newly collected data are sent to the supervisor, and then to the survey headquarters, for data quality check, approval and analysis
CAPI applications – SuSo
17
CAPI applications – SuSo
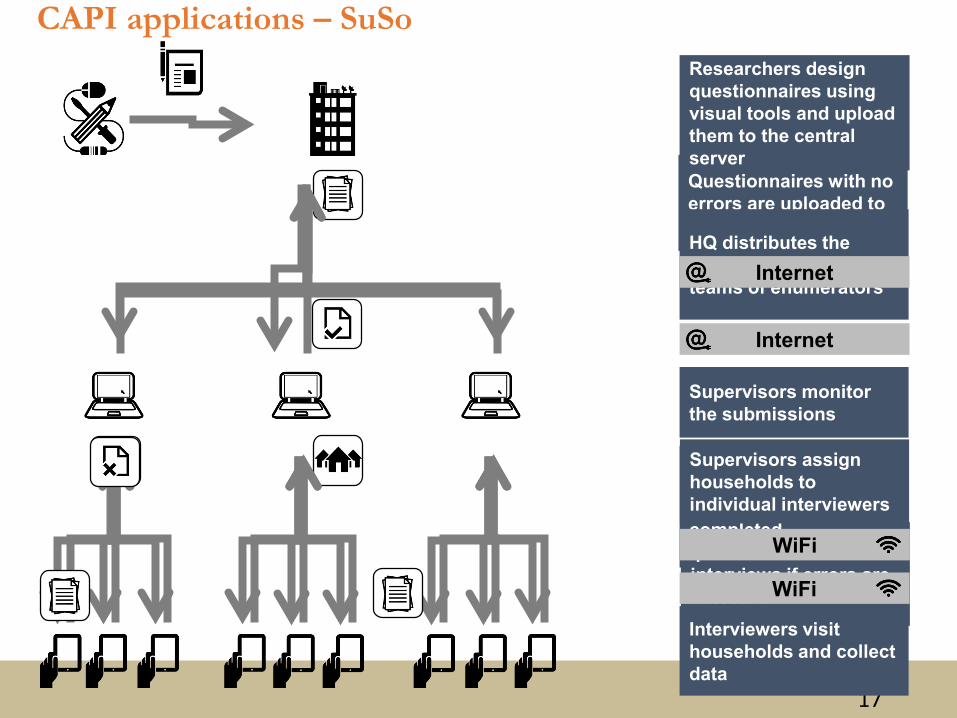
Enumerators repeat interviews if errors are detected
Interviewers synchronize theirdevices and upload completedquestionnaires
Supervisors monitor the submissions
Questionnaires with no errors are uploaded to the central server
Supervisors assign households to individual interviewers
WiFi
Researchers design questionnaires using visual tools and upload them to the central server
Interviewers visithouseholds and collect data
HQ distributes the sample lists across teams of enumerators
Internet
WiFi
Internet
18
CAPI applications – OPEN ARTFISH (ODK)
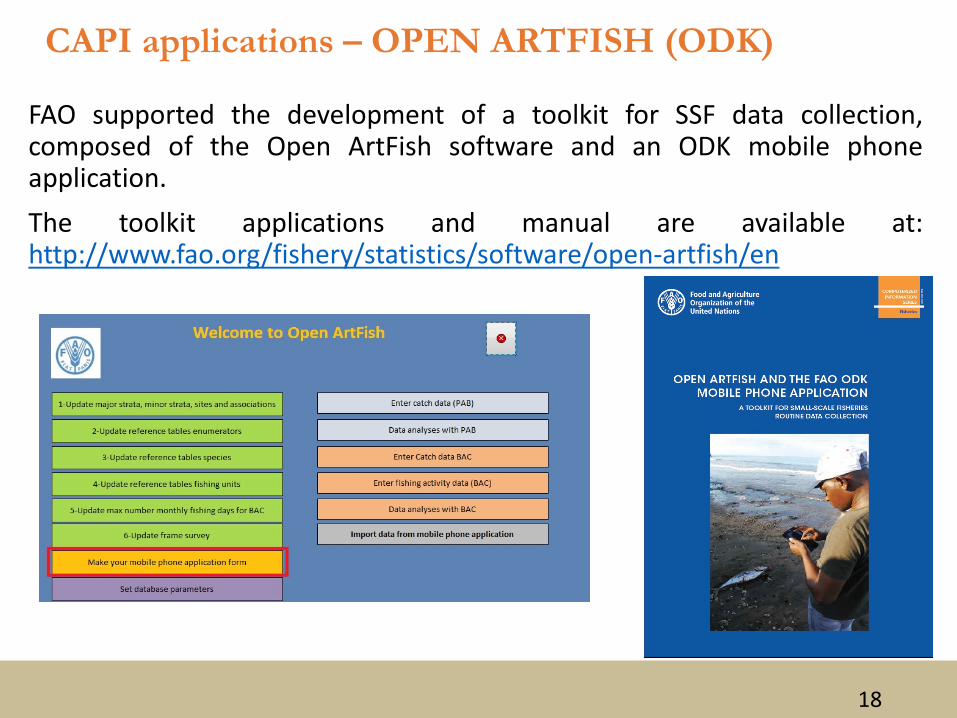
FAO supported the development of a toolkit for SSF data collection,composed of the Open ArtFish software and an ODK mobile phoneapplication.The toolkit applications and manual are available at:http://www.fao.org/fishery/statistics/software/open-artfish/en
19
CAPI applications – OPEN ARTFISH (ODK)
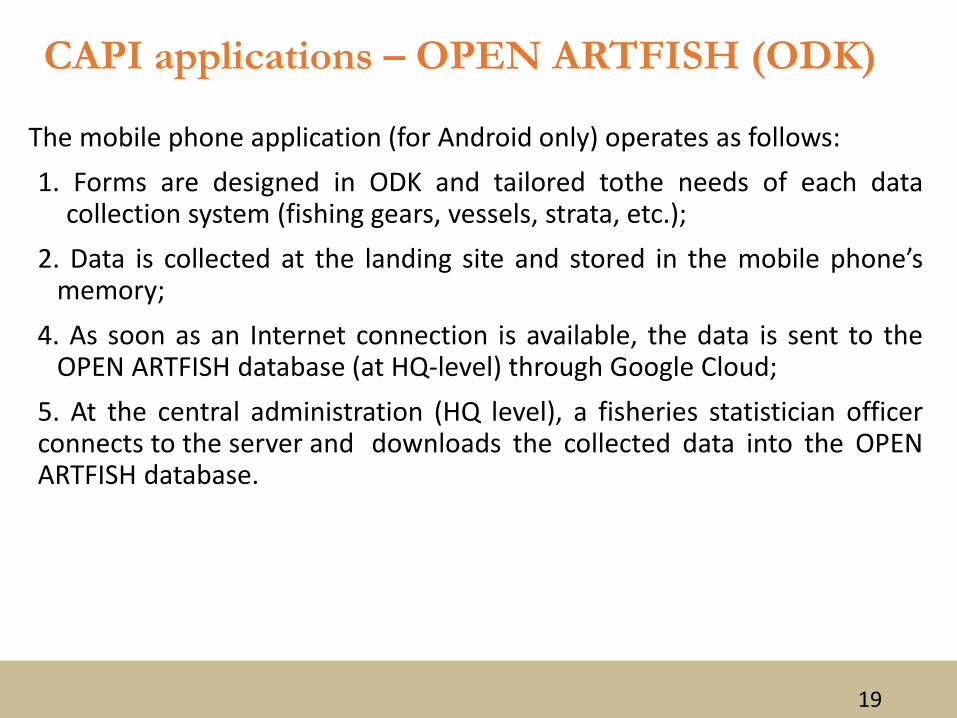
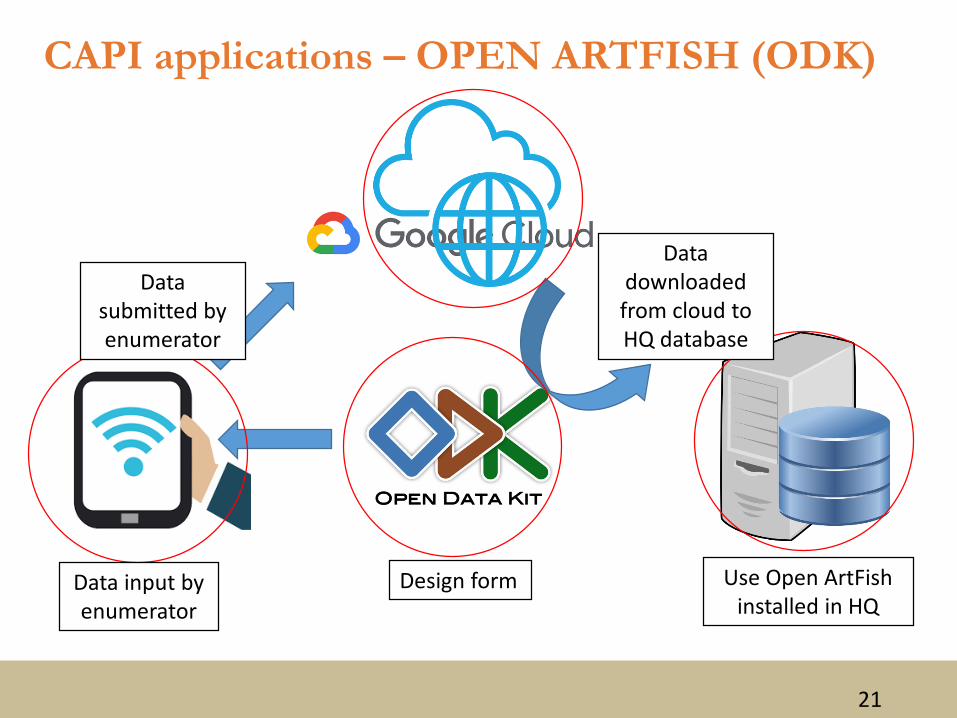
The mobile phone application (for Android only) operates as follows:1. Forms are designed in ODK and tailored tothe needs of each data
collection system (fishing gears, vessels, strata, etc.);2. Data is collected at the landing site and stored in the mobile phone’s
memory;4. As soon as an Internet connection is available, the data is sent to the
OPEN ARTFISH database (at HQ-level) through Google Cloud;5. At the central administration (HQ level), a fisheries statistician officerconnects to the server and downloads the collected data into the OPENARTFISH database.
21
Use Open ArtFishinstalled in HQ
Design formData input by enumerator
Data submitted by enumerator
Data downloaded from cloud to HQ database
CAPI applications – OPEN ARTFISH (ODK)
22
Data compilation and analysis software for
SSF (OPEN ARTFISH)3
23
Open ArtFishOpen ArtFish stands for Open Approaches, Rules and Techniques forFisheries statistical monitoring. It consists of the Open ArtFishsoftware application and its “backbone”, the Open ArtFish database.The software application is built to estimate total catch and value byspecies for sampling schemes of SSF
FAO made Open ArtFish available at:
http://www.fao.org/fishery/topic/16081/en
• The Open ArtFish generic database estimates total catch and valueby species for sampling schemes of SSF
• Open ArtFish uses appropriate statistical procedures and samplingdesign as described in more detail by de Graaf et al. (2014) andStamatopoulos (2002).
24
Open ArtFish
• It is “open” because it can be easily adapted to local requirements and more specific outputs or reports can be easily added, while maintaining appropriate statistical procedures
• It provides an indication of the reliability of the estimates through the relative error of the CPUE and of the total catch
25
• It is developed in MS Access because:MS Access is widely distributed and easy to use
all estimation procedures can be based on queries, which facilitateunderstanding of the estimation process
People with MS Access programmer skills can easily learn andoperate the software
• The document entitled Open ArtFish and the FAO ODK mobile phoneapplication: a toolkit for small scale fisheries routine data collectionintroduces the operation of Open ArtFish and the ODK mobile app for SSF
• To set up and use Open ArtFish , expertise in statistics and MS Access isrequired. When funds are available, FAO provides support to thedevelopment of national data collection systems with tailored-madeOpen ArtFish solutions.
Open ArtFish
26
Standardizing simple databases
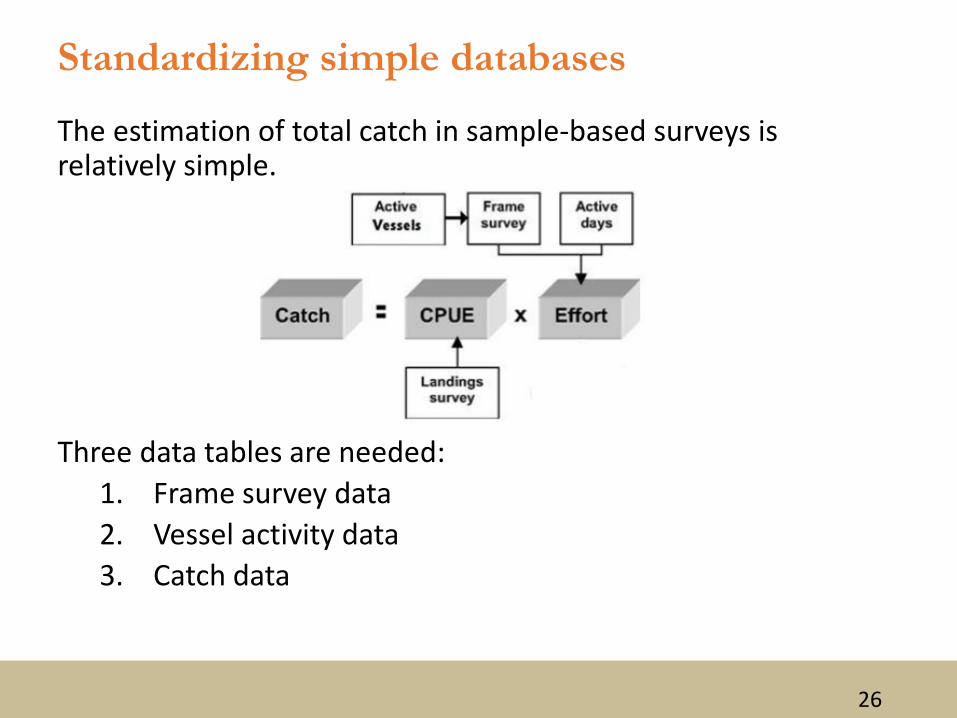
The estimation of total catch in sample-based surveys is relatively simple.
Three data tables are needed:1. Frame survey data2. Vessel activity data3. Catch data
27
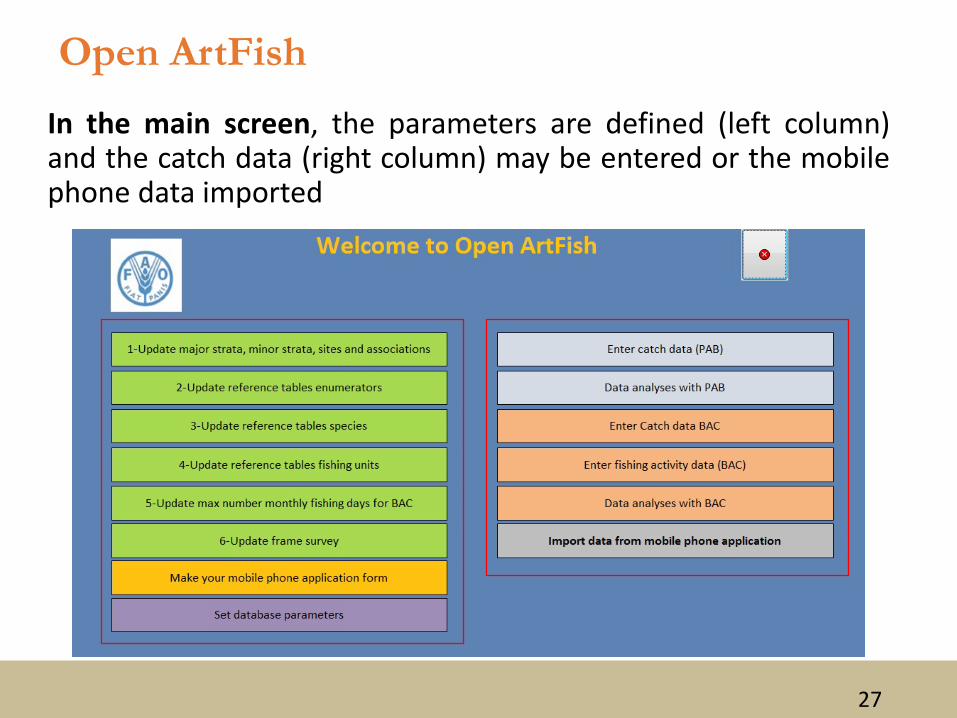
In the main screen, the parameters are defined (left column)and the catch data (right column) may be entered or the mobilephone data imported
Open ArtFish
28
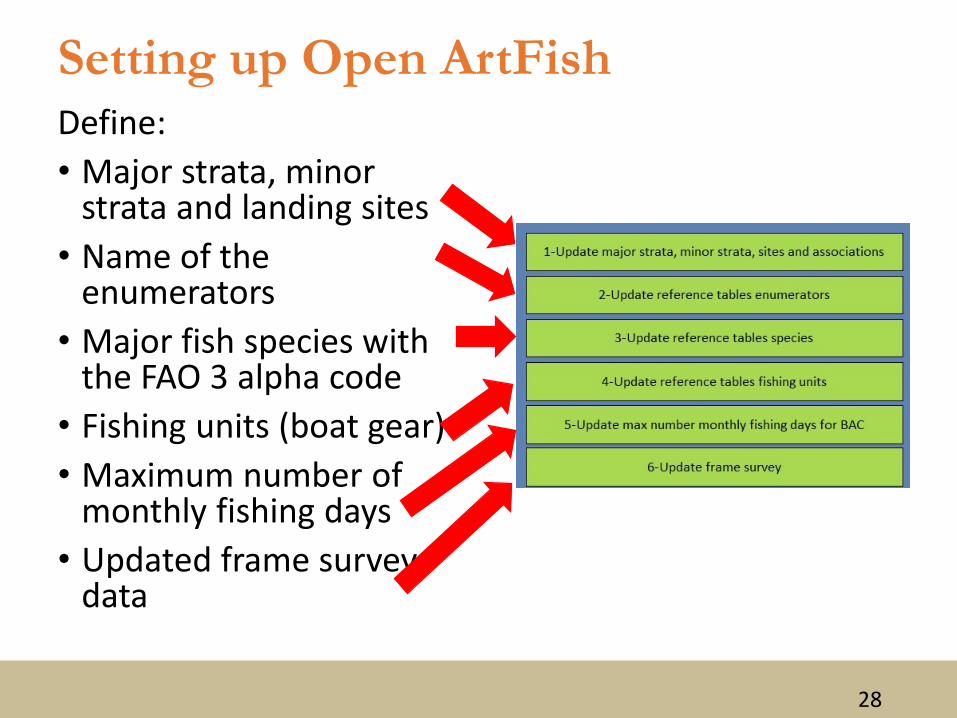
Setting up Open ArtFishDefine:• Major strata, minor
strata and landing sites• Name of the
enumerators• Major fish species with
the FAO 3 alpha code• Fishing units (boat gear)• Maximum number of
monthly fishing days• Updated frame survey
data
29
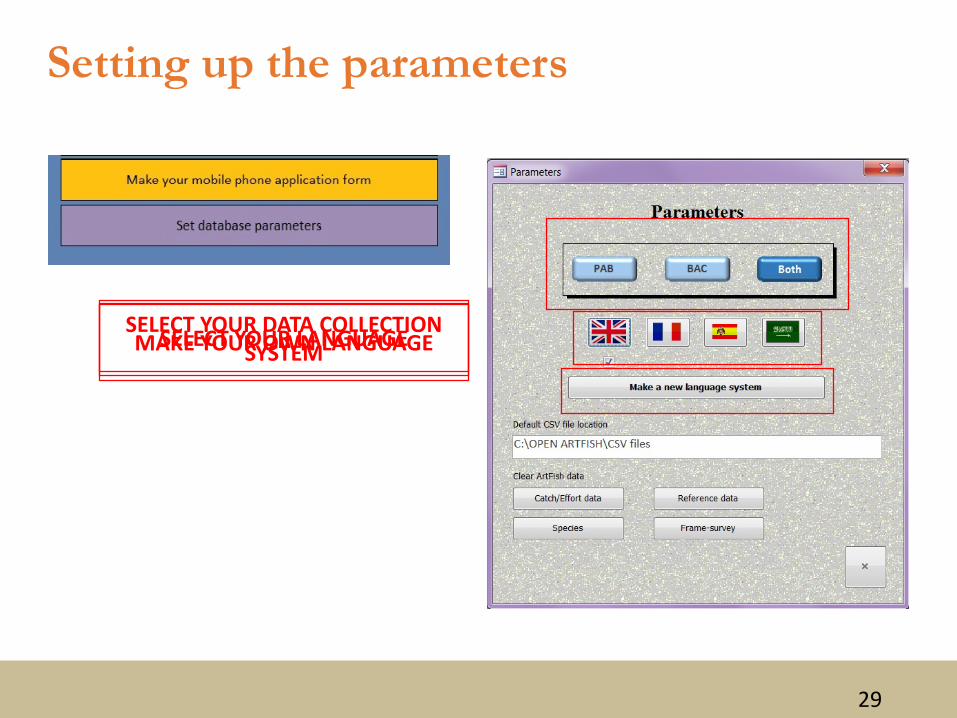
Setting up the parameters
SELECT YOUR DATA COLLECTION SYSTEMSELECT YOUR LANGUAGEMAKE YOUR OWN LANGUAGE
30
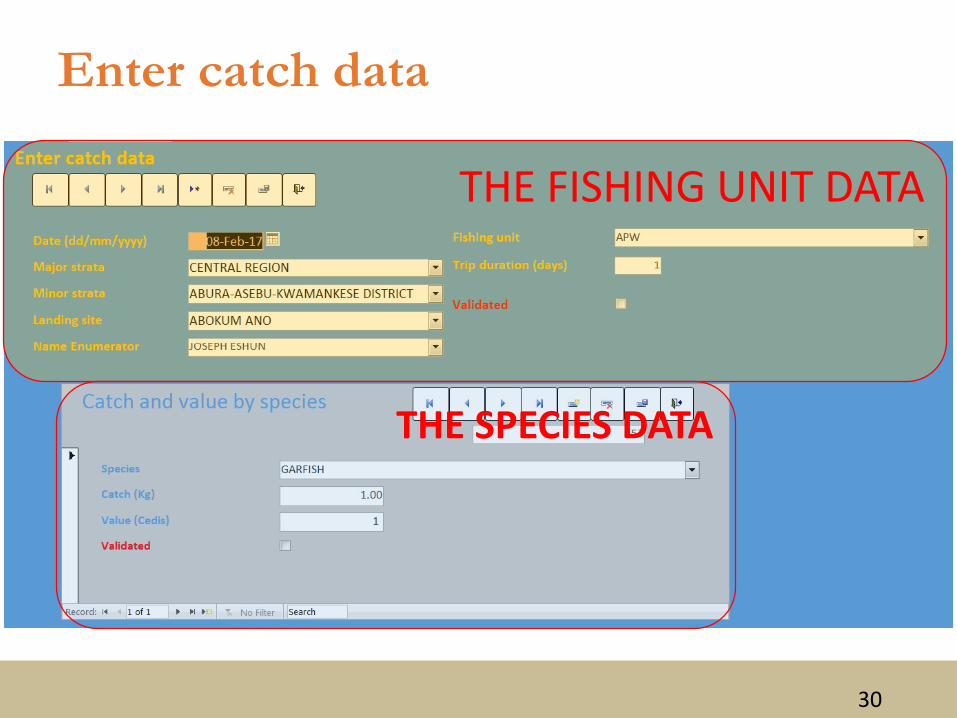
Enter catch data
THE FISHING UNIT DATA
THE SPECIES DATA
31
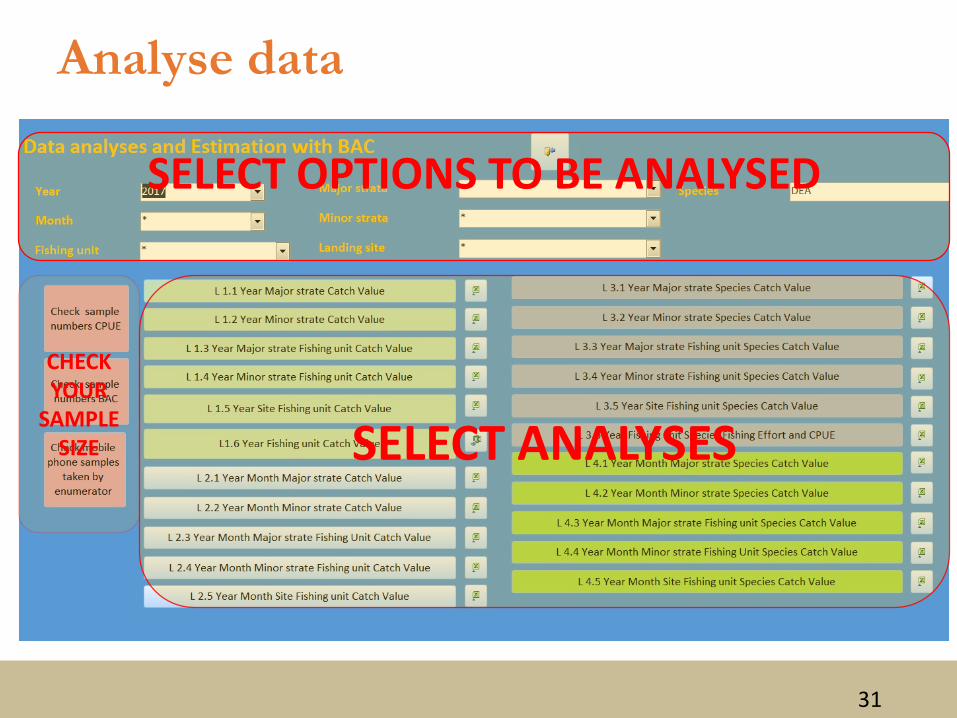
Analyse data
SELECT OPTIONS TO BE ANALYSED
CHECK YOUR
SAMPLE SIZE SELECT ANALYSES
32
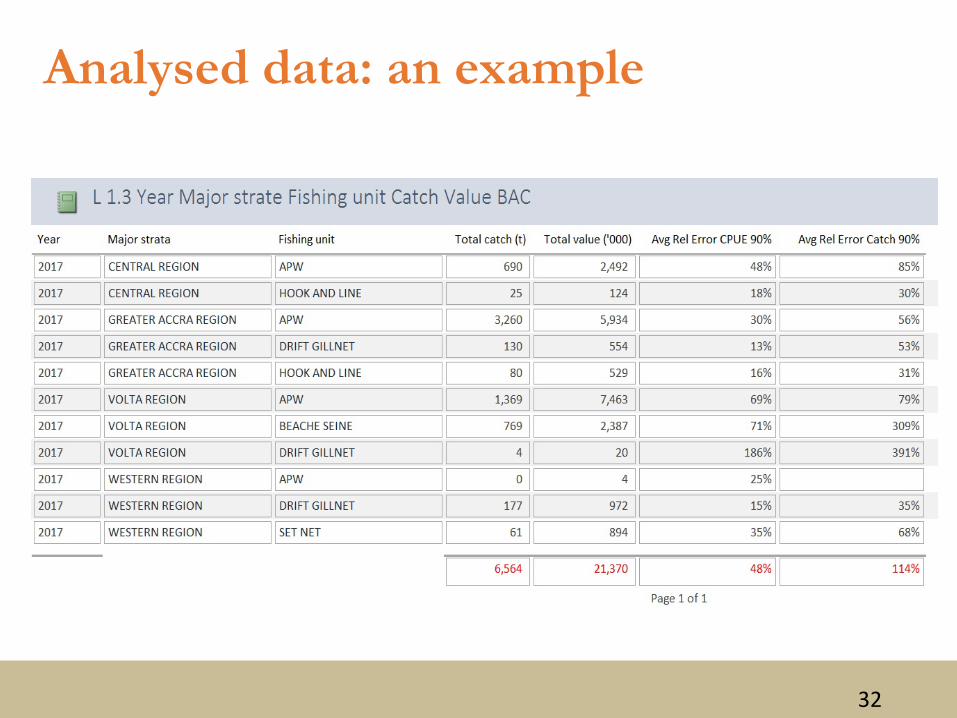
Analysed data: an example
33
The estimation process
• All based on simple queries• Follows exactly the procedures explained in the
international training course• Calculate the average and standard deviation, count
the number of samples, calculate the relative error at a probability level of 90 percent
• Statistically sound• All data stored in a final table• The final table can be queried for additional analyses
34
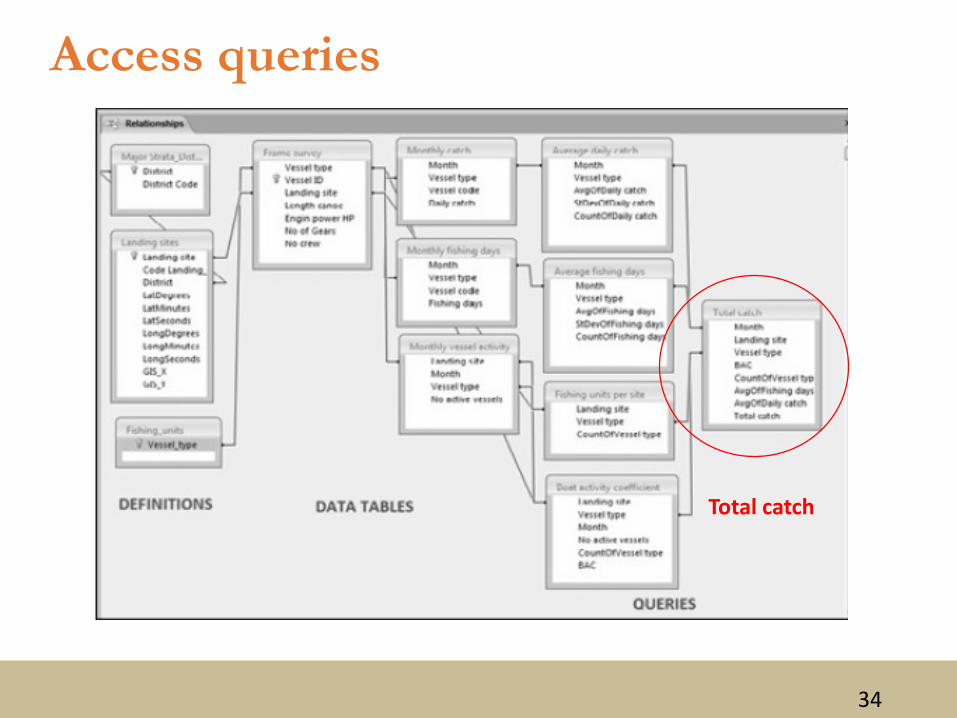
Access queries
Total catch
35
ConclusionsTechnological tools for data collection improve the quality,timeliness and cost of obtaining survey data
CAPI offers the advantages of requiring lower costs andenabling faster and higher-quality survey data collection,compared to PAPI
Two free software applications (SuSo and Open ArtFish) areavailable, with support and training material software to assistin data collection, compilation and analysis
To set up and use Open ArtFish, expertise in statistics and MSAccess is required. When funds are available, FAO providessupport to the development of national data collectionsystems with tailor-made Open ArtFish.
36
References• de Graaf, G.J., Nunoo, F., Ofori Danson, P., Wiafe, G., Lamptey, E. & Bannerman, P.
2015. International training course in fisheries statistics and data collection. FAOFisheries and Aquaculture Circular No. 1091. FAO Publication: Rome.http://www.fao.org/3/a-i3639e.pdf
• Stamatopoulos, C. 2002. Sample-based Fishery Surveys. A technical handbook.FAO Fisheries Technical Paper No. 425
• FAO. 2017. Open ArtFish and the FAO ODK mobile phone application: a toolkit forsmall-scale fisheries routine data collection. FAO Publication: Rome. Italy.http://www.fao.org/fishery/static/OpenArtfish/Toolkit.pdf
• Global Strategy to improve Agricultural and Rural Statistics (GSARS). 2017.Guidelines to Enhance Small Scale Fisheries and Aquaculture through HouseholdApproach. GSARS Guidelines: Rome. http://gsars.org/en/guidelines-to-enhance-small-scale-fisheries-and-aquaculture-statistics-through-a-household-approach/
• GSARS. 2018. Computer-Assisted Personal Interviews with Survey Solutions Usingmobile devices for cost-effective and faster data collection. http://gsars.org/wp-content/uploads/2018/03/GS-CAPI-SUSO-BROCHURE-05.pdf

Thank you