Embed Size (px)
Citation preview


2013 Training Benefits Program Annual Report
Published December 2013 Washington State Employment Security Department Dale Peinecke, commissioner Cynthia Forland, director Labor Market and Performance Analysis
This program performance report was prepared in accordance with the Revised Code of Washington, section 50.22.157. Report prepared by Andrew Greenwell, Sandra Jones, Jeffrey Robinson and Ernst W. Stromsdorfer
For more information or to get this report in an alternative format, call the Employment Security Department Labor Market Information Center at 800-215-1617. The Employment Security Department is an equal-opportunity employer and provider of programs and services. Auxiliary aids and services are available upon request to people with disabilities. Washington Relay Services: 711.

December 2013 Training Benefits Program Annual Report Employment Security Department Page i
Contents
Executive summary ...................................................................................................................... 1
Introduction .................................................................................................................................. 5
Findings ......................................................................................................................................... 9
Participant demographics ......................................................................................................... 9
Unemployment-insurance and training benefits received.................................................... 17
Employment and wage history of participants ...................................................................... 24
Program administrative costs ................................................................................................... 27
Appendices .................................................................................................................................... 31
Appendix 1. Survey methodology and response rate ........................................................... 31
Appendix 2. Survey questionnaire with responses ............................................................... 32

December 2013 Training Benefits Program Annual Report Employment Security Department Page ii

December 2013 Training Benefits Program Annual Report Employment Security Department Page 1
Executive summary Background The Training Benefits (TB) Program provides extended unemployment benefits to qualifying unemployment-insurance claimants who need training for a new career. The Training Benefits Program provides income support while participating individuals are in training, but does not cover the direct costs of training (e.g., tuition, books, transportation). The benefits are paid out of the state Unemployment-Insurance Trust Fund.
Training Benefits payments are available to qualifying unemployment-insurance claimants for up to 52 weeks. Total unemployment-insurance benefits paid while in the TB Program include the recipient’s regular unemployment benefits. However, in times of federal extensions of benefits, as the state has seen since July 2008, claimants qualifying for Training Benefits could have received up to 125 weeks of benefits.
The legislature has made a series of changes to the Training Benefits Program since its inception. Most recently, legislation enacted in 2011 (EHB 1091) increased the accessibility and flexibility of the program.
Annual report to the Legislature RCW 50.22.157 requires the Employment Security Department (ESD) to deliver an annual report to the Legislature that includes the following information:
Participant demographics;
Number of weeks of benefits;
Types of training;
Employment and wages of program participants; and
Program administrative costs.
The data in this report come from three sources: the Employment Security Department’s administrative records; a survey of program participants conducted by ESD in summer 2013; and training data from the State Board for Community and Technical Colleges (SBCTC).
Key findings
Participant demographics Looking at the nearly 2,900 Training Benefits participants approved in FY 2012 and the nearly 2,400 approved in FY 2013:
Females enrolled in the Training Benefits Program at higher rates than males.
Individuals 26 through 55 years of age enrolled at higher rates than those under 26 and over 55.
Training Benefits participants had more education, before entering the program, than unemployment-insurance claimants overall.
Training Benefits participants were concentrated in King, Pierce and Snohomish counties.

December 2013 Training Benefits Program Annual Report Employment Security Department Page 2
Over half of the Training Benefits participants came from the following five industry sectors: manufacturing; administrative and support and waste management services; public administration; healthcare and social assistance; and retail trade.
Over half of the Training Benefits participants came from the following five occupations: office and administrative support; production; management; construction and extraction; and sales and related occupations.
Receipt of Training Benefits Program and unemployment-insurance benefits As of October 2013, Training Benefits participants approved in FY 2012 had collected an average of $396 per week and a median of $407 per week, for an average of 100 weeks. Participants approved in FY 2013 had collected an average of $377 per week and a median of $385 per week, for an average of 84 weeks. These payments included funds from regular unemployment benefits, emergency-unemployment compensation, extended benefits and the Training Benefits Program. These numbers will most likely change, since a portion of the Training Benefits participants analyzed in this report are still receiving weekly benefits.
Analysis of training Information on training through the state’s community and technical colleges was analyzed for the nearly 9,000 Training Benefits participants approved in calendar years 2009 through 2011 for academic years 2008-2009 through 2011-2012.
Over 8,000 Training Benefits participants completed over 150,000 courses and nearly 3,900 of those participants took developmental education courses. Just over 3,700 participants completed one or more certificate or degree programs. More participants completed a degree or certificate in accounting and bookkeeping than any other program of study.
Experiences with the Training Benefits Program As in previous years, ESD surveyed the nearly 9,000 Training Benefits participants approved in calendar years 2009 through 2011 to learn about their experiences.
Of those responding to the survey, nearly all (92.6 percent) stated that they had started their training.
Of those who had started training, 62.9 percent stated that they had completed their training, 19.0 percent had not completed training and 15.4 percent were still in training.
The greatest proportion of participants who stated that they had not completed their training (36.7 percent) attributed it to their unemployment benefits ending.
Of those who reported having started or completed their training, the greatest proportion (42.0 percent) reported using financial assistance through their school or college to fund their training.
Over three-quarters of respondents (78.7 percent) stated that the job they were training for required a degree, certificate or license.

December 2013 Training Benefits Program Annual Report Employment Security Department Page 3
Employment and wages of program participants For the Training Benefits participants approved for the program in calendar years 2009 through 2011, ESD compared before-tax earnings prior to layoff to participants’ earnings after their Training Benefits ended. Participants’ earnings were relatively stable in the 12 months leading up to receiving unemployment benefits. Once benefits ended, earnings were lower than prior to Training Benefits Program participation, but increased over the following two years.
Numerous studies have found that dislocated workers1 who retrain for new careers experience a drop in their earnings after training compared to their earnings before training. However, their earnings tend to rise for a number of years after training completion. Earnings for those who have retrained tend to be higher than for those who have not retrained, though somewhat lower than their pre-layoff earnings.
Program administrative costs Training Benefits Program administrative costs totaled $1.25 million in FY 2013 and are projected to be $1.26 million in FY 2014 – less than half the total cost from FY 2011. During FY 2013, the average cost to process an application was $291, down from $473 in FY 2012 and $508 in FY 2011.
Training Benefits funding obligations Through November 30, 2013, a total of $186,406,754 has been paid out of Training Benefits funds over the history of the program. This represents about 55 percent of total funds made available for the program. A total of $13,496,142 was paid out in FY 2013 and $5,596,224 through November 30, 2013, of FY 2014. The balance of future obligations is $20,739,869.
1 A dislocated worker is an individual who has been laid off, is eligible for unemployment insurance, and is unlikely to return to his or her previous
occupation or industry due to foreign competition or technological change. Not all employees affected by a major layoff will be dislocated workers. They might have job skills that are in demand and can return to work in their previous industry or occupation.

December 2013 Training Benefits Program Annual Report Employment Security Department Page 4

December 2013 Training Benefits Program Annual Report Employment Security Department Page 5
Introduction
Background on the Training Benefits Program In 2000, the Washington State Legislature enacted Substitute House Bill 3077, which created the Training Benefits (TB) Program. The program allocates up to $20 million each year from the Unemployment-Insurance Trust Fund to provide additional weeks of unemployment benefits, while in training, to qualifying claimants who need training to obtain a new job.
To qualify for the program, claimants must enroll in training that will prepare them for a high-demand occupation. On an annual basis, the Employment Security Department develops an initial list identifying occupations that are “in demand,” “balanced” and “not in demand” at the state and workforce development area level. The local workforce development councils then review, adjust and approve that initial list on the basis of their local, on-the-ground experience.2
Participating claimants do not have to look for work as long as they are enrolled and making satisfactory progress in their approved training programs.3 Direct costs of training (e.g., tuition, books, transportation) are not directly supported by this program. Training Benefits payments are not charged to employers for purposes of calculating experience-rated unemployment taxes.4
Enrollment in and eligibility for Training Benefits Individuals approved for the Training Benefits Program may enroll in an approved training program and have their work-search requirement waived while receiving up to 52 weeks of unemployment-insurance benefits. This 52-week total includes the recipient’s regular unemployment benefits which must be utilized before the Training Benefits kick in. While the federal extensions of benefits have been in place, Training Benefits have been paid only after the TB participant exhausted his or her regular benefits, any emergency-unemployment compensation benefits and, effective July 3, 2011,5 any extended unemployment benefits.
When these extensions were at their peak number of available weeks, individuals approved for the Training Benefits Program could receive up to a maximum of 125 weeks of benefits. That statutory maximum has been declining since early 2012. Under current law, the federal extensions will end as of December 29, 2013. As of that date, an individual approved for the Training Benefits Program will be eligible only for his or her regular unemployment-insurance benefits plus the Training Benefits, for a total of up to 52 weeks.
2 As required by RCW 50.22.150 and 50.22.155. 3 Commissioner-Approved Training is not funded through the funds allocated to the Training Benefits Program. Commissioner-Approved Training
is paid through regular and federally funded unemployment benefits. 4 EHB 1091 of 2011 amended the law so that benefits are not charged to employers beginning with the date of approval rather than upon the
first payment from Training Benefits funds, as of FY 2013. 5 RCW 50.22.155.

December 2013 Training Benefits Program Annual Report Employment Security Department Page 6
In some cases, participants approved for the TB program may have ended their training before receiving any payments from Training Benefits Program funds. That is because they were in training and receiving unemployment benefits under federal benefit extensions and they completed their training plan before they reached the point at which Training Benefits funds could be used during their approved training plan period.
Eligibility for the TB Program requires claimants to be in one of the following categories:
Dislocated workers;6
Certain low-income workers whose earning potential will be enhanced with training;7
Honorably discharged veterans who served in the military or Washington National Guard in the 12-month period prior to application;
Individuals currently serving in the Washington National Guard; and
Individuals who are disabled and unable to return to their previous occupations.
Prior to passage of EHB 1091 in 2011, Training Benefits Program eligibility required claimants to submit a training plan within 90 days after being notified about the program and to enter an approved training program within 120 days after being notified about the Training Benefits Program. Under the provisions of EHB 1091, these requirements were eliminated for dislocated-worker claimants who had an effective date of claim on or after July 1, 2012. The original deadlines for submitting a training plan and entering a training program still apply to the other categories of eligible claimants.
EHB 1091 also expanded the definition of “dislocated worker” for claimants with an effective date of claim on or after July 1, 2012.
For all categories of claimants eligible for Training Benefits other than dislocated workers, approved program participants must enroll in training as full-time students. Provisions of EHB 1091 waived this requirement for dislocated-worker claimants with an effective date of claim on or after July 1, 2012.
Claimants in the categories for whom the submission and enrollment deadlines apply may receive a waiver for missing the deadlines if the Employment Security Commissioner determines they had good cause for doing so. Similarly, claimants for whom the full-time enrollment requirement remains in effect may participate in part-time training if a physical, mental or emotional disability prevents full-time enrollment.
6 A dislocated worker is an individual who has been laid off, is eligible for unemployment insurance, and is unlikely to return to his or her previous
occupation or industry due to foreign competition or technological change. Not all employees affected by a major layoff will be dislocated workers. They might have job skills that are in demand and can return to work in their previous industry or occupation.
7 Prior to January 1, 2011,”low income” is considered to be a wage rate of $11.11 per hour or less. For Training Benefits applications filed January 1, 2011, or later, $11.27 per hour or less is considered low income and, for Training Benefits applications filed January on or after July 1, 2012, or later, $11.75 per hour or less is considered low income. For those TB applicants filing after January 1, 2013, anyone earning $11.94 per hour or less is considered to meet the low income eligibility threshold. ESD calculates these wage rates by dividing total wages earned in the 12 to 15 months upon which the claim is based by total hours worked in the same period. Source: Employment Security Department, Unemployment Benefit Administration and Policy.

December 2013 Training Benefits Program Annual Report Employment Security Department Page 7
The annual report to the Legislature RCW 50.22.157 requires the Employment Security Department to deliver an annual report to the Legislature. The report must include:
A demographic analysis of participants in the Training Benefits Program, including the number of claimants by industry of their last employer and the gender, race, age and geographic distribution of participants;
The number of weeks of benefits claimed per claimant;
An analysis of the training provided to participants, including: the occupational category supported by the training; whether the training would lead to employment in an occupation in demand in the economy; whether a degree or certificate is required in order to get a job in the occupation chosen; a comparison of participants who complete training in relationship to those who do not; the number of participants taking courses in basic skills; and the reasons for not completing approved training programs;
The employment and wage history of participants, including: the pre-training and post-training wages; the work participants engaged in before they were laid off; whether those participating in training return to their previous employers within two years after training terminates; whether participants are reemployed in a field for which they were retrained;
An identification and analysis of local and state administrative costs for operating this program; a projection of program costs for the next fiscal year; the total funds obligated for Training Benefits; and the net balance remaining to be obligated, given the restrictions in current law.
Data sources Data in this report come from three sources: the Employment Security Department’s (ESD) administrative records; a survey of program participants conducted by ESD in summer 2013; and training data from the State Board for Community and Technical Colleges.
In the summer of 2013, the Employment Security Department conducted a survey of the 8,945 claimants approved for the Training Benefits Program from January 1, 2009, through December 31, 2011. ESD received 3,426 usable survey responses for a response rate of 38.3 percent. The survey was conducted via telephone and the Internet.
A small percentage of Training Benefits participants chose to enroll in training with private educational providers. Training outcomes for these participants are not reflected in the SBCTC data in this report.

December 2013 Training Benefits Program Annual Report Employment Security Department Page 8
December 2013 Training Benefits Program Annual Report Employment Security Department Page 9
Findings There are two groups of Training Benefits participants discussed in this report. The first group is participants approved for the program during state fiscal years (FY) 2012 and 2013, from July 2011 through June 2012 and July 2012 through June 2013. Program administrative data on this group provide the basis for an analysis of participants’ demographics and weeks of benefits.
To track employment and earnings outcomes, the second group of participants is those individuals approved for the program during calendar years (CY) 2009 through 2011. The results of ESD’s survey and State Board for Community and Technical College administrative data on this group provide the basis for a longer-term analysis of the types of training, employment and wages of participants.
Participant demographics: Training Benefits participants approved during FY 2012 and FY 2013 As with previous years’ participants,8 while the population of all unemployment-insurance claimants was nearly two-thirds male, the male/female distribution of Training Benefits participants was approximately equal. Participants approved for the Training Benefits Program in FY 2012 were 48.2 percent female, compared to 37.3 percent of all unemployment-insurance claimants. In contrast, 51.2 percent of participants were male but comprised 62.7 percent of all unemployment-insurance claimants. As shown in Figure 1, the pattern was similar for FY 2013, but then proportionately more participants were female than male.
There were few differences between the age distributions of Training Benefits participants in FY 2012 compared to the age distribution in FY 2013. About four-fifths of all participants were ages 26 through 55. These percentage distributions were also similar to those reported in previous years’ reports.
The average age of Training Benefits participants and all unemployment-insurance claimants was 40 years of age in FY 2012 and 41 in FY 2013. This average masked differences among specific age groups. For FY 2012 there were more Training Benefits participants ages 26 through 55, 81.1 percent, compared to all unemployment-insurance claimants, at 70.9 percent. The picture was similar for FY 2013 (Figure 1).
Individuals under 26 years of age and over 55 were under-represented in the Training Benefits Program. This held for individuals approved in both FY 2012 and FY 2013. For FY 2012, 9.2 percent of Training Benefits participants were under 26 compared to 13.9 percent for all unemployment-insurance claimants. A total of 9.1 percent of Training Benefits participants were over 55 years of age, compared to 15.2 percent for all claimants.
In terms of race and ethnicity, Figure 1 shows that a somewhat higher proportion of individuals who were Black and Asian/Pacific Islander enrolled in the Training Benefits Program than overall unemployment-insurance claimants. In contrast, a somewhat lower proportion of individuals who
8 Previous years’ annual Training Benefits reports are available at https://fortress.wa.gov/esd/employmentdata/reports-publications/special-
reports/training-benefits-report.

December 2013 Training Benefits Program Annual Report Employment Security Department Page 10
were Hispanic and Native American/Alaskan Native enrolled in the Training Benefits Program than overall unemployment-insurance claimants. This picture holds for participants approved in FY 2012 and FY 2013, as well as FY 2011.
Figure 1. Demographic characteristics of Training Benefits participants approved in FY 2012 and FY 2013 Washington state, FY 2012 and FY 2013 Source: Employment Security Department/LMPA, Unemployment Insurance Data Warehouse
Demographic
FY 2012 FY 2013
Approved Training Benefits
participants
Percent of
total
Percent of all unemployment
claimants
Approved Training Benefits
participants
Percent of
total
Percent of all unemployment
claimants
Gender
Male 1,473 51.2% 62.7% 1,142 48.6% 62.6%
Female 1,387 48.2% 37.3% 1,184 50.4% 37.4%
Data not available 15 0.5% 0.0% 23 1.0% 0.0%
Total 2,875 100.0% 100.0% 2,349* 100.0% 100.0%
Race/ethnicity
Black 176 6.1% 5.2% 168 7.2% 5.5%
Asian, Pacific Islander 185 6.4% 5.8% 182 7.7% 6.1%
White 2,053 71.4% 70.4% 1,611 68.6% 68.8%
Hispanic 228 7.9% 12.6% 196 8.3% 13.4%
Native American, Alaskan Native 51 1.8% 2.1% 33 1.4% 2.1%
Other 167 5.8% 4.0% 136 5.8% 4.2%
Data not available 15 0.5% 0.0% 23 1.0% 0.0%
Total 2,875 100.0% 100.0% 2,349 100.0% 100.0%
Age
Average age 40 41
Under 21 18 0.6% 2.2% 12 0.5% 2.1%
21 to 25 248 8.6% 11.7% 179 7.6% 11.5%
26 to 35 874 30.4% 25.7% 672 28.6% 25.8%
36 to 45 758 26.4% 22.2% 614 26.1% 22.1%
46 to 55 699 24.3% 23.0% 590 25.1% 22.8%
56 to 65 251 8.7% 13.1% 245 10.4% 13.4%
Over 65 12 0.4% 2.1% 14 0.6% 2.2%
Data not available 15 0.5% 0.0% 23 1.0% 0.0%
Total 2,875 100.0% 100.0% 2,349 100.0% 100.0%
*The number of participants approved for the Training Benefits program in FY 2013 included in this figure varies slightly from the number included in Figure 7, since the unemployment-insurance administrative database is an active file in which information can be updated.
Individuals approved for the Training Benefits Program were more likely to be female compared to all unemployment-insurance claimants. Participants were also more likely to be in the prime working years of 26 to 55 years of age.

December 2013 Training Benefits Program Annual Report Employment Security Department Page 11
Participant education As with previous years’ reports, Training Benefits participants approved during FY 2012 and FY 2013 had more education than unemployment-insurance claimants as a group (Figure 2).
Training Benefits Program enrollment was dominated by participants who had some level of post-secondary education – represented by 57.3 percent and 58.5 percent, respectively, for participants approved in FY 2012 and FY 2013. These proportions contrast with 42.6 and 43.5 percent for all unemployment-insurance claimants who had some post-secondary education.
However, the largest single proportion of Training Benefits participants held high school diplomas – with 34.4 percent of participants approved in FY 2012 and 32.6 percent approved in FY 2013. Thus, the TB Program had the effect of introducing a relatively large number of high school graduates – 1,754 participants – to post-secondary job training. Counting those with a GED, this number increases to 1,988 participants for the two years combined.
Figure 2. Education level of Training Benefits participants approved in FY 2012 and FY 2013 Washington state, FY 2012 and FY 2013 Source: Employment Security Department/LMPA, Unemployment Insurance Data Warehouse
Education level
FY 2012 FY 2013
Approved Training Benefits
participants Percent of total
Percent of all unemployment
claimants
Approved Training Benefits
participants Percent of total
Percent of all unemployment
claimants
Less than high school diploma 94 3.3% 13.7% 82 3.5% 13.8%
GED 129 4.5% 4.1% 105 4.5% 4.4%
High school diploma 989 34.4% 39.4% 765 32.6% 38.4%
Some college, no degree 671 23.3% 13.6% 528 22.5% 14.1%
Associate degree 534 18.6% 14.5% 440 18.7% 14.4%
Bachelor’s degree and above 443 15.4% 14.5% 406 17.3% 15.0%
Data not available 15 0.5% 23 1.0%
Total 2,875 100.0% 99.8% 2,349 100.0% 100.0%
Training Benefits participants had more education than unemployment-insurance claimants overall. The majority of Training Benefits participants had some post-secondary education prior to enrolling in the TB Program.
Geographic distribution of participants Of participants approved for the TB program in FY 2012 and FY 2013, the greatest number resided in King, Pierce and Snohomish counties, accounting for 55.1 percent and 60.2 percent, for the two respective fiscal years. This compares to 47.6 percent and 47.4 percent of all unemployment-insurance claimants in those counties during those fiscal years (Figure 4). The map in Figure 3 displays the geographic distribution of participants who were approved for the program in FY 2012.

December 2013 Training Benefits Program Annual Report Employment Security Department Page 12
Figure 3. Distribution of Training Benefits participants approved in FY 2012 by county of residence Washington state, FY 2012 Source: Employment Security Department/LMPA, Unemployment Insurance Data Warehouse
Training Benefits participants were concentrated in King, Pierce and Snohomish counties in FY 2012.

December 2013 Training Benefits Program Annual Report Employment Security Department Page 13
Figure 4. County of residence of Training Benefits participants approved in FY 2012 and FY 2013 Washington state, FY 2012 and FY 2013 Source: Employment Security Department/LMPA, Unemployment Insurance Data Warehouse
County
FY 2012 FY 2013
Approved Training Benefits
participants Percent of total
Percent of all unemployment
claimants
Approved Training Benefits
participants Percent of total
Percent of all unemployment
claimants
Adams 1 0.0% 0.4% 1 0.0% 0.4%
Asotin 2 0.1% 0.1% 0 0.0% 0.1%
Benton 125 4.3% 3.2% 97 4.1% 3.4%
Chelan 37 1.3% 1.7% 25 1.1% 1.7%
Clallam 28 1.0% 1.1% 16 0.7% 1.0%
Clark 83 2.9% 4.7% 70 3.0% 4.5%
Columbia 1 0.0% 0.5% 0 0.0% 0.1%
Cowlitz 43 1.5% 1.7% 31 1.3% 1.6%
Douglas 22 0.8% 0.8% 10 0.4% 0.8%
Ferry 4 0.1% 0.1% 1 0.0% 0.1%
Franklin 43 1.5% 1.7% 44 1.9% 1.8%
Garfield 1 0.0% 0.2% 0 0.0% 0.0%
Grant 20 0.7% 1.8% 13 0.6% 1.9%
Grays Harbor 135 4.7% 1.5% 61 2.6% 1.5%
Island 29 1.0% 0.9% 29 1.2% 0.8%
Jefferson 6 0.2% 0.4% 4 0.2% 0.4%
King 806 28.0% 23.8% 774 33.0% 24.0%
Kitsap 114 4.0% 3.0% 87 3.7% 3.0%
Kittitas 4 0.1% 0.7% 1 0.0% 0.6%
Klickitat 4 0.1% 0.3% 1 0.0% 0.3%
Lewis 70 2.4% 1.7% 43 1.8% 1.5%
Lincoln 1 0.0% 0.1% 2 0.1% 0.1%
Mason 26 0.9% 1.0% 11 0.5% 0.9%
Okanogan 13 0.5% 0.9% 7 0.3% 0.9%
Pacific 4 0.1% 0.4% 2 0.1% 0.4%
Pend Oreille 2 0.1% 0.2% 1 0.0% 0.2%
Pierce 338 11.8% 13.1% 297 12.6% 12.9%
San Juan 0 0.0% 0.2% 0 0.0% 0.2%
Skagit 62 2.2% 2.2% 47 2.0% 2.1%
Skamania 1 0.0% 0.2% 0 0.0% 0.2%
Snohomish 441 15.3% 10.7% 344 14.6% 10.5%
Spokane 83 2.9% 7.3% 46 2.0% 7.3%
Stevens 13 0.5% 0.7% 12 0.5% 0.8%
Thurston 93 3.2% 3.6% 93 4.0% 3.8%
Wahkiakum 2 0.1% 0.0% 1 0.0% 0.1%
Walla Walla 24 0.8% 0.6% 25 1.1% 0.7%
Whatcom 70 2.4% 2.9% 61 2.6% 3.0%
Whitman 3 0.1% 0.1% 2 0.1% 0.2%
Yakima 106 3.7% 6.0% 67 2.9% 6.3%
Data not available 15 0.5% 0.0% 23 1.0% 0.0%
Total 2,875 100.0% 100.0% 2,349 100.0% 100.0%
For FY 2012, the greatest portion of Training Benefits participants resided in King, Pierce and Snohomish counties – 55.1 percent in FY 2012 and 60.2 percent in FY 2013. In contrast, these three counties for the same fiscal years held somewhat more than 47 percent of all unemployment-benefits recipients.

December 2013 Training Benefits Program Annual Report Employment Security Department Page 14
Industry and occupation of participants before training Industry refers to an employer’s principal line of business, while an occupation refers to the kind of work a worker does. For example, a secretary working for an aerospace manufacturer has the occupation of secretary, but is classified as working in the aerospace industry.
Occupations in this report are specific to the experience of individual unemployment-insurance claimants, who provide their current occupational information when they file a claim for unemployment-insurance benefits.
Industry classification of participants prior to training
Over half of Training Benefits participants approved in both FY 2012 (51.6 percent) and FY 2013 (51.6 percent) were previously employed in the following five industry sectors: manufacturing; administrative and support and waste management services; public administration; healthcare and social assistance; and retail trade. Workers from these industry sectors represented only 44.1 percent and 44.7 percent of all unemployment-insurance claimants in FY 2012 and FY 2013, respectively (Figure 5).
The top five industries in which Training Benefits participants had previously been employed were consistent between FY 2012 and FY 2013, but two of those top five industry sectors – public administration and retail trade – were not present in the top five for FY 2011.
For both FY 2012 and FY 2013, unemployed workers coming from the following industry sectors each provided less than one percent of the Training Benefits participants: agriculture, forestry, fishing and hunting; management of companies and enterprises; utilities; and mining. The agriculture, forestry, fishing and hunting industry sector made up a larger share of the total unemployment-insurance claimants, at 5.6 percent and 6.3 percent in FY 2012 and FY 2013, respectively.

December 2013 Training Benefits Program Annual Report Employment Security Department Page 15
Figure 5. Prior industry of employment of Training Benefits participants approved in FY 2012 and FY 2013 Washington state, FY 2012 and FY 2013 Source: Employment Security Department/LMPA, Unemployment Insurance Data Warehouse
Industry
FY 2012 FY 2013
Approved Training Benefits
participants
Percent of
total
Percent of all unemployment
claimants
Approved Training Benefits
participants
Percent of
total
Percent of all unemployment
claimants
Manufacturing 406 14.1% 10.8% 233 9.9% 10.7%
Administrative and support and waste management services
298 10.4% 10.5% 223 9.5% 11.0%
Public administration 278 9.7% 4.4% 250 10.6% 4.8%
Healthcare and social assistance 251 8.7% 8.8% 219 9.3% 8.6%
Retail trade 249 8.7% 9.6% 289 12.3% 9.6%
Construction 213 7.4% 18.3% 145 6.2% 17.1%
Professional, scientific and technical services
191 6.6% 4.6% 154 6.6% 4.7%
Wholesale trade 115 4.0% 3.8% 95 4.0% 3.9%
Finance and insurance 115 4.0% 1.9% 107 4.6% 1.7%
Other services (except public administration)
110 3.8% 2.8% 86 3.7% 2.8%
Accommodation and food services 106 3.7% 6.8% 86 3.7% 7.0%
Educational services 99 3.4% 2.5% 65 2.8% 2.3%
Information 71 2.5% 1.7% 73 3.1% 1.8%
Transportation and warehousing 67 2.3% 3.6% 69 2.9% 3.8%
Real estate renting and leasing 53 1.8% 1.6% 38 1.6% 1.4%
Arts, entertainment and recreation 47 1.6% 2.1% 47 2.0% 2.1%
Agriculture, forestry, fishing and hunting
21 0.7% 5.6% 20 0.9% 6.3%
Management of companies and enterprises
8 0.3% 0.2% 4 0.2% 0.1%
Utilities 5 0.2% 0.2% 4 0.2% 0.2%
Mining 3 0.1% 0.3% 2 0.1% 0.2%
Data not available 169 5.9% 0.0% 140 6.0% 0.0%
Total 2,875 100.0% 100.0% 2,349 100.0% 100.0%
Over half of all Training Benefits participants were former employees of the following industry sectors: manufacturing; administrative and support and waste management services; public administration; healthcare and social assistance; and retail trade.
Occupational classification of participants prior to training
Over half of Training Benefits participants approved in both FY 2012 (55.5 percent) and FY 2013 (53.2 percent) were previously employed in the following five occupations: office and administrative support; production; management; construction and extraction; and sales and related occupations. Workers from these occupations represented comparable percentages of total unemployment-insurance claimants in both years: 54.0 percent in FY 2012 and 53.0 percent in FY 2013 (Figure 6). A greater percentage of unemployment-insurance claimants who previously worked in office and

December 2013 Training Benefits Program Annual Report Employment Security Department Page 16
administrative support occupations participated in the TB Program compared to their overall percentage of total claimants. The reverse was true for those who previously worked in construction and extraction occupations. These patterns were consistent between the two fiscal years, as well as previous years.
Workers previously employed in legal occupations and farming, fishing and forestry occupations each provided less than one percent of the Training Benefits participants approved in FY 2012 and no more than 1.0 percent in FY 2013. For these two fiscal years, these two occupations represented about 5 percent of all unemployment-insurance claimants.
It is of interest that 2.9 percent of Training Benefits participants were from military-specific occupations in both fiscal years, but they represented less than 1 percent of all unemployment-insurance claimants for those two years. This over-representation was also true for FY 2011.
Figure 6. Prior occupations of Training Benefits participants approved in FY 2012 and FY 2013 Washington state, FY 2012 and FY 2013 Source: Employment Security Department/LMPA, Unemployment Insurance Data Warehouse
Occupation
FY 2012 FY 2013
Approved Training Benefits
participants
Percent of
total
Percent of all unemployment
claimants
Approved Training Benefits
participants
Percent of
total
Percent of all unemployment
claimants
Office and administrative support occupations
521 18.1% 11.7% 460 19.6% 11%
Production occupations 377 13.1% 10.4% 220 9.4% 11%
Management occupations 287 10.0% 7.6% 234 10.0% 8%
Construction and extraction occupations
225 7.8% 17.5% 153 6.5% 17%
Sales and related occupations 187 6.5% 6.8% 180 7.7% 7%
Transportation and material moving occupations
156 5.4% 8.6% 110 4.7% 9%
Business and financial operations occupations
142 4.9% 2.3% 131 5.6% 2%
Installation, maintenance and repair occupations
139 4.8% 4.8% 122 5.2% 5%
Personal care and service occupations
85 3.0% 3.1% 70 3.0% 3%
Healthcare support occupations 84 2.9% 2.0% 72 3.1% 2%
Military-specific occupations 83 2.9% 0.8% 68 2.9% 1%
Computer and mathematical occupations
82 2.9% 1.8% 98 4.2% 2%
Food preparation and serving related occupations
65 2.3% 5.6% 54 2.3% 6%
Healthcare practitioners and technical occupations
64 2.2% 1.8% 64 2.7% 2%
Architecture and engineering occupations
63 2.2% 1.6% 49 2.1% 2%
Life, physical and social science occupations
54 1.9% 0.9% 31 1.3% 1%

December 2013 Training Benefits Program Annual Report Employment Security Department Page 17
Community and social services occupations
49 1.7% 0.8% 22 0.9% 1%
Education, training and library occupations
45 1.6% 1.7% 35 1.5% 2%
Arts, design, entertainment, sports and media occupations
44 1.5% 1.4% 58 2.5% 2%
Protective service occupations 40 1.4% 1.3% 34 1.4% 1%
Building and grounds cleaning and maintenance occupations
31 1.1% 2.9% 30 1.3% 3%
Legal occupations 22 0.8% 0.4% 8 0.3% 0%
Farming, fishing and forestry occupations
15 0.5% 4.2% 23 1.0% 5%
Data not available 15 0.5% 23 1.0%
Total 2,875 100.0% 100.0% 2,349 100.0% 100.0%
Over one-half of all Training Benefits participants worked in the following occupations prior to TB program participation: office and administrative support; production; management; construction and extraction; and sales and related occupations.
Unemployment-insurance and Training Benefits payments received Figure 7 shows the unemployment-insurance and Training Benefits Program payments made, through October 2013, to participants approved in FY 2012 and FY 2013. These numbers will most likely change, since a portion of these Training Benefits participants are still receiving weekly benefits.
To date, Training Benefits participants approved in FY 2012 have collected an average of $396 per week and a median of $407 per week, for an average of 100 weeks. Participants approved in FY 2013 have collected an average of $377 per week and a median of $385 per week, for an average of 84 weeks. These payments included funds from regular unemployment benefits, emergency-unemployment compensation, extended benefits and the Training Benefits Program.9
Of the 2,875 Training Benefits participants approved in FY 2012, to date, 1,402, or 48.8 percent, have received payments from Training Benefits funds. Those payments have totaled about $12.5 million, for an average of $8,931 per participant who received TB Program funds. For participants approved in FY 2013, to date, 776 of 2,378 have received payments from Training Benefits funds. To date, those payments have totaled about $4.0 million, for an average of $5,138 per participant from TB funds.
Looking at unemployment-insurance claimants who did not participate in the Training Benefits Program, in FY 2012, a total of 403,052 individuals (exclusive of Training Benefits participants) received unemployment-insurance benefits. In FY 2013 that number was 330,279. Their average and median weekly benefits amounts were slightly lower than Training Benefits participants, at $352 and $338 in FY 2012 and $359 and 345 in FY 2013. This indicates that Training Benefits participants were earning somewhat more than non-participants prior to being laid off.
9 These measures of total benefit compensation reflect the federal American Recovery and Reinvestment Act of 2009 (ARRA) stimulus of $25
and state EHB 1906 $45 state stimulus packages that increased benefit amounts by $70 per week.

December 2013 Training Benefits Program Annual Report Employment Security Department Page 18
Figure 7. Training Benefits participants' receipt of unemployment-insurance and Training Benefits payments, current dollars, for participants approved in FY 2012 and FY 2013 Washington state, FY 2012 and FY 2013 Source: Employment Security Department/LMPA, Unemployment Insurance Data Warehouse
2,875 participants approved in FY 2012
2,378 participants approved in FY 2013*
Total unemployment-insurance benefits paid $101,249,693 $60,891,631
Average number of weeks UI benefits paid 100 84
Median number of weeks UI benefits paid 95 71
Average weekly UI benefits paid $396 $377
Median weekly UI benefits paid $407 $385
Total paid from Training Benefits Program benefits funds $12,520,741 $3,986,765
Total participants receiving benefits from Training Benefits funds 1,402 776
Average number of weeks TB benefits paid from TB funds 22 13
Median number of weeks TB benefits paid from TB funds 24 10
*The number of participants approved for the TB program in FY 2013 included in this figure varies slightly from the number included in Figure 1, since the unemployment-insurance administrative database is an active file in which information can be updated. Information in this table is current as of October 2013.
Training Benefits funds account for only a portion of the total unemployment-insurance benefits received by program participants.
Types of training and program completions for Training Benefits participants approved from 2009 through 2011 To better understand the training experience and employment prospects of Training Benefits participants, this report looks at the population of nearly 9,000 participants who were approved for the program from calendar years (CY) 2009 through 2011. In addition to Employment Security administrative records, two sources of data are essential to this effort: training data from the State Board for Community and Technical Colleges and data from the survey of program participants.
Enrollment in the state’s community and technical college system The State Board for Community and Technical Colleges provided information for Training Benefits participants enrolled in training during the 2008-2009, 2009-2010, 2010-2011 and 2011-2012 academic years (Figure 8).
During these academic years, 8,095 Training Benefits participants completed 150,998 courses of the 167,058 courses they attempted, for a 90.4 percent completion rate. This rate is an improvement over the 84.8 percent reported in the 2012 Training Benefits report for participants approved from CY 2008 through CY 2010 for enrollments from the 2007-2008 through 2010-2011 academic years.10
The five most common courses attempted by participants approved during CY 2009 through CY 2011 were: computational skills; office management and supervision; microcomputer applications, general; medical/clinical assistant; and accounting technician and bookkeeping. The
10 See: “2012 Training Benefits Program Annual Report,” Washington State Employment Security Department, Labor Market and Economic
Analysis, December 2012, page 12.
December 2013 Training Benefits Program Annual Report Employment Security Department Page 19
composition and ranking of these course areas were very similar to those analyzed in last year’s report, for participants approved from CY 2008 through CY 2010 for enrollments from the 2007-2008 through 2010-2011 academic years.
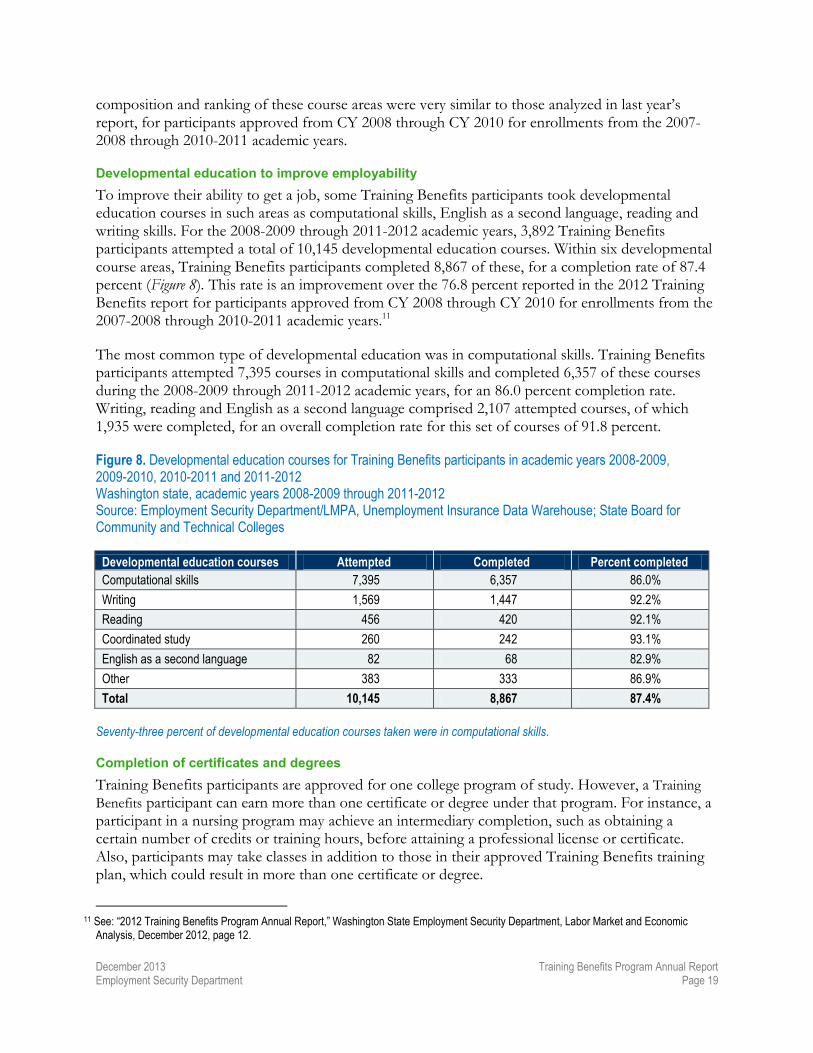
Developmental education to improve employability To improve their ability to get a job, some Training Benefits participants took developmental education courses in such areas as computational skills, English as a second language, reading and writing skills. For the 2008-2009 through 2011-2012 academic years, 3,892 Training Benefits participants attempted a total of 10,145 developmental education courses. Within six developmental course areas, Training Benefits participants completed 8,867 of these, for a completion rate of 87.4 percent (Figure 8). This rate is an improvement over the 76.8 percent reported in the 2012 Training Benefits report for participants approved from CY 2008 through CY 2010 for enrollments from the 2007-2008 through 2010-2011 academic years.11
The most common type of developmental education was in computational skills. Training Benefits participants attempted 7,395 courses in computational skills and completed 6,357 of these courses during the 2008-2009 through 2011-2012 academic years, for an 86.0 percent completion rate. Writing, reading and English as a second language comprised 2,107 attempted courses, of which 1,935 were completed, for an overall completion rate for this set of courses of 91.8 percent.
Figure 8. Developmental education courses for Training Benefits participants in academic years 2008-2009, 2009-2010, 2010-2011 and 2011-2012 Washington state, academic years 2008-2009 through 2011-2012 Source: Employment Security Department/LMPA, Unemployment Insurance Data Warehouse; State Board for Community and Technical Colleges
Developmental education courses Attempted Completed Percent completed
Computational skills 7,395 6,357 86.0%
Writing 1,569 1,447 92.2%
Reading 456 420 92.1%
Coordinated study 260 242 93.1%
English as a second language 82 68 82.9%
Other 383 333 86.9%
Total 10,145 8,867 87.4%
Seventy-three percent of developmental education courses taken were in computational skills.
Completion of certificates and degrees Training Benefits participants are approved for one college program of study. However, a Training
Benefits participant can earn more than one certificate or degree under that program. For instance, a participant in a nursing program may achieve an intermediary completion, such as obtaining a certain number of credits or training hours, before attaining a professional license or certificate. Also, participants may take classes in addition to those in their approved Training Benefits training plan, which could result in more than one certificate or degree.
11 See: “2012 Training Benefits Program Annual Report,” Washington State Employment Security Department, Labor Market and Economic
Analysis, December 2012, page 12.
December 2013 Training Benefits Program Annual Report Employment Security Department Page 20
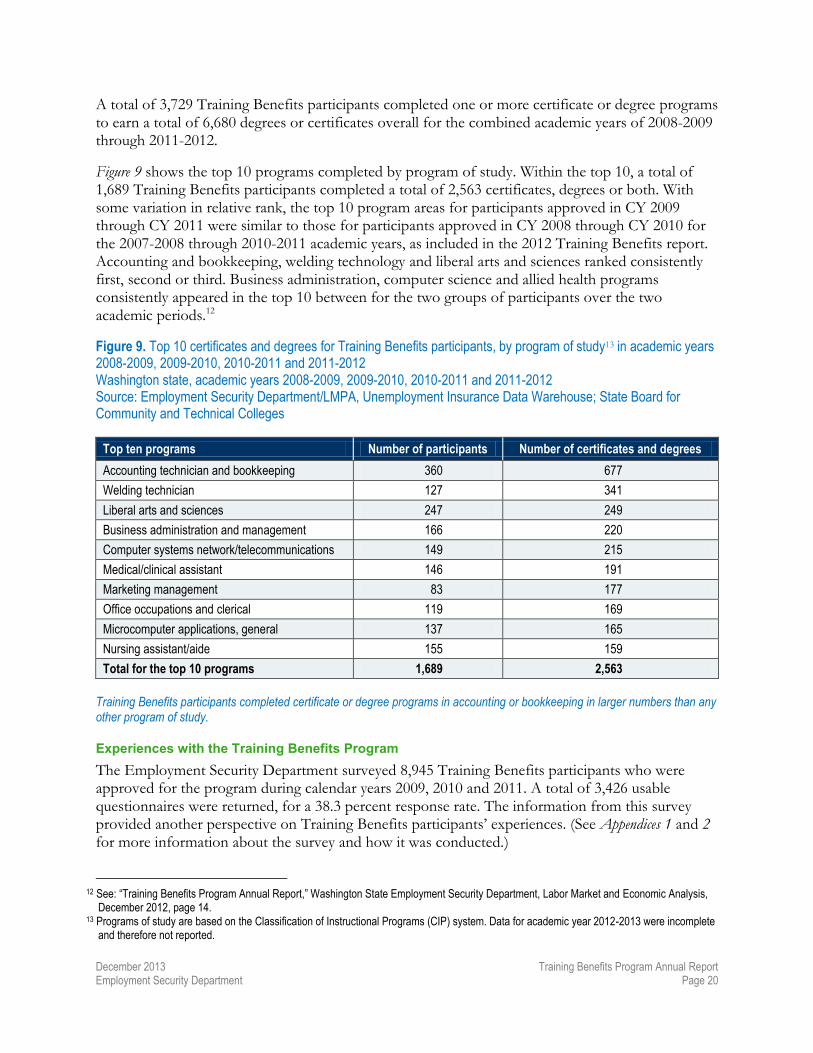
A total of 3,729 Training Benefits participants completed one or more certificate or degree programs to earn a total of 6,680 degrees or certificates overall for the combined academic years of 2008-2009 through 2011-2012.
Figure 9 shows the top 10 programs completed by program of study. Within the top 10, a total of 1,689 Training Benefits participants completed a total of 2,563 certificates, degrees or both. With some variation in relative rank, the top 10 program areas for participants approved in CY 2009 through CY 2011 were similar to those for participants approved in CY 2008 through CY 2010 for the 2007-2008 through 2010-2011 academic years, as included in the 2012 Training Benefits report. Accounting and bookkeeping, welding technology and liberal arts and sciences ranked consistently first, second or third. Business administration, computer science and allied health programs consistently appeared in the top 10 between for the two groups of participants over the two academic periods.12
Figure 9. Top 10 certificates and degrees for Training Benefits participants, by program of study13 in academic years 2008-2009, 2009-2010, 2010-2011 and 2011-2012 Washington state, academic years 2008-2009, 2009-2010, 2010-2011 and 2011-2012 Source: Employment Security Department/LMPA, Unemployment Insurance Data Warehouse; State Board for Community and Technical Colleges
Top ten programs Number of participants Number of certificates and degrees
Accounting technician and bookkeeping 360 677
Welding technician 127 341
Liberal arts and sciences 247 249
Business administration and management 166 220
Computer systems network/telecommunications 149 215
Medical/clinical assistant 146 191
Marketing management 83 177
Office occupations and clerical 119 169
Microcomputer applications, general 137 165
Nursing assistant/aide 155 159
Total for the top 10 programs 1,689 2,563
Training Benefits participants completed certificate or degree programs in accounting or bookkeeping in larger numbers than any other program of study.
Experiences with the Training Benefits Program The Employment Security Department surveyed 8,945 Training Benefits participants who were approved for the program during calendar years 2009, 2010 and 2011. A total of 3,426 usable questionnaires were returned, for a 38.3 percent response rate. The information from this survey provided another perspective on Training Benefits participants’ experiences. (See Appendices 1 and 2 for more information about the survey and how it was conducted.)
12 See: “Training Benefits Program Annual Report,” Washington State Employment Security Department, Labor Market and Economic Analysis,
December 2012, page 14. 13 Programs of study are based on the Classification of Instructional Programs (CIP) system. Data for academic year 2012-2013 were incomplete
and therefore not reported.

December 2013 Training Benefits Program Annual Report Employment Security Department Page 21
As required by statute, ESD surveyed a three-year group of participants. The results of this survey are largely the same as last year’s survey. This is not surprising since participants from two of last year’s three-year group overlapped with this year’s – those approved in CY 2009 and CY 2010.
Did the participant complete training? Of the 3,426 survey respondents, 3,171, or 92.6 percent, indicated that they had started their training. Of those who started training, 1,993 participants, or 62.9 percent, indicated that they completed their training. The remaining 1,090 respondents were split among 603 participants, or 19.0 percent, who did not complete their training, 487, or 15.4 percent, who were still in training and a remaining 88 participants with unknown status – 2.8 percent.
Reasons for withdrawing from training The 603 respondents to the survey who did not complete their training selected one or more of six possible reasons for not completing their TB Program approved training plan (Figure10). An important group of these respondents was the Training Benefits participants who stated that they needed to find a job rather than continue in school, 77 individuals or 12.8 percent. Another 191 participants, or 31.7 percent, found a job that met their needs. A small group of 34 individuals, 5.6 percent, indicated that they returned to their former job. Somewhat fewer than one out of five, 18.1 percent, of the respondents indicated that they did not have enough money for tuition, books, supplies, etc. Finally, more than one-third, 36.7 percent, indicated that they ran out of unemployment-insurance benefits before they completed their training program.
Figure 10. Reasons Training Benefits participants gave for not completing their training plan, for participants approved in CY 2009 through CY 2011 Washington state, CY 2013 Source: Employment Security Department/LMPA, summer 2013 Training Benefits survey
Reason for withdrawal from training Number* Percent of total
You found a job that met your needs 191 31.7%
You needed to find a job rather than continue school 77 12.8%
You returned to former job 84 5.6%
You did not have enough money for tuition, fees, supplies and/or books 109 18.1%
Your unemployment insurance ended before you completed the program 221 36.7%
Other reasons 23 3.8%
*A Training Benefits participant could give more than one reason for not completing his or her Training Benefits Program plan.
A total of 603 individuals responded with at least one reason.
Of those Training Benefits participants who did not complete their training, over three out of 10 gave as a reason that they found a suitable job. More than one-third quit because their unemployment benefits ran out.
How program participants paid for tuition Some Training Benefits participants had multiple sources of funds to pay for their training, that is, their tuition. The 1,915 respondents who started or completed training reported one or more of six funding sources to pay for their tuition.

December 2013 Training Benefits Program Annual Report Employment Security Department Page 22
The greatest proportion of respondents, 42.0 percent, identified financial assistance from the school or college. Training Benefits Program weekly payments ranked second at 40.2 percent of funding sources reported. Other governmental assistance was reported as a funding source for about 30 percent of respondents. Personal funds, at 32.5 percent, were cited by about one-third of respondents. Finally, the Training Benefits participant’s family was not a significant source of funding; only 7.0 percent, one out of 14, reported family support as a source of funds. This pattern of funding sources was similar to the participants who reported their tuition funding sources in the 2012 Training Benefits report, although the exact percentages varied between the two reports.
Figure 11. Ways Training Benefits participants paid for tuition, for Training Benefits participants approved in CY 2009 through CY 2011 Washington state, CY 2013 Source: Employment Security Department/LMPA, summer 2013 Training Benefits survey
Source of funding Number* Percent of total
Personal funds 623 32.5%
Family support 134 7.0%
Other governmental assistant 573 29.9%
Financial assistant through school or college 804 42.0%
Training Benefits Program weekly payments 770 40.2%
Combination of funds 501 26.2%
*A Training Benefits participant could indicate more than one source of funding for his or her tuition. A total of 1,915 responded with at least one source of funding.
The most commonly reported source of funding to pay for tuition was financial assistance through the school or college.
Was a degree, certificate or license required for the job for which participants were training? The Training Benefits participants were asked whether the job they were training for required a degree, certificate or license. Of the 3,426 respondents, 2,695, or 78.7 percent, responded “yes”; 250, or 7.3 percent, responded “no”; 134 Training Benefits participants or 3.9 percent “did not know.”
Occupations of participants after returning to work
Of the 3,426 respondents to the survey, 1,393 provided information on their occupation after training. A total of 198 respondents, 14.2 percent, said they worked in office and administrative support occupations. The top five occupations in which respondents found work provided 705, or 50.6 percent, of the 1,393 occupations reported. The bottom five occupations provided only 42 of the occupations reported, 3.0 percent (Figure 12).

December 2013 Training Benefits Program Annual Report Employment Security Department Page 23
Figure 12. Occupations of Training Benefits participants who returned to work, for participants approved in CY 2009 through CY 2011 Washington state, CY 2013 Source: Employment Security Department/LMPA, summer 2013 Training Benefits survey
Occupation of TB Program participants who returned to work Number Percentage of total
Office and administrative support occupations 198 14.2%
Healthcare practitioners and technical occupations 159 11.4%
Computer and mathematical occupations 144 10.3%
Business and financial operations occupations 105 7.5%
Healthcare support occupations 99 7.1%
Production occupations 92 6.6%
Installation, maintenance and repair occupations 85 6.1%
Management occupations 80 5.7%
Architecture and engineering occupations 60 4.3%
Construction and extraction occupations 50 3.6%
Education, training and library occupations 48 3.4%
Sales and related occupations 46 3.3%
Transportation and material moving occupations 45 3.2%
Personal care and service occupations 40 2.9%
Arts, design, entertainment, sports and media occupations 36 2.6%
Community and social services occupations 27 1.9%
Protective service occupations 19 1.4%
Legal occupations 18 1.3%
Life, physical and social science occupations 16 1.1%
Food preparation and serving-related occupations 14 1.0%
Building and grounds cleaning and maintenance occupations 8 0.6%
Farming, fishing and forestry occupations 3 0.2%
Military-specific occupations 1 0.1%
Total 1,393 99.8%
The top five occupational categories provided one-half of the total employment reported by Training Benefits participants. Did participants return to their former employers? Of those 640 respondents who said they were now working,14 24, or 3.8 percent, said they returned to the employer they had when they were laid off; 507 respondents, 79.2 percent, were working for another employer; and the status of the remaining 109 was unknown.15
14 The time period of reference was summer 2013. 15 Recall that 34 Training Benefits participants who dropped out of training reported that they returned to their former employer, as well – 5.2
percent of the total reasons given for dropping out.

December 2013 Training Benefits Program Annual Report Employment Security Department Page 24
Was the training helpful in getting a new job? Training Benefits participants were asked if the training helped them get their job. There were 1,372 responses to this question. More than three-fifths, 63.4 percent, reported that the training was “a major help.” Another 15.7 percent indicated that the training “helped somewhat.” One fifth, 20.8 percent, indicated that their training provided “very little help” or “no help at all.”
Were participants employed in a field for which the participants were retrained? Training Benefits participants were asked if they were employed in a field for which they were retrained. There were 1,371 responses to this question. One thousand respondents, 72.9 percent, indicated that this was so. The remaining 371 respondents, 27.1 percent, answered in the negative.
Employment and wage history of Training Benefits participants Prior to their initial unemployment claims, Training Benefits participants approved in FY 2012 and FY 2013 earned a median annual wage of $37,632 and $36,392, respectively. This compares to median pre-claim annual earnings of $34,748 for FY 2011 participants.16 Final post-TB wages are not yet available for these FY 2012 and FY 2013 participants, some of whom may still be in training.
Figure 13 and Figure 14 show the pre- and post-before-tax earnings of Training Benefits participants who were employed based on the calendar year in which they were approved for the TB Program. Figure 13 shows the four quarters of earnings prior to the quarter in which individuals filed a claim for unemployment-insurance benefits and the eight quarters of earnings starting in the quarter after benefits ended.17 These data come from unemployment-insurance administrative data and are separate from the survey data of participants.
Note that the earnings estimates in Figure 13 are measures of gross program impact. They are not adjusted for net program impact by comparing them with a valid control or comparison group over the same post-program time period.18
The post-TB Program quarterly earnings data show that from 46 to 56 percent of Training Benefits participants were employed in the first quarter after the end of their TB Program plan. For participants approved in CY 2009, for whom the data are most complete, post-TB quarterly employment increased steadily from 53 percent in post-quarter 1 to 58 percent in post-quarter 4. For those approved in CY 2010, post-quarter 1 employment was estimated to be 56 percent, increasing to 60 percent by post-quarter 3. Follow-up data for participants approved in CY 2011 were incomplete beyond post-quarter 1.
16 From this point on, the term “earnings” refers to “before-tax earnings.” The median estimates are for those who worked at all in a given quarter.
Zero earnings are excluded from these quarterly estimates. These earnings are based on the total earnings reported in the 12 to 15 months upon which the unemployment-insurance claim is based. Given that the individual is a Training Benefits participant, “Quarter -1” begins in the quarter immediately prior to the quarter in which the individual applies for unemployment-insurance benefits. “Quarter +1” begins in the quarter in which the individual ceases to receive an unemployment-insurance benefit check.
17 As stated earlier in this report, the actual dates for starting and ending one’s TB approved job training may or may not coincide with the dates of approval for Training Benefits Program eligibility. Training can start before TB Program eligibility and continue after one’s weekly benefits under the TB Program run out. The data in Figures 13 and 14 are based on the quarter in which the individual applied for unemployment-insurance benefits and the date at which the Training Benefits participant no longer received unemployment-insurance benefits.
18 For an estimate of net TB Program impacts, see: Paterson, Toby, Ernst W. Stromsdorfer and Jeffrey Zahir, “Net-Impact Analysis on Before-Tax Annual Earnings for the Training Benefits Program, 2002 through 2008,” Employment Security Department, Labor Market and Economic Analysis branch, February 2012.
December 2013 Training Benefits Program Annual Report Employment Security Department Page 25
A wide range of studies have found that dislocated and disadvantaged workers who retrain for new careers experience their post-training wages beginning below their pre-layoff wages. Post-training wages then tend to rise during the second or third year after training. At that point, wages for those who have retrained tend to be higher than those statistically similar workers who have not retrained, but still can be lower than pre-layoff wages due to the loss of firm-, industry- and occupation-specific human capital.19
As Figure 13 shows, Training Benefits participants’ median earnings in the year prior to their pre-TB Program unemployment-insurance claims were considerably higher than their earnings in the first full year after their Training Benefits payments ended. For participants approved for the TB Program in calendar year 2009, median earnings went down from $38,926 prior to the TB Program to $31,993 in the first full year after the program, a reduction of 17.8 percent. For those approved in calendar year 2010, the difference was 25.4 percent ($38,699 versus $28,886). For those approved in calendar year 2011, the difference was greatest, a reduction of 28.4 percent ($38,687 versus $27,697).20
Improvement in median annual earnings began in the second full year after the participants’ TB Program plan ended. For the 2009 cohort, the improvement was 15.0 percent; for the 2010 cohort, 22.8 percent; and for the 2011 cohort, 25.0 percent. At a median of $36,786 in the second year, the 2009 cohort was earning only 5.5 percent less than the year before receiving unemployment benefits. The 2010 cohort earned 8.4 percent less, improving to $35,462 for the second full year out; while the 2011 cohort earned 10.5 percent less, improving to $34,627. Again, these are gross program effects that do not reflect the ultimate net program effects.
19 See: Paterson, Toby, Ernst W. Stromsdorfer and Jeffrey Zahir, “Net-Impact Analysis on Before-Tax Annual Earnings for the Training Benefits
Program, 2002 through 2008,” Employment Security Department, Labor Market and Economic Analysis branch, February 2012; Hollenbeck, Kevin and Wei-Jang Huang, “Net Impact and Benefit-Cost Estimates of the Workforce Development System in Washington State,” Upjohn Institute Technical Report No. 06-020, W.E. Upjohn Institute for Employment Research, Kalamazoo, Michigan, September 2006; and Jacobson, Louis, Robert LaLonde and Daniel G. Sullivan, “The Returns of Community College Schooling for Displaced Workers,” U.S. Department of Labor, The University of Chicago and the Federal Reserve Bank of Chicago, January 2001.
20 TB participant earnings for those approved for the program in calendar years 2009 and 2010 overlap with the analysis in last year’s report. The numbers differ somewhat due to changes that may have occurred in individuals’ program status.

December 2013 Training Benefits Program Annual Report Employment Security Department Page 26
Figure 13. Median quarterly before-tax earnings, pre- and post-Training Benefits, for participants approved from CY 2009 through CY 2011, in current dollars Washington state, CY 2009 through CY 2011 Source: Employment Security Department/LMPA, Unemployment Insurance Data Warehouse, Wage File
Cohort year
Quarterly earnings before* Quarterly earnings post training benefits**
-4 -3 -2 -1 1 2 3 4 5 6 7 8
2009 $9,685 $9,650 $9,872 $9,719 $7,581 $7,762 $8,104 $8,546 $8,824 $8,946 $9,360 $9,656
2010 $9,600 $9,694 $9,734 $9,671 $6,523 $7,076 $7,532 $7,755 $8,410 $8,640 $9,046 $9,366
2011 $9,538 $9,680 $9,778 $9,691 $5,899 $6,784 $7,234 $7,780 $8,491 $8,443 $8,751 $8,942
*Quarterly median before-tax earnings of Training Benefits participants who were employed in the quarters prior to receiving unemployment benefits under the TB Program. Information in this table is current as of October 2013. **Quarterly median before-tax earnings of Training Benefits participants who were employed in the quarters post-Training Benefits. Information in this table is current as of October 2013.
Training Benefits participants’ earnings declined following loss of employment, but gradually increased in the second year after the Training Benefits participant completed his or her TB Program plan.
Figure 14 abstracts from the time the participants spent in the TB Program – a time period that varies by cohort and participant depending on the quarter in which the individual applied for unemployment-insurance benefits and the quarter in which the Training Benefits participant received his or her last unemployment-insurance benefit payment under the conditions of his or her TB Program plan.
Figure 14 graphically shows the pre- and post-TB quarterly earnings for these same TB Program participants. Note that median quarterly earnings were stable in the four quarters prior to the quarter in which the participants applied for the receipt of unemployment benefits. Although not depicted here, the rate of employment dropped off 2 to 6 percentage points from the third to the fourth quarter prior to the quarter of application for unemployment-insurance benefits. Then, after unemployment-insurance benefits ended, quarterly earnings gradually improved. This pattern of earnings loss and then gain following loss of employment is similar to the pattern seen in other government-subsidized occupational training programs.21
21 See: Paterson, Toby, Ernst W. Stromsdorfer and Jeffrey Zahir, Net-Impact Analysis on Before-Tax Annual Earnings for the Training Benefits
Program, 2002 through 2008, Employment Security Department, Labor Market and Economic Analysis, February 2012.

December 2013 Training Benefits Program Annual Report Employment Security Department Page 27
Figure 14. Median quarterly before-tax earnings, pre- and post-Training Benefits Program plan, for participants approved from calendar year 2009 through 2011, in current dollars* Washington state, 2009 through 2011 Source: Employment Security Department/LMPA, Unemployment Insurance Data Warehouse, Wage File
*Information in this figure is current as of October 2013.
It took about two years after participation in the Training Benefits Program to see before-tax earnings approach pre-layoff levels.
Program administrative costs The Employment Security Department spent an average of $1.6 million per state fiscal year over FY 2012 and FY 2013 to administer the Training Benefits Program (Figure 15). There are two major drivers of program costs.
The first driver of program costs is caseload-associated activities. These are tasks and services associated with claimants seeking and gaining eligibility to the Training Benefits Program. These activities fluctuate with the number of initial unemployment-insurance claims and overall demand for the program.
The second driver of program costs is general administrative costs and program oversight. These core functions are essential to operating the Training Benefits Program. These functions include supervisory and administrative activities, fiscal and budget activities, communications and office services.

December 2013 Training Benefits Program Annual Report Employment Security Department Page 28
Caseload activities Caseload activities vary, depending on the number of applications the department receives. These activities accounted for an average of 54 percent of costs per state fiscal year for FY 2012 and FY 2013 and included:
Distributing information about and explaining eligibility criteria for the Training Benefits Program and other unemployment programs, including Commissioner-Approved Training, emergency-unemployment compensation and extended benefits;
Helping applicants complete the Training Benefits application;
Communicating and coordinating with the adjudication centers and participants to provide the status of applications and advise adjudicators of changes to a claimant’s training status; and
Writing decisions and processing appeals.
Current cost assumptions for caseload activities
For every 320 applications, an Unemployment Insurance Specialist 3 is needed, at a current annual cost of $66,294. For every six Unemployment Insurance Specialist 3 positions, an Office Assistant 3 is needed, at an annual cost of $48,676.
General administrative and oversight activities General administrative and oversight activities are constant costs. These averaged 46 percent of total costs for FY 2012 and FY 2013. Figure 15 outlines the costs for FY 2011 through FY 2013 and the projected costs for FY 2014.
These activities include the indirect overhead costs associated with financial services, accounting, budgeting, payroll, personnel, communications, training, computer systems management, research and data analysis, utilities, rent and leases, travel, printing and facilities services.
The State Board for Community and Technical Colleges reported that there are administrative costs associated with serving any student enrolled in college. A student receiving Training Benefits does not create additional costs or different costs than any other student.

December 2013 Training Benefits Program Annual Report Employment Security Department Page 29
Figure 15. Training Benefits Program administrative costs for FY 2011through FY 2013 and projected costs for FY 2014 Washington state, FY 2011 through projected FY 2014 Source: Employment Security Department administrative data
Training Benefits Program administrative costs
FY 2011 FY 2012 FY 2013 Projected FY 2014
Number of applications processed 5,440 3,961 4,282 4,282
Caseload staffing
Unemployment Insurance Specialist 16.8 12.1 8.0 8.0
Office Assistant 0.9 1.6 2.3 2.3
WorkSource Specialist 8.5 3.8 0.5 0.5
Total caseload staffing 26.1 17.5 10.7 10.7
Claims per UI Specialist 325 327 537 537
Caseload cost
Salaries $1,085,753 $754,450 $467,352 $481,372
Benefits $417,191 $299,315 $178,742 $175,701
Total caseload cost $1,502,944 $1,053,766 $646,094 $657,073
Non-caseload staff
Supervisory staffing 1.9 1.6 1.0 1.0
Research and data analysis 1.8 2.1 1.7 1.7
Annual reporting 0.7 0.7 0.7 0.7
Total non-caseload staffing 4.4 4.4 3.4 3.4
Total staffing 30.5 21.9 14.1 14.1
Non-caseload cost
Salaries $169,083 $126,567 $209,262 $215,539
Benefits $50,026 $43,275 $65,477 $62,506
Communications $76,701 $19,352 $13,589 $13,589
Utilities $4,458 $2,438 $961 $961
Rental and leases $166,263 $134,350 $59,161 $59,161
Repairs and maintenance $20,507 $8,555 $7,212 $7,212
Printing and reproduction $35,963 $3,466 $922 $922
Facilities and services $4,135 $2,766 $2,489 $2,489
Other goods and client services $680,689 $427,844 $187,875 $187,875
Annual reporting $53,000 $53,000 $53,000 $53,000
Total non-caseload cost $1,260,824 $821,654 $599,947 $603,255
Total Training Benefits $2,763,768 $1,875,420 $1,246,041 $1,260,328
TB Program total administrative costs are projected in FY 2014 to be less than half of the total costs for FY 2011.

December 2013 Training Benefits Program Annual Report Employment Security Department Page 30
Summary of administrative costs The sum of state and local level administrative costs for FY 2012 was $1,875,420; administrative costs for FY 2013 were $1,246,041; and administrative costs projected for FY 2014 are $1,260,328. Figure 16 compares these total costs with the average number of Training Benefits applications processed.
Denied applications require labor-intensive staff review. This report reflects the average cost per application processed. For comparative purposes, Figure 16 shows the calculations back to 2011.
Once the recession took hold in the state, total staffing increased to accommodate the increased demand for the Training Benefits Program. As the number of applications decreased, beginning in FY 2012, staffing levels were also reduced. Since staffing levels were further reduced in FY 2013, without a further decrease in demand, the costs per application have decreased substantially from FY 2011 levels.
Figure 16. Administrative costs per Training Benefits Program application processed for FY 2011 through FY 2013 and projected costs for FY 2014 Washington state, FY 2011 through projected FY 2014 Source: Employment Security Department and Workforce Development Councils’ administrative data
Program cost measure FY 2011 FY 2012 FY 2013 Projected FY 2014
Total administrative costs $2,763,768 $1,875,420 $1,246,041 $1,260,328
Applications processed 5,440 3,961 4,282 4,282
Applications approved 3,439 2,548 2,802 2,802
Percentage approved 63% 64% 65% 65%
Cost per application processed $508 $473 $291 $294
Average cost per application processed has dropped from approximately $500 over FY 2011 and 2012 to about $300 in FY 2013 and projected for FY 2014.
Training Benefits Program funding obligations Through November 30, 2013, a total of $186,406,754 has been paid out of Training Benefits funds
over the history of the program. This represents about 55 percent of total funds made available for
the program. A total of $13,496,142 was paid out in FY 2013 and $5,596,224 through November 30,
2013, of FY 2014. The balance of future obligations is $20,739,869.22
22 Employment Security Department administrative data.

December 2013 Training Benefits Program Annual Report Employment Security Department Page 31
Appendices Appendix 1. Survey methodology and response rate
Approach In accordance with state law (RCW 50.22.157), the Employment Security Department surveys Training Benefits participants each year to collect information about the participants’ training programs and subsequent employment experiences. This survey collected information on the participants’ training status, specific training pursued, current employment status and wages and the perceived impact of training. The full questionnaire is included in Appendix 2.
Survey design
The total population of Training Benefits participants was surveyed who were approved for the program in calendar years (CY) 2009 through 2011. This sampling design allowed for a minimum of two years of follow-up on earnings and employment for those Training Benefits participants who were approved for their TB Program plan.
The survey was conducted in June and July of 2013 using a bi-modal approach via telephone and the Internet.
Telephone and/or email follow-up was attempted to answer any questions that a respondent failed to complete. This reduced statistical bias in the study results.
Response rate
Employment Security surveyed 8,945 claimants approved for the Training Benefits Program who were approved from January 1, 2008, through December 31, 2011. We received 3,447 survey responses. Of these responses, 3,426 were usable, valid responses, for a response rate of 38.3 percent.
Figure A-1. Survey results Washington state, 2013 Source: Employment Security Department, LMPA, summer 2013 Training Benefits survey
Survey results Count
Training Benefits Program population (calendar years 2009, 2010 and 2011) 8,945
Valid responses 3,426
Response rate in percent 38.3%

December 2013 Training Benefits Program Annual Report Employment Security Department Page 32
Appendix 2. Survey questionnaire
TRAINING BENEFITS PROGRAM SURVEY
WEB-BASED QUESTIONNAIRE23
2013
Name of participant: __________________________
IDNUM _______________
Introduction to the individual We are interested in your experience with Unemployment-Insurance Training Benefits Program, which pays extended unemployment benefits to eligible participants while they attend approved training to learn new jobs.
1. Our records show that you were approved for training with the Training Benefits Program in connection with your unemployment-insurance application.
Have you started your training?
Yes Go to Q. 2
No Go to Q. 4
2. What was (is) the name of the training program?
3. Was (is) a degree, certificate or license required for the job you are training for?
a. Yes
b. No
c. Unknown
Go to Q.5
4. Why haven’t you started your training? (Check all that apply.)
a. You found a job that met your needs
b. You did not have enough money for tuition fees, supplies and/or books
c. You needed to find a job rather than start school
d. You returned to your former job
e. You had other family responsibilities
f. Other reasons; please specify: (In jail, military, etc.)
Go to End of Questions – Closing
23 The same questions and sequence were used for the telephone interviews.

December 2013 Training Benefits Program Annual Report Employment Security Department Page 33
5. Did you complete this training?
a. Yes
b. No Go to Q. 8
c. Still in training. Go to end of survey.
6. How did you pay for your tuition? (Check all that apply.)
a. Personal funds
b. Family support
c. Other governmental assistance, for example, GI Bill or Workforce Investment Act (WIA)
d. Financial assistance through the school or college
e. Training Benefits weekly funds
f. Combination of funds. Please specify: ___________________
7. When did you complete this training? Month/Day/Year Go to Q. 10
8. When did you stop taking this training? Month/Day/Year
9. What are the reasons why you have not completed the training? (Check all that apply) a. You found a job that met your needs
b. You needed to find a job rather than continue school
c. You returned to your former job
d. You did not have enough money for tuition fees, supplies and/or books
e. Your unemployment insurance ended before you completed the program
f. Other reasons; please specify: (In jail, military, etc.) Go to end of Questions – Closing.

December 2013 Training Benefits Program Annual Report Employment Security Department Page 34
Current employment history
10. Are you working now?
a. Yes
b. No Go to end of Questions – Closing.
11. When did you start this job?
Month/Day/Year
12. Did the training help you get this job?
a. A major help
b. Helped somewhat
c. Very little help
d. No help at all
13. Are you employed in a field for which you were retrained?
a. Yes
b. No
14. After completing your training, did you go back and work for the same employer that you were
laid off from? a. Yes b. No
15. What is your current job title or occupation?
a. Job title or occupation:
b. What do you do in this job?
16. In a typical week, how many hours a week do you work on this job?
Hours per week: 17. What is your rate of pay before taxes and deductions?
$ . per hour or $ per .

December 2013 Training Benefits Program Annual Report Employment Security Department Page 35
End of questions – closing This completes the questions I have. Do you have any questions or comments concerning this questionnaire? Comments: Thank you very much for all your help and your time.
Comments and notes (of the interviewer – relevant for telephone interviews and item nonresponse
call-backs.)

December 2013 Training Benefits Program Annual Report Employment Security Department Page 36