Embed Size (px)
Citation preview

Trailnet Constituent Survey May 2015
Contents• Survey response• Demographics• Actions• Attitudes
Survey process• Open for 3 weeks• Shared through Trailnet’s newsletter,
Facebook, Twitter, and dedicated e-blasts• Survey and methodology was vetted by a
professional psychometrician

Survey response• Survey was sent to the entire population of our
constituents (NOT a sample)• 1161 responses but 349 only answered the first
question• 812 respondents answered multiple questions;
398 were members• 4% margin of error at a 95% confidence level
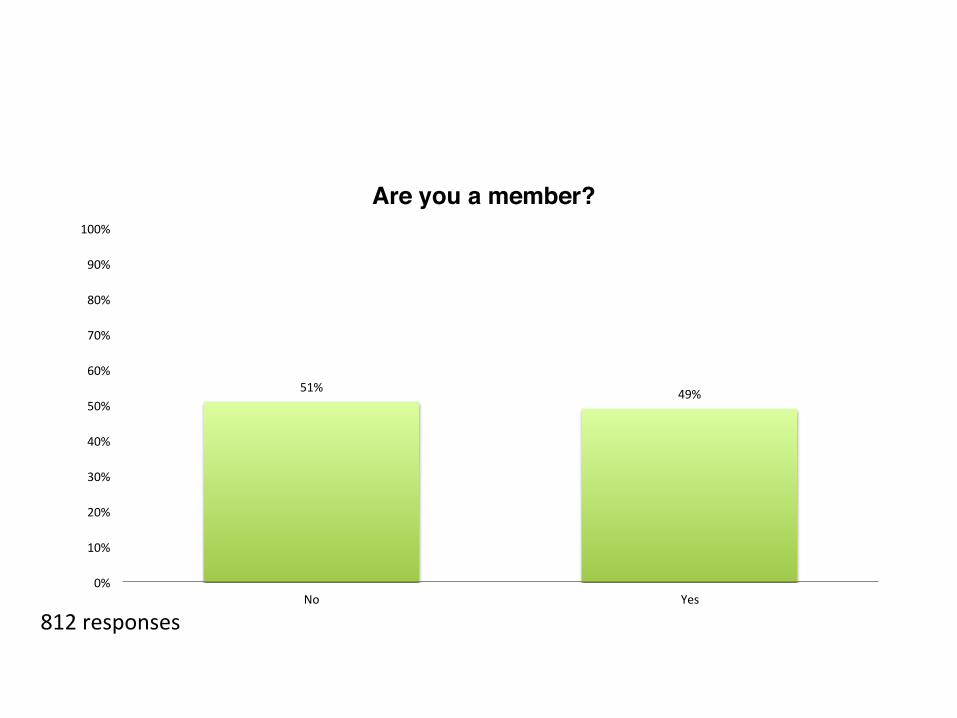
51% 49%
0%
10%
20%
30%
40%
50%
60%
70%
80%
90%
100%
No Yes
Are you a member?
812 responses

Race
93.4%
2.7%
1.6%
1.4%
0.8%
0.2%
0.0% 10.0% 20.0% 30.0% 40.0% 50.0% 60.0% 70.0% 80.0% 90.0% 100.0%
Caucasian/White/European American
African American
Asian/Pacific Islander
Hispanic/LaJno
MulJple
Other
638 responses
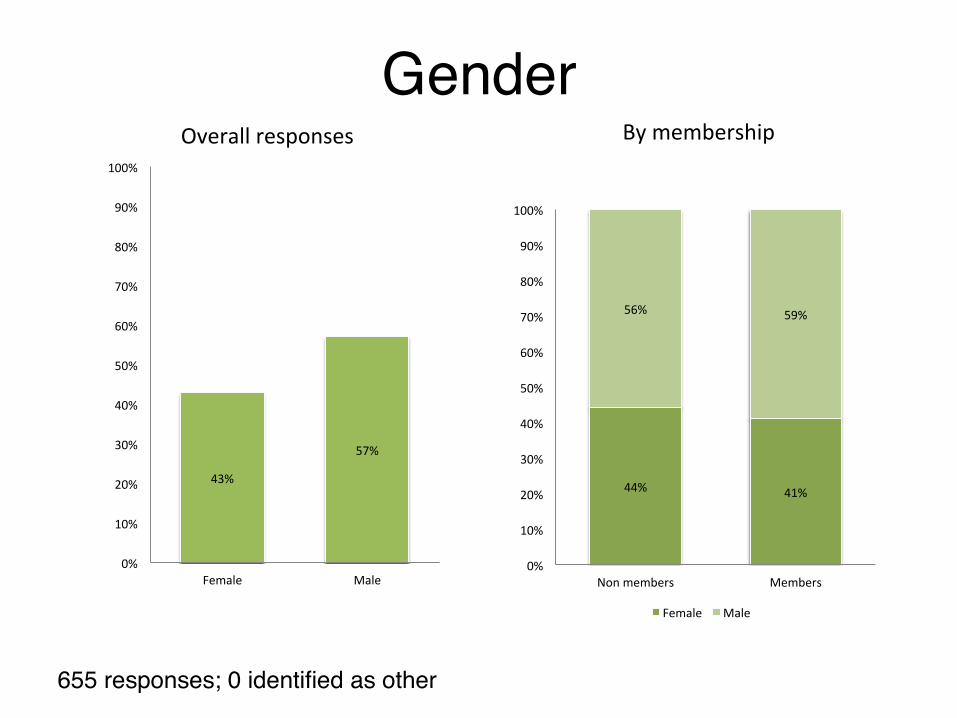
Gender
44% 41%
56% 59%
0%
10%
20%
30%
40%
50%
60%
70%
80%
90%
100%
Non members Members
Female Male
655 responses; 0 identified as other
Overall responses By membership
43%
57%
0%
10%
20%
30%
40%
50%
60%
70%
80%
90%
100%
Female Male

Age
653 responses
10%
17%
18%
29%
22%
5%
0% 10% 20% 30% 40% 50% 60% 70% 80% 90% 100%
21-‐30
31-‐40
41-‐50
51-‐60
61-‐70
71 or older
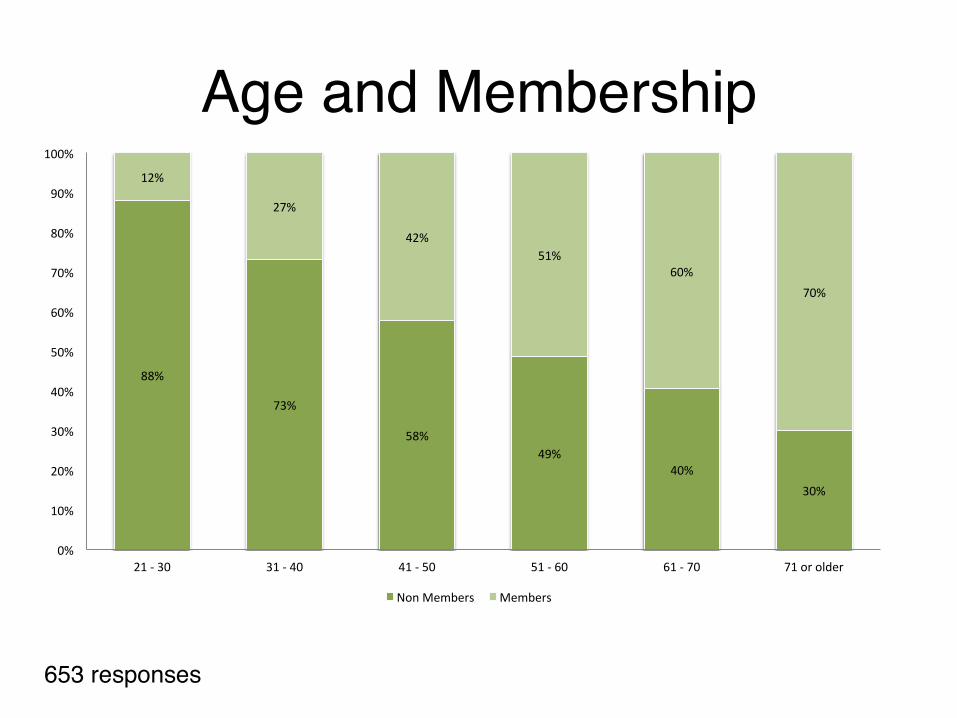
Age and Membership
653 responses
88%
73%
58% 49%
40% 30%
12%
27%
42% 51%
60% 70%
0%
10%
20%
30%
40%
50%
60%
70%
80%
90%
100%
21 -‐ 30 31 -‐ 40 41 -‐ 50 51 -‐ 60 61 -‐ 70 71 or older
Non Members Members
Marriage
640 responses
0%
2%
10%
24%
64%
1%
2%
11%
14%
72%
0% 10% 20% 30% 40% 50% 60% 70% 80% 90% 100%
Separated
Widowed
Divorced
Never married
Married
Members Non Members
0%
2%
10%
20%
67%
0% 10% 20% 30% 40% 50% 60% 70% 80% 90% 100%
Separated
Widowed
Divorced
Never married
Married
All respondents
By membership

Children
45%
32%
55%
68%
0%
10%
20%
30%
40%
50%
60%
70%
80%
90%
100%
Non Members Members
No Yes
648 responses
40%
60%
0%
10%
20%
30%
40%
50%
60%
70%
80%
90%
100%
No Yes
All responses By membership

What type of bicyclist are you?
663 responses
26%
55%
17%
2%
0% 10% 20% 30% 40% 50% 60% 70% 80% 90% 100%
Strong and Fearless
Enthused and Confident
Interested, but concerned
No way, no how

Bicyclist type by Gender
646 responses
17%
34%
54%
55%
26%
11%
3%
0%
0% 10% 20% 30% 40% 50% 60% 70% 80% 90% 100%
Female
Male
Strong and Fearless Enthused and Confident Interested, but concerned No way, no how

What type of transit user are you?
606 responses
15%
39%
35%
11%
0% 10% 20% 30% 40% 50% 60% 70% 80% 90% 100%
Strong and Fearless
Enthused and Confident
Interested, but concerned
No way, no how
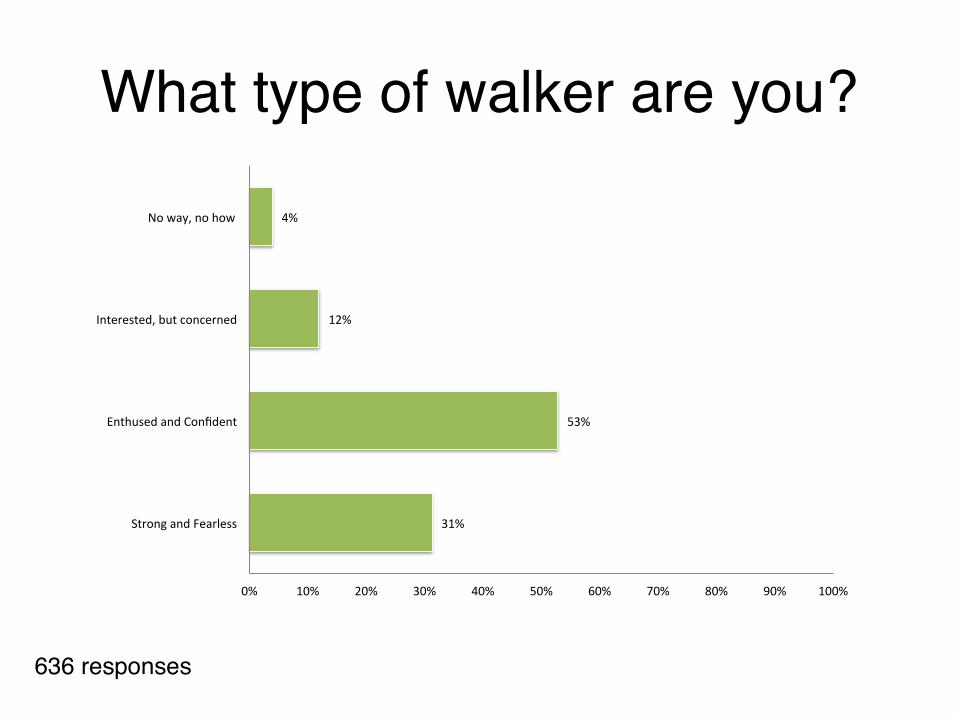
What type of walker are you?
636 responses
31%
53%
12%
4%
0% 10% 20% 30% 40% 50% 60% 70% 80% 90% 100%
Strong and Fearless
Enthused and Confident
Interested, but concerned
No way, no how
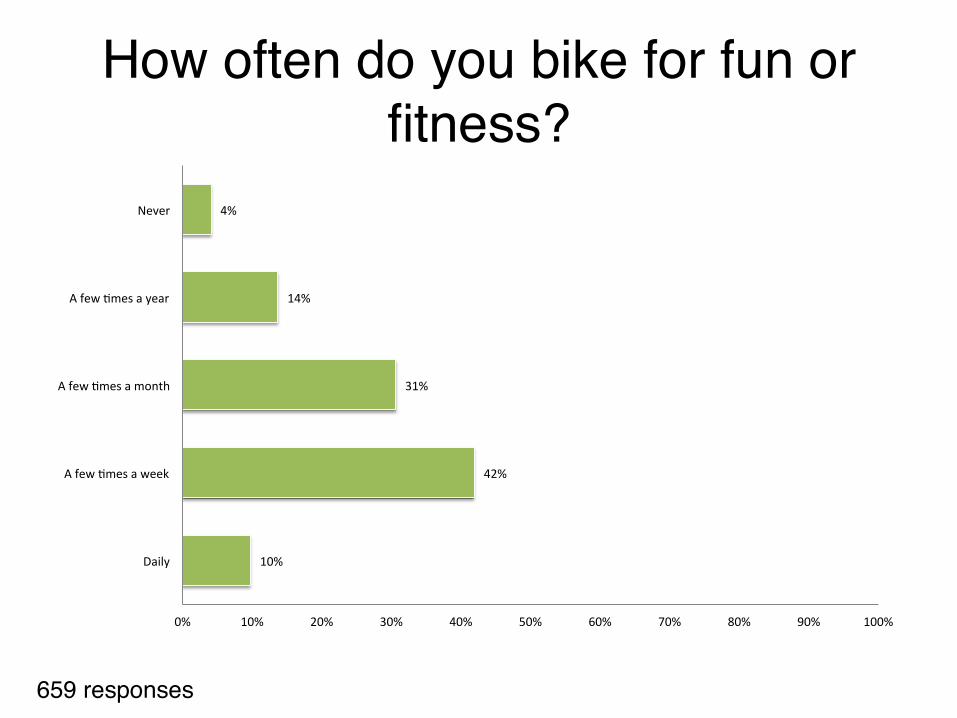
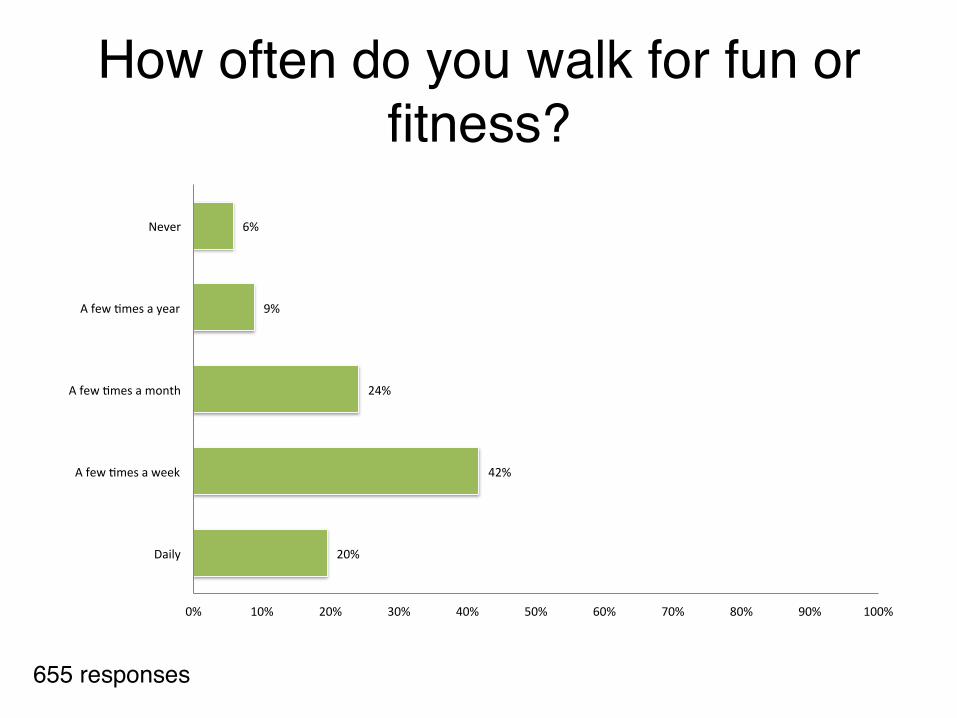
How often do you bike for fun or fitness?
659 responses
10%
42%
31%
14%
4%
0% 10% 20% 30% 40% 50% 60% 70% 80% 90% 100%
Daily
A few Jmes a week
A few Jmes a month
A few Jmes a year
Never
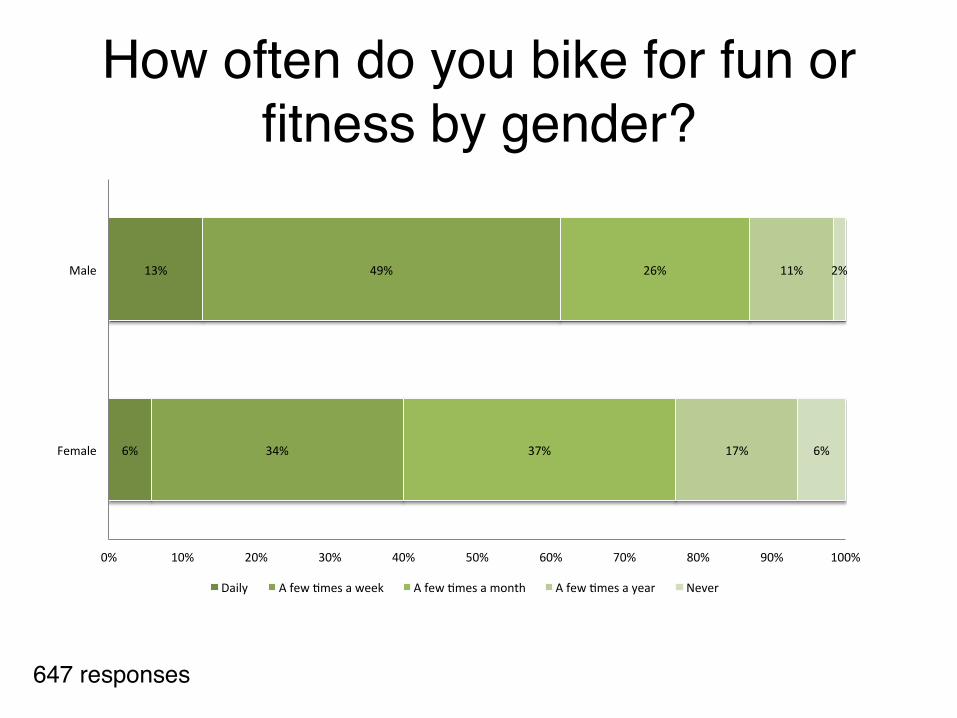
How often do you bike for fun or fitness by gender?
647 responses
6%
13%
34%
49%
37%
26%
17%
11%
6%
2%
0% 10% 20% 30% 40% 50% 60% 70% 80% 90% 100%
Female
Male
Daily A few Jmes a week A few Jmes a month A few Jmes a year Never

How often do you bicycle for transportation?
10%
23%
19%
26%
23%
0% 10% 20% 30% 40% 50% 60% 70% 80% 90% 100%
Daily
A few Jmes a week
A few Jmes a month
A few Jmes a year
Never
646 responses

How often do bicycle for transportation by gender?
635 responses
8%
12%
18%
27%
20%
19%
27%
25%
28%
18%
0% 10% 20% 30% 40% 50% 60% 70% 80% 90% 100%
Female
Male
Daily A few Jmes a week A few Jmes a month A few Jmes a year Never
How often do you walk for fun or fitness?
655 responses
20%
42%
24%
9%
6%
0% 10% 20% 30% 40% 50% 60% 70% 80% 90% 100%
Daily
A few Jmes a week
A few Jmes a month
A few Jmes a year
Never
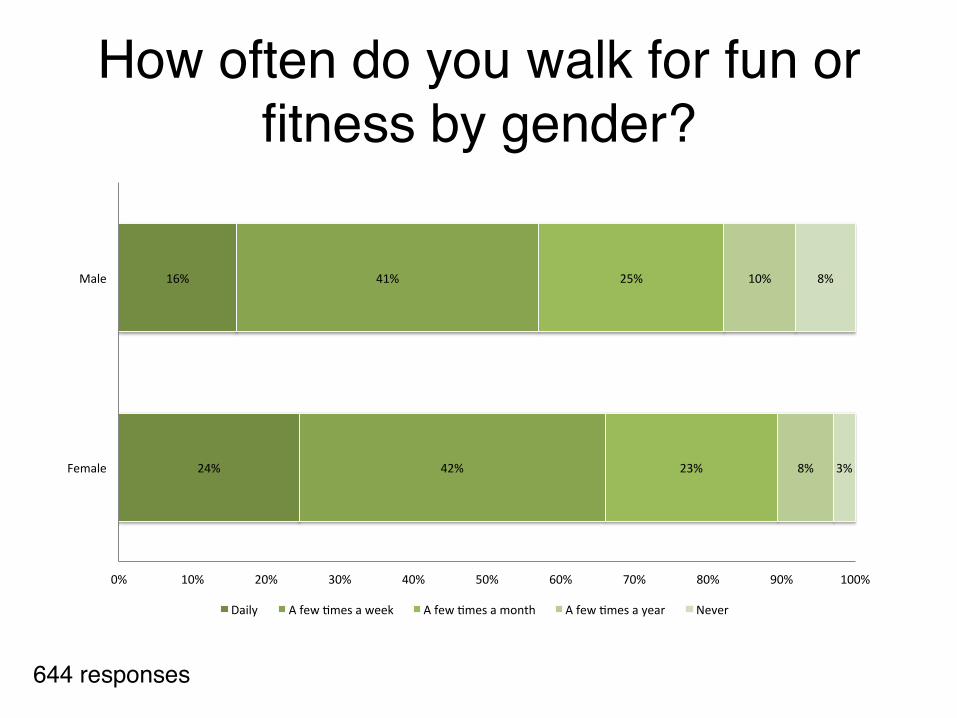
How often do you walk for fun or fitness by gender?
644 responses
24%
16%
42%
41%
23%
25%
8%
10%
3%
8%
0% 10% 20% 30% 40% 50% 60% 70% 80% 90% 100%
Female
Male
Daily A few Jmes a week A few Jmes a month A few Jmes a year Never

How often do you walk for transportation?
652 responses
10%
18%
28%
25%
18%
0% 10% 20% 30% 40% 50% 60% 70% 80% 90% 100%
Daily
A few Jmes a week
A few Jmes a month
A few Jmes a year
Never
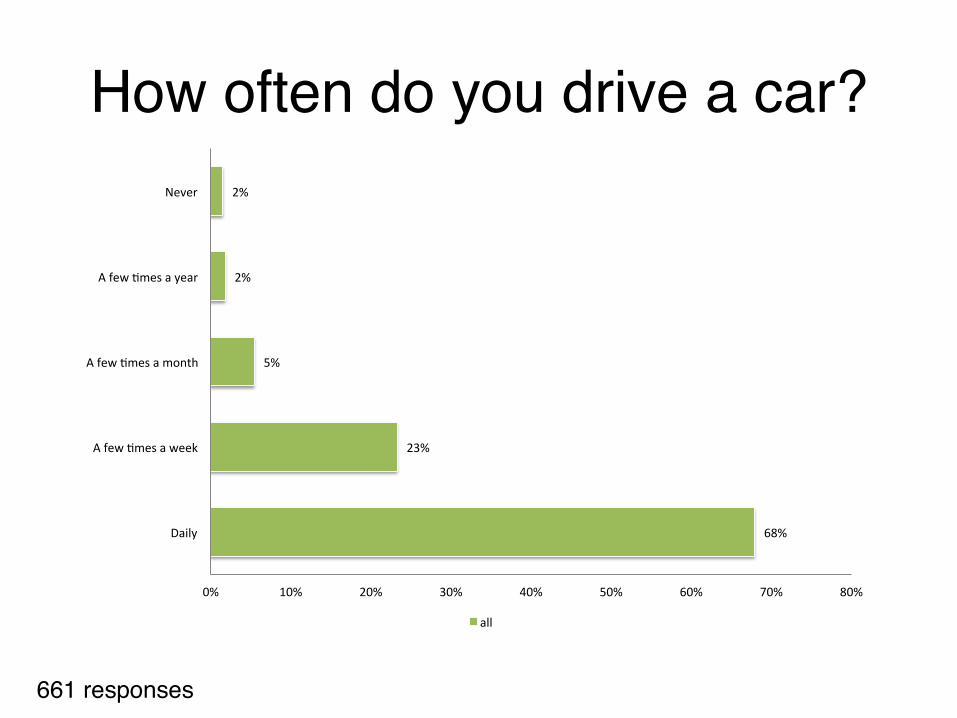
How often do you drive a car?
661 responses
68%
23%
5%
2%
2%
0% 10% 20% 30% 40% 50% 60% 70% 80%
Daily
A few Jmes a week
A few Jmes a month
A few Jmes a year
Never
all

How often do you ride transit?
654 responses
4%
5%
15%
52%
24%
0% 10% 20% 30% 40% 50% 60% 70% 80% 90% 100%
Daily
A few Jmes a week
A few Jmes a month
A few Jmes a year
Never

In 10 years, would you like to bike for fun or fitness…
79%
20%
1%
0% 10% 20% 30% 40% 50% 60% 70% 80% 90% 100%
More
Neither more nor less
Less
all
659 responses
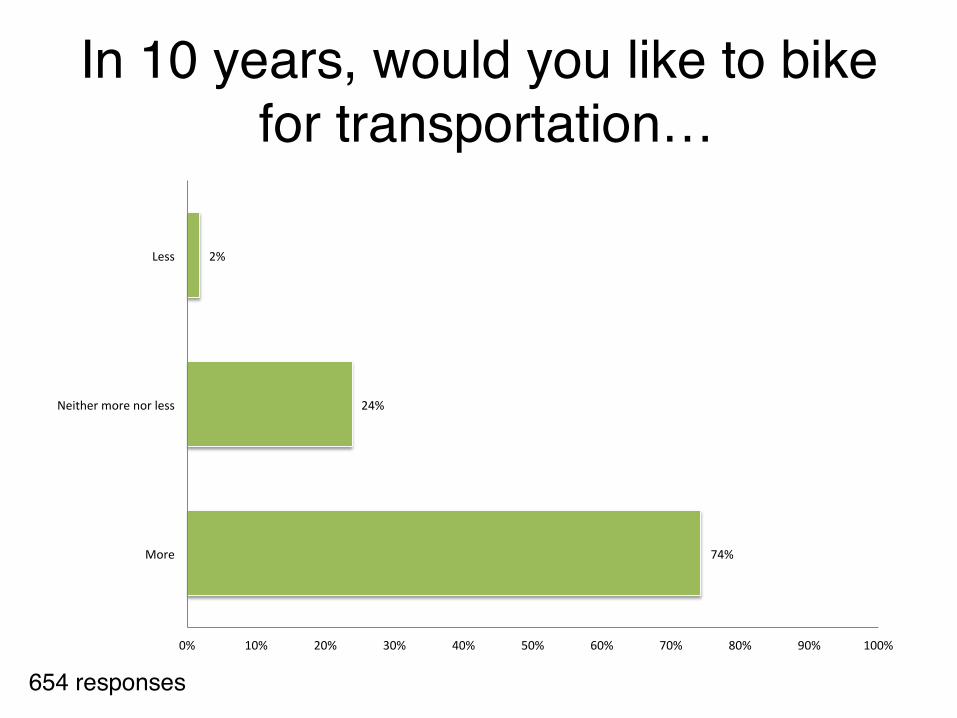
In 10 years, would you like to bike for transportation…
654 responses
74%
24%
2%
0% 10% 20% 30% 40% 50% 60% 70% 80% 90% 100%
More
Neither more nor less
Less
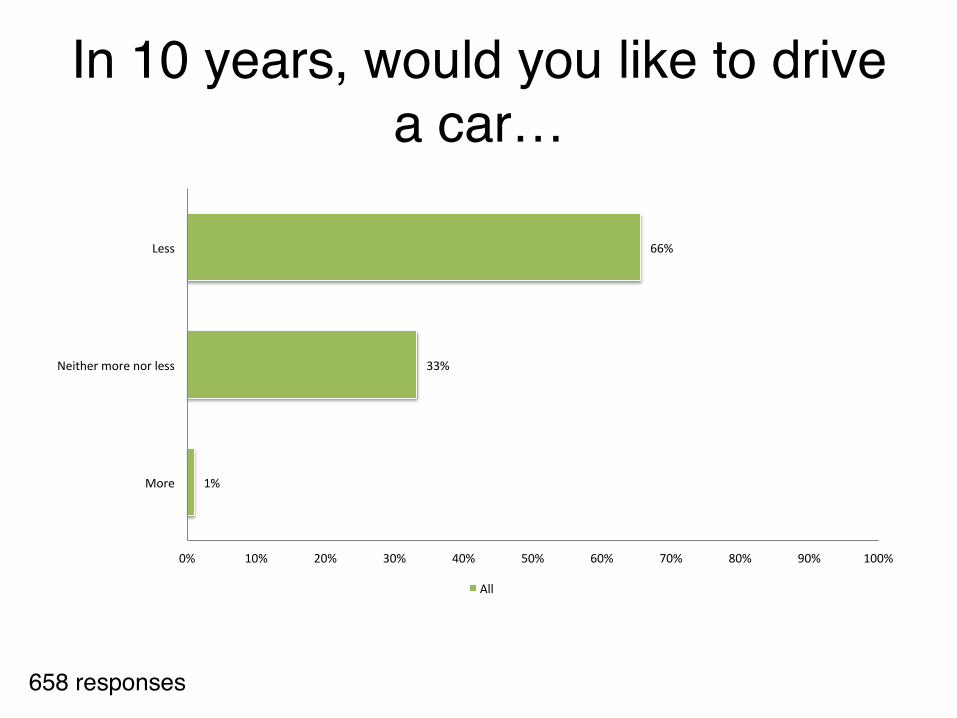
In 10 years, would you like to drive a car…
658 responses
1%
33%
66%
0% 10% 20% 30% 40% 50% 60% 70% 80% 90% 100%
More
Neither more nor less
Less
All

In 10 years, would you like to take transit…
650 responses
47%
47%
6%
0% 10% 20% 30% 40% 50% 60% 70% 80% 90% 100%
More
Neither more nor less
Less
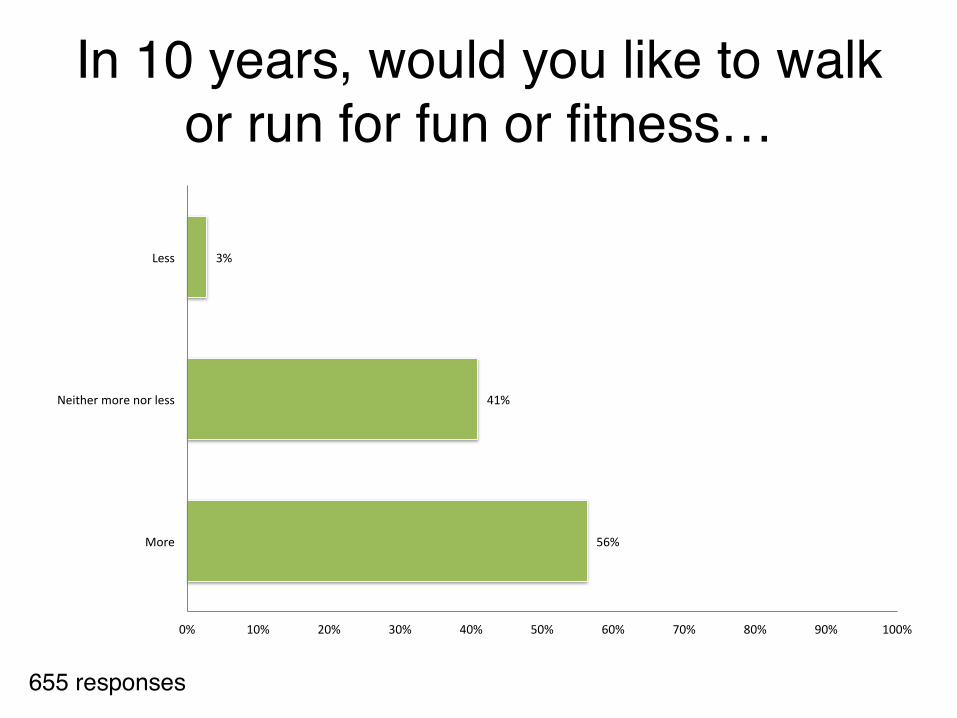
In 10 years, would you like to walk or run for fun or fitness…
655 responses
56%
41%
3%
0% 10% 20% 30% 40% 50% 60% 70% 80% 90% 100%
More
Neither more nor less
Less

In 10 years, would you like to walk for transportation…
649 responses
55%
42%
3%
0% 10% 20% 30% 40% 50% 60%
More
Neither more nor less
Less
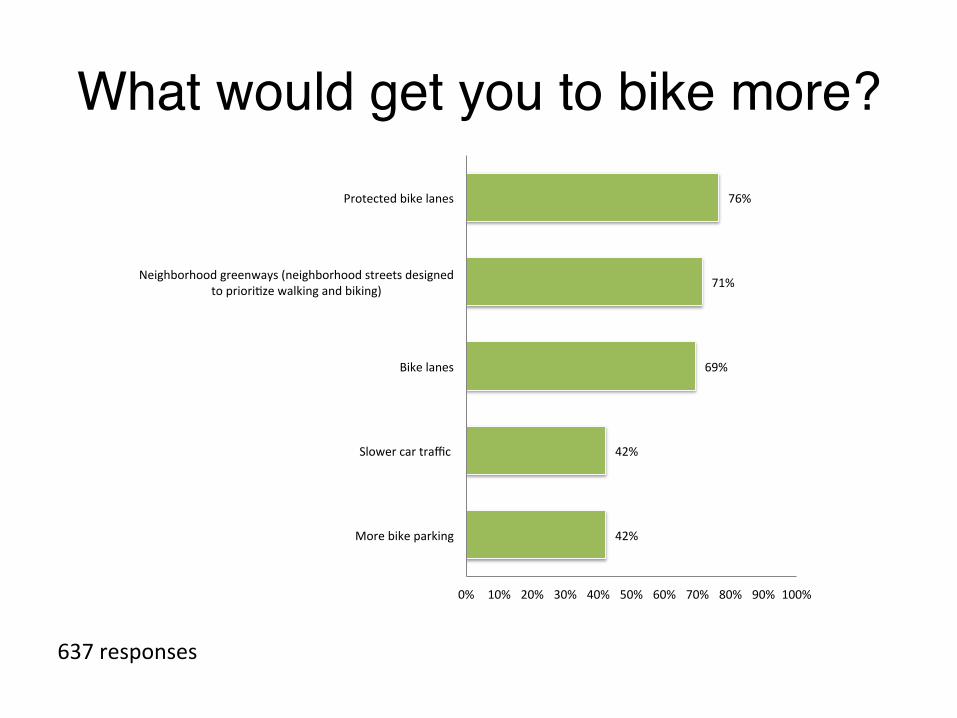
What would get you to bike more?
42%
42%
69%
71%
76%
0% 10% 20% 30% 40% 50% 60% 70% 80% 90% 100%
More bike parking
Slower car traffic
Bike lanes
Neighborhood greenways (neighborhood streets designed to prioriJze walking and biking)
Protected bike lanes
637 responses
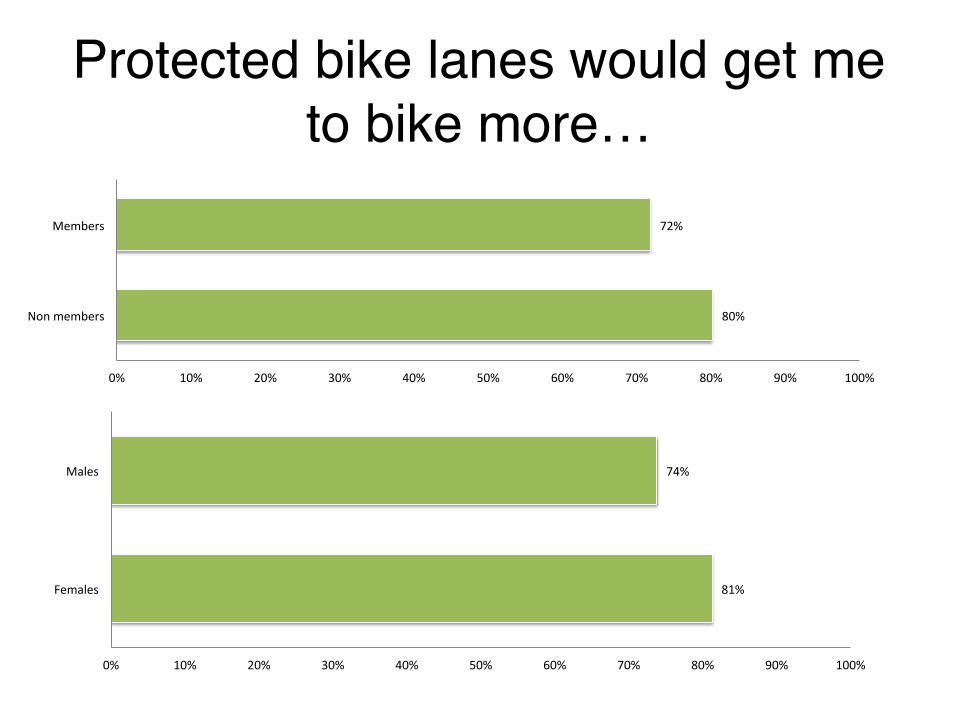
Protected bike lanes would get me to bike more…
80%
72%
0% 10% 20% 30% 40% 50% 60% 70% 80% 90% 100%
Non members
Members
81%
74%
0% 10% 20% 30% 40% 50% 60% 70% 80% 90% 100%
Females
Males
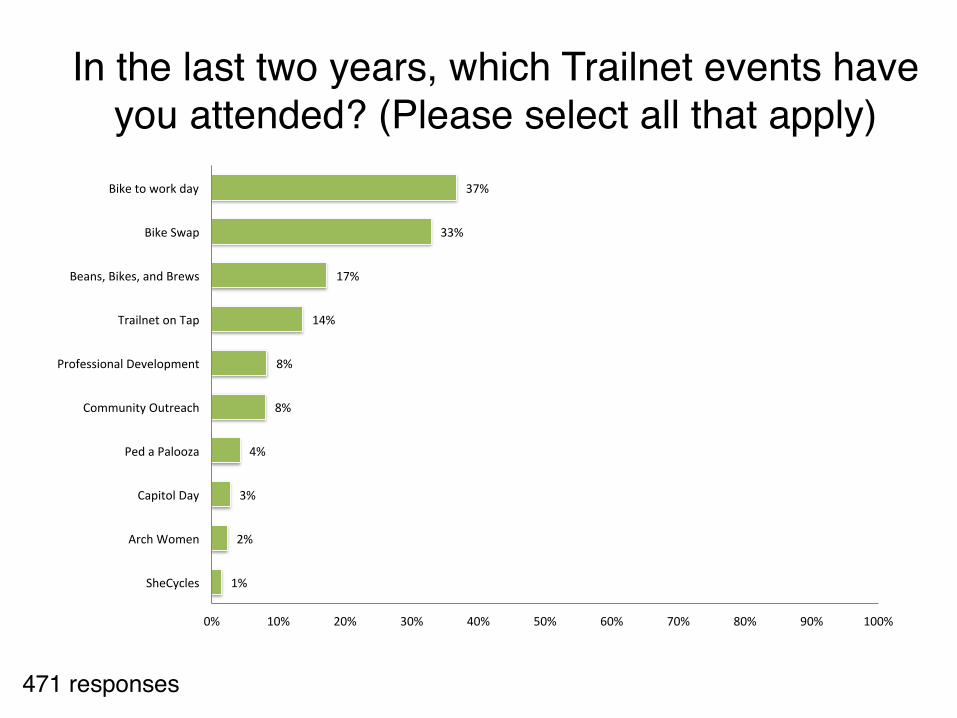
In the last two years, which Trailnet events have you attended? (Please select all that apply)
1%
2%
3%
4%
8%
8%
14%
17%
33%
37%
0% 10% 20% 30% 40% 50% 60% 70% 80% 90% 100%
SheCycles
Arch Women
Capitol Day
Ped a Palooza
Community Outreach
Professional Development
Trailnet on Tap
Beans, Bikes, and Brews
Bike Swap
Bike to work day
471 responses

What rides have you attended in the last 2 years?
60%
19%
16%
0% 10% 20% 30% 40% 50% 60% 70% 80% 90% 100%
BFC Rides
Cultural tours
Weekly shop rides
471 responses
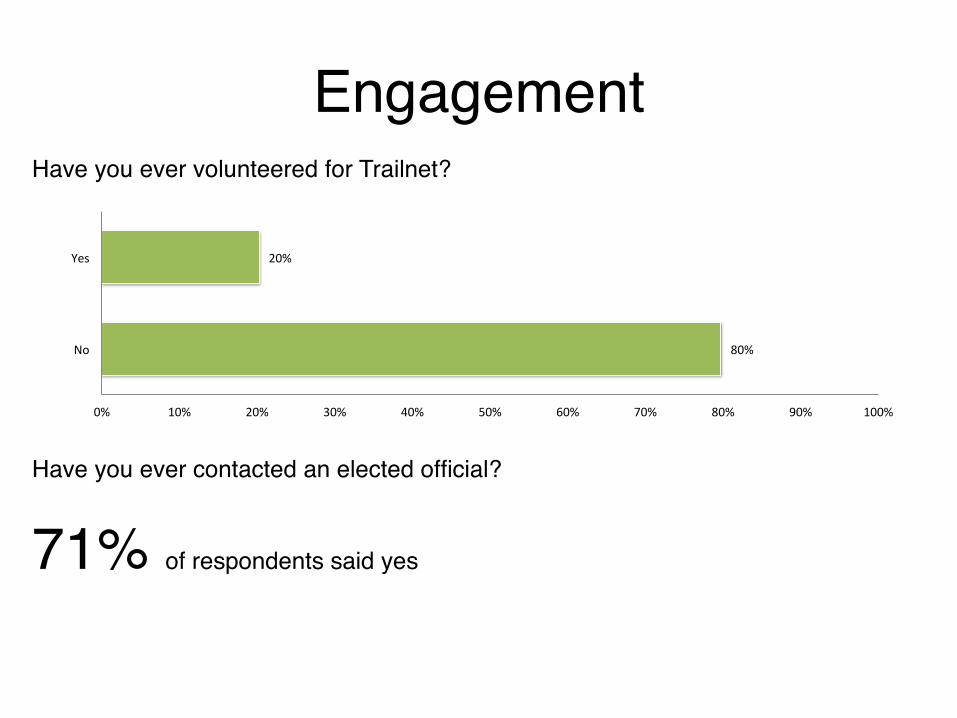
EngagementHave you ever volunteered for Trailnet?
Have you ever contacted an elected official?
71% of respondents said yes
80%
20%
0% 10% 20% 30% 40% 50% 60% 70% 80% 90% 100%
No
Yes
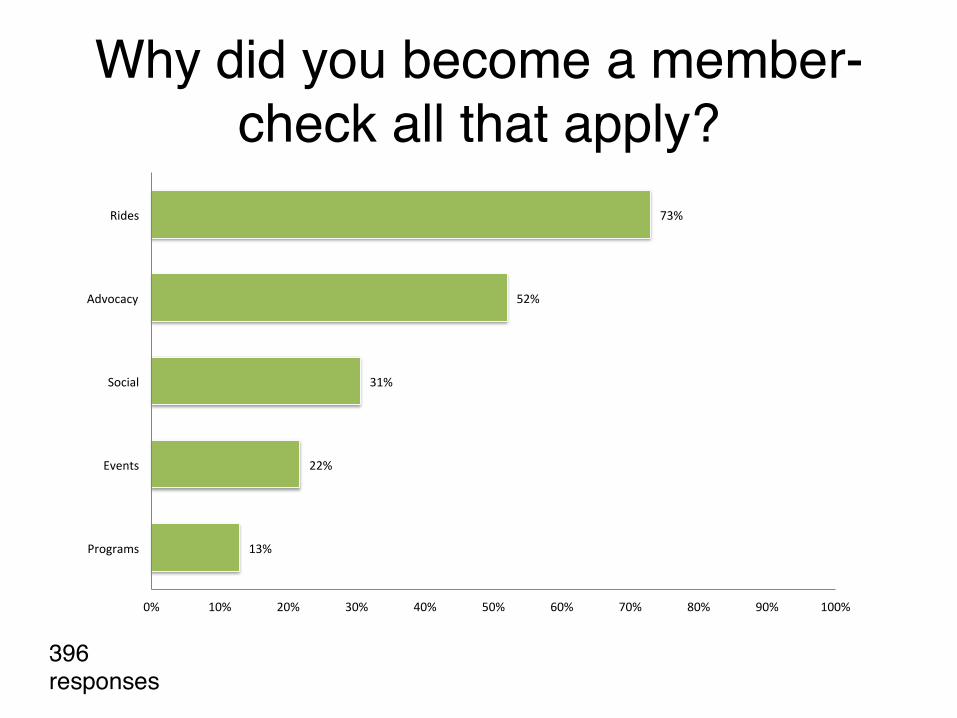
Why did you become a member- check all that apply?
13%
22%
31%
52%
73%
0% 10% 20% 30% 40% 50% 60% 70% 80% 90% 100%
Programs
Events
Social
Advocacy
Rides
396 responses
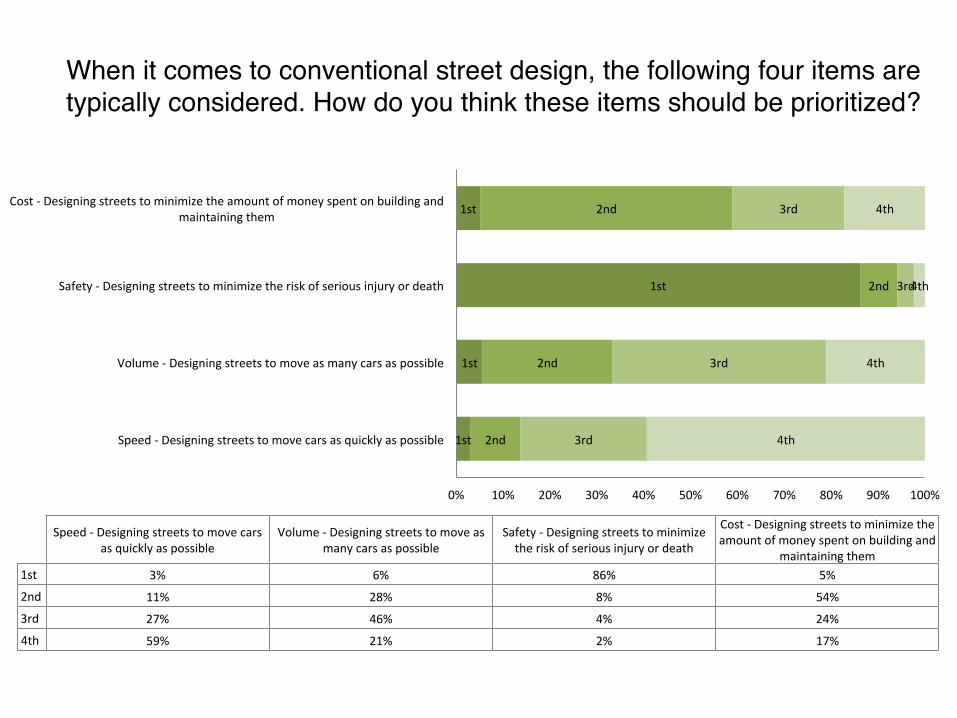
When it comes to conventional street design, the following four items are typically considered. How do you think these items should be prioritized?
1st
1st
1st
1st
2nd
2nd
2nd
2nd
3rd
3rd
3rd
3rd
4th
4th
4th
4th
0% 10% 20% 30% 40% 50% 60% 70% 80% 90% 100%
Speed -‐ Designing streets to move cars as quickly as possible
Volume -‐ Designing streets to move as many cars as possible
Safety -‐ Designing streets to minimize the risk of serious injury or death
Cost -‐ Designing streets to minimize the amount of money spent on building and maintaining them
Speed -‐ Designing streets to move cars as quickly as possible
Volume -‐ Designing streets to move as many cars as possible
Safety -‐ Designing streets to minimize the risk of serious injury or death
Cost -‐ Designing streets to minimize the amount of money spent on building and
maintaining them 1st 3% 6% 86% 5%
2nd 11% 28% 8% 54%
3rd 27% 46% 4% 24%
4th 59% 21% 2% 17%
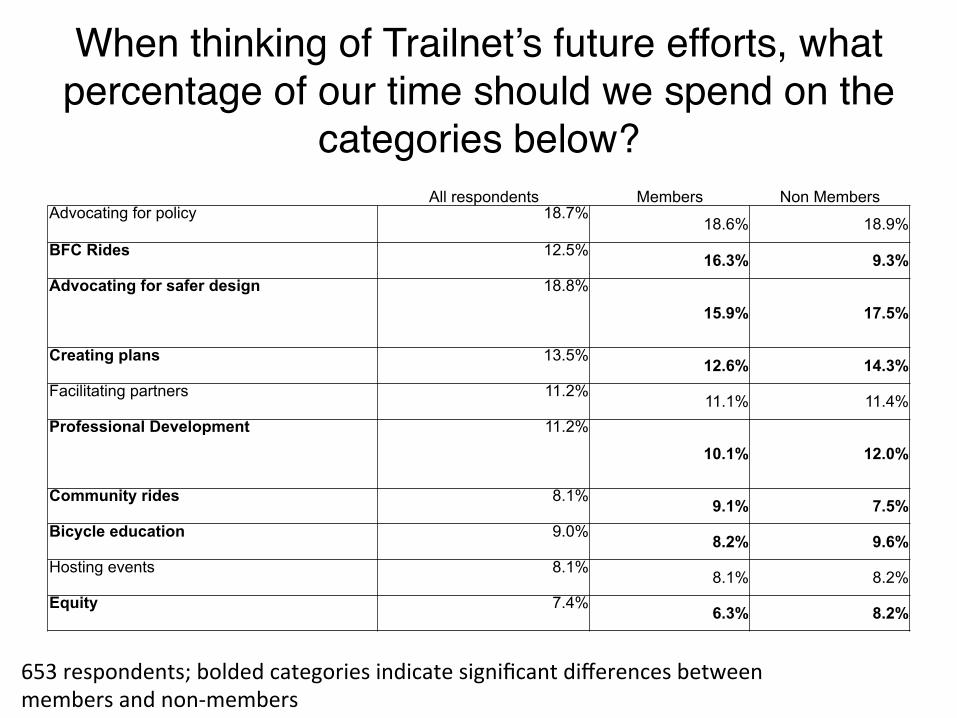
When thinking of Trailnet’s future efforts, what percentage of our time should we spend on the
categories below?All respondents Members Non Members
Advocating for policy 18.7% 18.6% 18.9%
BFC Rides 12.5% 16.3% 9.3% Advocating for safer design 18.8%
15.9% 17.5%
Creating plans 13.5% 12.6% 14.3% Facilitating partners 11.2% 11.1% 11.4% Professional Development 11.2%
10.1% 12.0%
Community rides 8.1% 9.1% 7.5% Bicycle education 9.0% 8.2% 9.6% Hosting events 8.1% 8.1% 8.2% Equity 7.4% 6.3% 8.2%
653 respondents; bolded categories indicate significant differences between members and non-‐members

What we’ll do nextIn the next six months we will take the following acJons to improve our work based on consJtuent feedback: 1. Increase diversity We want our consJtuency to reflect the diversity of the St. Louis region. As we plan our 2016 calendar, we will expand our partnerships to include even more groups that represent people of color, the LGBTQ community, women, and younger residents. 2. Increase the effec3veness of our advocacy We have already taken great strides to improve our advocacy in 2015 by increasing advocacy staffing and establishing a board commiiee. We will take further acJon by enhancing our communicaJons through a featured secJon within our newsleier and establishing a consJtuent commiiee to shape our advocacy agenda. 3. Enhance the Quality of Bicycle Fun Rides To enhance the rider experience, we will create a focus group and survey for BFC riders to give input into our 2016 calendar of rides.