Embed Size (px)
Citation preview

NHTSA’s National Center for Statistics and Analysis 1200 New Jersey Avenue SE., Washington, DC 20590
TRAFFIC SAFETY FACTS2010 Data
DOT HS 811 683 October 2012
Passenger VehiclesA passenger vehicle is a motor vehicle weighing less than 10,000 pounds and includes passenger cars and light trucks (pickup trucks, vans, SUVs, and other light trucks). Passenger vehicles make up over 90 percent of registered vehicles, and account for nearly 90 percent of total vehicle miles traveled (VMT). In 2010 there were an estimated 9,442,000 vehicles involved in police-reported crashes, 97 percent (9,125,000) of which were passenger vehicles. There were 44,712 vehicles involved in fatal crashes, of which 79 percent (35,146) were passenger vehicles. More than 22,000 passenger vehicle occupants lost their lives in traffic crashes in 2010, and an estimated 1.99 million were injured.
From 2001 to 2010, passenger vehicle registrations increased 14 percent. Light trucks (LTVs) experienced a 30-percent increase in registrations, while passenger cars had an increase of about 5 percent (see Figure 1). Among the light-truck categories, pickup truck registrations increased 15 percent and van registrations decreased 3 percent; however, SUV registrations increased by 84 percent.
Figure 1Passenger Vehicle Registrations, 2001–2010
20092001
160,000,000
140,000,000
120,000,000
100,000,000
80,000,000
60,000,000
40,000,000
20,000,000
02002
Passenger Cars Light Trucks
2003 2004 2005 2006 2007 2008
Regi
stra
tions
Year
2010
Figure 2 shows that fatality rates per 100,000 registered vehicles have declined since 2001 for all passenger vehicle types; however, this decline has been most pronounced for passenger cars. (The data for Figure 2 are presented in Tables 1 and 2.) Similarly, the proportion of passenger vehicle occupant fatalities that were occupants of light trucks increased to 44 percent in 2010, from 37 percent in 2001,
Passenger vehicles make up over 90 percent of the fleet of registered vehicles, and account for nearly 90 percent of total VMT.

NHTSA’s National Center for Statistics and Analysis 1200 New Jersey Avenue SE., Washington, DC 20590
2
while the proportion of passenger car occupant fatalities declined from 63 percent to 56 percent during the same time span. In 2006, the number of overall light truck occupant fatalities (12,761) experienced a 2-percent decrease, the first decline since 1992. Since this decrease in 2006, light truck occupant fatalities decreased an additional 24 percent by 2010.
Figure 2Passenger Vehicle Occupant Fatality Rates per 100,000 Registered Vehicles, by Type of Vehicle, 2001–2010
0.00
5.00
10.00
15.00
20.00
20092001 2002
Passenger Cars Vans SUVsPickups
2003 2004 2005 2006 2007 2008
Fata
lity
Rate
per
100
,000
Regi
ster
ed V
ehic
les
Year
2010
Table 1 shows the number of occupant fatalities, registered vehicles, and fatality rate for total passenger vehicles, as well as separately for passenger cars and light trucks. Both types of passenger vehicles have seen reductions in the registration- based fatality rate. Note also that the number of registered light trucks has increased at a much greater rate than that of passenger cars. Light trucks are then separated by type and shown separately as SUVs, pickup trucks, and vans in Table 2. Again, each group has consistently seen a reduction in the registration-based fatality rate. Among the three types of light trucks, SUVs saw the steepest increase in the number of registered vehicles. Looking at each type of passenger vehicle, vans have the lowest registration-based fatality rate.
Passenger cars exhibited a greater decline in both injury and fatality rates in 2010 than did light trucks. As shown in Table 3, the proportion of injured passenger vehicle occupants who were occupants of light trucks increased to 37 percent in 2010, from 31 percent in 2001, while the proportion of injured passenger car occupants declined from 69 percent to 63 percent over these same years.
As shown in Table 3, rates for occupants injured per 100,000 registered vehicles have shown a steady decline since 2000 for all passenger vehicle types; however, injured passenger car occupants experienced the largest decline in rates, from 1,493 in 2001 to 926 in 2010.
Table 4 shows that the occupant injury rate in all of the light truck categories has steadily declined since 2001, with the largest decline being in pickup trucks.
The registration-based fatality and injury rates among passenger vehicle occupants have declined over the past decade.

NHTSA’s National Center for Statistics and Analysis 1200 New Jersey Avenue SE., Washington, DC 20590
3
Table 1Passenger Vehicle Occupant Fatalities, Registered Vehicles, and Fatality Rates*, by Vehicle Type, 2001–2010
Year
Passenger Cars Light Trucks** Total Passenger VehiclesOccupantFatalities
Registered Vehicles
Fatality Rate*
Occupant Fatalities
Registered Vehicles
Fatality Rate*
Occupant Fatalities
Registered Vehicles
Fatality Rate*
2001 20,320 129,044,240 15.75 11,723 78,675,630 14.90 32,043 207,719,870 15.432002 20,569 130,349,393 15.78 12,274 81,643,269 15.03 32,843 211,992,662 15.492003 19,725 131,665,783 14.98 12,546 85,063,823 14.75 32,271 216,729,606 14.892004 19,192 133,414,552 14.39 12,674 89,799,406 14.11 31,866 223,213,958 14.282005 18,512 135,324,121 13.68 13,037 94,787,880 13.75 31,549 230,112,001 13.712006 17,925 137,031,279 13.08 12,761 98,064,117 13.01 30,686 235,095,396 13.052007 16,614 137,929,951 12.05 12,458 100,817,496 12.36 29,072 238,747,447 12.182008 14,646 139,028,041 10.53 10,816 100,862,944 10.72 25,462 239,890,985 10.612009 13,135 137,203,972 9.57 10,312 102,008,600 10.11 23,447 239,212,572 9.802010 12,435 135,310,480 9.19 9,752 102,376,147 9.53 22,187 237,686,627 9.33
Source: Registered Vehicles—NCSA, R.L. Polk*Fatality Rate Per 100,000 Registered Vehicles**Includes other/unknown light truck vehicle types
Table 2Light Truck Occupant Fatalities, Registered Vehicles, and Fatality Rates*, by Vehicle Type, 2001–2010
Year
SUVs Pickup Trucks VansOccupantFatalities
Registered Vehicles
Fatality Rate*
Occupant Fatalities
Registered Vehicles
Fatality Rate*
Occupant Fatalities
Registered Vehicles
Fatality Rate*
2001 3,530 23,007,060 15.34 6,139 36,170,162 16.97 2,019 18,272,860 11.052002 4,031 25,530,657 15.79 6,100 36,598,265 16.67 2,109 18,422,812 11.452003 4,483 28,357,698 15.81 5,957 37,116,234 16.05 2,080 18,615,310 11.172004 4,760 31,416,857 15.15 5,838 38,362,205 15.22 2,046 18,982,049 10.782005 4,831 34,698,739 13.92 6,067 39,699,056 15.28 2,112 19,453,034 10.862006 4,928 37,170,302 13.26 5,993 40,478,837 14.81 1,815 19,539,179 9.292007 4,834 39,463,148 12.25 5,847 41,121,470 14.22 1,764 19,406,561 9.092008 4,214 40,529,579 10.40 5,097 40,782,963 12.50 1,492 18,784,452 7.942009 4,104 41,383,289 9.92 4,801 41,676,351 11.52 1,396 18,222,255 7.662010 3,930 42,378,757 9.27 4,473 41,596,353 10.75 1,342 17,732,967 7.57
Source: Registered Vehicles—NCSA, R.L. Polk*Fatality Rate Per 100,000 Registered Vehicles
Table 3Passenger Vehicle Occupants Injured, Registered Vehicles, and Injury Rates*, by Vehicle Type, 2001–2010
Year
Passenger Cars Light Trucks** Total Passenger VehiclesOccupants
InjuredRegistered Vehicles
Injury Rate*
Occupants Injured
Registered Vehicles
Injury Rate*
Occupants Injured
Registered Vehicles
Injury Rate*
2001 1,927,000 129,044,240 1,493 861,000 78,675,630 1,094 2,787,000 207,719,870 1,3422002 1,805,000 130,349,393 1,385 879,000 81,643,269 1,077 2,684,000 211,992,662 1,2662003 1,756,000 131,665,783 1,334 889,000 85,063,823 1,045 2,646,000 216,729,606 1,2212004 1,643,000 133,414,552 1,231 900,000 89,799,406 1,002 2,543,000 223,213,958 1,1392005 1,573,000 135,324,121 1,163 872,000 94,787,880 920 2,446,000 230,112,001 1,0632006 1,475,000 137,031,279 1,076 857,000 98,064,117 874 2,331,000 235,095,396 9922007 1,379,000 137,929,951 1,000 841,000 100,817,496 835 2,221,000 238,747,447 9302008 1,304,000 139,028,041 938 768,000 100,862,944 762 2,072,000 239,890,985 8642009 1,216,000 137,203,972 887 759,000 102,008,600 744 1,976,000 239,212,572 8262010 1,253,000 135,310,480 926 733,000 102,376,147 716 1,986,000 237,686,627 835
Source: Registered Vehicles—NCSA, R.L. Polk*Injury Rate Per 100,000 Registered Vehicles**Includes other/unknown light truck vehicle types

NHTSA’s National Center for Statistics and Analysis 1200 New Jersey Avenue SE., Washington, DC 20590
4
Table 4Light Truck Occupants Injured, Registered Vehicles, and Injury Rates*, by Vehicle Type, 2001–2010
Year
SUVs Pickup Trucks VansOccupants
InjuredRegistered Vehicles
Injury Rate*
Occupants Injured
Registered Vehicles
Injury Rate*
Occupants Injured
Registered Vehicles
Injury Rate*
2001 290,000 23,007,060 1,262 360,000 36,170,162 996 204,000 18,272,860 1,1172002 315,000 25,530,657 1,234 344,000 36,598,265 941 208,000 18,422,812 1,1282003 338,000 28,357,698 1,190 333,000 37,116,234 898 203,000 18,615,310 1,0902004 364,000 31,416,857 1,159 309,000 38,362,205 806 211,000 18,982,049 1,1102005 363,000 34,698,739 1,047 308,000 39,699,056 775 183,000 19,453,034 9422006 387,000 37,170,302 1,042 276,000 40,478,837 682 179,000 19,539,179 9192007 380,000 39,463,148 962 271,000 41,121,470 660 175,000 19,406,561 9042008 361,000 40,529,579 891 250,000 40,782,963 612 145,000 18,784,452 7702009 341,000 41,383,289 823 238,000 41,676,351 570 139,000 18,222,255 7662010 360,000 42,378,757 851 218,000 41,596,353 524 135,000 17,732,967 761
Source: Registered Vehicles—NCSA, R.L. Polk*Injury Rate Per 100,000 Registered Vehicles
Restraint UseAccording to the National Occupant Protection Use Survey (NOPUS), which provides the only probability-based observed data on seat belt use in the United States, seat belt use for passenger vehicles in 2011 was 84 percent; 85 percent for passenger cars, 87 percent for vans and SUVs, and 74 percent for pickup trucks.
In fatal crashes in 2010, 22,187 passenger vehicle occupants were killed. Rural areas accounted for 61 percent of these occupant fatalities. For these passenger vehicle occupant fatalities occurring in rural areas, 53 percent were unrestrained, compared to 48 percent in urban areas. Nearly two-thirds (65%) of rural pickup truck occupants killed were unrestrained—the highest percentage of any passenger vehicle occupants killed among both rural and urban areas.
Figure 3 below shows the gradual decline of the proportion of passenger vehicle occupants killed who were unrestrained, from 2001 to 2010. Passenger car occupant fatalities had the lowest percentage (44%) of unrestrained occupant fatalities in 2010, while pickup truck occupant fatalities, as in previous years, had the highest percent (65%) of unrestrained occupant deaths—see Table 5.
Figure 3Percent of Unrestrained Passenger Vehicle Occupant Fatalities, 2001–2010
0%10%20%30%40%50%60%70%80%90%
100%
2001 2002 2003 2004 2005 2006 2007 2008 2009 2010
Year
Seat belt use for occupants of passenger vehicles was 84 percent in 2011, according to NOPUS.

NHTSA’s National Center for Statistics and Analysis 1200 New Jersey Avenue SE., Washington, DC 20590
5
In fatal crashes in 2010, 78 percent of passenger vehicle occupants who were totally ejected from vehicles were killed. Ejection from the vehicle is one of the most injurious events that can happen to a person in a crash. In passenger cars, 19 percent of fatally injured occupants were ejected (totally or partially) from the vehicle, while 37 percent of those killed in light trucks were ejected.
Seat belts are effective in preventing total ejections: in fatal crashes from 2003 through 2007, only 2 percent of the occupants reported to have been using restraints in fatal crashes were ejected, while over 35 percent of the unrestrained occupants were ejected (Factors Related to the Likelihood of a Passenger Vehicle Occupant Being Ejected in a Fatal Crash; DOT HS 811 209). Lap/shoulder seat belts, when used, reduce the risk of fatal injury to front-seat passenger car occupants by 45 percent and the risk of moderate-to-critical injury by 50 percent. For light-truck occupants, seat belts reduce the risk of fatal injury by 60 percent and moderate-to-critical injury by 65 percent. In 2010 alone, seat belts saved an estimated 12,546 lives.
Table 5Percent of Passenger Vehicle Occupant Fatalities Who Were Unrestrained*, by Vehicle Type, 2001–2010
Year
Passenger Vehicle Type
Total Passenger Vehicles**
Passenger Cars
Light TrucksSUVs Pickups Vans Total**
2001 53 67 75 61 70 592002 53 66 74 56 69 592003 50 65 71 57 67 562004 49 62 69 55 64 552005 49 63 69 54 64 552006 49 63 69 51 64 552007 47 62 68 52 63 542008 48 62 68 52 63 552009 46 60 67 48 62 532010 44 59 65 49 60 51
*Based on known restraint use**Includes other/unknown light truck vehicle types
RolloverThe rollover crash is one of the most deadly forms of crashes among passenger vehicles, accounting for more than one-third (35%) of all occupant fatalities in 2010. Among fatally injured passenger vehicle occupants in 2010, the proportion of fatalities in rollover crashes was highest for SUVs (57%), followed by pickup trucks (47%), vans (30%), and passenger cars (23%).
In fatal crashes in 2010, 78 percent of passenger vehicle occupants who were totally ejected were killed.

NHTSA’s National Center for Statistics and Analysis 1200 New Jersey Avenue SE., Washington, DC 20590
6
Figure 4Passenger Vehicle Occupants Killed in Rollover Crashes, by Vehicle Type, 2001–2010
0
1,000
2,000
3,000
4,000
5,000
6,000
20092001 2002
Passenger Cars Vans SUVsPickups
2003 2004 2005 2006 2007 2008Oc
cupa
nts
Kille
dYear
2010
As seen in Figure 4, each passenger vehicle category showed a decrease in the number of occupant fatalities occurring in rollover crashes in 2010. The number of pickup truck occupant fatalities declined by 21 percent over the past decade, while those in SUVs have increased by 5 percent. Fatalities in vans, already the lowest number, declined by 48 percent, and in passenger cars, declined by 36 percent over these years. The data used in Figure 4 are shown in Table 6 below.
Table 6Passenger Vehicle Occupant Fatalities in Rollovers, by Vehicle Type, 2001–2010
Year
Passenger Vehicle Type
Total Passenger Vehicles*
Passenger Cars
Light TrucksSUVs Pickups Vans Total*
2001 4,559 2,149 2,651 786 5,598 10,1572002 4,794 2,471 2,755 699 5,935 10,7292003 4,464 2,661 2,580 728 5,978 10,4422004 4,353 2,929 2,597 695 6,237 10,5902005 4,371 2,895 2,796 794 6,499 10,8702006 4,376 2,899 2,844 609 6,366 10,7422007 4,055 2,861 2,748 572 6,185 10,2402008 3,653 2,435 2,435 514 5,390 9,0432009 3,230 2,303 2,295 457 5,061 8,2912010 2,912 2,251 2,088 407 4,747 7,659
*Includes other/unknown light truck vehicle types
In 2010, among passenger vehicles involved in rural fatal crashes, SUVs experienced the highest rollover percentage (42%) compared to 33 percent for pickup trucks, and 22 percent for both vans and passenger cars. The rollover rates for passenger vehicles in urban areas were much lower: 22 percent for SUVs, 17 percent for pickup trucks, 10 percent for vans, and 9 percent for passenger cars.
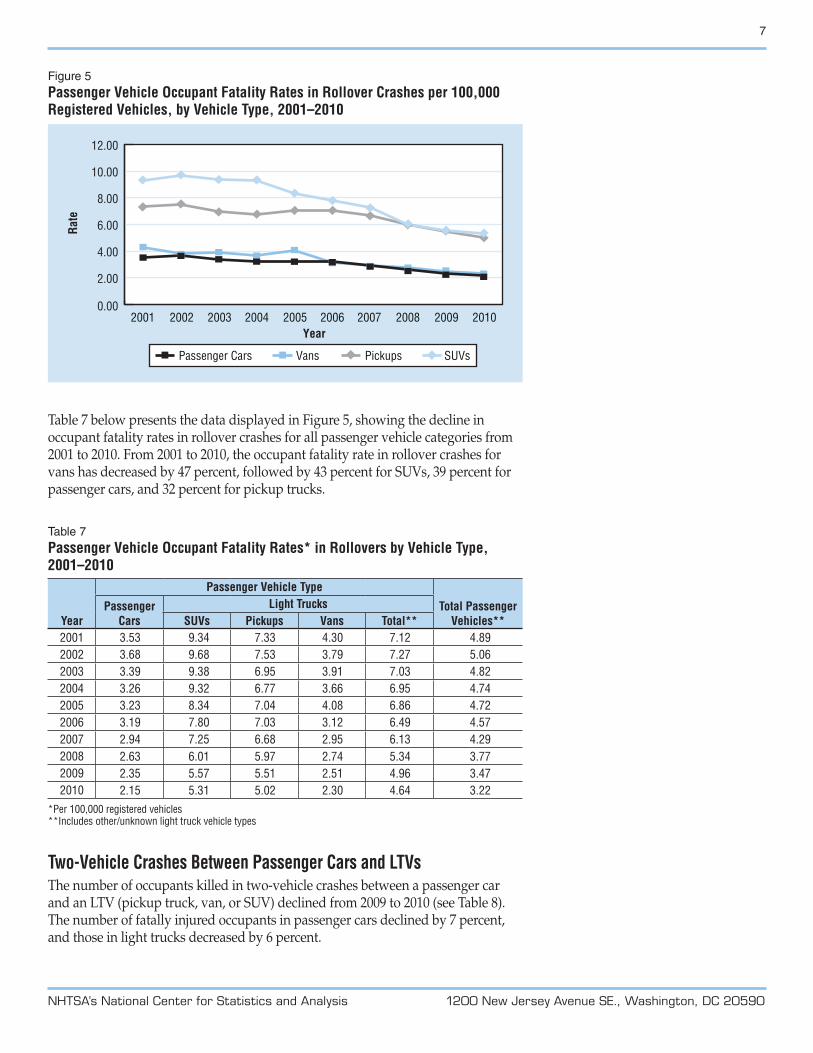
Figure 5 shows that in 2010, passenger vehicle occupant fatality rates per 100,000 registered vehicles in rollover crashes declined for all body types. The lowest occupant fatality rates in rollover crashes in 2010 were 2.15 for passenger cars, and 2.30 for vans, compared to the highest rates of 5.02 for pickups and 5.31 for SUVs.
Rollover rates for passenger vehicles involved in fatal crashes were much lower in urban areas than in rural areas.
NHTSA’s National Center for Statistics and Analysis 1200 New Jersey Avenue SE., Washington, DC 20590
7
Figure 5Passenger Vehicle Occupant Fatality Rates in Rollover Crashes per 100,000 Registered Vehicles, by Vehicle Type, 2001–2010
0.00
2.00
4.00
6.00
8.00
10.00
12.00
20092001 2002
Passenger Cars Vans SUVsPickups
2003 2004 2005 2006 2007 2008
Rate
Year2010
Table 7 below presents the data displayed in Figure 5, showing the decline in occupant fatality rates in rollover crashes for all passenger vehicle categories from 2001 to 2010. From 2001 to 2010, the occupant fatality rate in rollover crashes for vans has decreased by 47 percent, followed by 43 percent for SUVs, 39 percent for passenger cars, and 32 percent for pickup trucks.
Table 7Passenger Vehicle Occupant Fatality Rates* in Rollovers by Vehicle Type, 2001–2010
Year
Passenger Vehicle Type
Total Passenger Vehicles**
Passenger Cars
Light TrucksSUVs Pickups Vans Total**
2001 3.53 9.34 7.33 4.30 7.12 4.892002 3.68 9.68 7.53 3.79 7.27 5.062003 3.39 9.38 6.95 3.91 7.03 4.822004 3.26 9.32 6.77 3.66 6.95 4.742005 3.23 8.34 7.04 4.08 6.86 4.722006 3.19 7.80 7.03 3.12 6.49 4.572007 2.94 7.25 6.68 2.95 6.13 4.292008 2.63 6.01 5.97 2.74 5.34 3.772009 2.35 5.57 5.51 2.51 4.96 3.472010 2.15 5.31 5.02 2.30 4.64 3.22
*Per 100,000 registered vehicles**Includes other/unknown light truck vehicle types
Two-Vehicle Crashes Between Passenger Cars and LTVsThe number of occupants killed in two-vehicle crashes between a passenger car and an LTV (pickup truck, van, or SUV) declined from 2009 to 2010 (see Table 8). The number of fatally injured occupants in passenger cars declined by 7 percent, and those in light trucks decreased by 6 percent.

NHTSA’s National Center for Statistics and Analysis 1200 New Jersey Avenue SE., Washington, DC 20590
8
Table 8Occupants Killed in Two-Vehicle Crashes Involving a Passenger Car and an LTV, 2009 and 2010
Year% Change2009 2010
Killed in Passenger Car 2,940 2,740 -6.8%Killed in LTV 793 749 -5.6%LTV = Pickup Truck, Van, or SUV
Figure 6 graphically shows the number of occupant fatalities in each vehicle type in two-vehicle crashes involving a car and a light truck, for the years 2001 through 2010. In these crashes there were about four times as many passenger car occupant fatalities as light-truck occupant fatalities.
Figure 6Occupants Killed in Two-Vehicle Crashes Involving a Passenger Car and an LTV, 2001–2010
0
1,000
2,000
3,000
4,000
5,000
2001 2002 2003 2004 2005 2006 2007 2008 2009 2010
Passenger Car LTV
Year
In head-on collisions, nearly four times as many passenger car occupants as light-truck occupants were killed (see Table 9). The number of occupant fatalities decreased for passenger cars and light trucks from 2009 to 2010. In addition, when the front of the passenger car struck the side of the LTV, occupant fatalities declined for both passenger cars and LTVs in the crash. When the front of the LTV struck the side of the passenger car, occupant fatalities decreased for both passenger cars and light trucks in the crash. The largest number of occupant fatalities in these crashes was those in passenger cars struck in the side by the front of an LTV. When LTVs were struck in the side by a passenger car, 1.4 times as many LTV occupants were killed as passenger car occupants. When passenger cars were struck in the side by LTVs, 15 times as many passenger car occupants were killed as LTV occupants.
In head-on collisions between a passenger car and a light truck, nearly four times as many passenger car occupants as light-truck occupants were killed.

NHTSA’s National Center for Statistics and Analysis 1200 New Jersey Avenue SE., Washington, DC 20590
9
Table 9Occupants Killed in Two-Vehicle Crashes Involving a Passenger Car and an LTV, by Collision Type, 2009 and 2010
Year
% Change2009 2010Head-On Collisions
Killed in Passenger Car 1,178 1,092 -7.3%Killed in LTV 371 298 -19.7%
Passenger Car Front to LTV SideKilled in Passenger Car 135 127 -5.9%Killed in LTV 184 175 -4.9%
LTV Front to Passenger Car SideKilled in Passenger Car 1,317 1,233 -6.4%Killed in LTV 83 80 -3.6%LTV = Pickup Truck, Van, or SUV
Figures 7, 8, and 9 graphically show each of the above types of crashes from 2001 through 2010. When a passenger car and a light truck hit each other head-on, a fatality in the passenger car is 3.5 times more likely than one in the LTV. Note also that when one vehicle is struck in the side by the front of the other vehicle, the vehicle struck in the side is more likely to have an occupant fatality. This is far more likely when a light truck strikes the side of a passenger car, as shown in Figure 9.
Figure 7Occupants Killed in Two-Vehicle Head-On Collisions Involving a Passenger Car and an LTV, 2001–2010
0
500
1,000
1,500
2,000
2001 2002 2003 2004 2005 2006 2007 2008 2009 2010
Passenger Car LTV
Year
When a passenger car and a light truck are involved in a side-impact crash, the vehicle struck in the side is more likely to have an occupant fatality.

NHTSA’s National Center for Statistics and Analysis 1200 New Jersey Avenue SE., Washington, DC 20590
10
Figure 8Occupants Killed in Two-Vehicle Crashes Involving a Passenger Car and an LTV, When Passenger Car Front Hit LTV in the Side, 2001–2010
0
100
200
300
400
2001 2002 2003 2004 2005 2006 2007 2008 2009 2010
Passenger Car LTV
Year
Figure 9Occupants Killed in Two-Vehicle Crashes Involving a Passenger Car and an LTV, When the LTV Front Hit the Passenger Car in the Side, 2001–2010
0
500
1,000
1,500
2,000
2,500
2001 2002 2003 2004 2005 2006 2007 2008 2009 2010
Passenger Car LTV
Year
Alcohol A driver is considered to be alcohol-impaired when the driver’s blood alcohol concentration (BAC) is .08 grams per deciliter (g/dL) or higher. From 2001 to 2010, the percent of alcohol-impaired passenger vehicle drivers involved in fatal crashes remained virtually unchanged among each of the vehicle types. Pickup truck drivers continue to have the highest percentage of alcohol impairment compared to other passenger vehicle drivers (see Table 10). The percentage of alcohol-impaired van drivers involved in fatal crashes is substantially below that of other passenger vehicle drivers.
Pickup truck drivers have the highest percentage of alcohol-impairment compared to drivers of other passenger vehicles.

NHTSA’s National Center for Statistics and Analysis 1200 New Jersey Avenue SE., Washington, DC 20590
11
Table 10Percent of Alcohol-Impaired (BAC = .08+ g/dL) Passenger Vehicle Drivers in Fatal Crashes by Vehicle Type, 2001–2010
Year
Passenger Vehicle Type Total Passenger Vehicles*
Passenger Cars
Light TrucksSUVs Pickups Vans Total*
2001 23 22 26 13 23 232002 22 22 27 14 23 232003 22 21 25 13 22 222004 23 22 24 13 21 222005 24 21 25 14 22 232006 23 24 27 14 24 232007 23 23 27 14 23 232008 23 23 26 12 23 232009 23 23 27 12 23 232010 23 23 25 12 22 23
*Includes other/unknown light truck vehicle types
Table 11 presents the number of passenger vehicle occupant fatalities in 2010, by vehicle type, for each State and Puerto Rico.
For more information:Information on traffic fatalities is available from the National Center for Statistics and Analysis (NCSA), NVS-424, 1200 New Jersey Avenue SE., Washington, DC 20590. NCSA can be contacted at 800-934-8517 or via the following e-mail address: [email protected]. General information on highway traffic safety can be accessed by Internet users at www.nhtsa.gov/NCSA. To report a safety-related problem or to inquire about motor vehicle safety information, contact the Vehicle Safety Hotline at 888-327-4236.
Other fact sheets available from the National Center for Statistics and Analysis are Alcohol-Impaired Driving, Bicyclists and Other Cyclists, Children, Large Trucks, Motorcycles, Occupant Protection, Older Population, Overview, Pedestrians, Race and Ethnicity, Rural/Urban Comparisons, School Transportation-Related Crashes, Speeding, State Alcohol Estimates, State Traffic Data, and Young Drivers. Detailed data on motor vehicle traffic crashes are published annually in Traffic Safety Facts: A Compilation of Motor Vehicle Crash Data from the Fatality Analysis Reporting System and the General Estimates System. The fact sheets and annual Traffic Safety Facts report can be accessed online at www-nrd.nhtsa.dot.gov/CATS/index.aspx.

NHTSA’s National Center for Statistics and Analysis 1200 New Jersey Avenue SE., Washington, DC 20590
12
Table 11Passenger Vehicle Occupant Fatalities, by State and Vehicle Type, 2010
State
Passenger Vehicle Type TotalPassengerVehicles*Passenger Cars
Light Trucks
Pickups SUVs Vans Total*# % # % # % # % # % #
Alabama 376 55% 153 22% 125 18% 33 5% 313 45% 689Alaska 19 50% 8 21% 9 24% 2 5% 19 50% 38Arizona 184 44% 111 27% 100 24% 23 6% 234 56% 418Arkansas 209 51% 108 27% 71 17% 19 5% 198 49% 407California 930 59% 257 16% 301 19% 101 6% 659 41% 1,589Colorado 154 50% 61 20% 79 26% 12 4% 152 50% 306Connecticut 150 74% 13 6% 33 16% 6 3% 52 26% 202Delaware 41 61% 12 18% 11 16% 3 4% 26 39% 67Dist of Columbia 8 100% 0 0 0 0 0 0 0 0 8Florida 839 60% 222 16% 259 18% 83 6% 564 40% 1,403Georgia 467 53% 204 23% 165 19% 49 6% 418 47% 885Hawaii 32 58% 16 29% 6 11% 1 2% 23 42% 55Idaho 81 52% 42 27% 27 17% 6 4% 75 48% 156Illinois 397 64% 103 16% 91 15% 34 5% 228 36% 625Indiana 327 60% 100 18% 67 12% 53 10% 220 40% 547Iowa 160 57% 54 19% 34 12% 32 11% 120 43% 280Kansas 171 49% 101 29% 55 16% 24 7% 180 51% 351Kentucky 297 53% 132 24% 83 15% 45 8% 260 47% 557Louisiana 230 44% 159 31% 109 21% 20 4% 288 56% 518Maine 76 62% 23 19% 16 13% 7 6% 46 38% 122Maryland 206 70% 36 12% 37 13% 17 6% 90 30% 296Massachusetts 119 64% 22 12% 35 19% 9 5% 67 36% 186Michigan 373 62% 76 13% 106 18% 44 7% 226 38% 599Minnesota 187 63% 25 8% 49 16% 37 12% 111 37% 298Mississippi 266 50% 144 27% 107 20% 12 2% 263 50% 529Missouri 319 52% 155 25% 95 15% 49 8% 299 48% 618Montana 57 39% 45 31% 33 22% 12 8% 90 61% 147Nebraska 68 46% 33 22% 29 20% 18 12% 80 54% 148Nevada 91 57% 35 22% 26 16% 6 4% 69 43% 160New Hampshire 54 59% 15 16% 21 23% 1 1% 37 41% 91New Jersey 221 68% 23 7% 56 17% 23 7% 102 32% 323New Mexico 108 43% 83 33% 56 22% 6 2% 145 57% 253New York 440 70% 55 9% 97 15% 40 6% 192 30% 632North Carolina 534 59% 168 18% 159 17% 48 5% 375 41% 909North Dakota 28 38% 26 36% 13 18% 6 8% 45 62% 73Ohio 490 64% 97 13% 121 16% 61 8% 279 36% 769Oklahoma 213 44% 167 34% 85 17% 21 4% 273 56% 486Oregon 109 56% 50 26% 26 13% 9 5% 85 44% 194Pennsylvania 547 63% 108 12% 158 18% 61 7% 327 37% 874Rhode Island 27 71% 3 8% 7 18% 1 3% 11 29% 38South Carolina 315 53% 117 20% 122 21% 37 6% 276 47% 591South Dakota 46 49% 32 34% 12 13% 4 4% 48 51% 94Tennessee 401 52% 175 23% 144 19% 46 6% 366 48% 767Texas 1,021 49% 571 27% 400 19% 97 5% 1,069 51% 2,090Utah 99 58% 31 18% 28 16% 13 8% 72 42% 171Vermont 35 64% 5 9% 11 20% 4 7% 20 36% 55Virginia 307 57% 99 19% 84 16% 45 8% 228 43% 535Washington 199 64% 48 15% 49 16% 16 5% 113 36% 312West Virginia 128 54% 56 24% 42 18% 10 4% 108 46% 236Wisconsin 241 63% 56 15% 52 14% 35 9% 143 37% 384Wyoming 38 36% 38 36% 29 27% 1 1% 68 64% 106National 12,435 56% 4,473 20% 3,930 18% 1,342 6% 9,752 44% 22,187Puerto Rico 128 76% 13 8% 24 14% 3 2% 40 24% 168*Includes other/unknown light truck vehicle types
8883-101212-v2