Embed Size (px)
Citation preview
Traffic Congestion Model: Challenges and Opportunities
M.D. Enjat Munajat1, Rinaldi Munir2 Dwi H. Widyantoro3, School of Electrical Engineering and Informatics Institute of Technology Bandung, Email: [email protected], [email protected], [email protected],
Abstract. This paper discusses models to detect traffic congestion using two approaches: road detection and moving object detection. There are two methods proposed to detect roads and moving objects. The methods involve the detection of both moving and non-moving objects. The system presented in this paper is able to detect roads as well as moving objects. However, further development is needed to detect extreme road curves. The system presented in this paper is relatively inexpensive since it only uses one camera and capable of capturing satisfactorily detailed images.
1. Introduction Traffic congestion model becomes an important issue, because a good model can effectively and efficiently determine the level of congestion, and inform the public as the basis for determining the best direction. Numerous methods have been developed to monitor roadways with the ultimate aim of detecting traffic congestion. Systems developed for this purpose almost always uses 3 (three) parameters, namely (1) vehicle detection, (2) vehicle tracking, (3) vehicle classification [2]. Potential issues arising are the resolution of details and accuracy of reading roads and vehicles. Road detection systems tend to have issues monitoring curved road sections. Vehicle detection, on the other hand, tends to work reliable if there are no obstructions present. However, such systems tend to be unreliable if view of the tracked object is partially obstructed. These shortfalls are inherent challenges in studies on road monitoring and vehicle tracking. This paper presents several road monitoring and vehicle detection methods, which are not susceptible to such issues.
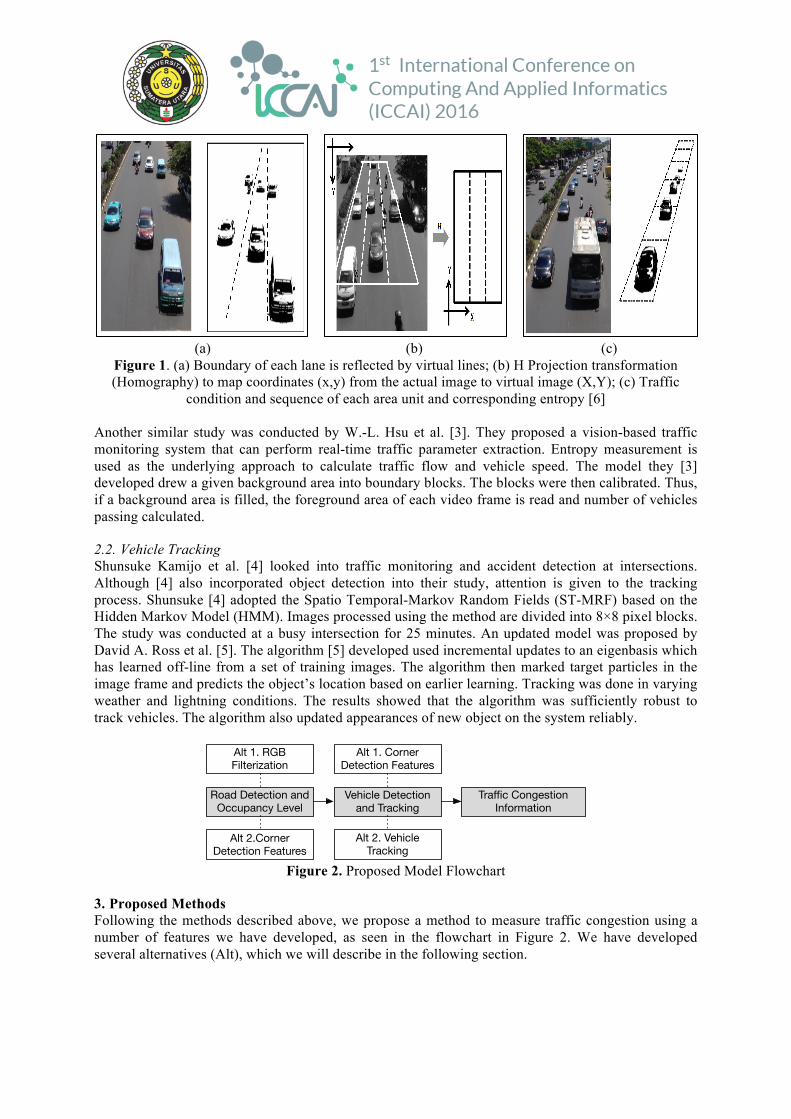
2. Related Works 2.1. Vehicle Detection Jun-Wei Hsieh et al. [2] conducted a study on a road with moderate traffic density. Their study found that the method they used were able to detect vehicles with an average accuracy of 80%. They [2] then developed their model further so that it could classify vehicular traffic. The model [2] developed improved detection accuracy to 91% even in conditions susceptible to occlusions. The process implemented in [2] was to reconstruct images using the Gaussian Mixture Model by adding boundaries onto each lane (Figure 1(a)). This boundary then removed vehicle occlusions caused by shadows to improve precision. In 1997, Beymer et al. [1] have conducted a similar study in vehicle detection. They [1] claimed that their method was, at the time, the best. Their method [1] of vehicle detection uses static cameras connected to a network of Texas Instruments C40 DSPs (Digital Signal Processor). Beymer et al. accumulated approximately 44 hours of traffic footage.
(a) (b) (c)
Figure 1. (a) Boundary of each lane is reflected by virtual lines; (b) H Projection transformation (Homography) to map coordinates (x,y) from the actual image to virtual image (X,Y); (c) Traffic
condition and sequence of each area unit and corresponding entropy [6]
Another similar study was conducted by W.-L. Hsu et al. [3]. They proposed a vision-based traffic monitoring system that can perform real-time traffic parameter extraction. Entropy measurement is used as the underlying approach to calculate traffic flow and vehicle speed. The model they [3] developed drew a given background area into boundary blocks. The blocks were then calibrated. Thus, if a background area is filled, the foreground area of each video frame is read and number of vehicles passing calculated.
2.2. Vehicle Tracking Shunsuke Kamijo et al. [4] looked into traffic monitoring and accident detection at intersections. Although [4] also incorporated object detection into their study, attention is given to the tracking process. Shunsuke [4] adopted the Spatio Temporal-Markov Random Fields (ST-MRF) based on the Hidden Markov Model (HMM). Images processed using the method are divided into 8×8 pixel blocks. The study was conducted at a busy intersection for 25 minutes. An updated model was proposed by David A. Ross et al. [5]. The algorithm [5] developed used incremental updates to an eigenbasis which has learned off-line from a set of training images. The algorithm then marked target particles in the image frame and predicts the object’s location based on earlier learning. Tracking was done in varying weather and lightning conditions. The results showed that the algorithm was sufficiently robust to track vehicles. The algorithm also updated appearances of new object on the system reliably.
Figure 2. Proposed Model Flowchart
3. Proposed Methods Following the methods described above, we propose a method to measure traffic congestion using a number of features we have developed, as seen in the flowchart in Figure 2. We have developed several alternatives (Alt), which we will describe in the following section.
Road Detection and Occupancy Level
Vehicle Detection and Tracking
Traffic Congestion Information
Alt 1. RGB Filterization
Alt 2.Corner Detection Features
Alt 1. Corner Detection Features
Alt 2. Vehicle Tracking
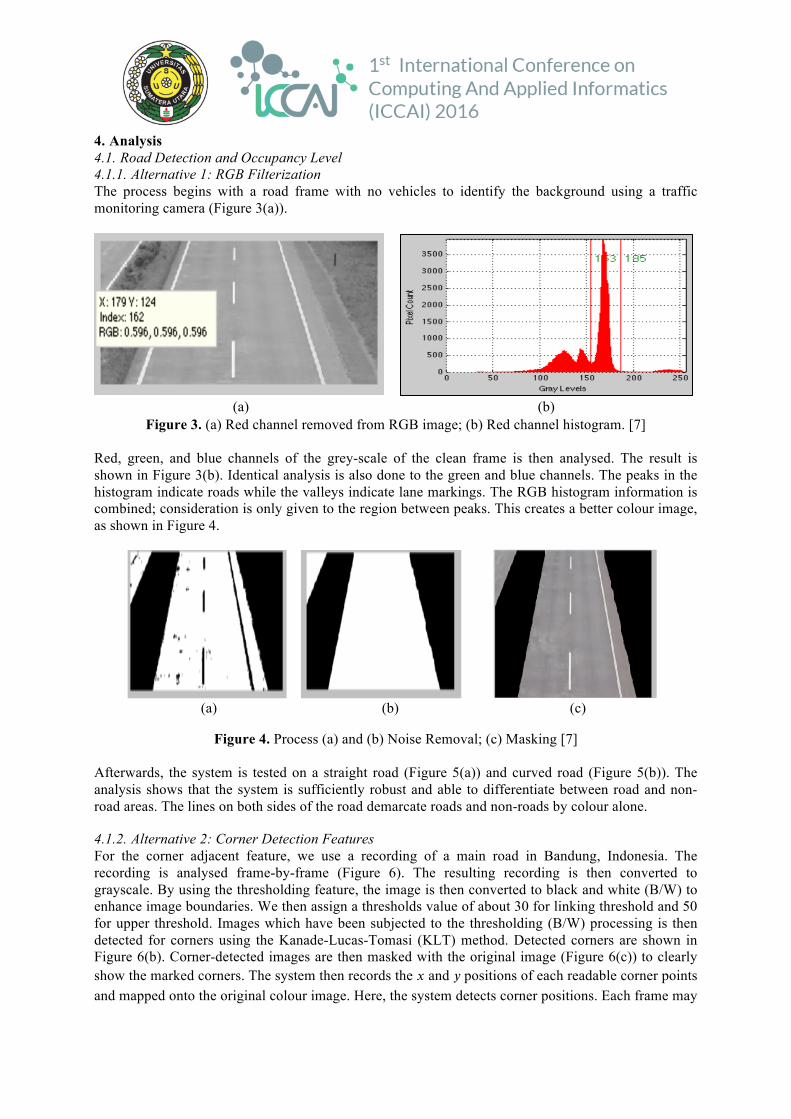
4. Analysis 4.1. Road Detection and Occupancy Level 4.1.1. Alternative 1: RGB Filterization The process begins with a road frame with no vehicles to identify the background using a traffic monitoring camera (Figure 3(a)).
(a) (b)
Figure 3. (a) Red channel removed from RGB image; (b) Red channel histogram. [7] Red, green, and blue channels of the grey-scale of the clean frame is then analysed. The result is shown in Figure 3(b). Identical analysis is also done to the green and blue channels. The peaks in the histogram indicate roads while the valleys indicate lane markings. The RGB histogram information is combined; consideration is only given to the region between peaks. This creates a better colour image, as shown in Figure 4.
(a) (b) (c)
Figure 4. Process (a) and (b) Noise Removal; (c) Masking [7] Afterwards, the system is tested on a straight road (Figure 5(a)) and curved road (Figure 5(b)). The analysis shows that the system is sufficiently robust and able to differentiate between road and non-road areas. The lines on both sides of the road demarcate roads and non-roads by colour alone.
4.1.2. Alternative 2: Corner Detection Features For the corner adjacent feature, we use a recording of a main road in Bandung, Indonesia. The recording is analysed frame-by-frame (Figure 6). The resulting recording is then converted to grayscale. By using the thresholding feature, the image is then converted to black and white (B/W) to enhance image boundaries. We then assign a thresholds value of about 30 for linking threshold and 50 for upper threshold. Images which have been subjected to the thresholding (B/W) processing is then detected for corners using the Kanade-Lucas-Tomasi (KLT) method. Detected corners are shown in Figure 6(b). Corner-detected images are then masked with the original image (Figure 6(c)) to clearly show the marked corners. The system then records the 𝑥 and 𝑦 positions of each readable corner points and mapped onto the original colour image. Here, the system detects corner positions. Each frame may
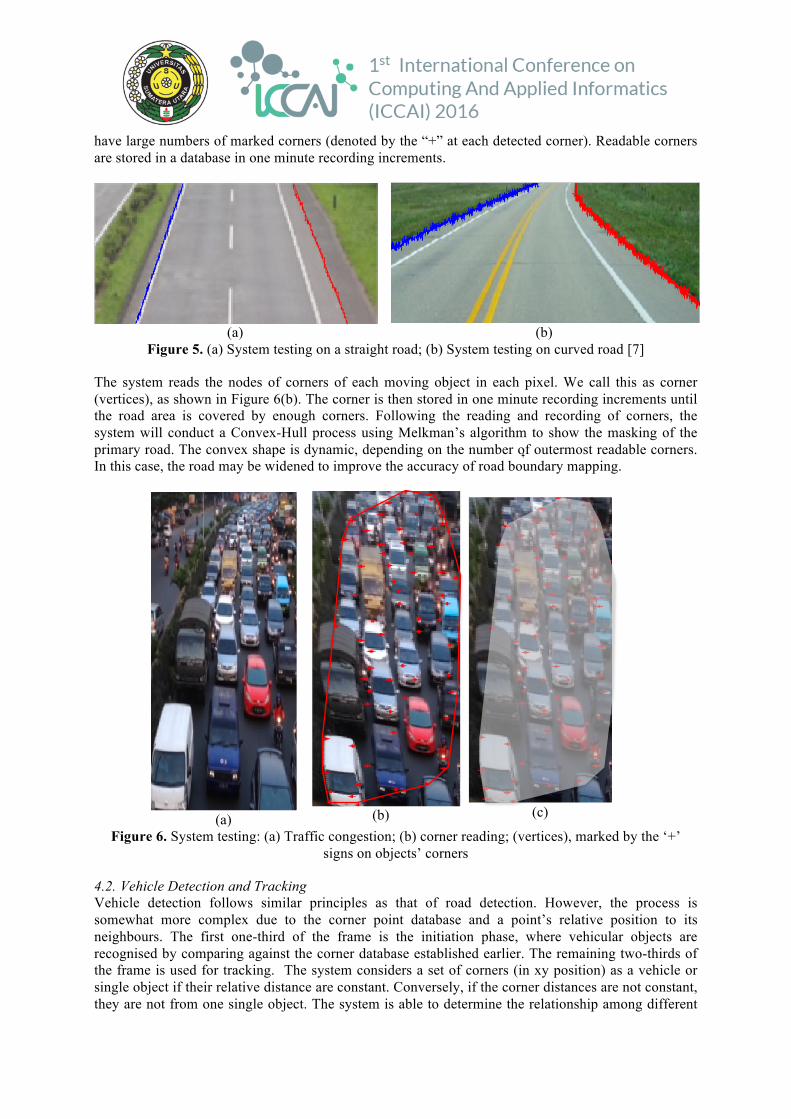
have large numbers of marked corners (denoted by the “+” at each detected corner). Readable corners are stored in a database in one minute recording increments.
(a) (b)
Figure 5. (a) System testing on a straight road; (b) System testing on curved road [7]
The system reads the nodes of corners of each moving object in each pixel. We call this as corner (vertices), as shown in Figure 6(b). The corner is then stored in one minute recording increments until the road area is covered by enough corners. Following the reading and recording of corners, the system will conduct a Convex-Hull process using Melkman’s algorithm to show the masking of the primary road. The convex shape is dynamic, depending on the number of outermost readable corners. In this case, the road may be widened to improve the accuracy of road boundary mapping.
(a) (b) (c)
Figure 6. System testing: (a) Traffic congestion; (b) corner reading; (vertices), marked by the ‘+’ signs on objects’ corners
4.2. Vehicle Detection and Tracking Vehicle detection follows similar principles as that of road detection. However, the process is somewhat more complex due to the corner point database and a point’s relative position to its neighbours. The first one-third of the frame is the initiation phase, where vehicular objects are recognised by comparing against the corner database established earlier. The remaining two-thirds of the frame is used for tracking. The system considers a set of corners (in xy position) as a vehicle or single object if their relative distance are constant. Conversely, if the corner distances are not constant, they are not from one single object. The system is able to determine the relationship among different
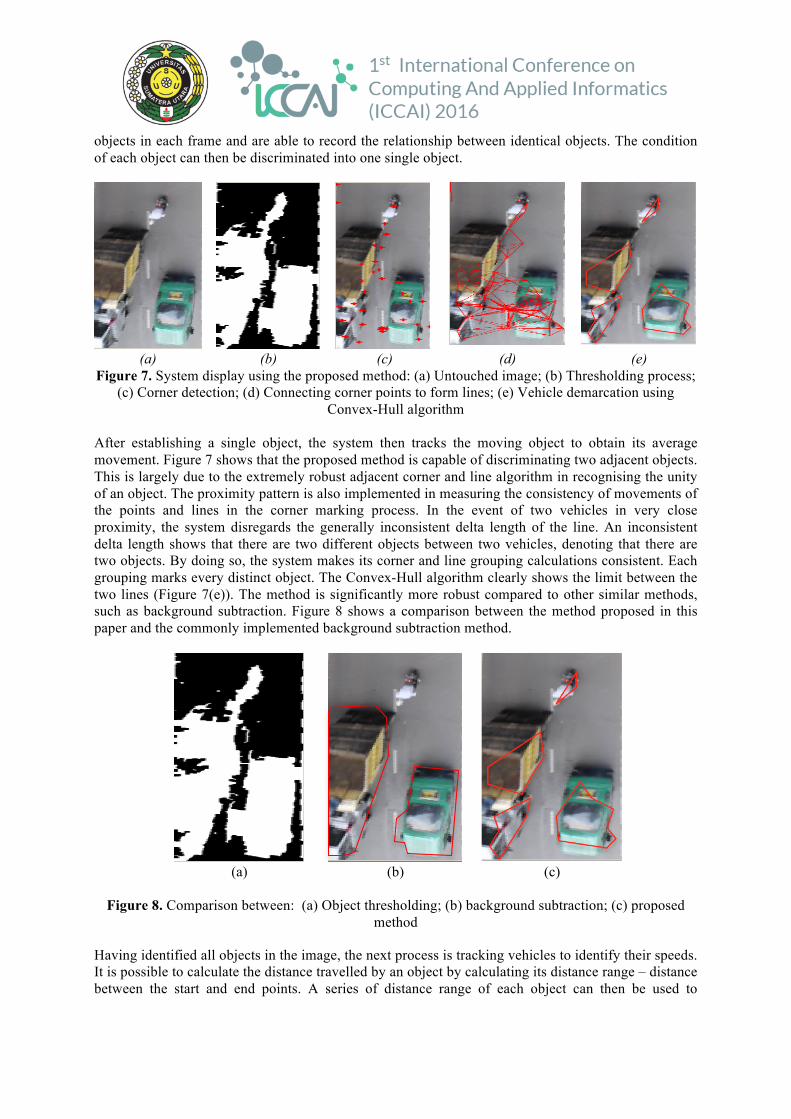
objects in each frame and are able to record the relationship between identical objects. The condition of each object can then be discriminated into one single object.
(a) (b) (c) (d) (e)
Figure 7. System display using the proposed method: (a) Untouched image; (b) Thresholding process; (c) Corner detection; (d) Connecting corner points to form lines; (e) Vehicle demarcation using
Convex-Hull algorithm After establishing a single object, the system then tracks the moving object to obtain its average movement. Figure 7 shows that the proposed method is capable of discriminating two adjacent objects. This is largely due to the extremely robust adjacent corner and line algorithm in recognising the unity of an object. The proximity pattern is also implemented in measuring the consistency of movements of the points and lines in the corner marking process. In the event of two vehicles in very close proximity, the system disregards the generally inconsistent delta length of the line. An inconsistent delta length shows that there are two different objects between two vehicles, denoting that there are two objects. By doing so, the system makes its corner and line grouping calculations consistent. Each grouping marks every distinct object. The Convex-Hull algorithm clearly shows the limit between the two lines (Figure 7(e)). The method is significantly more robust compared to other similar methods, such as background subtraction. Figure 8 shows a comparison between the method proposed in this paper and the commonly implemented background subtraction method.
(a) (b) (c)
Figure 8. Comparison between: (a) Object thresholding; (b) background subtraction; (c) proposed
method
Having identified all objects in the image, the next process is tracking vehicles to identify their speeds. It is possible to calculate the distance travelled by an object by calculating its distance range – distance between the start and end points. A series of distance range of each object can then be used to
calculate average distance, from which object speed can be calculated. The average traffic speed can then be calculated from a number of individual object speeds.
5. Discussion The system proposed in this paper requires further development to detect extreme road corners (or twisting roads). Vehicle detection using the adjacent corner method requires tuning to detect details on a given vehicle. Currently, the detection algorithm can only detect certain corners of vehicles, thus the polygonal outlines.
6. Conclusion In detecting road condition, RGB histogram filtering is able to detect road corners. It should be noted that there are levels of road corners. In addition, road markings significantly affect detection area and speed. If road markings are absent, demarcation of roads will be difficult. Moreover, road detection using the adjacent corner method is unreliable if there are corners in the road. The adjacent corner method is a superior method of detecting vehicles compared to other similar methods. However, the method may be unreliable in capturing complete physical details of vehicles as it can mark only certain corner points. The system can easily identify and calculate traffic speed and volume. The keystone of this process is in the initiation phase (first one-third of each frame). If the system fails this phase, it will almost certainly fail to track vehicles and their speed.
Acknowledgment This paper is funded by the Decentralization Grant awarded by the Directorate of Higher Education (DIKTI) and PUPT Scheme Grant, 2016.
References [1] David Beymer, Philip McLauchlan, Benn Coifman, and Jitendra Malik, “ A Real-time Computer
Vision System for Measuring Traffic Parameters, “1063-6919/97 $10.00 0 1997 IEEE [2] Jun-Wei Hsieh, Shih-Hao Yu, Yung-Sheng Chen, and Wen-Fong Hu, “Automatic Traffic
Surveillance System for Vehicle Tracking and Classification, “IEEE TRANSACTIONS ON INTELLIGENT TRANSPORTATION SYSTEMS, VOL. 7, NO. 2, JUNE 2006
[3] W.-L. Hsu, H.-Y.M. Liao, B.-S. Jeng and K.-C. Fan, “Real-time traffic parameter extraction using entropy,” IEE Proc.-Vis. Image Signal Process., Vol. 151, No. 3, June 2004
[4] Shunsuke Kamijo, Yasuyuki Matsushita, Katsushi Ikeuchi, and Masao Sakauchi, “Traffic Monitoring and Accident Detection at Intersections, “IEEE TRANSACTIONS ON INTELLIGENT TRANSPORTATION SYSTEMS, VOL. 1, NO. 2, JUNE 2000
[5] David A. Ross, Jongwoo Lim, Ruei-Sung Lin, and Ming-Hsuan Yang, “Incremental Learning for Robust Visual Tracking, “Honda Research Institute, USA Motorola Labs
[6] D. H. Widyantoro and M. D. Enjat Munajat, "Fuzzy traffic congestion model based on speed and density of vehicle," Advanced Informatics: Concept, Theory and Application (ICAICTA), 2014 International Conference of, Bandung, 2014, pp. 321-325. http://ieeexplore.ieee.org/stamp/stamp.jsp?tp=&arnumber=7005962&isnumber=7005902
[7] M. D. E. Munajat, D. H. Widyantoro and R. Munir, "Road detection system based on RGB histogram filterization and boundary classifier," 2015 International Conference on Advanced Computer Science and Information Systems (ICACSIS), Depok, 2015, pp. 195-200. http://ieeexplore.ieee.org/stamp/stamp.jsp?tp=&arnumber=7415163&isnumber=7415142